

Submitted:
30 August 2024
Posted:
30 August 2024
You are already at the latest version
Abstract
This paper investigates rural mobility in the Global South using a participatory GIS approach to address the lack of mobility data. Limited rural mobility due to poor infrastructure and financial constraints hinders social and economic activities, impeding development. The study aims to explore the socio-economic impacts of limited mobility, identify software needs for data-scarce environments, and map daily mobility patterns. Fieldwork was conducted in Kenya (2022) and Nepal (2023), collecting geographic data related to mobility. The methodology included community engagement and digital mapping using the QField app for precise data collection. The study highlights the use of participatory GIS to fill data gaps, enabling more accurate mobility assessments. In Kenya, the research significantly increased the number of mapped roads and paths, providing a more realistic view of local mobility. Community engagement revealed gender-specific mobility patterns, with women facing particular challenges in daily activities. The study emphasizes the need for adaptable data models to reflect community-specific mobility needs and the integration of qualitative insights to propose effective mobility solutions. This research contributes to understanding rural mobility in the Global South and demonstrates the effectiveness of participatory GIS in overcoming data scarcity and enhancing mobility analysis.
Keywords:
Participatory Geographic Information System (PGIS)
; Network Analysis
; Rural Mobility
; Nepal
; Kenya
1. Introduction
This paper aims to contribute to the understanding of mobility in rural areas of the Global South using a participatory GIS approach. Limited mobility stems from a combination of a poor state of infrastructure with limited private of public solutions for movement in daily life. This limited mobility in turn hinders the ability of individual to conduct their economic and social activities that prevents further social and economic development.
This paper extends and earlier research paper on the methodological framework connecting participatory GIS and mobility in Kenya.[1] This paper attempts to open roads of analysis of interpretation on mobility issues in the Global South by addressing the lack of data using geographic information systems (GIS). It will provide examples of GIS analysis as diagnostics of daily mobility challenges, using service area maps and analysis of real-world daily mobility.
The paper highlights three main objectives of this research. The first objective is 1) exploring the social impacts of limited rural mobility, emphasizing the correlation with subsistence agriculture and financial constraints. The second objective is 2) identifying the software needs for studying rural mobility in data-scarce environment. And the third objective is 3) the mapping and analysis of the daily mobility patterns of rural dwellers in the Global South.
This research was conducted in two separate regions of the Global South, during one month each. A first research fieldwork as conducted in Kenya in 2022 and the second in Nepal in 2023. It consisted on a large collection of geographic data relating to mobility, including roads, paths and origin and destination data points relevant to rural communities. This paper will present the methodology conducted for this research and how iterations to the method allowed refining results and adapting to sensibly different rural contexts, in terms of spatial connectedness and economic and social development.
Research Objectives
This study develops three primary objectives. First, it explores the socio-economic impacts of limited mobility on rural communities in the Global South, where subsistence agriculture and financial constraints hinder access to education, markets, and autonomous movement. Second, the study seeks to overcome data scarcity in rural contexts by utilizing participatory GIS and Volunteered Geographic Information (VGI) to fill data gaps and enable comprehensive GIS analysis. Existing data from projects like OpenStreetMap, although limited, provide a foundation for further data collection using GIS tools. Third, the research focuses on mapping daily mobility patterns through digital community mapping experiments
Adressing Socio-Economic Impacts of Lack of Mobility
Subsistence agriculture, on which most farmers and food systems in the Global South depend are typically correlated with dispersed habitat and low access to mobility. The limited access to mobility solutions in rural South primarily stems from financial limitations of rural dwellers, most of them being engaged in small family farming activities generating limited revenues. As a result of this limitations in mobility, many dwellers lack access to education, markets and a level of autonomy of movement.
Rural mobility is influenced by levels of connectedness and infrastructure as well as personal income, which multiplies the possible solutions in daily mobility [2].
The planning of mobility solutions, be they private or public-led are themselves largely constrained by lack of baseline data on rural mobility. Data on important points of destinations, such as major public or private services, of rural dwellers is often missing. In this regard, the use of participatory GIS or Volunteered Geographic Information (VGI) solutions can constitute a relatively cheap and actionable solution to fill the data gaps needed as assessment of mobility patterns and needs in specific areas.
Overcoming Data-Scarcity in Rural Context
Lack of data in the Global South limits the possibility to conduct GIS analysis based on social and economic patterns without extensive data collection. This is especially the case when studying rural mobility, where basic geographic information is missing to conduct GIS analysis at the correct scale. As most rural dwellers walk, they also use shortcuts and path that are rarely included in transportation survey.
The development of crowd mapping, and OpenStreetMap (OSM) project in particular, allows for a certain level of data analysis. In the context of the Global South, this is however, generally limited as only main roads and urban areas are extensively mapped. Although incomplete, the OSM data layers provide a basis for the data collection of basic infrastructure that can be completed using GIS data collection tools.
Daily Mobility Mapping
Participatory mapping regrading mobility is a relatively new field and often relies on paper maps for single projects. The limitation of the use of paper maps for further analysis is however consequent, as it prevents from using GIS analysis. And transferring paper map information into GIS is extremely time consuming [3]. The use of paper maps constitutes an efficient medium to discuss with the community the many aspects of their lives and surroundings. It is however complex to transcribe back this knowledge to a geographic information system (GIS) and pleads for a direct digital data collection.
This article will present two separate experiments in digital community mapping conducted in the region of Kakamega, Kenya and in Birendranagar Municipality, Nepal and results from the data collection to illustrate the possible results of mobility data collection exercise and further analysis.
These two exercises took place in the course of several month and in conjunction with the development of methodological tools as well as incremental implementation of a software developed on purpose to allow enumerators and community participants to visualise data and produce maps.
The GIS data itself was collected using QField app, following a review of existing data collection tools and selected for its capacity to cover the essential needs of the data collection exercise. QField is an extension of open-source mapping software QGIS that allows geographic data collection on the field using mobile phones or tablets (https://qfield.org/). The criteria for the selection of the app included the capacity of using aerial imagery as basemap, collecting line segments as well as points, and the possibility to use snapping – allowing to connect points and lines to other features for later network analysis.
2. Materials and Methods
With great variations depending on the goals and origin of the community mapping, Participatory GIS (PGIS) can mean different things depending on the context. In some cases, the purpose is to contest state narratives, such as in the case of the mapping of indigenous lands [10,11]. It can also take a role of replacing the state, as is the case of mapping informal areas [12,13,14]. Typically participatory mapping may combine these two aspects. With the development of OSM platform, community GIS is getting generalised and more widely used by a multiplicity of development actors. This includes HOTOSM, the humanitarian tasking system to support emergency mapping as well as multiple projects from the World Bank and a particular emphasis on hazard mapping now widely used both in paper maps to sensitize communities as well as digital mapping.[15]
The method used for this research can be located between the traditions of Participatory GIS (PGIS) and Voluntary GIS (VGI), combining community mobilisation dynamics of the former and the predefined approaches more linked to the former.[16,17] The research objectives have been predefined from the outset as focussed on mobility. This choice places some constraints in the type of data that is used and processed in the analysis, as elements of mobility mapping. In particular, it requires the use or creation of a road network and sets of points defined as origins and destinations in the daily mobility of communities.
The road network leaves limited latitude to define it with community members. Mobility research of such an exercise relies on existing dataset and standards to map mobility networks. The quantity and quality of data required for network analysis require the use and update of pre-existing dataset, that can be found with large institutions or crowdmapping initiatives. A choice of simplification was made to use categories used as Kenya and Nepal standards in OpenStreetMap which differentiate whether segments of the network are path, roads, asphalted or not.
Origins and destination on the other hand leaves more space for dialogue and community self-definition. So as the concept of O-D as input for transport analysis is untouched in the process, the definitions of the points of interests relevant for the community are discussed and integrated as much as possible while balancing with existing standards either from OSM or from local official data.
QField was opted as the most adequate tool to collect mobility data in this context. QField is integrated with the QGIS open-source software. Its integration with QGIS allows to perform all the main data collection process needed to collect accurate and precise geometries, including snapping, and the use of offline basemap imagery. The main limitation of this tool is that it is more complex to use than other data collection options, such as KoBo or ODK. The setup of data collection templates in particular requires a good understanding of GIS concepts and the QGIS software. The function of snapping are also used to connect the points categories of mobility obstacles and street profiles to roads, to ensure that said identified obstacle would be correctly associated to a given road segment.
The data collection tool QField was selected for this exercise for its ability among open-source GIS to integrate certain specific GIS capabilities, in particular the function of snapping, which is essential to digitize a road network. The ability to include a basemap in the project is also essential in allowing the enumerators to point exactly at the locations of the different routes and points of interest.
The use of QField also allows the reference of the basemap to be used in a variety of purpose,, including navigate, ensure no overlap with other enumerators, and locate points of interest directly over a building, a stream or a well.
Figure 1.
QField Screen capture. A health facility is identified and inserted in data collection in Mumias East, Kenya, using QField and Bing basemap imagery.
Figure 1.
QField Screen capture. A health facility is identified and inserted in data collection in Mumias East, Kenya, using QField and Bing basemap imagery.
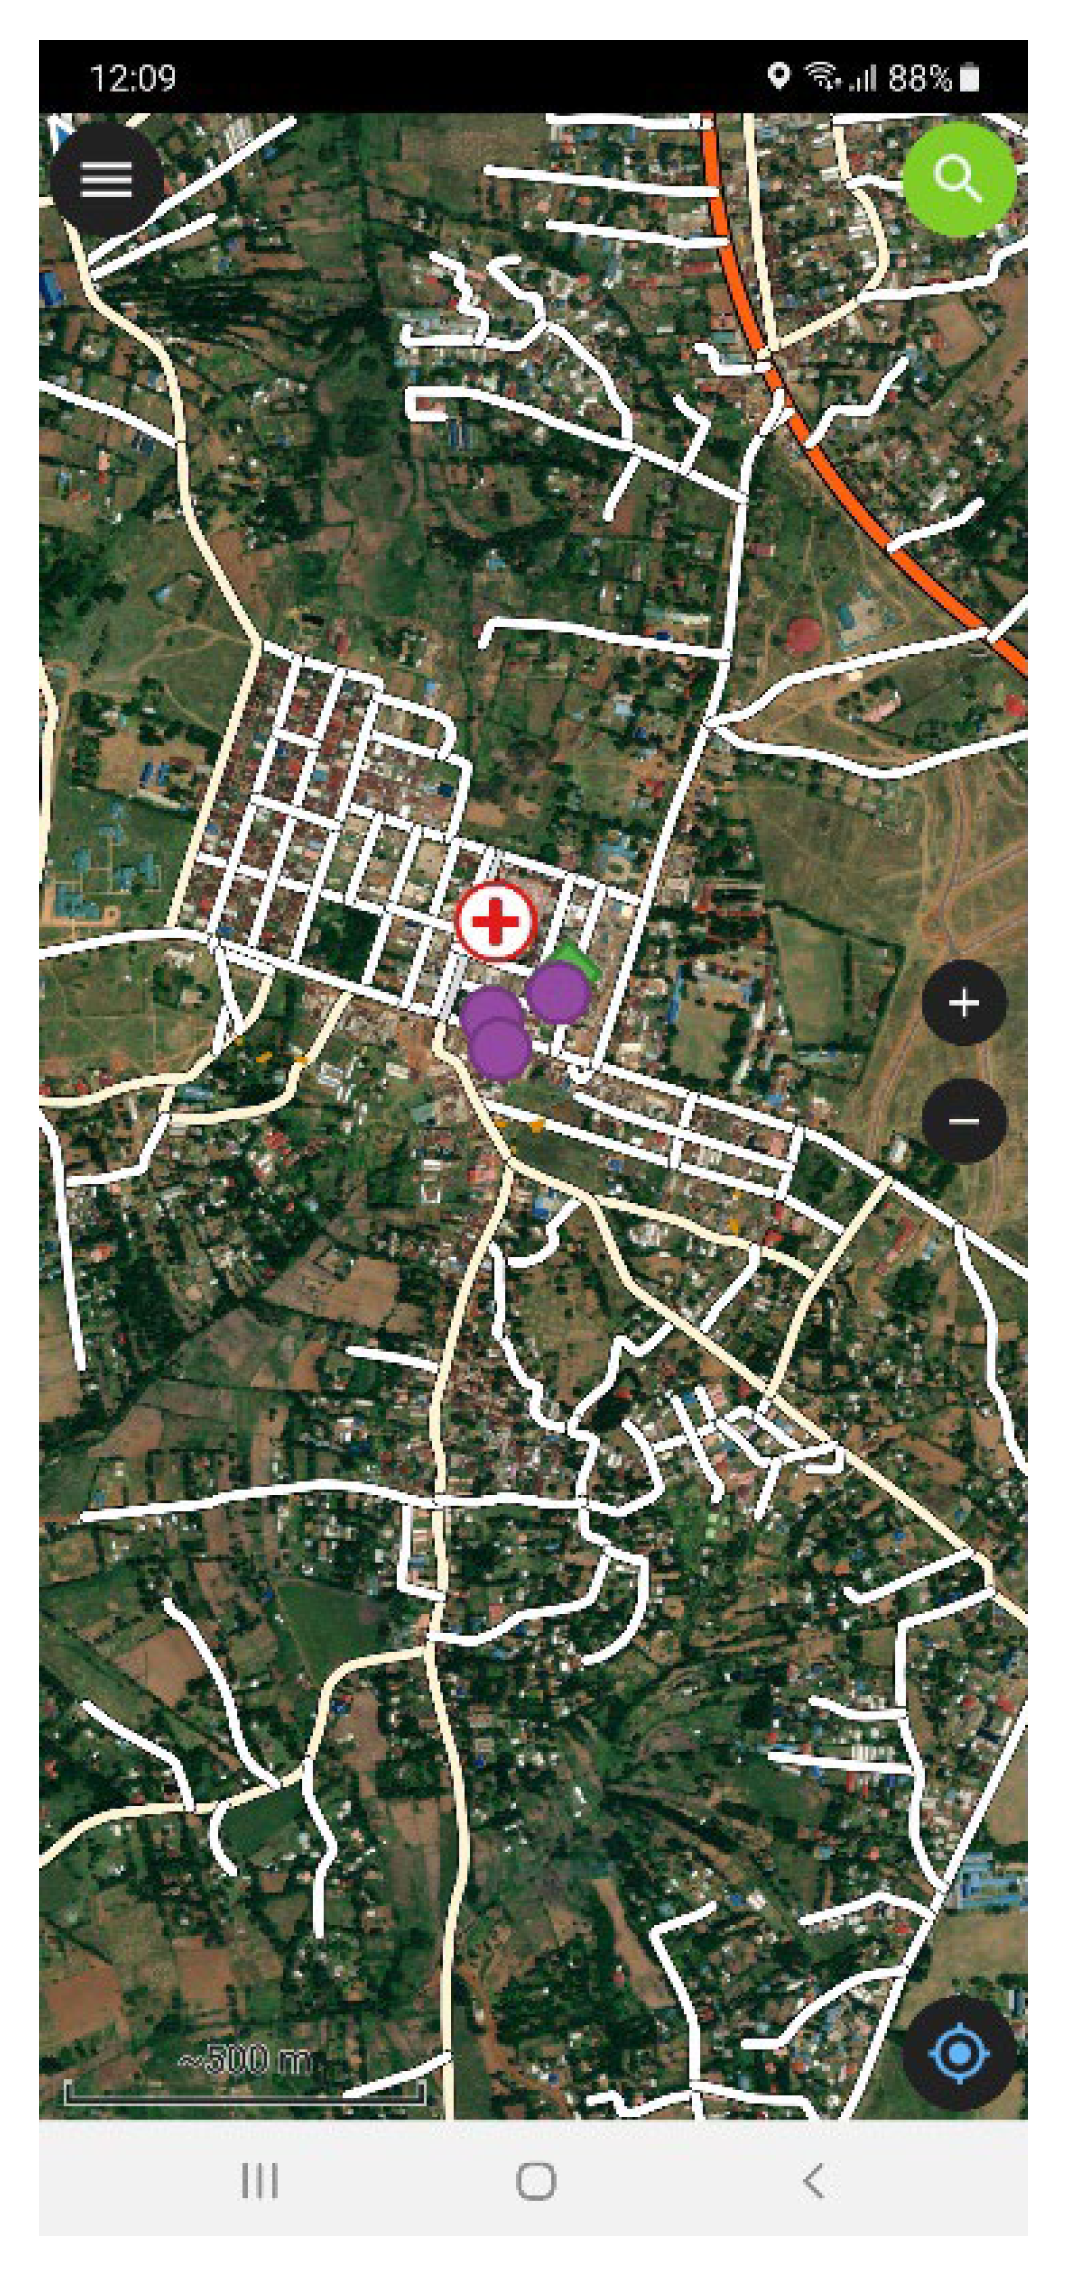
The broad categories of geographic features needed for mobility analysis include the transportation network as well and potential origins and destinations as well as barriers that can hinder movement.

Table 1.
Data layers contents and data types.
| Category | Data Layer | Data Type |
|---|---|---|
| Transportation Network | Road Network | Line data |
| Mobility | Infrastructure Barriers | Point data |
| Barriers | Road incidents | Point data |
| Crime or Wrongdoing | Point data | |
| Points of Interest/Amenities | Markets, Shops, Banks, Money Transfers Water Points, Religious sites, Industry | Point data |
| Health | Pharmacy, Clinic, Health Posts, Hospitals | Point data |
| Education | Kindergarten, Primary School, University, Training Centre | Point data |
| Government | Local, State, District, Country, other Government offices | Point data |
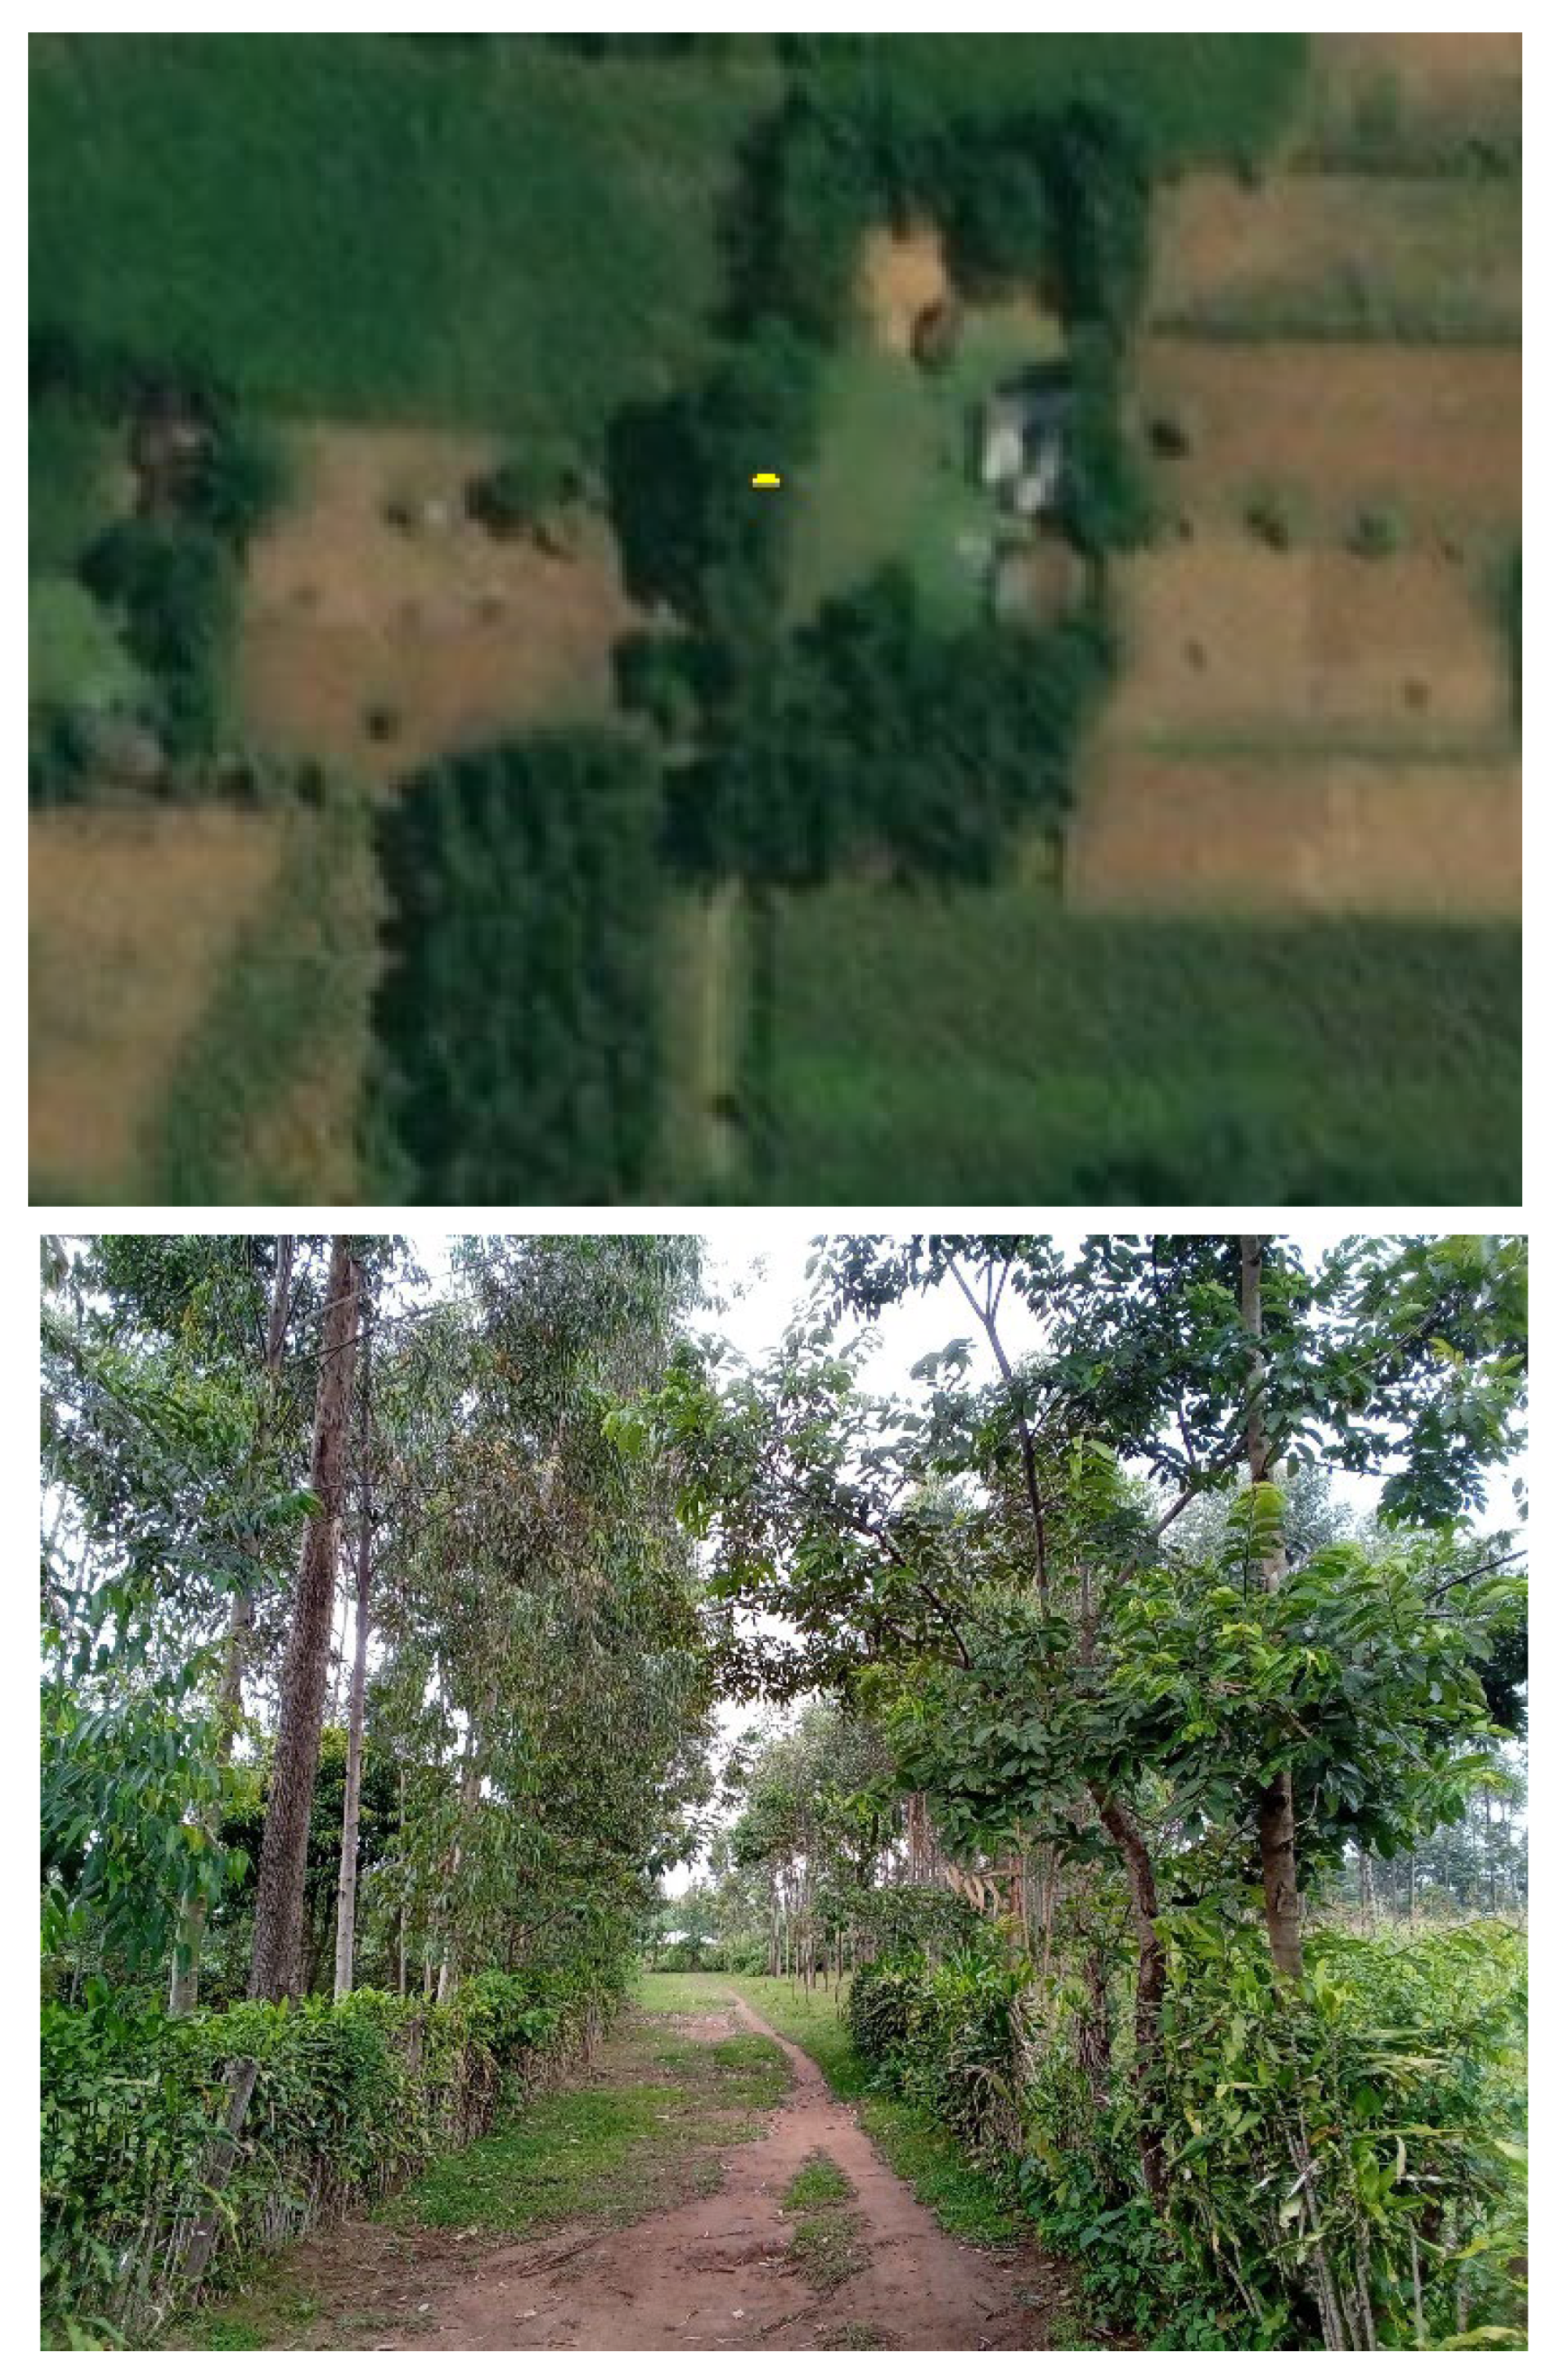
The data collection exercise also included the functionality of tracking. The collected line geometries reflect broadly the path used by the enumerators during transect walks. Street profiles were collected, although not used in the final mapping product. Pictures taken by enumerators at regular intervals in their transect along different types of road allows for a comparison between the aerial view and the road seen from the ground. This collection of street profiles allowed for the identification of numerous paths located in dense vegetation to later digitize a more complete mobility network.
Figure 2.
A street picture next to its aerial imagery facilitates identification of paths where they are not directly visible from aerial imagery.
Figure 2.
A street picture next to its aerial imagery facilitates identification of paths where they are not directly visible from aerial imagery.
3. Results
Socio-Economic Impacts (Objective 1)
Limited mobility solutions for the rural population of the global south impacts on socio-economic conditions at collective and individual levels. Exisiting scientific literature on the subject highlight a number of consequences of lack of mobility at multiple levels. At an immediate level, access to basic services, such as healthcare and education is limited and made difficult to many rural residents.[4] This aspect was discussed during Focus Group Discussion (FGD) conducted on the field and highlighted how women are particularly affected by these aspects as they are generally in charge of health and brining children to schools, as was consistently described in both Kenya and Nepal.
Limited mobility also produces broader constraints on socio-economic activities for rural population. Among other aspects, access to markets are limited by the distances needed to cover to sell agriculture products.[5,6] Focus groups in Kenya, highlighted, for instance, that the selling of milk in East Mumias, Kakamega, was exclusively done in the village selling the milk walking along the way until all was sold. In this regard, the mobility of subsistence agriculture presents a specific set of spatial relationships where short distance activities are adapted to the options of movements of residents.
Walking and short-range mobility largely shapes the geography of subsistence agriculture in the global South and structures the living spaces of residents in multiple ways. Although differences of levels of reliance on motorized transports modifies the opportunities to rural residents and organisation of livelihoods and family economies, the observation from Birendranagar and Kakamega both illustrates that the walking mode still overwhelmingly dominates modal journeys, as in most of the global South.[7]
Data-Scarcity in Rural Context (Objective 2)
Despite the presence of a few collective and individual mobility solutions in the Global South, by motorcycles and bicycle, daily mobility is generally conducted by foot. This research allowed the collection of networks of paths allowing a realistic GIS mobility analysis of rural mobility with a finer granularity of data than existing official, or private routing data providers, such as ESRI’s ArcGIS Online Network Analysis Services or the OSM current state of the map.
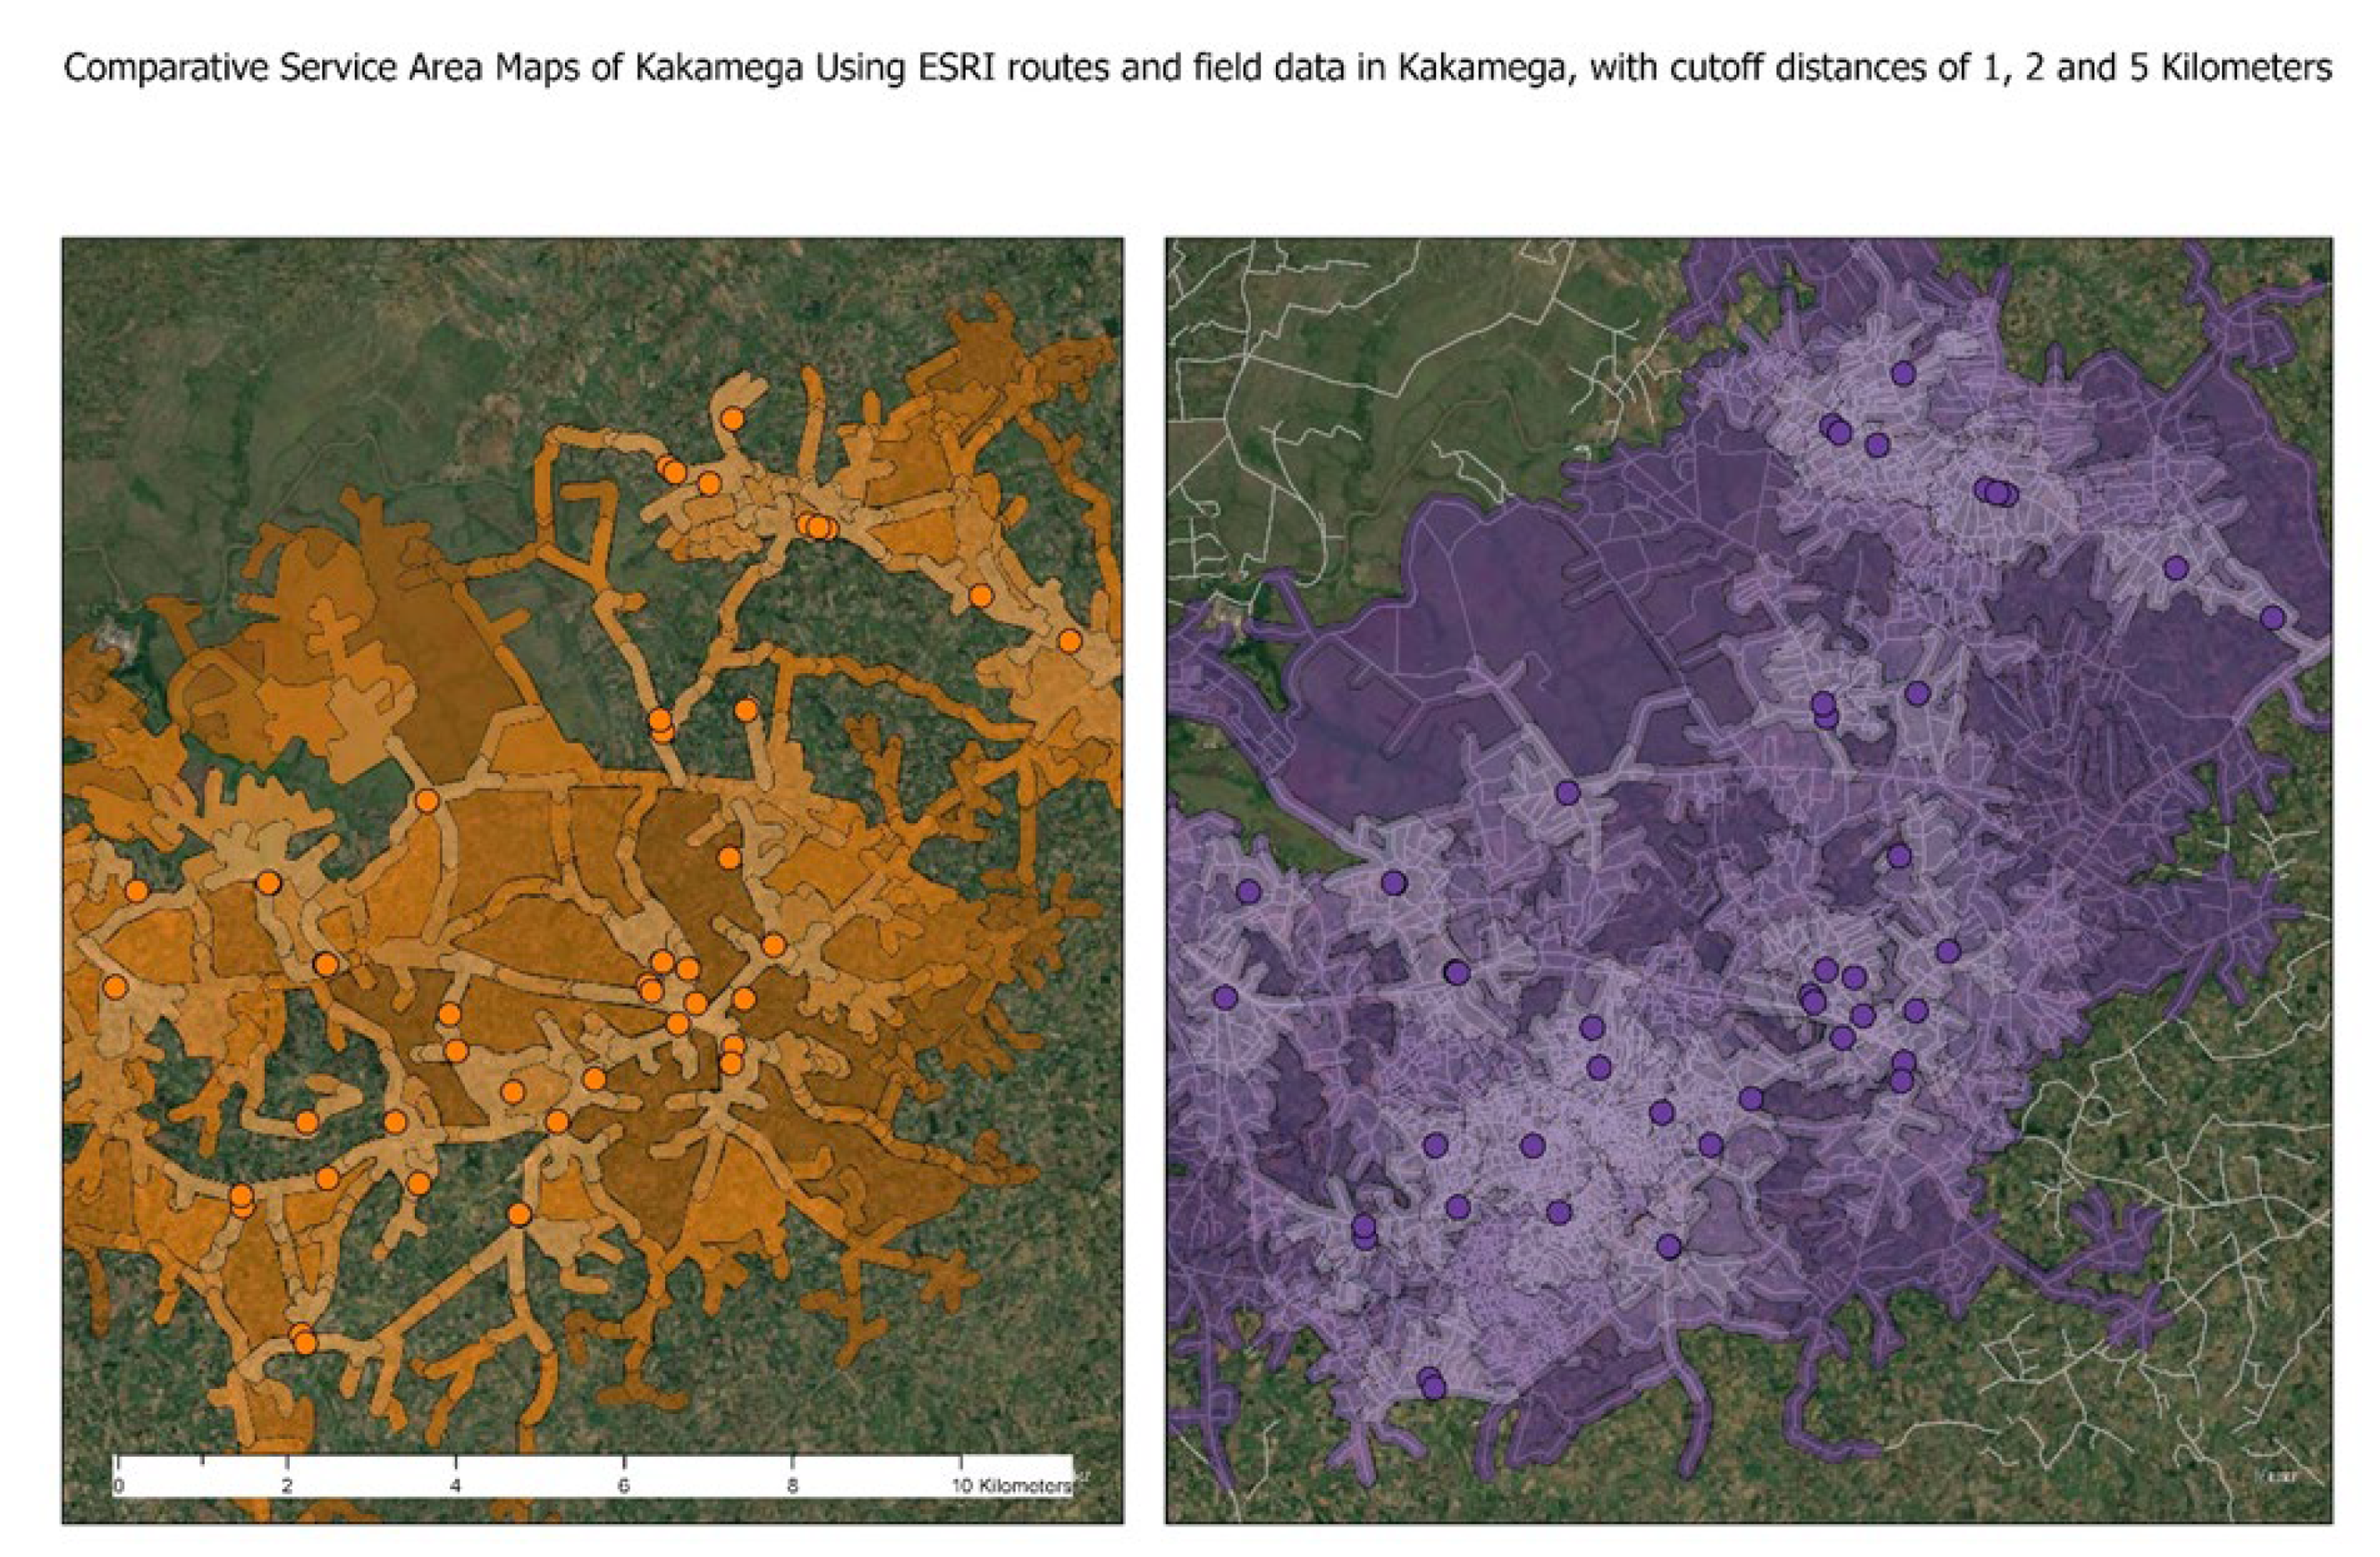
At the time of this study, ESRI existing mobility network as provided as network service is broadly similar to the existing OSM data. The data scarcity of the existing GIS rural data is best illustrated in comparison to the additions made by the research team, whose methodology will be explained below. A comparative observation of what areas can be reached using ESRI ArcGIS Pro services and with the mobility network data that was collected by the research team can be observed in Figure 3. The Service Area comparison illustrates the areas covered at certain network distances of facilities (in this case schools). Conducted on two maps with lower and higher network density, the comparison illustrates how the non-inclusion of paths presents many areas uncovered, because they are located at certain distances from mains roads. Rural mobility is however mainly pedestrian and a realistic picture of local mobility must reflect the uses of rural paths and shortcuts.
Figure 3.
Comparison of ESRI routing services and Field data to study rural mobility.
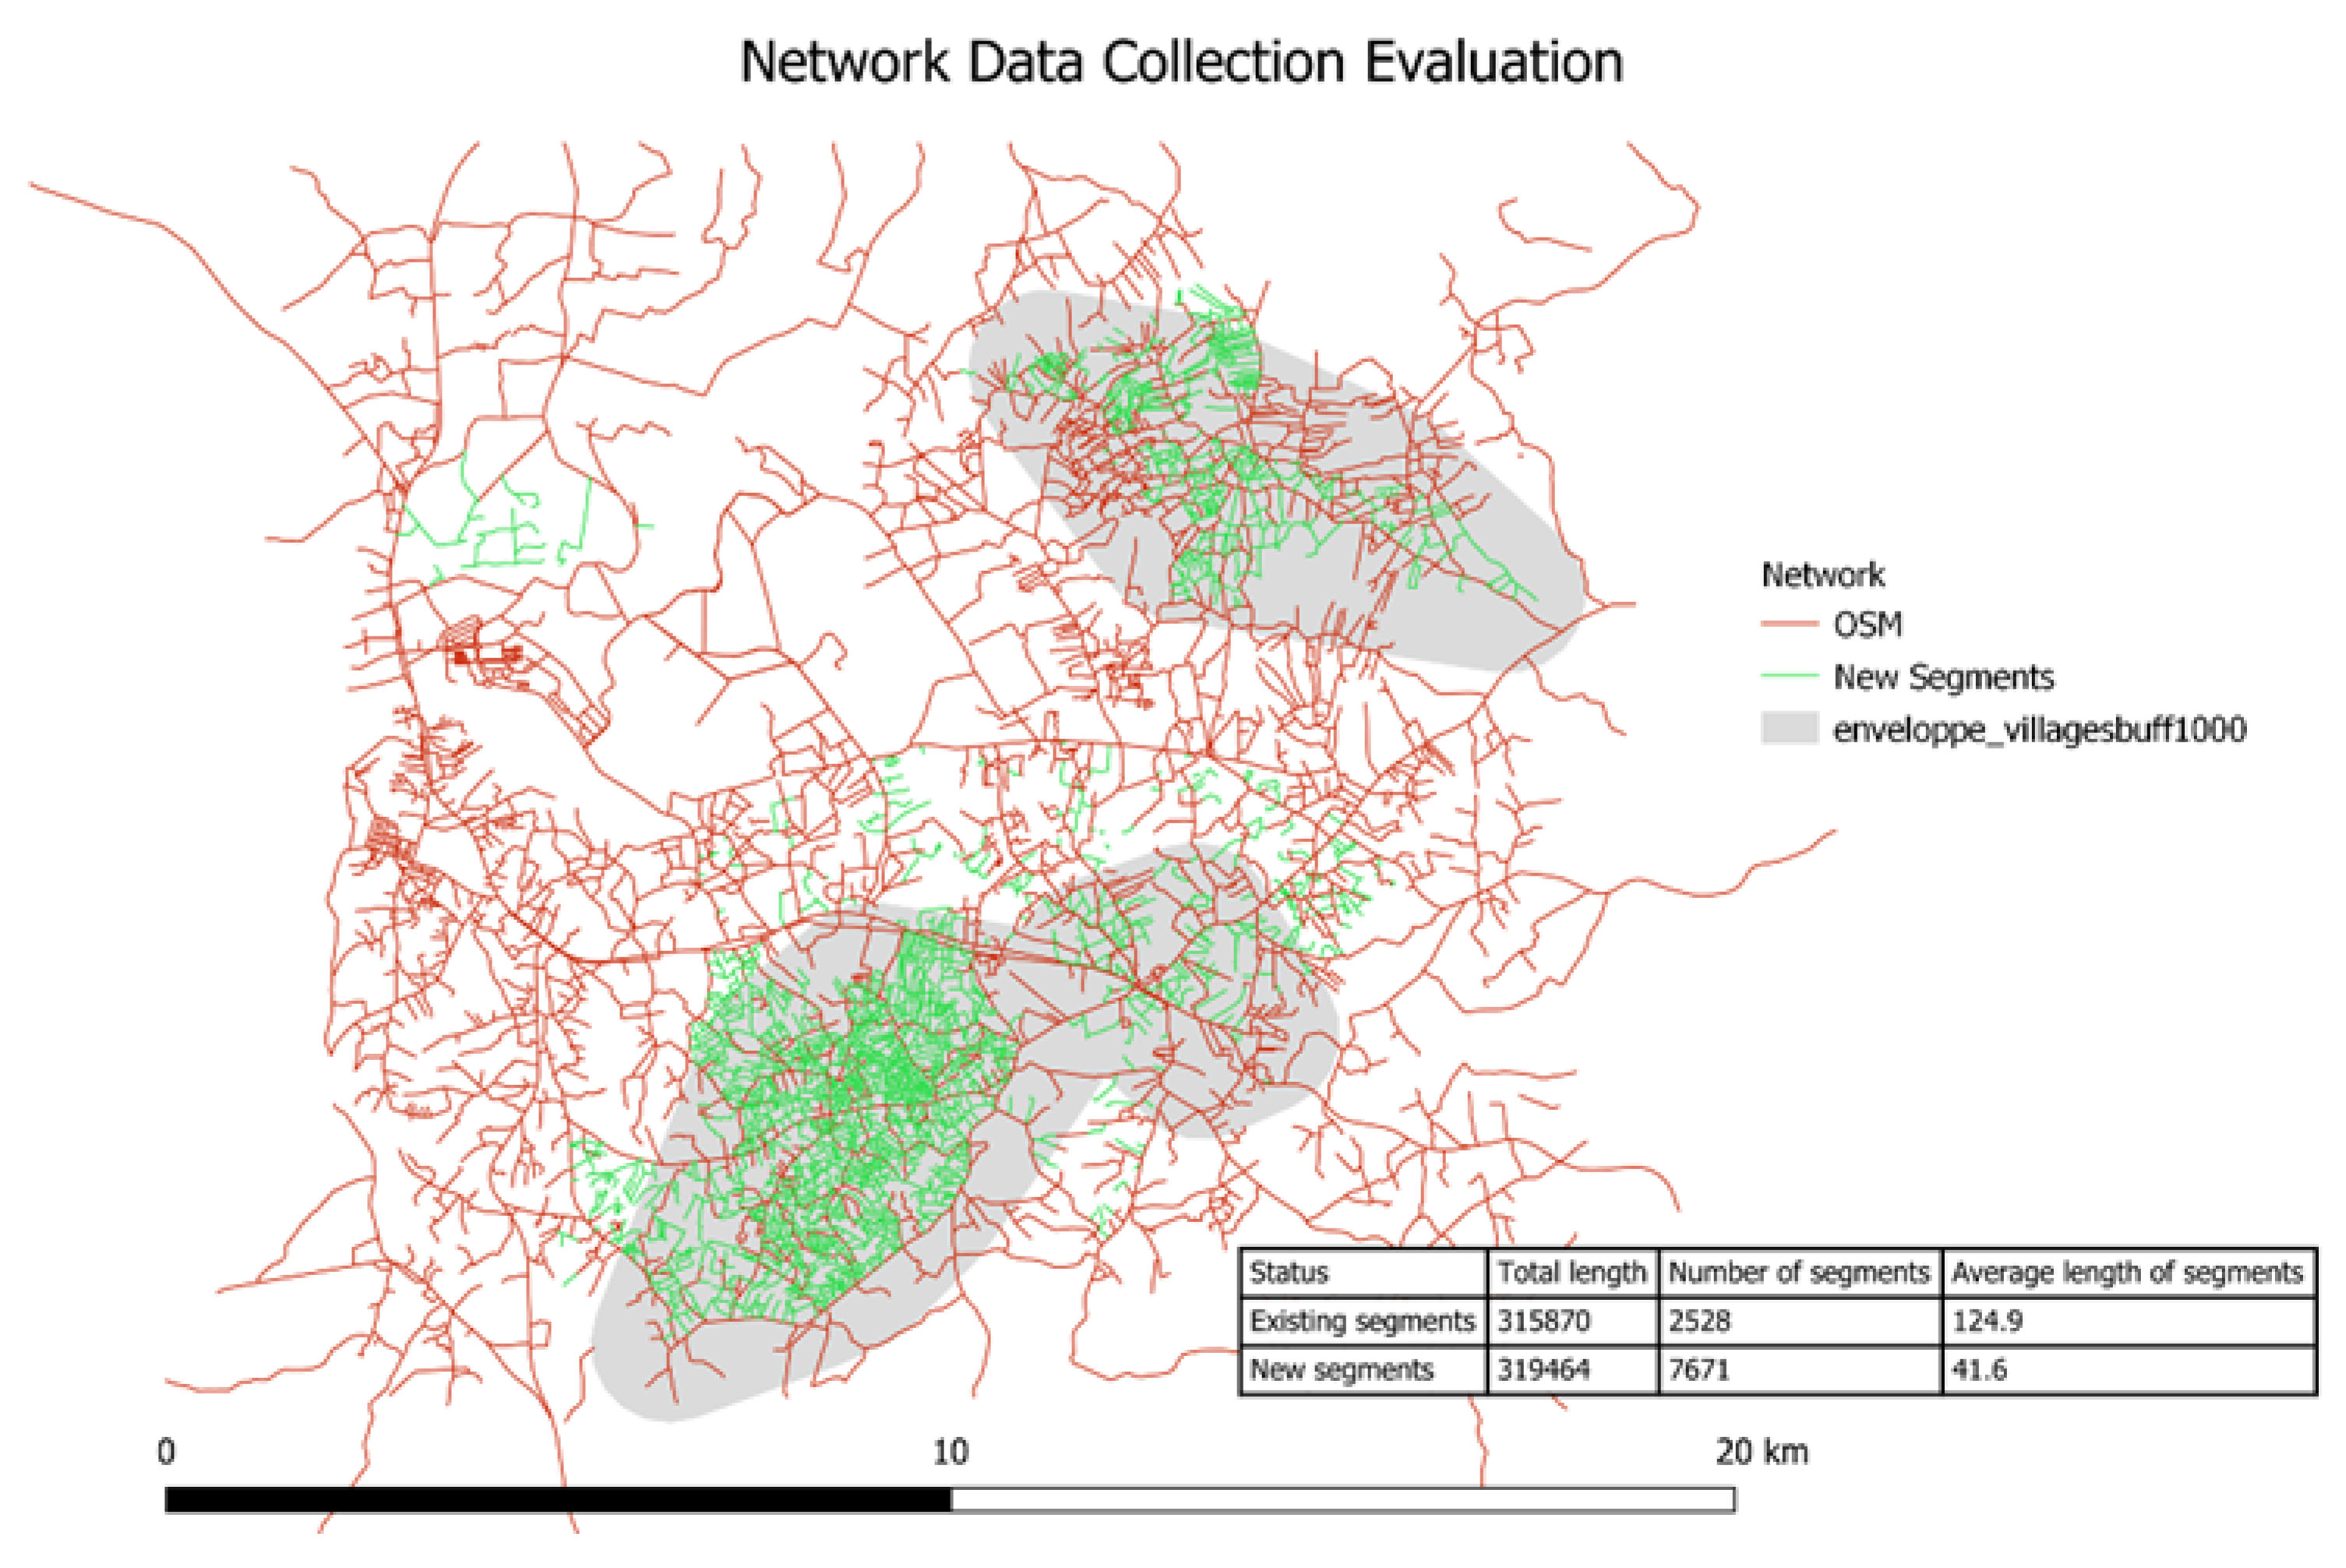
The data collection allowed the inclusion of numerous roads and points of interest, following OSM existing mapping or community-specific items. The mapping of streets roads and paths is the largest quantity of items. Prior to the visit in Kakamega, the existing OSM database contained a number of main roads and junction, but not the rural roads and small paths that are used daily by community members. In Kakamega, for example, the number of roads collected increased dramatically the total number of roads in the Mumias East region. As the attention of data collection came closer to the daily activities of rural dwellers, the number of segments increased and their length shortened, reflecting a set of activities closer to home and pedestrian in nature.
The inclusion of the walking mode of transport in analysis of rural mobility requires the creation of thousands of line segments of roads and paths for areas of interests spread over around ten kilometres by five, as was the case in Kakamega and Birendranangar. The collection of this data allows for the calculation of daily mobility mapping based on a dense network of path. The Figure 4 below illustrates the number of new segments created in the map of Kakamega. The numbers of new segments in the new GIS data represents over 300 kilometres, which is roughly equivalent to the pre-existing data retrieved from OSM data. It is notable that the number of new segments is three times higher than the original 2528 in OSM. In turn the average length of OSM segments are much larger at an averages of 126 meters and the new segments at an average of 41 meters. This reflects how the crowdmapping of OSM focussed on the main roads, while the new data collection focussed on collecting a dense net of data within a small territory.
Figure 4.
Road segments collected in Mumias East over the existing map of the area.
Daily Mobility Mapping (Objective 3)
Combining community engagement and GIS, the research allows a close integration of rural dwellers’ description of their daily life before its mapping.
3.1. Identify Rural Hubs and Points of Interests
Community-relevant data is collected in dialogue with the local community. This requires the facilitators to be ready to adapt their data models to community specificities and maintain structured data collection models. The readiness to adapt and include new items in the data models is needed to follow community activities and mobility needs. It is however necessary to maintain a sound structure in the data model and avoid multiplying the numbers of data layers for each new item.
This structure requires the facilitators to prepare broad categories of geographic and material features, such as water or economic resources. These broad categories must be adapted to include categorical descriptions.
The inclusion of new items and dataset can be done most conveniently by projecting a table of the locations the community indicates are central to their daily life and mobility. The inclusion of some activities might prove difficult to collect. It is the case of mobile activities, in particular. Some farmers, for example, indicated that they sell milk in the villages walking to multiple locations in their daily routine. Although it is possible to map such movements, their mapping was deemed too complex to include in the collection exercises, and the research team preferred limiting the mapping to fixed objects.
Members of the communities of Lusheya and Khaunga were gathered to discuss their daily movements in and around their houses and communities. Participants were divided in two groups by gender, following the gendered division of daily tasks and place in the rural economy. In this exercise, community members are invited to list their activities in a typical 24-hours timeline and highlight their activities. Most community members are farmers, although a small number of clerical employees also include their daily activities.
Most activities and related mobility needs are common to men and women, although some key housework mobility tasks are specifically attributed to women. It is the case in particular with collecting water – in the absence of running water in the households – and firewood. The latter activity being identified with specific risks of harassment.
The activities were listed in a table to identify the main destinations of community members during their daily activities. In the absence of access to means of transport others than walking, most activities happen within a limited distance to the households. The following table describe the main activities described by community members and their approximate associated distances and frequencies.
Community members also identified the different modes of transport used for the different activities. In most cases, travels are made by foot, although for less frequent and more distant activities. In both Kenya and Nepal, motorcycles taxis (“boda-bodas”) or public minibuses (“matatus”) may be used to access a central place, such as a health centre, a political rally or a government office.
Men and women from the community presented their estimated distances and travel times for their daily activities. The Table 2 below shows how women described their movements and frequencies and was discussed on a large screen to present broad estimates of movements. Women mobility differs depending on their work and status, but encompasses house work and the care of children on top of their professions. The period when the study was conducted, shortly before the 2022 presidential elections in Kenya was also reflected in most participants describing participation to political rallies.
Once identified the main categories of destinations, community members were invited to highlight the frequency they went to said places. The list of destination served as the basis to collect the data during the mapping exercise. As such the categories of items were integrated as layers into a QField questionnaire that enumerators would use during walks with community members.
As similar exercise was conducted with community members of Birendranagar. Modifications in setting the exercise and systematization of information collection allowed to precise technical elements to collect as well as including a more holistic approach to data collection and mobility. As research on mobility limitation, the exercise tends to forget the positive elements that may emanate from issues in transport.
Research participants were thus asked to express if they also envisioned positive aspects in the situation of the village. As a result, from the answers of participants, a number of elements came up that bring understanding of positive aspects of current mobility practices. Participants identified important bonds of solidarity between villagers. One important aspect of the solidarity mentioned is that vehicle of two-wheel owners are often keen to give a lift to other villagers, and make themselves available easily in case of emergencies.
Slower pace of movements seems to support stronger social bonds. Long walks to bring children to schools, for example constitute an important means of connecting between villagers, where women in particular discuss of their affairs. Villagers also mentioned in a broader sense that their relative isolation bring other positive outcomes. This included in particular what they considered the consumption healthier organic food mostly produced in the village itself. Although not directly collectable information, the perception of villagers of their mobility issue also brining positive outcomes is important in the sense that the mobility assessment and proposed solutions shall take into account these aspects and propose solutions that maintain these positive aspects as much as possible. The use of this information at that stage does not imply the collection of specific features, rather it implies that the conclusion of any quantitative study would have to take into account the proposition of solution that maintain these positive aspects of the current state of rural mobility. This inclusion of qualitative remarks in the methodological framework is a necessity to provide sound results to the study. This inclusion of qualitative and quantitative approaches follows tradition of mixed methods central to understanding rural mobility in the global south [8].
The exercise also included the systematic collection of travel time to and from their places to various facilities.
3.2. The Size of the Study Area Depends on the Required Data Density for the Mobility Mapping
One key aspect of this process is the definition of the boundary of the study area. The size of the area of interest influences how data can be collected and what will constitute a complete dataset. To calibrate the expected data/information density to the size of the area of study and prepare data collection accordingly. A small area demands great precision in both geometric and tabular data (quantitative and qualitative). A larger area requires simplification of features and a preselection of the main categories of geographic features (e.g., collecting information relating to health centres, but not informal shops).
The size of the area of interest influences the means needed to complete data collection. In a small area, all data collection can be done by foot, while if focusing on a larger area, it might be necessary to accommodate the data collection with faster means of transports (e.g., bicycles or motorcycles). Although participants indicated some irregular travels to further distances, the mainstay of their movements was located within a 5-to-10-kilometre radius in both Nepal and Kenya.
3.3. Intermediary Results: Paper Maps and Transects
In the absence of precise mapping of rural areas, community members are invited to describe the main landmarks of their community with the help of data enumerators. The mapping exercise of the area using paper serves has the basis to identify the main landmarks, such as government offices – most often location chief offices –, health centres, schools, and rivers and streams. This paper map was not drawn to scale but allowed identify the relation of central features in relation to others.
The surveys start in a central place, at the chief or assistant chief office of the surveyed locations. Community members and enumerators are accompanied by a village elder, a community member chosen within the villages. As no current mapping of the villages is accessible (or apparently even exists) village elders were key not only to guide enumerators to key points of interests, but also to set the limits to other villages, so enumerators would not overlap with the collection of others.
Walks in the villages lasted generally from around 5 hours and enumerators were guided to visit schools, religious sites (in Kenya these are mainly Churches of various observances), health centers and shops, but also water access points and mills were farmers grind their maize to later consume or sell ugali, a common staple food in Kenya and the region.
Enumerators also conducted an important exercise of identifying the aspects of many types of rural roads and paths with geolocalised profile pictures which allowed to compare the road aspect from the ground the high-resolution imagery base map used on QField collection tool. This aspect of the data collection was especially important in the context of rural Kakamega, where the tree cover is dense and often hides parts of roads and path, which limits the extent and possibility of remote mapping.
The practice of transect is an essential element of this participatory approach. It is essential to collect complete information on the locations as the pace of travel allows the inclusion of a variety of places that reflect village life, such as formal and informal shops, wells, small local industry. It is also essential in reflecting the pace of movements of village dwellers and their relation to their territory. Transports entail a bodily relation to the territory marked by the means of transport used in mobility, where the effort made to move, the pace, the possibility or not of discussing with neighbours along the way all entail a particular lived sensation. The corollary to this aspect of mobility is that it is essential for researchers and enumerators to travel the territories with similar means of transport as the local dwellers [9].
3.4. Measuring Access to Amenities with Collected Data
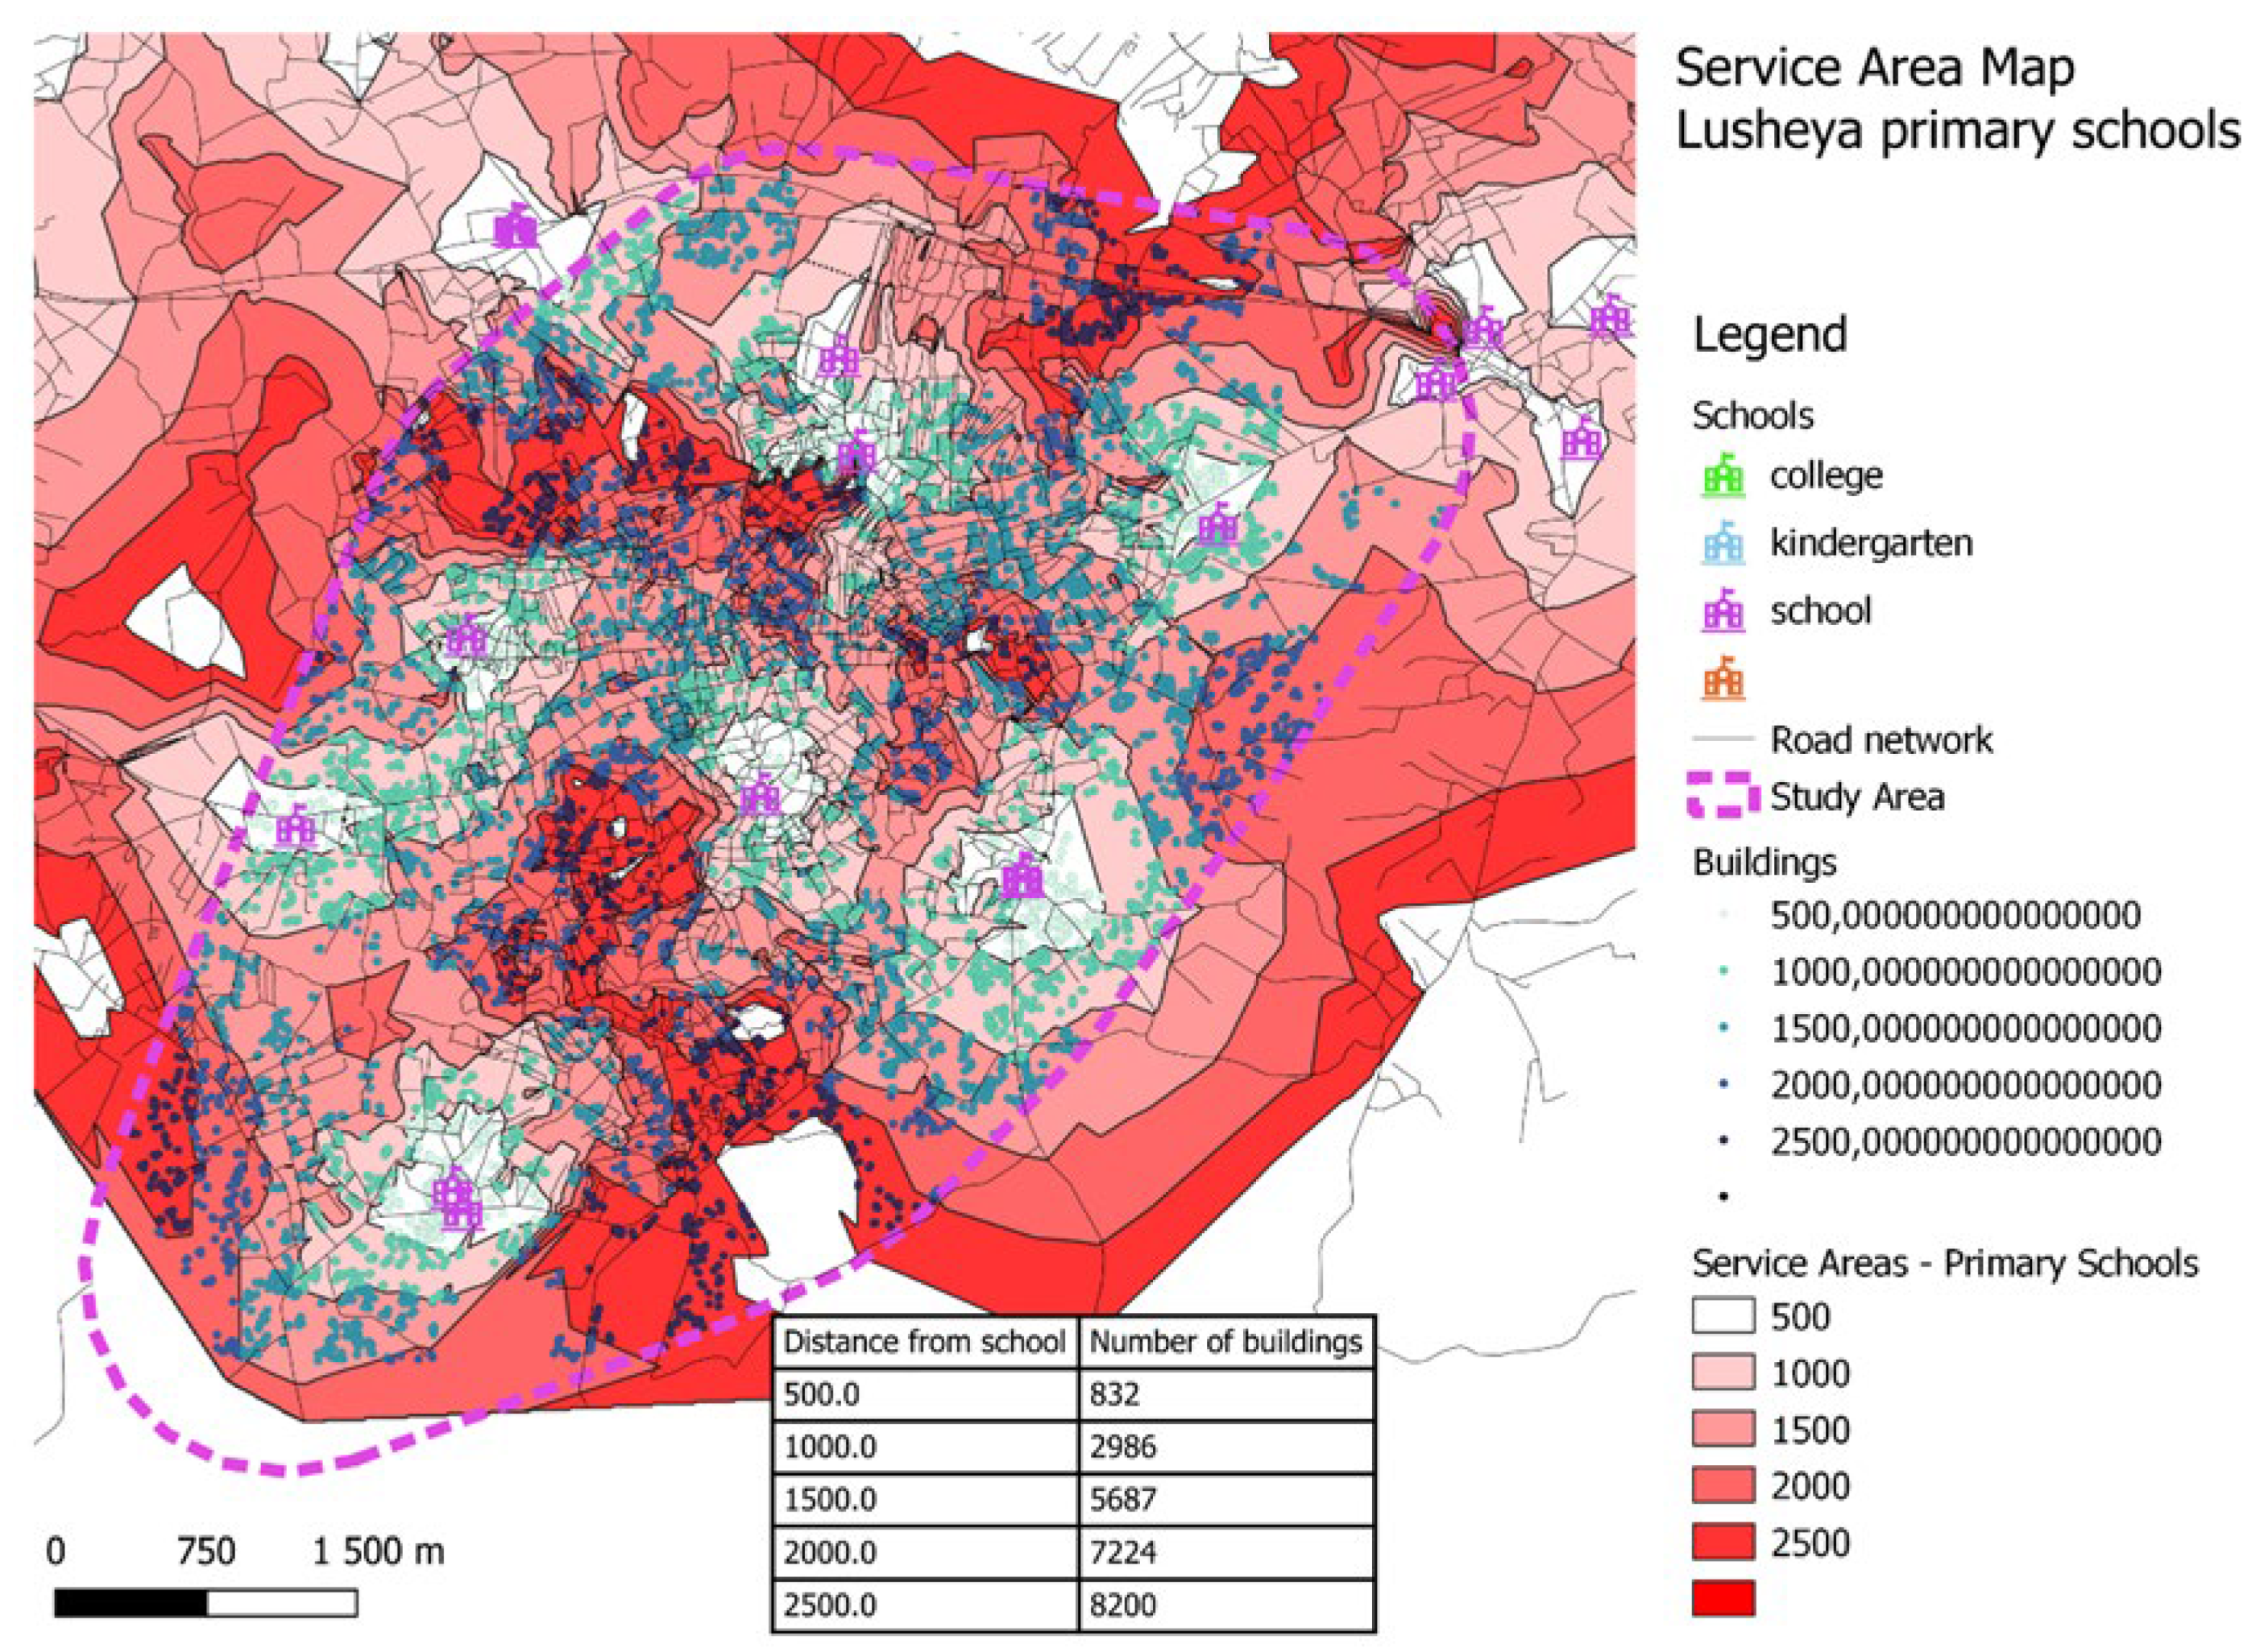
The data collection allowed the mapping of access to amenities from the different points of the wards/locations. Using diverse sources, the service areas allow to locate all areas within certain distance of a specific amenity. The example of primary schools, illustrates all buildings at every 500 meters interval distance and illustrate that a large number of children need to do significant daily walks to access education. Note that here buildings do not equate with population, as many Microsoft buildings included are agricultural facilities. It serves however as a proxy to illustrate that the proportion of children needing to do long walks to school is significant.
Figure 5.
Service area map of Lusheya.
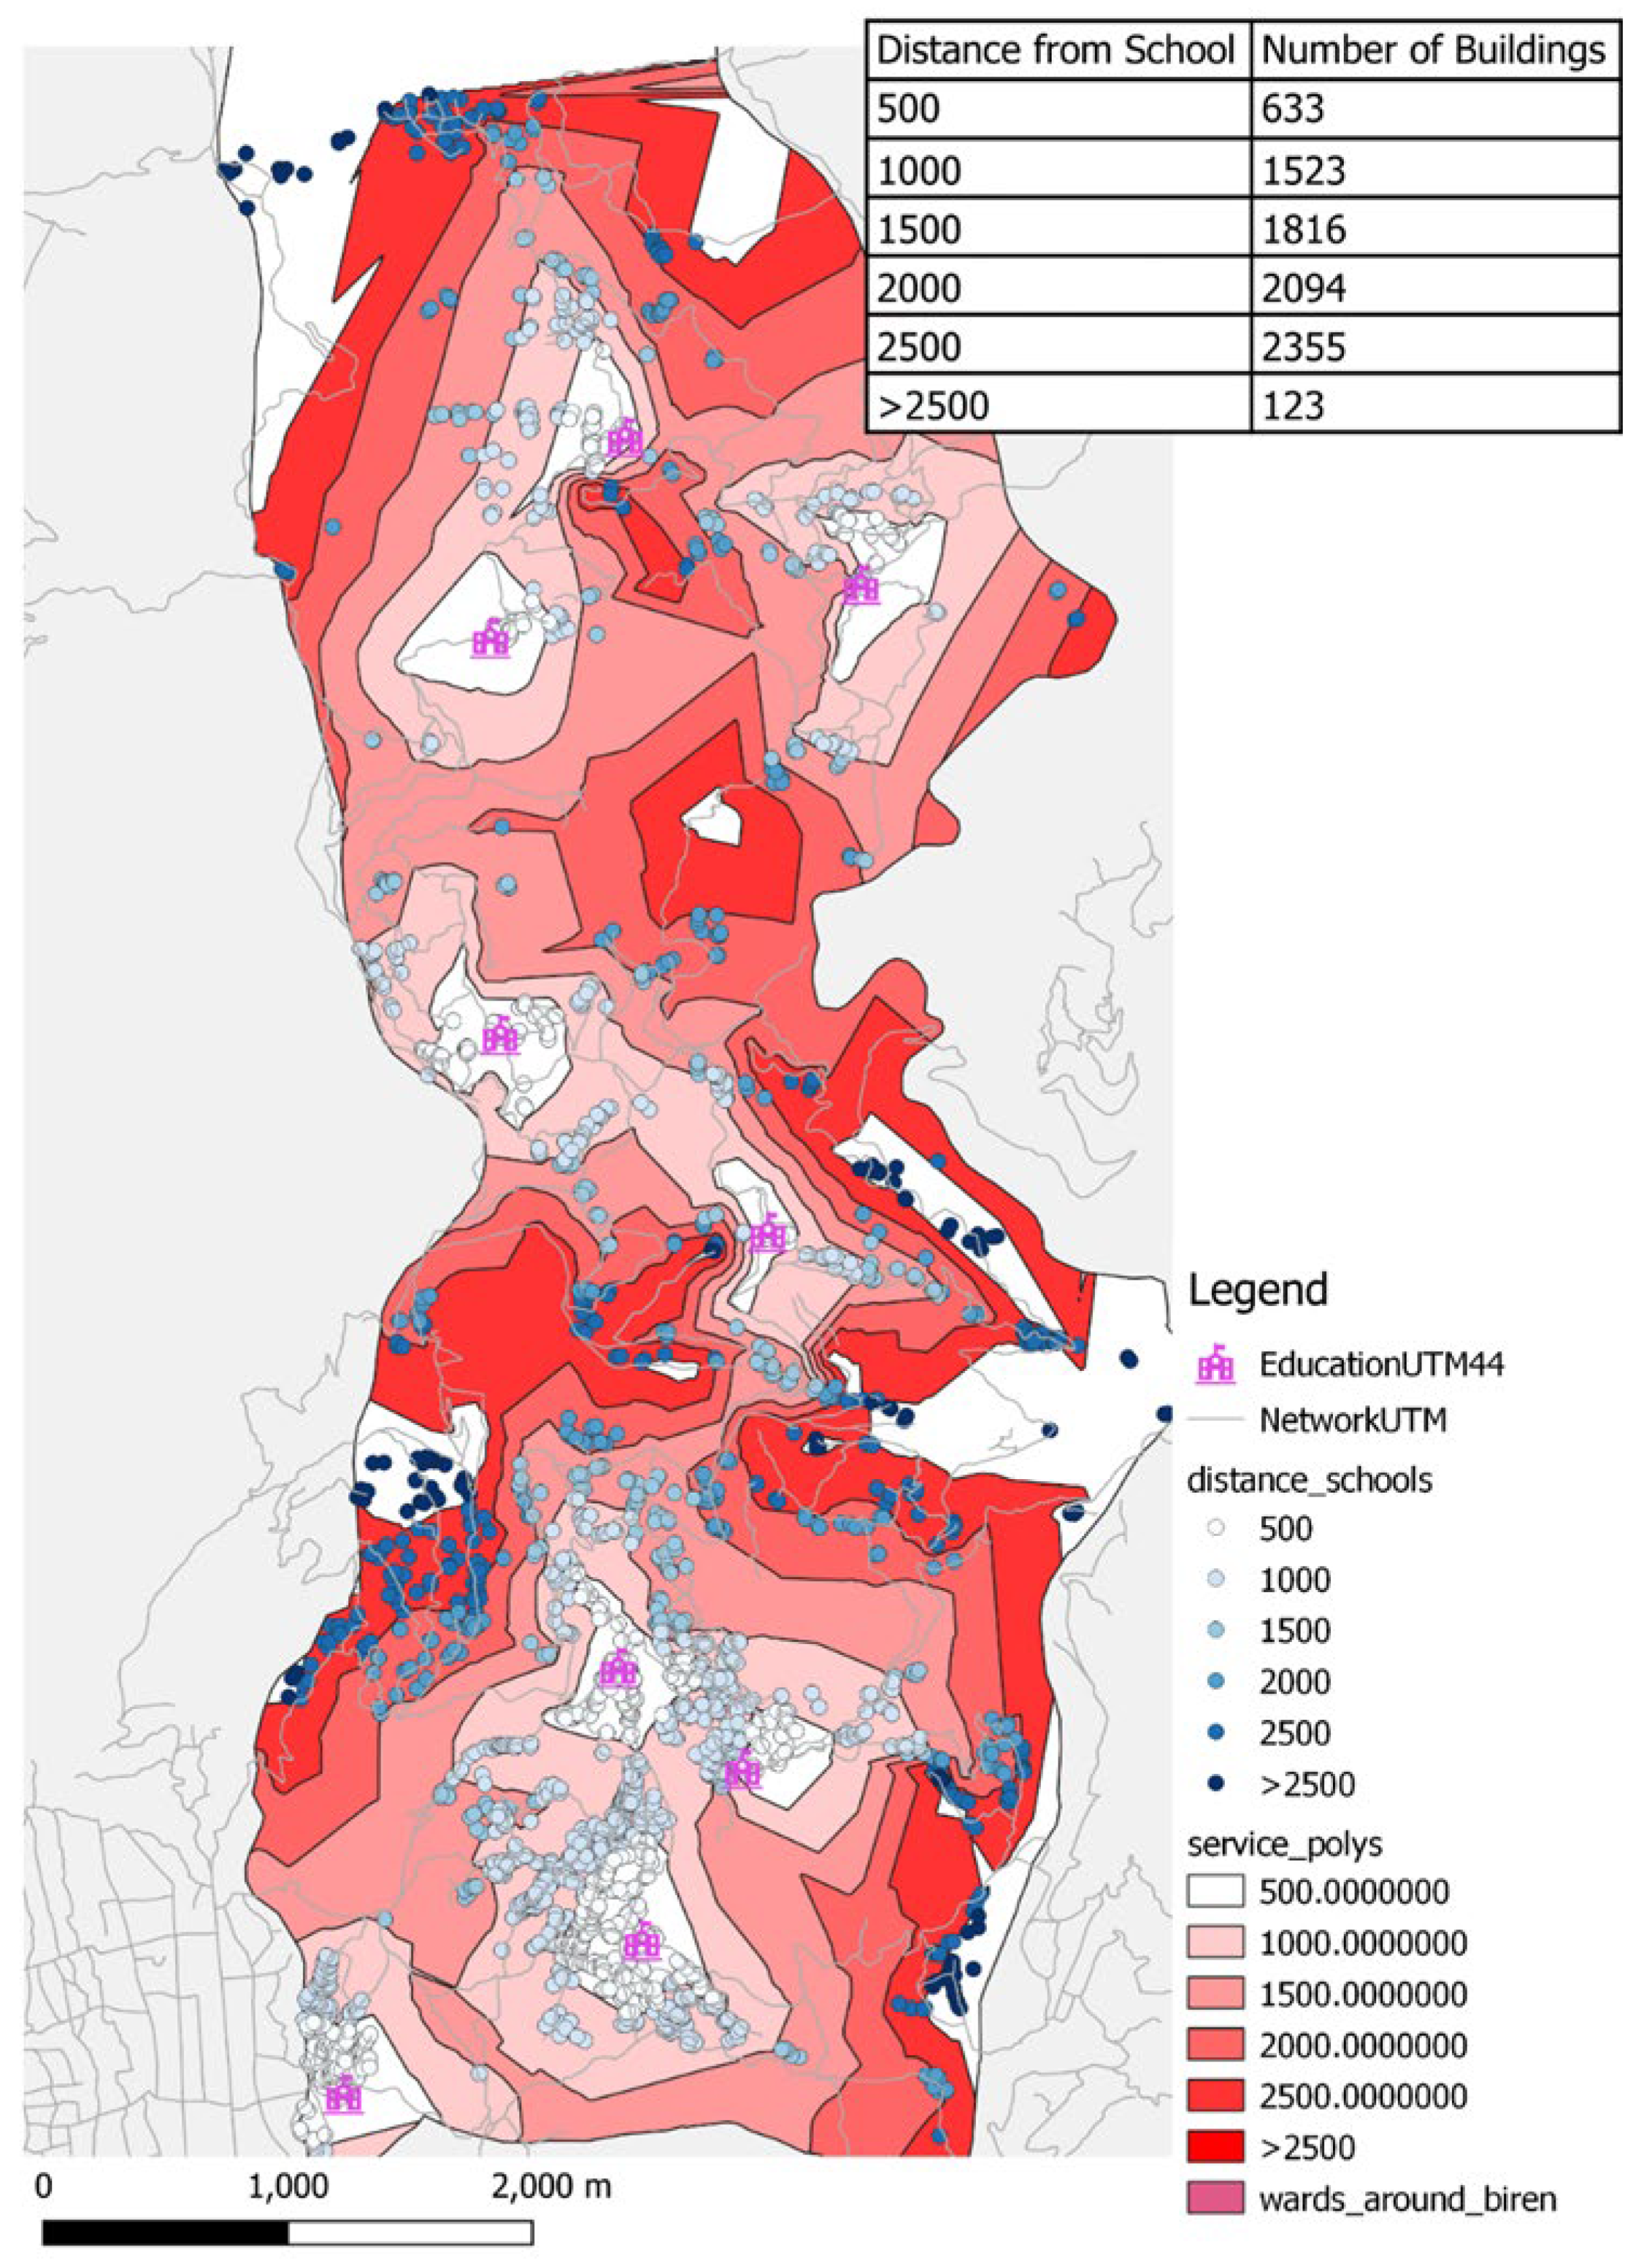
A similar exercise conducted in Birendranagar rural ward 13 illustrates a similar problematic. The lower populations and building density still illustrates the needs to walk for significant portions of children in the area.
Figure 6.
Birendranagar Ward 13 Service area.
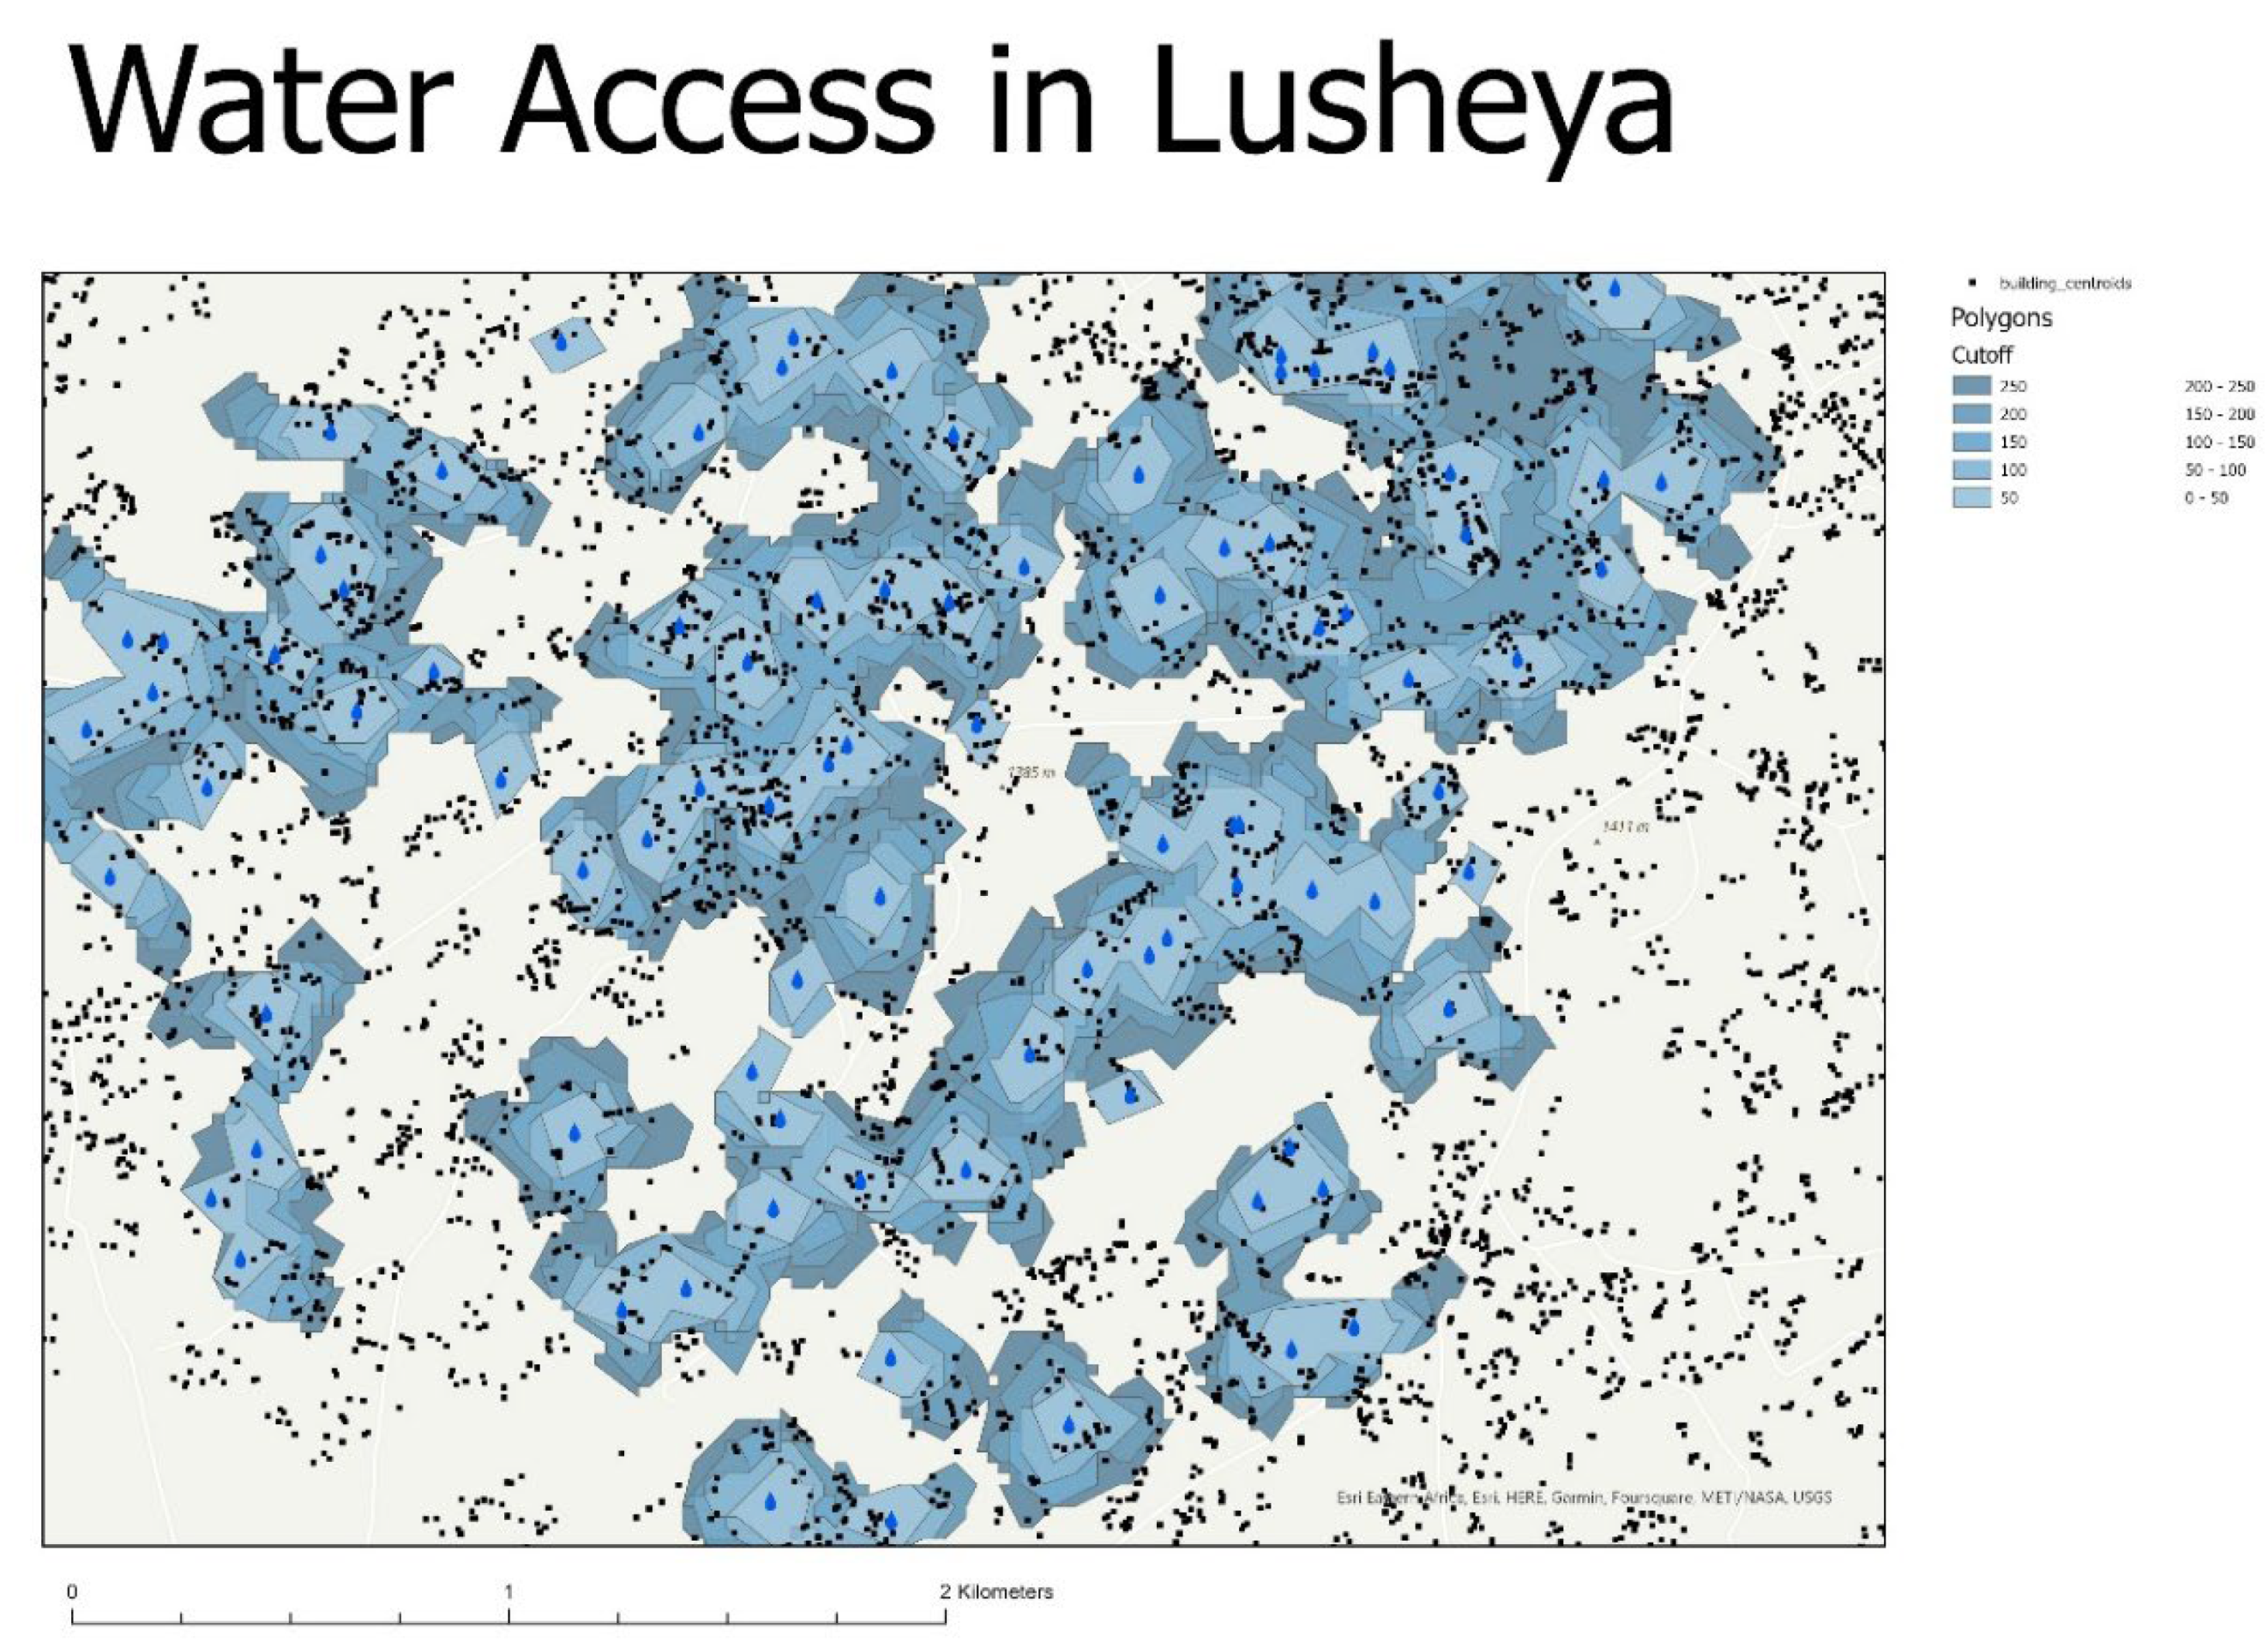
Different types of destinations are linked with diverse needs. Access to water requires the proximity of water collection points in a closer vicinity as carrying water and the frequency of the need in a household is high, with several voyages each day. The collection exercise allowed to collect 182 water points during the exercise. A map of the water points in relation to dwellings illustrates how most dwellings are located in close vicinity of collective water points.
The density of points located outside a 500 meters service area from any community well, illustrates however the large number of dwellers that need to travel more than 500 meters (going and back) to access water at all season. As community members explained, individual water points present in most houses do not give access to water all year round, when the dry season does not allow individual access. This results in a number of travels carrying water being an important time and effort made mostly by women for basic living needs.
Figure 7.
Lusheya water access service area map.
Validation of the Data with Communities
Data Validation by Making Maps
This research project is closely linked to the development of a GIS platform application that includes the creation of maps by enumerators and community members together. This approach of data validation stems for the tradition of F-VGI, or Facilitated VGI, where participants are provided with a simplified access to GIS software and data, to provide geographic information [18,19].
This approach as conducted in Birendranagar, Nepal, allows the participant to access their data in a common exercise and produce maps from the data inputs. This closer look at the data results in maps of sufficient quality with the use of symbology discussed then in common with the community members.
Maps produced by community members belong to a GIS-amateur genre. With a simple and easy to use tool developed during the course of the project, the online mapping tool Usafiri (https://usafiri.io/), community member were invited to build themselves the maps with the support of the research team. This method had the compared advantage with the paper map exercise to allow community members to directly verify and correct the data that was corrected in the previous weeks.
A projection of the maps in a public hall that included the community participants and the elected official of the wards and municipality allowed to discuss the data collected while directly correcting the data.
Figure 8.
Community map highlighting mobility barriers.
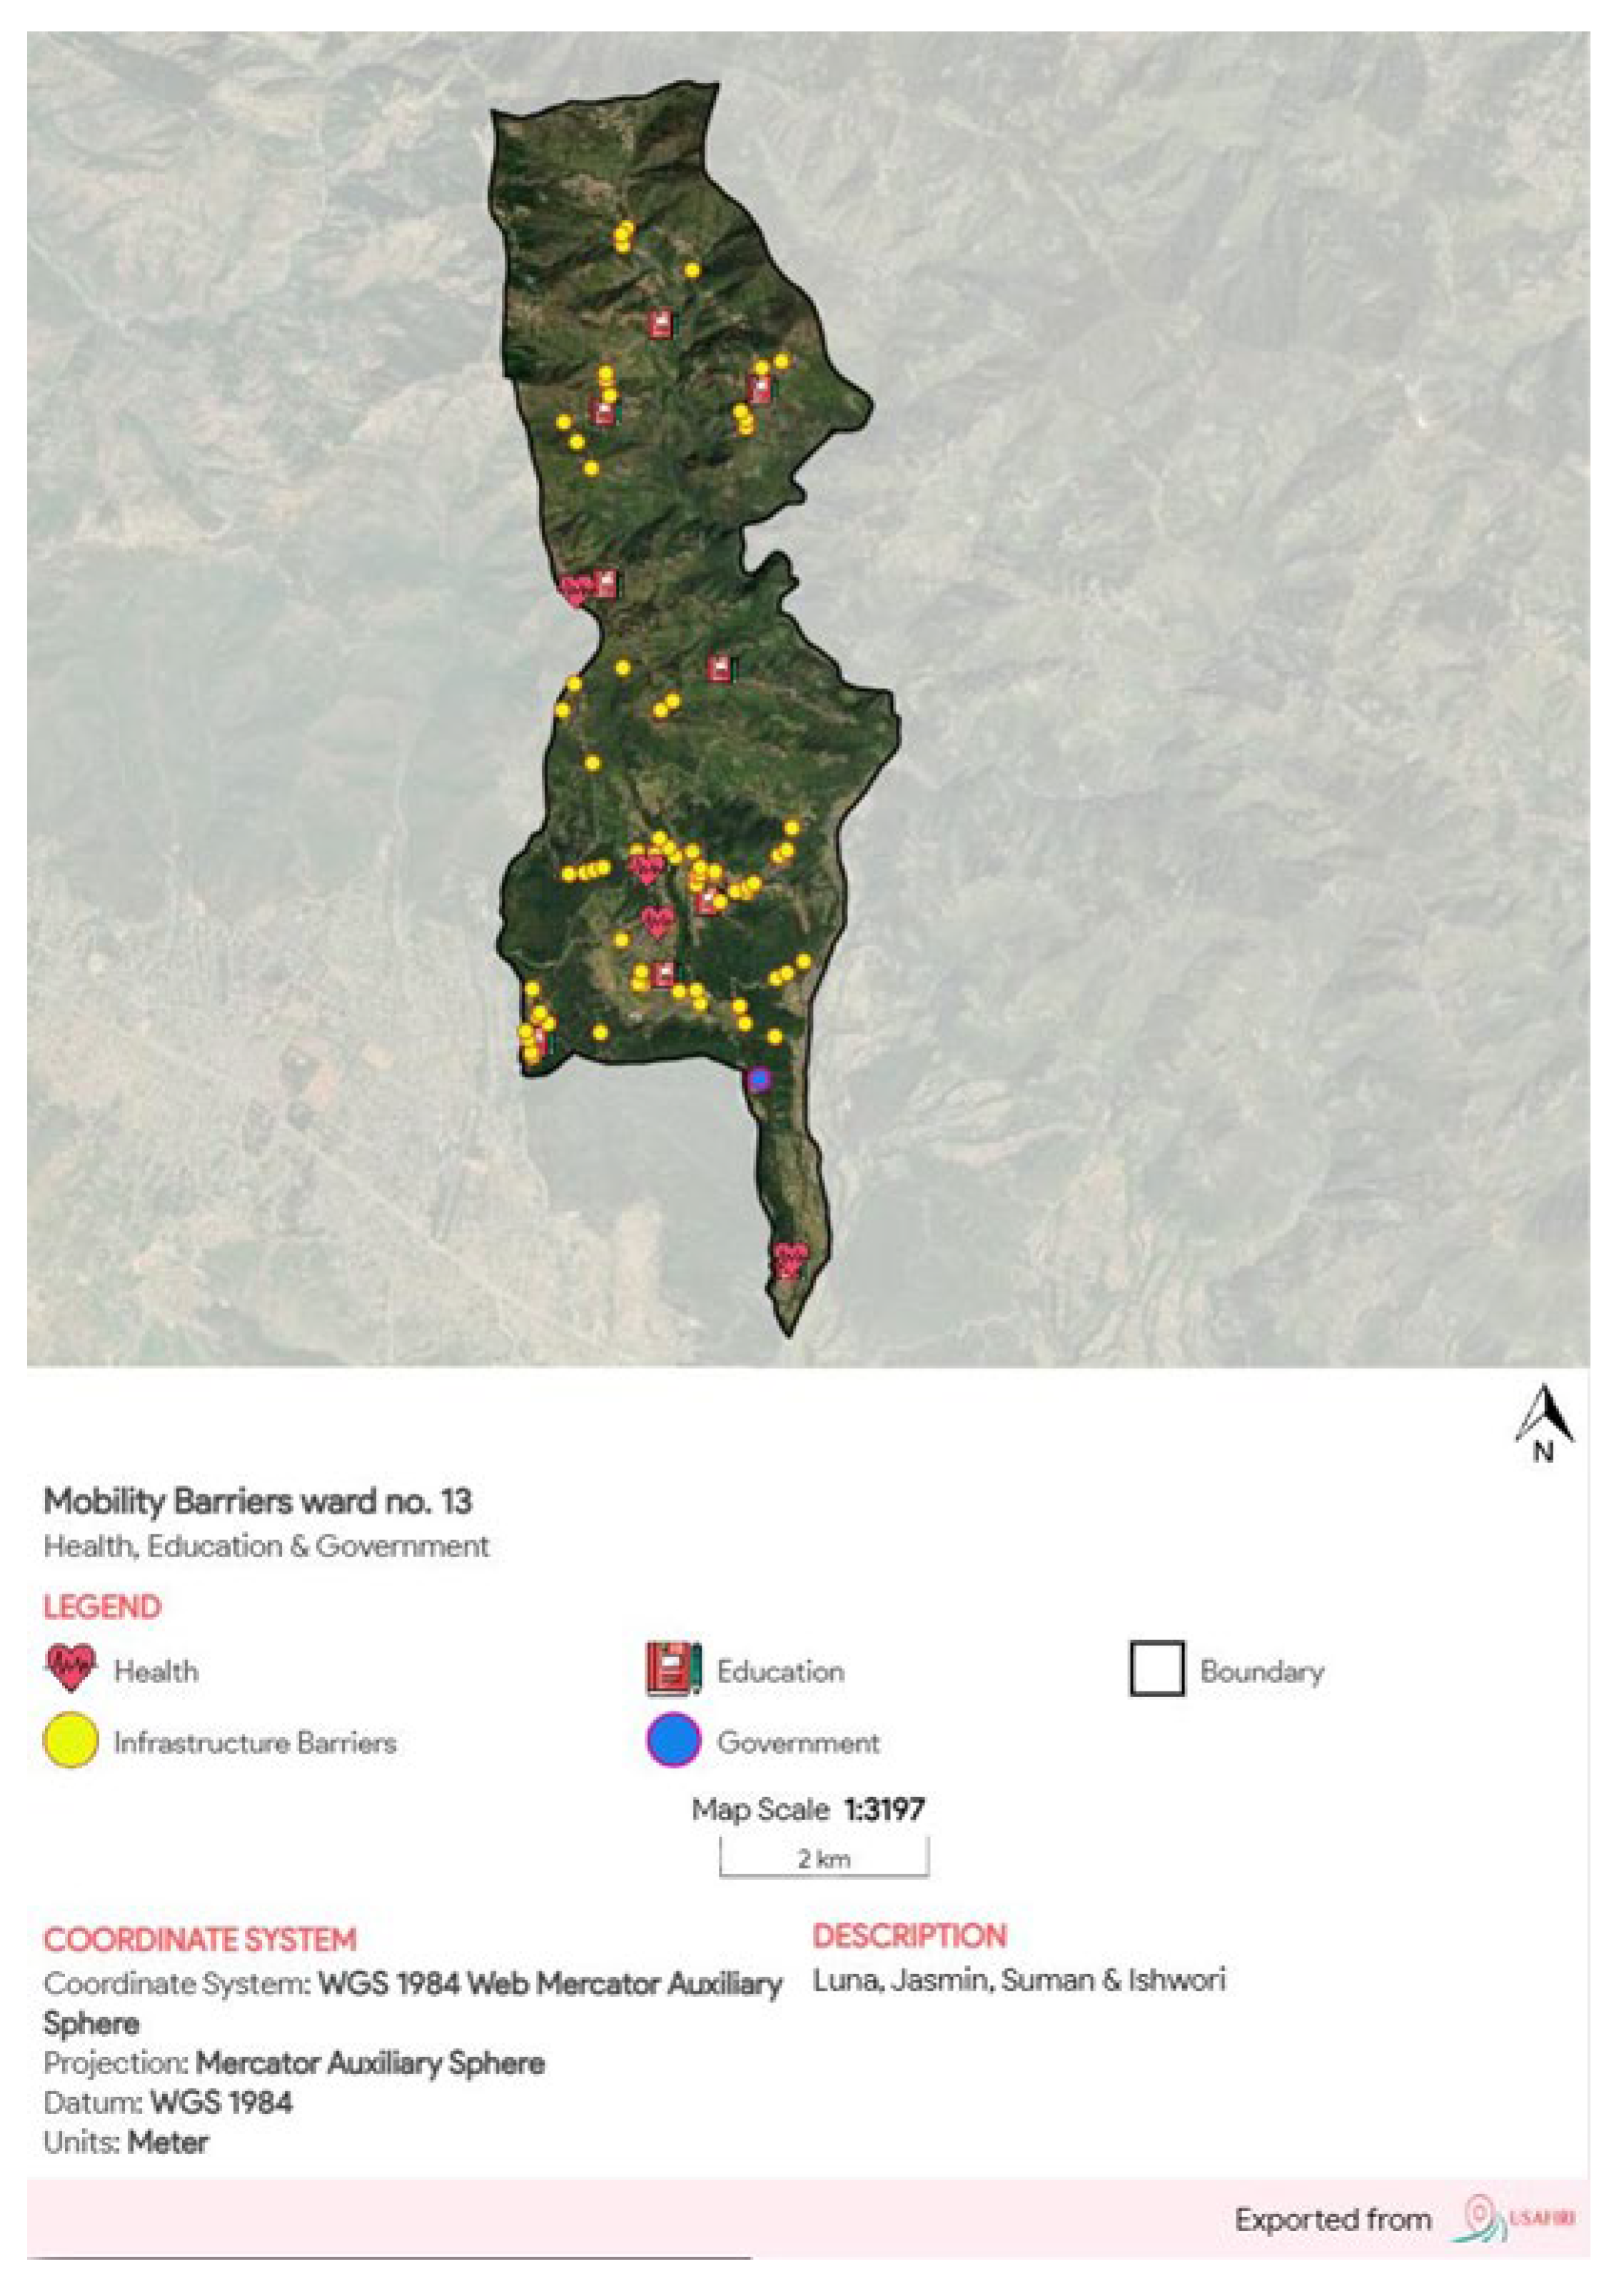
Figure 9.
Community map focussed on social infrastructure.
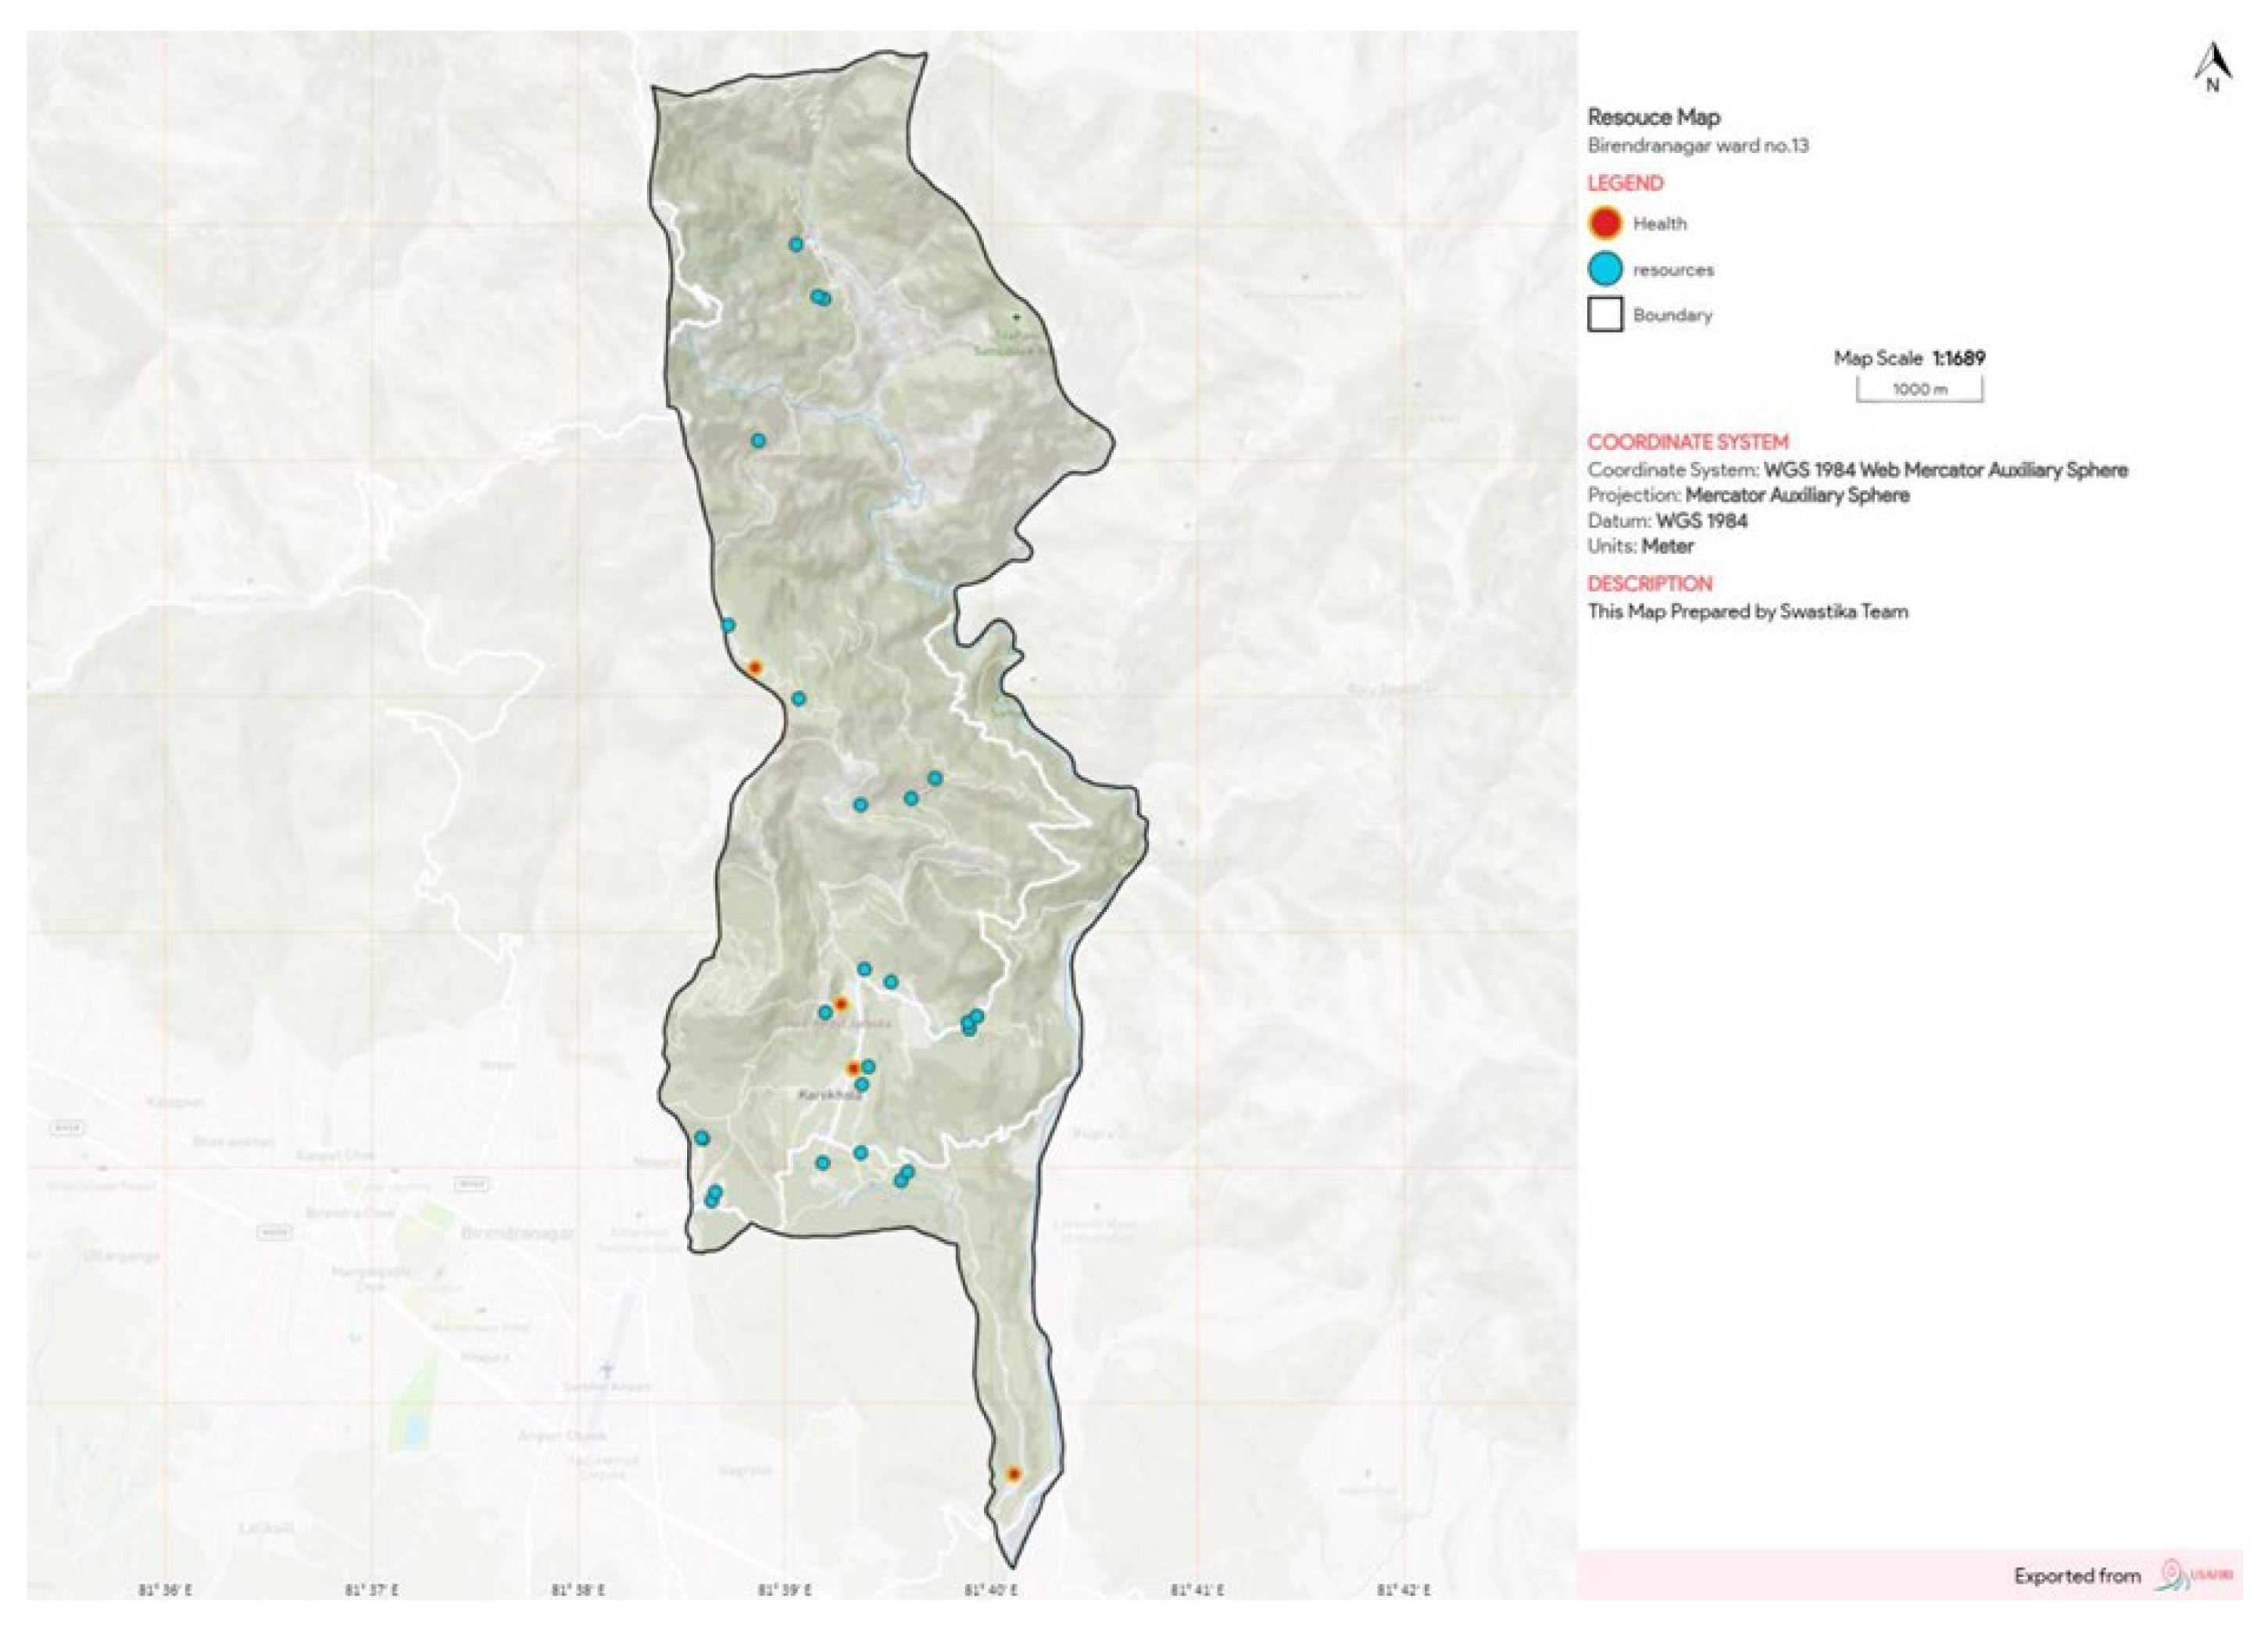
Dynamic GIS Software Combines with Paper Maps
The nature of the data collection tool used for the exercise allowed the continuous control of the technical quality of the data. As QField permitted the visualisation of the collected data on the device, and later when coordinated allowed several checks of on the computer, the tool itself allowed an important assurance that no collected point or line would be misplaced. The most important quality check of this exercise is not however related to the control of point and line position, but to ensure that the main elements defined at the beginning of the collect would correspond to community knowledge.
A form of quality control was continuous, as community members ad enumerators constantly exchanged views and community members were shown the data on the device and actively commented on the situation and positions of elements. The validation needed however a specific session where the community members had access both to a wide overview of the areas and seeing all the details on the map. To allow such exercise to take place, the research team designed and printed two large paper maps in A0 format representing both the Lusheya and Khauga areas.
The validation session consisted in two main parts. A first session aimed at collected collectively the impressions of the participants on the overall exercise and whether they considered the focus of the research to correspond to their mobility priorities and issues. A second part focussed on the detail of the maps by hearing the movements of participants, and correcting some errors of positions and names of features on the map.
The discussion around the maps consisted in the participants listing all the main points of interest listed on the maps as well as adding any element that would not be present, or correct names that were wrongly spelled on the maps. This validation serves in both correcting possible errors but more broadly ensure that community participants recognize the places and validate the overall results.
Another exercise was conducted to have community members describe their own mobility patterns on the map. This part of the exercise allowed going back to the daily mobility patterns, where community participants describe their daily life, only this time it was visually supported by the map. This not only allowed to see patterns of movement of proximity, but also to evaluate what are the minimum daily distances made by community members.
Community members indicated the approximate location of their homes on the map and the main sites of their daily mobility. As explained by these community members, they made all of their daily movements walking. Public transport solutions, including three-wheelers (boda boda in Kenya or auto in Nepal) and minibuses (matatu) was done to reach areas of further distance and less frequent destinations, such as health centres or further to the central administration (Shianda town in Kenya, Birendranagar in Nepal).
This discussion of the daily activities of participants allows observing what are the activity spaces of rural dwellers. Activity spaces are defined as the convex hull of the daily mobility [20,21]. The advantage of this method is its provision of daily activity spaces as a simple area that simply requires the location points of where most activity happen.
In the present case study, they also have the advantage illustrating the area coverage of the participants familiar space over the whole study area. The map of the daily mobility hull illustrates that most activities are restricted to a relatively small area. It reflected interestingly in the validation session as several participants noted that the exercise helped them see their village in a way they had not thought earlier.
The spatial spread of geographic elements in the villages illustrates the character of subsistence economy of the areas covered during the community cartography. The need to have access to close amenities in daily life by local dwellers results in the villages being covered by dense net of small shops and industry, such as grain mills, worship places and water access, among others.
Community Members Feedbacks
A final focus group was organised with community participants to understand their opinions on the overall exercise. It aimed to understand their opinions of the exercise in a broader scope than the maps and data collected. It also aimed to let participants voice their critiques of the exercise, positive and negatives to enhance future exercises in
Perhaps the most interesting result of the exercise, is that community members pointed to how the data collection exercise pushed them to reflect on their villages and social and spatial dynamics. Some community members pointed how this exercise was the occasion to discuss in depth with the local authorities and helped them get a better sense of the mobility dynamics of their village. “I learnt to interact with people from different positions”, explained one participant.
As parts of the exercises were done walking with village elders, the participants enjoyed the deep knowledge of the elders in explaining village social and economic dynamics. Village Elders are elected semi-official acting as interface between the government and citizens, they are generally older people with deep links to their community [22]. Participants thus learnt about locations and local points of interest in the villages as well as walking and learning form places located deeper into the villages than they usually do, apart of their own immediate vicinity.
One participant noted in particular that he only now realised the importance of the regular location of boreholes and river access points. As many houses have direct access to shallow wells, these are generally useable only during the rainy seasons, while in the dry season the shallow wells do not provide enough water all year round [23,24]. The participant noted that the wide presence of shallow wells contrasted with the more spaced and less frequent permanent water points.
Participants also commented that the visits combined with data collection made them realise that clustering of some of the local amenities. “Most churches are located where most other amenities are. But it also made me realise that a number of villages don’t have their own schools and children must walk further”, noted a participant. Coupled with the observation of the map, this exercise of validation of the data and the exercise convincingly illustrates that participatory exercise have a useful effect of supporting local community dwellers to orient their observations of their own living space.
Important critiques of the exercise by community members concerned mainly the practical constraints of the exercise. The transect method requiring walking long distances over the day implied that some of the daily exercises lasted from 9am to 3pm. The community participants noted that they would have favoured expanding the exercise in each of the location to 4 days instead of 3 to allow for shorter days and distances covered per day. “You should take more time to get good information”, as one participant noted at the end of the session.
The impression on the exercise however was not unanimous among the participants. As some had suggested to widen the area of study and others on the contrary suggested surveying smaller parts and focussing on a reduced number of villages and sites. It is not surprising that different opinions emerge from the debriefing of a collection exercise. It provides key insights for researchers to understand that different methods may seem the most appropriate and that decision should take into account and weight in a number of factors.
Suggestion of broadening the scope of the survey also came in the discussion. As the Chief of one of the location pointed: “These maps can support the administration, by showing the locations of MPESA (mobile money) points, or the posho mills (small maize mills). However, when “the question of road access is a big issue that relates to the land, and to the sensitive issue of land ownership”. The feedbacks form the community members highlight numerous questions on how to conduct these type of collection exercises. They also mark eloquently how limited the granularity of official data collection is in rural Kenya.
Results of the first exercise in Kenya provided feedback to enhance and systematise the exercise in Nepal. By this time, the method integrated a GIS Web platform that allowed community participants supported by enumerators to discuss the results in smaller groups and directly navigate interactively the data and produce maps selecting their elements of interest.
Large paper maps and screening produced in advance allowed the representatives of the community and local authorities to comment on the collected data. A survey of appreciation conducted using permitted to assess the impressions of the participants on the exercise. Some participants found the exercise too long and demanding with long walks under high temperature. Validation exercise is also the occasion to assess and discuss the conditions of the community mapping. Among the remarks from participants, comments regard the level of comfort provided during the collection exercise, including for instance discussing the temperature during hall exercises or the quality of the food that was provided. Most participants noted, however, that the exercise was an occasion to observe and understand closely their environments and discussing the conditions of various amenities in their villages with local authorities.
Validation session allowed the addition of elements used in the first fieldwork with other methods. Refining the first exercise allowed to include a broader group of stakeholders in both rural and urban mobility.
The large maps that were shown to communities were commented and annotated to illustrate origins and destinations in the community daily life. In later confirmation exercise, the homes (origins) and main destinations were located on the network and calculated along the network with an Origin-Destination Matrix to see distances involved in daily mobility.
A female participant from Lusheya identified some key destinations as the Market, the Water point and her local church. Although there are numerous churches on the whole territory, the different faiths of the congregants do not necessarily to the closest to their houses. The calculated distances between origin (home) and destinations are shown in Table 4.
The distances involved in the movement of this woman illustrates well different ranges of distances depending on activities. The closest water point is at a walking distance of 310 meters and is clearly the closest distances, whereas shops and especially church can be located at longer distances. Gendered roles in the community, where water collection is almost exclusively assigned to women explains why female respondents present this as regular activity whereas male respondents do not include it in their activities.
A male member of the community, working in a local office indicated his regular movements. The distance to the church is also the longest of its regular movements, justified by a lower frequency of movement.
Figure 10.
Detail of an annotated community map of Lusheya.
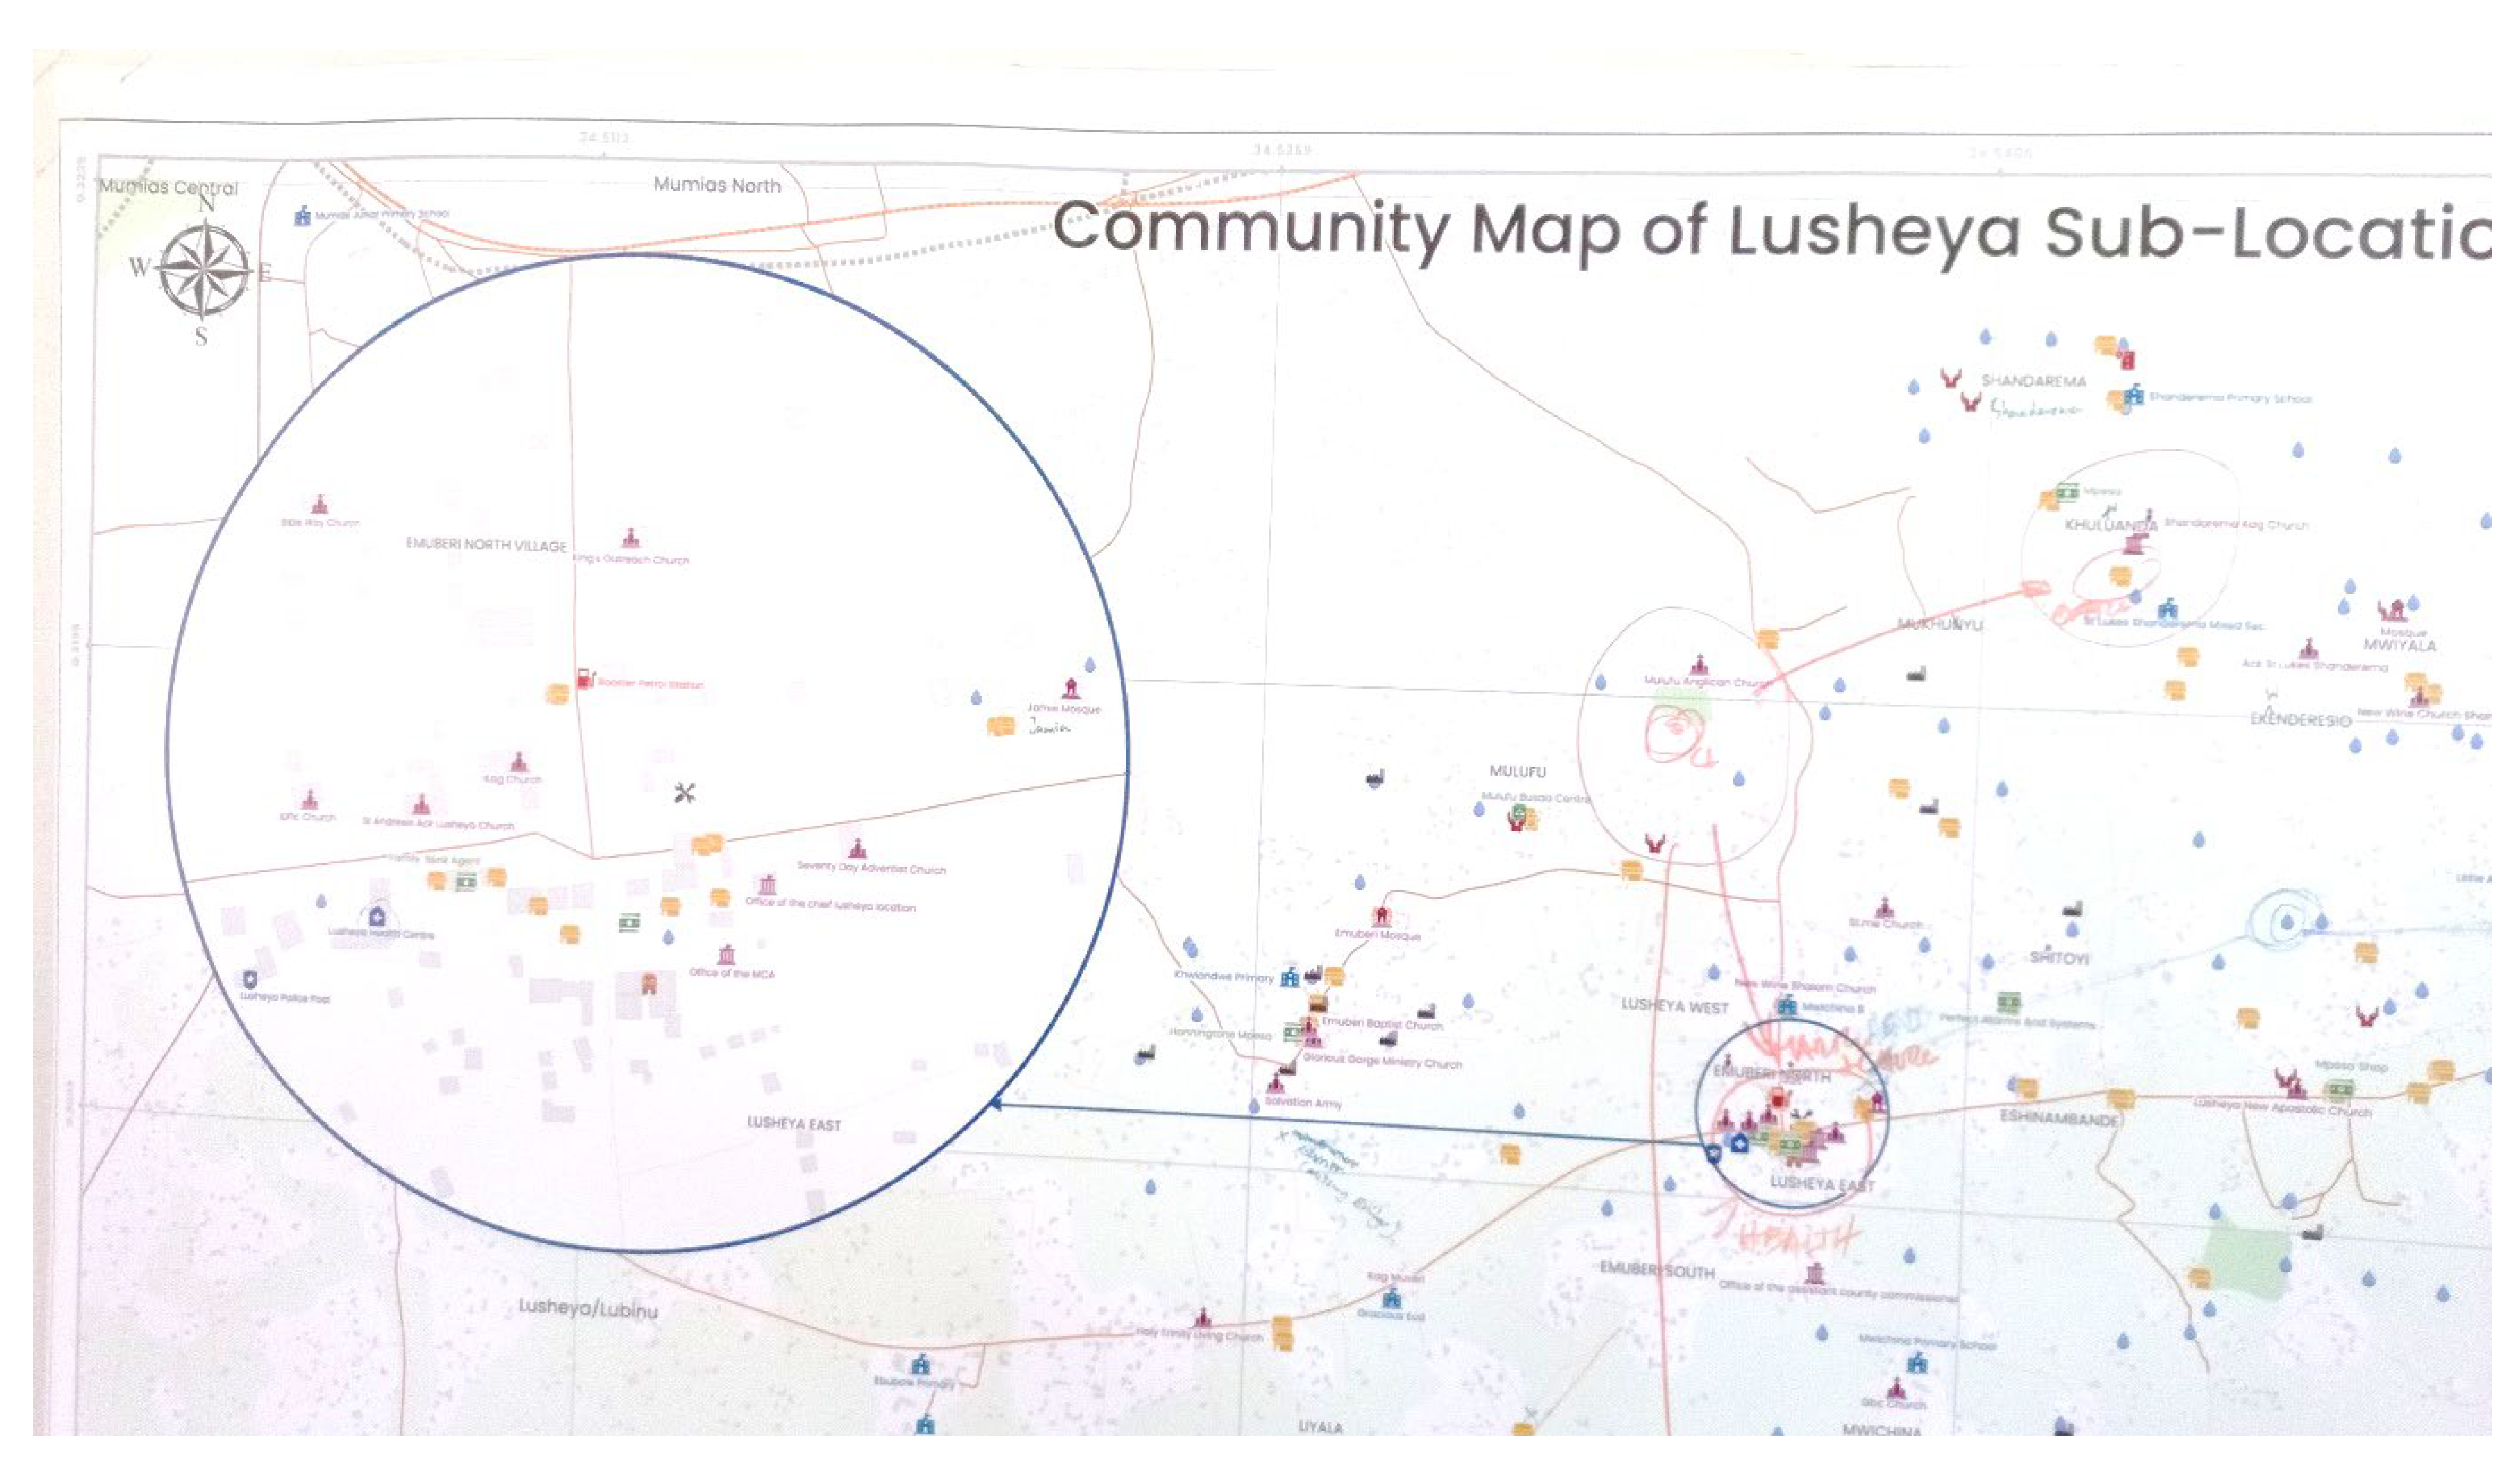
The table of movement samples show a close correlation of distances as estimated by the communities in the first exercise described above, where community members indicated their daily, weekly, and less regular mobility in their community. Both examples of mobility shown above illustrate relatively long walks for religious service, despite a strong density of places of worship in the area. This is due to a great variety of churches, including Catholic, Anglican, various protestant faith and a small number of mosques. As a result, on a weekly basis, church-going can involve relatively long distances.
Overall the examples calculated with network analysis are quite congruent with the estimates made by the community at the begging of the exercise as shown in table. The use of paper maps is however complex and time-consuming to re-import into a GIS. This process, as Seeger notes in his commentary: “The value of the local knowledge to the planning process [is] clear, but so too [are] the limitations of the process in which the information was collected.”[3]
4. Discussion and Conclusions
The research demonstrates that limited mobility significantly impacts daily life for subsistence farmers and rural dwellers. Financial constraints limit access to essential services, education, and markets, perpetuating a cycle of poverty and limited development.
By utilizing participatory GIS and engaging with local communities, the study was able to collect detailed and accurate data on rural mobility patterns. This approach not only filled existing data gaps but also provided valuable insights into the daily movement needs of rural dwellers. The fieldwork in Kenya and Nepal showcased the effectiveness of digital mapping tools like the QField app, which allowed for the collection of comprehensive geographic data, including roads, paths, and points of interest.
The research experiment on community mapping for mobility indicates possible methods and tools to assess mobility in the rural Global South. The possibility to use GIS tools adapted for high data density can be used in rural environments characterised by lack of existing data, provided an adaptation of methods and the inclusion of community knowledge in the process. Technical data collection tools for small areas and rural mobility present limited options. QField appears as the most appropriate in the current development as it permits the updating of existing data and the use of snapping. GIS network analysis corroborates the estimates made by community members in the mapping exercises. Its validation weight is important as it should serve to justify mobility plans based on a combination of community needs assessments supported by spatial analysis.
The research highlights the importance of considering both quantitative and qualitative data when assessing rural mobility. Community engagement revealed specific gender-based mobility challenges, with women often facing greater obstacles in their daily activities. These insights underscore the need for mobility solutions that are tailored to the unique needs of different community members.
Overall, the study advocates for the continued use of participatory GIS as an actionable method for improving rural mobility. By incorporating community-specific data and perspectives, policymakers and planners can develop more effective strategies to enhance mobility and support socio-economic development in the Global South. This research contributes to a deeper understanding of rural mobility issues and provides a framework for future studies and interventions aimed at improving the lives of rural populations.
Author Contributions
Conceptualization, P.D.R., and J.C.; methodology, P.D.R.; software, P.D.R. and U.P.; validation, P.D.R, J.C.B.M..; formal analysis, P.D.R.; investigation, J.C.B.M. and P.D.R.; resources, J.C.; data curation, P.D.R.; J.C.B.M and U.P.; writing—original draft preparation, P.D.R.; writing—review and editing, P.D.R., J.C.B.M, U.P.; visualization, P.D.R.; supervision, J.C.; project administration, P.D.R.; funding acquisition, J.C. All authors have read and agreed to the published version of the manuscript.
Funding
This research was funded by EPFL Tech4Impact, Vice Presidency for Innovation.
Institutional Review Board Statement
The study was conducted in accordance with the Declaration of Helsinki, and approved in two separate applications by the Institutional Review Board (or Ethics Committee) of Swiss Federal Institute of Technology Lausanne (protocol code HREC000179, date of approval: 21 March 2022, and HREC 086-2022, date of approval: 6 December 2022).
Informed Consent Statement
Informed consent was obtained from all subjects involved in the study.
Data Availability Statement
The data presented in this study are available on request from the corresponding author. The data are not publicly available due to privacy restrictions.
Acknowledgments
We acknowledge the administrative support of the local authorities in Kakamega, Kenya and the Municipality of Birendranagar in Nepal. We thank the Human Research Ethics Committee (HREC) of EPFL for ensuring that the research was conducted ethically and following Kenyan and Nepalese standards of ethics and data protection. We also acknowledge the partners in this multidisciplinary research project: the World Bicycle Relief (WBR), Ms. Alisha Myers and Gail Jennings and their representation in Kenya, in particular MM. Nixon Okou and Milton Bwibo Moses; the Nepal Flying Labs (NFL), in particular M. Anil Mandal, for their contributions in building the PGIS toolkit and field support. We also wish to acknowledge the support of all research participants and enumerators in Kenya and Nepal for their interest and their enthusiastic support to this project.
Conflicts of Interest
The authors declare no conflicts of interest.
References
- Munyaka, J.-C.B.; Chenal, J.; de Roulet, P.T.H.; Mandal, A.K.; Pudasaini, U.; Otieno, N.O. Multi-Level Participatory GIS Framework to Assess Mobility Needs and Transport Barriers in Rural Areas: A Case Study of Rural Mumias East, a Sub-County of Kakamega, Kenya. Sustainability 2023, 15, 9344. [CrossRef]
- Bryceson, D.F.; Bradbury, A.; Bradbury, T. Roads to Poverty Reduction? Exploring Rural Roads’ Impact on Mobility in Africa and Asia. Development Policy Review 2008, 26, 459–482. [CrossRef]
- Seeger, C.J. The Role of Facilitated Volunteered Geographic Information in the Landscape Planning and Site Design Process. GeoJournal 2008, 72, 199–213. [CrossRef]
- Brottem, L.V.; Coulibaly, B. The Geography of the Bottom Billion: Rural Isolation and Basic Service Access in the Republic of Mali. Eur J Dev Res 2019, 31, 1147–1170. [CrossRef]
- Berg, C.N.; Blankespoor, B.; Selod, H. Roads and Rural Development in Sub-Saharan Africa. The Journal of Development Studies 2018, 54, 856–874. [Google Scholar] [CrossRef]
- Beuran, M.; Gachassin, M.; Raballand, G. Are There Myths on Road Impact and Transport in Sub-Saharan Africa? Development Policy Review 2015, 33, 673–700. [Google Scholar] [CrossRef]
- Bryceson, D.F.; Mbara, T.C.; Maunder, D. Livelihoods, Daily Mobility and Poverty in Sub-Saharan Africa. Transport Reviews 2003, 23, 177–196. [Google Scholar] [CrossRef]
- Madsen, L.M.; Adriansen, H.K. Understanding the Use of Rural Space: The Need for Multi-Methods. Journal of Rural Studies 2004, 20, 485–497. [Google Scholar] [CrossRef]
- Sexton, A.E.; Hayes-Conroy, A.; Sweet, E.L.; Miele, M.; Ash, J. Better than Text? Critical Reflections on the Practices of Visceral Methodologies in Human Geography. Geoforum 2017, 82, 200–201. [Google Scholar] [CrossRef]
- Hirt, I. Mapping Dreams/Dreaming Maps: Bridging Indigenous and Western Geographical Knowledge. Cartographica 2012, 47, 105–120. [Google Scholar] [CrossRef]
- Hirt, I. Indigenous Mapping: Reclaiming Territories, Decolonizing Knowledge. In The Politics of Mapping; John Wiley & Sons, Ltd., 2022; pp. 155–185 ISBN 978-1-119-98675-1.
- Santos, A.P.; Pessoa Colombo, V.; Heider, K.; Rodriguez-Lopez, J.M. Comparing Volunteered Data Acquisition Methods on Informal Settlements in Mexico City and São Paulo: A Citizen Participation Ladder for VGI. In Socio-Environmental Research in Latin America: Interdisciplinary Approaches Using GIS and Remote Sensing Frameworks; López, S., Ed.; The Latin American Studies Book Series; Springer International Publishing: Cham, 2023; pp. 255–280. ISBN 978-3-031-22680-9. [Google Scholar]
- Choplin, A. La mondialisation des pauvres: loin de Wall Street et de Davos; La république des idées; Seuil: Paris, 2018; ISBN 978-2-02-136652-5. [Google Scholar]
- Citizen Mapping: Using Common Geospatial Technologies to Map Informal Settlements in São Paulo, Brazil.; Pessoa Colombo, V., Ed.; 2018.
- Johns, F. #Help: Digital Humanitarianism and the Remaking of International Order; Oxford University Press, 2023; ISBN 978-0-19-764887-2.
- Brown, G. A Review of Sampling Effects and Response Bias in Internet Participatory Mapping (PPGIS/PGIS/VGI). Transactions in GIS 2017, 21, 39–56. [Google Scholar] [CrossRef]
- Verplanke, J.; McCall, M.K.; Uberhuaga, C.; Rambaldi, G.; Haklay, M. A Shared Perspective for PGIS and VGI. The Cartographic Journal 2016, 53, 308–317. [Google Scholar] [CrossRef]
- Seeger, C.J. Mapping and Visualizing the Built Environment and User Interaction Through Facilitated-Volunteered Geographic Information (F-VGI). In The Virtual and the Real in Planning and Urban Design; Routledge, 2017 ISBN 978-1-315-27024-1.
- Kalvelage, K.; Dorneich, M.C.; Seeger, C.J.; Welk, G.J.; Gilbert, S.; Moon, J.; Jafir, I.; Brown, P. Assessing the Validity of Facilitated-Volunteered Geographic Information: Comparisons of Expert and Novice Ratings. GeoJournal 2018, 83, 477–488. [Google Scholar] [CrossRef]
- Sherman, J.E.; Spencer, J.; Preisser, J.S.; Gesler, W.M.; Arcury, T.A. A Suite of Methods for Representing Activity Space in a Healthcare Accessibility Study. International Journal of Health Geographics 2005, 4, 24. [Google Scholar] [CrossRef] [PubMed]
- Stewart, T.; Duncan, S.; Chaix, B.; Kestens, Y.; Schipperijn, J.; Schofield, G. A Novel Assessment of Adolescent Mobility: A Pilot Study. International Journal of Behavioral Nutrition and Physical Activity 2015, 12, 18. [Google Scholar] [CrossRef] [PubMed]
- Mutua, J.N.; Kiruhi, T.M. Volunteer Public Leaders’ Values-Driven Leadership: The Case of Village Elders in Kenya. Heliyon 2021, 7, e06411. [Google Scholar] [CrossRef] [PubMed]
- Rutten, M.M.E.M. Shallow Wells: A Sustainable and Inexpensive Alternative to Boreholes in Kenya. ASC Working Paper Series 2005. [Google Scholar]
- Turman-Bryant, N.; Nagel, C.; Stover, L.; Muragijimana, C.; Thomas, E.A. Improved Drought Resilience Through Continuous Water Service Monitoring and Specialized Institutions—A Longitudinal Analysis of Water Service Delivery Across Motorized Boreholes in Northern Kenya. Sustainability 2019, 11, 3046. [Google Scholar] [CrossRef]
Table 2.
Women of the community present their main activities, and their estimates of distances and time spent walking and other means of transports.
Table 2.
Women of the community present their main activities, and their estimates of distances and time spent walking and other means of transports.
| Activities | Distance from/ to home (at home, 100 meters, 1 kilometer, 5kilometer) | Frequency (daily, weekly, irregular, several times a day..) | Transport mode (foot, bicycle, public transport..) | Obstacles on the way (infrastructure, disturbances..) | Approximate time spent on travel for this activity |
|---|---|---|---|---|---|
| Domestic activities | At/near home | ||||
| Farming activities | At/near home | ||||
| Bringing/collecting children to/from school | 3 km | every week day | walking, bicycles (few), boda (motorbike) boda (motorbike) (few)school bus for private schools (negligeable) | road condition, people disturbance, flooded rivers (rain season) | From 5.45am to 6.30am (45 mins) |
| Fetching firewood | 2-3 km in rural paths and forest areas | twice a week | walkingsometimes husband carries on bicycle | road condition, people disturbance, flooded rivers (rain season)snakes/wild attacksharassment and risk of rape | From 7am to 12am (distance walking and fetching) |
| Selling milk | 400m, 1 km | daily | walking, boda (motorbike) cancels profit. Selling while walking | road condition, people disturbance, flooded rivers (rain season) | 20-30 mins |
| Church | 100m-2km (long range exceptions) | weekly | walking, bicycle, boda (motorbike), vehicles | road condition, people disturbance, flooded rivers (rain season) | 20-30 mins |
| Office work | most stay at workplace. 5maj-30km for those who have houses and commute | every week day | boda (motorbike), matatu (minibus) | price, road conditions, police | 15mins |
| Social meetings | vicinity | multiple each day | walking | road condition, people disturbance, flooded rivers (rain season) | 20-30 mins |
| Political rallies | up to 8km | political season. Couple times | walking, bicycle, boda (motorbike), vehicles | road condition, people disturbance, flooded rivers (rain season) | long walk |
| Bringing children to health centre | 1km-5km | occasionally | boda (motorbike) | road condition, people disturbance, flooded rivers (rain season) | long walk |
| Going to the market | vicinity/main market on Saturdays 5km | multiple times in the week | walking, bicycle, boda (motorbike), vehicles | road condition, people disturbance, flooded rivers (rain season) | short or long walks depending if local or main market |
Table 3.
Summary of community participants and commuting needs and estimated distances.
| Small area/walking distance (5 km radius) | Medium area (10/25 km radius) | Wider area (25/50 km radius) |
|---|---|---|
| Day-to-day activities | Regular displacements | Access to central and specialized facilities |
| Schools, work, market | Religious service, health care | Specialized healthcare, renewal of official documents |
Table 4.
Example of distances between home of a Lusheya woman and local amenities.
| Origin and destination | Distance on the network (meters) |
|---|---|
| Home - Water | 310.78 |
| Home - Shop | 1268.03 |
| Home - Church | 2550.25 |
Table 5.
Example of distances between home of a Lusheya man and local amenities.
| Origin and destination | Distance on the network (meters) |
|---|---|
| Home - Office | 1179.26 |
| Home - Health | 1405.39 |
| Home - Church | 4335.79 |
Disclaimer/Publisher’s Note: The statements, opinions and data contained in all publications are solely those of the individual author(s) and contributor(s) and not of MDPI and/or the editor(s). MDPI and/or the editor(s) disclaim responsibility for any injury to people or property resulting from any ideas, methods, instructions or products referred to in the content. |
© 2024 by the authors. Licensee MDPI, Basel, Switzerland. This article is an open access article distributed under the terms and conditions of the Creative Commons Attribution (CC BY) license (https://creativecommons.org/licenses/by/4.0/).
Copyright: This open access article is published under a Creative Commons CC BY 4.0 license, which permit the free download, distribution, and reuse, provided that the author and preprint are cited in any reuse.


