
Submitted:
20 July 2025
Posted:
06 August 2025
You are already at the latest version
Abstract
Accurate and verifiable landholding data are essential for precision agriculture, underpinning equitable water distribution, effective irrigation scheduling, and evidence-based agricultural planning. In many developing contexts, however, legacy land records, customary tenure systems, and fragmented administrative data hinder efficient resource governance. For the first time, we present an innovative, methodical approach to farmer registry modernization—tested and piloted in a mixed farming system characterized by outdated registries and informal tenure arrangements. The approach integrates participatory mapping, mobile-based data collection, and geospatial analysis to generate a technical and socially validated farmer registry. The pilot was conducted in the Kiamanyeki section of Kenya’s Mwea Irrigation Scheme, where 2,397.24 acres were mapped and 997 farmers registered across eight administrative units. Data were collected via KoboCollect and processed via ArcGIS, enabling reconciliation of parcel size discrepancies, boundary visualization, and identification of data gaps associated with absenteeism and nondisclosure. We present a replicable framework that enhances transparency, facilitates stakeholder engagement, and offers a scalable model for improving land information systems in smallholder irrigation contexts. This paper outlines the technical constraints, sociocultural dynamics, and policy pathways for upscaling participatory GISs in support of climate-resilient agricultural governance.
Keywords:
participatory GIS
; farmer registry
; land tenure
; smallholder irrigation
; precision agriculture
1. Introduction
Precision agriculture increasingly relies on detailed, accurate, and dynamic farm-level information to optimize input use, improve yields, and support equitable natural resource management [12, 15]. One key component of this approach is precision irrigation, which depends on up-to-date spatial landholding data to allocate water resources efficiently, plan maintenance schedules, support government subsidy programs and support cost recovery in large-scale irrigation schemes [11, 20]. However, many smallholder irrigation systems in Sub-Saharan Africa are still managed via outdated land registries, with disparate administrative records and informal tenure arrangements, factors that hinder effective governance and equitable service delivery [6, 14].
In Kenya, the National Irrigation Authority (NIA) has prioritized irrigation expansion as part of the Vision 2030 agenda to increase national food security and climate resilience [16]. The Mwea Irrigation Scheme (MIS), the country’s largest public irrigation project, has recently expanded through developments such as the Kiamanyeki section, which added 2,400 acres to irrigated farmland. Despite major physical investments in canals and control infrastructure, efficient management still depends on verifiable farmer registries to ensure transparent water allocation, fair cost sharing, and accountable service delivery [16].
The Kiamanyeki expansion presents an opportunity to pilot innovative approaches to registry development that combines participatory mapping, mobile data capture, and spatial analytics. Participatory geographic information system (PGIS) methodologies have been widely promoted as effective mechanisms for democratizing data collection, strengthening farmer buy-in, and improving data quality in resource governance systems [2, 3]. This paper presents the results of a participatory registry development process in the Kiamanyeki section, offering insights into its technical feasibility, governance benefits, and broader policy relevance.
In many developing nations, smallholder farmers face a persistent barrier: the lack of accurate, up-to-date landholding data. This gap undermines effective irrigation governance, which is nowhere more evident than in Kenya’s Mwea Irrigation Scheme (MIS). Within the recently expanded Kiamanyeki section spanning 2,400 acres and supporting 997 farmers—outdated records, administrative inconsistencies, and tenure complexities—have stymied efforts to modernize irrigation practices and increase agricultural productivity. These challenges impede equitable water distribution, hinder sustainable maintenance funding, and limit the adoption of precision agriculture techniques critical for resilience in an era of climate uncertainty.
To address this pressing issue, this study developed and tested a participatory GIS-based farmer registry framework, an innovative solution designed to deliver precise, verifiable landholding data while fostering community ownership. By integrating mobile phone-based data capture, farmer-led mapping, and official registry index maps (RIMs), this framework bridges the divide between traditional land administration and the demands of contemporary irrigation planning. This approach, implemented in the Kiamanyeki section across eight administrative units, represents a tested, scalable approach to improving transparency and governance in smallholder irrigation systems.
While PGIS and mobile data capture hold significant promise for improving landholding data and irrigation governance, their application in large-scale public irrigation systems in East Africa remains underexplored [4, 21]. Research often focuses narrowly on either the technical aspects of land administration or the governance of irrigation systems, rarely integrating these dimensions to address the specific demands of precision agriculture in smallholder contexts [4, 21]. This gap is particularly pronounced in regions such as Kenya, where tenure insecurity, outdated records, and sociocultural factors such as absenteeism and nondisclosure complicate resource management.
This study fills this gap by evaluating a participatory GIS-based farmer registry in the Kiamanyeki section of the Mwea Irrigation Scheme. By reconciling farm acreage discrepancies, resolving boundary overlaps, and addressing data incompleteness, the research demonstrates how PGIS can produce accurate, verifiable landholding data while enhancing governance outcomes. Furthermore, it examines the approach’s potential for wider replication, offering insights into technical challenges, sociocultural constraints, and policy implications for climate-smart precision agriculture in similar irrigation systems across the Global South. The present study tests these technologies in the Kiamanyeki section, addressing both their potential and limitations.
2. Literature Review
2.1. Land Information Systems (LIS) and Irrigation Governance
Effective irrigation governance is dependent on the availability of accurate, transparent, and verifiable landholding records, which serve as the foundation for equitable water allocation, enforceable property rights, and efficient cost recovery mechanisms [8, 13, 20]. Without precise and up-to-date land information, irrigation schemes struggle with inefficiencies, misallocation of resources, and disputes over access, ultimately hindering agricultural productivity. In developing countries, however, land information systems (LISs) are often fragmented and outdated, failing to accurately reflect contemporary land tenure arrangements due to historical reliance on colonial cadastral frameworks [5, 18]. These legacy systems inadequately accommodate informal land transfers, generational subdivisions, and evolving land uses, resulting in data discrepancies that complicate irrigation governance and contribute to resource conflicts [6, 15].
In sub-Saharan Africa, where smallholder agriculture dominates, weak land record systems have been identified as a significant barrier to agricultural productivity and climate resilience [7, 13]. Farmers operating under uncertain tenure arrangements often face difficulties in securing irrigation access and lack incentives for long-term investments in soil and water conservation [10, 14]. For example, in Kenya’s Mwea Irrigation Scheme (MIS), outdated registries have hindered modernization efforts, limiting efforts to introduce precision irrigation technologies and adaptive land-use planning [10, 16-17]. The lack of clarity in land tenure not only delays infrastructure upgrades but also perpetuates inefficiencies in water allocation, exacerbating vulnerability to climate extremes.
Recognizing these challenges, modernized LIS can offer a pathway to more efficient and participatory irrigation governance. The integration of information from remote sensing, digital mapping, and automated record management, irrigation authorities can improve data accuracy, streamline decision-making, and enhance farmers’ access to resources [16]. This is particularly relevant for highly contested irrigation zones such as the Kiamanyeki section of MIS, where participatory approaches may enable greater transparency and trust among landholders, water users, and governing agencies. Strengthening the LIS can thus serve as a critical step in ensuring equitable irrigation access, sustainable land use, and climate-adaptive agricultural practices in water-stressed regions.
2.2. Participatory GIS and Registry Modernization
Participatory geographic information systems (PGISs) integrate community engagement with geospatial technology to increase the accuracy and legitimacy of landholding data [3, 4, 17]. By involving local stakeholders in the mapping process, PGIS fosters ownership, strengthens tenure security, and reduces conflicts while producing granular, up-to-date spatial data essential for precision irrigation [4 ,8]. Recent studies underscore its potential for modernizing cadastral records in diverse settings [1, 9, 18].
Successful implementations provide valuable insights. In Rwanda, a PGIS initiative registered over 10 million land parcels, significantly improving tenure security and dispute resolution [4, 18, 21]. Similarly, in Ghana, participatory mapping has documented customary land rights, bridging the gap between informal and formal tenure systems [2-3]. These examples illustrate how PGIS can reconcile discrepancies and enhance trust among stakeholders, a critical factor in the Kenyan context where the MIS integrates formal and customary tenure arrangements. This study leverages PGIS to address these challenges, offering a tailored approach to registry modernization.
2.3. Mobile Data Capture and Technological Innovations
Mobile data collection platforms, such as KoboCollect and the Open Data Kit (ODK), have transformed field mapping by enabling real-time data capture, validation, and centralized management [1-2, 17]. When paired with GIS analytics and remote sensing, these tools offer scalable, cost-effective solutions for updating land registries in resource-constrained environments [3, 21]. Their flexibility makes them particularly suited to smallholder irrigation contexts, where traditional surveying methods are often impractical [6, 17].
Despite their promise, challenges persist. Limited internet connectivity, data privacy concerns, and the need for technical training can impede adoption, especially in rural areas [5, 7, 21]. In Kenya, while mobile phone penetration is high, disparities in digital literacy and infrastructure remain significant barriers [16]. Nevertheless, with adequate capacity-building and community involvement, mobile-based PGIS has demonstrated success in bridging traditional land administration with modern precision agriculture needs [3, 11, 16, 20].
3. Study Area
3.1. Project Location
The MIS lies in Kirinyaga County, Kenya, receiving water from the Thiba and Nyamindi rivers and serving as the country’s main rice production hub. The Kiamanyeki expansion covers 2,400 acres subdivided into eight administrative units (Units A, B, C1, C2, C3, C4, D, and E), each designed around a new canal and sluice gate infrastructure that enables double cropping under regulated irrigation scheduling.
Figure 1.
Geographic context of the study area: (a)Detailed map of the Mwea Irrigation Scheme (MIS), highlighting the Kiamanyeki section with labeled zones A–E in red; (b) Inset map of Kenya indicating the location of Kirinyaga County; (c) Regional map of Kirinyaga County illustrating the distribution of irrigation schemes.

Farm sizes in this irrigation scheme range between 0.25 and 3 acres, with mixed land uses including rice paddies, horticulture, maize, grazing areas, and homesteads. Accurate farmer registry data are critical for operationalizing new infrastructure, allocating water shares, and establishing operations and maintenance (O&M) charges.
4. Materials and Methods
4.1. Participatory Design and Stakeholder Engagement
The registry development process employed a fully participatory design anchored in inclusive, multistakeholder engagement. Inception meetings were convened at the outset, bringing together key actors, including representatives from the National Irrigation Authority (NIA), Mwea Irrigation Scheme (MIS) management, unit leaders, administrative officers (Assistant Chiefs and Chiefs), local farmers, and GIS technical experts.
These meetings aim to align expectations, clarify project objectives and deliverables, define roles, and establish timelines. Following the inception phase, a week-long sensitization campaign was carried out by local leaders to mobilize community participation. This preparatory effort underscored the importance of farmer involvement and transparency, fostering collective ownership and trust in the registry development process.
4.2 Enumerator Training And Mobile Data Capture
A field-based data collection campaign was implemented by a team of six trained enumerators, each equipped with rugged Android tablets configured with geospatial survey instruments via the KoboCollect platform. The enumerators participated in comprehensive training sessions comprising both theoretical instruction and practical application. The key components of the training included the following:
- Deployment of KoboCollect for mobile survey administration
- Operation of handheld GPS-enabled devices for geospatial boundary mapping
- Vertex-by-vertex digitization techniques suited for irregular plot geometries
- Protocols for collecting verified farmer biodata (e.g., names, identification numbers, and contact information)
- Visual classification of land use and in-field crop identification
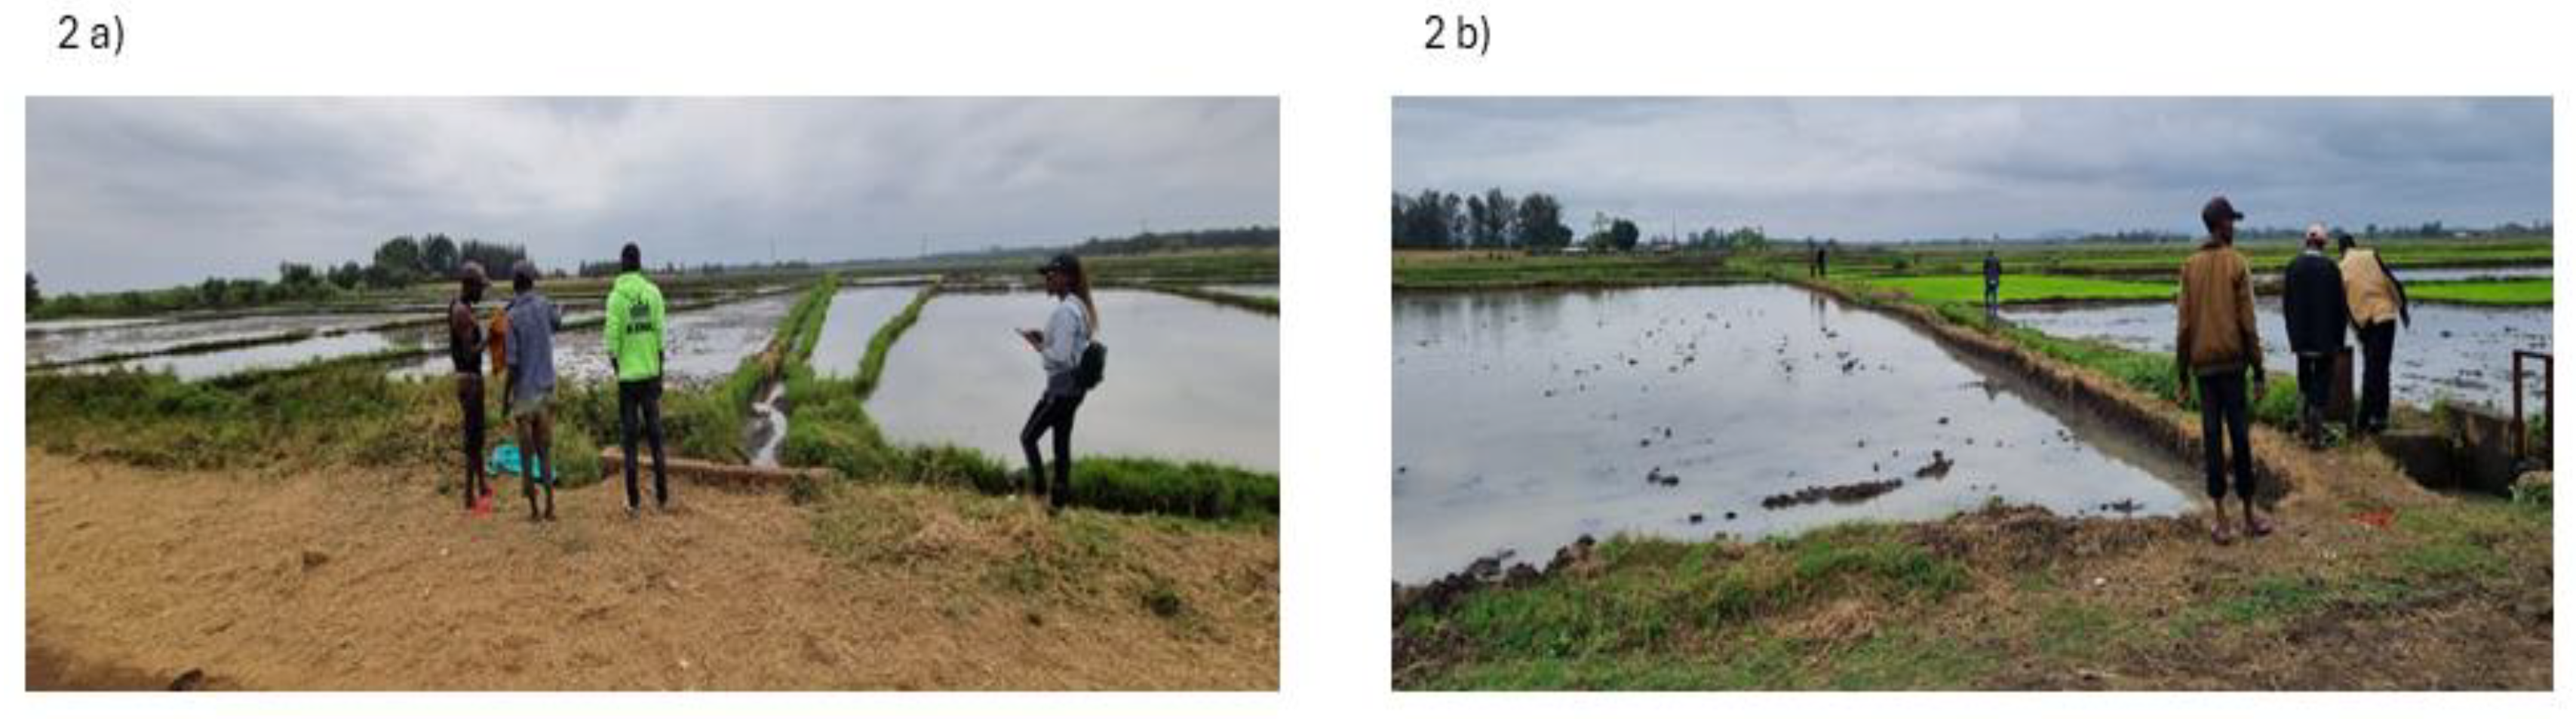
Field work began with structured mobilization and equitable distribution of enumerators across the targeted zones under the coordination of local leaders. Given the complexity of agricultural practices in areas such as Kiamanyeki, where mixed cropping is common and farm boundaries are often irregular or visually ambiguous, the presence of the farmer or their representative was essential. The enumerators physically walked each field with the farmer to trace the perimeter of the farm, using GPS to capture vertices and generate spatially referenced polygons.
Figure 2.
(a) A farmer guiding enumerators during field perimeter tracing; (b) an enumerator actively engaged in geospatial mapping via GPS-enabled tools.
Figure 2.
(a) A farmer guiding enumerators during field perimeter tracing; (b) an enumerator actively engaged in geospatial mapping via GPS-enabled tools.
Field data were collected and transmitted in real time via GPS-enabled mobile devices, facilitating both precision of geolocation and continuous monitoring of fieldwork progress (Figure 3). Upon completion of initial data capture—including farmer biodata such as full name, title number, physical description, contact telephone, and observed crop types—enumerators conducted perimeter walks of individual farms to delineate boundaries with the farmer present. The KoboCollect platform allowed for live visualization of farm boundaries, enabling the enumerator to monitor the completeness of mapping in situ. The application automatically generated spatial polygons upon closure of the boundary loop. All recorded information underwent in-field verification prior to submission to ensure consistency and accuracy. The finalized datasets were uploaded to a centralized cloud repository for secure storage and subsequent geospatial analysis.
Upon completion, the collected data were uploaded to secure cloud servers in real time, enabling remote monitoring, daily validation, and backup archiving.
4.3. Registry Index Map Integration
The official registry index maps (RIMs) for the Kiamanyeki Section were sourced from the Nyeri Lands Registry. A total of 25 cadastral sheets were scanned, georeferenced, and digitized via ArcGIS Desktop. These RIM layers were then overlaid with field-captured farm boundaries for boundary reconciliation and validation of legal titles.
Overlay analysis revealed both alignment matches and positional discrepancies due to factors such as outdated RIMs, encroachments, or overlapping claims. Where necessary, parcel boundary adjustments were applied to resolve discrepancies, ensuring conformance with cadastral accuracy standards while honouring observed field realities. This process directly improved spatial data integrity for official registry use.
4.4. Data Quality Control and Processing
Ensuring the accuracy and integrity of spatial datasets was central to developing a verifiable GIS-based farmer registry—especially within irrigation schemes where land tenure directly influences equitable resource allocation. The data quality management framework followed a structured, multistage pipeline comprising field-level validation, geodatabase organization, spatial rectification, and collaborative farmer verification forums. This integrative approach ensured that the mapped farm boundaries reflected ground realities and supported registry credibility.
Figure 4.
a) Raw farm boundary data prior to correction; (b) revised boundary after spatial rectification. This example highlights typical mapping adjustments performed during quality control. Sensitive locations and farmer-identifying information were excluded for privacy protection. The demonstrated changes reflect visual discrepancies resolved through field verification and community-based correction processes.
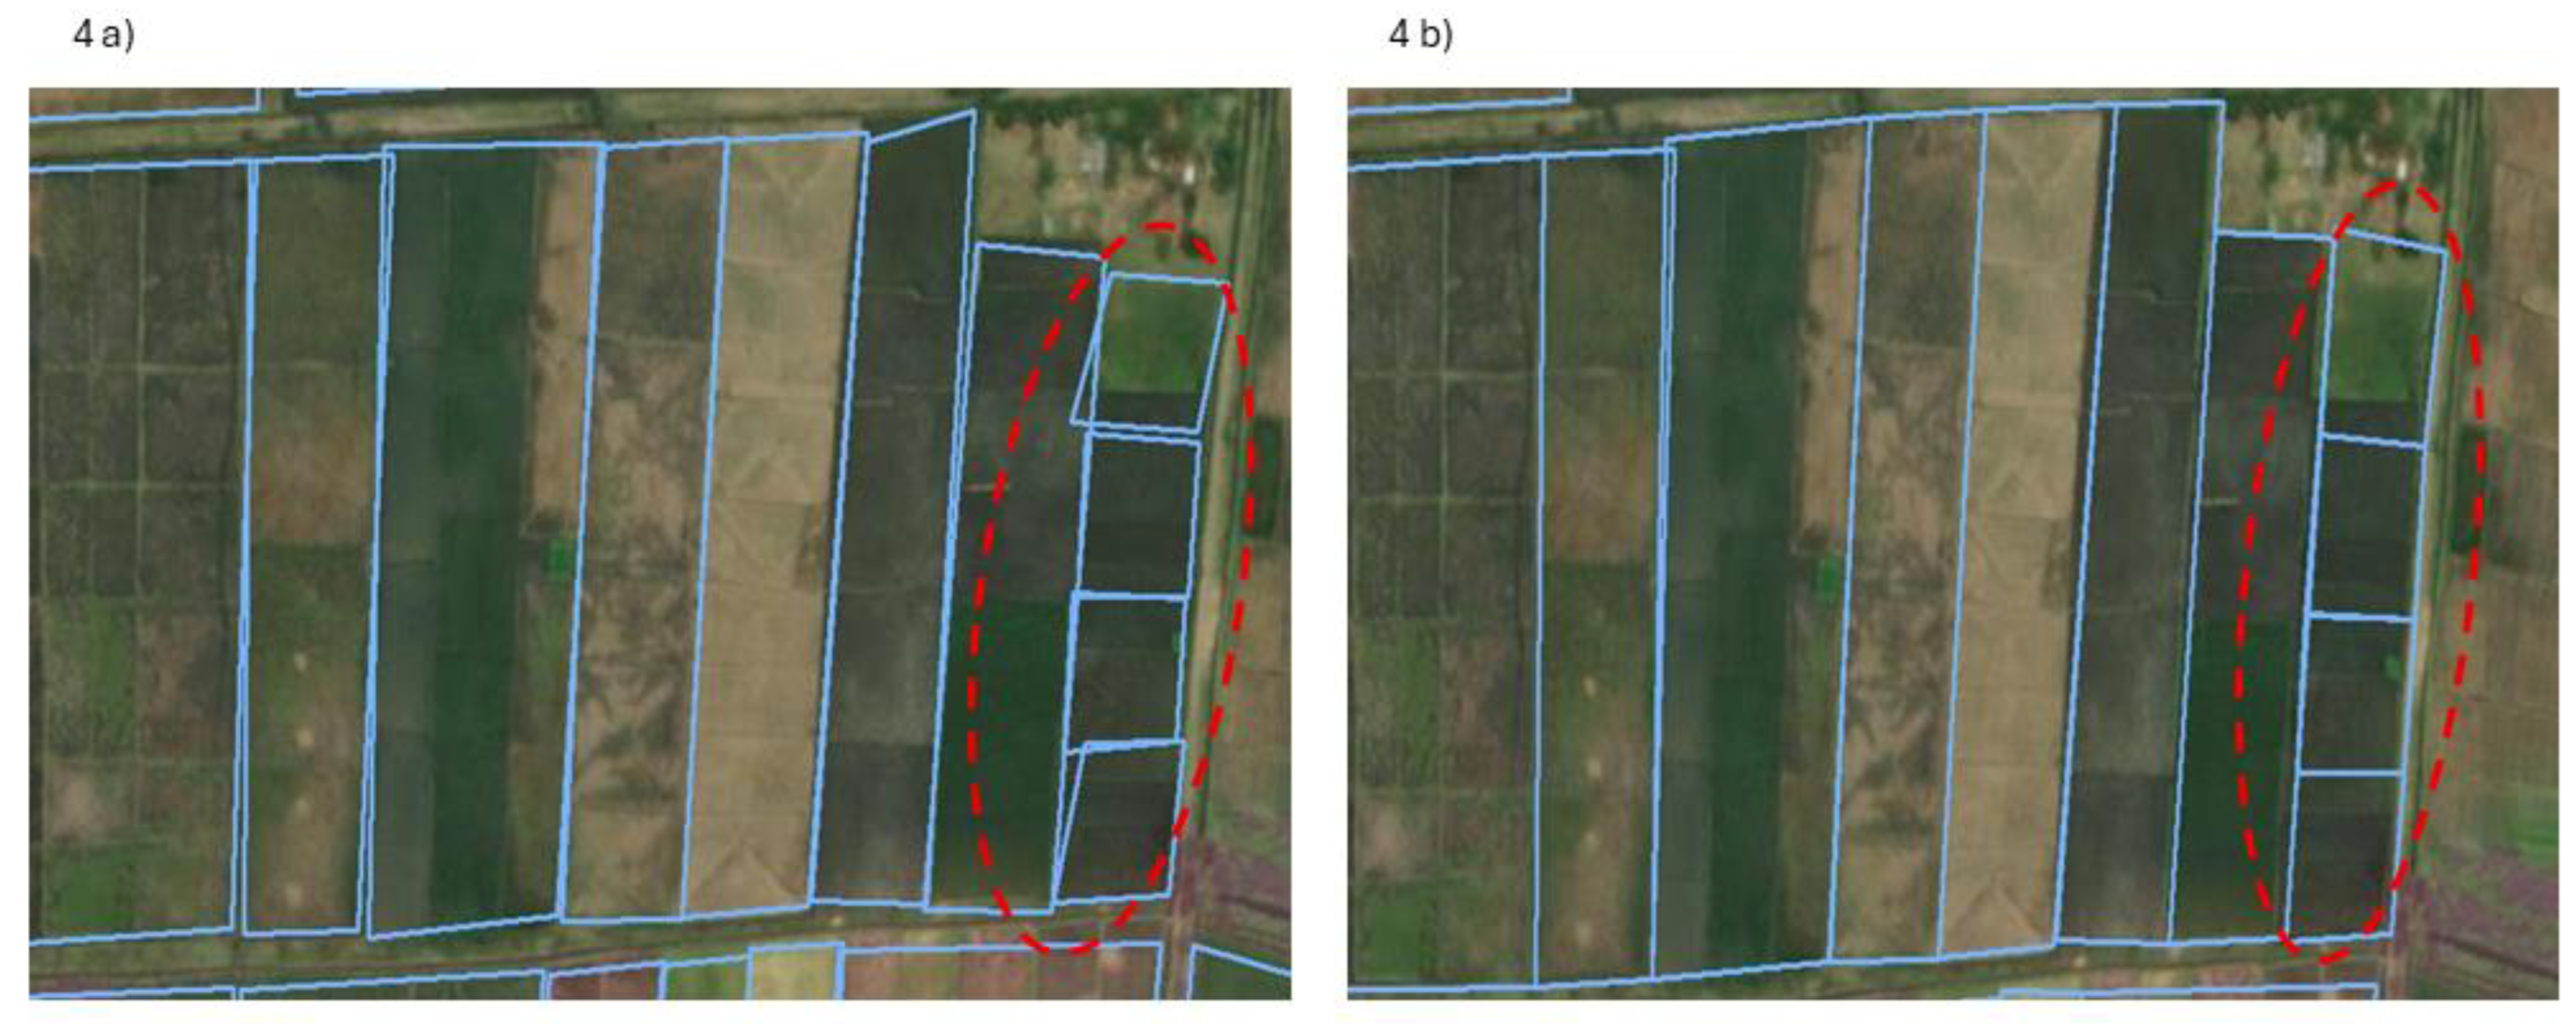
These corrections, illustrated in Figure, highlight the practical refinements made to farm boundary data during postfield validation. Building on this process, the following subsections describe the key stages of the data quality pipeline, encompassing real-time field verification, iterative spatial adjustments, and collaborative farmer forums that ensure the accuracy and legitimacy of the final registry.
4.4.1. Field Data Integrity and Verification
To mitigate errors during field data acquisition, multiple validation protocols were embedded within the KoboCollect system. These included mandatory input fields for farmer identification, standardized categorical variables to minimize entry inconsistencies, and GPS accuracy thresholds to ensure precise spatial positioning. Field mapping was conducted interactively, with farmers and enumerators navigating parcel boundaries via satellite basemaps—enhancing the alignment between the mapped geometries and ground realities.
Local units and line leaders play an active role in supporting enumerators, facilitating farmer engagement, and resolving site-level ambiguities (Figure 5). Their participation not only reinforced the credibility of the registry data but also bolstered community involvement in land tenure validation.
4.4.2. Geodatabase Design and Spatial Rectification
Data uploaded to the cloud were subjected to consultant-led review to identify anomalies. The enumerators received feedback for real-time corrections while still in the field. Each evening, daily summary maps and tabular reports were generated and reviewed jointly with unit leaders to crosscheck the completeness and correctness of the submissions. This iterative daily review enabled proactive error resolution before final dataset consolidation.
Following field data collection, spatial and attribute information was imported into the Geodatabase File within ArcGIS Desktop to enable controlled editing, secure backup, and structured data management. This geodatabase system facilitated the following:
- Correction of incomplete biodata, including missing phone numbers, national ID records, and farmer names, was performed.
- To identify spatial overlaps, farm parcel boundaries that deviated from official cadastral records were adjusted.
- The backup data are exported in multiple formats (CSV, Excel, KML, and shapefile) to ensure redundancy and accessibility.
The mapped polygons were validated against high-resolution satellite imagery and Registry Index Map (RIM) overlays. Where farm boundaries encroached upon protected zones such as irrigation canals, service roads, and drainage corridors, corrective realignments were applied to maintain operational efficiency and cadastral compliance.
4.4.3. Generation of Spatially Ordered Unique Farm Identifiers
The establishment of a comprehensive farmer nominal roll necessitated the assignment of a unique identifier to each mapped farm. To enhance data organization and facilitate spatial analysis, a numbering scheme was developed to ensure that spatially proximate farm polygons were assigned spatially ordered identifiers.
To achieve this spatial sorting, the "Sort" geoprocessing tool in Esri ArcMap was employed via a spatial sorting method. This tool leverages the geometric properties of the feature class 'Shape' field to reorder feature identification numbers (FIDs) based on their relative spatial distribution. The specific sorting algorithm utilized by ArcMap's spatial sorting tool optimizes spatial contiguity, resulting in FIDs that progressively increase or decrease as one traverses the geographic extent of the dataset.
Following the reordering of the FIDs, unique farm numbers were generated through a concatenation process. Each farm's newly assigned, spatially sorted FID was appended to a predefined irrigation section and unit codes. For example, a farm located within the Kiamanyeki irrigation section block D and assigned a reordered FID of '1' would receive the unique identifier "KID-1". This methodology ensures both the uniqueness of each farm identifier and its intuitive correlation with the farm's spatial location relative to its neighbors.
4.4.4 Farmer public verification and final registry development
Farmers and interest groups (Table 1) were invited to review individual maps and registry entries, verify their recorded land acreage, and contest any discrepancies before finalizing data processing.
This farmer-led verification was necessary to ensure accuracy, transparency, and dispute resolution. By empowering farmers to validate their records, the process reduced potential conflicts over land ownership, improved acceptance of mapped boundaries, and strengthened community confidence in the dataset.
This multilayered quality control process provided MIS with an operationally efficient registry, supporting equitable water distribution, land management optimization, and long-term sustainability in precision agriculture, as stated previously in part 4.4 above.
4.5. Expected Deliverables
4.5.1. Map and Nominal Roll Production
The processed data were used to generate high-resolution maps showing individual farm boundaries overlaid with infrastructure such as roads and canals. These maps were printed and packaged along with nominal rolls that included parcel ownership, acreage, and crop details. The results were also compiled into summary reports and PowerPoint slides for stakeholder presentations, enabling data-driven dialogue and planning.

Table 2.
Sample Table of Farmer Register Information.
| Srl | Farmer Number | Parcel Number | Farmer Name | Telephone Number | ID Number |
Ownership |
Main Crop | Other Crops | Area (Acre) |
| 1 | KID-1 | 2367/23 | David Mwangi | 07XXXXX87 | 4500000 | OWNER | Paddy Rice | 0.5 | |
| 2 | KID-2 | 2367/10 | Samuel John | 07XXXXX87 | 3400000 | BENEFICIARY | Field Crop | Maize | 2 |
Sample entries are provided for illustration purposes only; the details here, including names, do not depict actual person(s).
4.5.2. Data Infrastructure and Outputs
The mapping exercise was supported by a robust data infrastructure designed to ensure accurate, accessible, and secure handling of field information. The key outputs under this component include the following:
- Digital data collection tools
Custom-built digital forms were developed and deployed on Android-enabled tablets and smartphones via mobile data collection platforms such as ODK or KoboToolbox. These tools were tailored to capture parcel-level attributes, including farmer demographics, parcel boundaries, land use, crop types, and ownership claims. Real-time GPS integration enables accurate spatial tagging, whereas skip logic and validation rules improve the data quality during capture.
- 2.
- Registry index maps
The existing Registry Index Maps were scanned at high resolution, georeferenced using known control points, and digitized into vector formats suitable for overlay and analysis within a Geographic Information System (GIS). This process allowed the team to compare historical parcel delineations with current field observations, revealing discrepancies such as subdivisions, consolidations, and unregistered land use.
- 3.
- Cleaned and stored field data
After the raw data were collected, a rigorous cleaning process involving spatial validation (e.g., ensuring closed polygons), attribute correction, and deduplication was performed. The cleaned datasets were then stored in both shapefile and geodatabase formats to allow compatibility with various GIS platforms. Backup copies were maintained on secure cloud servers (e.g., Google Drive or AWS S3) as well as external hard drives to ensure redundancy and data integrity.
5. Results
5.1. Overall Registry Coverage
A total of 997 farmers were successfully registered through the participatory GIS mapping exercise, representing 2,397.24 acres of agricultural land across eight administrative units in the Kiamanyeki section. These units include A, B, C1, C2, C3, C4, D, and E. The exercise captured both spatial and attribute data, forming the basis for a unified farmer registry and land use database.
5.2. Mapping Exercise Output
As part of a pilot initiative to develop a replicable and innovative workflow for registry modernization, the mapping exercise combined participatory engagement, mobile-based data collection, and spatial analytics within a mixed farming environment characterized by outdated land registries and traditional tenure arrangements. The exercise captured current land use patterns to inform geospatial registry design and improve alignment between farm activity and irrigation infrastructure planning.
Six dominant land use categories were identified:
- Paddy rice
- Field crops (e.g., maize and miraa)
- Horticulture (e.g., bananas, beans, tomatoes, fruits, kale, and peppers)
- Grazing and open field areas
- Homesteads and settled zones
- Forest cover
To better understand the nature of the discrepancies observed between field-acquired spatial data and preexisting registry index maps, a coding framework was applied to categorize omitted or misaligned features. This classification clarified the extent and types of boundary inconsistencies and unmapped elements, supporting efforts to align the new geospatial registry with ground realities and legacy records. Table 3 summarizes these omission codes and their descriptions, highlighting recurring patterns such as parcel fragmentation, informal consolidation, and undocumented infrastructure.
Table 4.
Classification codes for omitted or misaligned features during registry comparison. Each code corresponds to specific cases of mismatch between field mapping outputs and registry index maps, including unrecorded homesteads, informal subdivisions, parcel consolidations, and infrastructure not captured in legacy maps.
| Omitted code | Description |
| 1 | Homesteads clustered together forming a small settlement were not mapped although on the Registry Index Maps, they appear to have ownership |
| 2 | Several cases whereby 2 to 5 farms from the field data were under one parcel on the Registry Index Map. This indicated formal or informal subdivision that had occurred, but the Registry Index Map was not updated |
| 3 | Other cases, 2 or more than 2 parcels from the Registry Index Map were under one farm as captured from the field mapping exercise. This indicated that a person could have procured several parcels, but this was not yet updated on the Registry Index Map as well |
| 4 | The field data captured new roads and canals that are not indicated on the Registry Index Map |
| 5 | Unutilized land is not reflected on the field data but can be seen on the Registry Index Maps |
Land use analysis across the irrigation scheme revealed paddy rice as the dominant cropping activity, accounting for the majority of cultivated acreage in nearly all administrative units. Units B, C1, D, and E each exceed 150 acres under rice cultivation, underscoring their central role in local agricultural practices. Units D and E also display notable diversification, with substantial areas allocated to field crops, horticultural produce, grazing, and residential settlements. In contrast, Units A through C4 have a more limited range of land uses, with a pronounced focus on rice production. These patterns, illustrated in Figure 6, reflect both agronomic preferences and infrastructural constraints shaping land utilization across the scheme.
Farmer distribution mirrors these patterns: Units D and E host the largest number of farmers and reflect the broadest spectrum of agricultural engagement, suggesting that land use diversity may correlate with farmer participation and crop specialization within the registry.
Gaps in data completeness were observed across the farmer registry, with missing identification numbers and phone contacts emerging as the most frequent deficiencies. These issues were especially pronounced in Units D and E, where more than 20% of the entries lacked critical biodata. In contrast, Units C2 and A displayed comparatively higher levels of data completeness and registry adherence. As visualized in Figure 7, these discrepancies underscore the structural and operational challenges associated with updating farmer information in larger, more diverse units. These findings point to an urgent need for strengthened registry maintenance protocols and targeted sensitization efforts to increase data integrity.
5.3. Geodatabase and Data Deliverables
The registry development process resulted in a suite of spatial and nonspatial datasets intended for long-term operational use by the National Irrigation Authority (NIA). Central among these is a fully corrected File Geodatabase, which consolidates spatial geometries alongside associated farmer attribute data. To support flexible visualization and interoperability, additional outputs include shapefiles and KML formats compatible with common GIS platforms.
For attribute management and administrative reporting, structured CSV and Excel datasets were produced, reflecting cleaned and validated registry inputs. Backup datasets have been securely archived to ensure redundancy and facilitate future updates without compromising data integrity.
Standardized thematic maps were generated to enhance interpretability and field-level utility. These include delineations of individual farm parcel boundaries, administrative unit divisions, classified land use categories, and visual representations of boundary corrections applied during the verification phase.
5.4 Map and Nominal Roll Production
The final phase of the exercise involved the production of farm parcel maps and corresponding nominal rolls. These rolls capture key details such as farm acreage, ownership, and crop types. The structure used to present this information is illustrated in the annexes.
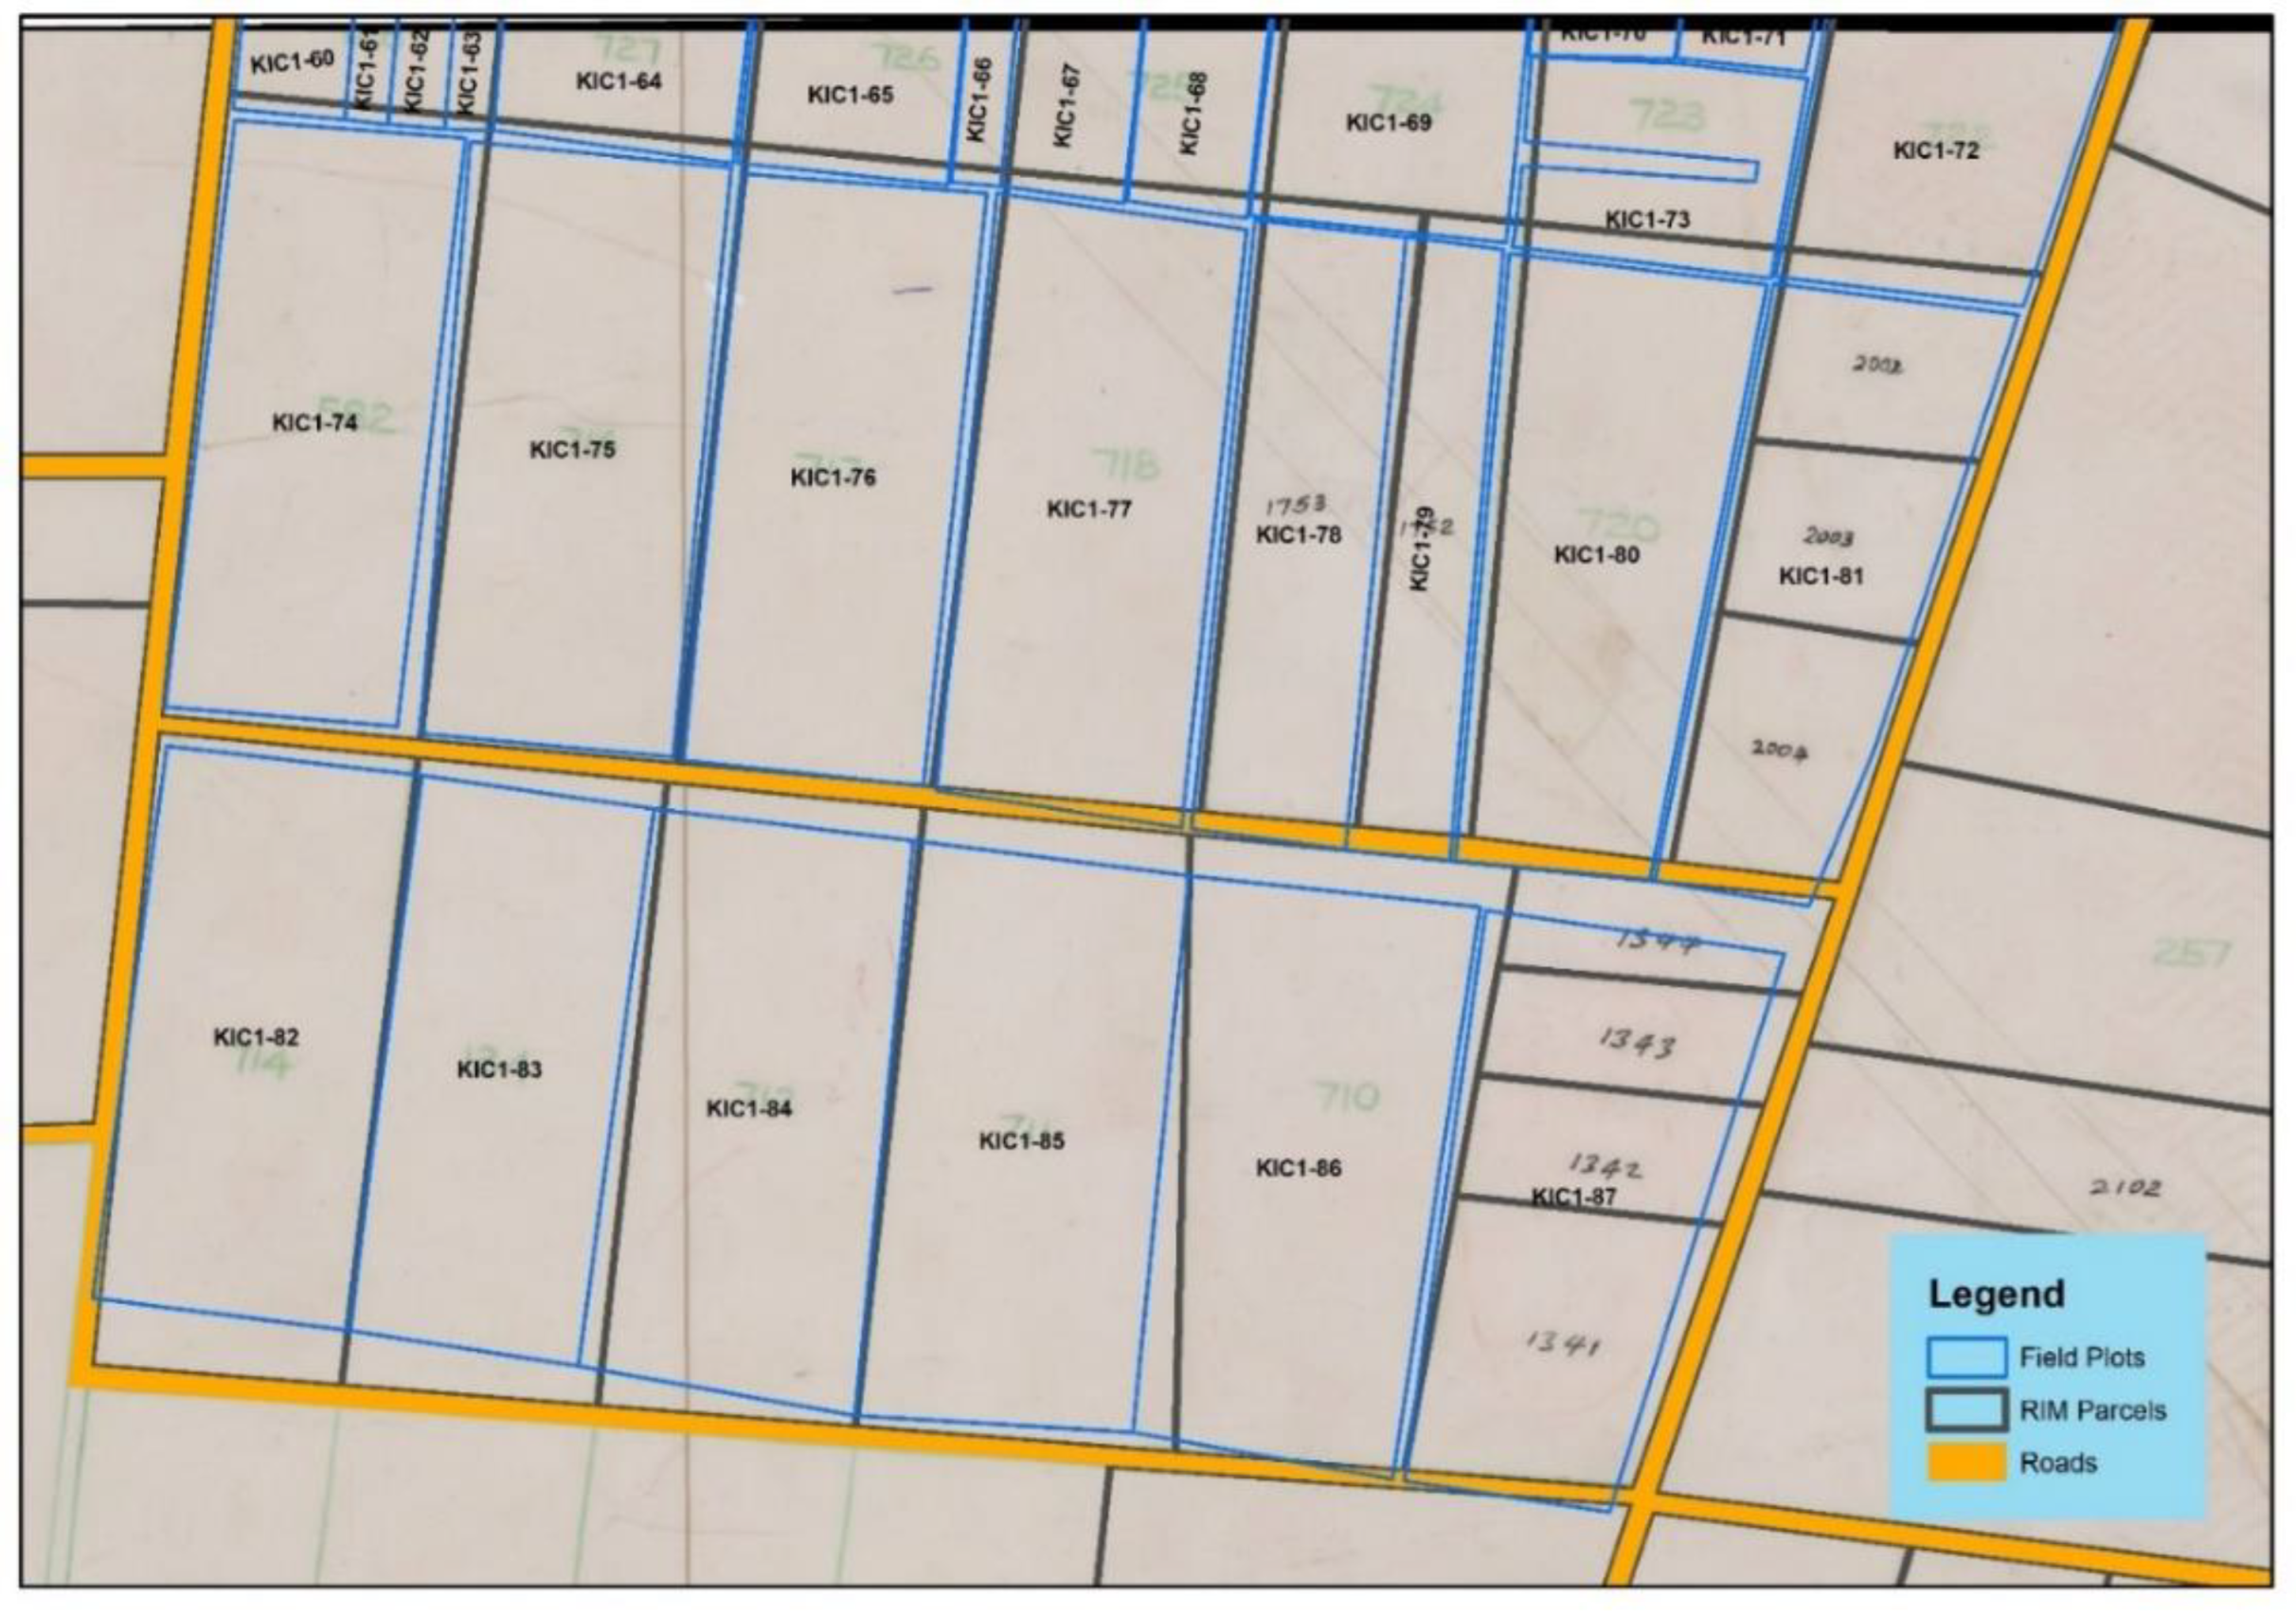
Figure 8.
RIM-based parcels overlaid with field data.
6. Discussion
The findings confirm that participatory GIS approaches can successfully generate accurate, spatially referenced landholding data critical for precision irrigation governance. The combination of mobile GIS and official RIM produces boundary-corrected farm polygons with high positional accuracy, minimizing disputes, double-counting, and irrigation allocation errors [6, 17].
Governance benefits included enhanced transparency, stronger farmer trust, and increased local ownership of registry outcomes. Participatory processes also minimize potential conflicts by allowing farmers to validate boundaries directly, which is consistent with global findings on participatory land administration [2, 21].
6.1. Accuracy Gains Through Participatory GIS and Cadastral Integration
This study confirms that participatory GIS approaches can successfully generate accurate, spatially referenced landholding data essential for precision irrigation management. By combining farmer-guided field mapping with official Registry Index Map (RIM) overlays, the process produces boundary-corrected polygons with high positional accuracy. This minimized spatial overlap, double-counting, and irrigation allocation conflicts that often undermine administrative registries in smallholder irrigation systems [6, 17].
The systematic integration of geodatabase management allowed iterative corrections of both spatial and nonspatial data—updating farmer names, contact details, and resolving parcel subdivisions or amalgamations. The spatial validation process using ArcGIS Desktop and high-resolution imagery further ensured boundary accuracy while protecting public irrigation infrastructure from encroachment. As illustrated in Fig. 4 (boundary correction examples) and Fig. 8 (RIM overlay), these spatial adjustments were critical for producing operationally reliable irrigation service maps. The stepwise data processing and verification protocol is summarized in Table 1 (workflow table).
6.2. Farmer Participation, Governance Credibility, and Institutional Alignment
In addition to providing technical gains, the participatory approach provides significant governance benefits. Active farmer involvement in boundary demarcation and public verification meetings fostered ownership, transparency, and trust in the registry outcomes. These participatory processes help reduce potential boundary disputes by directly involving stakeholders in data validation, which is consistent with global experiences in participatory land administration [2, 21].
However, some institutional and social challenges persist. Incomplete farmer records due to the absence of landowners, reluctance to disclose personal identification, or fear of administrative consequences highlight deeper concerns over data privacy and land tenure insecurity [1, 8]. If not addressed through deliberate policy interventions, these gaps risk undermining the long-term integrity and credibility of registry systems. The patterns of incomplete data identified emphasize the importance of continuous farmer sensitization and robust legal data protection frameworks.
6.3. Land Use Diversity and Implications
The registry also revealed considerable heterogeneity in land use across the Kiamanyeki section. In addition to rice, which is the dominant crop, farmers cultivate horticultural crops, maize, grazing fields, and homestead areas. This land use diversity introduces important complexities for irrigation scheduling, as different crops present varying water needs and seasonal demands [2, 11].
Spatially disaggregated land use data, now captured through this registry, enable more adaptive and efficient irrigation management models capable of responding to shifting climate and production patterns. As shown by the land use classification presented, capturing this heterogeneity is essential for designing precision irrigation strategies that balance water demand, crop productivity, and long-term system resilience [19, 20].
6.4. Policy Relevance, Scalability, and Future Innovation Pathways
The implementation of a participatory GIS-based farmer registry within the Kiamanyeki irrigation scheme provides actionable insights for national efforts under Kenya’s Vision 2030 irrigation expansion. By blending field-level farmer engagement with mobile GIS technology and the integration of official cadastral records, the registry demonstrates a scalable and adaptable approach for modernizing land administration in other emerging schemes [7, 9].
To sustain these outcomes, institutional frameworks need to support timely registry updates, promote coordination across agencies, and provide legal safeguards for farmer data. The architecture of the system is well positioned to accommodate future innovations, including remote sensing for boundary verification, artificial intelligence for land use classification, and blockchain-based solutions that strengthen data security and transparency, such as those recommended by [20].
While these technologies offer significant potential, their effectiveness depends on alignment with inclusive processes that emphasize farmer trust, leadership involvement at the local level, and transparent governance structures. The experience in Kiamanyeki illustrates the importance of community ownership and participatory validation in ensuring both technical reliability and social legitimacy. This model presents a viable blueprint for equitable and responsive land registry development in similar contexts.
7. Conclusions and Recommendations
This study demonstrates that participatory GIS approaches, when combined with mobile data collection and official cadastral overlays, offer a practical, accurate, and farmer-endorsed pathway for modernizing irrigation registries in Kenya. In the Kiamanyeki section of Mwea, this process successfully captured 997 farmers managing nearly 2,400 acres, producing boundary-corrected spatial data that directly support precision irrigation scheduling, equitable resource allocation, and financial accountability.
The participatory nature of the mapping process fostered trust and minimized boundary disputes, whereas diverse land use classifications generated new opportunities for climate-resilient, crop-specific irrigation planning. Nonetheless, unresolved data gaps, social disclosure barriers, and encroachments underscore the ongoing need for institutional reforms, inclusive governance, and strengthened data protection frameworks.
For wider replication, policy frameworks must embed periodic registry updates, sustained farmer sensitization, and multiagency coordination across irrigation, land, and administrative authorities. Emerging technologies, such as drones, AI-based land classification, and blockchain registries, offer additional opportunities but must remain grounded in locally appropriate governance models and farmer participation.
Ultimately, robust farmer registries are not merely technical datasets but foundational governance tools that underpin equitable, transparent, and climate-adaptive irrigation management in sub-Saharan Africa.
Author Contributions
IK: Methodology, Investigation, Data curation, Conceptualization, Manuscript writing and editing. IK: Methodology, Investigation, Data curation, Conceptualization. SO: Methodology, Investigation, Data curation, Conceptualization. IA: Methodology, Investigation, Data curation, Conceptualization.
Funding
This research received no external funding.
Data Availability Statement
No new data were created or analyzed in this study. Data sharing is not applicable to this article.
Acknowledgments
The authors gratefully acknowledge the National Irrigation Authority (NIA) for granting access to their irrigation scheme, which was instrumental to the success of this work.
Conflicts of Interest
The authors declare no conflicts of interest.
Abbreviations
The following abbreviations are used in this manuscript:
| NIA | National Irrigation Authority |
| MIS | The Mwea Irrigation Scheme |
| PGIS | Participatory geographic information system |
| ODK | Open Data Kit |
References
- Ameyaw, P. D., & de Vries, W. T. Blockchain technology adaptation for land administration services: The importance of sociocultural elements. Land Use Policy 2023, 125, 106485.
- Bennett, R., Rajabifard, A., Williamson, I., & Wallace, J. On the need for national land administration infrastructures. Land Use Policy 2012, 29, 208–219. [CrossRef]
- Chambers, R. (2006). Participatory Mapping and Geographic Information Systems: Whose Map? Who is Empowered and Who Disempowered? Electronic Journal of Information Systems in Developing Countries, 25, 1-11.
- Danda, D. H., & Wema, E. F. Utilisation of ICT in the management of land administration information in Tanzania. Alexandria 2024, 34, 46–70.
- Davies, J., Blekking, J., Hannah, C., Zimmer, A., Joshi, N., Anderson, P., ... & Evans, T. Governance of traditional markets and rural-urban food systems in sub-Saharan Africa. Habitat international 2022, 127, 102620.
- Deininger, K. , Augustinus, C., Enemark, S., & Munro-Faure, P. (Eds.). (2010). Innovations in land rights recognition, administration, and governance. World Bank Publications.
- Diop, M. (2013). Securing Africa’s Land for Shared Prosperity. World Bank, July, 22.
- Enemark, S. , Bell, K. C., Lemmen, C., & McLaren, R. (2014). Fit-for-purpose land administration. International Federation of Surveyors (FIG).
- Enemark, S., McLaren, R., & Lemmen, C. H. J. (2016). Fit-for-purpose land administration: Guiding principles for country implementation. United Nations Human Settlements Programme (UN-HABITAT). https://www.fig.net/resources/publications/GLTN/index.asp.
- FAO. (2020). Water Scarcity in Agriculture: Approaches and Adaptation Strategies. FAO Water Reports. https://www.fao.org/family-farming/detail/en/c/432861/.
- Howell, T. A. Enhancing water use efficiency in irrigated agriculture. Agronomy Journal, 2001, 93, 281–289. [Google Scholar] [CrossRef]
- Kendall, H. , Clark, B., Li, W., Jin, S., Jones, G. D., Chen, J.,... & Frewer, L. J. (2022). Precision agriculture technology adoption: A qualitative study of small-scale commercial “family farms” located in the North China Plain. Precision Agriculture, 1-33.
- McCartney, M. , & Smakhtin, V. (2010). Water storage in an era of climate change: Addressing the challenge of increasing rainfall variability. Blue paper. IWMI Reports.
- Meinzen-Dick, R. Beyond panaceas in water institutions. PNAS 2007, 104, 15200–15205. [Google Scholar] [CrossRef] [PubMed]
- Mulla, D. J. Twenty-five years of remote sensing in precision agriculture: Key advances and remaining knowledge gaps. Biosystems Engineering 2013, 114, 358–371. [Google Scholar] [CrossRef]
- National Irrigation Authority. (2023). Annual report 2022/2023. https://www.treasury.go.ke/wp-content/uploads/2024/10/National-Irrigation-Authority-2022_2023.pdf.
- Siriba, D. N., & Dalyot, S. Adoption of volunteered geographic information into the formal land administration system in Kenya. Land Use Policy 2017, 63, 279–287.
- Sjaastad, E., & Cousins, B. Formalization of land rights in the South: An overview. Land Use Policy 2008, 26, 1–9.
- Woodhouse, P., & Muller, M. Water governance—An historical perspective on current debates. World development 2017, 92, 225–241.
- Ye, Z., Yin, S., Cao, Y., & Wang, Y. AI-driven optimization of agricultural water management for enhanced sustainability. Scientific Reports 2024, 14, 25721.
- Zevenbergen, J. , et al. (2013). Transparency in land administration. In: Land Governance in the 21st Century.
Figure 3.
KoboCollect interface displaying sample geospatial mapping. Sensitive farm details were excluded for privacy; actual data collection included live farm boundary visualization and farmer-specific attributes such as title number, full name, contact information, and crop types.
Figure 3.
KoboCollect interface displaying sample geospatial mapping. Sensitive farm details were excluded for privacy; actual data collection included live farm boundary visualization and farmer-specific attributes such as title number, full name, contact information, and crop types.
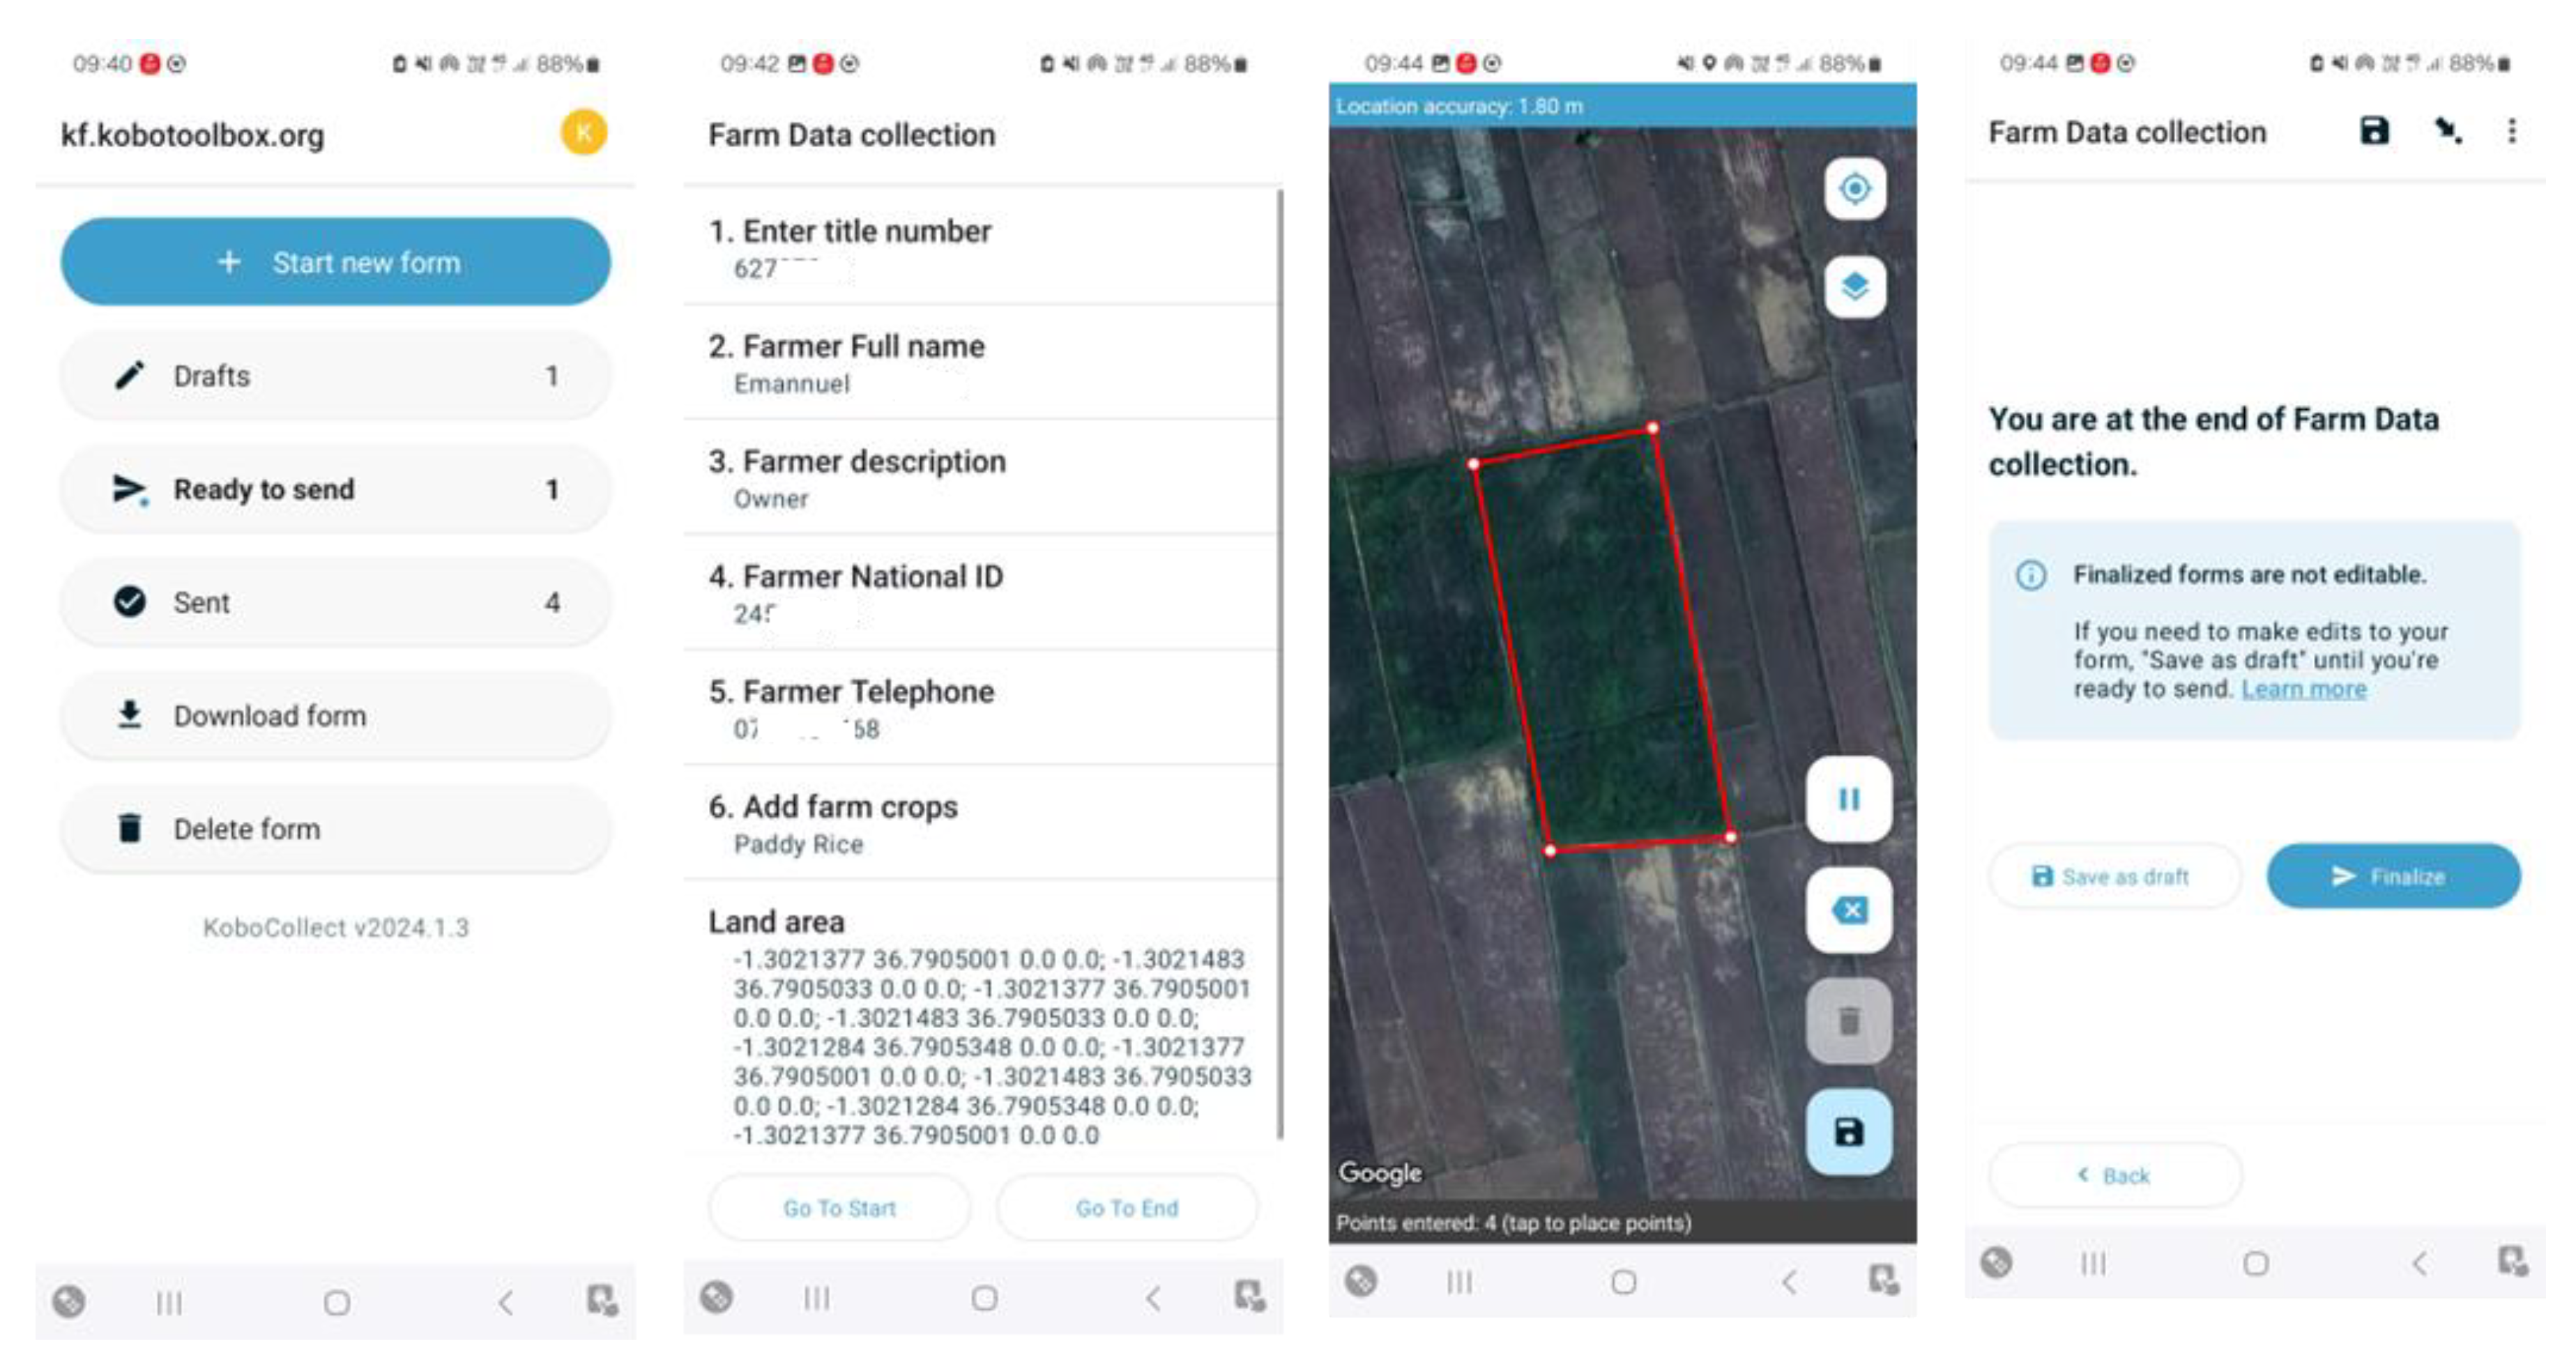
Figure 5.
a) Field-based biodata update conducted by unit and line leaders; (b) live map interface illustrating the biodata capture process. For confidentiality, farmer-identifying information was excluded. The actual data collection included inputs such as the full name, title number, physical description, contact telephone, and associated crop details—each mapped to spatial parcels through the KoboCollect platform.
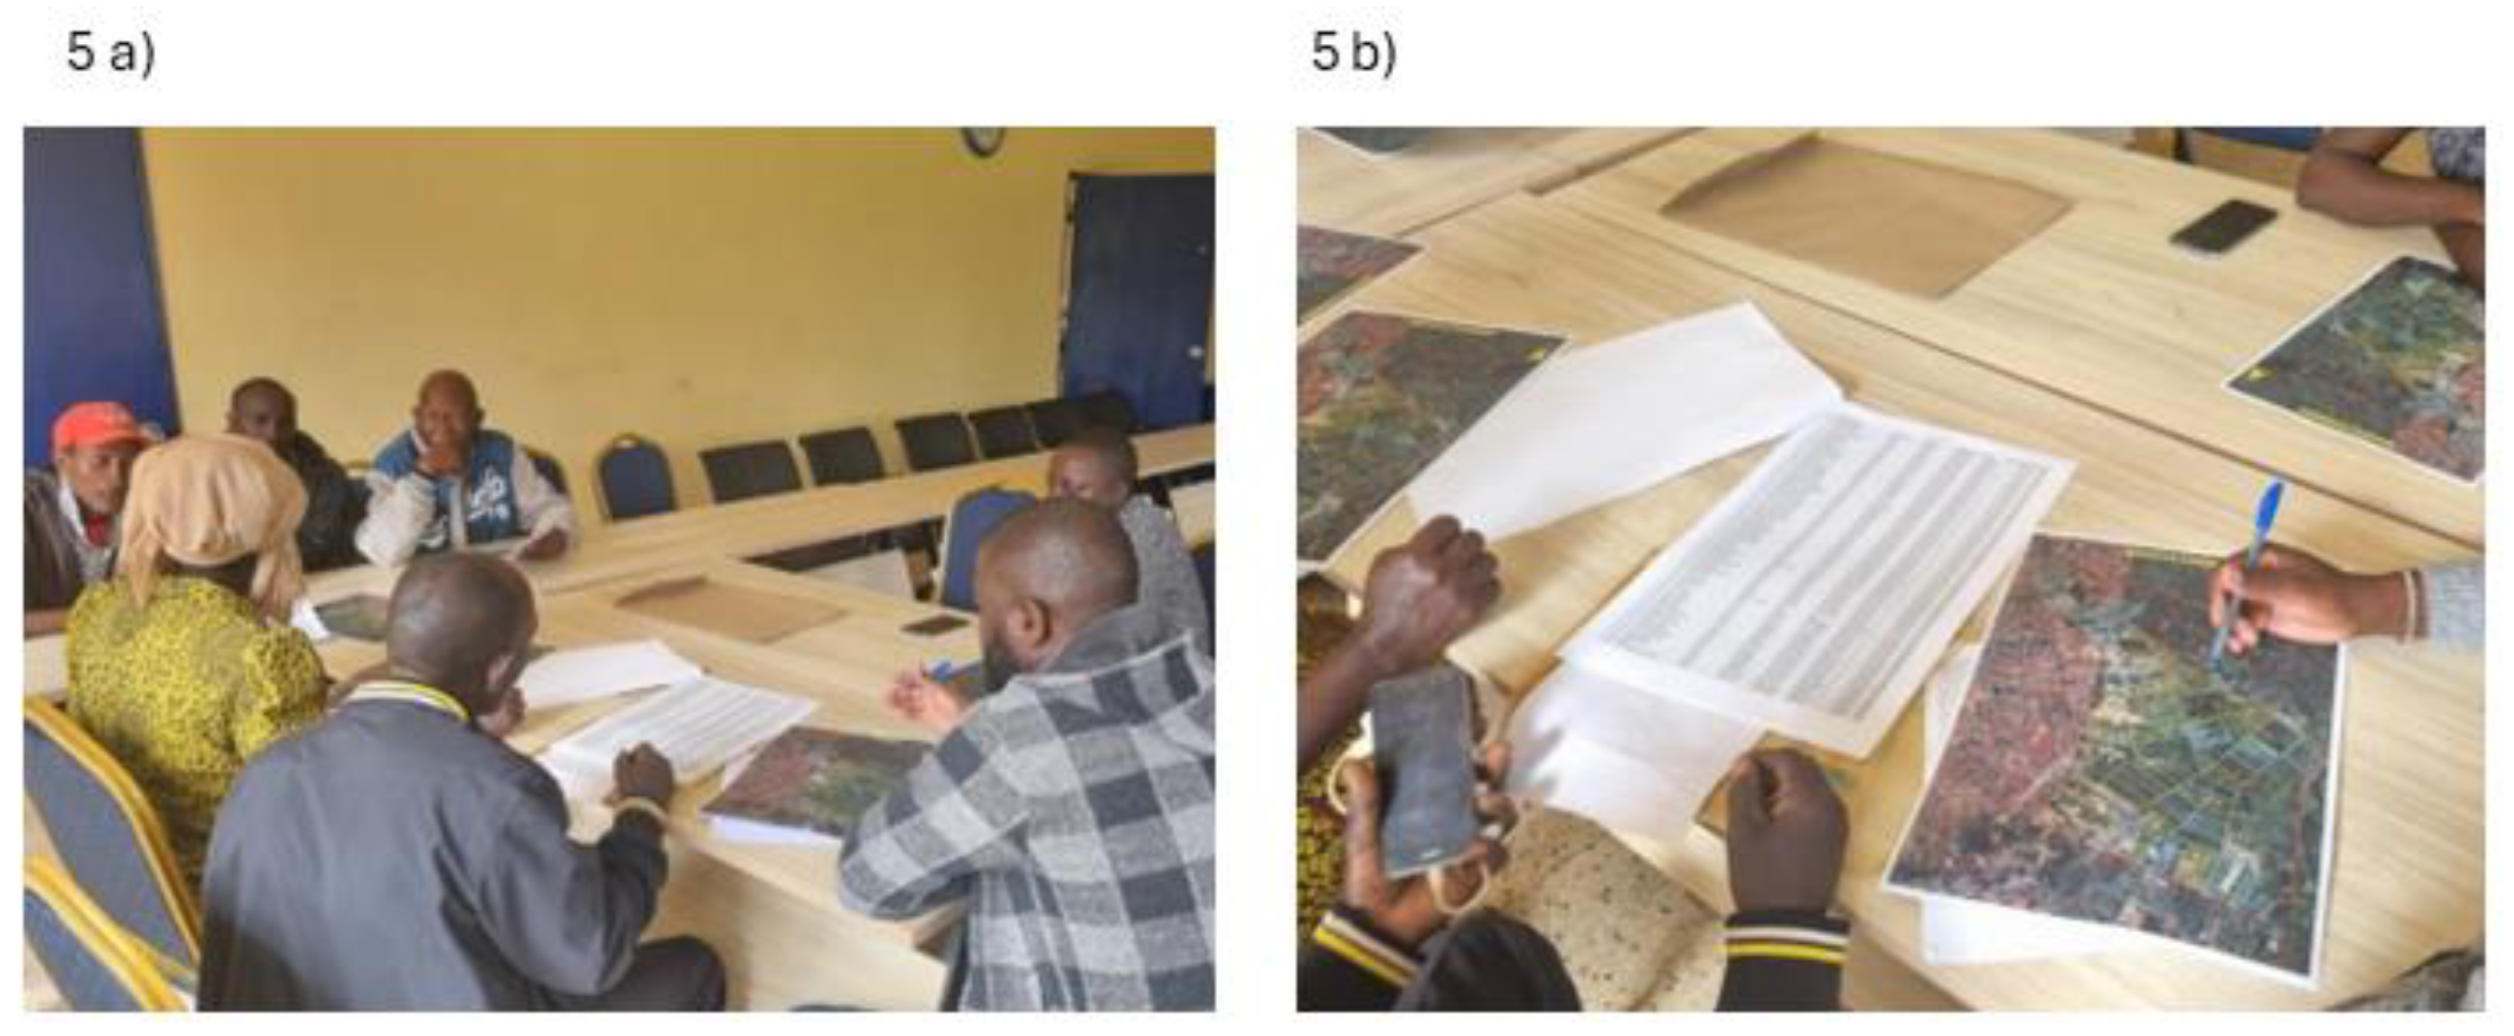
Figure 6.
(a) Land use distribution by acreage across irrigation units; (b) corresponding farmer distribution per unit. Paddy rice dominated the cultivated landscape, particularly in Units B, C1, D, and E. Units D and E presented diverse land use profiles—including field crops, horticulture, grazing areas, and homesteads—with corresponding variations in farmer engagement. The data presented are anonymized and aggregated for analytical purposes.
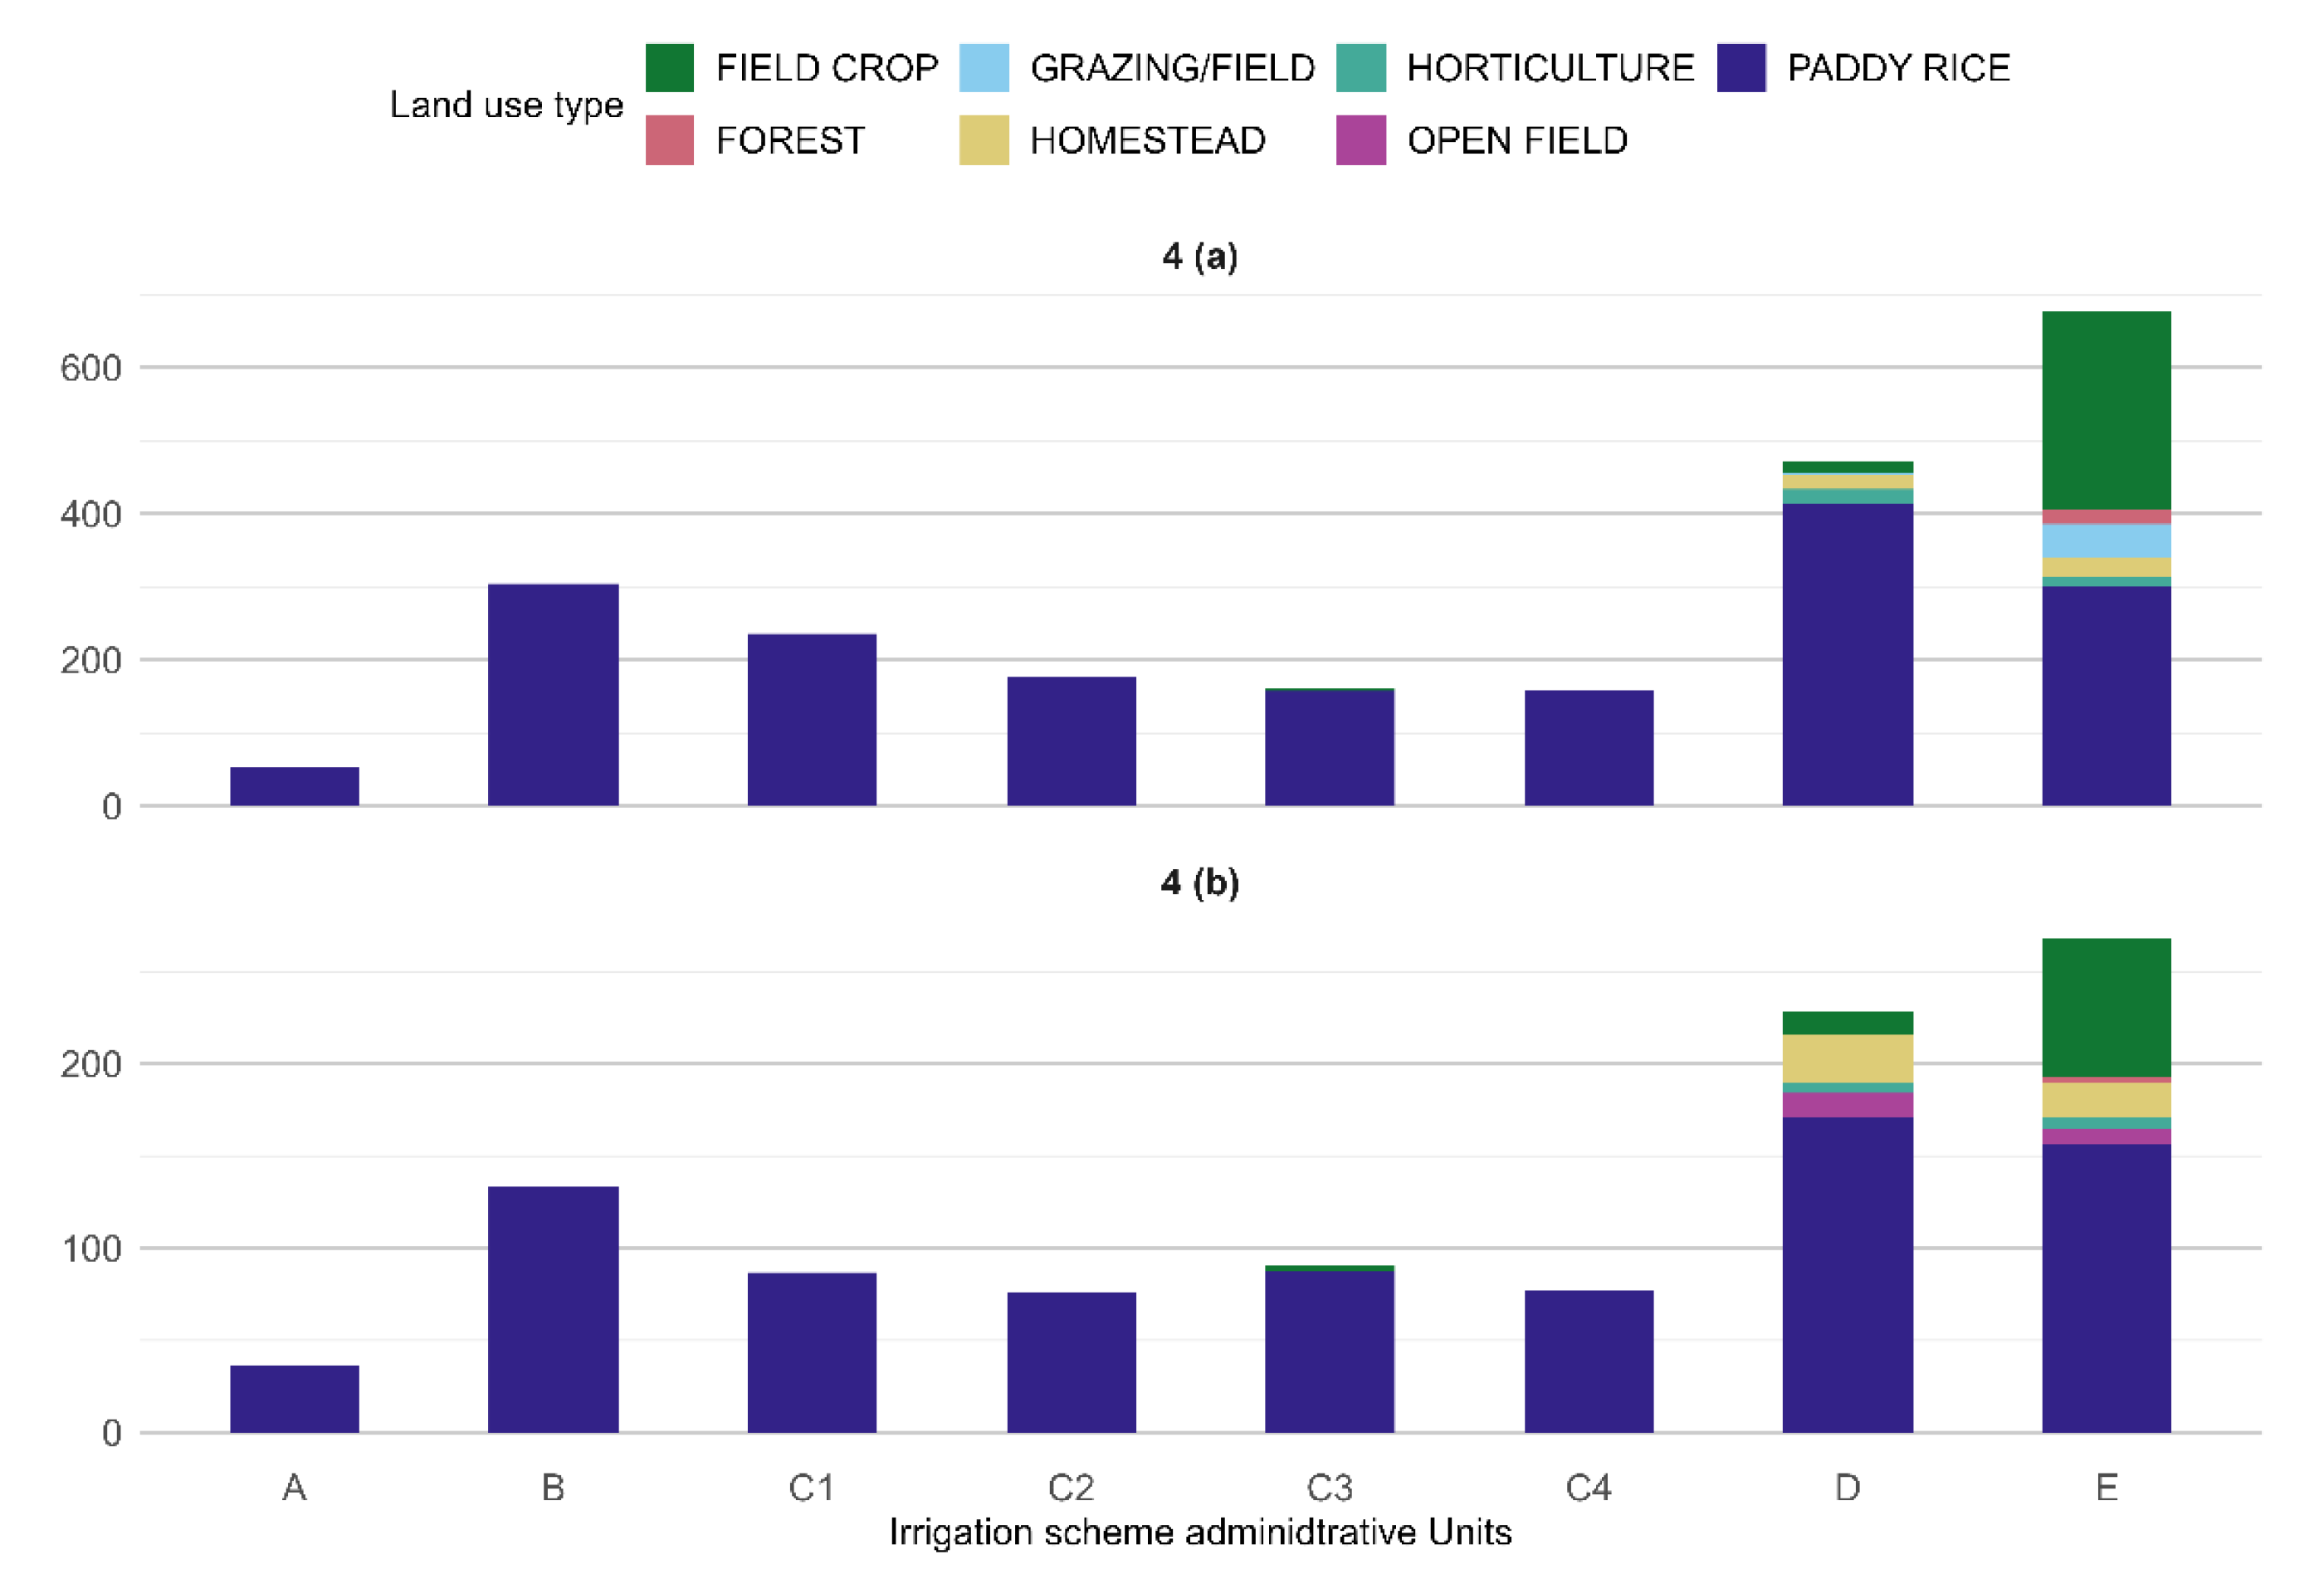
Figure 7.
Registry data completeness across irrigation units. The chart highlights the frequency of missing identification numbers and phone contacts, particularly in Units D and E, where more than 20% of farmer entries lacked key biodata. Units C2 and A presented relatively high data integrity. These patterns point to operational gaps in registry updating and emphasize the need for improved farmer outreach and sensitization strategies.
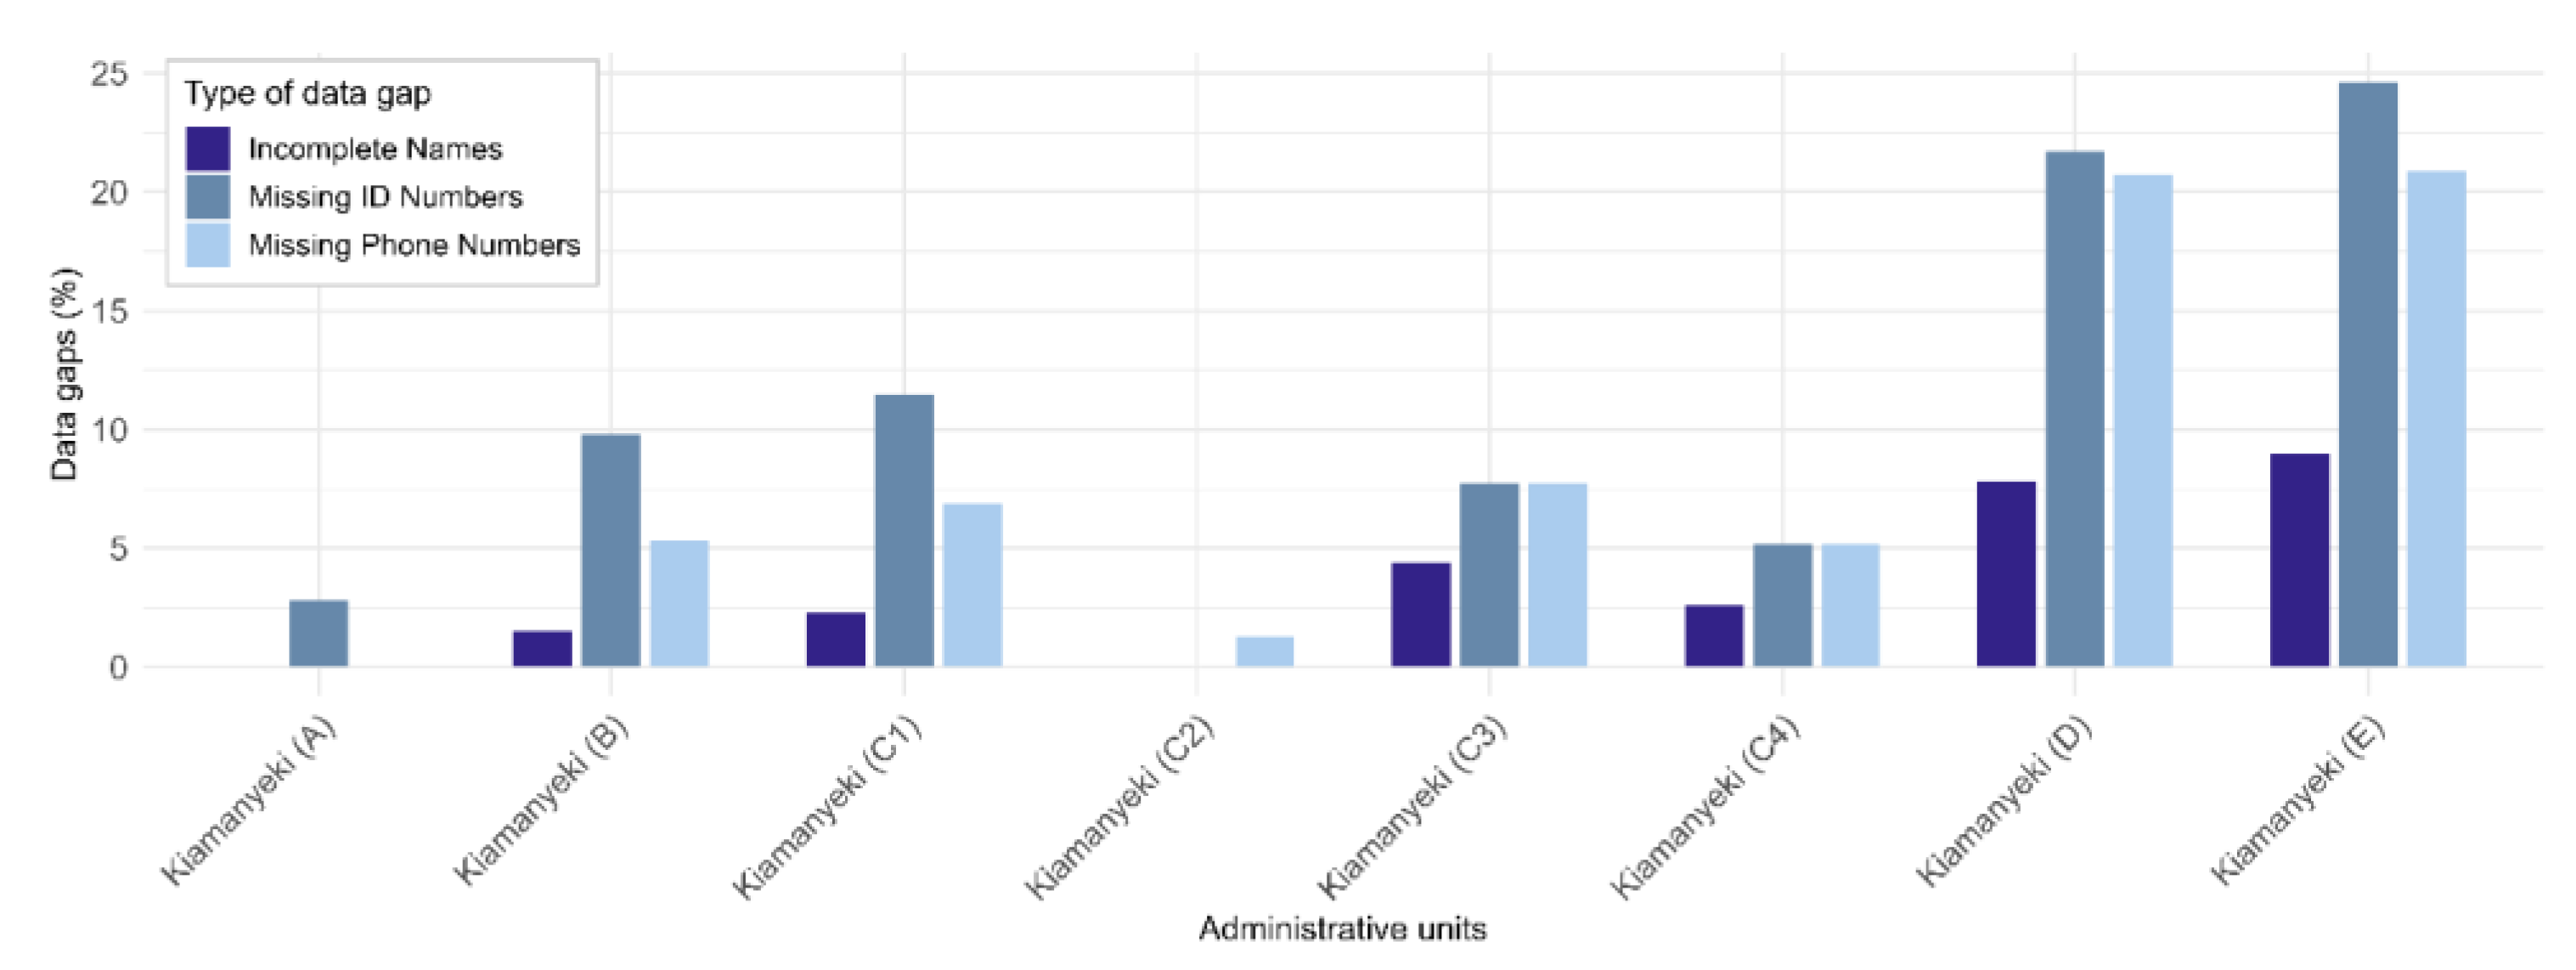
Table 1.
Data processing workflow for participatory GIS-based farmer registry development in the Kiamanyeki section of the Mwea Irrigation Scheme. The workflow integrates field data collection, verification, geodatabase design, spatial validation, and farmer community authentication.
Table 1.
Data processing workflow for participatory GIS-based farmer registry development in the Kiamanyeki section of the Mwea Irrigation Scheme. The workflow integrates field data collection, verification, geodatabase design, spatial validation, and farmer community authentication.
| Phase | Activity | Key Tools | Responsible Actor |
| 1. Pre-Field Preparation | Enumerator training, KoboCollect configuration, form constraints design | KoboCollect, satellite basemaps | Consultant, Enumerators |
| 2. Field Data Collection | GPS boundary tracing, farmer attribute capture, absentee liaisons | KoboCollect tablets, GPS | Enumerators, Local Leaders |
| 3. Real-Time Verification | Live data checks, immediate correction requests | Cloud submission monitoring | Consultant |
| 4. Daily Desktop Verification | Map and tabular cross-checks, feedback to field team | ArcGIS, printed outputs | Consultant, Unit Leaders |
| 5. Geodatabase Design and Compilation | Schema design, data import, backups | ArcGIS File Geodatabase | GIS Analyst |
| 6. Data Editing & Cleaning | Correction of IDs, phone numbers, parcel adjustments | ArcGIS Desktop | GIS Analyst |
| 7. Spatial Validation | Overlay with RIMs, imagery correction, boundary rectification | ArcGIS Desktop, RIM maps | GIS Analyst, Consultant |
| 8. Public Farmer Verification | Community meetings, registry finalization | Printed maps, tabular summaries | Administrative Leaders, Farmers |
Disclaimer/Publisher’s Note: The statements, opinions and data contained in all publications are solely those of the individual author(s) and contributor(s) and not of MDPI and/or the editor(s). MDPI and/or the editor(s) disclaim responsibility for any injury to people or property resulting from any ideas, methods, instructions or products referred to in the content. |
© 2025 by the authors. Licensee MDPI, Basel, Switzerland. This article is an open access article distributed under the terms and conditions of the Creative Commons Attribution (CC BY) license (http://creativecommons.org/licenses/by/4.0/).
Copyright: This open access article is published under a Creative Commons CC BY 4.0 license, which permit the free download, distribution, and reuse, provided that the author and preprint are cited in any reuse.


