

Submitted:
27 August 2024
Posted:
28 August 2024
You are already at the latest version
Abstract
Dispatching goods is becoming more difficult to manage in the field of logistics due to the high demand for order shipments. This is relative to the increasing popularity of the use of e-commerce platforms among consumers, where delivery of products is required as compared to buying in physical stores. Dispatch management is one of the critical components in a supply chain since it covers the coordination tasks among stakeholders from warehouse up to the consumer’s doorstep. In this study, the authors intend to propose a framework leveraging geographic information to sustain the logistics operations, specifically in terms of managing last-mile delivery and return trip orders. This includes scheduling, communications, and inventory of goods shipment. A mobile application built on this framework was integrated with a waypoint order optimization algorithm considering the entire route traversing all the required pick-up and delivery points. It was pilot tested with an actual dispatch operation of a logistics company yielding a decrease of 87% in total shipment time, 79% in operations cost, and 3% in carbon footprint per vehicle. With the adoption of this framework, the study aims to contribute to the overall efficiency and sustainability of logistics operations in a wider geographic range.
Keywords:
carbon footprint
; environment
; geographic information
; last-mile delivery
; logistics
; return trip scheduling
; route optimization
; sustainability
1. Introduction
In today’s generation, consumers have grown more dependent on the use of e-commerce given the convenience it offers in purchase and delivery of goods [1,2]. Consequently, the demand for logistics has exponentially increased since e-commerce businesses heavily rely on this industry [3]. The companies running e-commerce services opt to avail 3rd party logistics service instead of buying their own delivery vehicles and managing their order shipments. Third-party logistics or 3PL is a type of logistics service that specializes in moving goods from source to destination points [4]. Its services commonly include freight forwarding, cargo delivery services, and point-to-point delivery [5]. Sourcing out this service allows e-commerce businesses to focus more on improving its core operations.
The process of bringing the product to the customer, technically known as last-mile delivery, garnered a lot of attention recently because of its pivotal role in customer satisfaction, environmental condition, and cost-effective operation [6,7]. It is composed of several steps as follows: (1) storing of order information to the digitalized central system, (2) physical arrival of orders at the logistics company, (3) assignment of order to a delivery personnel, (4) update of order status, and (5) closing of orders for successful end to end transaction [8]. A return trip occurs as an additional step when the product delivered is wrong or defective. Return trips are the transfer of products or assets from the vehicle’s destination back to its origin or to another specified point [9,10]. Although it appears to be a simple step in the logistics process, return trips can bring challenges and opportunities that may leave a signification impact both on the business’ cost savings and on the environment. Coordination among the stakeholders throughout the process is crucial and among the difficult tasks of a dispatcher are scheduling and fleet tracking [11,12]. Inefficiency in handling these tasks contributes to operational overhead cost and to environmental carbon footprint [13].
According to a study, 25% of the total CO2 emission in an urban city is generated from the logistics network. This is because of the urban deliveries made from smaller trucks catering individual households as compared to the traditional bulk and long distance deliveries [14,15]. The more frequent stops and idle time on the road of vehicles, the higher fuel consumption is, and the higher greenhouse gas contribution. This scenario is evident in last-mile deliveries or the final leg of shipment [16,17,18]. Other contributing factors to increased carbon footprint are the vehicle type, traffic characteristics, fuel type, and the fleet behavior [19]. There is a need to structure the fleet dispatch and the space usage at a single time of delivery to lower the contribution of the logistics operations in the pollution [20,21]. Through the use of IoT, the coordination between customers and drivers were made more real-time in a study [22]. Another research focused on managing received requests to make dispatch assignments more economical on the end of the pick-up vehicle [23,24]. In terms of routing optimizations, several search heuristics [25,26,27] were proposed not only in the transportation sector but also in supply distribution [28,29] and of fields which requires redirection of entity [30,31,32], in general. Dijkstra’s method is one of the most classic yet stable search algorithms which serves as the primary backbone in route finding algorithms of Google Maps as well. It aims to find the shortest path from one point to another by visiting all the adjacent vertices and calculating the path cost at the same time [33]. The path cost may vary depending on the required metric. Most commonly, either distance or time cost metrics [34].
The study aims to address the pressing economic and environmental needs and challenges within the logistics industry through a geographic information [35] system-based framework. With this framework, a dispatch management application was developed and integrated with an optimization algorithm for last-mile delivery and return trip sequence recommendation to aid the dispatcher in handling the workload [36,37] more efficiently. Concurrently, the researchers promote green logistics with the reduction of carbon emission from courier activities on the road while maximizing the logistics resources at hand [38]. The achievement of these objectives was evident with the resulting metrics explained in the chapter 3 of the paper.
2. Materials and Methods
A logistics company was interviewed to validate the pain points identified in the previous chapter in the context of dispatch management and to get insights about the proposed framework to be discussed further in section 2.2. A dispatch management software application was then developed using Android Studio as an Integrated Development Environment (IDE), Flutter as the UI Software Development Kit (SDK), Dart as the primary programming language, and powered by Google APIs such as Maps, Places, Directions, and Firebase Cloud Messaging. The final prototype was tested, and its performance results were compared with the traditional approach of the identified logistics company in dispatch management. Shown in Figure 1 is the visualization of each user role in the software application.
2.1. Current Method Used by the Partner Logistics Company
The traditional return trip and last-mile delivery transactions of most logistics companies like 5RJS Lanuza Logistics Corp. are made through calls, Short Message Service (SMS), and/or emails from customers. First, the customer directly contacts a 3PL via phone to schedule a delivery of their goods. The dispatcher from the 3PL then schedules a vehicle and driver to send off the product/s by batch to the respective end customer’s location. After successful delivery of all the assigned orders, the vehicle usually returns to its origin point with empty or unused space. In the case of return trips, the customer contacts the dispatcher again, requesting a new schedule for the transportation of goods from the destination back to the sending vehicle’s origin. The current method has its limitations and challenges in establishing effective communication, coordination, and scheduling resulting to inefficiencies and missed opportunities especially in terms of optimizing delivery routes and use of carrier space. Additionally, transactions made via phone calls, SMS and emails are difficult to track, posing further issues in managing logistics processes.
The old framework shown in Figure 2 yields higher turnaround time and lower concurrent order processing. Using phone calls limits single customer transaction at a time usually ranging few minutes to an hour duration, depending on the concern of the customer. The existing setup of the corporation is as follows:
For the customer, the only way to get a delivery order is to inquire to the company through phone calls or SMS. High call waiting time is a common problem when there are simultaneous requests from multiple customers. If an inbound call gets through, a CSR is assigned to interact and maintain a good relationship with the customers. They answer customer concerns, relay messages to and from the management, provide service information, and monitor the capacity of trucks to handle a given number of deliveries. All these are crucial in maintaining a good business image to customers. Next, the dispatchers are designated to interact with the drivers by assigning the delivery requests to the available drivers, monitoring the progress of deliveries, and relaying the routes/paths that should be taken by the drivers. Fleet tracking is done using a whiteboard only. This is prone to inconsistencies and is difficult to sustain especially when the business is expanding. On the driver’s side, they get a call from the dispatcher when there is an accepted delivery order whether it is a last-mile or a return trip delivery.
2.2. Proposed GIS Framework
There are a total of four roles (see Table 1) in the software level, namely, administrator, dispatcher, customer, and driver. The customer is the one who requests the trips and monitors the progress of their delivery requests. Next, the dispatcher will either accept or decline the delivery requests, depending on the availability of vehicles and drivers. After that, the dispatcher will also be responsible for accepting and assigning the requests to the available drivers which he/she will also monitor. Then, the driver will either accept or decline the delivery requests depending on their condition and update their progress while delivering the goods. Lastly, the administrator has the same responsibilities as the dispatcher but has additional ones, specifically retrieving, updating, and deleting user accounts existing in the application software.
The proposed improvement on the framework of the 5RJSL Lanuza Logistics Corp. is shown in Figure 3. It utilizes mobile application and GIS-driven algorithms at the back end to improve their business response times and increase the number of concurrent customers they can handle. With the new framework, customers will be able to keep on sending their orders through the application software and just wait for an acceptance notification instead of dialing in numerous times. While still having the option to use SMS/call/email to inquire about concerns, special deliveries, etc. Next, the customer service representative may answer special concerns through SMS, calls, and e-mails. Then, the dispatcher can handle multiple orders at the same time as long as there are available trucks for delivery. The dispatcher is also responsible for assigning driver trips, including return trips through the application software, managing the truck fleet using the dashboard, and real-time monitoring of the trucks and customer orders. Lastly, the truck driver can also update the dispatcher regarding its delivery and availability status much more quickly instead of calling back to the dispatcher. They can also accept/reject customer orders just in case the driver needs to go home early or has health problems that he needs to attend to.
To optimize the trip of a driver, the application software suggests a route plan based on various input parameters such as vehicle type, shipment locations, defined constraints, and vehicle cost parameters. The constraints include driver working hours, vehicle capacity, and window hour. This is done through the waypoint order optimization algorithm wherein a vehicle is assigned with cost per hour, per kilometer, and per traveled hour parameters. The pseudocode representation of the algorithm is as follows:
request.truck[0].startLocation -> transitions[0] -> visits[0] ->
transitions[1] -> visits[1] -> transitions[2] -> ... -> visits[n] ->
transitions[n] -> request.truck[0].endLocation.
The startLocation and endLocation represent the origin and return point of a truck respectively after all orders have been shipped to the corresponding end customer location. Based on the GPS locations of pickup/delivery points, the order of waypoint is arranged to achieve minimum travel hour and distance costs. These costs are extracted using the Distance Matrix and Directions API of Google. Transition is tagged between the truck’s current location and the next location to visit. Upon completion of a pickup or delivery, it is tagged as visit. This represents as an assigned work that a truck needs to complete at the requested place and time. To aid the driver in visualizing the path per visit, the interactive polyline encoder utility of Google was used.
Utilizing the GIS framework can sustain logistics operations with its combined workload management tool and shipment route optimization to increase time efficiency, cost savings, customer/driver satisfaction, and environmental friendliness through the reduced carbon emission despite being in the transportation sector as well.
2.3. Roles and User Access in the Application Software
The roles and capabilities of the application software are shown in Table 1. The admin has the capability of a dispatcher plus the capability to view, update, block/unblock, and delete the details of the users in the database.
2.4. Dataflow in the GIS Framework
Figure 4 shows the data flow diagram of the application software. In this figure, the interaction between the database, APIs, different variables, and user data is illustrated. The data starts from the creation of users and drivers in the application. At first, the user will input their details such as email address, username, phone number, and password, and the driver will input the details mentioned earlier in addition to car details such as plate number, model, and their own picture so that the admin and dispatcher can further validate the legitimacy and identify more easily in the system once recorded in the database. The Mapping and Database module houses the algorithms and core GIS which is the key contribution and difference of the proposed study as compared to existing dispatch management applications.
2.5. Data Collection Methods
The researchers decided to replicate a normal trip of a 4-wheeler vehicle of the partner logistics company. The scenario is that there are six different customers, each booked a distinct pick-up location while Mega Pacific Freight Logistics, Inc. is the only starting and drop-off location. The order of then accepted customer requests and pick-up locations of the said requests are: 1) University Pad Residences Taft, 2) Vista GL Taft by Vista Residences, 3) Robinsons Place Manila, 4) Adamson University Main Building, 5) SM Mall of Asia, and 6) SM City Bicutan.
Data gathering is divided into three parts. In the first part, the researchers followed the order of the customer requests and did not use the application software or any navigation applications. They only followed the traditional approach which only relied on spatial awareness and following the signages. The second part is where the researchers used the software application, which organizes the route for the driver. This modifies the order of pick-up locations. The elapsed time, distance traveled, and fuel expenses were recorded, and the corresponding carbon footprint and projected profits were measured for the first two parts. It should be noted that due to time constraints, the researchers started outside the Br. Andrew Gonzales Hall in the actual testing for both the traditional and the proposed GIS framework, instead of Mega Pacific Logistics, Inc. The deviation in time and distance projected by Google Maps were added in the final results. In the last part of the data gathering, the researchers demonstrated the software application to several employees of the partner logistics company and distributed a survey about user acceptance to them.
2.6. Freight Rate Matrix Provided by the Partner Logistics Company
The rate matrix provided by the partner logistics company is summarized in Table 2. This was used by the researchers to generate the projected profits for testing using the current dispatch method. Another factor measured was the fuel costs per trip. To compute the fuel costs incurred in the traditional method, the researchers followed the values of fuel efficiency and fuel price set by the partner logistics company. According to R.J. Lanuza in a personal interview on February 19, 2024, the company currently follows the fuel efficiency set to 8 km/L and the fuel price set to ₱65.00/L in computing the fuel costs which is necessary for generating the rates.
2.7. Freight Rate Matrix Provided by the Researchers
Table 3 shows rate matrix proposed by the researchers. This was used to generate the projected profits for testing the dispatch performance using the proposed framework. The rate matrix provided by the partner logistics company caters for regular trips, which makes the rates significantly higher since it is based on two-way trips (origin to destination and vice versa). Because of this, the drivers and helpers might also earn more for a minimal effort because they can earn a minimum of Php 550.00 and Php 405, respectively each trip even if one pick-up location is very near to the next one. More established logistics companies implement a base fare on every trip and add a fee for every kilometer traveled on the way to the destination [39]. This makes it fair not only for the customers but also for the admin and other employees of the company. Because of this, the rate for drivers and helpers was adjusted accordingly.
First, the rate matrix still follows the fuel efficiency rate of 8 km/L and the fuel price of Php 65.00/L in calculating the fuel consumption. The formula for the fuel consumption cost is:
Fuel Consumption Cost=Fuel Price*No. of Kilometers/Fuel Efficiency
Next, the calculation of maintenance cost, along with driver and helper rate was based on the advice of the consultant. For maintenance costs, it was set at 5% of the final rate. As for driver and helper rates, according to R.J. Lanuza in a personal interview on March 7, 2024, the usual practice in these kinds of trips is that drivers receive 10% of the final rate while helpers receive 5% of the final rate for their respective compensations.
As mentioned above, the implementation of the base fare and additional fee for every kilometer traveled is beneficial for all of the stakeholders, especially in the context of the return trips. For 4-wheeler vehicles, the researchers set the base fare to Php 650.00 while the fee for every kilometer traveled is set to Php 55.00. Lastly, the final rate is the sum of the base fare and additional fee for every kilometer traveled while the profit is the difference between the final rate and expenses.
3. Results and Discussions
3.1. Elapse Time
As mentioned in the previous Chapter, the actual testing with and without using the application software started outside Br. Andrew Gonzales Hall instead of Mega Pacific Freight Logistics, Inc., which is the original starting and drop-off location. Also, the elapsed time projected by Google Maps if the original starting point is used, was just added to the final results. Comparing Table 4 and Table 5, it can be observed that the time it took to arrive at all of the pick-up locations except pick-up location no. 4 is significantly lower with the use of the proposed framework. The difference in the total elapsed time between testing with and without the application software is 45 minutes and 17 seconds. This means that testing with the application software saves around 87% of the time when compared to the traditional dispatch method.
3.2. Distance Traveled, Fuel Expenses, and CO2 Emission
In Table 6 and Table 7, the distance traveled per pick-up location were recorded and the corresponding fuel expenses and carbon footprint were measured. The difference in the total distance traveled between testing without and with the application software is 1.3 km while the saved fuel expense is Php 10.57. The corresponding decrease in carbon footprint is 0.37 kg/vehicle-km. This was measured using the distance-based method considering 0.454 CO2 emission factor for light-duty trucks as listed in the emission factors for greenhouse gas inventories as of April 2022 [40,41]. In total, there is a 2.89% reduction in all components when the software application is utilized.
3.3. Projected Savings
The results shown in Table 8 and Table 9 are the summary of the projected expenses in testing with and without the application software. In testing without the application software, there is a total of Php 6,095.63 expenses. On the other hand, testing with the application software there is only a total of Php 1,275.86 in expenses. This results in a total of Php 4,819.77 projected savings or a 79% decrease in operating expenses.
3.4. Projected Revenues
The results shown in Table 10 and Table 11 are the projected revenues for testing with and without the application software. It can be observed that the projected revenue for testing without the application is a bit lower than the projected revenue for testing with the application. This is because the rates for the former are based on the freight rate matrix provided by the partner logistics company, which is intended for regular two-way trips. On the other hand, the rates for the latter are based on the proposed freight rate matrix by the researchers, which is focused on return trips.
3.5. Projected Gross Profits
The results shown in Table 12 are the projected gross profits gained after testing with and without the application software. It can be observed that testing with the application software has a higher projected gross profit of Php 157.97 or about 3.36% increase. Even though using the application software generates less revenue, it significantly cuts the expenses.
3.6. User Acceptance
It can be observed in Table 13 that the results of the survey were mostly positive with regards to the application software. The respondents think that the application will greatly benefit the company, especially the logistics operations, and they can easily use the application software after being taught how to use it. The most notable part of the survey is the response of the drivers as they gave a positive response, especially on the Drivers App wherein they would no longer need to manually plan their routes and avoid traffic as much as possible. The results indicate that the GIS framework based software application can positively impact the user experience, maintenance of vehicles, safety, seamless navigation, optimization in operations, and seamless integration.
4. Conclusions
In this study, the researchers were able to design, develop, implement, and build upon a small-scale application software of a dispatcher management system following the proposed GIS framework. Application programming interface of Google Maps were integrated to perform waypoint order optimization with the aid of parameters from Directions, Distance Matrix and polyline utility. Next, a return trip node-based order gathering within a small-scale area application was established. After that, application software for multiple roles/users such as Admin, Dispatcher, Driver, and Customer was also developed. Lastly, the operations with application software were compared to operations without the application software and the results show significant improvement and cost savings for clients based on different success metrics.
The test results using the new framework show promising value as it can reduce the travel time of the driver by optimizing the pickup addresses while also taking into consideration the live traffic information that Google has. The application provided significant improvement for the company as it can allow return trips again without spending much time in planning the return trip of the truck as the application software can efficiently plan the return trip with the click of a button. The company can also benefit from the time savings that the app can provide due to its efficient routing. The importance of technology in easing the role of dispatchers is very evident in this application. Without the quick and efficient planning of the application software, dispatchers would have to take an enormous amount of time in planning the trips of the drivers just to optimize their path and without live traffic information [42]. The improved delivery efficiency and reduction of operational costs brought by the app can be significant to the company because of the lesser time that the vehicle will spend on the road and the potential profits that the company may get from using the application. The positive remarks of the respondents show the potential that this application can bring to a business, and it covers the essential part of it starting from the dispatcher, and driver, up to the customer. The comments and suggestions of the respondents can be taken into consideration in the recommendations part of the paper. Overall, the researchers were able to achieve the objectives and contribute positively to making logistics operations sustainable in the future.
Author Contributions
Conceptualization, methodology, data curation, investigation, software, visualization, writing—original and draft preparation: Jonathan Agoo, Renz Joshua Lanuza, Jonathan Lee, Paul Anthony Rivera; Funding acquisition, project administration, writing—review and editing: Neil Oliver Velasco, Marielet Guillermo, and Arvin Fernando.
Funding
This research was funded by NAME OF FUNDER and the APC was funded by XXX.
Data Availability Statement
Data can be requested from the corresponding author as needed.
Acknowledgments
The authors would like to thank the Gokongwei College of Engineering of De La Salle University for the administrative and technical support with the use of laboratory resources and spaces. The authors would also like to thank the editorial board and peer reviewers for the improvement of this article.
Conflicts of Interest
The authors declare no conflicts of interest.
References
- Saarah Hendricks, Samwel Dick Mwapwele, A systematic literature review on the factors influencing e-commerce adoption in developing countries, Data and Information Management, Volume 8, Issue 1, 2024.
- Omar Hasan Salah, Mohannad Moufeed Ayyash, E-commerce adoption by SMEs and its effect on marketing performance: An extended of TOE framework with ai integration, innovation culture, and customer tech-savviness, Journal of Open Innovation: Technology, Market, and Complexity, Volume 10, Issue 1, 2024.
- Shaolong Zeng, Qinyi Fu, Fazli Haleem, Yiyang Han, Ling Zhou, Logistics density, E-commerce and high-quality economic development: An empirical analysis based on provincial panel data in China, Journal of Cleaner Production, Volume 426, 2023.
- Andre Parvian Aristio, Mudjahidin Mudjahidin, Jessica Patricia Halim, Lukman Junaedi, S. Supardi, Ismail, Gatut Prijo Utomu. Model Development of Factors Affecting Intention to Use in Third-Party Logistics. Procedia Computer Science 2024, 234. [Google Scholar]
- Navid Zarbakhshnia, Amin Karimi, Enhancing third-party logistics providers partnerships: An approach through the D.L.A.R.C.S supply chain paradigm, Resources, Conservation and Recycling, Volume 202, 2024.
- S. Dolan, Last mile delivery logistics explained: Problems & solutions, 2022, Insider Intelligence, 15.
- Enming Chen, Zhongbao Zhou, Ruiyang Li, Zhongxiang Chang, Jianmai Shi, The multi-fleet delivery problem combined with trucks, tricycles, and drones for last-mile logistics efficiency requirements under multiple budget constraints, Transportation Research Part E: Logistics and Transportation Review, Volume 187, 2024.
- Onfleet, Inc., What is a last mile delivery? Delivered Blog., https://onfleet.com/blog/what-is-last-mile-delivery/.
- T. Mai, What is reverse logistics? How it works and types, March 2022, Magenest, https://magenest.com/en/what-is-reverse-logistics/.
- Nawin Yanpirat, Daniel F. Silva, Alice E. Smith, Sustainable last mile parcel delivery and return service using drones, Engineering Applications of Artificial Intelligence, Volume 124, 2023.
- Truck Dispatcher Job Description, Betterteam, https://www.betterteam.com/truck-dispatcher-job-description.
- S. Kaushik, Common Challenges In Scheduling And Dispatch Management, LinkedIn, https://www.linkedin.com/pulse/common-challenges-scheduling-dispatch-management-suyash-Kaushik.
- Özge Büyükdeveci, Selin Özpeynirci, Özgür Özpeynirci, Multi-objective shipment consolidation and dispatching problem, Computers & Operations Research, Volume 169, 2024.
- Crippa, M.; Guizzardi, D.; Solazzo, E.; Muntean, M.; Schaaf, E.; Monforti-Ferrario, F.; Banja, M.; Olivier, J.; Grassi, G.; Rossi, S. GHG emissions of all world countries. In EUR 30831 EN; Publications Office of the European Union: Luxembourg, 2021; ISBN 978-92-76-41546-6. [Google Scholar]
- Climate Change 2022: Impacts, Adaptation and Vulnerability. In Contribution of Working Group II to the Sixth Assessment Report of the Intergovernmental Panel on Climate Change; Pörtner, H.-O., Roberts, D.C., Tignor, M.M.B., Poloczanska, E.S., Mintenbeck, K., Alegría, A., Craig, M., Langsdorf, S., Löschke, S., Möller, V., Eds.; Cambridge University Press: Cambridge, UK; New York, NY, USA, 2022. [Google Scholar]
- Siragusa, C.; Tumino, A.; Mangiaracina, R.; Perego, A. Electric Vehicles Performing Last-Mile Delivery in B2C e-Commerce: An Economic and Environmental Assessment. Int. J. Sustain. Transp. 2022, 16, 22–33. [Google Scholar] [CrossRef]
- Ghosh, P.; Jha, A.; Sharma, R.R.K. Managing carbon footprint for a sustainable supply chain: A systematic literature review. Mod. Supply Chain. Res. Appl. 2020, 2, 123–141. [Google Scholar] [CrossRef]
- Sherafati, M.; Bashiri, M.; Tavakkoli-Moghaddam, R.; Pishvaee, M.S. Achieving sustainable development of supply chain by incorporating various carbon regulatory mechanisms. Transp. Res. Part D Transp. Environ. 2020, 81, 102253. [Google Scholar] [CrossRef]
- Quak, H.; Nesterova, N.; Rooijen, T.; Dong, Y. Zero emission city logistics: Current practices in freight electromobility and feasibility in the near future. Transp. Res. Procedia 2016, 14, 1506–1515. [Google Scholar] [CrossRef]
- Kopfer, H.W.; Schönberger, J.; Kopfer, H. Reducing Greenhouse Gas Emissions of a Heterogeneous Vehicle Fleet. Flex Serv. Manuf. J. 2014, 26, 221–248. [Google Scholar] [CrossRef]
- Schöder, D.; Ding, F.; Campos, J.K. The Impact of E-Commerce Development on Urban Logistics Sustainability. Open J. Soc. Sci. 2016, 4, 1–6. [Google Scholar] [CrossRef]
- Jianxin Wang, Ming K. Lim, Yuanzhu Zhan, XiaoFeng Wang, An intelligent logistics service system for enhancing dispatching operations in an IoT environment, Transportation Research Part E: Logistics and Transportation Review, Volume 135, 2020.
- Zhiyuan Ouyang, Eric Ka Ho Leung, George Q. Huang, Community logistics for dynamic vehicle dispatching: The effects of community departure “time” and “space”, Transportation Research Part E: Logistics and Transportation Review, Volume 165, 2022.
- Eda Yücel, F. Sibel Salman, Güneş Erdoğan, Optimizing two-dimensional vehicle loading and dispatching decisions in freight logistics, European Journal of Operational Research, Volume 302, Issue 3, 2022.
- Michel Gendreau, François Guertin, Jean-Yves Potvin, René Séguin, Neighborhood search heuristics for a dynamic vehicle dispatching problem with pick-ups and deliveries, Transportation Research Part C: Emerging Technologies, Volume 14, Issue 3, 2006.
- Sallem, R., Serbaji, M.M., Alamri, A.M., Kallel, A., Trabelsi, I., 2021. Optimal routing of household waste collection using ArcGIS application: a case study of El Bousten district, Sfax city, Tunisia. Arabian J. Geosci. 14.
- Akram, M., Habib, A., Alcantud, J.C.R., 2021. An optimization study based on Dijkstra algorithm for a network with trapezoidal picture fuzzy numbers. Neural Comput. Appl. 33, 1329–1342.
- Shouliang Zhu, Chao Wang, An interaction-enhanced co-evolutionary algorithm for electric vehicle routing optimization, Applied Soft Computing, 2024.
- Jingfeng Yang, Hoong Chuin Lau, Hai Wang, Optimization of customer service and driver dispatch areas for on-demand food delivery, Transportation Research Part C: Emerging Technologies, Volume 165, 2024.
- Mingjie Ding, Yingya Guo, Zebo Huang, Bin Lin, Huan Luo, GROM: A generalized routing optimization method with graph neural network and deep reinforcement learning, Journal of Network and Computer Applications, Volume 229, 2024.
- Fernando, Arvin H., et al. “Load Pushing Capacity Analysis of Individual and Multi-Cooperative Mobile Robot through Symbiotic Application.” International Journal of Mechanical Engineering and Robotics Research 13.2 (2024).
- Fernando, A., and L. GanLim. “Velocity analysis of a six wheel modular mobile robot using MATLAB-Simulink.” IOP Conference Series: Materials Science and Engineering. Vol. 1109. No. 1. IOP Publishing, 2021.
- Praveen Kumar B, Hariharan K, Manikandan M.S.K., Hybrid long short-term memory deep learning model and Dijkstra’s Algorithm for fastest travel route recommendation considering eco-routing factors, Transportation Letters, Volume 15, Issue 8, 2023.
- Yuanmin Liu, Xinyu Gao, Bo Wang, Jiaxin Fan, Qiurong Li, Wen Dai, A passage time–cost optimal A* algorithm for cross-country path planning, International Journal of Applied Earth Observation and Geoinformation, Volume 130, 2024.
- K. G. Francisco, R. R. P. Vicerra, R. S. Concepcion, A. A. Bandala, A. H. Fernando and M. A. Guillermo, “Soil Type Factor Estimation Based on ERT Apparent Resistivity Using Supervised Machine Learning Models,” 2023 IEEE 15th International Conference on Humanoid, Nanotechnology, Information Technology, Communication and Control, Environment, and Management (HNICEM), Coron, Palawan, Philippines, 2023, pp. 1-6. [CrossRef]
- Pascua, Athena Rosz Ann, et al. “Face Recognition and Identification Using Successive Subspace Learning for Human Resource Utilization Assessment.” 2022 13th International Conference on Information and Communication Technology Convergence (ICTC). IEEE, 2022.
- A. Fernando, L. A. Fernando, L. Lim, A. Bandala, R. Vicerra, E. Dadios, M. Guillermo, and R. Naguib, “Simulated vs Actual Application of Symbiotic Model on Six Wheel Modular Multi-Agent System for Linear Traversal Mission,” J. Adv. Comput. Intell. Intell. Inform., Vol.28 No.1, pp. 12-20, 2024.
- L. Ping, Strategy of green logistics and sustainable development. In 2009 International Conference on Information Management, Innovation Management and Industrial Engineering, Vol. 1, pp. 339-342, December 2009, IEEE.
- Lalamove, Delivery Pricing & Rates, https://www.lalamove.com/en-ph/all-delivery-pricing-detail.
- https://www.epa.gov/system/files/documents/2022-04/ghg_emission_factors_hub.pdf.
- https://ghgprotocol.org/sites/default/files/2023-03/Scope3_Calculation_Guidance_0%5B1%5D.pdf.
- M. Guillermo et al., “A Comparative Study on Satellite Image Analysis for Road Traffic Detection using YOLOv3-SPP Keras RetinaNet and Full Convolutional Network”, 2023 8th International Conference on Business and Industrial Research (ICBIR), pp. 578-584, 2023.
Figure 1.
Use Case Diagram of the Proposed GIS Framework
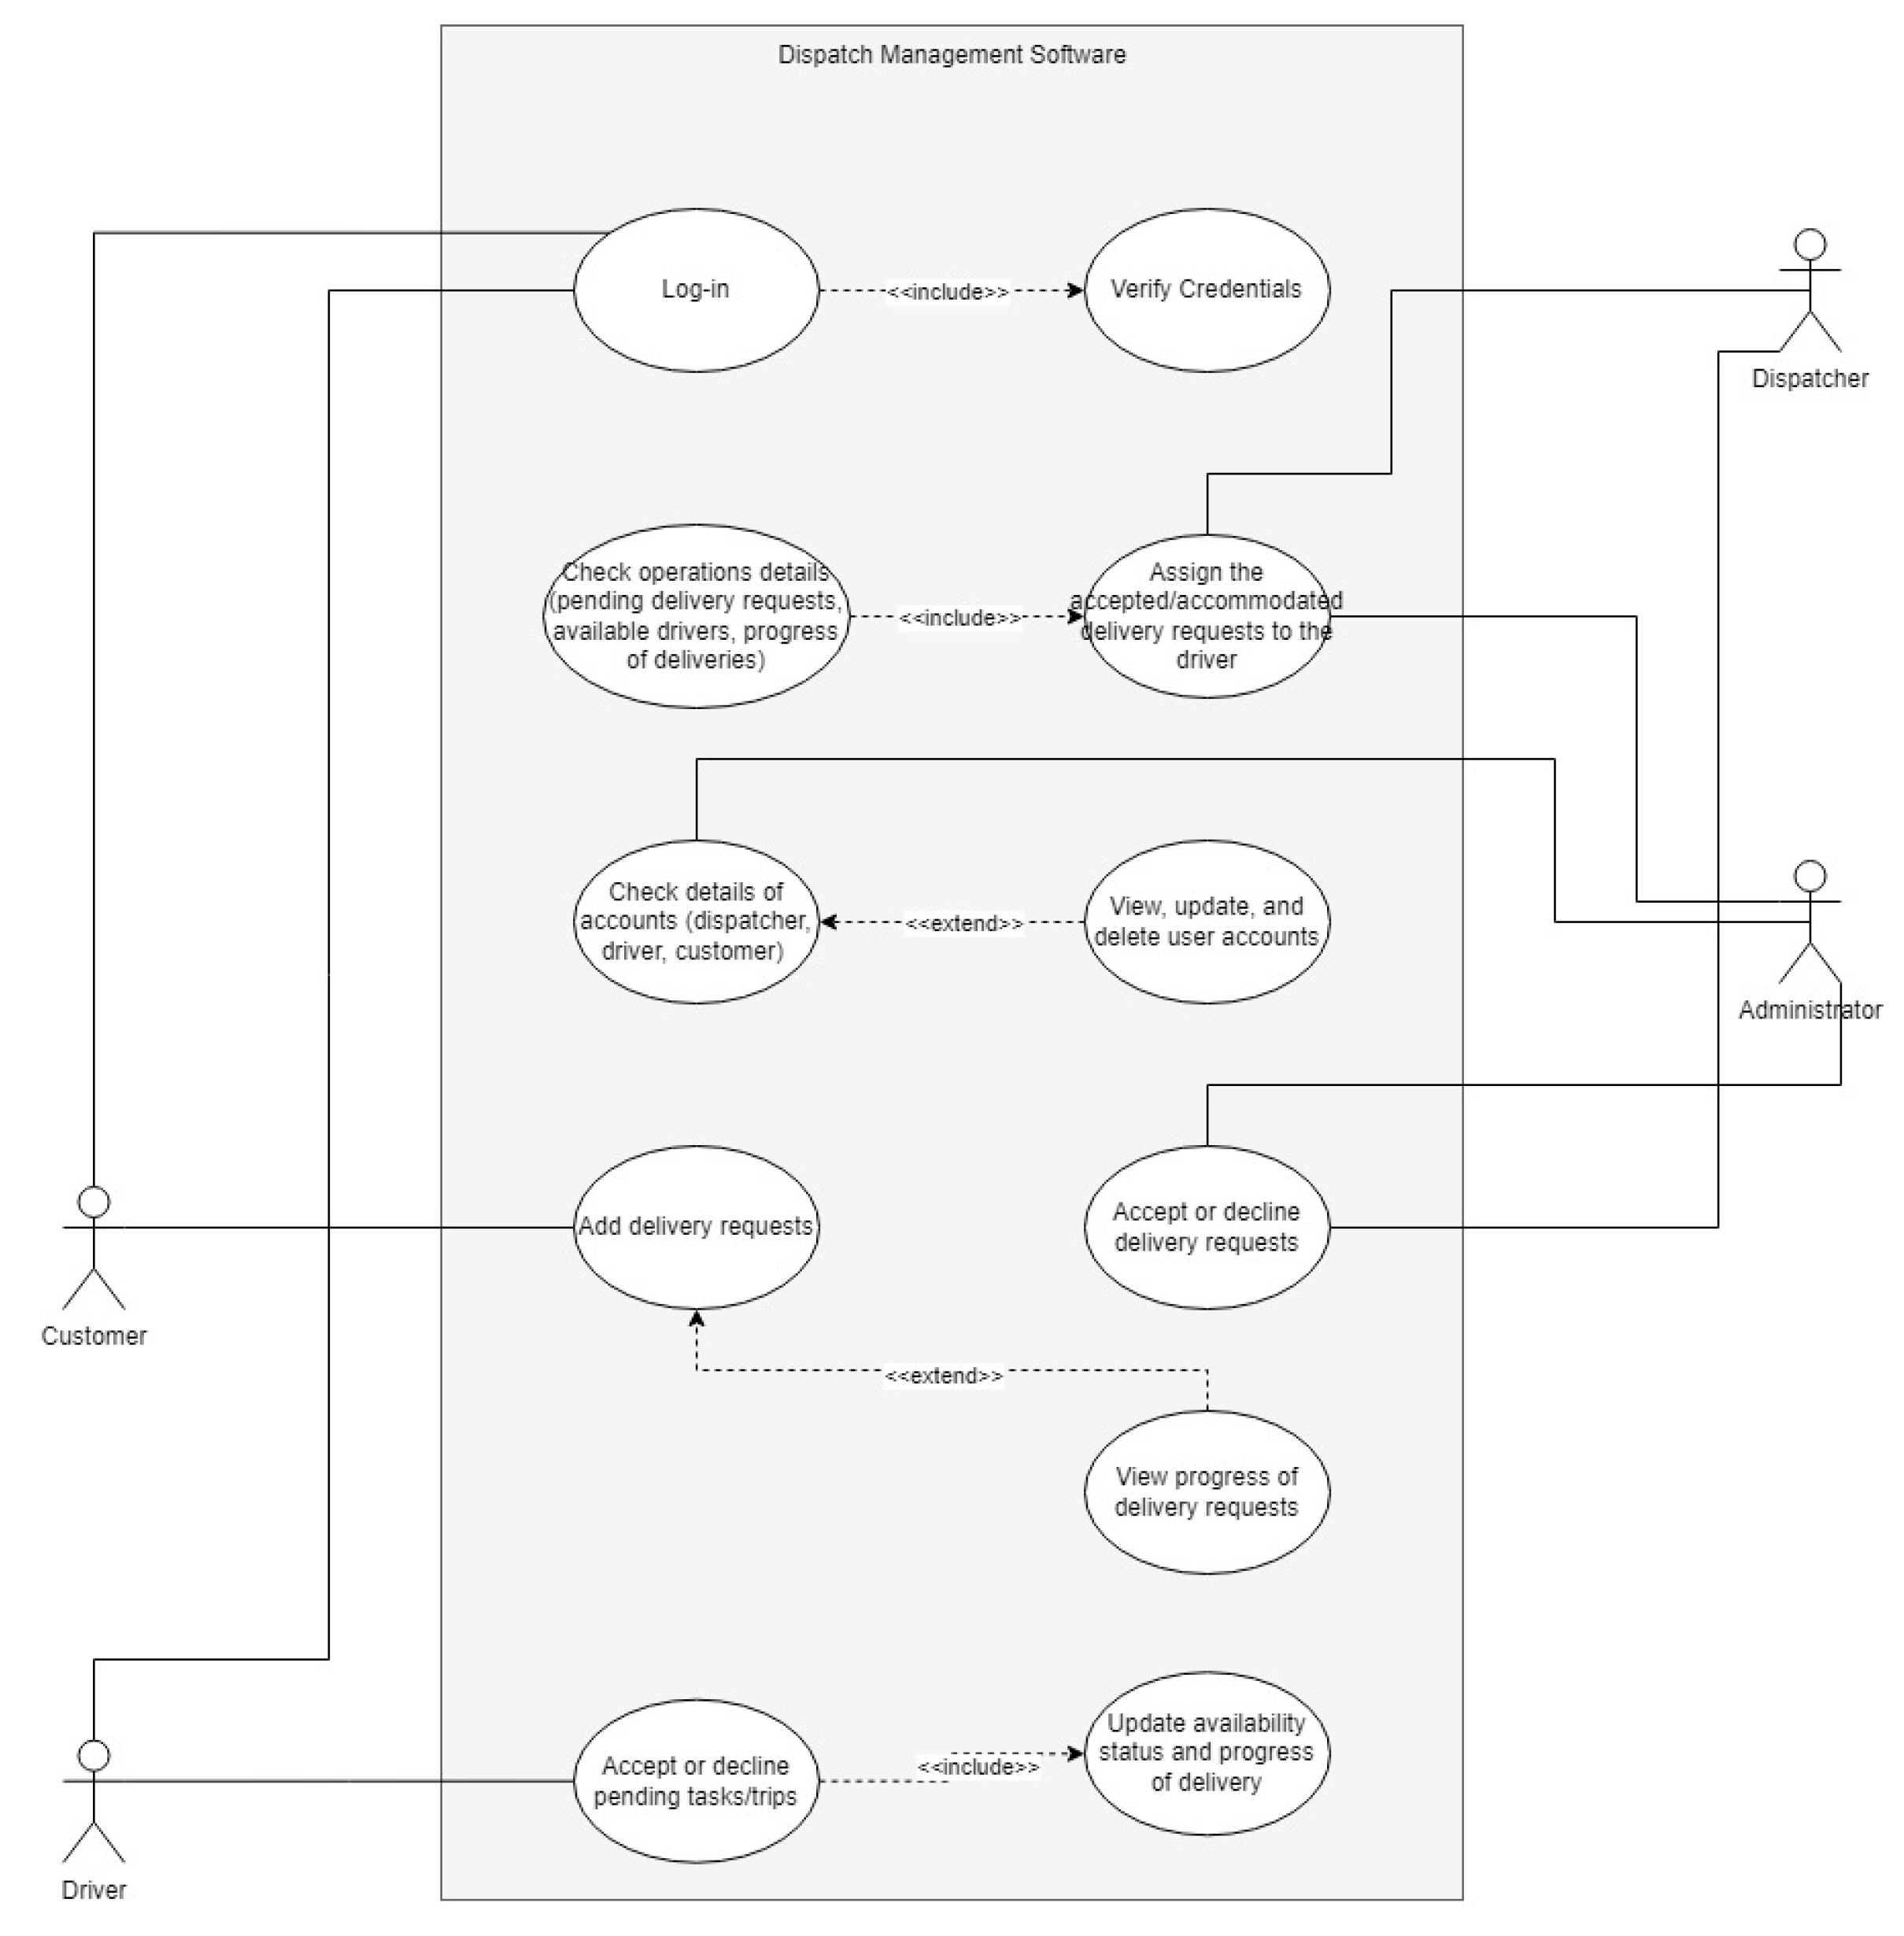
Figure 2.
As Is Dispatch Management Framework of 5RJS Lanuza Logistics Corp.
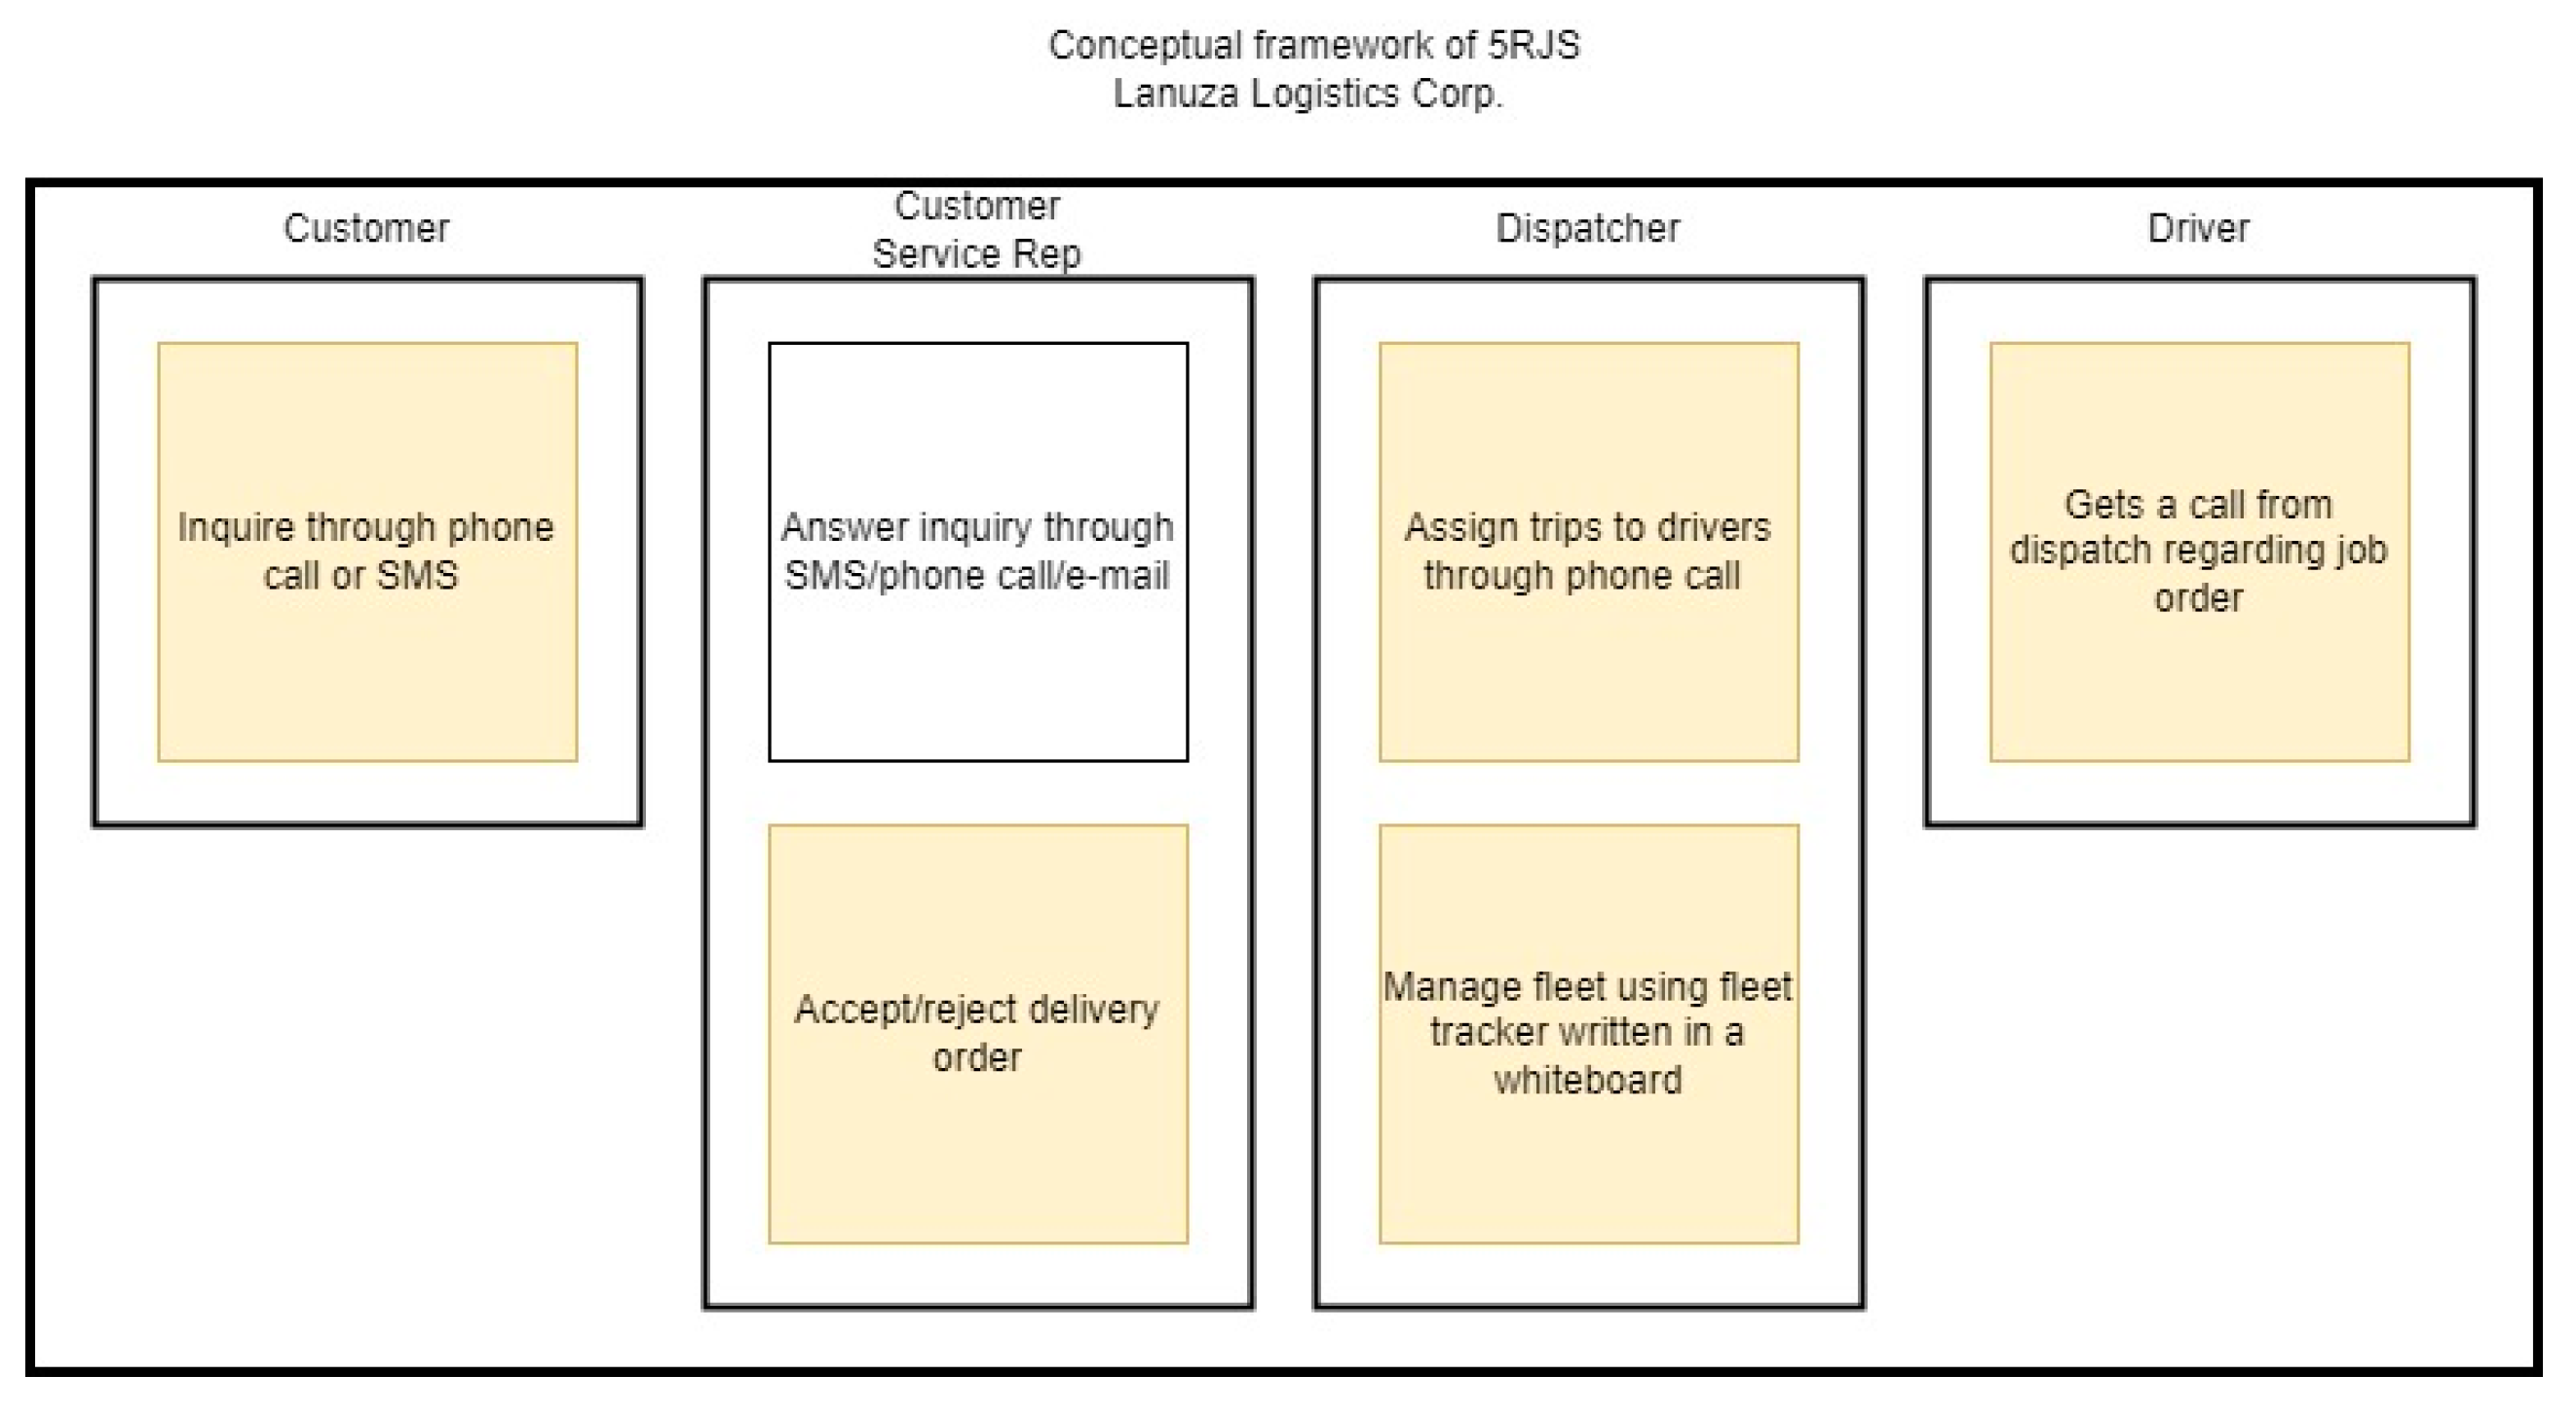
Figure 3.
Proposed GIS Framework for the partner Logistics Corp.
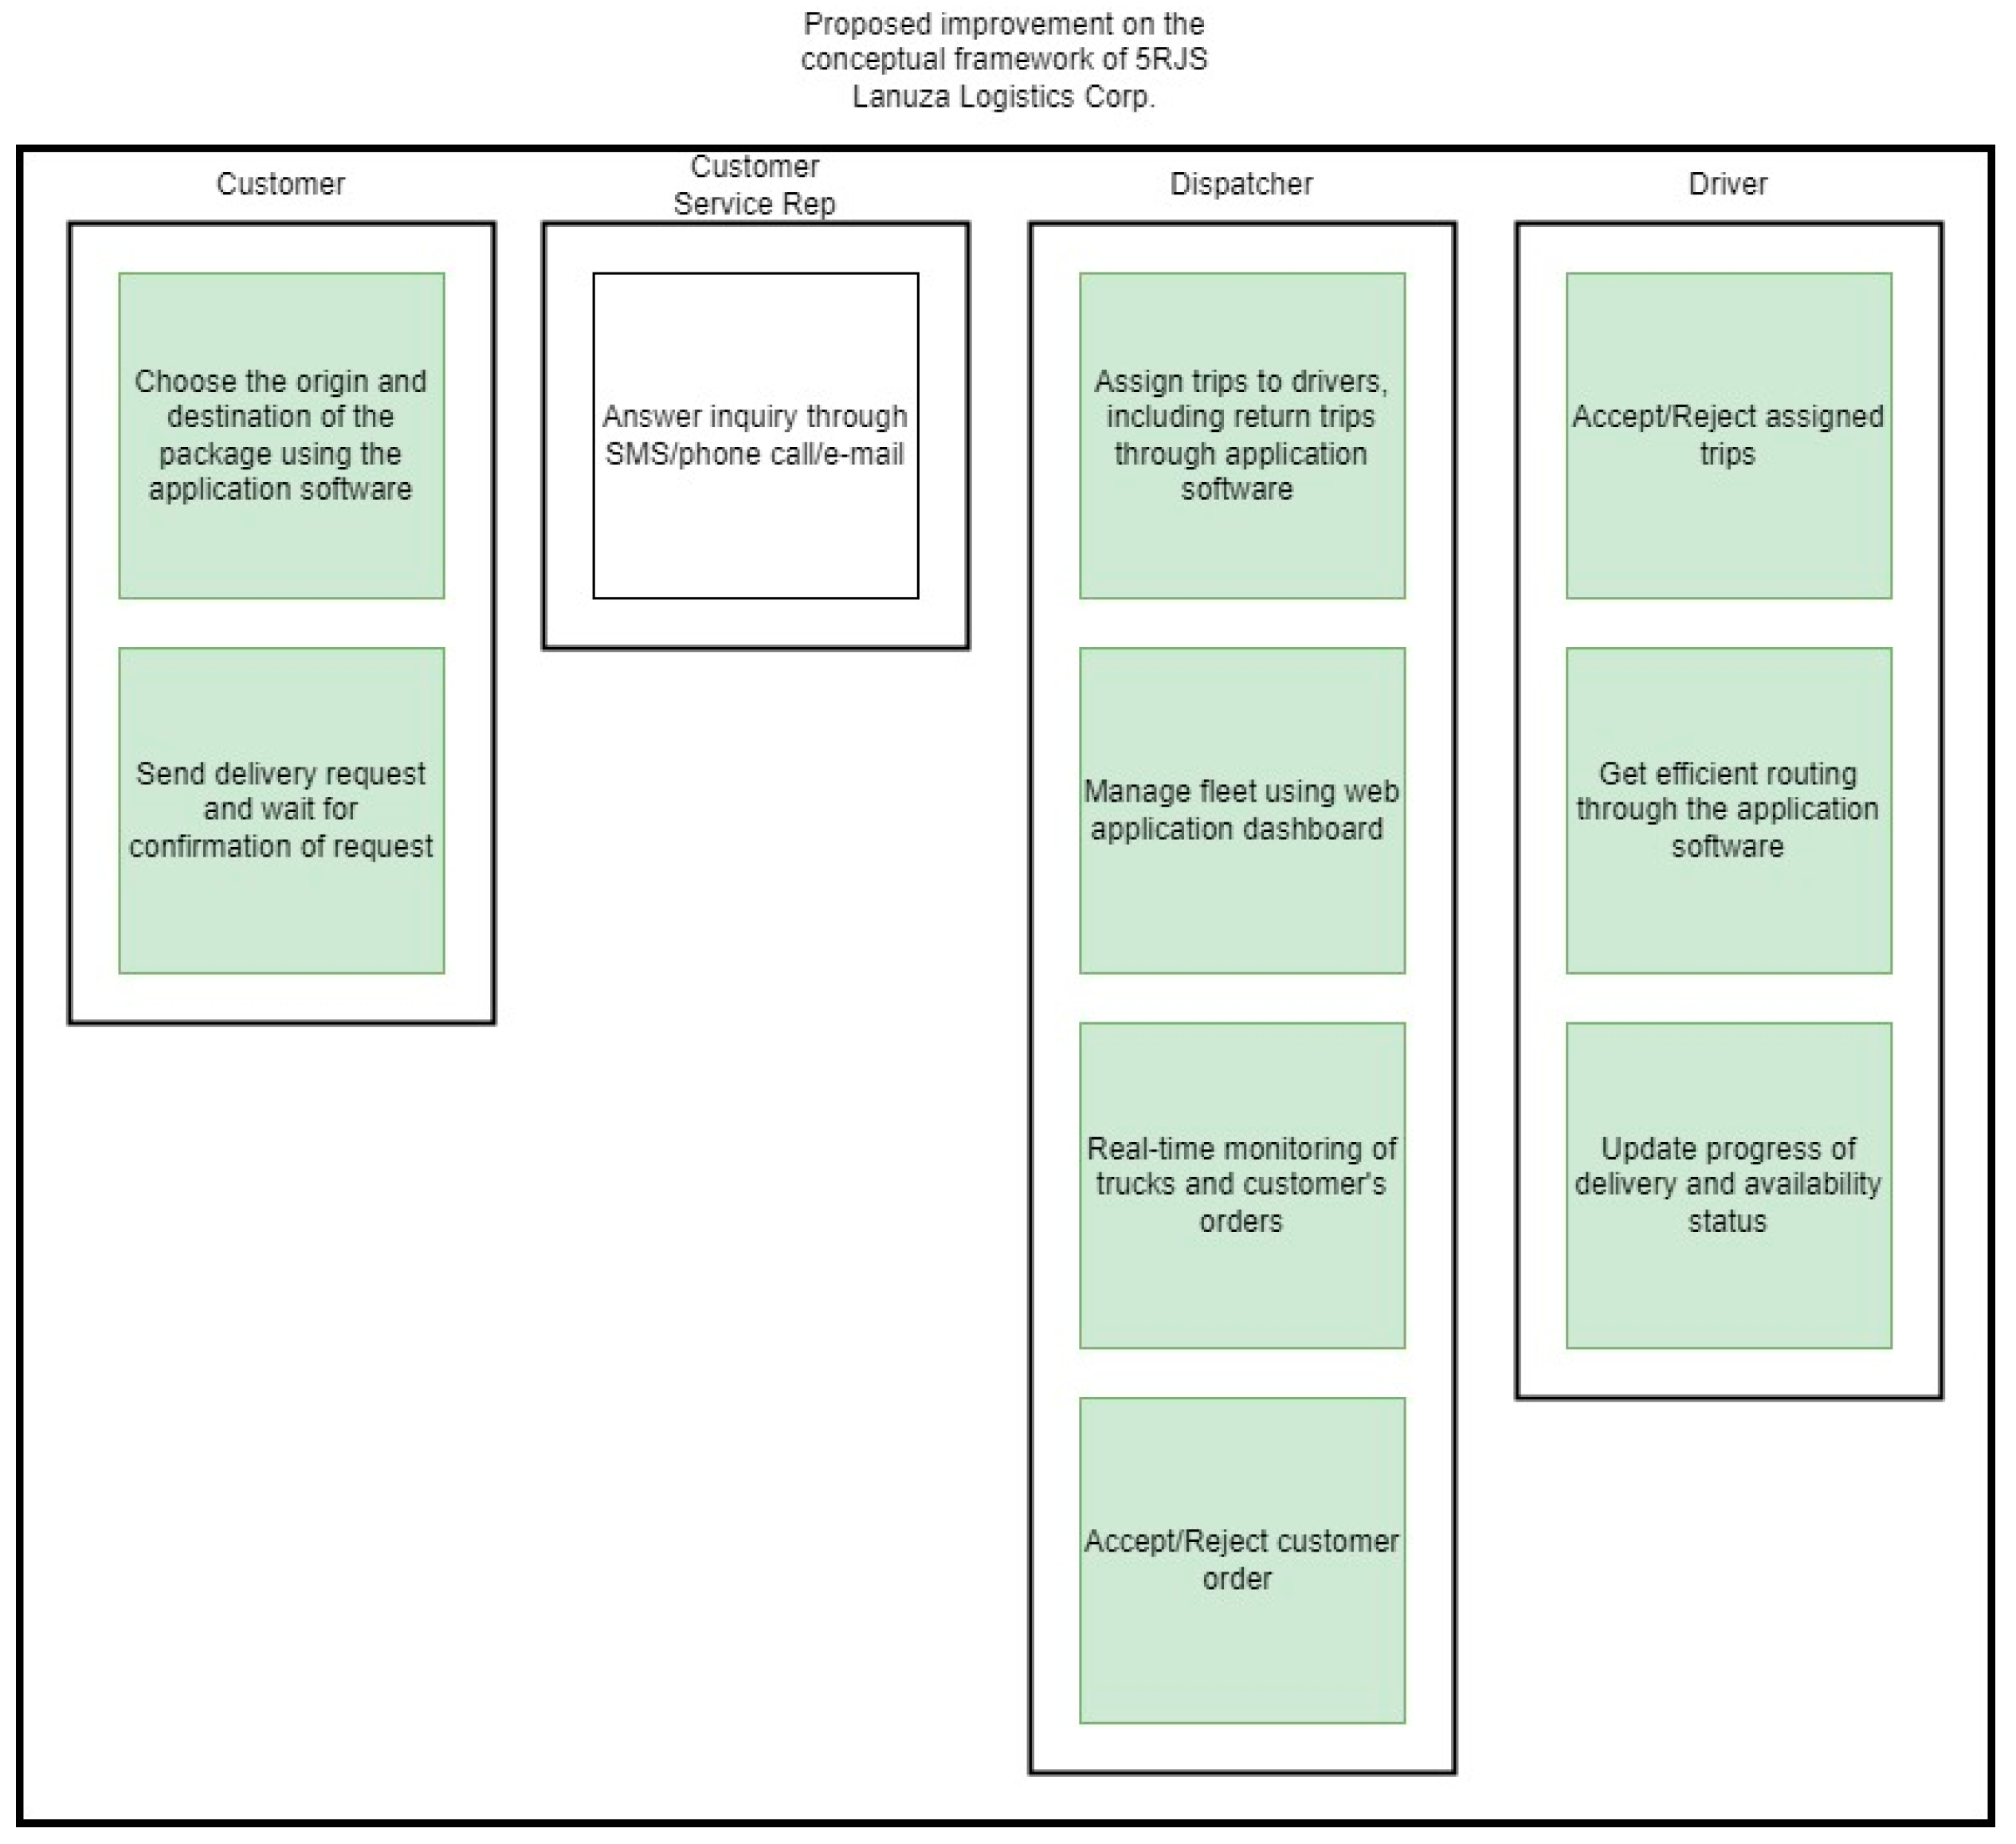
Figure 4.
Dataflow diagram of the application software
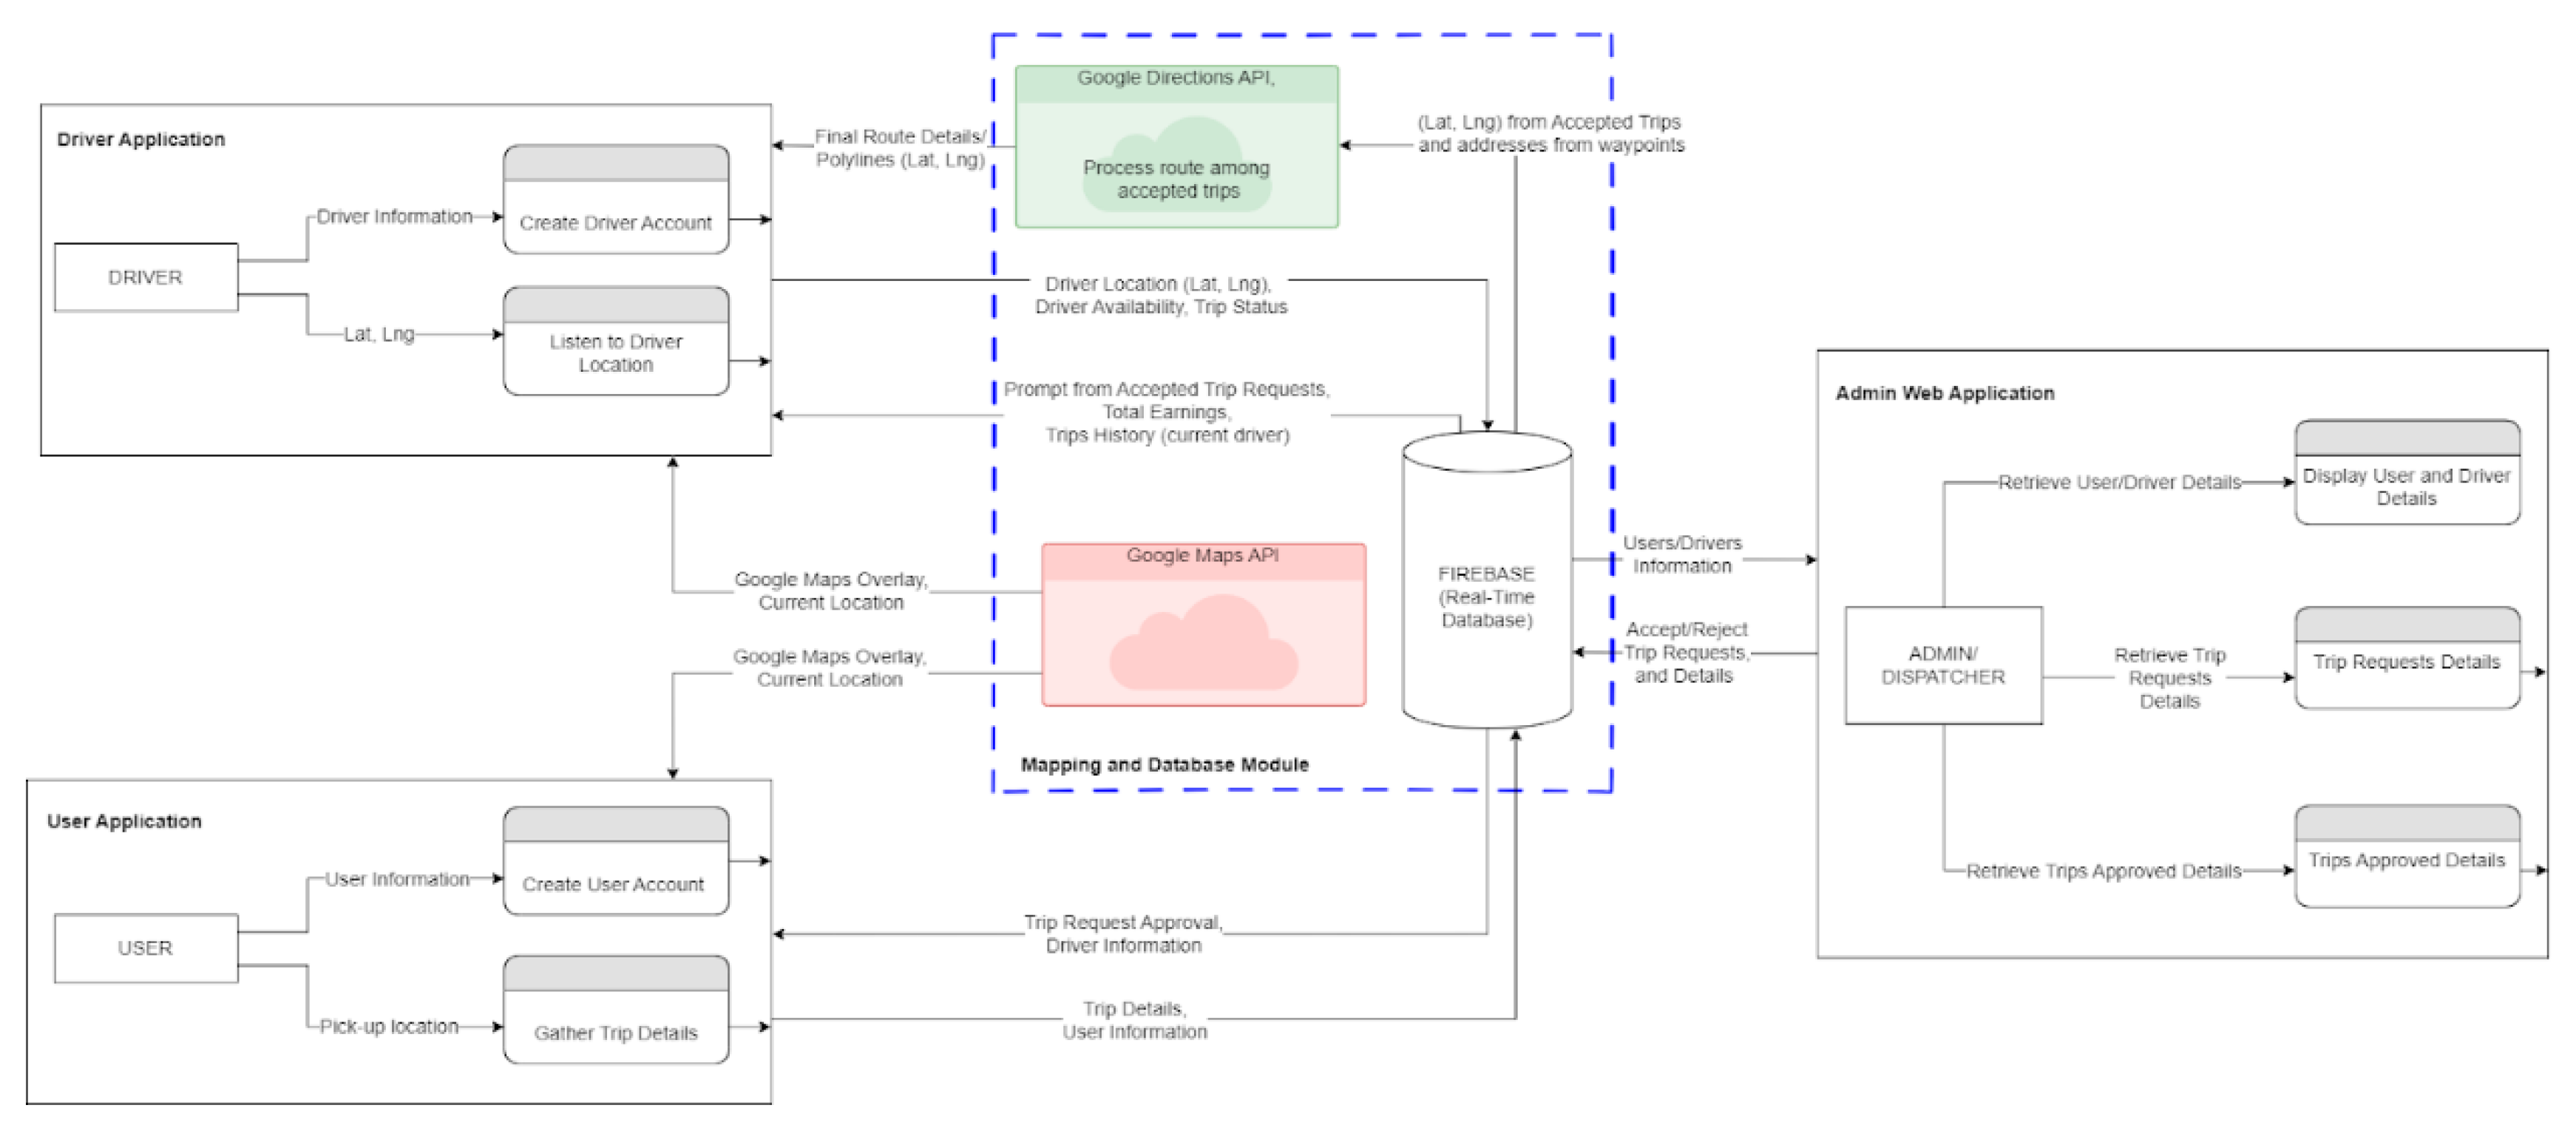

Table 1.
Roles and Capabilities in the Proposed Application Software.
| Roles | User Access |
|---|---|
| Admin |
|
| Dispatcher |
|
| Driver |
|
| Customer |
|
Table 2.
Freight Rate Matrix without Toll Fees for 4 Wheeler Vehicles Provided by the Partner Logistics Company.
Table 2.
Freight Rate Matrix without Toll Fees for 4 Wheeler Vehicles Provided by the Partner Logistics Company.
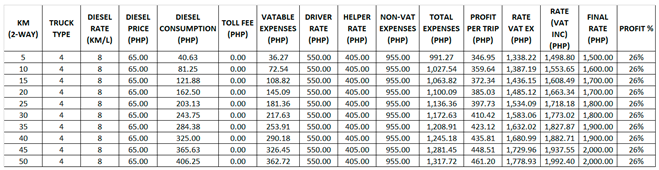 |
Table 3.
Freight Rate Matrix Without Toll Fees for 4 Wheeler Vehicles Proposed by the Researchers.
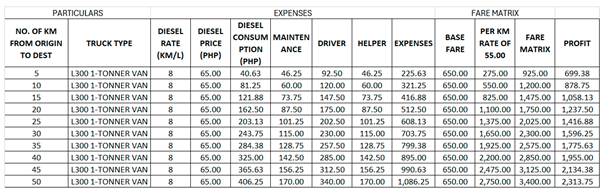 |
Table 4.
Summary of Elapsed Time for Testing Without the Application Software.
| Pick-up Location No. | Pick-up Location | Elapsed Time from Previous Location |
|---|---|---|
| Starting Location | Starting Location | Starting Location |
| 0 | Br. Andrew Gonzales Hall | 35:00* |
| 1 | University Pad Residences Taft | 12:21^ |
| 2 | Vista GL Taft by Vista Residences | 37:50^ |
| 3 | Robinsons Place Manila | 13:00^ |
| 4 | Adamson University Main Building | 9:21^ |
| 5 | SM Mall of Asia | 42:58^ |
| 6 | SM City Bicutan | 56:49^ |
| Drop-off Location | Mega Pacific Freight Logistics, Inc. | 24:45^ |
| Total | 3:52:04 |
* Estimated by Google Maps. ^ Added 2:00 as the allotted time for picking up the goods.
Table 5.
Summary of Elapsed Time for Testing With the Application Software.
| Pick-up Location No. | Pick-up Location | Elapsed Time from Previous Location |
|---|---|---|
| Starting Location | Mega Pacific Freight Logistics, Inc. | 0:00 |
| 0 | Br. Andrew Gonzales Hall | 35:00* |
| 1 | University Pad Residences Taft | 08:14^ |
| 2 | Vista GL Taft by Vista Residences | 16:47^ |
| 3 | Adamson University Main Building | 08:36^ |
| 4 | Robinsons Place Manila | 13:56^ |
| 5 | SM Mall of Asia | 31:38^ |
| 6 | SM City Bicutan | 52:51^ |
| Drop-off Location | Mega Pacific Freight Logistics, Inc. | 19:45^ |
| Total | 03:06:47 |
* Estimated by Google Maps.^ Added 2:00 as the allotted time for picking up the goods.
Table 6.
Summary of Distance Traveled and Fuel Expenses for Testing Without the Application Software.
Table 6.
Summary of Distance Traveled and Fuel Expenses for Testing Without the Application Software.
| Pick-up Location No. | Pick-up Location | Distance Traveled from Previous Location (km) | Fuel Expenses (Php) | CO2 Emmission (kg/veh-km) |
|---|---|---|---|---|
| Starting Location | Mega Pacific Freight Logistics, Inc. | 0.00 | 131.63 | 0 |
| 0 | Br. Andrew Gonzales Hall | 15.50* | 4.372599948 | |
| 1 | University Pad Residences Taft | 0.70 | 0.197472256 | |
| 2 | Vista GL Taft by Vista Residences | 2.50 | 20.31 | 0.705258056 |
| 3 | Robinsons Place Manila | 0.40 | 3.25 | 0.112841289 |
| 4 | Adamson University Main Building | 2.10 | 17.06 | 0.592416767 |
| 5 | SM Mall of Asia | 7.90 | 64.19 | 2.228615457 |
| 6 | SM City Bicutan | 11.80 | 95.88 | 3.328818025 |
| Drop-off Location | Mega Pacific Freight Logistics, Inc. | 4.10 | 33.31 | 1.156623212 |
| Total | 45.00 | 365.63 | 12.69464501 |
* Estimated by Google Maps.
Table 7.
Summary of Distance Traveled and Fuel Expenses for Testing With the Application Software.
| Pick-up Location No. | Pick-up Location | Distance Traveled from Previous Location (km) | Fuel Expenses (Php) | CO2 Emmission (kg/veh-km) |
|---|---|---|---|---|
| Starting Location | Mega Pacific Freight Logistics, Inc. | 0.00 | 131.63 | 0 |
| 0 | Br. Andrew Gonzales Hall | 15.50* | 4.372599948 | |
| 1 | University Pad Residences Taft | 0.70 | 0.197472256 | |
| 2 | Vista GL Taft by Vista Residences | 2.60 | 21.13 | 0.733468378 |
| 3 | Adamson University Main Building | 1.50 | 12.19 | 0.423154834 |
| 4 | Robinsons Place Manila | 1.60 | 13.00 | 0.451365156 |
| 5 | SM Mall of Asia | 6.90 | 56.06 | 1.946512235 |
| 6 | SM City Bicutan | 11.90 | 96.69 | 3.357028347 |
| Drop-off Location | Mega Pacific Freight Logistics, Inc. | 3.00 | 24.38 | 0.846309667 |
| Total | 43.70 | 355.06 | 12.32791082 |
* Estimated by Google Maps.
Table 8.
Summary of Operating Expenses for Testing Without the Application Software.
| Pick-up Location No. | Pick-up Location | Actual Fuel Expenses (Php) | Driver Rate (Php) | Helper Rate (Php) |
Total |
|---|---|---|---|---|---|
| Starting Location | Mega Pacific Freight Logistics, Inc. | 0.00 | 0.00 | 0.00 | 0.00 |
| 0 | Br. Andrew Gonzales Hall | 131.63 | 550.00 | 405.00 | 1,086.63 |
| 1 | University Pad Residences Taft | ||||
| 2 | Vista GL Taft by Vista Residences | 20.31 | 550.00 | 405.00 | 975.00 |
| 3 | Robinsons Place Manila | 3.25 | 550.00 | 405.00 | 958.25 |
| 4 | Adamson University Main Building | 17.06 | 550.00 | 405.00 | 972.06 |
| 5 | SM Mall of Asia | 64.19 | 550.00 | 405.00 | 1,019.19 |
| 6 | SM City Bicutan | 95.88 | 550.00 | 405.00 | 1,050.88 |
| Drop-off Location | Mega Pacific Freight Logistics, Inc. | 33.31 | 0.00 | 0.00 | 33.31 |
| Total | 365.63 | 3,300.00 | 2,430 | 6,095.63 |
Table 9.
Summary of Operating Expenses for Testing With the Application Software.
| Pick-up Location No. | Pick-up Location | Actual Fuel Expenses (Php) | Driver Rate (Php) | Helper Rate (Php) |
Total |
|---|---|---|---|---|---|
| Starting Location | Mega Pacific Freight Logistics, Inc. | 0.00 | 0.00 | 0.00 | 0.00 |
| 0 | Br. Andrew Gonzales Hall | 131.63 | 154.10 | 77.05 | 362.78 |
| 1 | University Pad Residences Taft | ||||
| 2 | Vista GL Taft by Vista Residences | 21.13 | 79.30 | 39.65 | 140.08 |
| 3 | Adamson University Main Building | 12.19 | 73.25 | 36.63 | 122.07 |
| 4 | Robinsons Place Manila | 13.00 | 73.80 | 36.90 | 123.70 |
| 5 | SM Mall of Asia | 56.06 | 102.95 | 51.48 | 210.49 |
| 6 | SM City Bicutan | 96.69 | 130.45 | 65.23 | 292.37 |
| Drop-off Location | Mega Pacific Freight Logistics, Inc. | 24.38 | 0.00 | 0.00 | 24.38 |
| Total | 355.08 | 613.85 | 306.93 | 1,275.86 |
Table 10.
Summary of Revenue for Testing Without the Application Software.
| Pick-up Location No. | Pick-up Location | Distance from Starting Location (2-way) (km) | Rate (Php) |
|---|---|---|---|
| Starting Location | Mega Pacific Freight Logistics, Inc. | 0.00 | 0.00 |
| 0 | Br. Andrew Gonzales Hall | 32.40* | 1,800.00 |
| 1 | University Pad Residences Taft | ||
| 2 | Vista GL Taft by Vista Residences | 33.60* | 1,900.00 |
| 3 | Robinsons Place Manila | 32.20* | 1,800.00 |
| 4 | Adamson University Main Building | 33.40* | 1,900.00 |
| 5 | SM Mall of Asia | 26.80* | 1,800.00 |
| 6 | SM City Bicutan | 6.00* | 1,600.00 |
| Drop-off Location | Mega Pacific Freight Logistics, Inc. | 0.00 | 0.00 |
| Total | 164.50* | 10,800.00 |
* Estimated by Google Maps.
Table 11.
Summary of Revenue for Testing With the Application Software.
| Pick-up Location No. | Pick-up Location | Distance from Previous Location (km) | Rate (Php) |
|---|---|---|---|
| Starting Location | Mega Pacific Freight Logistics, Inc. | 0.00 | 0.00 |
| 0 | Br. Andrew Gonzales Hall | 16.20* | 1,541.00 |
| 1 | University Pad Residences Taft | ||
| 2 | Vista GL Taft by Vista Residences | 2.60 | 793.00 |
| 3 | Adamson University Main Building | 1.50 | 732.50 |
| 4 | Robinsons Place Manila | 1.60 | 738.00 |
| 5 | SM Mall of Asia | 6.90 | 1,029.50 |
| 6 | SM City Bicutan | 11.90 | 1,304.50 |
| Drop-off Location | Mega Pacific Freight Logistics, Inc. | 3.00 | 0.00 |
| Total | 43.70 | 6,138.50 |
* Estimated by Google Maps.
Table 12.
Summary of Gross Profit for Testing With And Without the Application Software.
| Type of Testing | Projected Revenue (Php) | Projected Expenses (Php) | Projected Gross Profit (Php) |
|---|---|---|---|
| Without the Application Software | 10,800.00 | 6,095.63 | 4,704.68 |
| With the Application Software | 6,138.50 | 1,275.86 | 4,862.65 |
Table 13.
Summary of Results Gathered From User Acceptance Survey.
| Category | Survey Item | Mean Score |
|---|---|---|
| User Experience | The application software is user-friendly. | 4.1 |
| The interface of the application software is intuitive and easy to navigate. | 4.0 | |
| Features of the application software will significantly improve workflow efficiency. | 4.4 | |
| Maintenance of Vehicles | The application software will help lessen the strain on vehicles. | 4.6 |
| The application software will contribute to extending the lifespan of the vehicles in the fleet. | 4.7 | |
| Safety | The application software will positively influence the safety of the driver and helper during operations. | 4.4 |
| The route optimization will reduce fatigue and enhance a safer work environment since it will lessen the worry on planning the route ahead manually. | 4.8 | |
| Seamless Navigation | I am satisfied with the accuracy and reliability of the navigation system within the application software. | 4.4 |
| The navigation feature will help avoid delays and optimizes delivery routes effectively. | 4.5 | |
| Optimization in Operations | The application software has significantly reduced the manual efforts required by dispatchers and drivers in logistics operations. | 4.8 |
| Automated processes, such as order processing and inventory management, will improve overall efficiency. | 4.9 | |
| Seamless Integeration | The application software seamlessly integrates with existing systems (return trips and consolidated shipping) in operations. | 4.1 |
Disclaimer/Publisher’s Note: The statements, opinions and data contained in all publications are solely those of the individual author(s) and contributor(s) and not of MDPI and/or the editor(s). MDPI and/or the editor(s) disclaim responsibility for any injury to people or property resulting from any ideas, methods, instructions or products referred to in the content. |
© 2024 by the authors. Licensee MDPI, Basel, Switzerland. This article is an open access article distributed under the terms and conditions of the Creative Commons Attribution (CC BY) license (http://creativecommons.org/licenses/by/4.0/).
Copyright: This open access article is published under a Creative Commons CC BY 4.0 license, which permit the free download, distribution, and reuse, provided that the author and preprint are cited in any reuse.


