
Submitted:
28 August 2024
Posted:
29 August 2024
You are already at the latest version
Abstract
Due to their independent structure, piping, and access, townhouses offer great flexibility in floor plan changes and high spatial autonomy, making them the mainstream housing type in Taiwan. This study focuses on row houses and examines 2022 completion cases in Kaohsiung City. It collects floor plans from 14 newly constructed buildings, totaling 227 units, and analyzes spatial dimensions including facade width, depth, habitable room, staircases, bathrooms, and total floor area for each case. The objective of this study is to examine the spatial layout of row houses in Kaohsiung City, with the aim of providing reference for future planning and design of such structures. The study resulted showed that 81.8% of the row houses analyzed have a total floor area per unit ranging from 136 to 192 m², a facade width between 4.1 and 6.38 meters, and a building depth from 7.67 to 12.68 meters. In addition, low negative correlation between facade width and total floor area, a high positive correlation between building depth and total floor area, and a moderate negative correlation between facade width and building depth. The spatial distribution within these houses includes 78% allocated to habitable room, 13.1% to staircases, and 8.7% to bathrooms. The total area of habitable room and bathrooms increases with the total floor area of the building. However, the total area of staircases remains almost constant as the area of habitable room increases. Furthermore, the most common location for staircase planning is the rear-right (RB) position, while the least common is the rear-left (LB) position. Among various staircase types, the C-shaped staircase has the largest average area per floor and the highest average proportion. Conversely, the I-shaped staircase has the smallest average area and the lowest average proportion. The U-shaped staircase is the most frequently planned, whereas the C-shaped staircase is the least frequently used.
Keywords:
Townhouses
; Principal Spaces
; Spatial Layout
; Relevance
1. Introduction
In Taiwan, Statistics show that nearly 50% of buildings are townhouses. For example, in Kaohsiung City, about 85% of buildings use permits are townhouses. The space in a townhouse primarily consists of habitable room, staircases, and bathrooms. The habitable room serves as the actual living and activity space. Townhouses have the characteristic of being narrow and long, with small floor areas on each level. Developers control the total construction area to meet budget constraints. The characteristics of a townhouse with a narrow and elongated facade result in a limited single-floor area. Builders typically control the total construction area to fit within budget constraints. The elongated space, further constrained by considerations for staircases and bathrooms, presents significant spatial limitations. The size of these elements directly impacts the functional living space within the residence.
Housing is a primary need for human daily activities, and a good living environment contributes significantly to comfort and quality of life. Housing quality is a critical indicator of overall living standards [1,2,3]. In Europe, the development of townhouses or rowhouses has a history of over 1000 years. These structures, prevalent in both rural and urban areas, evolved from the land measurement system "acre" and represent a sustainable architectural prototype. They reflect differences between rural and urban environments, societal, cultural, and economic influences, and enhance community awareness and privacy [4]. In Egypt, townhouses are designed in rows with small gardens. Historically, these structures became the choice of nobility and the wealthy, evolving into luxurious and popular housing units due to design, political, and cultural factors [5]. In Japan, townhouses originated in the medieval period as narrow, street-front shops. These buildings, known as machiya, have a standard width of 5.4 meters and extend backward, creating narrow and deep shop houses typical in traditional urban settings [6]. In Thailand, townhouses typically have a lot area of 64-100 square meters and a total floor area of 83-162 square meters, including 2-4 bedrooms, 2 bathrooms, and parking space. They are particularly favored by middle- and low-income families [7].
Taiwan's residential types have been influenced by both Chinese and Japanese models. During the agricultural period, the concept of separate and live apart led to the development of street houses, which were incrementally divided along roads. This evolved into the townhouse format after 1951. Urban design and planning have since shifted towards increasing density [8]. From 1968 to 1979, townhouses were extensively developed, becoming typical rural housing in Taiwan and predominantly used by the middle class. However, due to population growth and advancements in construction technology, the scale of buildings has gradually expanded. The design type of residential buildings is similar, and it is built in several buildings, rows and quantities (multi-family). The land and building ownership are usually consolidated under a single entity, with complete ownership extending from the ground floor to the top, commonly referred to as "townhouses" or "townhouse residences"
In Taiwan, townhouses typically consist of three to four stories. The evolution of their design is influenced by factors such as family, community structure, construction technology, architectural types, building regulations, and cultural. During the planning phase, developers often focus on maximizing land use efficiency, resulting in townhouse designs that are narrow in width and deep in length. Site planning usually involves designs for single units, paired units, row houses, or community-style layouts. Townhouse are characterized by their frontage facing the road, with partition walls (common walls) on the sides. These structures have clearly defined land boundaries and are connected to neighboring units. Townhouses can be classified into commercial and residential types. The commercial type typically includes a first floor designated for commercial use, with arcade as required by regulations, and residential use on the upper floors. Townhouses, is used solely for residential purposes and is usually priced higher, primarily serving high-income families.
According to statistics from Taiwan's Ministry of the Interior for the year 2018, The total residential type in each city accounts for approximately 49.20%, except for the Taipei metropolitan area. types. The average total floor area of these houses is 170.04 m2, with about 91.15% featuring 4 to 5 bedrooms. Typically, the staircase is located centrally in long-depth houses and is adjacent to the bathroom facilities. Additionally, 40% of families living in townhouses type consist of four members. Row-type townhouses are favored due to their advantages such as property ownership, structural independence, separate utilities, and flexible space adjustments.
Architectural designer often utilizes fundamental principles of geometry to plan the basic shapes of architectural designs. The design process must include the type, form, geometry, and dimensions of the design subject. In the design of row-type townhouses, functional characteristics determine the use of each space. Topology dictates spatial relationships, and form characteristics influence the layout and forms of floor plans. The planning of townhouses must first confirm the building layout and involves interactive adjustments with the building's floor plan. Factors affecting the lot size of townhouses residential site include planning concept, site depth, topography, road conditions, regulations and neighbor relations. Relative influence on the relationship between residential width and depth. In addition, the size of the lot is a primary factor in determining the permissible total floor area. Furthermore, the total building area influences the construction costs of townhouses. Base on, the layout of the lot is the most critical factor affecting the design of townhouses.
The types of building lot layout are classified into six categories: linear, l-shaped, trapezoidal, parallel, c-shaped, and mixed, as shown in Figure 1. The l-shaped configuration accounts for 86% [10]. Figure 1 illustrates that, regardless of the unit type, townhouses predominantly feature middle units, except for the end and corner units. These middle units have common wall on both sides, with natural light coming only from the front and rear. Furthermore, the layout of these units is significantly influenced by parking space, entrance orientation, and stair placement, resulting in a unique layout pattern for townhouse spatial.
In narrow and elongated townhouse residences, the spatial progression is directed along the depth of the building, with the spatial sequence being entrance → living room → dining room → kitchen. In row houses, the " principal spaces " consist of habitable room, stairs, and bathroom facilities. habitable room are designated for residential, work, assembly, recreational, and cooking functions. Stairs provide vertical circulation between floors, while bathrooms serve for sanitation and bathing purposes. Due to the limited base area of each floor, the spatial arrangement is constrained, and considerations for the placement of stairs and bathrooms affect the layout and functionality of the spaces.
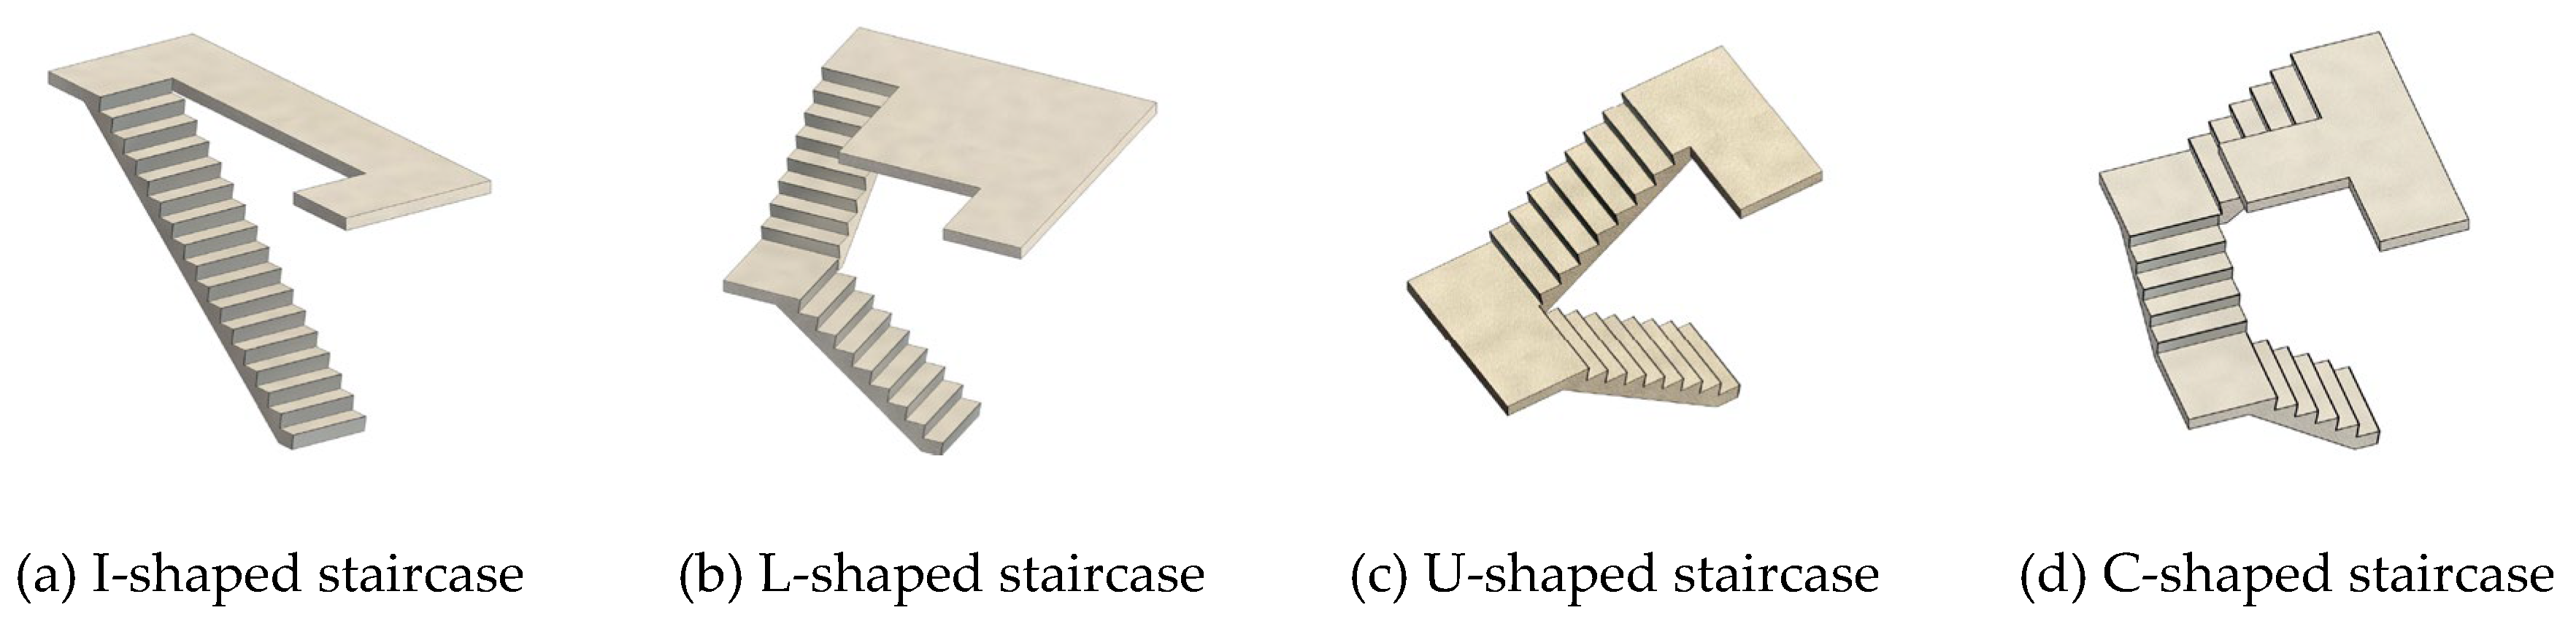
In addition, stairs serve as the vertical circulation path for residents moving between floors. The configuration of stairs types including spiral, straight, and U-shaped stairs. Each type of stair has distinct dimensions for handrails, stair platforms, tread depth, and riser height. Movement on stairs is primarily constrained by the depth of each tread and the height of each riser[11,12,13], which affect the overall stair area. Common stair configurations in townhouses include I-shaped, L-shaped, U-shaped, and C-shaped designs, as illustrated in Figure 3 Bathroom spaces, being the second most critical area in a home, possess characteristics that are not easily modified. The design of bathroom spaces should consider the needs of all household members [14]. The type and size of stairs, as well as the dimensions of bathroom spaces, significantly impact the overall habitable room area and spatial utilization.
Figure 2.
Common staircase types in townhouses.
In Kaohsiung, the widespread design of townhouses began around 1980. About 85% of the new buildings in 2018 are designed as townhouses.. Among these, about 48.18% have a lot size between 61 and 87 m2. The floor width of most building bases is 4.0M, and a building coverage ratio of 50%, the building depth ranges between 7.6 and 10.88 m. This indicates that townhouses characterized by narrow widths, extended depths, and limited single-floor area. Unlike high-rise apartments, townhouses are influenced by external factors such as street width and neighborhood characteristics, as well as internal factors like Building lot width, Floor area size, and floor plan, which significantly affect property value. This study focuses on the spatial layout of townhouses in Kaohsiung, examining the relationship between floor plan shape, principal spaces area, and total floor area to identify designs that meet basic residents' living needs.
2. Materials and Methods
2.1. Research Cases
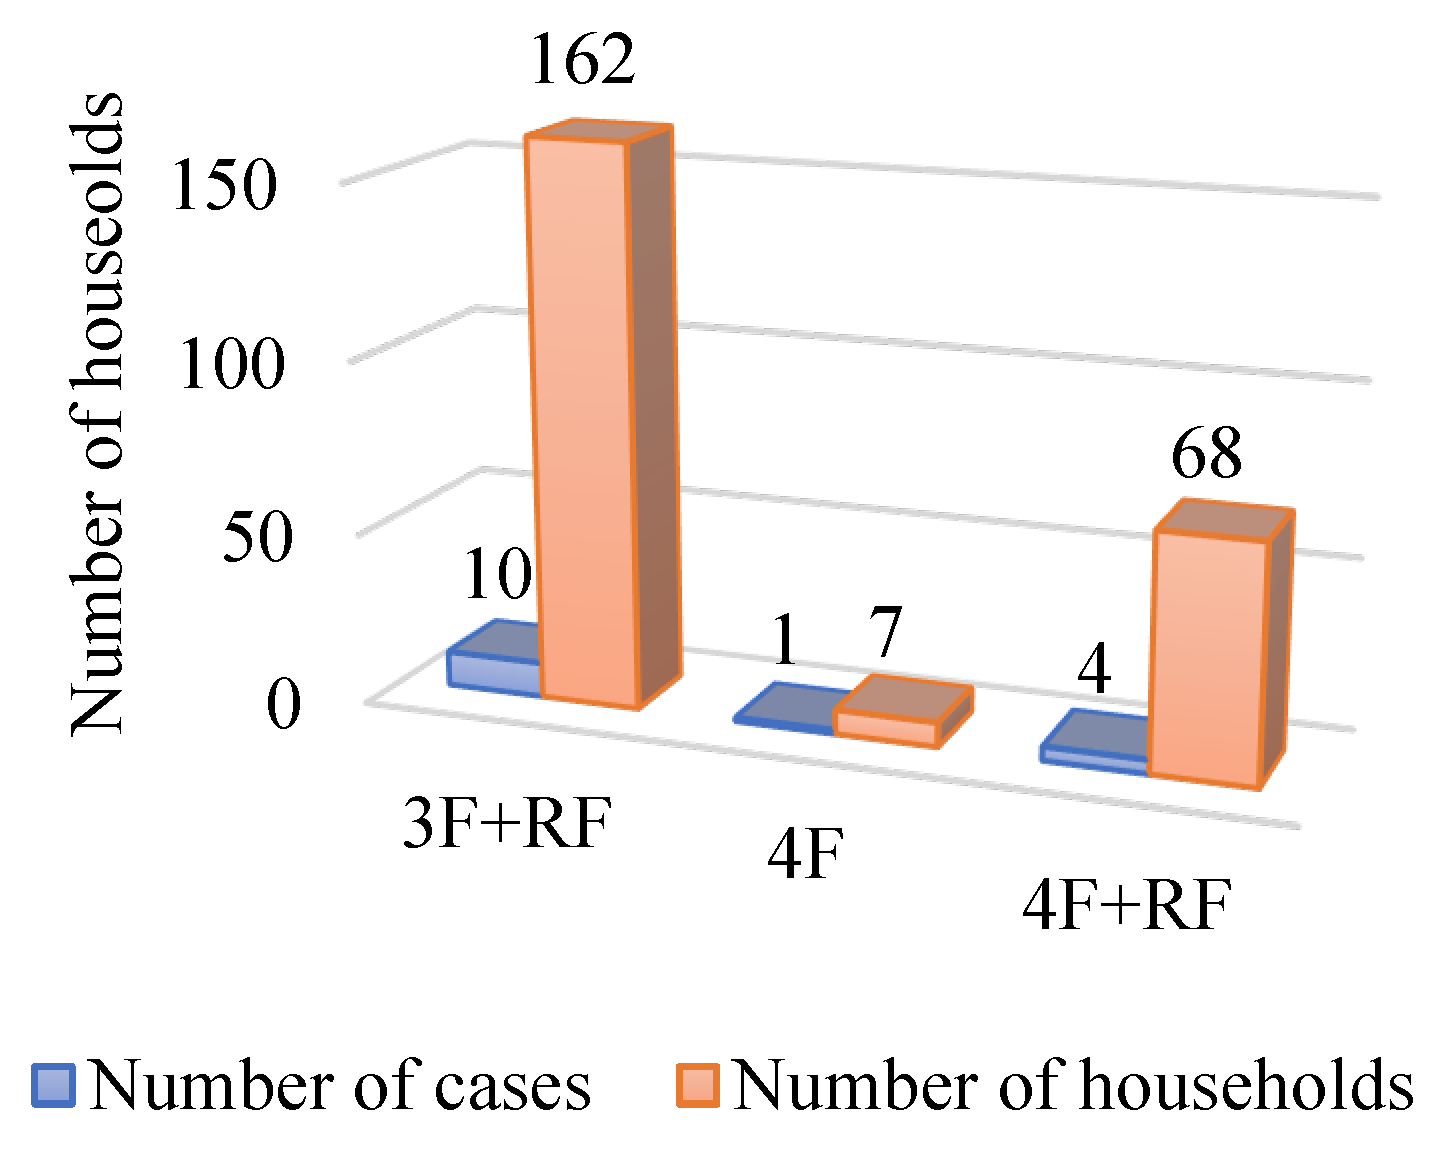
This study collected completion drawings of townhouses in Kaohsiung City from 2022 as case studies. A total of 14 architectural cases were gathered, encompassing 237 units, which represents approximately 14% of the total building cases in 2020. The floor types and unit quantities are depicted in Figure 3.
In Taiwan, common row townhouses are generally designed with three to four floors, and their floor plans typically exhibit a rectangular shape with narrow width and long depth. These townhouses are primarily used for residential purposes. In this study cases has categorized the floor types into three configurations: 3F+RF, 4F, and 4F+RF. Among these, there are 10 architectural cases of 3F+RF with a total of 162 units, 1 architectural case of 4F with 7 units, and 4 architectural cases of 4F+RF with 68 units. In total, there are 14 projects with 15 different floor plans and 237 units. The 3F+RF configuration accounts for 68% of the cases, followed by the 4F+RF configuration at 29%, and the 4F configuration at 3%.
Figure 3.
Floor configurations and number of units.
2.2. Data Analysis
This study investigates the relationships between various floor plan layout of attached townhouses. Then calculates various values such as facade width, depth, and total floor area. Due to the differing number of units across various building cases, weighted averages are computed using the number of units as the weight (wi). The calculation formula is as follows [15,16,17,18,19,20,21].
3. Results
3.1. Characteristics of Shape and Total Floor Area
3.1.1. Mean and Standard Deviation
In the study case, the mean () and standard deviation (σ) of the width, depth, and total floor area are calculated based on weighted counts of units. As shown in Table 1, the mean values for width, depth, and total floor area are 4.86 m, 9.34 m, and 154.81m2, respectively. The corresponding standard deviations are 0.76, 1.67, and 18.79
3.1.2. Limit Values and Normal Distribution
The minimum and maximum values for building width, depth, and total floor area were shown in Figure 4. The minimum width is 4.0 m and the maximum width is 6.3 m; the minimum depth is 7.3 m and the maximum depth is 11.4 m; the minimum total floor area is 142.94 m2 and the maximum total floor area is 217.96 m2. Consequently, the width of terraced townhouses ranges between 4.0 to 6.3 m, the depth ranges from 7.3 to 11.4 m, and the total floor area varies between 142.94 and 217.96 m2.
The normal distribution of building cases for width, depth, and total floor area is illustrated in Figure 5. It shows that the majority of values for width, depth, and total floor area fall within the range of the mean () plus or minus one standard deviation (±σ) and up to two standard deviations (+2σ), i.e., ( ± σ) and ( + 2σ). It is evident that the values for width, depth, and total floor area do not appear within the range of the mean minus two standard deviations ( - 2σ). Most of the observed values are located to the right of the mean, and the distribution exhibits left skewness, indicating a negative skewness.
Based on calculations using the mean ± one standard deviation and the mean + two standard deviations, specifically ( ± σ) and ( + 2σ), the range of the facade width, depth, and total floor area of the attached townhouses, as shown in Table 2, indicates that there is an 81.8% probability that the facade width will fall between 4.1 and 6.38 m, the depth between 7.67 and 12.68 m, and the total floor area between 136.02 and 192.39 m2.
3.2. Correlation Analysis
3.2.1. Correlation Coefficient
The correlation coefficients r for factors such as facade width, depth, total staircase area, total bathroom area, habitable room area, and total floor area of building cases in this study were shown in Table 3. It were indicated that the correlation between facade width and depth is relatively high, with a coefficient of -0.5, which is considered moderately correlated. The correlation between facade width and total floor area is low, with a coefficient of -0.04, which is considered weak and is the lowest overall correlation.
The depth of interior space has a higher correlation with both total habitable room area and total floor area, with coefficients of 0.75, indicating a high correlation. The correlation between depth and total bathroom, area is low, with a coefficient of 0.16, indicating a weak correlation. The total staircase area has a higher correlation with the total habitable room area, with a coefficient of -0.43, which is moderately correlated. The correlation between total staircase area and total bathroom area is low, with a coefficient of 0.09, indicating a weak correlation. The correlation between total bathroom area and total floor area is 0.39, which is the highest correlation but still considered moderate. The correlation between total bathroom area and total living area is low, with a coefficient of 0.14, indicating a weak correlation.
Overall, the correlation between total habitable room area and total floor area is 0.96, the highest overall correlation, approaching 1, indicating a nearly perfect positive correlation, which means that as the total floor area of a multi-story residential building increases, the habitable room area also increases. The correlation between facade width and total floor area is -0.04, the lowest overall correlation, indicating almost no correlation, showing that the size of the total floor area of a multi-story residential building is unrelated to its facade width.
3.2.2. Width, Depth, and Total Floor Area Ratio Correlation
In Figure 6, the coefficient of determination (R2) between building width and total floor area is 0.0018, it indicates that there is no significant linear relationship between building width and total floor area. Furthermore, the correlation coefficient (r) between building width and total floor area, as shown in Table 3, is -0.04, reflecting a low negative correlation with no significant association. The primary reason for this weak correlation is that the design of townhouses typically starts with building lot layout. Building width is mainly influenced by factors such as economic conditions of the era, regional land prices, and building lot conditions, resulting in a low correlation with total floor area.
Figure 6 demonstrates that the coefficient of R² for the correlation between depth and total floor area is 0.5571, indicating a strong linear relationship. Additionally, Table 3 shows that the correlation coefficient (r) between depth and total floor area is 0.75, representing a high positive correlation. This implies that total floor area of townhouses increases with depth. This phenomenon may be attributed to the depth of townhouses is influenced by width, plot area, and building coverage ratio. With a minimum acceptable width of 4.0 for townhouses, further reduction is not feasible. Consequently, in cases where the depth of the plot is extensive and nearing saturation to optimize the coverage ratio, the increased plot depth results in a larger ground floor area, which subsequently increases the total floor area. Furthermore, the preference of Taiwanese residents for townhouses with greater depth further strengthens the positive correlation between depth and total floor area in such buildings.
The relationship between building width and depth, as shown in Figure 7, has a coefficient of R² of 0.2604, which is less than 0.5, indicating a weak linear relationship. Table 3 displays the correlation coefficient (r) between width and depth as -0.51, suggesting a moderate negative correlation. This implies that the depth of a townhouse decreases as the width increase. The reason for this trend is that townhouses, typically three to four floor on Taiwan, have their width and depth determined by factors such as layout plans, site conditions, and construction costs. Each floor has a specific range of area, so when the width increases, the depth is usually reduced to keep the total floor area within a controlled range.
3.2.3. Relationship between Interior Space Area and Total Floor Area in Buildings
Figure 8 shown the average floor area of each floor were divided into the first floor 48.70M2, the second floor 46.10M2, the third floor 45.36M2, the fourth floor 41.63M2 and the roof floor 21.63M2. Floor area gradually decreases as floors increase. The overall average proportions of space in the building are as follows: bathrooms account for 8.7%, stairs for 13.1%, and habitable room for only 78.2%. The average proportion of bathroom space is highest on the third floor at 13.5% and lowest on the first floor at 6.4%. The average proportion of stair space is highest on the fourth floor at 14.4% and lowest on the first floor at 8.2%. The average proportion of habitable room space is highest on the first floor at 85.3% and lowest on the fourth floor at 72.7%.
Figure 8 also shows that the average proportion of bathroom space on the first floor is 6.4%, and the average proportion of stair space is 8.2%, both of which are the lowest among all floors. Consequently, the first floor has the highest proportion of habitable room space at 85.3%. This is because the first floor of a terraced house typically serves as the starting point for the stairs, resulting in a smaller stair area. This floor is often designed for vehicle parking with limited living space, and the bathrooms are usually have no shower facilities, which contributes to a larger habitable room area. The fourth floor has the highest proportions of stair and bathroom space at 14.4% and 13.5%, respectively. Therefore, the average proportion of habitable room space on this floor is only 72.7%, the lowest among all floors. This is primarily because the total floor area of the fourth floor is reduced, rather than an increase in the stair and bathroom areas.
As shown in Figure 9, the coefficient of determination (R2) between the total stair area and the total floor area is 0.0666, which is greater than 0.5, indicating a weak linear relationship. Additionally, Table 3 shows a correlation coefficient (r) of -0.26 between the total stair area and the total floor area, demonstrating a low negative correlation. This implies that as the total floor area of the building increases, the stair area does not increase correspondingly but tends to decrease. The area of the stairs is determined by the number of steps, tread depth, stair width, and landing area. The number of steps is decided by the floor height. In typical townhouses, the floor height of the living and dining room level is generally higher than that of other floors, ranging from 3.4 to 3.6 m, while other floors are around 3.0 to 3.2 m. Consequently, the number of steps varies between 15 and 23 steps. The tread depth and stair width are regulated by building codes, with little variation beyond the minimum requirements. The landing area is crucial in determining the type and size of the stairs. Therefore, the stair area does not increase with the total floor area but is determined by the stair design. When the building's total floor area increases due to wider or deeper plots, ample space may allow for staircases without intermediate landings or changes in stair design, directly connecting different floors and reducing the proportion of the stair area. Hence, as the total floor area increases, the proportion of the stair area decreases.
As shown in Figure 9, the coefficient of determination (R2) between the total habitable room area and the total floor area is 0.9162, which is greater than 0.5. Additionally, Table 3 shows a correlation coefficient (r) of 0.96 between the total habitable room area and the total floor area, indicating a strong positive linear relationship between the two variables. This means that the total habitable room area increases with the total floor area. The reason for this is that in the real estate market, when projects with high total floor area (such as luxury houses) are introduced, the bathroom area also increases. However, the primary selling point is the increase in the total habitable room area, which provides more space for daily activities and living comfort.
3.3. Staircase Planning
3.3.1. Staircase Locations on Each Floor
The schematic diagram of the ground floor layout for a townhouse, as shown in Figure 10, divides the building's width (x-direction) into left and right sides and its depth (y-direction) into front, middle, and rear sections when facing the road from inside the house. Consequently, the single-story floor plan is divided into six zones: left front (LF), right front (RF), left middle (LM), right middle (RM), left rear (LB), and right rear (RB). The location of the staircase on each floor is calculated accordingly, and if there is an intermediate landing, its position is counted twice.
The positions of each floor in the case studies are shown in Figure 11. Regardless of the floor level, the highest proportion of staircase planning occurs at the rear-right (RB) position. This is especially evident on the first floor, where the number of cases with staircases planned at the rear-right (RB) is the highest. This phenomenon can be attributed to Taiwanese customs, where the main entrance is traditionally placed on the left side (the "dragon side"), resulting in the main circulation path being on the left. Thus, positioning the staircase on the right side optimizes space. It is common for townhouses to have parking spaces on the first floor, requiring a deeper layout to accommodate vehicles, which pushes the staircase position to the rear.
On the second floor, most spaces are used as living rooms, dining areas, and kitchens. If the layout is open and has good visibility, it creates a spacious feeling interior, which enhances sales opportunities. This layout results in the highest number of staircase cases at the rear-right (RB) position. The second most common position for staircases is the rear-middle (RM) on the second and third floors. This is primarily due to the fact that townhouses, except for the first and last units and corner units, are mostly middle units. Middle units have common wall on both the left and right sides, with lighting available only at the front and rear. Positioning the staircase in the middle allows for windows in the front and rear sections, which can be used as bedrooms[22], thus fulfilling the spatial needs of townhouses.
3.3.2. The Area and Proportion of Each Ladder Type
The frequency of planning, area, and proportion of each staircase type are shown in Figure 12. The average area and average proportion of various types of staircases, ranked from lowest to highest, are as follows: I-type staircases with 3.78 m² and 9.2%, L-type staircases with 4.13 m² and 10.4%, U-type staircases with 5.20 m² and 11.4%, and C-type staircases with 5.51 m² and 12.9%. The frequency of planning, from highest to lowest, is as follows: U-type staircases 48 times, I-type staircases 8 times, L-type staircases 7 times, and C-type staircases 4 times. This indicates that I-type staircases have the smallest average area and proportion, while C-type staircases have the largest average area and proportion. U-type staircases are the most frequently planned, with 48 instances, indicating that U-type is the most commonly used.
The frequency of stair type planning for each floor is illustrated in Figure 13. Among the different floor types, U-shaped stairs are the most commonly planned. This preference is likely due to the linear floor plan configuration of townhouses with only front and rear illumination. When a U-shaped stair is positioned in the middle or rear section of the floor plan, it creates front and rear living spaces, thereby shortening circulation paths and optimizing space utilization. In contrast, I-shaped stairs are less common because their midsection lacks a landing, making them more difficult to navigate. However, due to their minimal area and proportion, I-shaped stairs are often found in spaces such as stair transition levels, rooftops, and first floors. L-shaped stairs, planned five times on the first floor, are chosen due to their relatively small area (slightly larger than I-shaped stairs) and the design's suitability for wall-side placement. They also provide additional space for vehicle parking and improve accessibility. The C-shaped stair, despite its largest area and proportion, is the least frequently planned type.
4. Conclusions
This study examines 14 cases of townhouses in Kaohsiung City, completed in 2022, with 15 different floor plans as research samples, totaling 237 unit plans. The research investigates the spatial configuration types of townhouses. The conclusions of the study are as follows.
- (1)
- For townhouses, the architectural planning of each unit shows an 81.8% probability that the width, depth, and total floor area will fall within the following ranges: width between 4.1 and 6.38 m, depth between 7.67 and 12.68 m, and total floor area between 136.02 and 192.39 m2.
- (2)
- The width of the building exhibits a low negative correlation with the total floor area; that is, while a larger width tends to be associated with a smaller total floor area, the correlation is not pronounced. In contrast, the depth of the building shows a high positive correlation with the total floor area, meaning that greater depth is strongly associated with a larger total floor area. Additionally, the width and depth of the building are moderately negatively correlated, indicating that a larger width tends to be associated with a shorter depth.
- (3)
- The primary internal space allocations within a building are as follows: habitable room areas account for 78%, stairs constitute 13.1%, and bathrooms represent 8.7%. Both the total area of habitable room spaces and bathrooms increase with the expansion of the total floor area, while the total area of stairs remains constant.
- (4)
- The most frequently planned stair location is the right rear (RB), followed by the right middle (RM), with the least frequent being the left rear (LB). The average area and proportion of each stair type, ordered from smallest to largest, are as follows: I-shaped stairs, L-shaped stairs, U-shaped stairs, and C-shaped stairs. The frequency of planning each stair type, from highest to lowest, is as follows: U-shaped stairs, I-shaped stairs, L-shaped stairs, and C-shaped stairs.
- (5)
- In the research cases, the highest proportion of staircases across various floors are planned for the right rear (RB) position, followed by staircases on the right middle (RM) in the second and third floors. This trend is primarily due to the prevalence of middle units in townhouses, with fewer units at the head, tail, and corners. Middle units are characterized by partition walls on the left and right sides, with natural lighting limited to the front and rear faces. By positioning the staircase in the central section, windows can be placed in the front and rear sections to provide lighting, optimizing the space for bedrooms and fulfilling the spatial needs of townhouses.
References
- S. Asnur, M. Ardi, M. Mandra, and S. Ahsan, "Resident’s Satisfaction Level on the Quality of the Row House and the Environment," 2021.
- Mohit, M.A.; Azim, M. Assessment of residential satisfaction with public housing in Hulhumale’, Maldives. Procedia-Social and Behavioral Sciences 2012, 50, 756–770. [Google Scholar] [CrossRef]
- Tacoral, E.; Atik, A.; Yilmaz, B.; Aslan, F.; Altunkasa, M.F. A sustainability assessment of quality of life in a traditional settlement pattern: The case of Kemaliye, Turkey. Indoor and Built Environment 2017, 26, 456–470. [Google Scholar] [CrossRef]
- Bartuska, T. The evolution of the townhouse and its role in creating sustainable communities. International Journal of Design & Nature and Ecodynamics 2013, 8, 300–310. [Google Scholar]
- Ahmed, M.; Mahmoud, O.M. The concept of Independent Houses between (Twin House & Town House). International Design Journal 2022, 12, 415–429. [Google Scholar]
- H. Izumdia, "Machiya: A typology of Japanese townhouses," in University of Tsukuba Conference: 1st TTCL Annual Symposium, At Melaka, 2011, vol. 2011, p. 6.
- B. Natakun and N. Suchai, "Rethinking Affordable Row House Design for Multi-generational Lower Middle-income Family in Developing Countries: A Case Study of Bangkok, Thailand.
- Bolton, L.T. Space Ratio: A measure of density potentials in the built environment. Sustainable Cities and Society 2021, 75, 103356. [Google Scholar] [CrossRef]
- Çaǧdaş, G. A shape grammar model for designing row-houses. Design Studies 1996, 17, 35–51. [Google Scholar] [CrossRef]
- Wu Ki-zheng, "A Study on the Actual Condition of 'Transparent Houses' in the Kaohsiung Region: "Area Composition of Residential Buildings and Dwelling Units and Lamination of Rooms," 2011.
- Fang, Z.-M.; et al. Experimental study on evacuation process in a stairwell of a high-rise building. Building and environment 2012, 47, 316–321. [Google Scholar] [CrossRef]
- J.-y. Wang, J. Ma, M. Sarvi, T. Chen, and X.-m. Hu, "How stair configurations in buildings affect pedestrian dynamics on stairs? A simulation study via an extended three-dimensional force-based model," 2023.
- Afifi, M.; Parke, B.; Al-Hussein, M. Integrated approach for older adult friendly home staircase architectural design. Automation in Construction 2014, 39, 117–125. [Google Scholar] [CrossRef]
- DeMerchant, E.A.; Beamish, J.O. Universal design in residential spaces. Housing and Society 1995, 22, 77–91. [Google Scholar] [CrossRef]
- Campbell, C.E.; Rukhin, A.L. Evaluation of self-diffusion data using weighted means statistics. Acta materialia 2011, 59, 5194–5201. [Google Scholar] [CrossRef]
- Groeneveld, R.A.; Meeden, G. Measuring skewness and kurtosis. Journal of the Royal Statistical Society Series D: The Statistician 1984, 33, 391–399. [Google Scholar] [CrossRef]
- N. Johnson and S. Kotz, "Balakrishnan., N.(1994). Continuous univariate distributions (Vol. 1)," New Yor: Wiley.
- H. Mac Gillivray, "Shape properties of the g-and-h and Johnson families," Communications in statistics-theory and methods, vol. 21, no. 5, pp. 1233–1250, 1992.
- Lee, D.K.; In, J.; Lee, S. Standard deviation and standard error of the mean. Korean journal of anesthesiology 2015, 68, 220. [Google Scholar] [CrossRef] [PubMed]
- Asuero, A.G.; Sayago, A.; González, A. The correlation coefficient: An overview. Critical reviews in analytical chemistry 2006, 36, 41–59. [Google Scholar] [CrossRef]
- J. R. Benjamin and C. A. Cornell, Probability, statistics, and decision for civil engineers. Courier Corporation, 2014.
- Yi, L.Y.; Ren, Z.B.; Yu, C.Z.; Lu, L.K.; Ting, H.X. The Effects of Different Staircase Rooftop Baffles on Natural Ventilation Efficiency with Townhouse. Journal of Architecture 2019, 110, 9–20. [Google Scholar] [CrossRef]
Figure 1.
Townhouse Building Lot Layout Types [10].
Figure 1.
Townhouse Building Lot Layout Types [10].
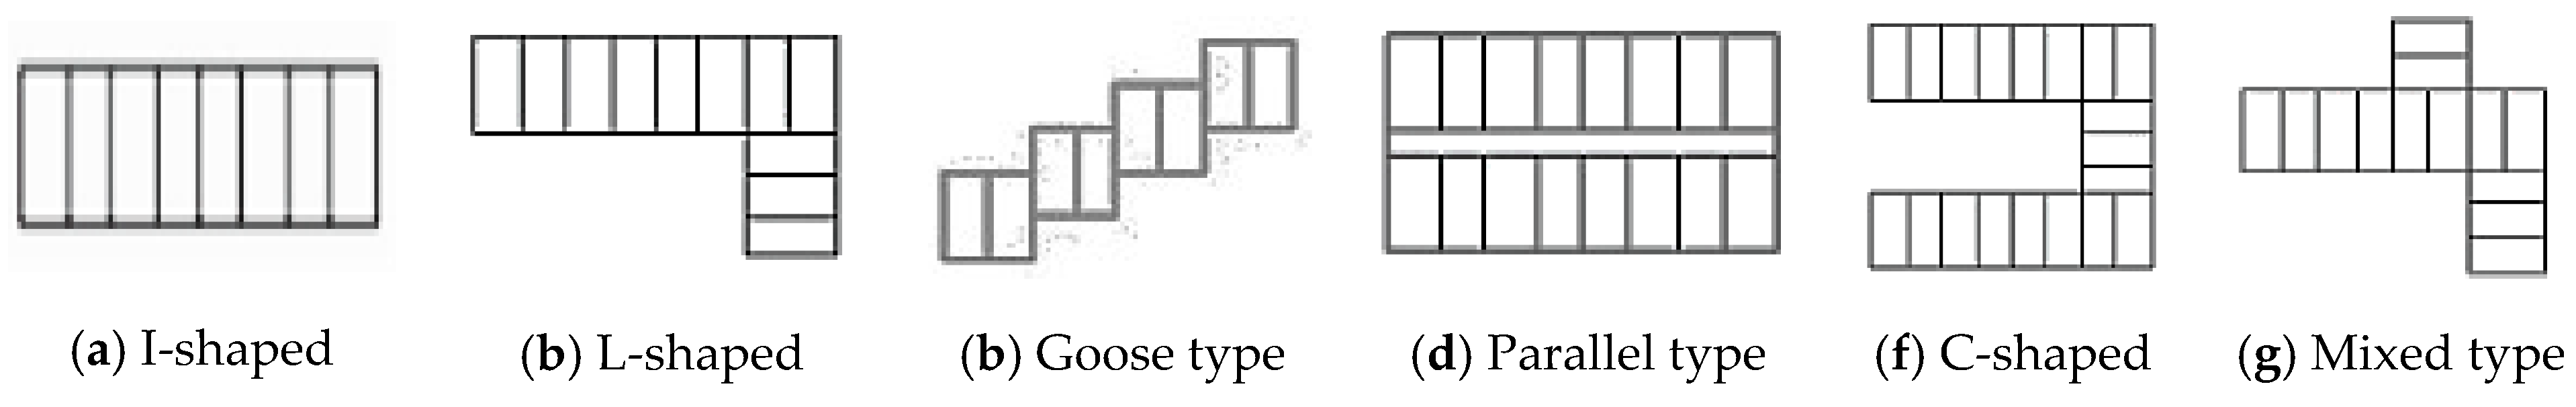
Figure 4.
Minimum and maximum values of building width, depth, and total floor area.
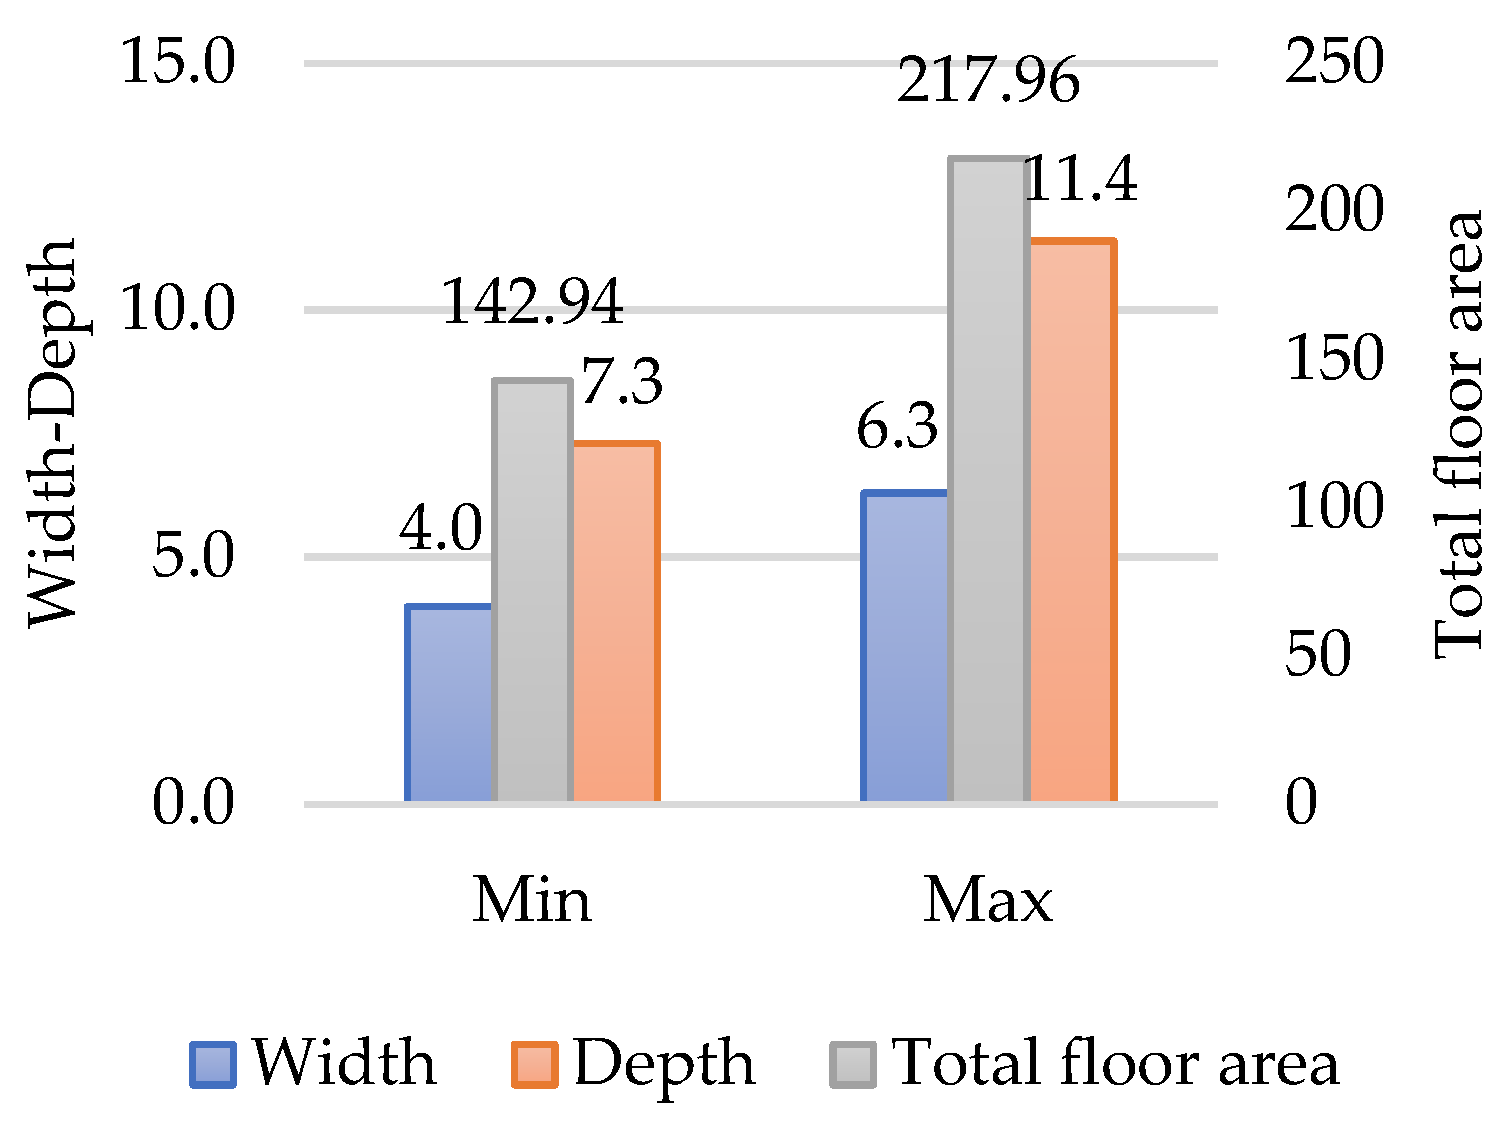
Figure 5.
Normal distribution of building width, depth, and total floor area.
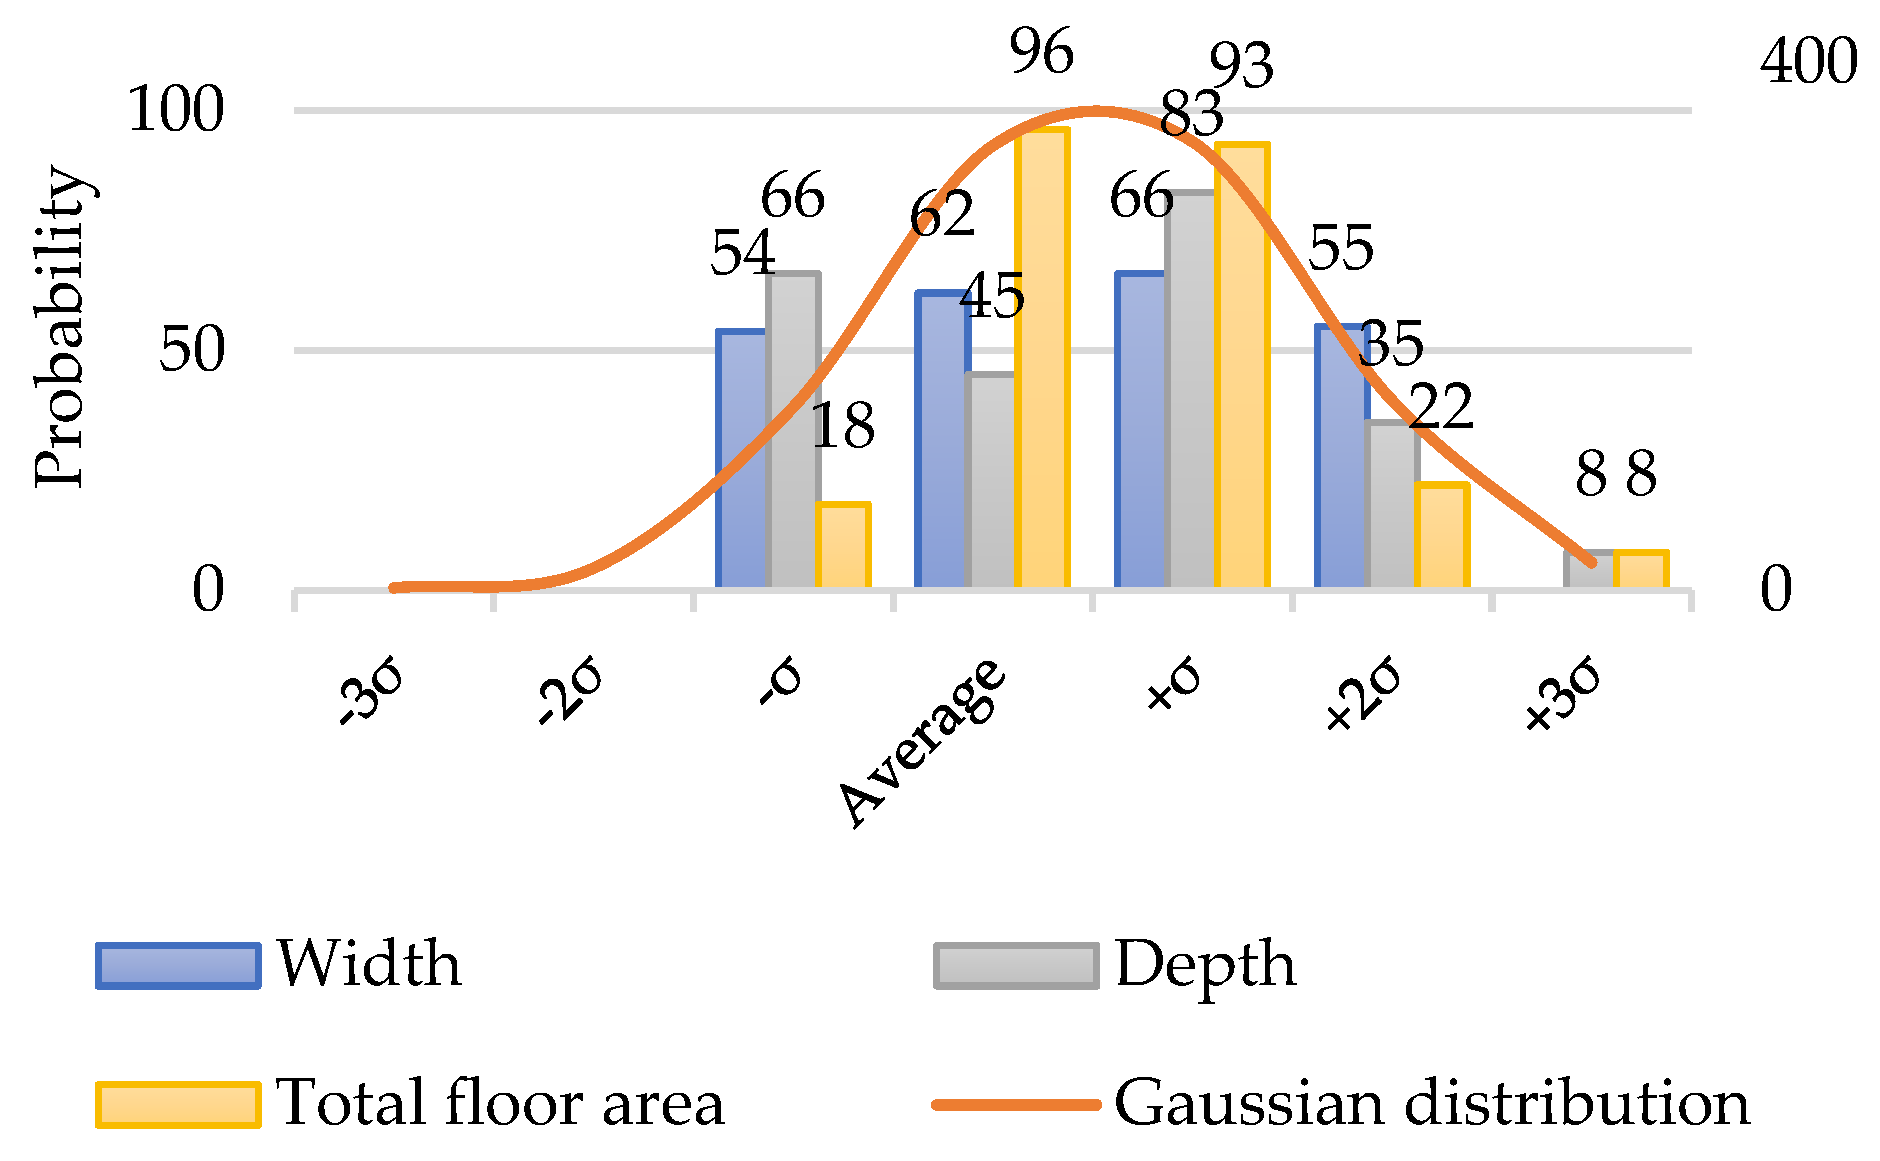
Figure 6.
Correlation between building width, depth, and total floor area.
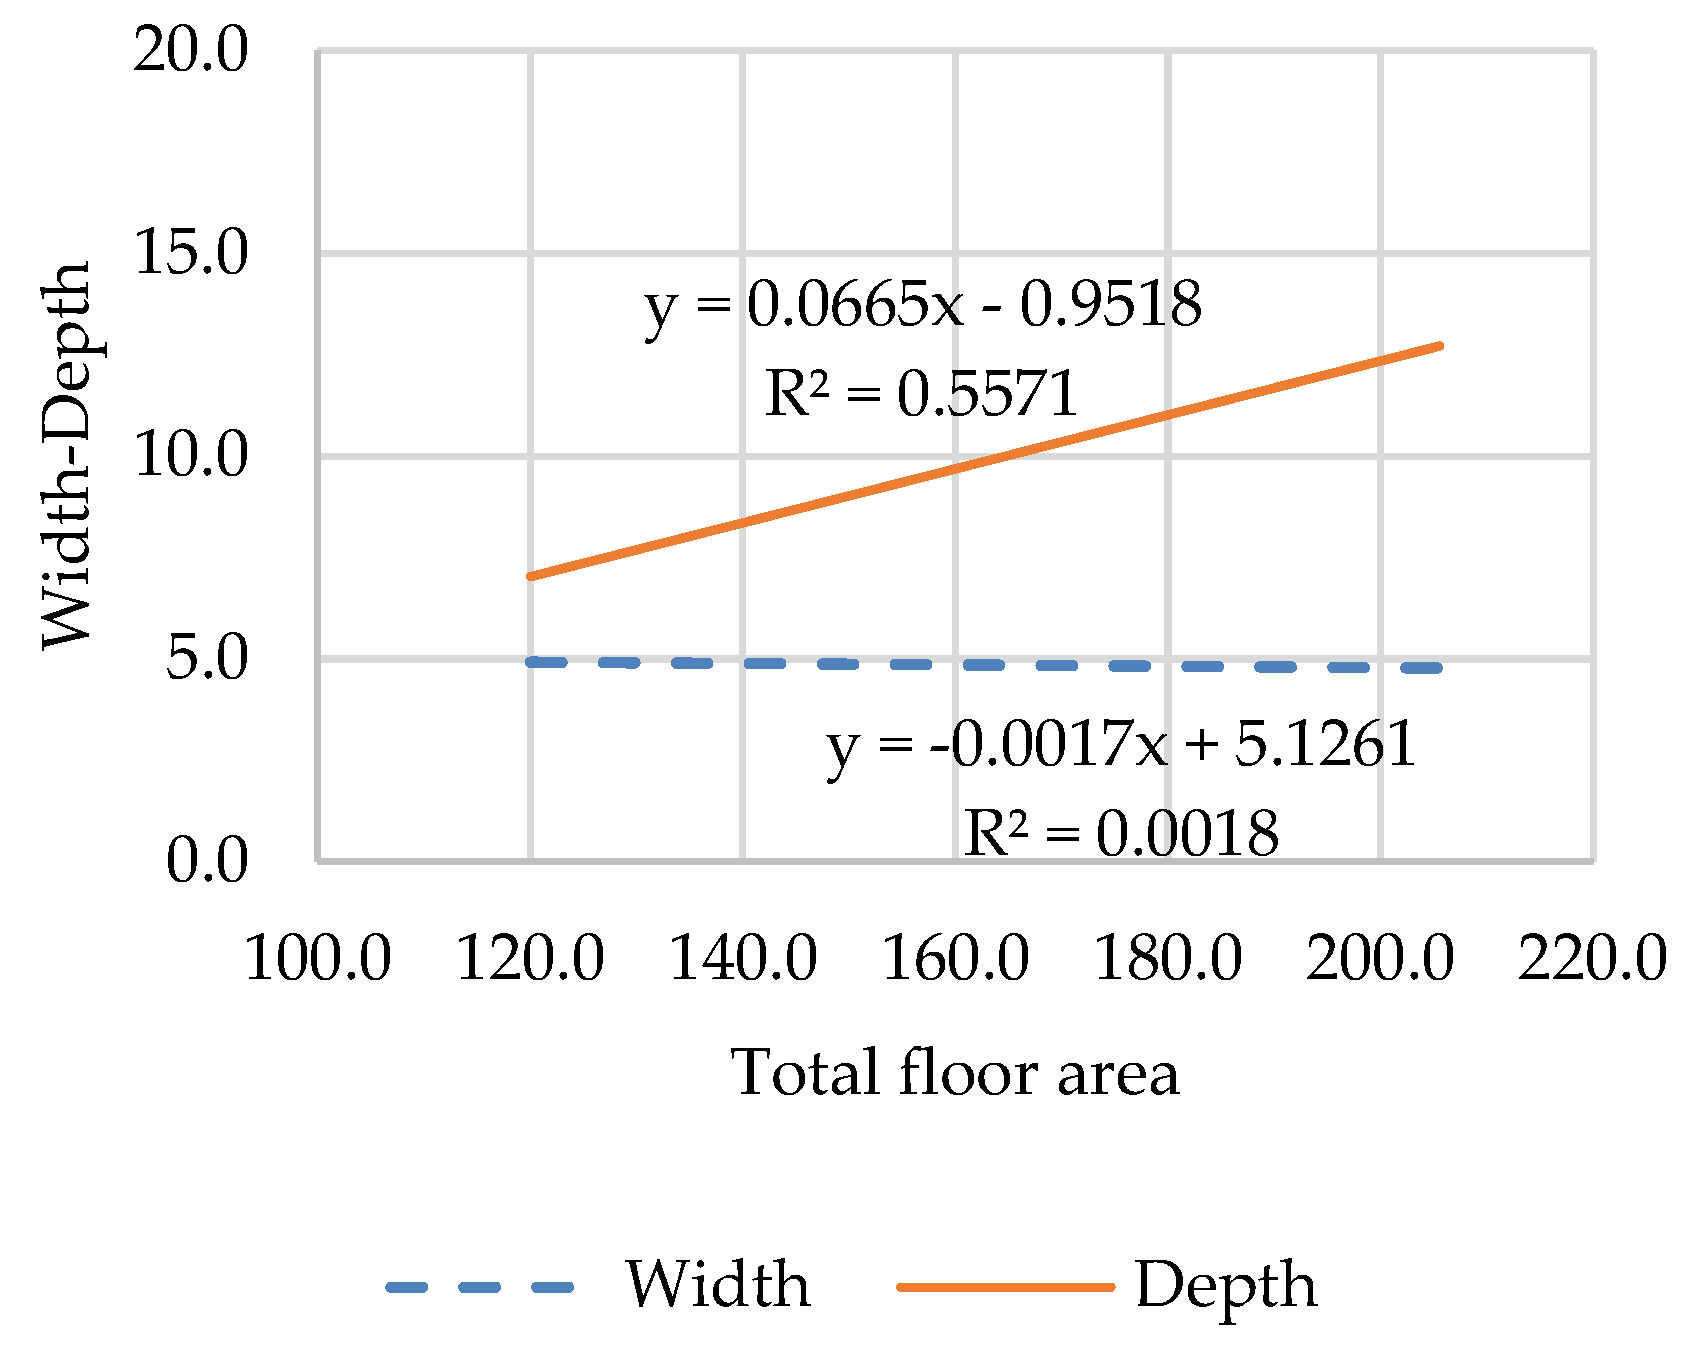
Figure 7.
Correlation between building width and depth.
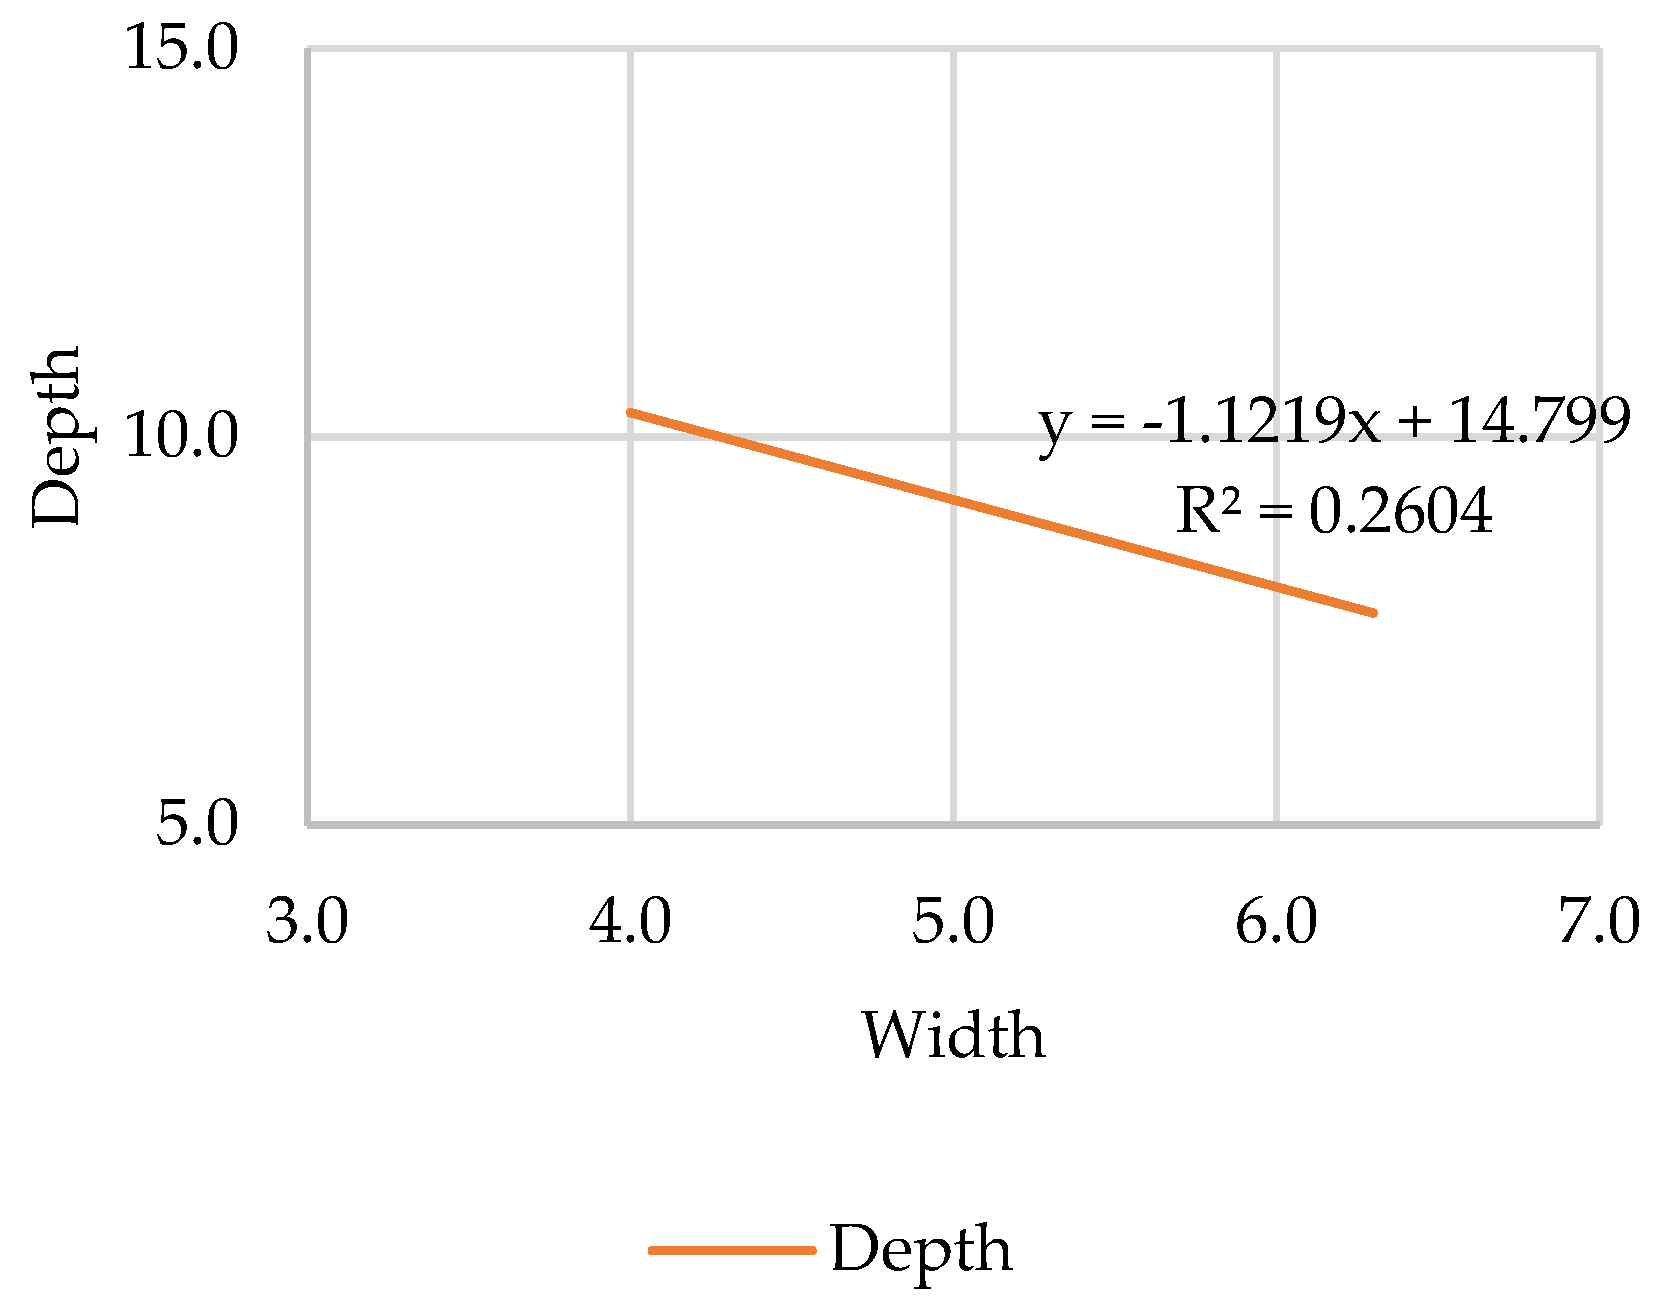
Figure 8.
Proportion of main space and average floor area.
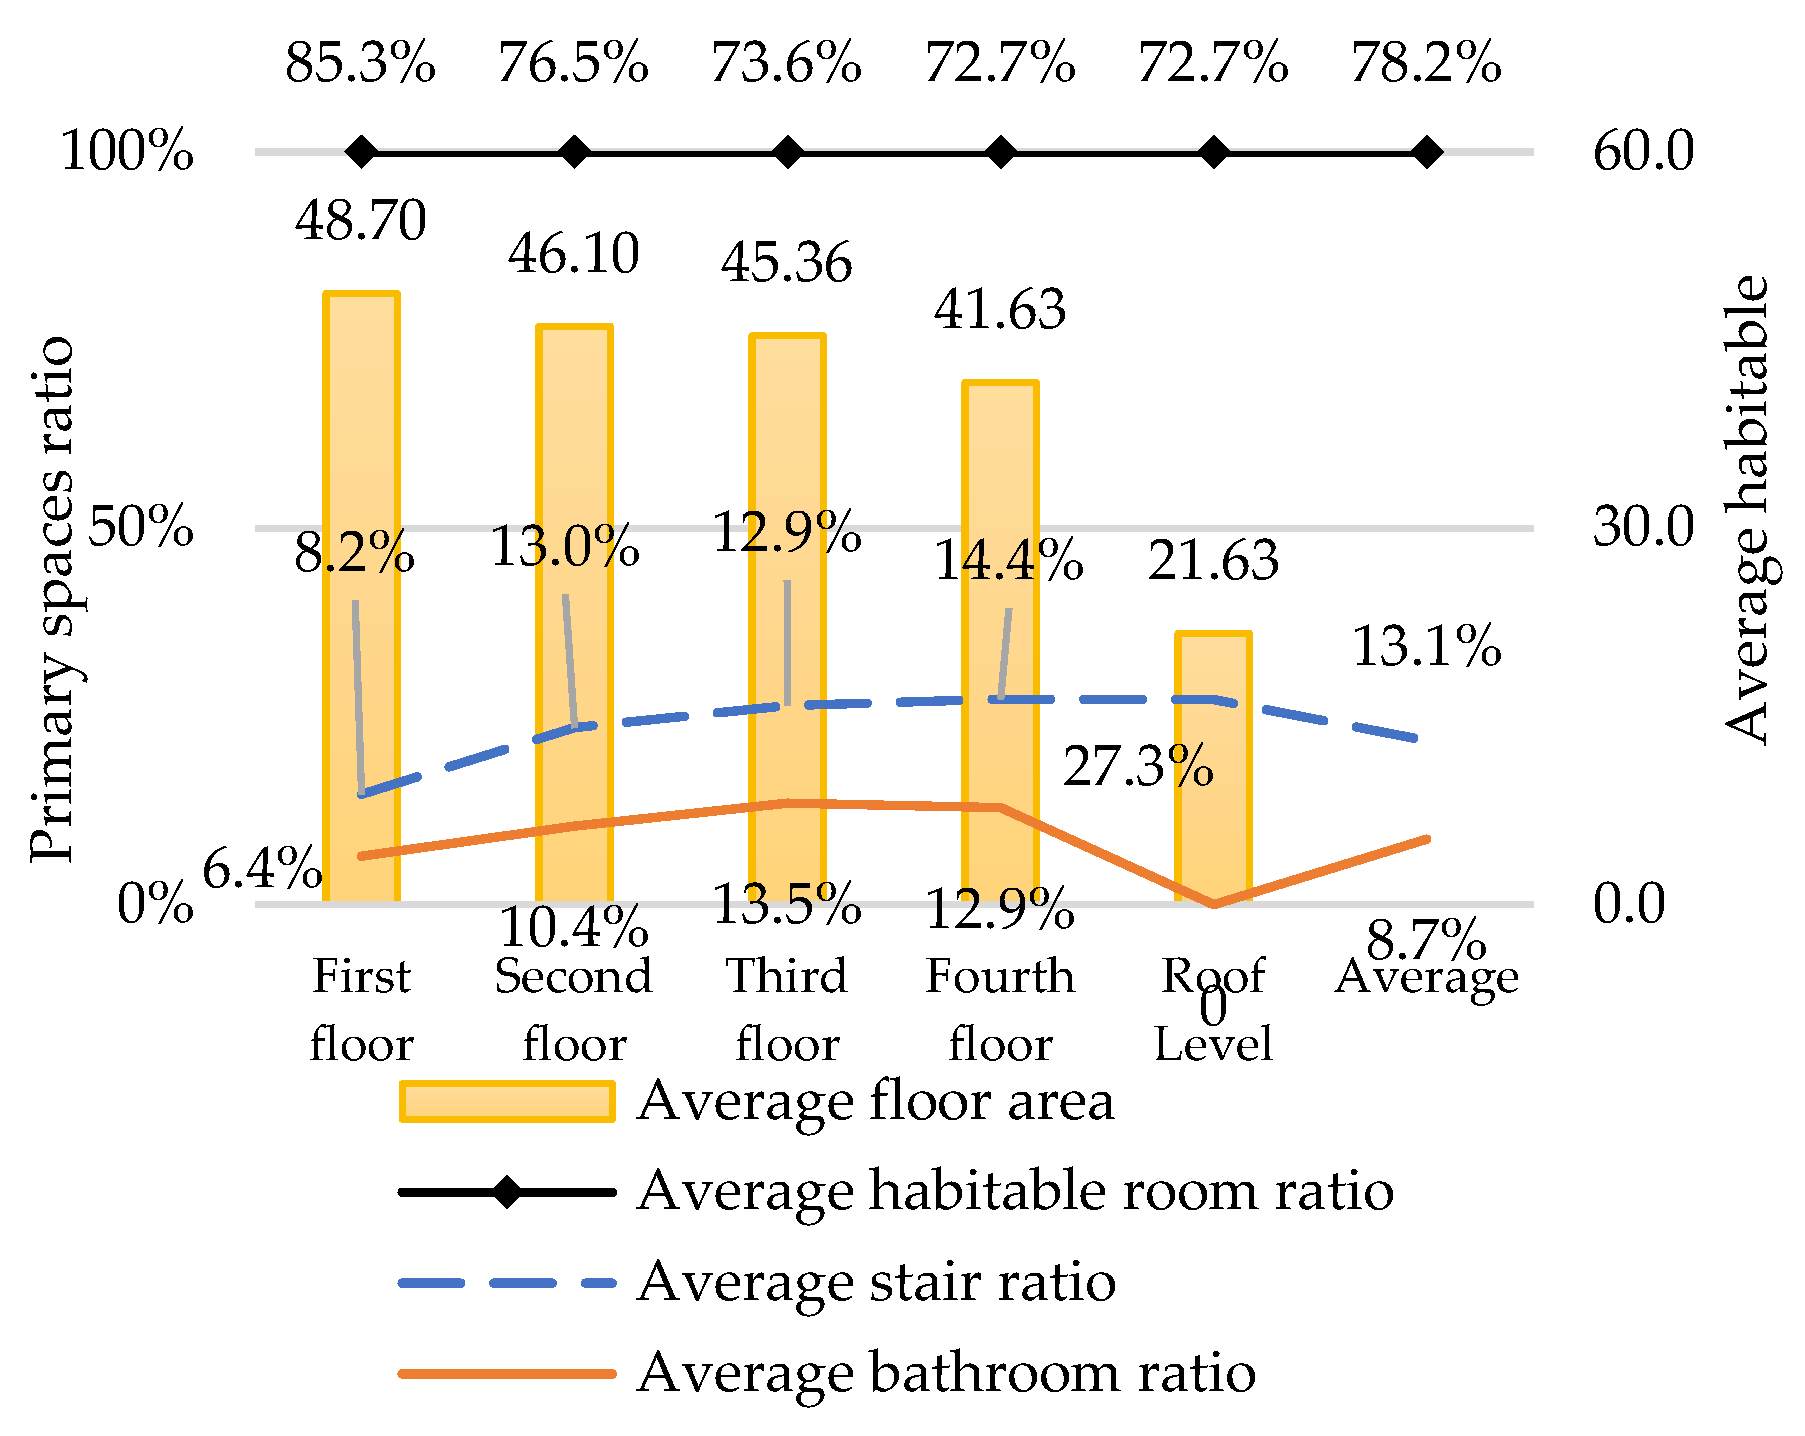
Figure 9.
Coefficient of determination between the main space and the floor of the main building.
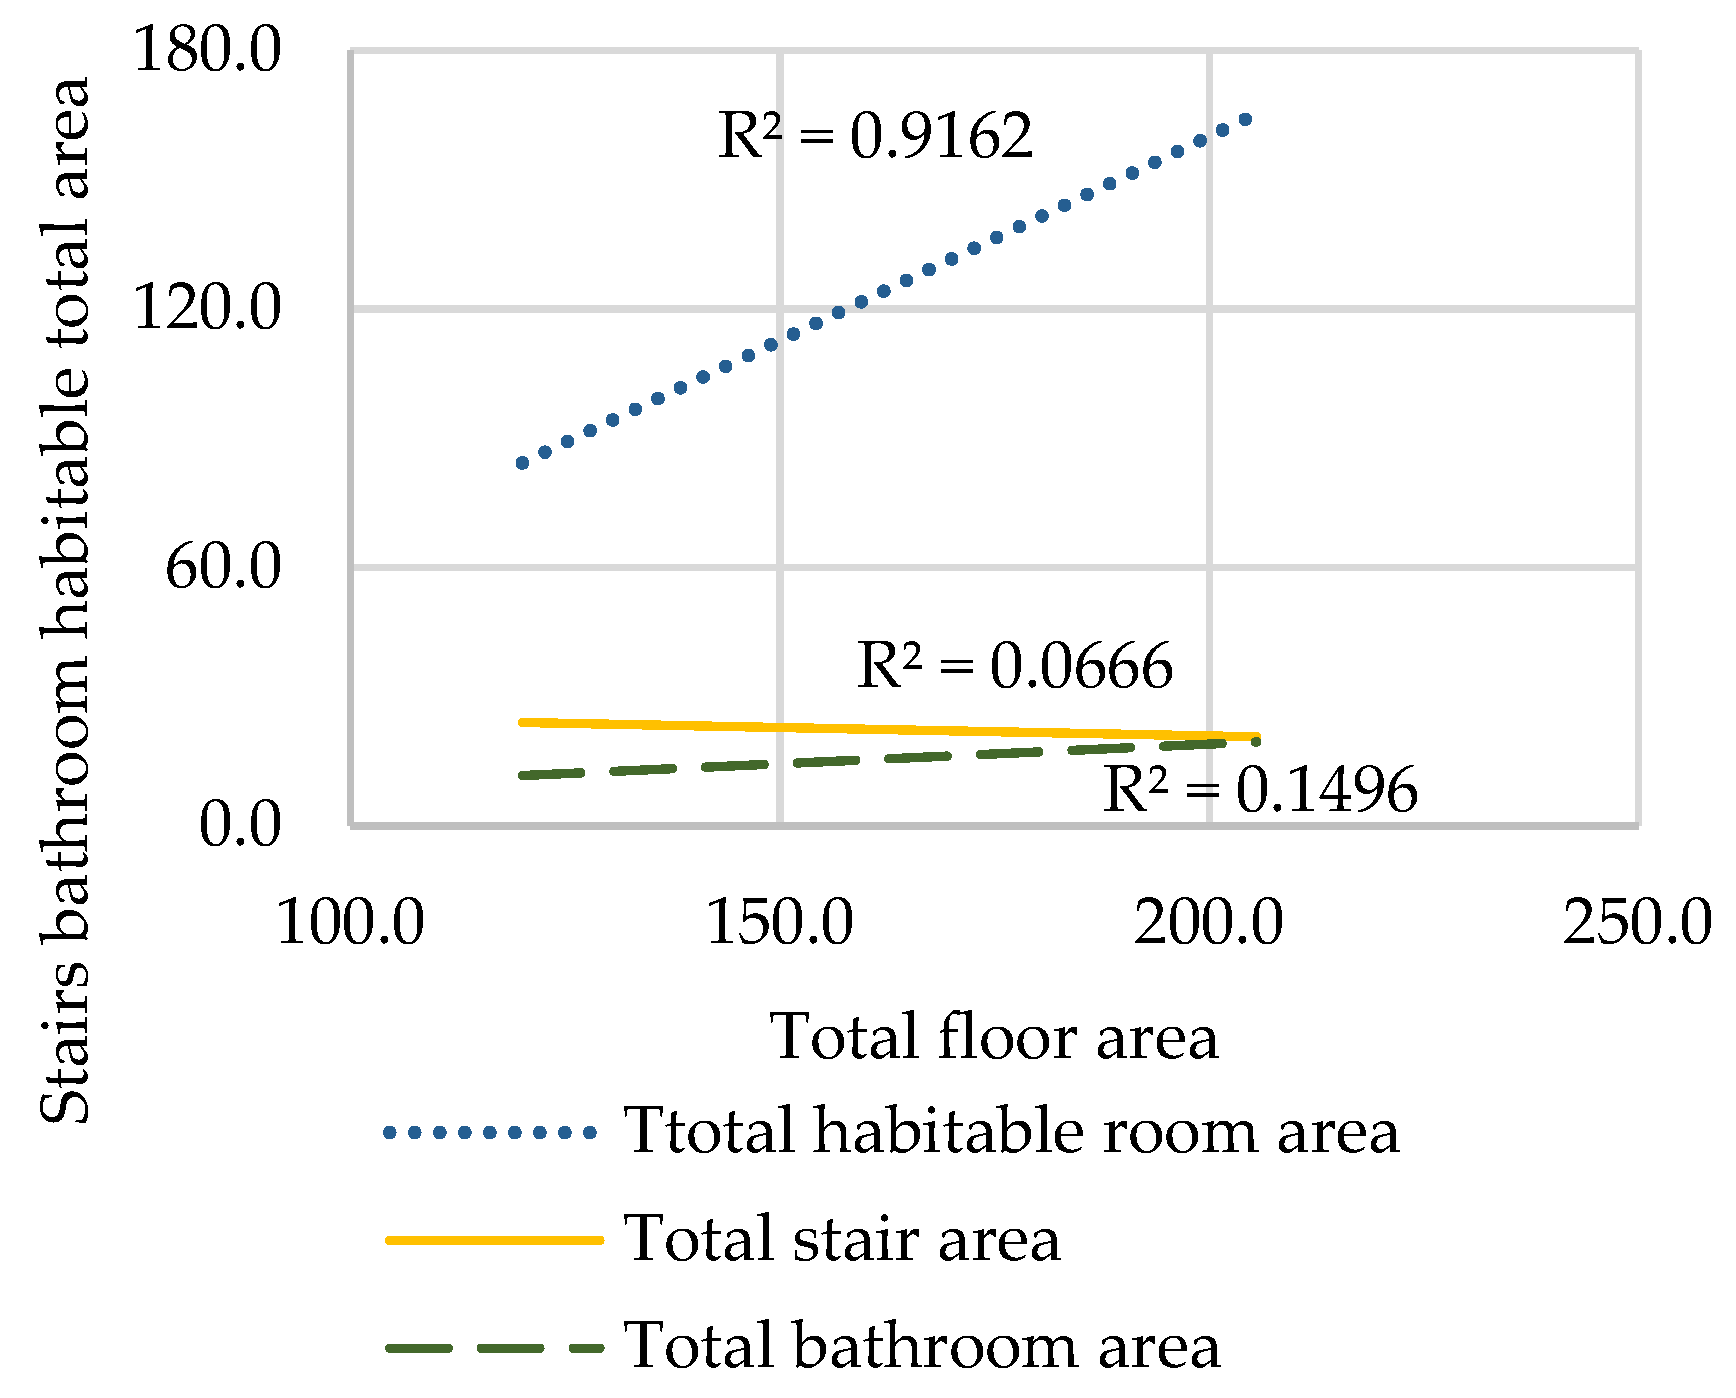
Figure 10.
Schematic Diagram of Staircase Location Zoning.
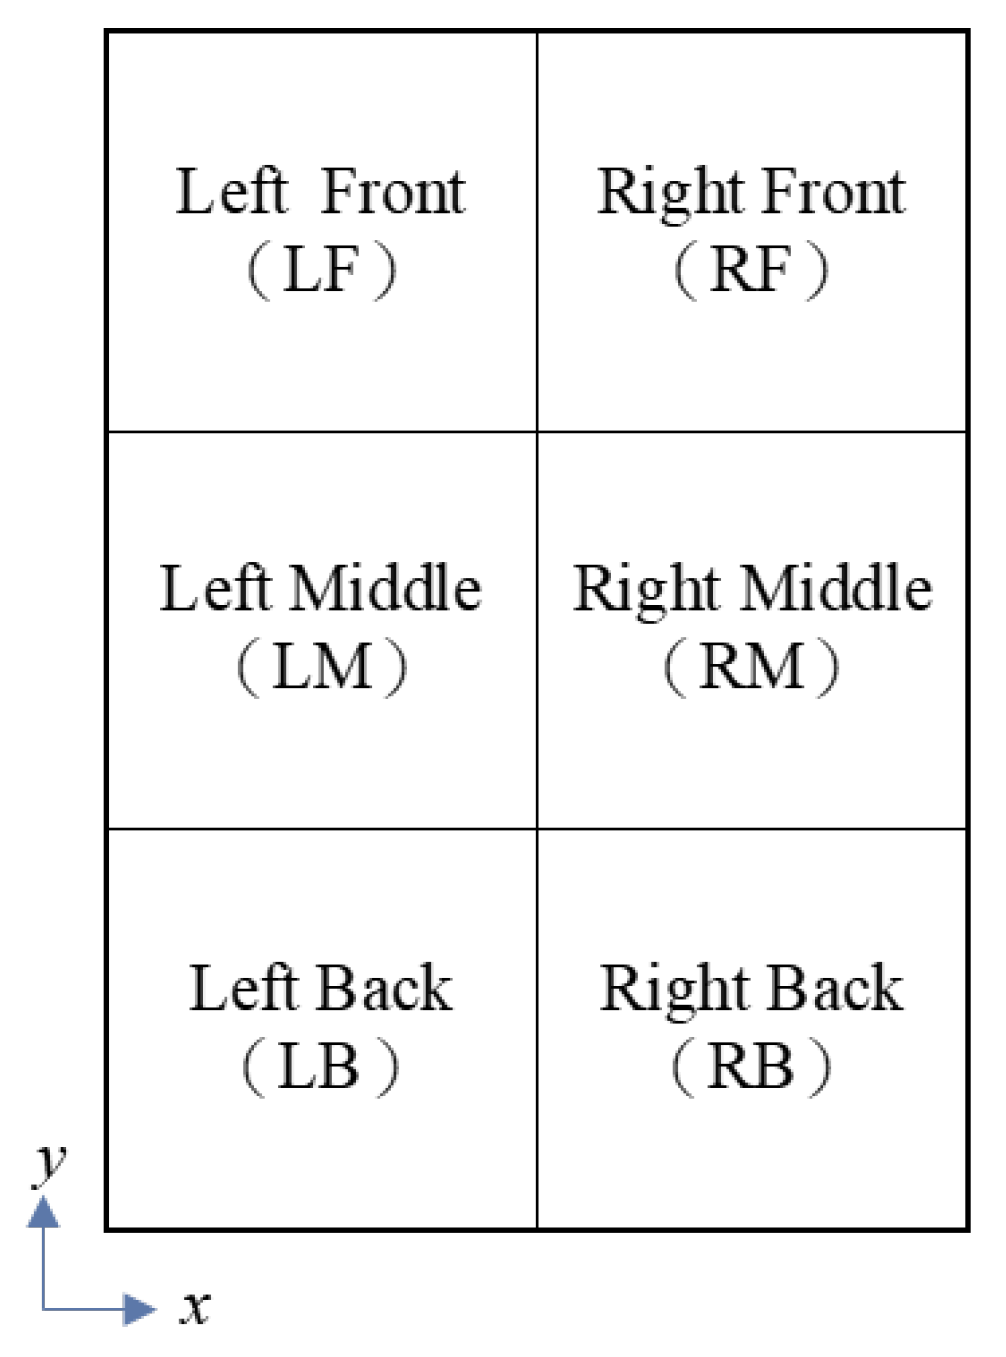
Figure 11.
Statistical Analysis of Staircase Locations on Each Floor.
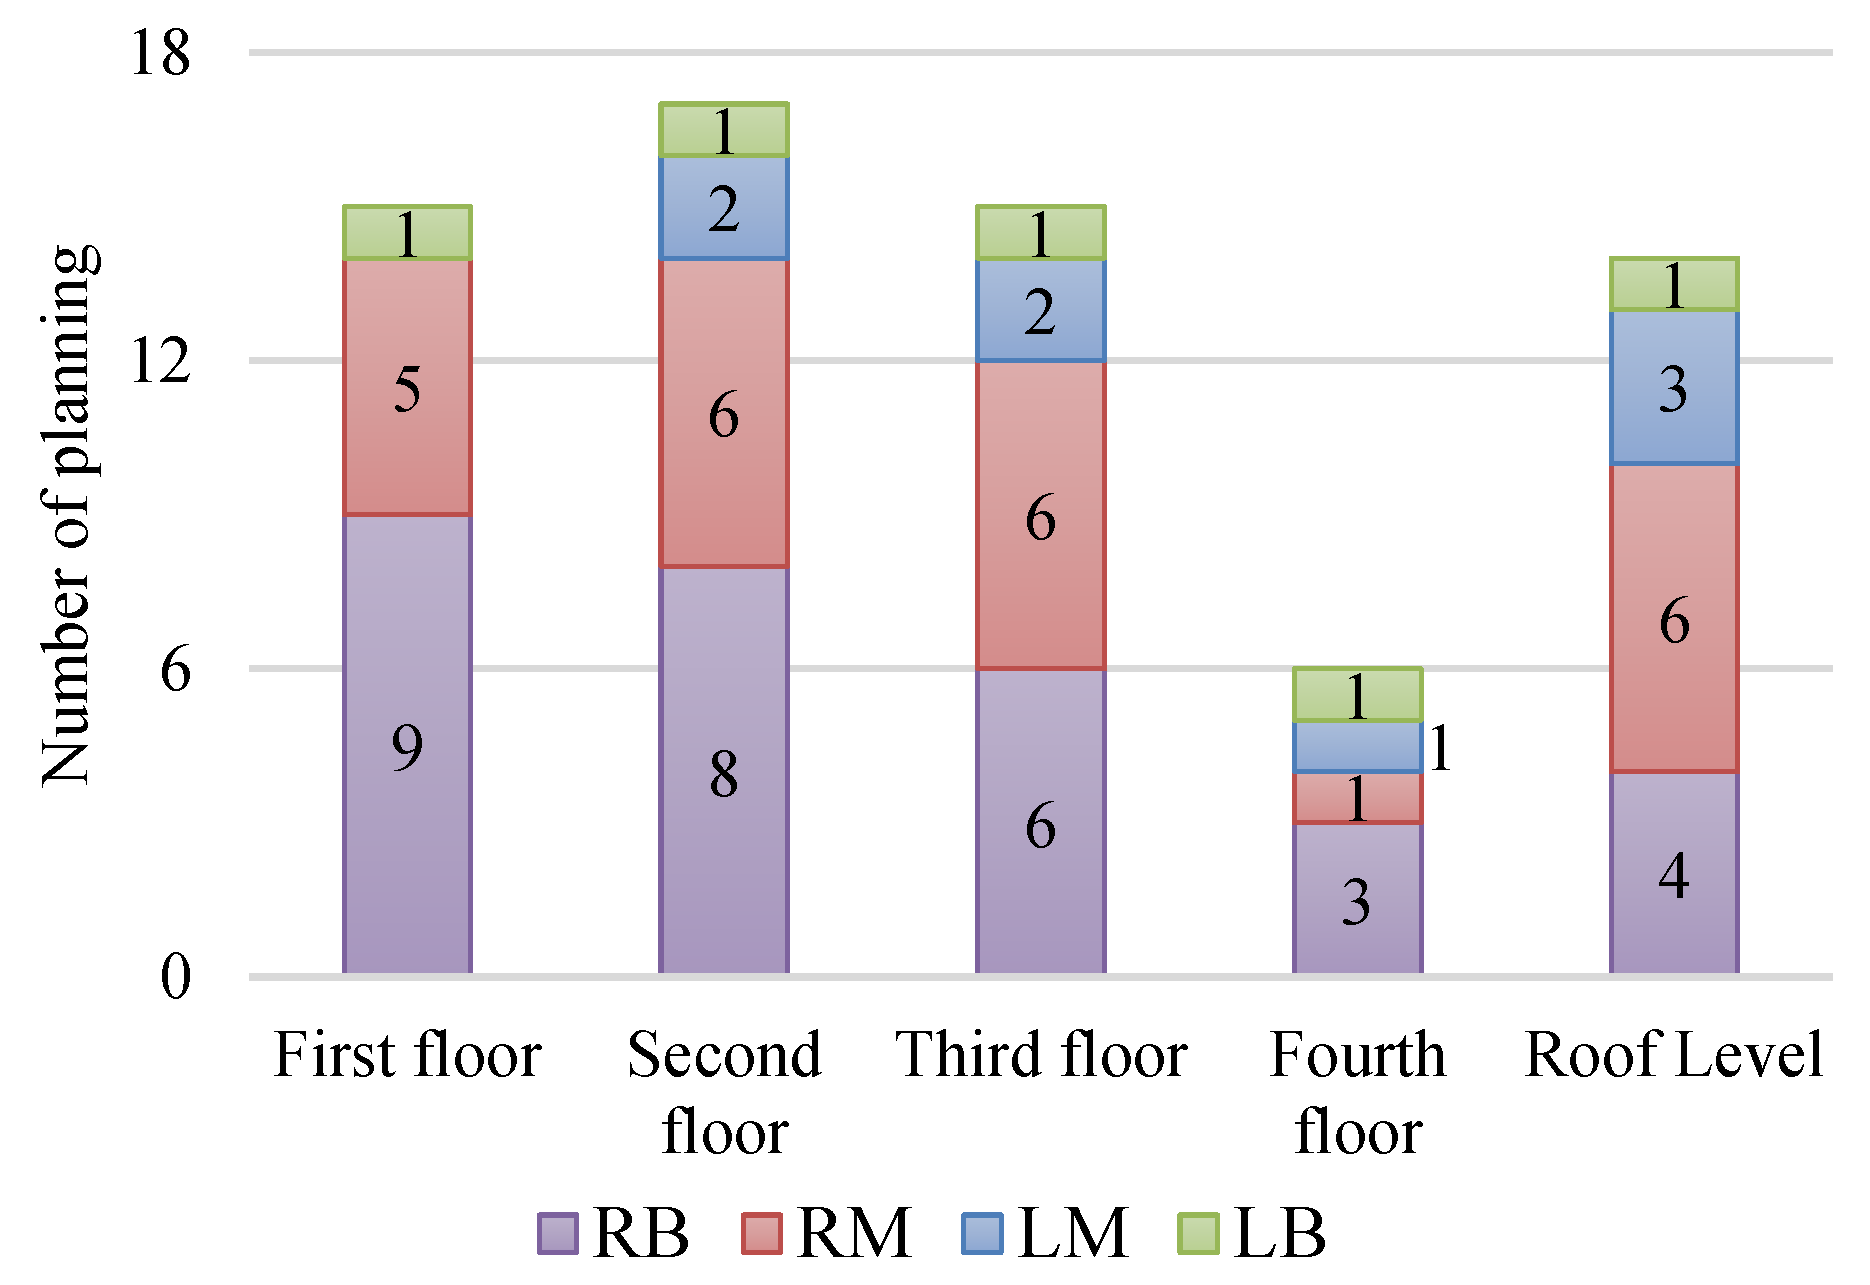
Figure 12.
The planning frequency, area, and proportion of each type of staircase.
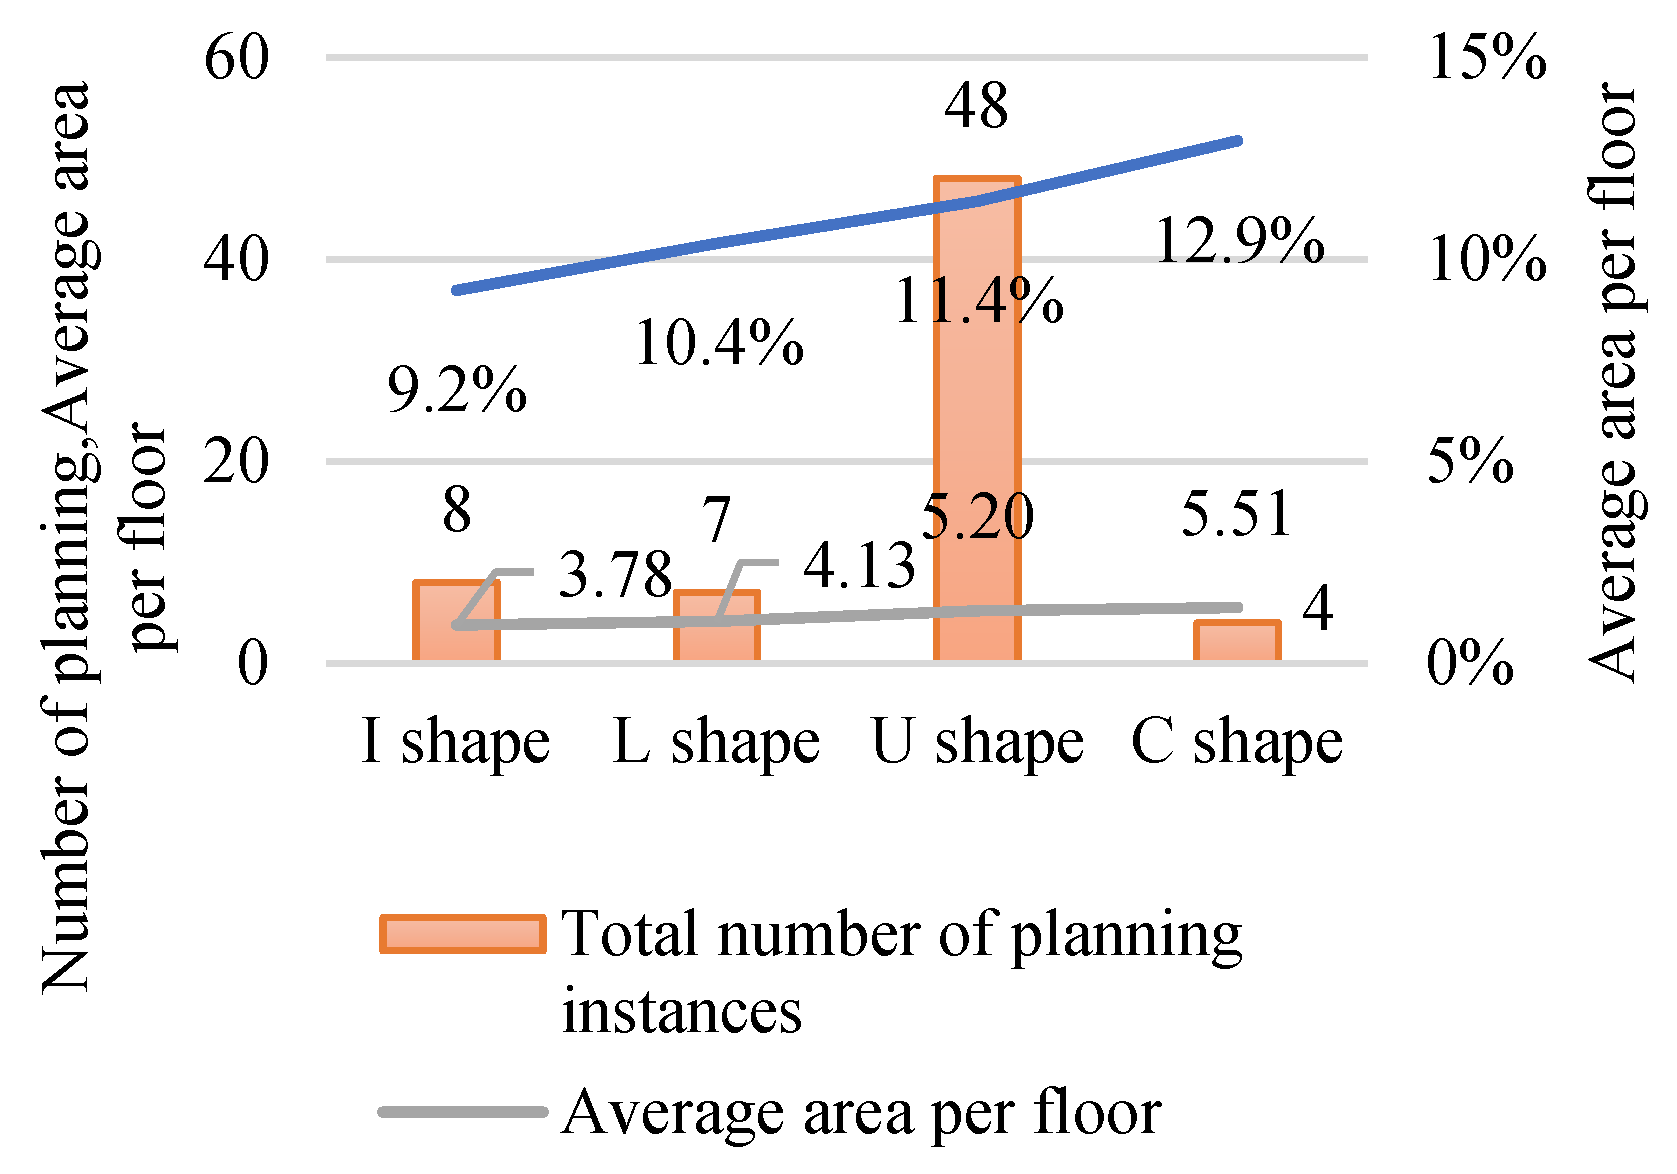
Figure 13.
Statistics on the number of planning instances for each type of staircase on each floor.
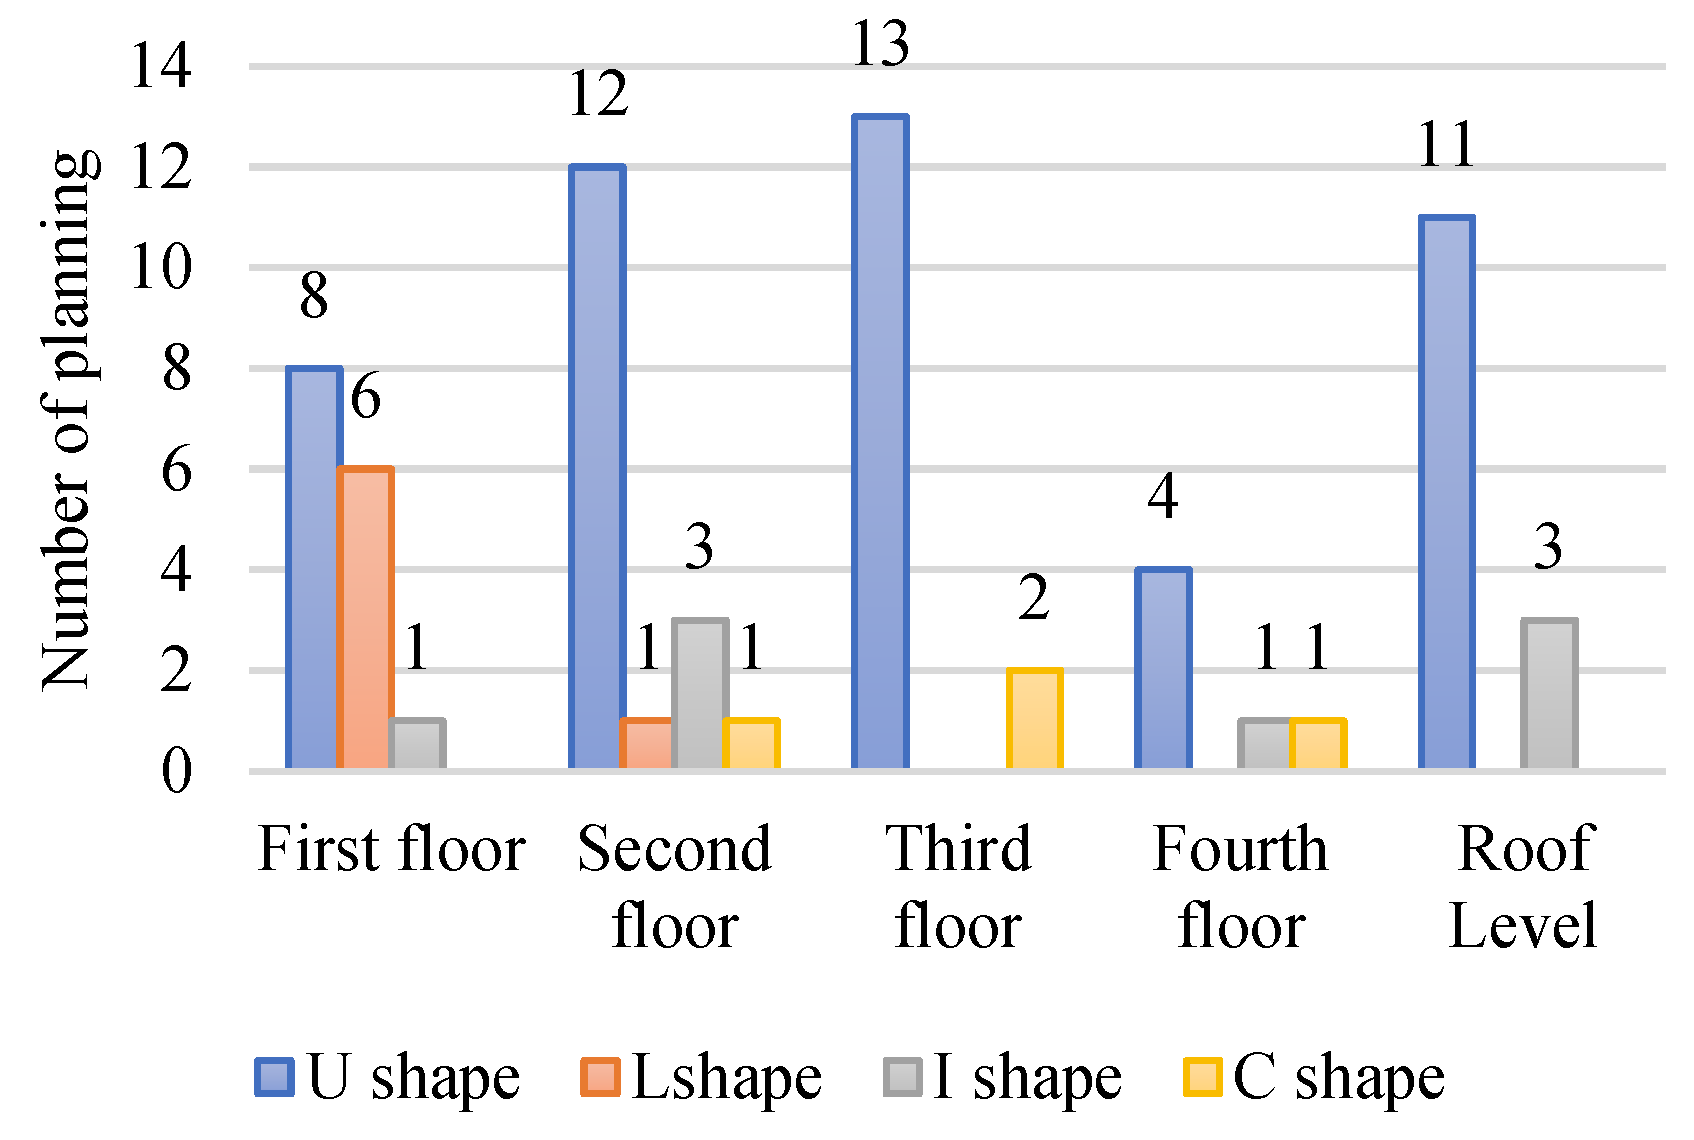

Table 1.
The mean and standard deviation of architectural width, depth, and total floor area.
| Item | Width | Depth | Total floor area |
|---|---|---|---|
| Average() | 4.86m | 9.34m | 154.81 m2 |
| Standard deviation(σ) | 0.76 | 1.67 | 18.79 |
Table 2.
Building Floor Area, Facade Width, and Depth Range.
| Item | -σ | +2σ | |
|---|---|---|---|
| Width | 4.1 m | 4.86m | 6.38 m |
| Depth | 7.67 m | 9.34m | 12.68 m |
| Total floor area | 136.02m2 | 154.81 m2 | 192.39 m2 |
Table 3.
Correlation coefficients.
| r | Width | Depth | The total area of the staircase | Total area of baths and toilets | Habitable total area of the habitable room | Total floor area |
| Width | 1.0 | - | - | - | - | - |
| Depth | -0.51 | 1.0 | - | - | - | - |
| The total area of the staircase | 0.43 | -0.26 | 1.0 | - | - | - |
| Total area of baths and toilets | 0.13 | 0.16 | 0.09 | 1.0 | - | - |
| The total area of the habitable room | -0.14 | 0.75 | -0.43 | 0.14 | 1.0 | - |
| Total floor area | -0.04 | 0.75 | -0.26 | 0.39 | 0.96 | 1.0 |
Disclaimer/Publisher’s Note: The statements, opinions and data contained in all publications are solely those of the individual author(s) and contributor(s) and not of MDPI and/or the editor(s). MDPI and/or the editor(s) disclaim responsibility for any injury to people or property resulting from any ideas, methods, instructions or products referred to in the content. |
© 2024 by the authors. Licensee MDPI, Basel, Switzerland. This article is an open access article distributed under the terms and conditions of the Creative Commons Attribution (CC BY) license (http://creativecommons.org/licenses/by/4.0/).
Copyright: This open access article is published under a Creative Commons CC BY 4.0 license, which permit the free download, distribution, and reuse, provided that the author and preprint are cited in any reuse.


