Submitted:
27 August 2024
Posted:
28 August 2024
You are already at the latest version
Abstract
Cleomaceae is an important group that is medicinally and economically important. However, its systematic position has been controversial. In this study, we have obtained three chloroplast genomes sequencing results of Cleomaceae species. The genome sizes ranged from 157,073 bp (Sieruela rutidosperma) to 158,152 bp (Gynandropsis gynandra). These chloroplast genomes have a typical quadripartite formation with a large single-copy (LSC) region (86,422-87,242bp), a small single-copy (SSC) region (18,485-18,548bp), and a pair of inverted repeat (IR) regions (26,083-26,184bp). The chloroplast genomes encoded 131-132 genes, comprising 8 rRNA genes, 37 tRNA genes, and 79-84 protein-coding genes. The overall GC contents of the three chloroplast genomes are almost identical (35.81%-36.02%). The phylogenetic trees concluding 8 Cleomaceae plants were constructed based on ML and BI methods. The results showed that Gynandropsis gynandra and Sieruela rutidosperma were in the same branch, with Corynandra viscosa as their sister. Six hypervariable areas were identified, containing clpP, matK, ndhF, atpH-atpI, atpF-atpH and petN-psbM which could be used in species identification and population genetics studies. This study provides valuable information for further species identification, evolutionary and genetic studies of Cleomaceae in the future.
Keywords:
Cleomaceae
; Chloroplast genome
; Comparative Genomics
; Phylogenetic Relationships
1. Introduction
Cleomaceae is a small family which contains 18 genera and about 150-200 species mostly distributed in tropical and subtropical areas. At the same time, a few species are restricted in temperate regions such as Asia, Africa, and the Americas [1]. Nonetheless, it has been the focus of important ecological and evolutionary inquiries. These studies were about floral morphology and development [2,3], the evolution of C4 photosynthesis [4,5], and comparative genomics [6]. The sister relationship between Cleomaceae and Brassicaceae can facilitate these investigations because Brassicaceae includes the model organism Arabidopsis thaliana. In addition, the plants of the Cleomaceae family are herbs (rarely shrubs), sometimes woody at the base [7], and some members are economically important. For example, Gynandropsis gynandra is an important Southeast Asian and African dry-season leafy vegetable [8], and Tarenaya hassleriana is widely grown as an ornamental species [6].
Chloroplast is an important plant photosynthetic organelle, as well as a semiautonomous genetic organelle. Chloroplast contains an independent chloroplast DNA (cpDNA), which has a length of 110-160 kb [9]. The chloroplast genome usually has a typical quadripartite structure, consisting of one large single-copy (LSC) region, one short single-copy (SSC) region, and two inverted repeats (IR) regions, and two IR regions separate the LSC region from the SSC. cpDNA is a separate genome encapsulated by the inner cell membrane, which is cytoplasmically inherited, and the DNA is inherited in a way that is equivalent to matrilineal inheritance, with separate transcription and transport systems within the chloroplast [10]. The chloroplast genome is characterized by a similar structure, highly conserved sequences, and stable matrilineal inheritance, making it an ideal resource for species identification, population genetics, phylogeny, and genetic engineering studies [11]. In addition, gene mutations, rearrangements, duplications, and deletions can be detected in the chloroplast genomes of angiosperms [12,13]. Structural changes in chloroplast genomes can be used to study phylogenetic relationships, informing the development of genomic markers [14]. Repeat sequences are motifs of DNA sequences that are repeated many times. They are widespread in the genome and play an important role in the evolutionary process. Repeat sequences include tandem repeats and interspersed repeats. Tandem repeats mainly include some shorter repeat sequences, such as simple sequence repeats (SSRs). Interspersed repeats are commonly known as transposons. SSRs consist of 1-6 nucleotide repeating units, which are also known as microsatellites. They are characterized by a high degree of reproducibility, codominance, multiparity, and chromosomal specificity, and are widely used as molecular markers [15,16]. Interspersed repeat sequences account for a large proportion of plant genome repeat sequences, whereas retrotransposons play an important role in genome amplification [17,18,19,20]. Expanding and contracting genomes and interspecific sequence differences have also contributed [21]. The complete chloroplast genome that can help us better understand plant biology and diversity contains all the genes used to reconstruct the evolutionary history, providing more valuable and high-quality information for evolutionary and phylogenetic analyses. The rapid development of Next-generation Sequencing technologies (Illumina and PacBio sequencing platforms) has reduced the difficulty of obtaining complete chloroplast genome sequences [22,23,24].
Cleomaceae is a key family in the study of the phylogeny of C4 photosynthesis [25] and the focus of important ecological, phylogenetic , and evolutionary studies. The intergeneric relationships of the family have been controversial due to the limitations of morphological classification [26]. For example, Feodorova et al. [4] reported that the clade including Cleome khorassanica and Cleome turkmena is the sister clade of all the remaining Cleomaceae genera, which is consistent with previous studies [27]. The results of another study showed that Capparaceae is the sister clade of Cleome and is further derived within that clade [1], which is in agreement with the results of Ali et al. [28]. The results of systematic delimitation of Cleomaceae based on morphology, anatomy, and paleobotany have been reported, but the traditional identification methods based on morphological characters could not clearly distinguish Cleomaceae species, especially on further differentiation of species within the genus [29,30]. The shared and independent genome duplication events between Cleomaceae and Arabidopsis thaliana established the sister family as a valuable model for studying post-duplication gene and genome evolution. Cleomaceae, as an emergent system, transcends the Brassicaceae in the study of the origin of photosynthetic diversity in plants, the consequences of gene duplication, and the genetic basis of adaptive traits [31]. With the rapid development of molecular techniques, some studies of phylogenetic analyses and DNA fragment labeling techniques based on nuclear or chloroplast DNA fragments are developing rapidly [32]. However, the limited numbers of nuclear DNA fragments or chloroplast DNA fragments cannot provide sufficient phylogenetic information to effectively resolve interspecific relationships [33]. A complete chloroplast genome can provide more valuable information for evolutionary and phylogenetic analyses, and can reduce sampling errors inherent in studies of one or a few genes that may herald key evolutionary events [34] Thus, based on the conserved chloroplast genome, clear phylogenetic relationships with Cleomaceae need to be established.
In this study, the complete chloroplast genomes of Gynandropsis gynandra,Corynandra viscosa, and Sieruela rutidosperma were sequenced using Illumina technology, and their features were characterized. The objectives of our study were (1) to investigate the molecular structure of these three chloroplast genomes; (2) to study the variation of repetitive sequences and SSRs in these three chloroplast genomes; (3) to identify divergent hotspot regions to provide potential molecular markers for future phylogenetic studies; (4) to establish and analyze, based on complete chloroplast genome sequences, the phylogenetic relationships. These data will provide valuable reference information for further studies on Cleomaceae species identification, evolution and phylogenetic analysis.
2. Results
2.1. Characteristics of Three Cleomaceae Species Chloroplast Genomes
The complete chloroplast genomes of Corynandra viscosa (158,041 bp), Sieruela rutidosperma (157,073 bp) and Gynandropsis gynandra (158,152 bp) have been submitted to GenBank at the NCBI. The three new chloroplast genomes of Cleomaceae are slightly different. Cp genomes range in size from 157,073 bp (S. rutidosperma) to 158,152 bp (G. gynandra). The chloroplast genomes had a typical quadripartite formation containing one LSC region (86,422-87,242 bp) and one SSC region (18,485-18,548 bp) separated by two inversely repeated IR regions (26,083-26,184 bp) (Figure 1, Table 1). The total GC contents of the three chloroplast genomes were basically the same (35.81%-36.02%) (Table 1), and the GC contents of the IR regions were higher than those of the LSC and SSC regions (Table 2).
The chloroplast genomes of C. viscosa and S. rutidosperma encode 131 genes, including 84 CDS genes, 37 tRNA genes, 8 rRNA genes and 2 pseudogenes (rps19, ycf1). The G. gynandra chloroplast genome, on the other hand, encodes 132 genes, including 86 CDS genes, 37 tRNA genes, 8 rRNA genes, and 1 pseudogene (ycf1) (Table 1). Their functions were categorized into three groups, including photosynthesis, self-replication and other genes. After removing the duplicated genes, C. viscosa still had 79 CDS genes, 28 tRNA genes and 4 rRNA genes, S. rutidosperma had 78 CDS genes, 30 tRNA genes, and 4 rRNA genes, and G. gynandra had 79 CDS genes, 30 tRNA genes, and 4 rRNA genes. The number of CDS genes is relatively conservative. Among the three chloroplast genomes, the LSC region contains 59 CDS genes and 20 tRNA genes, while the SSC region contains 11 CDS genes and 1 tRNA gene (Figure 1). There are 25 genes contained introns, of which 22 genes (atpF, ndhA, ndhB, petB, petD, rpl2, rpl16, rps16, rpoC1, trnA-UGC, trnI-UUC, trnK-UUU, trnL-UAA, trnT-CGU, trnV-UAC, trnA GCA, trnL-UAA, trnT-CGU, trnV-UAC, trnA-GCA, trnH-GUG, trnI-AUC, trnK-AAA, trnG-UCC, trnI-GAU and ycf3) contained one intron, and three genes (clpP, rps12, ycf3) contained two introns (Table S1). The longest intron was in trnK-AAA (2567bp) and the shortest was in trnL-UAA (531-539bp) (Table S2). Uniquely, rps12 is considered to be a trans-spliced gene separated by two introns. There are three rps12 in the complete chloroplast genomes except Corynandra viscosa, one is in the LSC region and the others are in the IR region (Figure 1).
2.2. Codon Usage Statistics
Codon usage preference analysis has important implications for assessing the evolution of chloroplast genomes. Relative synonymous codon usage (RSCU) was used to assess the use of synonymous codons in coding sequences, with higher RSCU values indicating a greater preference for the use of synonymous codons. RSCU values were calculated for the chloroplast genomes of C. viscosa, S. rutidosperma and G. gynandra based on the protein-coding sequences. The contents of 20 amino acids and stop codons in all protein-coding genes in the chloroplast genomes of the three species are shown in Figure 2. The coding regions of C. viscosa, S. rutidosperma and G. gynandra consisted of 26,146, 25,893 and 26,452 codons, respectively (Table S3). The most common amino acid was leucine (2,767 codons in C. viscosa, 2,725 codons in S. rutidosperma, 2,799 codons in G. gynandra). The rarest amino acid was cysteine (305 codons in C. viscosa, 298 codons in S. rutidosperma, 320 codons in G. gynandra). As shown in Figure 2, all amino acids are encoded by two or more synonymous codons except tryptophan (Trp), and methionine (Met) is encoded by seven synonymous codons. In addition, almost all synonymous codons ending in A/U have RSCU values greater than 1, while those ending in C/G have RSCU values<1 (Table S3), indicating that most of the amino acids tend to be coded by codons ending in A/U rather than by codons ending in C/G.
2.3. Repeat Sequence Analysis
Long repetitive sequences are sequences longer than 30 bp in length, and there are four types of them, including forward repeats, palindromic repeats, inverted repeats, and complementary repeats. Three newly assembled cp genomes of the three species were analyzed for their repetitive sequence characteristics, including the four types mentioned above. Among them, the long repeat sequences of C. viscosa, S. rutidosperma and G. gynandra were 59 (24 forward, 27 reverse, 7 inverted and 1 complement), 55 (18 forward, 30 reverse, 6 inverted and 1 complement) and 58 (18 forward, 27 reverse, 11 inverted and 2 complements), respectively. (Figure 3a). The length of the dispersed repeats was 30-35 bp (Figure 3b). Most of the long repetitive sequences of C. viscosa were located in the ycf gene and intergenic spacer (IGS), while those of S. rutidosperma and G. gynandra were mainly located in the ycf gene and trnH-GUG (Table S4). The type and content of long repetitive sequences were similar in the same genus.
2.4. SSR Analysis
Analysis of the cp genomes of the three species yielded six types of SSRs, including mononucleotides, dinucleotides, trinucleotide, tetranucleotide, pentanucleotide, and hexanucleotide, for a total of 374-388 SSRs (388,374,375). Most of the SSRs were located in the intergenic region. They were mainly located in the LSC region and less frequently in the SSC or IR regions (Table S5). There were 264-283 (283,274,264) single nucleotides, 14-16 (14,14,16) dinucleotides, 70-75 (73,70,75) trinucleotides, 16-17 (17,16,17) tetranucleotides, 0-2 (1,0,2) pentanucleotides, and 0-1 (1) hexanucleotides (only in G. gynandra). Among these SSRs, single nucleotide repeats were the most abundant and pentanucleotide repeats were the least abundant. The highest SSR abundance was in the A/T nucleotide repeats (Figure 4).
2.5. Comparative Genomic Analysis
The percentage sequence identity of eight Cleomaceae species using G. gynandra as a reference was calculated using the mVISTA program. The results showed that there was a high degree of similarity among the eight species, with less variability in the IR region of the chloroplast genome than in the LSC and SSC regions, and a higher degree of variability in the noncoding region than in the coding region, which is consistent with the pattern of change in most angiosperms (Figure 5) [35].
Chloroplast genomes contain many variable nucleotides that can be used to resolve closely related species or genera and are valuable DNA barcodes [36,37]. In this study, 81 common loci were identified in the cp genomes of eight species. The polymorphism information (Pi) values ranged from 0.00348 to 0.06884, with an average value of 0.02183 (Figure 6 and Table S6). Among them, the average Pi values were 0.02858 in the SSC region, 0.02325 in the LSC region and 0.00694 in the IR region, indicating that the SSC region had the largest variation, followed by the LSC region, and the IR region had the smallest and more conservative variation (Figure 6). In addition, four genes with high Pi values were detected, including rpl22 (0.06884), clpP (0.05275), matK (0.04902) and rpl32 (0.03931), of which rpl22, clpP, and matK were located in the LSC region, and rpl32 in the SSC region.
These results suggest that rpl22, clpP, matK and rpl32 are hypervariable loci (Pi > 0.039) at the species level, and these loci may also be potentially developed as barcodes for the identification of the Cleomaceae family.
The result shows the comparison of the IR/LSC and IR/SSC boundaries of the chloroplast genomes of eight Cleomaceae species (Figure 7). Among these eight species, Coalisina paradoxa had the longest chloroplast genome length (159,393 bp), whereas Cleomella lutea had the shortest one (154,124 bp). The rps19 genes in the eight Cleomaceae species were similarly located, all spanning the LSC and IRb binding regions, and were 110-112 bp apart from the LSC and IRb binding regions. trnH genes in eight Cleomaceae species were located in the LSC region, and were 0-22 bp apart from the IRa/LSC boundary. trnH genes in three species spanned the IRa and LSC binding regions, and were 3-5 bp apart from the IRa/LSC except for the ndhF gene of C. paradoxa, which straddles the IRa and SSC binding region, the ndhF genes of the other seven Cleomaceae species straddle the IRb/SSC boundary and are separated from the IRb/SSC boundary by 34-64 bp. In addition, the trnN genes of all seven species were located in the IRa region, except for C. paradoxa whose trnN gene was located in the IRb region. In conclusion, the cp genome sequences of the seven Cleomaceae species are relatively conserved.
The results of the hairy feather multiple alignment analysis showed that there were two locally colinear blocks (LCB) between the cp genomes of the eight species, indicating a high degree of similarity between the genomes of the eight species (Figure 8). The alignment results showed no rearrangements and minor inversions between their genomes; however, mutations were observed in the 120,000 to 144,000 regions, with a high degree of gene sequence variation in the aligned cp genomes.
The synonymous and non-synonymous variations in the G. gynandra cp genome were compared with the cp genomes of seven other Cleomaceae species using G. gynandra as a reference (Figure 9). The comparison revealed Ka/Ks ratios for 78 protein-coding genes in these seven cp genomes. Most of the coding genes had Ka/Ks ratios below 1 or could not be determined because of zero Ka or Ks values, indicating that these genes are conserved. rpl23 had Ka/Ks values greater than 1 in S. rutidosperma, C. paradoxa and T. hassleriana; rps7 had Ka/Ks values greater than 1 in C. lutea and C. pallida; rps7 had Ka/Ks values greater than 1 in C. pallida and C. lutea.
2.6. Phylogenetic Analysis
In this study, phylogenetic analyses based on complete chloroplast genomes of 23 species including eight Cleomaceae species were carried out using ML and BI. The complete sequences of the three chloroplast genomes provide important data for further exploring the phylogenetic relationships among the Cleomaceae family. The results of two phylogenetic analyses, ML and BI, showed that the evolutionary trees based on the complete chloroplast genomes were almost identical in topology, and most of the nodes in the phylogenetic trees were observed with the majority of nodes having 100% bootstrap (BP) values or 1.0 Bayesian posterior probability (Figure 10, Figure 11).
The phylogenetic tree was divided into two highly supported evolutionary branches except Arabidopsis thaliana and Brassica napus. The first branch included species mainly from Capparaceae, and the second branch was for Cleomaceae species. The evolution of the first branch including Capparaceae was highly supported (100)as well as some other minor families (Caricaceae, Moringaceae, Tropaeolaceae). Traditionally, Cleomaceae and Capparaceae are thought to be so closely related that they were once divided into the same family [38]. However, according to the results of the evolutionary tree, it was clear that the Capparaceae and some smaller families of Brassicaceae were more genetically related than Cleomaceae.
Cleomaceae species gathered on a large branch and species in some genera were clustered together to a certain degree. The Cleomaceae was divided into two clades. Cleomella luta was clustered into one single branch and the other seven species were grouped into one major branch. In this major branch, Sieruela rutidosperma, Gynandropsis gynandra and Tarenaya hassleriana were closer to each other, which was consistent with that they were all strongly adapted plants with wide distribution. Meanwhile, Corynandra viscosa was found to be sister to other five species (Cleome pallida, T. chrysantha, G. gynandra, S. rutidosperma, and T. hassleriana). In addition, G. gynandra, S. rutidosperma and C. viscosa were sister species to each other. These results suggested that these three species sequenced in this study were highly homologous with Cleomaceae.
To identify potential molecular markers, we constructed phylogenetic trees based on chloroplast-wide genomes and highly variable gene regions. These potential barcode sequences were chosen from the Pi value, containing matK、clpP、atpF-atpH、atpH-atpl、petN-pabM . We have also chosen the universal barcode sequence ndhF.
In Figure 12b, the same clustering results identical to the complete genome were found. Cleomaceae and Capparaceae were separated into two large branches, but there are only seven plants of Cleomaceae in the same branch. As a plant tied with these two families, Cleomella lutea was separated. In the branch of Gynandropsis gynandra, the results showed that Gynandropsis gynandra and Sieruela rutidosperma have a closer relationship than others. Generally, Gynandropsis has always been considered as a monophyletic genus [1] which does not match the result shown by the evolutionary tree.
In Figure 12a, two significant branches are shown and Brassicaceae plants are set as outgroups. Eight species of Cleomaceae were clustered in a branch, differing from the result of complete genomes. Gynandropsis gynandra was considered closer to Tarenaya hassleriana. In Figure 12c, the significant branches are the same as those in clpP. Confidence level of these large branches is higher, but decreases when it separates. Gynandropsis gynandra and Coalisina paradoxa were clustered in the same branch, obviously different from what we know.
The differences between Cleomella lutea and the other seven species are remarkable in these three figures. Cleomella lutea can be confused with other families in the classification of intergenic regions.
The results of the tree using a single copy of the gene alone were quite different from the results of the other two trees, so we used the method with better similarity and more reliability to obtain the evolutionary tree. Trees using single gene copy tandem results were identical to the genome-wide results for family classification, while there were differences in classification results between genera within the family, particularly between what is commonly thought monophyletic genera and the important monogeneric species Gynandropsis gynandra (not included).
In the obtained evolutionary trees using intergenic regions (Figure 13), it is possible to distinguish the family Cleomaceae relatively well at the family level, but the classification of some species is still problematic, especially Corynandra viscosa, which is positioned outside the rest of the plant in the evolutionary tree. The overall discrimination of the identification results is weaker than for single genes. These results can be used in the identification of plants in the family Cleomaceae.
3. Discussion
Chloroplast genomes can provide valuable information in species identification, phylogenetic and population genetics studies [39]. In this study, the chloroplast genomes of three Cleomaceae species were sequenced, assembled and annotated. The results provide valuable data and results on the genome structure, gene content and evolutionary relationships of Cleomaceae. These three cp genomes have the classical cyclic tetragonal chloroplast structure[40], and the GC content is lower than the AT content. This is essentially the same as in other angiosperm chloroplast genomes [41]. The IR region has the highest GC content, which may be due to the presence of a large amount of rRNA in the IR region, which has relatively high GC content. It has been shown that high AT content is the main reason why synonymous codons end in A/U [42], which may be related to natural selection and mutation during evolution [43] . Consistent with our observation, SSRs are usually composed of more A + T bases than G + C bases [44], which may be due to the higher AT content in the nucleotide composition.
Numbers and lengths of exons and introns are important information about the cytoplasmic genome. In most organisms, genes are cut off by introns [45]. Single-intron genes vary in different organisms, while clpP and rps12 are double-intron genes [39,46,47]. This is the same as our assembly results. The clpP protease encoded by the clpP gene plays an important role in the regulation of protein metabolism and is widely found in mitochondria and chloroplasts of prokaryotes and eukaryotes [48]. The 5′ end of the rps12 gene is located in the LSC region and the 3′ end of the repeat is located in the IR region. It is a trans spliced gene [49]. Beyond the primary there is the photosynthesis-related ycf3 [50] which is a double intron gene in C. viscosa and G. gynandra and a single intron gene in S. rutidosperma. An in-depth study of the clpP, rps12 and ycf3 genes would be helpful to obtain further chloroplast characterization in S. rutidosperma.
LSC and SSC regions are usually highly variable, while IR regions are usually highly conserved but subject to expansion and contraction [51]. Expansion and contraction of the IR region of the chloroplast genome is a common evolutionary phenomenon. Expansion and contraction of the IR region occur when some genes enter the IR region or the LSC region and SSC region during the evolution of the genome [48]. In seven Cleomaceae species, there is a tendency for the ycf1 gene to enter the IR region due to the contraction of the SSC/IR boundary, whereas in C. paradoxa, the SSC-IR boundary expands and ycf1 gene is placed in the SSC region. The cp genome boundary genes in C. paradoxa are different from those of the other seven species of the Cleomaceae family. The expansion or contraction of the IR region in these species should be related to the retention or loss of genes, and a gene loss event may have occurred during the evolution of C. paradoxa and the divergence of the species. In addition to this, Mauves comparison analysis showed that longer IR regions had less effect on the structural rearrangement of the cp genome in these Cleomaceae family species.
Nucleotide diversity (Pi) can reflect the degree of DNA sequence variation and the genetic diversity of species [52]. Nucleotide diversity analysis showed that the IR region contained fewer variable sites compared with the LSC and SSC regions, and the results also showed that genes with Pi values greater than 0.039 were mainly located in the LSC region. The chloroplast genome has a copy-based repair mechanism that ensures the sequence consistency and stability of the two IR regions, thus enhancing the stability and conservation of the genome [53]. Therefore, the sequence differences in the IR region are smaller than those in the LSC and SSC regions [54]. Except for clpP, none of the other intron-containing genes (atpF, ndhA, ndhB, petB, petD, rpl16, rpl2, rpoC1, rps12, rps16, and ycf3) had Pi values greater than 0.039, which suggests that the intron-containing genes are more conserved than the exon-containing genes in the chloroplast genome only. This suggests that exon-containing genes have higher variability and provide more valuable information in the study of species evolution.
The mVISTA analysis showed that there were fewer variant sites in coding regions than in non-coding regions, and the variability in IR regions was less than that in LSC and SSC regions. The variant sites could be used to develop new molecular markers for species identification and classification studies in Cleomaceae. These variations were observed in rpl22, clpP, matK and rpl32 genes and intergenic regions, such as psbK-psbI, atpF-atpH, atpH-atpI, atpI-rps2 rps2-rpoC2, petN-psbM, psaA-ycf3, atpB-rbcL, rbcL-accD, accD-psaI, psaI-ycf4, ycf4-cemA, petA-psbJ, psbE-petL, psaJ-rpl33, rps18-rpl20, clpP- psbB, and rps8-rpl14. Among these divergence hotspots, trnH-psbA has been selected as a suitable barcode for plants [55,56] as well as rbcL-accD [57] and petA-psbJ [58,59]. Further studies are needed to determine whether the divergence hotspot regions can be used as candidate DNA barcodes or for assessing the taxonomy and phylogeny of Cleomaceae.
A synonymous mutation is a base mutation that produces an unmodified amino acid and vice versa, producing a non-synonymous mutation, which is usually influenced by natural selection [60]. The selection effect (Ks) of a gene is usually expressed as the ratio of the number of non-synonymous substitutions per non-synonymous site (Ka) to the number of synonymous substitutions per synonymous site (Ks) [61]. Ka/Ks is a useful method for assessing whether or not protein-coding genes have evolved adaptively [62]. When Ka/Ks is greater than 1, there is a positive selection effect; when Ka/Ks is less than 1, there is a purifying selection effect. Comparatively, synonymous nucleotide substitutions occur more frequently in most biological genes and therefore Ka/Ks values are usually less than 1 [63]. In this study, we detected six positive selection genes. The Ka/Ks value of psaI related to photosynthesis was greater than 1 in the group of G. gynandra vs C. paradoxa. The value of psbH related to photosynthesis was also greater than 1 in groups of G. gynandra vs Thulinella chrysantha. This may be related to the similar growth environment of Gynandropsis plants and the similar light conditions for photosynthesis. The Ka/Ks values of three genes related to gene expression are greater than 1, including rpl23 in groups of G. gynandra vs T. hassleriana and G. gynandra vs C. paradoxa, rps11 in the group of G. gynandra vs C. paradoxa, and rps7 in groups of G. gynandra vs C. pallida and G. gynandra vs C. lutea. These indicate that the gene is undergoing rapid evolution recently, and further study on these genes has certain significance for the evolution of G. gynandra. ycf2 is an important enzyme coding gene in cp, located in the IR region of the cp genome of G. gynandra. The Ka/Ks value of ycf2 was greater than 1 in the group of G. gynandra vs T. hassleriana. The evolution speed of ycf2 is relatively fast, and the function of its encoded product is still unclear [64] . ycf2 has positive selection in the evolution of gymnosperms and other angiosperms, suggesting that this gene plays an important role in plant adaptation to environmental changes [65].
Chloroplast genomic data is valuable for analyzing species definitions, and based on genomic data, organelle-based "barcodes" can be created for certain species. The application of these barcodes can reveal phylogenetic relationships among species [11]. With the continuous development of sequencing technologies, chloroplast genome sequencing has become easier, and more and more studies have utilized complete chloroplast genome sequences to assess the phylogenetic relationships among angiosperms. In this study, phylogenetic relationships among angiosperms were constructed by ML and BI analyses using the complete chloroplast genome sequence data of almost all published Cleomaceae plants.
In this study, we used complete chloroplast genomes representing eight species in the family Cleomaceae to reconstruct phylogenetic relationships using maximum resolution and Bayesian inference methods. The two phylogenetic analyses (ML and BI) revealed congruent topologies based on the complete chloroplast genomes. We used complete chloroplast genomes that included all the Cleomaceae and other neighboring families, but many of species within the family were not included. Our results not only support the results of genetic relationships between traditionally classified families but also reclarify intergeneric relationships within the family Cleomaceae, especially among four species that are widely distributed in China, which can provide a more refined interpretation of evolutionary history of Cleomaceae.
The results showed that the Cleomaceae species investigated in this study were divided into two clades and the species in the same genus were clustered together to a certain degree. One of the species is one taxon, and seven species are clustered into another taxon. Among them, C. lutea was the first to diverge in Cleomaceae, indicating the relatively high genetic divergence between this species and others, followed by C. paradoxa and C. viscosa, which were early-diverging taxa in Cleomaceae. Similar results were obtained in phylogenetic research based on ndhf, matk and ycf1 [1]. Interestingly, these three genera are monotypic. Gynandropsis gynandra formed a monophyletic group. The sister relationships of the three clades in Cleomaceae, such as C. viscosa, G. gynandra and S. rutidosperma + T. hassleriana, are consistent with previous reports [1]. There are still unsolved enigmas in the phylogeny of Cleomaceae. This group is distributed across Asia, the Americas and Africa [4], we can 't get more plant material, so this research focuses on the four types of available material that are distributed in China.
Previous results of phylogenetic relationships have been derived from a limited number of molecular markers, such as only one marker, ITS [4,66,67], or two chloroplast markers, ndhF, matK [42] and trnL-trnF, ndhF [68]. Thus, the evolutionary relationships among Cleome branches remain unresolved [66,67,68,69,70]. rbcL, matK, ITS1 markers and selected RAPD (OPA-4 and RAPD-17), ISSR (ISSR-1 and ISSR-2)markers are suitable for distinguishing species of the genera Cleome, Corynandra and Cleoserrata speciosa [71]. Initial molecular analyses using plastid DNA regions (matK, ndhF, rbcL, trnL-trnF) indicated that Capparaceae was paraphyly, and suggested the closest genus to Brassicaceae has moved to Cleomaceae [68]. Using three cpDNA (ndhF, matK, ycf1), one mtDNA (rps3), and one nrDNA (ITS) region revision of the available results on the classification of the family Cleomaceae(Resolved phylogeny of Cleomaceae based on all three genomes)
The complete genome reliability results we got are higher than previous single-gene results. It plays an important part in confirming the taxonomic relationships of the Cleomaceae family. Compared with ITS, the complete genome classification results are significantly different, especially in G. gynandra.
The results using the seven markers we screened indicate that single genes are advantageous in differentiating family hierarchies in Cleomaceae. clpP and ndhF are the most suitable molecular markers for distinguishing Cleomaceae from other families. But when it comes to genus level, the classifications are less significant. At family level, it can sort out Cleomaceae and other families in Brassicaceae by using single-gene molecular markers. However, single-gene do not perform better in genera. The development of DNA barcodes that combine multiple genes may be needed to solve this problem.
Phylogeographic results based on morphological features, nuclear DNA markers, and some cp genomes are congruent with our phylogenetic conclusions. Alternatively, a different relationship of these paraphyletic groups was inferred from the morphological and molecular data, with an earlier divergence time for Arabidopsis thaliana than for Cleomaceae [64]. Our results are slightly different from previous studies, possibly due to sample limitations. We are in favor of the view that Cleomaceae is a sister to Capparaceae and together form the sister branch of Cleomaceae [72,73]. However, there is still a divergence between the classification of large groups and the results of previous authors.
Plants of the Cleomaceae family are not well-studied and new species continue to be reported. The morphological and molecular evidence used in taxonomy may be incomplete due to sampling difficulties. The unanswered questions in the Cleomaceae family may lead to additional follow-up studies. In order to gain a deeper understanding and determine the phylogeny of the species in the family Cleomaceae, future studies on more genera and more characterized genes are needed. The phylogenetic tree constructed in this study also provides a valuable resource for studying the taxonomy, phylogeny and evolutionary history of the Cleomaceae family.
4. Materials and Methods
4.1. Plant Material, DNA Extraction, and Genome Sequencing
Fresh young Corynandra viscosa and Sieruela rutidosperma plant material was collected at Nanjing Zhongshan Botanical Garden (118.83°E, 32.06°N) and South China Botanical Garden (113.37°E, 23.18°N) and the material was preserved by freezing using dry ice. Total genomic DNA was extracted from collected fresh plant leaves using a modified CTAB method [74]. After determining that the sample genome was satisfactory for testing, the DNA was fragmented using ultrasound, after which this was used for fragment purification, fragment end repair and A-addition at the 3′ end, and ligation of sequencing junctions. Fragment sizes were selected by agarose gel electrophoresis, and sequencing libraries were created by PCR amplification. The libraries that passed the library quality control were sequenced using the Illumina NovaSeq 6000 platform with a read length of 150 for double-end (PE) sequencing. The whole genome was sequenced by Nanjing Genepioneer Biotechnologies Inc. (Nanjing, China).
4.2. Chloroplast Genome Assembly And Annotation
Sequencing was performed using Fastp v0.20.0 (https://github.com/OpenGene/fastp) filtering of raw data, which requires removing sequencing junctions and primer sequences from the reads, filtering out the reads with average quality values less than Q5, and filtering out the reads with an N number greater than 5. To obtain clean data, the assembly core module was assembled using SPAdes v3.10.1 (http://cab.spbu.ru/software/spades/) [75] software to assemble the chloroplast genome, kmer was used 55, 87, and 121, respectively, and the assembly was not dependent on the reference genome. The cpDNA sequences were assembled using SPAdes v3.10.1 software to obtain the SEED of the chloroplast genome, and using SSPACE v2.0 (https://www.baseclear.com/services/bioinformatics/basetools/sspace-standard/) [76] software, the resulting contig sequences were ligated to obtain scaffolds; the obtained sequences were complemented with GAP using Gapfiller v2.1.1 [77] (https://sourceforge.net/projects/gapfiller/) software, and the work was repeated until the complete sequences were obtained and then genome corrections and coordinate rearrangements were performed
We used two methods to annotate the chloroplast genome to improve the accuracy of the annotation. Firstly, CDS annotation results of chloroplasts were obtained using prodigal v2.6.3 (https://www.github.com/hyattpd/Prodigal), after that HMMER v3.1b2 (http://www.hmmer.org/) ARAGORN v1.2.38 (http://130.235.244.92/ARAGORN/) software to predict rRNA and tRNA. Secondly, sequences of published closely related species were extracted to compare the assembled sequences using Blast v2.6 (https://blast.ncbi.nlm.nih.gov/Blast.cgi) to obtain the second annotation results. Afterwards, the two annotation results were manually checked and compared to remove errors and redundant annotations to determine the final annotation results.
OGDRAW v1.2 [78] was used to generate visualized circular gene maps. After checking the accuracy of the annotations and submitting the sequences to GenBank of NCBI database, GC content, codon usage and relative synonymous codon usage (RSCU) values were analyzed using MEGAX [79]. Repetitive sequences in the genome were identified using Vmatch v2.3.0 (http://www.vmatch.de/) with the following parameter settings minimum length of 30 bp and Hamming distance of 3. MISA v1.0 (http://pgrc.ipkgatersleben.de/misa/misa.html) was used to identify the settings for SSR sites in the genome: parameters 1-8, 2-5, 3-3, 4-3, 5-3, 6-3.
4.3. Chloroplast Genome Comparison and IR Boundary Analysis
Whole chloroplast genomes of Gynandropsis gynandra, Corynandra viscosa, and Sieruela rutidosperma were analyzed using the G. gynandra annotation as a reference and compared with the chloroplast genomes of five published species using the online comparison tool, mVISTA [80] . The five published species published species' chloroplast genomes were Thulinella chrysantha (MT948188), Cleome pallida (MT041700), Cleomella lutea (NC049613), Tarenaya hassleriana (NC034364) and Coalisina paradoxa (NC066812) were selected for the Shuffle-LAGAN [81] model to compare the cp genome sequences of the eight species. Expansion and contraction of IR boundaries is the main reason for the differences in the size of the chloroplast genomes, even though the IR region is usually considered to be the most conserved [82,83,84]. The boundaries of the LSC, SSC and IR regions of eight Cleomaceae species were compared and visualized using the SVG package in Perl. The eight chloroplast genome sequences were compared using MAFFT [85] under default parameters and nucleotide diversity (Pi) was detected using DnaSP v5.1 [86]. A sliding window length of 600 bp step of 200 b was selected to calculate Pi values. Homology and covariance of cp sequences were analyzed using Mauve v2.3.1 [87]. MAFFT software was used to compare the gene sequences and Ka/Ks Calculator v2.0 software was used to calculate the non-synonymous substitution rate (Ka), synonymous substitution rate (Ks), and Ka/Ks values of the genes.
4.4. Phylogenetic Analysis
To determine the phylogenetic position of Cleomaceae species, 23 complete chloroplast genome sequences (8 Cleomaceae species) were downloaded from NCBI GenBank. Using Capparaceae and Brassicaceae as outgroups (Table S7), these complete chloroplast genome sequences were utilized to determine the phylogenetic position of G. gynandra, C. viscosa, and S. rutidosperma within the Cleomaceae lineage. Twenty-three sequences were aligned using the default parameters of the MAFFT program, and phylogenetic analyses were performed using maximum likelihood (ML) and Bayesian inference (BI) methods. IQ-TREE and Ultrafast bootstrap were used for the ML analyses, and MrBayes was used for the BI analyses. GTR+F+R3 was selected as the IQ-TREE best-fit model for the complete chloroplast genome sequence based on BIC. The best-fit model for BI analysis was modeled using ModelFinder Bayesian Information Criterion (BIC) and GTR (General Time Reversible) + F+I+G. The parameter settings were set to the defaults when performing both ML and BI analyses. MAFFT, ModelFinder, IQ-TREE, Ultrafast bootstrap and MrBayes were used in PhyloSuite v1.2.2 [47].
We used OrthoFinder [88] and BLAST [89] at default settings to obtain homologous gene groups in the chloroplast genome. Potential molecular markers of Cleomaceae species were identified through the above results. PhyloSuite v1.2.2 is used to obtain intergenic regions and high variant regions (based on pi analysis). Evolutionary tree results apply MAFFT, ModelFinder, and IQ-TREE, using the same settings of complete genomes. All phylogenetic relationships were visualized by iTOL (https://itol.embl.de/).
5. Conclusions
In this study, we sequenced and analyzed the complete chloroplast genomes of three Cleomaceae species, revealing the basic structure, gene content, variability of these sequences, and the evolutionary relationships of Cleomaceae. IR regions were more conserved compared to LSC or SSC regions, while non-coding regions showed greater variability compared to gene-coding regions. The complete chloroplast genome can be used to establish phylogenetic relationships and resolve taxonomic relationships between genera. In contrast, single-gene and intergenic regions were not particularly suitable for classification. Future research is needed to further confirm the taxonomic relationships in Cleomaceae, and to conduct more extensive comparative analyses of Cleomaceae species to provide insights into the evolutionary adaptation of the family. According to phylogenetic research, a close relationship has been discovered between Cleome pallida and Thulinella chrysantha. Gynandropsis gynandra is sister to Sieruela rutidosperma and Tarenaya hassleriana. It also provides a new understanding of the relationship in Cleomaceae. The results of this study will not only support efforts to further clarify the evolutionary and phylogenetic relationships among Cleomaceae species but will also provide a useful reference for the development of genetic resources within Cleomaceae.
Supplementary Materials
The following supporting information can be downloaded at the website of this paper posted on Preprints.org.
Author Contributions
D.S., R.Z., L.Z. and Y.L. conceived and performed the original research project. D.S., R.Z. and Y.L. collected samples and performed the experiments. L.Z. and Y.L. designed the experiments and analyzed the data. R.Z. refined the project and wrote the manuscript with contributions from all authors. D.S. and Y.L. supervised the experiments and revised the writing. D.S. obtained the funding for the research project. All authors have read and agreed to the published version of the manuscript.
Funding
This research was funded by the National Natural Science Foundation of China [31300572], the Priority Academic Program Development of Jiangsu Higher Education Institutions (PAPD), and the Jiangsu Government Scholarship for Overseas Studies.
Data Availability Statement
The original sequence data of the 3 Cleomaceae plants have been submitted to the NCBI (www.ncbi.nlm.nih.gov) database and received GenBank accession numbers OP837968 (Corynandra viscosa), NC085364 (Sieruela rutidosperma), and NC054276 (Gynandropsis gynandra).
Conflicts of Interest
The authors declare no conflict of interest.
References
- Patchell, M.J.; Roalson, E.H.; Hall, J.C. Resolved Phylogeny of Cleomaceae Based on All Three Genomes. Taxon 2014, 63, 315–328. [Google Scholar] [CrossRef]
- Nozzolillo, C.; Amiguet, V.T.; Bily, A.C.; Harris, C.S.; Saleem, A.; Andersen, Ø.M.; Jordheim, M. Novel Aspects of the Flowers and Floral Pigmentation of Two Cleome Species (Cleomaceae), C. hassleriana and C. serrulata. Biochem. Syst. Ecol. 2010, 38, 361–369. [Google Scholar] [CrossRef]
- Patchell, M.J.; Bolton, M.C.; Mankowski, P.; Hall, J.C. Comparative Floral Development in Cleomaceae Reveals Two Distinct Pathways Leading to Monosymmetry. Int. J. Plant Sci. 2011, 172, 352–365. [Google Scholar] [CrossRef]
- Feodorova, T.A.; Voznesenskaya, E.V.; Edwards, G.E.; Roalson, E.H. Biogeographic Patterns of Diversification and the Origins of C4 in Cleome (Cleomaceae). Syst. Bot. 2010, 35, 811–826. [Google Scholar] [CrossRef]
- Huang, C.F.; Liu, W.Y.; Lu, M.Y.J.; Chen, Y.H.; Ku, M.S.B.; Li, W.H. Whole-Genome Duplication Facilitated the Evolution of C4 Photosynthesis in Gynandropsis gynandra. Mol. Bio.l Evol. 2021, 38, 4715–4731. [Google Scholar] [CrossRef] [PubMed]
- Cheng, S.; van den Bergh, E.; Zeng, P.; Zhong, X.; Xu, J.; Liu, X.; Hofberger, J.; de Bruijn, S.; Bhide, A.S.; Kuelahoglu, C.; et al. The Tarenaya hassleriana Genome Provides Insight into Reproductive Trait and Genome Evolution of Crucifers. Plant Cell 2013, 25, 2813–2830. [Google Scholar] [CrossRef]
- Chand, J.; Panda, S.R.; Jain, S.; Murty, U.; Das, A.M.; Kumar, G.J.; Naidu, V. Phytochemistry and Polypharmacology of Cleome Species: A Comprehensive Ethnopharmacological Review of the Medicinal Plants. J. Ethnopharmacol. 2022, 282, 114600. [Google Scholar] [CrossRef]
- Sogbohossou, E.; Achigan-Dako, E.G.; Maundu, P.; Solberg, S.; Deguenon, E.; Mumm, R.H.; Hale, I.; Van Deynze, A.; Schranz, M.E. A Roadmap for Breeding Orphan Leafy Vegetable Species: A Case Study of Gynandropsis gynandra (Cleomaceae). Hortic. Res. 2018, 5, 2. [Google Scholar] [CrossRef]
- Choi, K.S.; Park, S. The Complete Chloroplast Genome Sequence of Aster spathulifolius (Asteraceae); Genomic Features and Relationship with Asteraceae. Gene 2015, 572, 214–221. [Google Scholar] [CrossRef]
- Wu, L.; Nie, L.; Xu, Z.; Li, P.; Wang, Y.; He, C.; Song, J.; Yao, H. Comparative and Phylogenetic Analysis of the Complete Chloroplast Genomes of Three Paeonia Section Moutan Species (Paeoniaceae). Front. Genet. 2020, 11, 980. [Google Scholar] [CrossRef]
- Fan, R.; Ma, W.; Liu, S.; Huang, Q. Integrated Analysis of Three Newly Sequenced Fern Chloroplast Genomes: Genome Structure and Comparative Analysis. Ecol. Evol. 2021, 11, 4550–4563. [Google Scholar] [CrossRef] [PubMed]
- Li, C.; Zhao, Y.; Xu, Z.; Yang, G.; Peng, J.; Peng, X. Initial Characterization of the Chloroplast Genome of Vicia sepium, an Important Wild Resource Plant, and Related Inferences About Its Evolution. Front. Genet. 2020, 11, 73. [Google Scholar] [CrossRef] [PubMed]
- Luo, C.; Huang, W.; Sun, H.; Yer, H.; Li, X.; Li, Y.; Yan, B.; Wang, Q.; Wen, Y.; Huang, M.; et al. Comparative Chloroplast Genome Analysis of Impatiens Species (Balsaminaceae) in the Karst Area of China: Insights into Genome Evolution and Phylogenomic Implications. BMC Genomics 2021, 22, 571. [Google Scholar] [CrossRef]
- Cheng, Y.; Zhang, L.; Qi, J.; Zhang, L. Complete Chloroplast Genome Sequence of Hibiscus cannabinus and Comparative Analysis of the Malvaceae Family. Front. Genet. 2020, 11, 227. [Google Scholar] [CrossRef]
- Bondar, E.I.; Putintseva, Y.A.; Oreshkova, N.V.; Krutovsky, K.V. Siberian Larch (Larix Sibirica Ledeb.) Chloroplast Genome and Development of Polymorphic Chloroplast Markers. BMC Bioinformatics 2019, 20, 47–52. [Google Scholar] [CrossRef]
- Dashnow, H.; Tan, S.; Das, D.; Easteal, S.; Oshlack, A. Genotyping Microsatellites in Next-Generation Sequencing Data. BMC Bioinformatics 2015, 16, A5. [Google Scholar] [CrossRef]
- Baucom, R.S.; Estill, J.C.; Leebens-Mack, J.; Bennetzen, J.L. Natural Selection on Gene Function Drives the Evolution of LTR Retrotransposon Families in the Rice Genome. Genome Res. 2009, 19, 243–254. [Google Scholar] [CrossRef]
- Paterson, A.H.; Bowers, J.E.; Bruggmann, R.; Dubchak, I.; Grimwood, J.; Gundlach, H.; Haberer, G.; Hellsten, U.; Mitros, T.; Poliakov, A.; et al. The Sorghum Bicolor Genome and the Diversification of Grasses. Nature 2009, 457, 551–556. [Google Scholar] [CrossRef] [PubMed]
- SanMiguel, P.; Gaut, B.S.; Tikhonov, A.; Nakajima, Y.; Bennetzen, J.L. The Paleontology of Intergene Retrotransposons of Maize. Nat. Genet. 1998, 20, 43–45. [Google Scholar] [CrossRef]
- Schnable, P.S.; Ware, D.; Fulton, R.S.; Stein, J.C.; Wei, F.; Pasternak, S.; Liang, C.; Zhang, J.; Fulton, L.; Graves, T.A.; et al. The B73 Maize Genome: Complexity, Diversity, and Dynamics. Science 2009, 326, 1112–1115. [Google Scholar] [CrossRef]
- Morgante, M.; De Paoli, E.; Radovic, S. Transposable Elements and the Plant Pan-Genomes. Curr. Opin. Plant Biol. 2007, 10, 149–155. [Google Scholar] [CrossRef] [PubMed]
- Kim, S.; Boo, H.O.; Ahn, T.; Bae, C.S. Protective Effects of Erythronium Japonicum and Corylopsis coreana Uyeki Extracts against 1, 3-Dichloro-2-Propanol-Induced Hepatotoxicity in Rats. Appl. Microsc. 2020, 50, 29. [Google Scholar] [CrossRef] [PubMed]
- Yang, Z.; Wang, G.; Ma, Q.; Ma, W.; Liang, L.; Zhao, T. The Complete Chloroplast Genomes of Three Betulaceae Species: Implications for Molecular Phylogeny and Historical Biogeography. PeerJ 2019, 7, e6320. [Google Scholar] [CrossRef] [PubMed]
- Ye, X.; Zhang, M.; Jiang, Y.; Fan, H.; Chen, S.; Liu, B. The Complete Chloroplast Genome of Altingia chinensis (Hamamelidaceae). Mitochondr. DNA B. 2020, 5, 1808–1809. [Google Scholar] [CrossRef]
- van den Bergh, E.; Külahoglu, C.; Bräutigam, A.; Hibberd, J.M.; Weber, A.P.; Zhu, X.G.; Schranz, M.E. Gene and Genome Duplications and the Origin of C4 Photosynthesis: Birth of a Trait in the Cleomaceae. Curr. Plant Biol. 2014, 1, 2–9. [Google Scholar] [CrossRef]
- Arana, M.D.; Oggero, A.J. New Combinations in Tarenaya (Cleomaceae) for the Argentinian Flora. Phytotaxa 2016, 267, 162–164. [Google Scholar] [CrossRef]
- Eslami-Farouji, A.; Khosravi, A.R.; Çetin, Ö.; Mohsenzadeh, S. Unmasking the Phylogenetic Topology of Southwest Asian Cleomes (Cleomaceae) as a Precursor to Taxonomic Delimitation: Insights into Main Lineages and Important Morphological Characteristics. Genet. Resour. Crop Evol. 2024, 68, 2655–2667. [Google Scholar] [CrossRef]
- El Zayat, M.A.S.; Ali, M.E.S.; Amar, M.H. A Systematic Revision of Capparaceae and Cleomaceae in Egypt: An Evaluation of the Generic Delimitations of Capparis and Cleome Using Ecological and Genetic Diversity. J. Genet. Eng. Biotechnol. 2020, 18, 58. [Google Scholar] [CrossRef]
- Iltis, H.H.; Cochrane, T.S. Studies in the Cleomaceae V: A New Genus and Ten New Combinations for the Flora of North America. Novon 2007, 17, 447–451. [Google Scholar] [CrossRef]
- Bayat, S.; Schranz, M.E.; Roalson, E.H.; Hall, J.C. Lessons from Cleomaceae, the sister of crucifers. Trends Plant Sci. 2018, 23, 808–821. [Google Scholar] [CrossRef]
- Soares Neto, R.L.; Thomas, W.W.; de Vasconcellos Barbosa, M.R.; Roalson, E.H. Diversification of New World Cleomaceae with Emphasis on Tarenaya and the Description of Iltisiella, a New Genus. Taxon 2020, 69, 321–336. [Google Scholar] [CrossRef]
- Arif, I.A.; Bakir, M.A.; Khan, H.A.; Al Farhan, A.H.; Al Homaidan, A.A.; Bahkali, A.H.; Al Sadoon, M.; Shobrak, M. A Brief Review of Molecular Techniques to Assess Plant Diversity. Int. J. Mol. Sci. 2010, 11, 2079–2096. [Google Scholar] [CrossRef] [PubMed]
- Zhang, J.; Wang, J.; Xia, T.; Zhou, S. DNA barcoding: species delimitation in tree peonies. Sci. China C. Life Sci. 2009, 52, 568–578. [Google Scholar] [CrossRef] [PubMed]
- Cho, M.S.; Yang, J.Y.; Yang, T.J.; Kim, S.C. Evolutionary comparison of the chloroplast genome in the Woody Sonchus Alliance (Asteraceae) on the Canary Islands. Genes 2019, 10, 217. [Google Scholar] [CrossRef] [PubMed]
- Yang, C.H.; Liu, X.; Cui, Y.X.; Nie, L.P.; Lin, Y.L.; Wei, X.P.; Wang, Y.; Yao, H. Molecular structure and phylogenetic analyses of the complete chloroplast genomes of three original species of Pyrrosiae Folium. Chin. J. Nat. Med. 2020, 18, 573–581. [Google Scholar] [CrossRef] [PubMed]
- Gunn, B.F.; Murphy, D.J.; Walsh, N.G.; Conran, J.G.; Pires, J.C.; Macfarlane, T.D.; Crisp, M.D.; Cook, L.G.; Birch, J.L. Genomic Data Resolve Phylogenetic Relationships of Australian Mat-Rushes, Lomandra (Asparagaceae: Lomandroideae). Bot. J. Linn. Soc. 2024, 204, 1–22. [Google Scholar] [CrossRef]
- Xiong, Y.; Xiong, Y.; He, J.; Yu, Q.; Zhao, J.; Lei, X.; Dong, Z.; Yang, J.; Peng, Y.; Zhang, X.; Ma, X. The Complete Chloroplast Genome of Two Important Annual Clover Species, Trifolium alexandrinum and T. resupinatum: Genome Structure, Comparative Analyses and Phylogenetic Relationships with Relatives in Leguminosae. Plants 2020, 9, 478. [Google Scholar] [CrossRef]
- Jocelyn, C. H. Systematics of Capparaceae and Cleomaceae: an evaluation of the generic delimitations of Capparis and Cleome using plastid DNA sequence data. Botany 2008, 86, 682–696. [Google Scholar] [CrossRef]
- Wu, L.; Nie, L.; Wang, Q.; Xu, Z.; Wang, Y.; He, C.; Song, J.; Yao, H. Comparative and Phylogenetic Analyses of the Chloroplast Genomes of Species of Paeoniaceae. Sci. Rep. 2021, 11, 14643. [Google Scholar] [CrossRef]
- Yang, Z.; Zhao, T.; Ma, Q.; Liang, L.; Wang, G. Comparative Genomics and Phylogenetic Analysis Revealed the Chloroplast Genome Variation and Interspecific Relationships of Corylus (Betulaceae) Species. Front. Plant Sci. 2018, 9, 927. [Google Scholar] [CrossRef]
- Asaf, S.; Khan, A.L.; Khan, M.A.; Shahzad, R.; Lubna; Kang, S.M.; Al-Harrasi, A.; Al-Rawahi, A.; Lee, I.J. Complete Chloroplast Genome Sequence and Comparative Analysis of Loblolly Pine (Pinus taeda L.) with Related Species. PLoS ONE 2018, 13, e0192966. [Google Scholar] [CrossRef] [PubMed]
- Clegg, M.T.; Gaut, B.S.; Learn Jr, G.H.; Morton, B.R. Rates and Patterns of Chloroplast DNA Evolution. Proc. Natl. Acad. Sci. U. S. A. 1994, 91, 6795–6801. [Google Scholar] [CrossRef] [PubMed]
- Liu, X.; Chang, E.M.; Liu, J.F.; Huang, Y.N.; Wang, Y.; Yao, N.; Jiang, Z.P. Complete Chloroplast Genome Sequence and Phylogenetic Analysis of Quercus bawanglingensis Huang, Li et Xing, a Vulnerable Oak Tree in China. Forests. 2019, 10, 587. [Google Scholar] [CrossRef]
- Simeone, M.C.; Cardoni, S.; Piredda, R.; Imperatori, F.; Avishai, M.; Grimm, G.W.; Denk, T. Comparative Systematics and Phylogeography of Quercus Section Cerris in Western Eurasia: Inferences from Plastid and Nuclear DNA Variation. PeerJ 2018, 6, e5793. [Google Scholar] [CrossRef] [PubMed]
- Fan, R.; Ma, W.; Liu, S.; Huang, Q. Integrated analysis of three newly sequenced fern chloroplast genomes: Genome structure and comparative analysis. Ecol. Evol. 2021, 11, 4550–4563. [Google Scholar] [CrossRef]
- Zhang, D.; Wang, J.; Xu, L.; Xing, Y.; Zhang, T.; Li, S.; Yang, Y.; Bao, G.; Ao, W.; Kang, T. Characteristic and Phylogenetic Analysis of the Complete Chloroplast Genomes of Three Medicinal Plants of Schisandraceae. Biomed. Res. Int. 2020, 2020, 3536761. [Google Scholar] [CrossRef]
- Zhang, D.; Gao, F.; Jakovlić, I.; Zou, H.; Zhang, J.; Li, W.X.; Wang, G.T. PhyloSuite: An Integrated and Scalable Desktop Platform for Streamlined Molecular Sequence Data Management and Evolutionary Phylogenetics Studies. Mol. Ecol. Resour. 2020, 20, 348–355. [Google Scholar] [CrossRef]
- Chen, L.; Lan, L.; He, H.; Chen, Z.; She, S.; Liu, Y.; Lü, B. Progress in the Studies of ClpP: From Bacteria to Human Mitochondria. Chin. J. Cell Biol. 2014, 36, 717–725. [Google Scholar] [CrossRef]
- Guo, S.; Guo, L.; Zhao, W.; Xu, J.; Li, Y.; Zhang, X.; Shen, X.; Wu, M.; Hou, X. Complete Chloroplast Genome Sequence and Phylogenetic Analysis of Paeonia ostii. Molecules 2018, 23, 246. [Google Scholar] [CrossRef]
- Naver, H.; Boudreau, E.; Rochaix, J.D. Functional Studies of Ycf3: Its Role in Assembly of Photosystem I and Interactions with Some of Its Subunits. Plant Cell 2001, 13, 2731–2745. [Google Scholar] [CrossRef]
- Asaf, S.; Khan, A.L.; Khan, M.A.; Waqas, M.; Kang, S.M.; Yun, B.W.; Lee, I.J. Chloroplast Genomes of Arabidopsis halleri ssp. gemmifera and Arabidopsis lyrata Ssp. Petraea: Structures and Comparative Analysis. Sci. Rep. 2017, 7, 7556. [Google Scholar] [CrossRef] [PubMed]
- Akhunov, E.D.; Akhunova, A.R.; Anderson, O.D.; Anderson, J.A.; Blake, N.; Clegg, M.T.; Coleman-Derr, D.; Conley, E.J.; Crossman, C.C.; Deal, K.R.; et al. Nucleotide Diversity Maps Reveal Variation in Diversity among Wheat Genomes and Chromosomes. BMC Genomics 2010, 11, 1–22. [Google Scholar] [CrossRef] [PubMed]
- Khakhlova, O.; Bock, R. Elimination of Deleterious Mutations in Plastid Genomes by Gene Conversion. Plant J. 2006, 46, 85–94. [Google Scholar] [CrossRef]
- Shaw, J.; Lickey, E.B.; Schilling, E.E.; Small, R.L. Comparison of Whole Chloroplast Genome Sequences to Choose Noncoding Regions for Phylogenetic Studies in Angiosperms: The Tortoise and the Hare III. Am. J. Bot. 2007, 94, 275–288. [Google Scholar] [CrossRef] [PubMed]
- Hollingsworth, P.M.; Forrest, L.L.; Spouge, J.L.; Hajibabaei, M.; Ratnasingham, S.; van der Bank, M.; Chase, M.W.; Cowan, R.S.; Erickson, D.L. ; others A DNA Barcode for Land Plants. Proc. Natl. Acad. Sci. U. S. A. 2009, 106, 12794–12797. [Google Scholar] [CrossRef]
- Yang, J.; Vázquez, L.; Chen, X.; Li, H.; Zhang, H.; Liu, Z.; Zhao, G. Development of Chloroplast and Nuclear DNA Markers for Chinese Oaks (Quercus Subgenus Quercus) and Assessment of Their Utility as DNA Barcodes. Front. Plant Sci. 2017, 8, 816. [Google Scholar] [CrossRef]
- Song, Y.; Chen, Y.; Lv, J.; Xu, J.; Zhu, S.; Li, M.; Chen, N. Development of chloroplast genomic resources for Oryza species discrimination. Front. Plant Sci. 2017, 8, 1854. [Google Scholar] [CrossRef]
- Krawczyk, K.; Nobis, M.; Myszczyński, K.; Klichowska, E.; Sawicki, J. Plastid Super-Barcodes as a Tool for Species Discrimination in Feather Grasses (Poaceae: Stipa). Sci. Rep. 2018, 8, 1924. [Google Scholar] [CrossRef]
- Liu, Y.C.; Lin, B.Y.; Lin, J.Y.; Wu, W.L.; Chang, C.C. Evaluation of Chloroplast DNA Markers for Intraspecific Identification of Phalaenopsis equestris Cultivars. Sci. Hortic. 2016, 203, 86–94. [Google Scholar] [CrossRef]
- Lohmueller, K.E.; Albrechtsen, A.; Li, Y.; Kim, S.Y.; Korneliussen, T.; Vinckenbosch, N.; Tian, G.; Huerta-Sanchez, E.; Feder, A.F.; Grarup, N.; et al. Natural Selection Affects Multiple Aspects of Genetic Variation at Putatively Neutral Sites across the Human Genome. PLoS Genet. 2011, 7, e1002326. [Google Scholar] [CrossRef]
- Nekrutenko, A.; Makova, K.D.; Li, W.H. The K(A)/K(S) Ratio Test for Assessing the Protein-Coding Potential of Genomic Regions: An Empirical and Simulation Study. Genome Res. 2002, 12, 198–202. [Google Scholar] [CrossRef]
- Wang, D.; Liu, F.; Wang, L.; Huang, S.; Yu, J. (2011). Nonsynonymous substitution rate (Ka) is a relatively consistent parameter for defining fast-evolving and slow-evolving protein-coding genes. Biol. Direct 2011, 6, 1–17. [Google Scholar] [CrossRef] [PubMed]
- Makałowski, W.; Boguski, M.S. Evolutionary Parameters of the Transcribed Mammalian Genome: An Analysis of 2,820 Orthologous Rodent and Human Sequences. Proc. Natl. Acad. Sci. U. S. A. 1998, 95, 9407–9412. [Google Scholar] [CrossRef] [PubMed]
- Drescher, A.; Ruf, S.; Calsa Jr, T.; Carrer, H.; Bock, R. The Two Largest Chloroplast Genome-Encoded Open Reading Frames of Higher Plants Are Essential Genes. Plant J. 2000, 22, 97–104. [Google Scholar] [CrossRef] [PubMed]
- Wicke, S.; Schneeweiss, G.M.; Depamphilis, C.W.; Müller, K.F.; Quandt, D. The evolution of the plastid chromosome in land plants: gene content, gene order, gene function. Plant Mol. Biol. 2011, 76, 273–297. [Google Scholar] [CrossRef]
- Sánchez-Acebo, L. A Phylogenetic Study of the New World Cleome (Brassicaceae, Cleomoideae). Ann. Mo. Bot. Gard. 2005, 92, 179–201. [Google Scholar]
- Inda, L.A.; Torrecilla, P.; Catalán, P.; Ruiz-Zapata, T. Phylogeny of Cleome L. and Its Close Relatives Podandrogyne Ducke and Polanisia Raf. (Cleomoideae, Cleomaceae) Based on Analysis of Nuclear ITS Sequences and Morphology. Plant Syst. Evol. 2008, 274, 111–126. [Google Scholar] [CrossRef]
- Hall, J.C.; Sytsma, K.J.; Iltis, H.H. Phylogeny of Capparaceae and Brassicaceae Based on Chloroplast Sequence Data. Am. J. Bot. 2002, 89, 1826–1842. [Google Scholar] [CrossRef]
- Shilla, O.; Dinssa, F.F.; Omondi, E.O.; Winkelmann, T.; Abukutsa-Onyango, M. Cleome gynandra L. origin, taxonomy and morphology: A review. Asian. J. Agric. Res. 2019, 14, 1568–1583. [Google Scholar] [CrossRef]
- Feodorova, T.A.; Voznesenskaya, E.V.; Edwards, G.E.; Roalson, E.H. Biogeographic Patterns of Diversification and the Origins of C4 in Cleome (Cleomaceae). Syst. Bot. 2010, 35, 811–826. [Google Scholar] [CrossRef]
- Tamboli, A.S.; Patil, S.M.; Gholave, A.R.; Kadam, S.K.; Kotibhaskar, S.V.; Yadav, S.R.; Govindwar, S.P. Phylogenetic analysis, genetic diversity and relationships between the recently segregated species of Corynandra and Cleoserrata from the genus Cleome using DNA barcoding and molecular markers. C. R. Biol. 2016, 339, 123–132. [Google Scholar] [CrossRef]
- Couvreur, T.L.; Franzke, A.; Al-Shehbaz, I.A.; Bakker, F.T.; Koch, M.A.; Mummenhoff, K. Molecular Phylogenetics, Temporal Diversification, and Principles of Evolution in the Mustard Family (Brassicaceae). Mol. Biol. Evol. 2010, 27, 55–71. [Google Scholar] [CrossRef] [PubMed]
- Alzahrani, D.; Albokhari, E.; Yaradua, S.; Abba, A. Complete Chloroplast Genome Sequences of Dipterygium glaucum and Cleome chrysantha and Other Cleomaceae Species, Comparative Analysis and Phylogenetic Relationships. Saudi, J. Biol. Sci. 2021, 28, 2476–2490. [Google Scholar] [CrossRef] [PubMed]
- Aboul-Maaty, N.A.-F.; Oraby, H.A.S. Extraction of High-Quality Genomic DNA from Different Plant Orders Applying a Modified CTAB-Based Method. Bull. Natl. Res. Cent. 2019, 43, 1–10. [Google Scholar] [CrossRef]
- Bankevich, A.; Nurk, S.; Antipov, D.; Gurevich, A.A.; Dvorkin, M.; Kulikov, A.S.; Lesin, V.M.; Nikolenko, S.I.; Pham, S.; Prjibelski, A.D.; Pyshkin, A.V.; Sirotkin, A.V.; Vyahhi, N.; Tesler, G.; Alekseyev, M.A.; Pevzner, P.A. SPAdes: A new genome assembly algorithm and its applications to single-cell sequencing. J. Comput. Biol. 2012, 19, 455–477. [Google Scholar] [CrossRef] [PubMed]
- Acemel, R.D.; Tena, J.J.; Irastorza-Azcarate, I.; Marlétaz, F.; GómezMarín, C.; de la Calle-Mustienes, E.; Bertrand, S.; Diaz, S.G. , Aldea, D.; Aury, J.-M.; Mangenot, S.; Hol-land, P.W.H.; Devos, D.P.; Maeso, I., Escrivá, H.; Gómez-Skarmeta, J.L. A single three-dimensional chromatin compartment in amphioxus indicates a step-wise evolution of vertebrate Hox bimodal regulation. Nat. Genet. 2016, 48, 336–341. [Google Scholar] [CrossRef] [PubMed]
- Boetzer, M.; Pirovano, W. Toward almost closed genomes with GapFiller. Genome Biol. 2012, 13, R56. [Google Scholar] [CrossRef]
- Lohse, M.; Drechsel, O.; Bock, R. Organellar Genome DRAW (OGDRAW): A tool for the easy generation of high-quality custom graphical maps of plastid and mitochondrial genomes. Curr. Genet. 2007, 52, 267–274. [Google Scholar] [CrossRef]
- Kumar, S.; Stecher, G.; Tamura, K. MEGA7: Molecular Evolutionary Genetics Analysis Version 7.0 for Bigger Datasets. Mol. Biol. Evol. 2016, 33, 1870–1874. [Google Scholar] [CrossRef]
- Mayor, C.; Brudno, M.; Schwartz, J.R.; Poliakov, A.; Rubin, E.M.; Frazer, K.A.; Pachter, L.S.; Dubchak, I. VISTA: Visualizing Global DNA Sequence Alignments of Arbitrary Length. Bioinformatics 2000, 16, 1046–1047. [Google Scholar] [CrossRef]
- Frazer, K.A.; Pachter, L.; Poliakov, A.; Rubin, E.M.; Dubchak, I. VISTA: Computational Tools for Comparative Genomics. Nucleic Acids Res. 2004, 32, W273–W279. [Google Scholar] [CrossRef]
- Kode, V.; Mudd, E.A.; Iamtham, S.; Day, A. The Tobacco Plastid accD Gene Is Essential and Is Required for Leaf Development. Plant J. 2005, 44, 237–244. [Google Scholar] [CrossRef]
- Raubeson, L.A.; Peery, R.; Chumley, T.W.; Dziubek, C.; Fourcade, H.M.; Boore, J.L.; Jansen, R.K. Comparative Chloroplast Genomics: Analyses Including New Sequences from the Angiosperms Nuphar advena and Ranunculus macranthus. BMC Genomics 2007, 8, 1–27. [Google Scholar] [CrossRef]
- Yao, X.; Tang, P.; Li, Z.; Li, D.; Liu, Y.; Huang, H. The First Complete Chloroplast Genome Sequences in Actinidiaceae: Genome Structure and Comparative Analysis. PloS ONE 2015, 10, e0129347. [Google Scholar] [CrossRef] [PubMed]
- Katoh, K.; Standley, D.M. MAFFT Multiple Sequence Alignment Software Version 7: Improvements in Performance and Usability. Mol. Biol. Evol. 2013, 30, 772–780. [Google Scholar] [CrossRef] [PubMed]
- Librado, P.; Rozas, J. DnaSP v5: A software for comprehensive analysis of DNA polymorphism data. Bioinformatics 2009, 25, 1451–1452. [Google Scholar] [CrossRef]
- Darling, A.C.; Mau, B.; Blattner, F.R.; Perna, N.T. Mauve: Multiple Alignment of Conserved Genomic Sequence with Rearrangements. Genome Res. 2004, 14, 1394–1403. [Google Scholar] [CrossRef] [PubMed]
- Emms, D.M.; Kelly, S. OrthoFinder: Phylogenetic Orthology Inference for Comparative Genomics. Genome Biol. 2019, 20, 238. [Google Scholar] [CrossRef]
- Camacho, C.; Coulouris, G.; Avagyan, V.; Ma, N.; Papadopoulos, J.; Bealer, K.; Madden, T.L. BLAST+: Architecture and Applications. BMC bioinformatics 2009, 10, 1–9. [Google Scholar] [CrossRef]
Figure 1.
The chloroplast genome maps of Corynandra viscosa, Sieruela rutidosperma, and Gynandropsis gynandra. Genes on the inside of the circle are transcribed clockwise and those on the outside are transcribed counter-clockwise. The darker gray inner circle corresponds to the GC content, whereas the lighter gray indicates the A/T content. Different colors represent different functional genes.
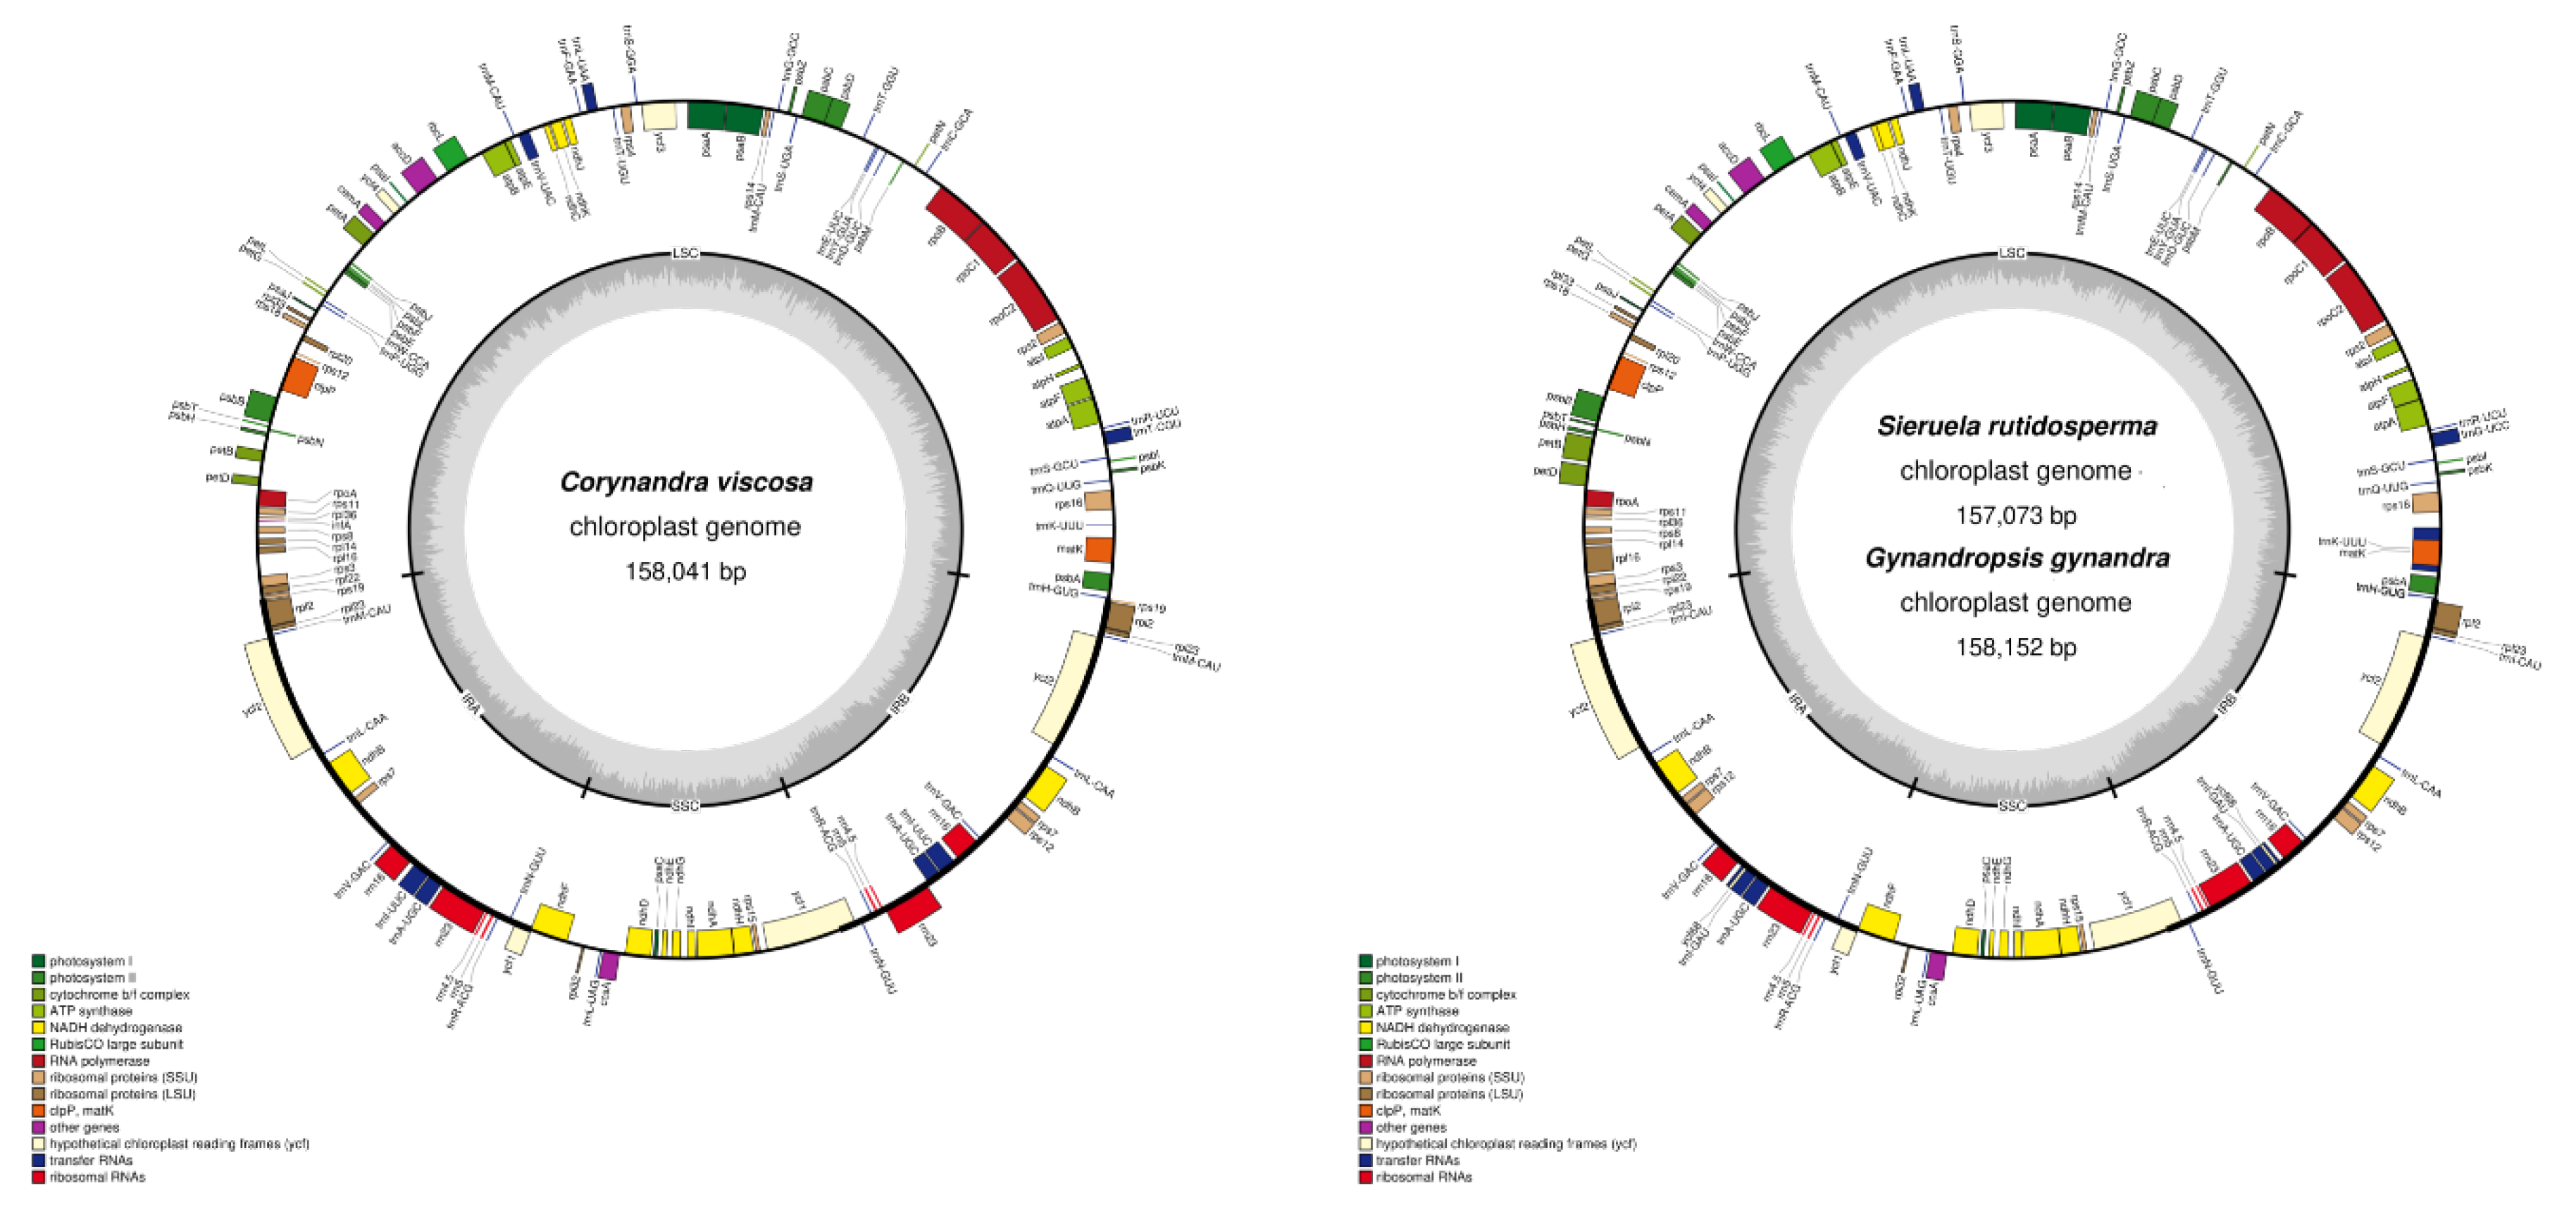
Figure 2.
Codon content of 20 amino acids and stop codons in the protein-coding genes of the chloroplast genomes of the three Cleomaceae species. (a) Corynandra viscosa; (b) Sieruela rutidosperma; (c) Gynandropsis gynandra.
Figure 2.
Codon content of 20 amino acids and stop codons in the protein-coding genes of the chloroplast genomes of the three Cleomaceae species. (a) Corynandra viscosa; (b) Sieruela rutidosperma; (c) Gynandropsis gynandra.
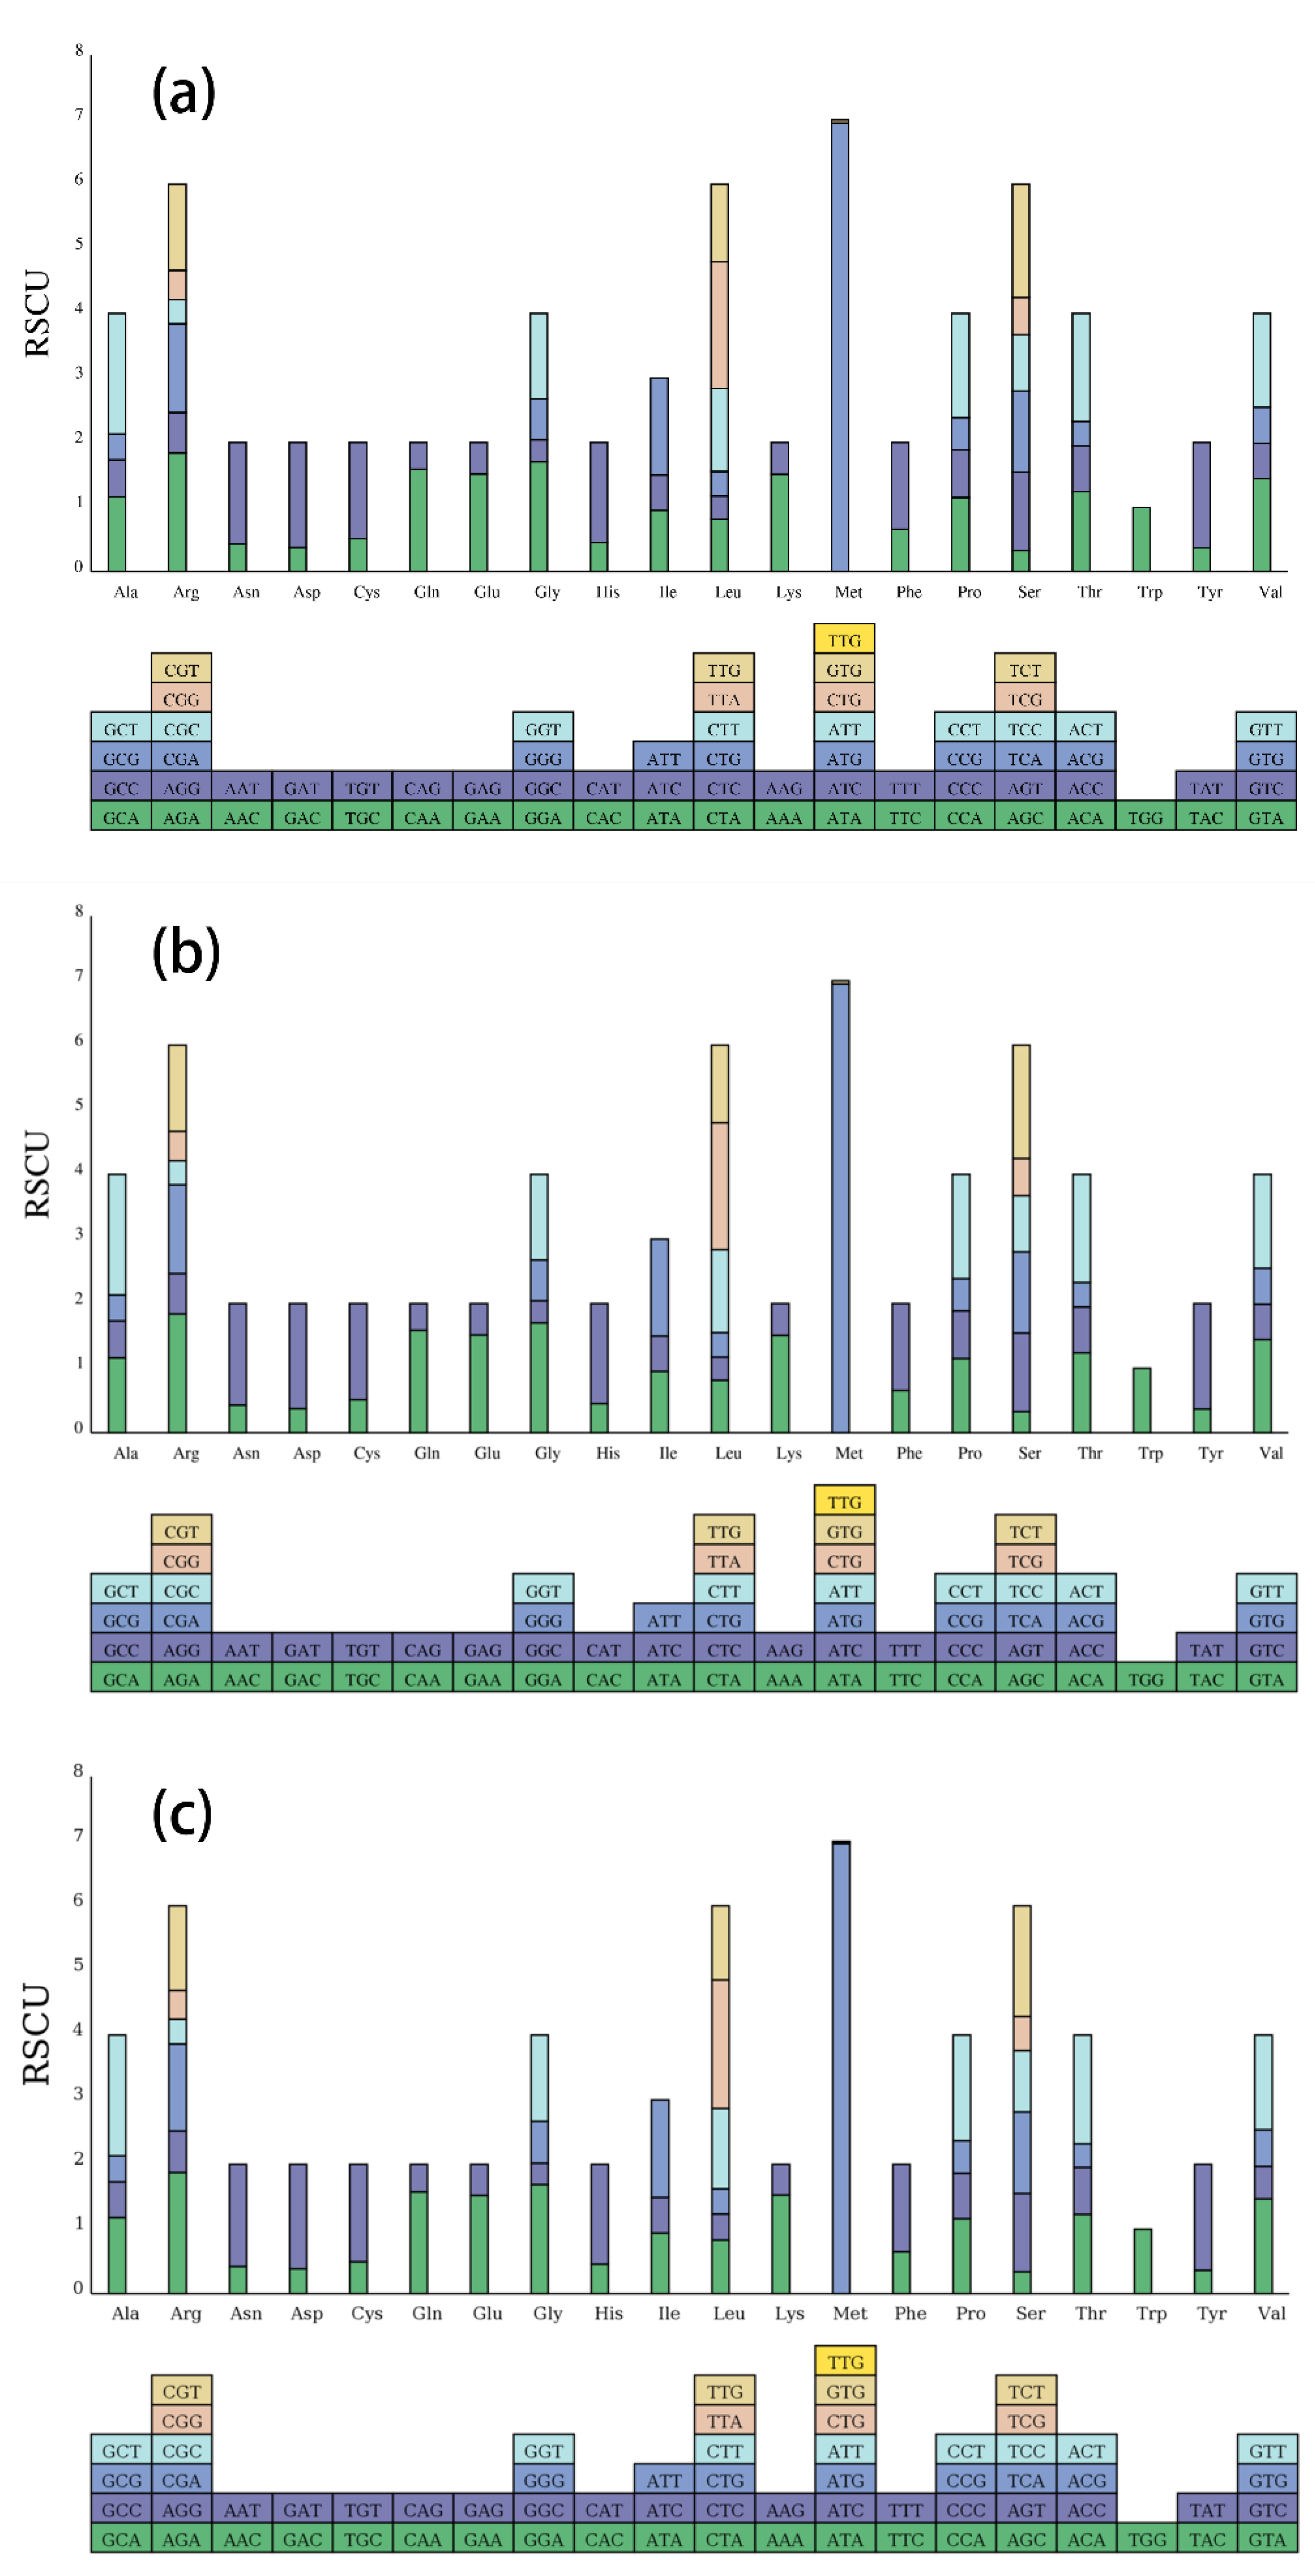
Figure 3.
Analysis of repeated sequences in the three Cleomaceae chloroplast genomes. (a) Frequency of repeat types; (b) Frequency of repeat sequences by length.
Figure 3.
Analysis of repeated sequences in the three Cleomaceae chloroplast genomes. (a) Frequency of repeat types; (b) Frequency of repeat sequences by length.

Figure 4.
Frequency of SSRs in the different repeat class types. (a) Corynandra viscosa; (b) Sieruela rutidosperma; (c) Gynandropsis gynandra.
Figure 4.
Frequency of SSRs in the different repeat class types. (a) Corynandra viscosa; (b) Sieruela rutidosperma; (c) Gynandropsis gynandra.
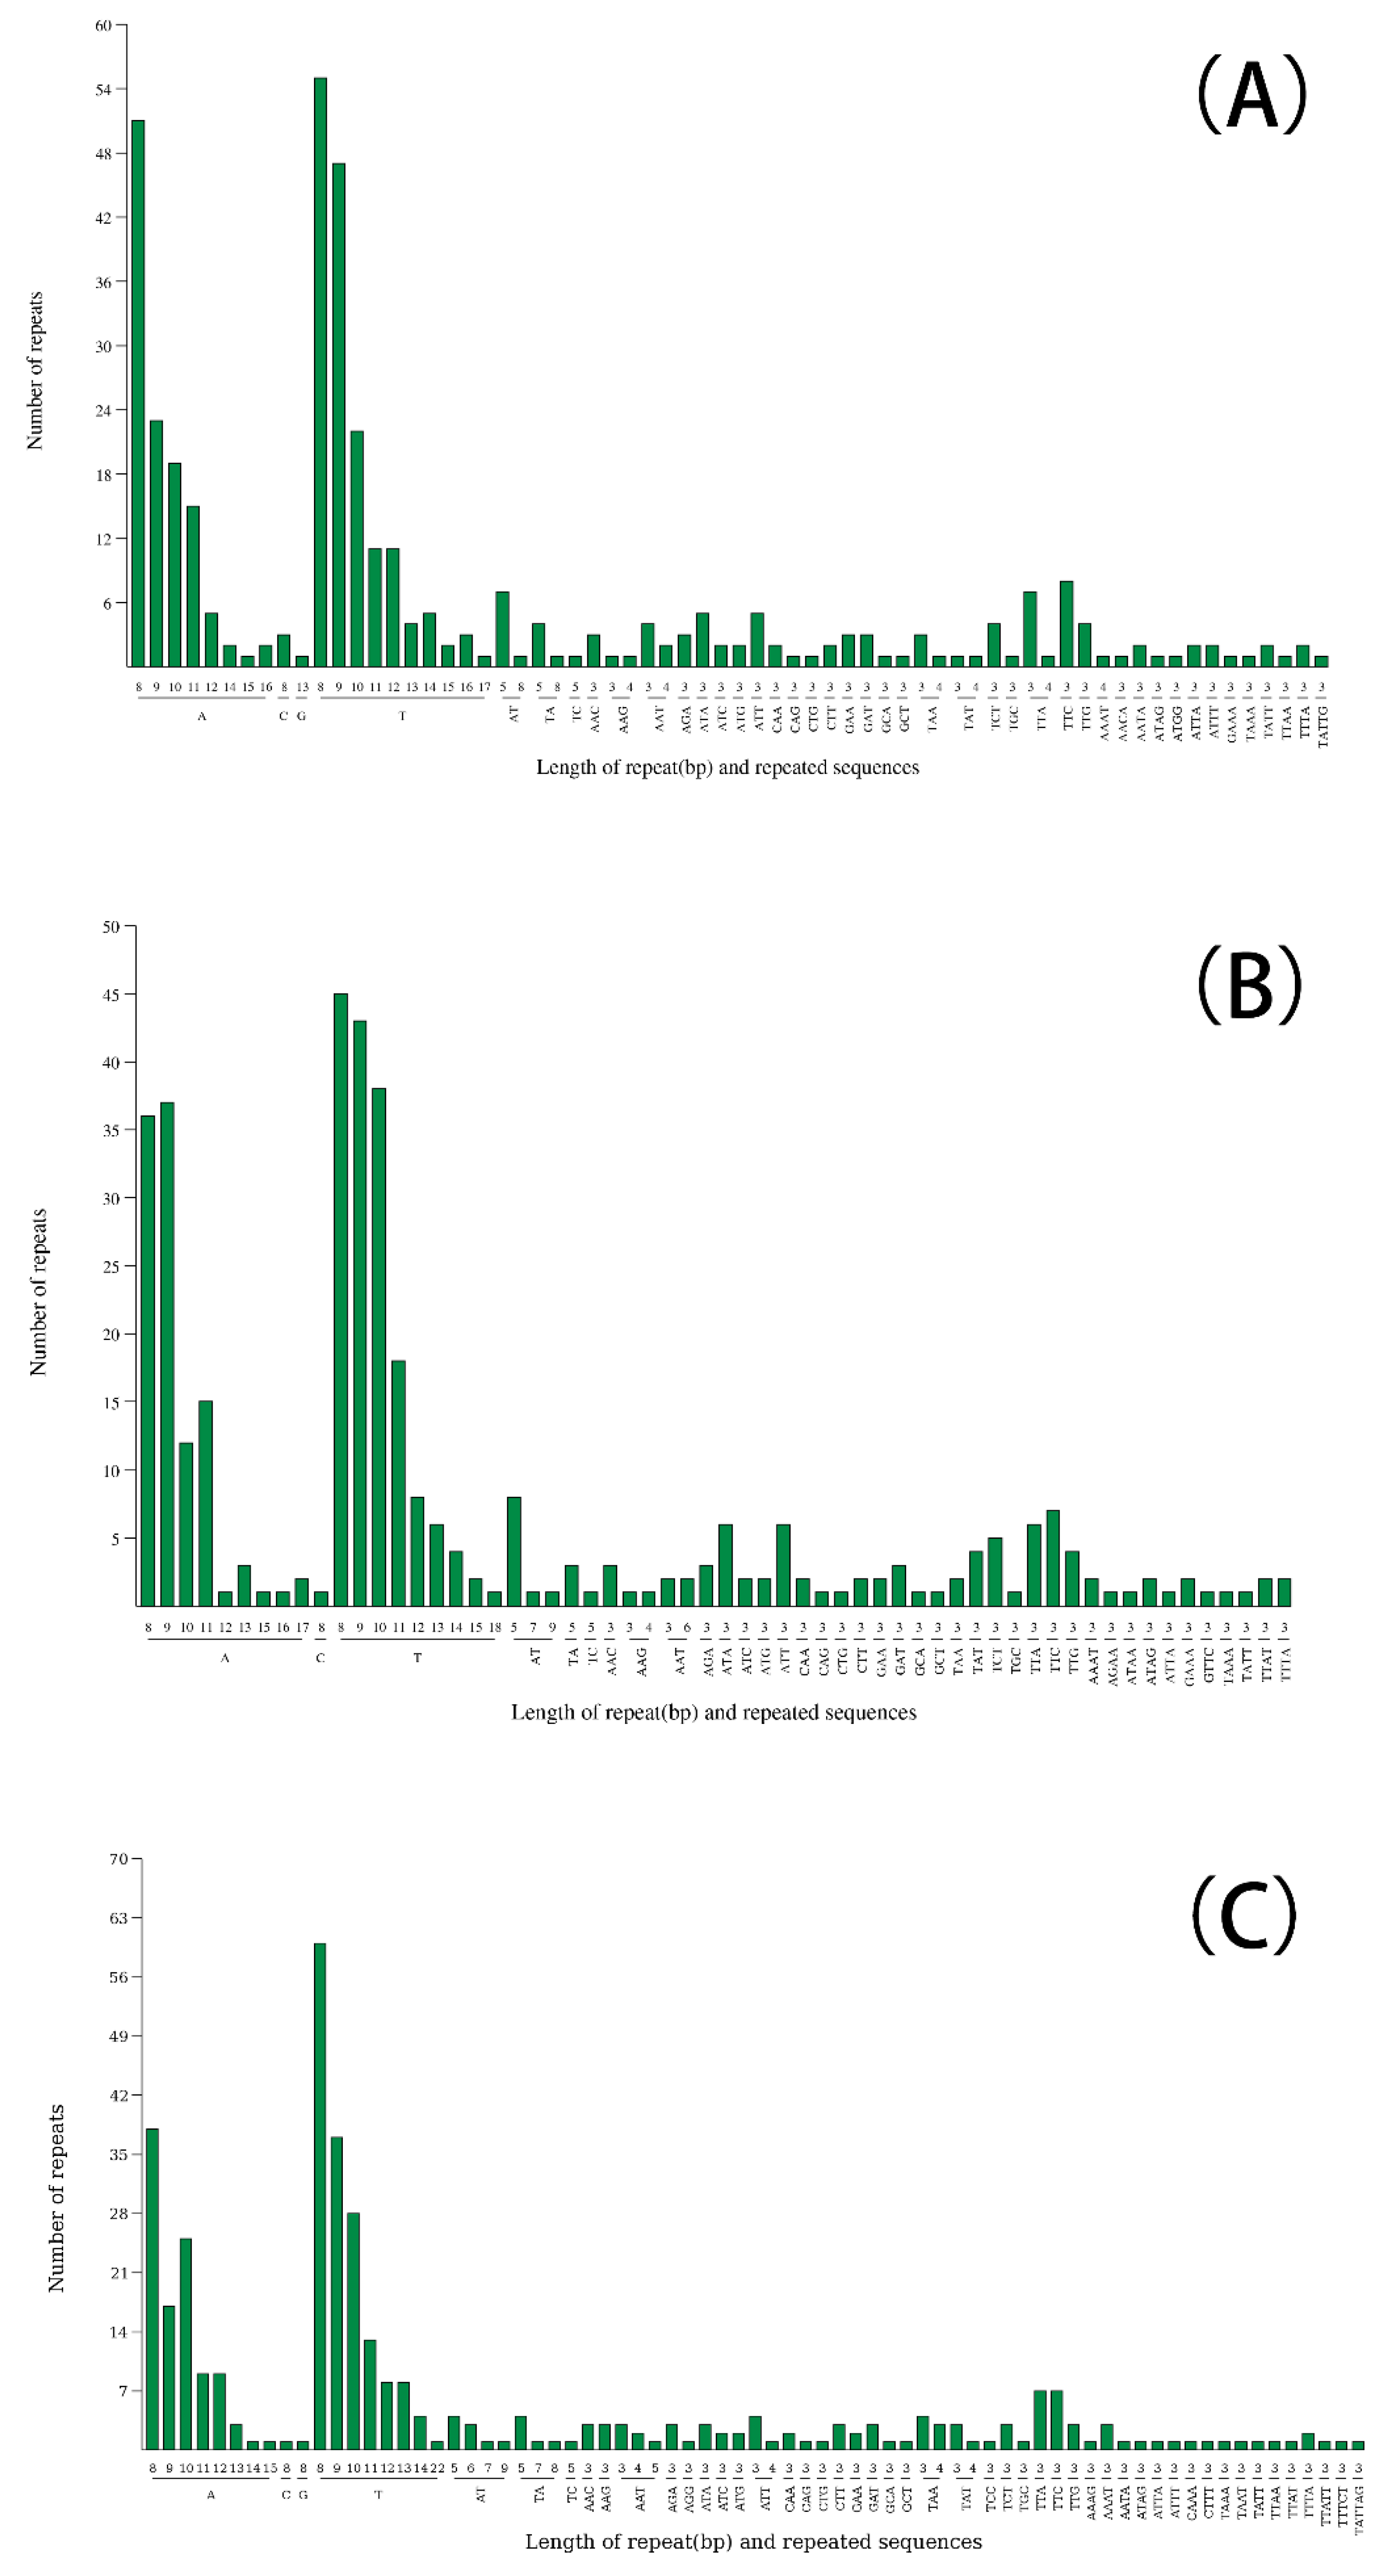
Figure 5.
Complete chloroplast genome alignments of eight Cleomaceae species using the mVISTA program, with the chloroplast genome of Gynandropsis gynandra as a reference. The horizontal axis indicates the coordinates within the chloroplast genome. The vertical scale indicates the percent identity within 50–100%. Annotated genes are displayed along the top.
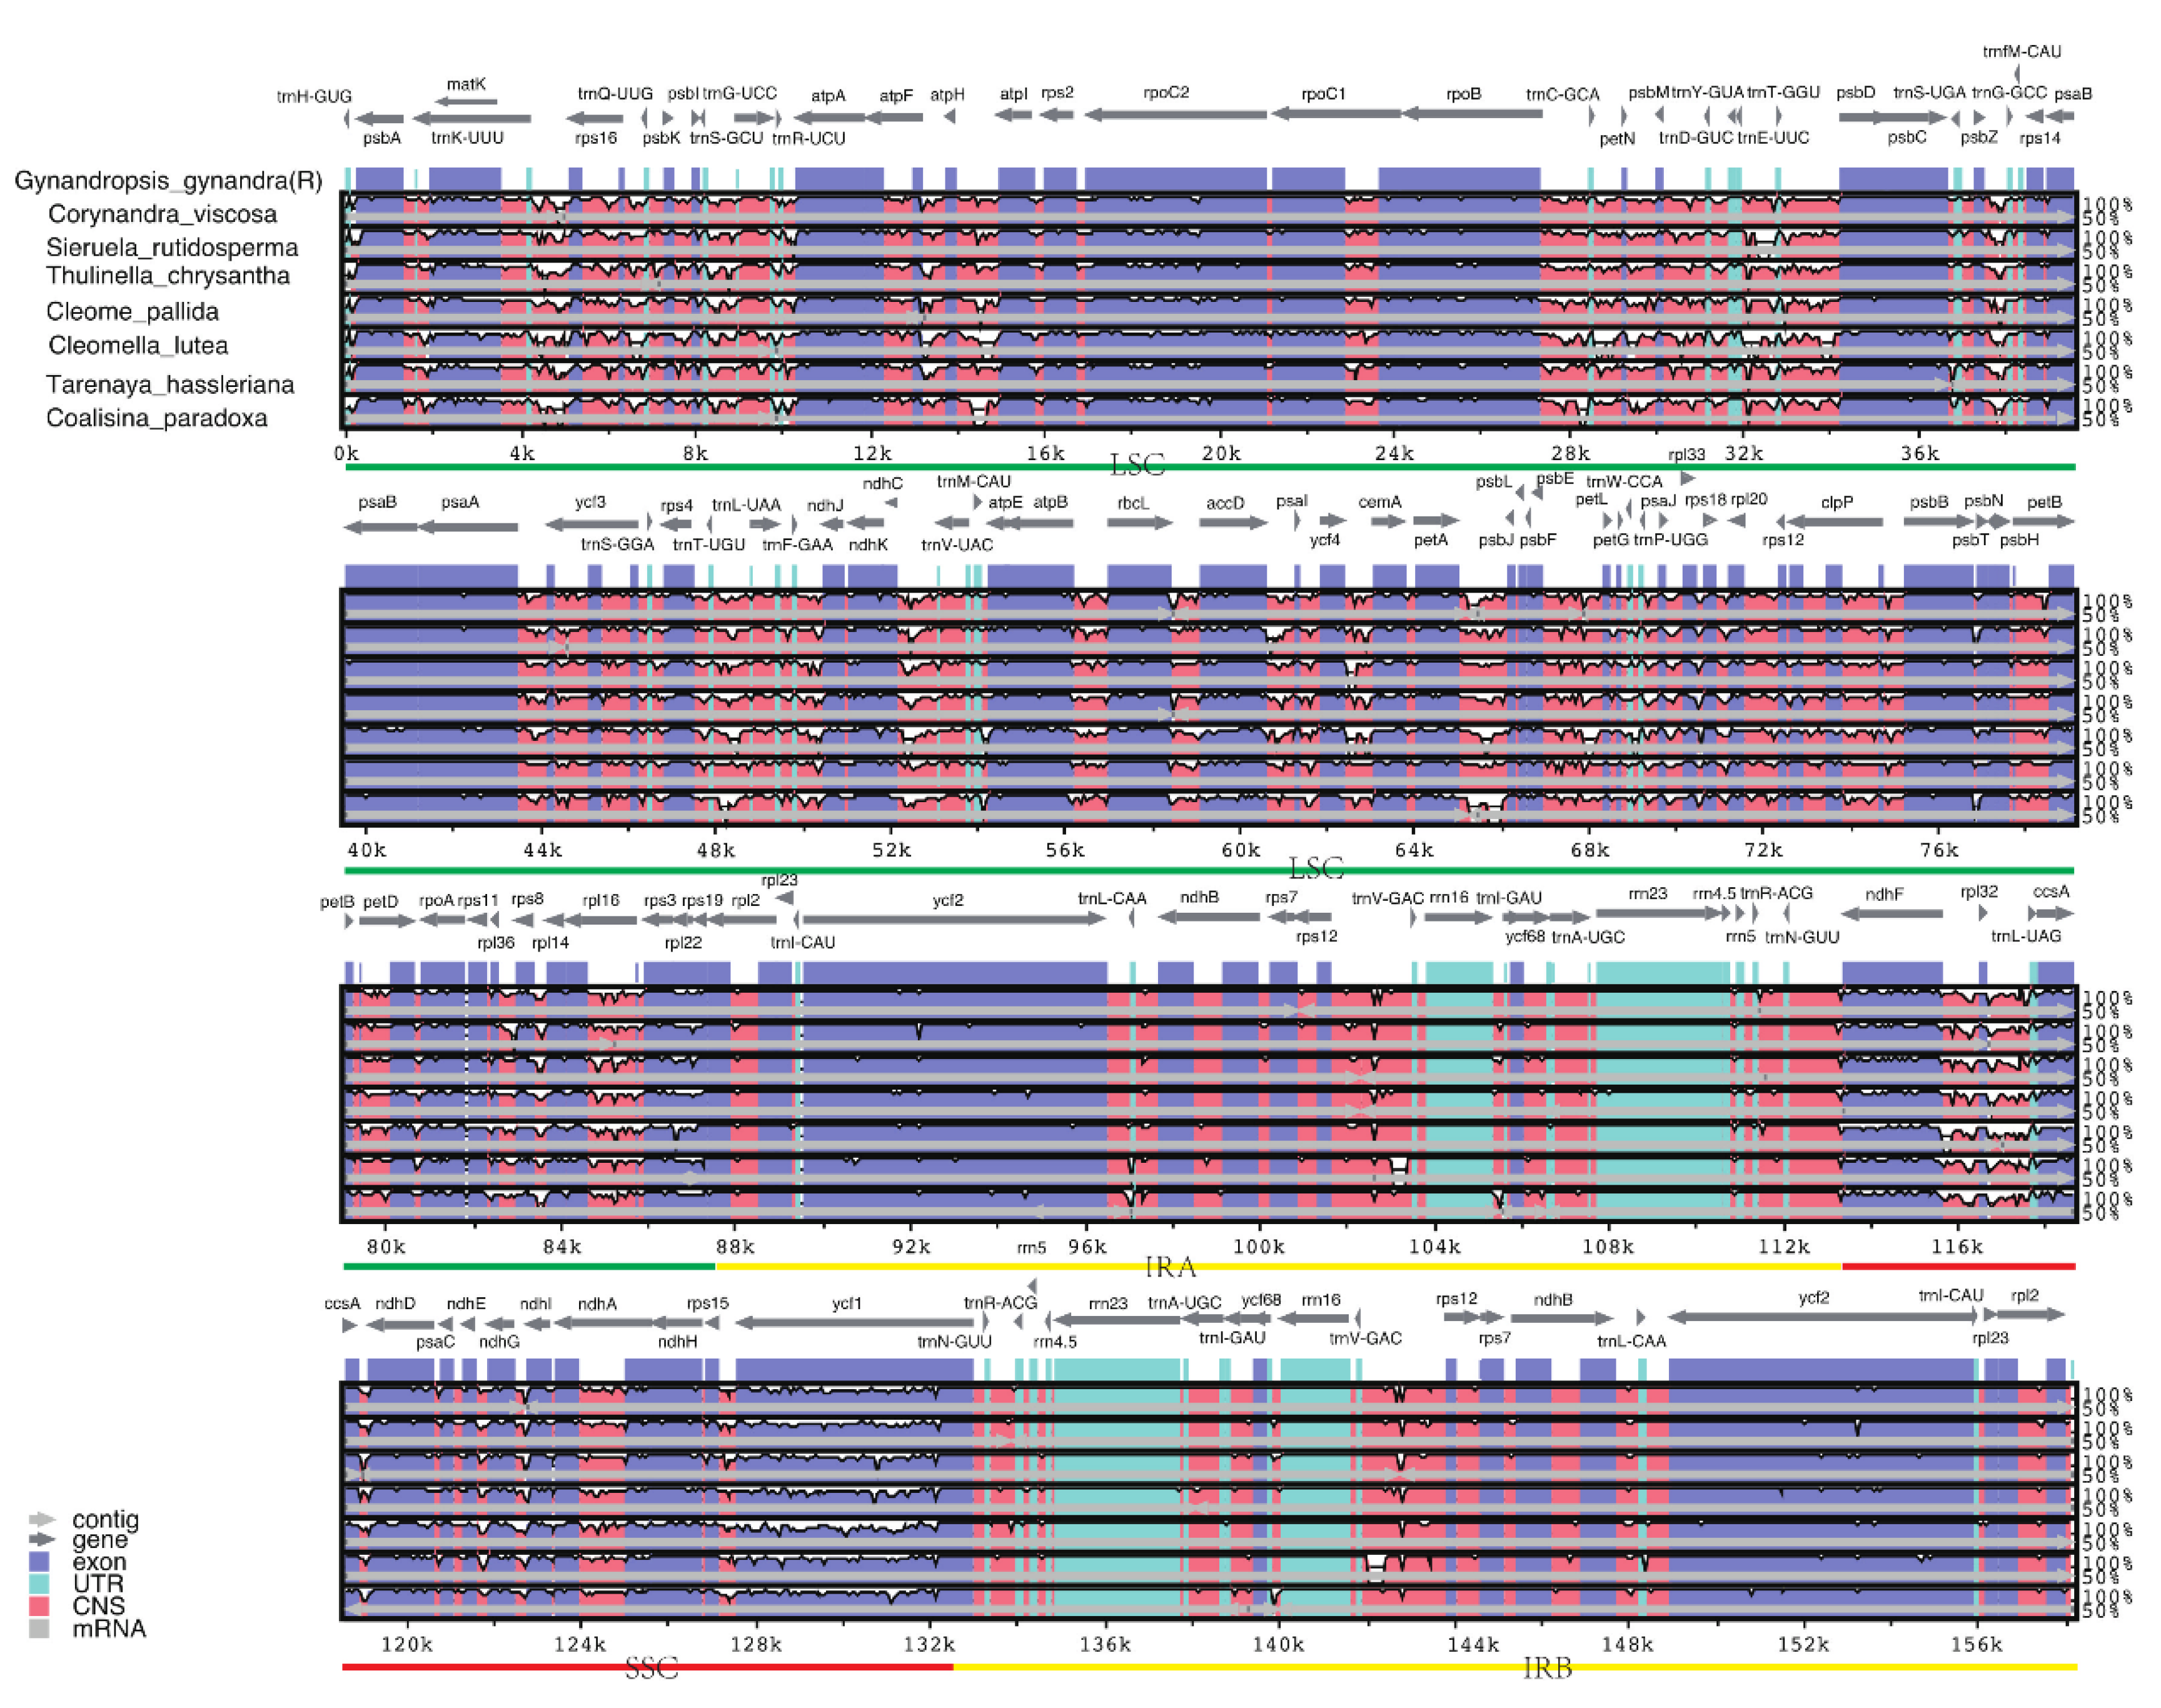
Figure 6.
Nucleotide diversity (Pi) values among the eight Cleomaceae species. X-axis: gene name; Y-axis: Pi value. Pi, polymorphism information.
Figure 6.
Nucleotide diversity (Pi) values among the eight Cleomaceae species. X-axis: gene name; Y-axis: Pi value. Pi, polymorphism information.
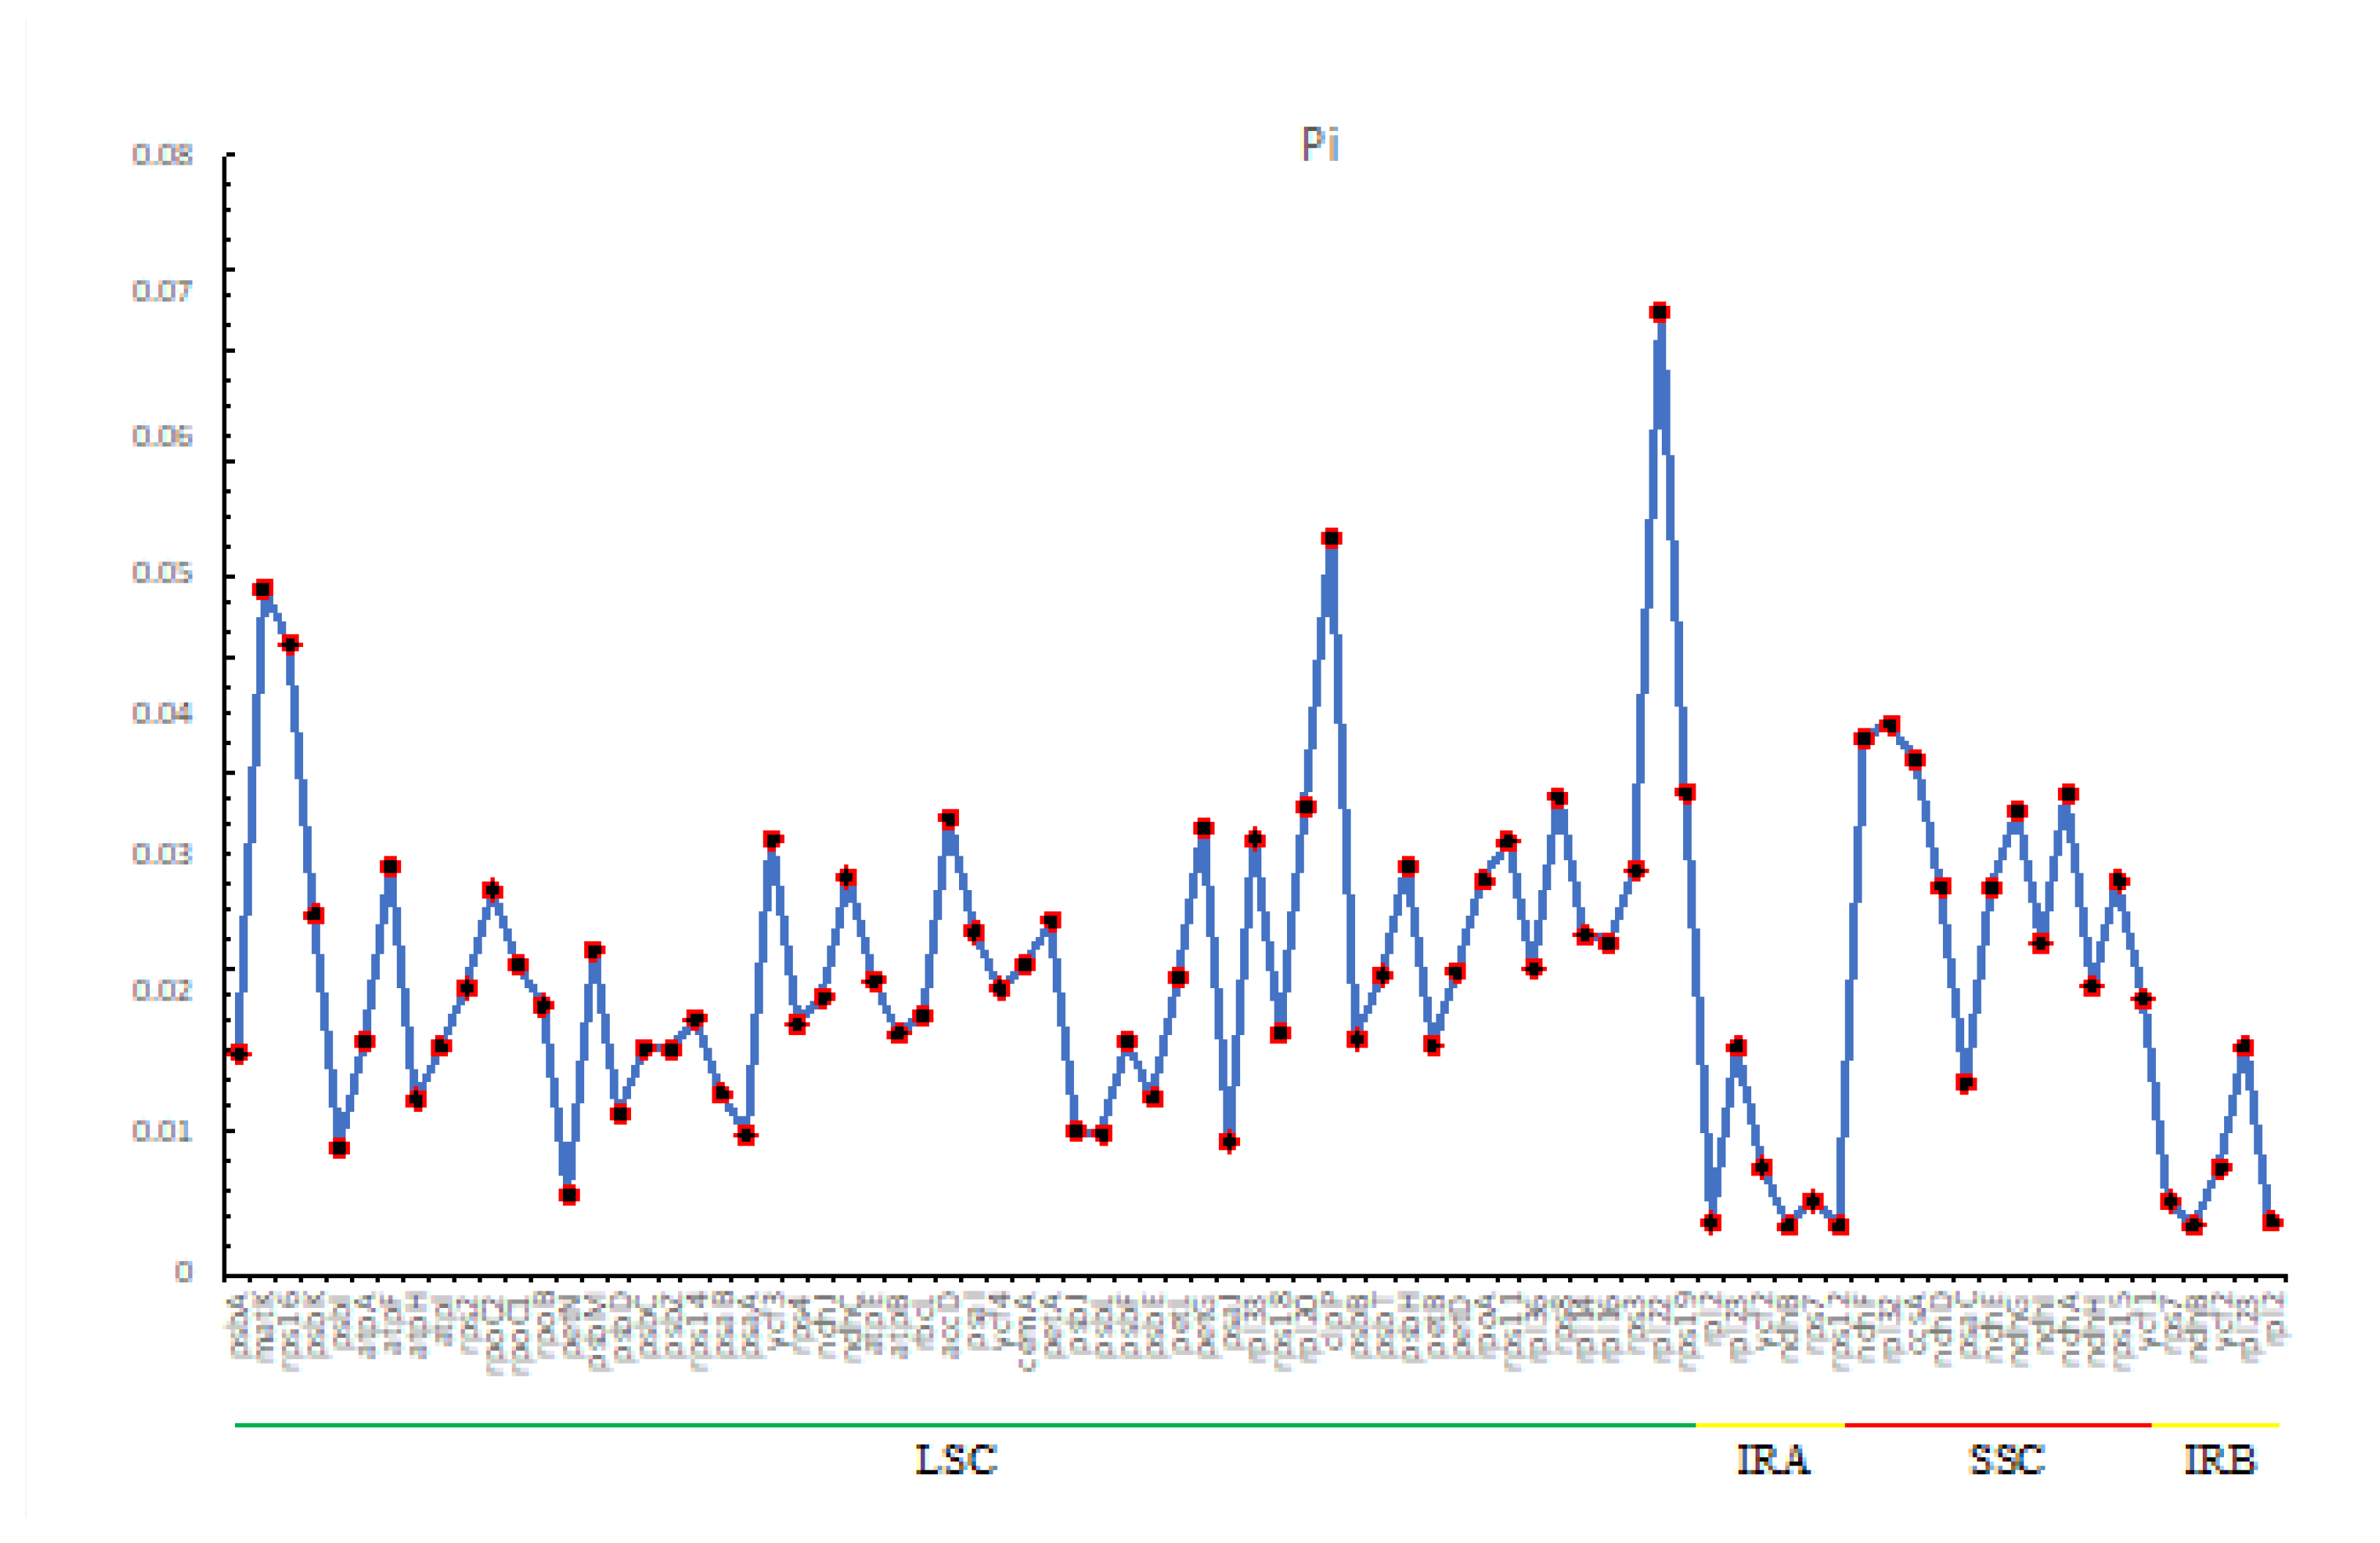
Figure 7.
Comparison of the borders of the large single-copy (LSC), small single-copy (SSC), and inverted repeat (IR) regions among the eight Cleomaceae chloroplast genomes. Genes are denoted by colored boxes. The gaps between the genes and the boundaries are indicated by the base lengths (bp).
Figure 7.
Comparison of the borders of the large single-copy (LSC), small single-copy (SSC), and inverted repeat (IR) regions among the eight Cleomaceae chloroplast genomes. Genes are denoted by colored boxes. The gaps between the genes and the boundaries are indicated by the base lengths (bp).
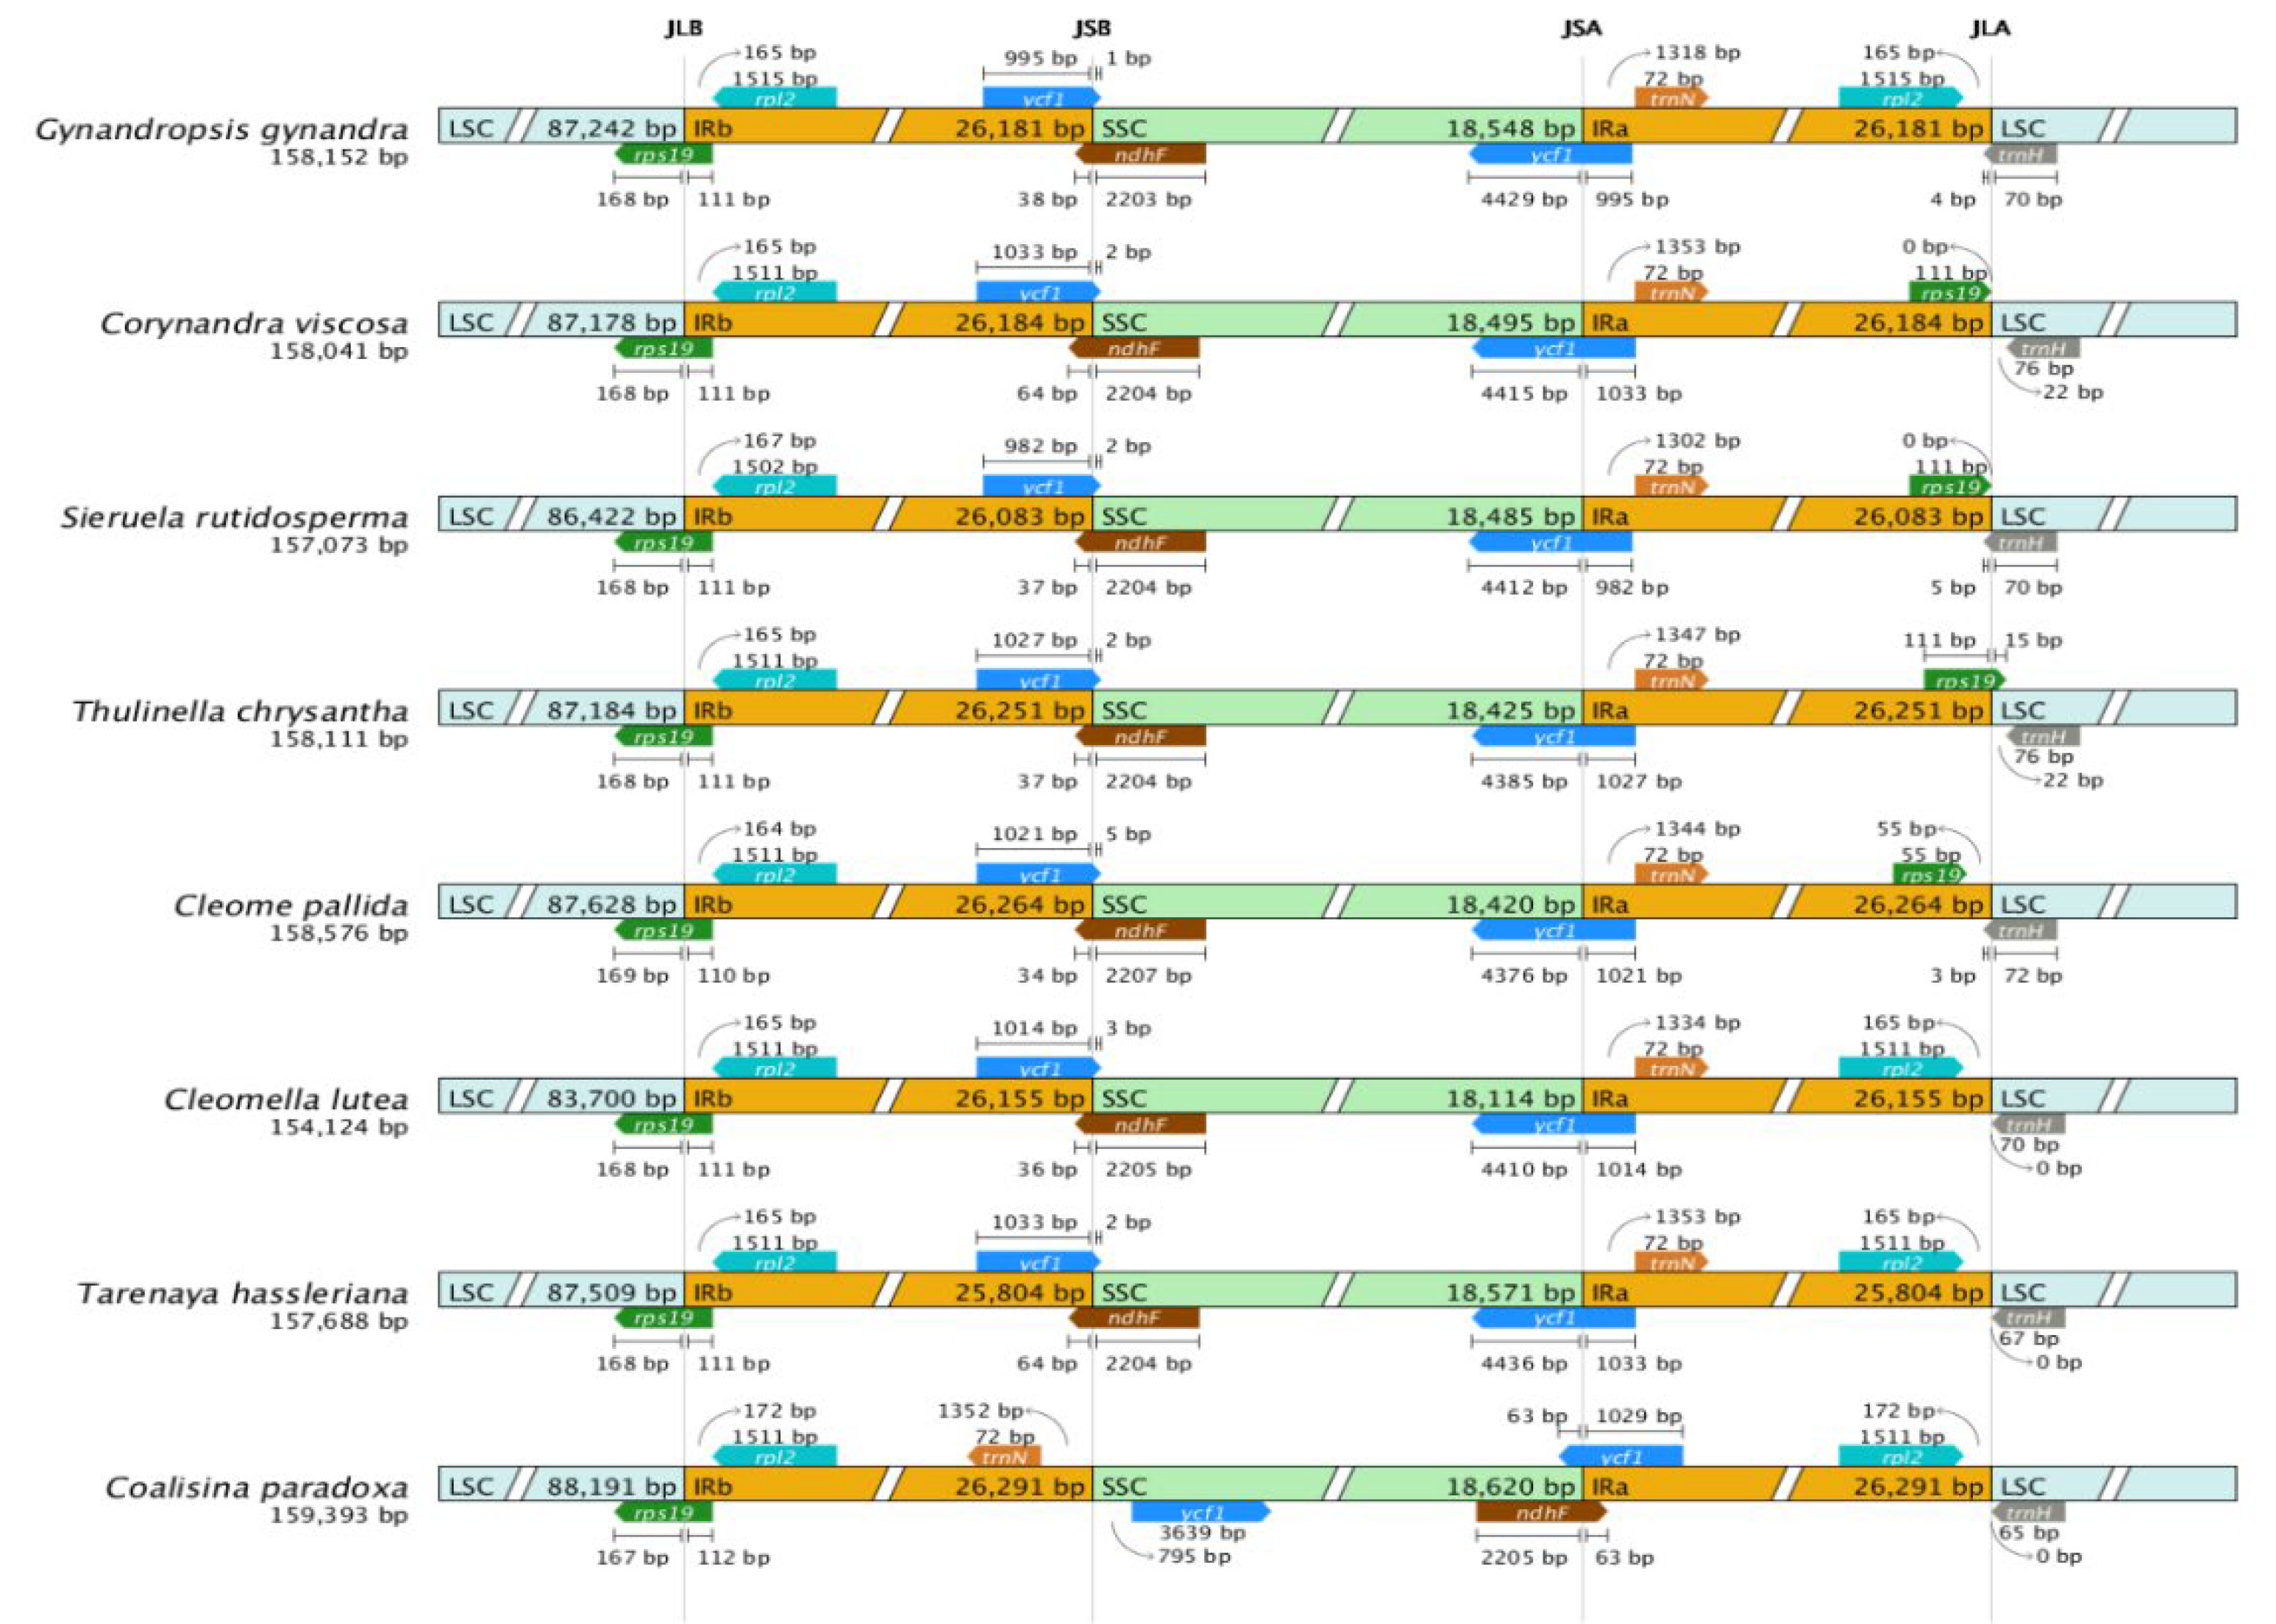
Figure 8.
MAUVE alignment of G. gynandra related species. As a reference, the cp genome of G. gynandra is presented at the top. The long squares show genomic similarity, while the lines connecting them represent a covariate association. Each genome’s gene locations are represented by the short squares. CDS is represented by white, tRNA is represented by green, and rRNA is represented by red.
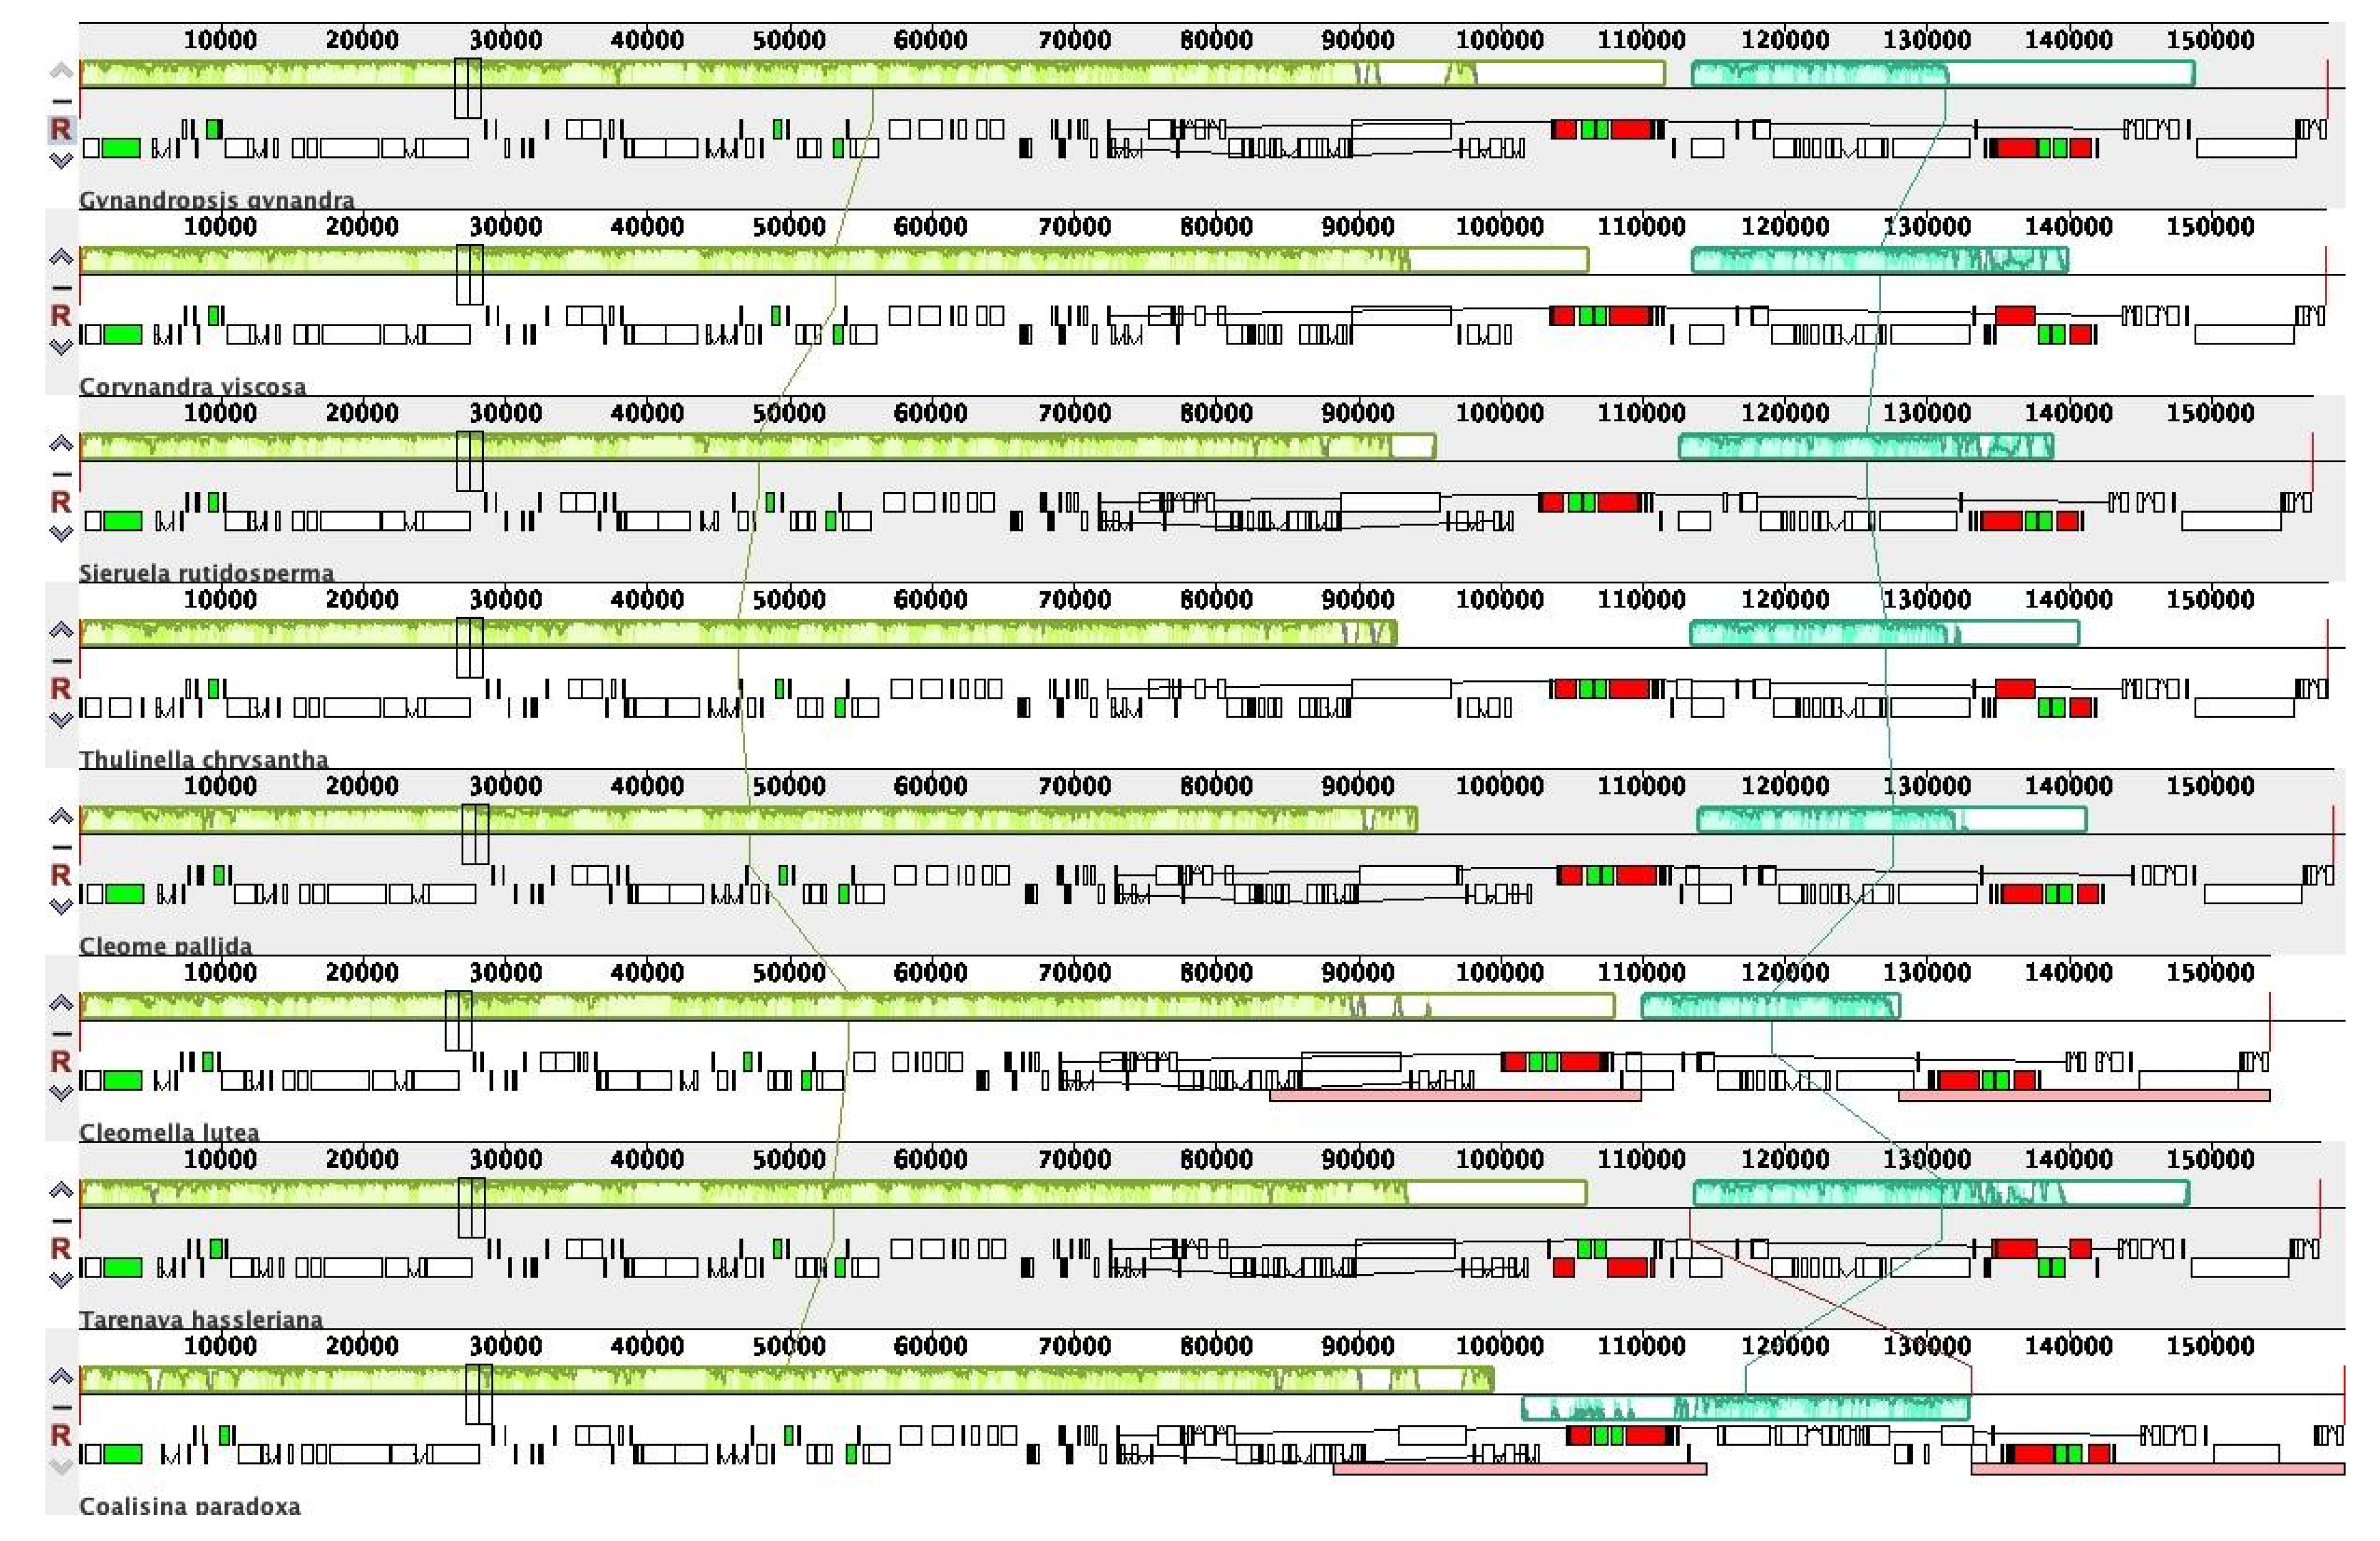
Figure 9.
The Ka/Ks analysis was performed on 78 protein-coding genes from the G. gynandra cp genome and seven related species.
Figure 9.
The Ka/Ks analysis was performed on 78 protein-coding genes from the G. gynandra cp genome and seven related species.
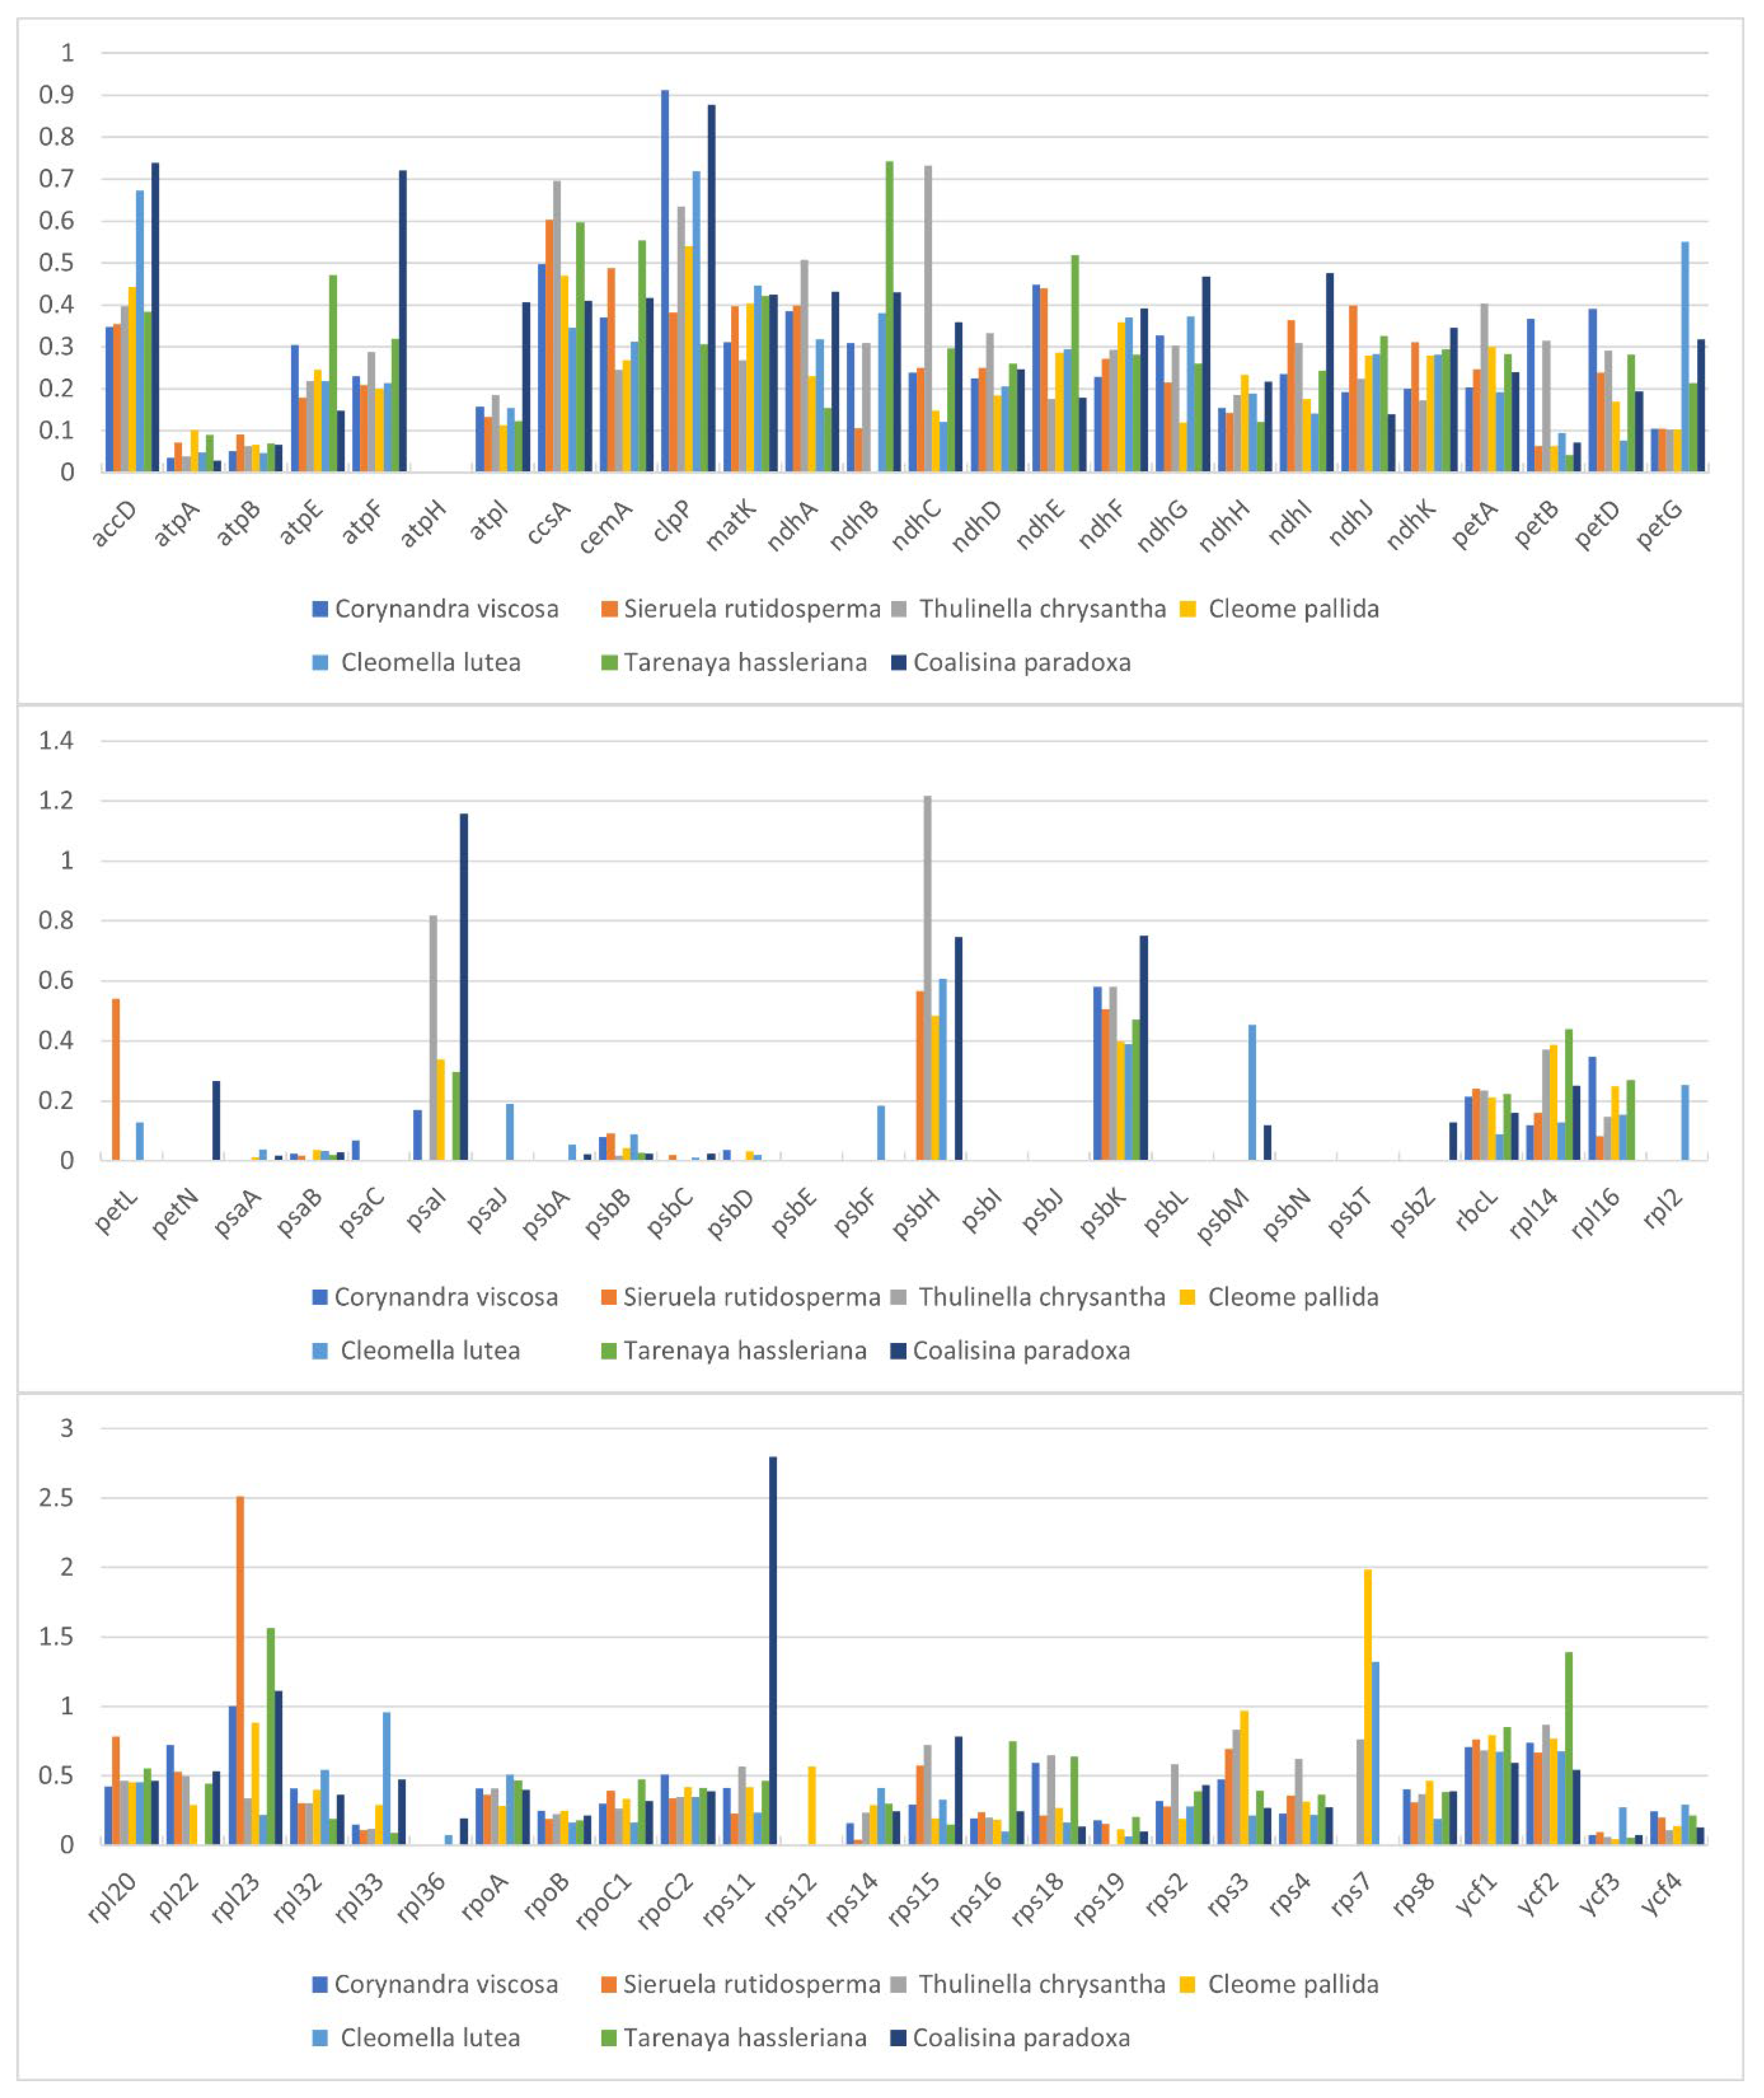
Figure 10.
Maximum likelihood (ML) phylogenetic trees were constructed based on the chloroplast genomes of 23 species. The support values are displayed on the branches of the tree. The species investigated in this study are colored in red.
Figure 10.
Maximum likelihood (ML) phylogenetic trees were constructed based on the chloroplast genomes of 23 species. The support values are displayed on the branches of the tree. The species investigated in this study are colored in red.
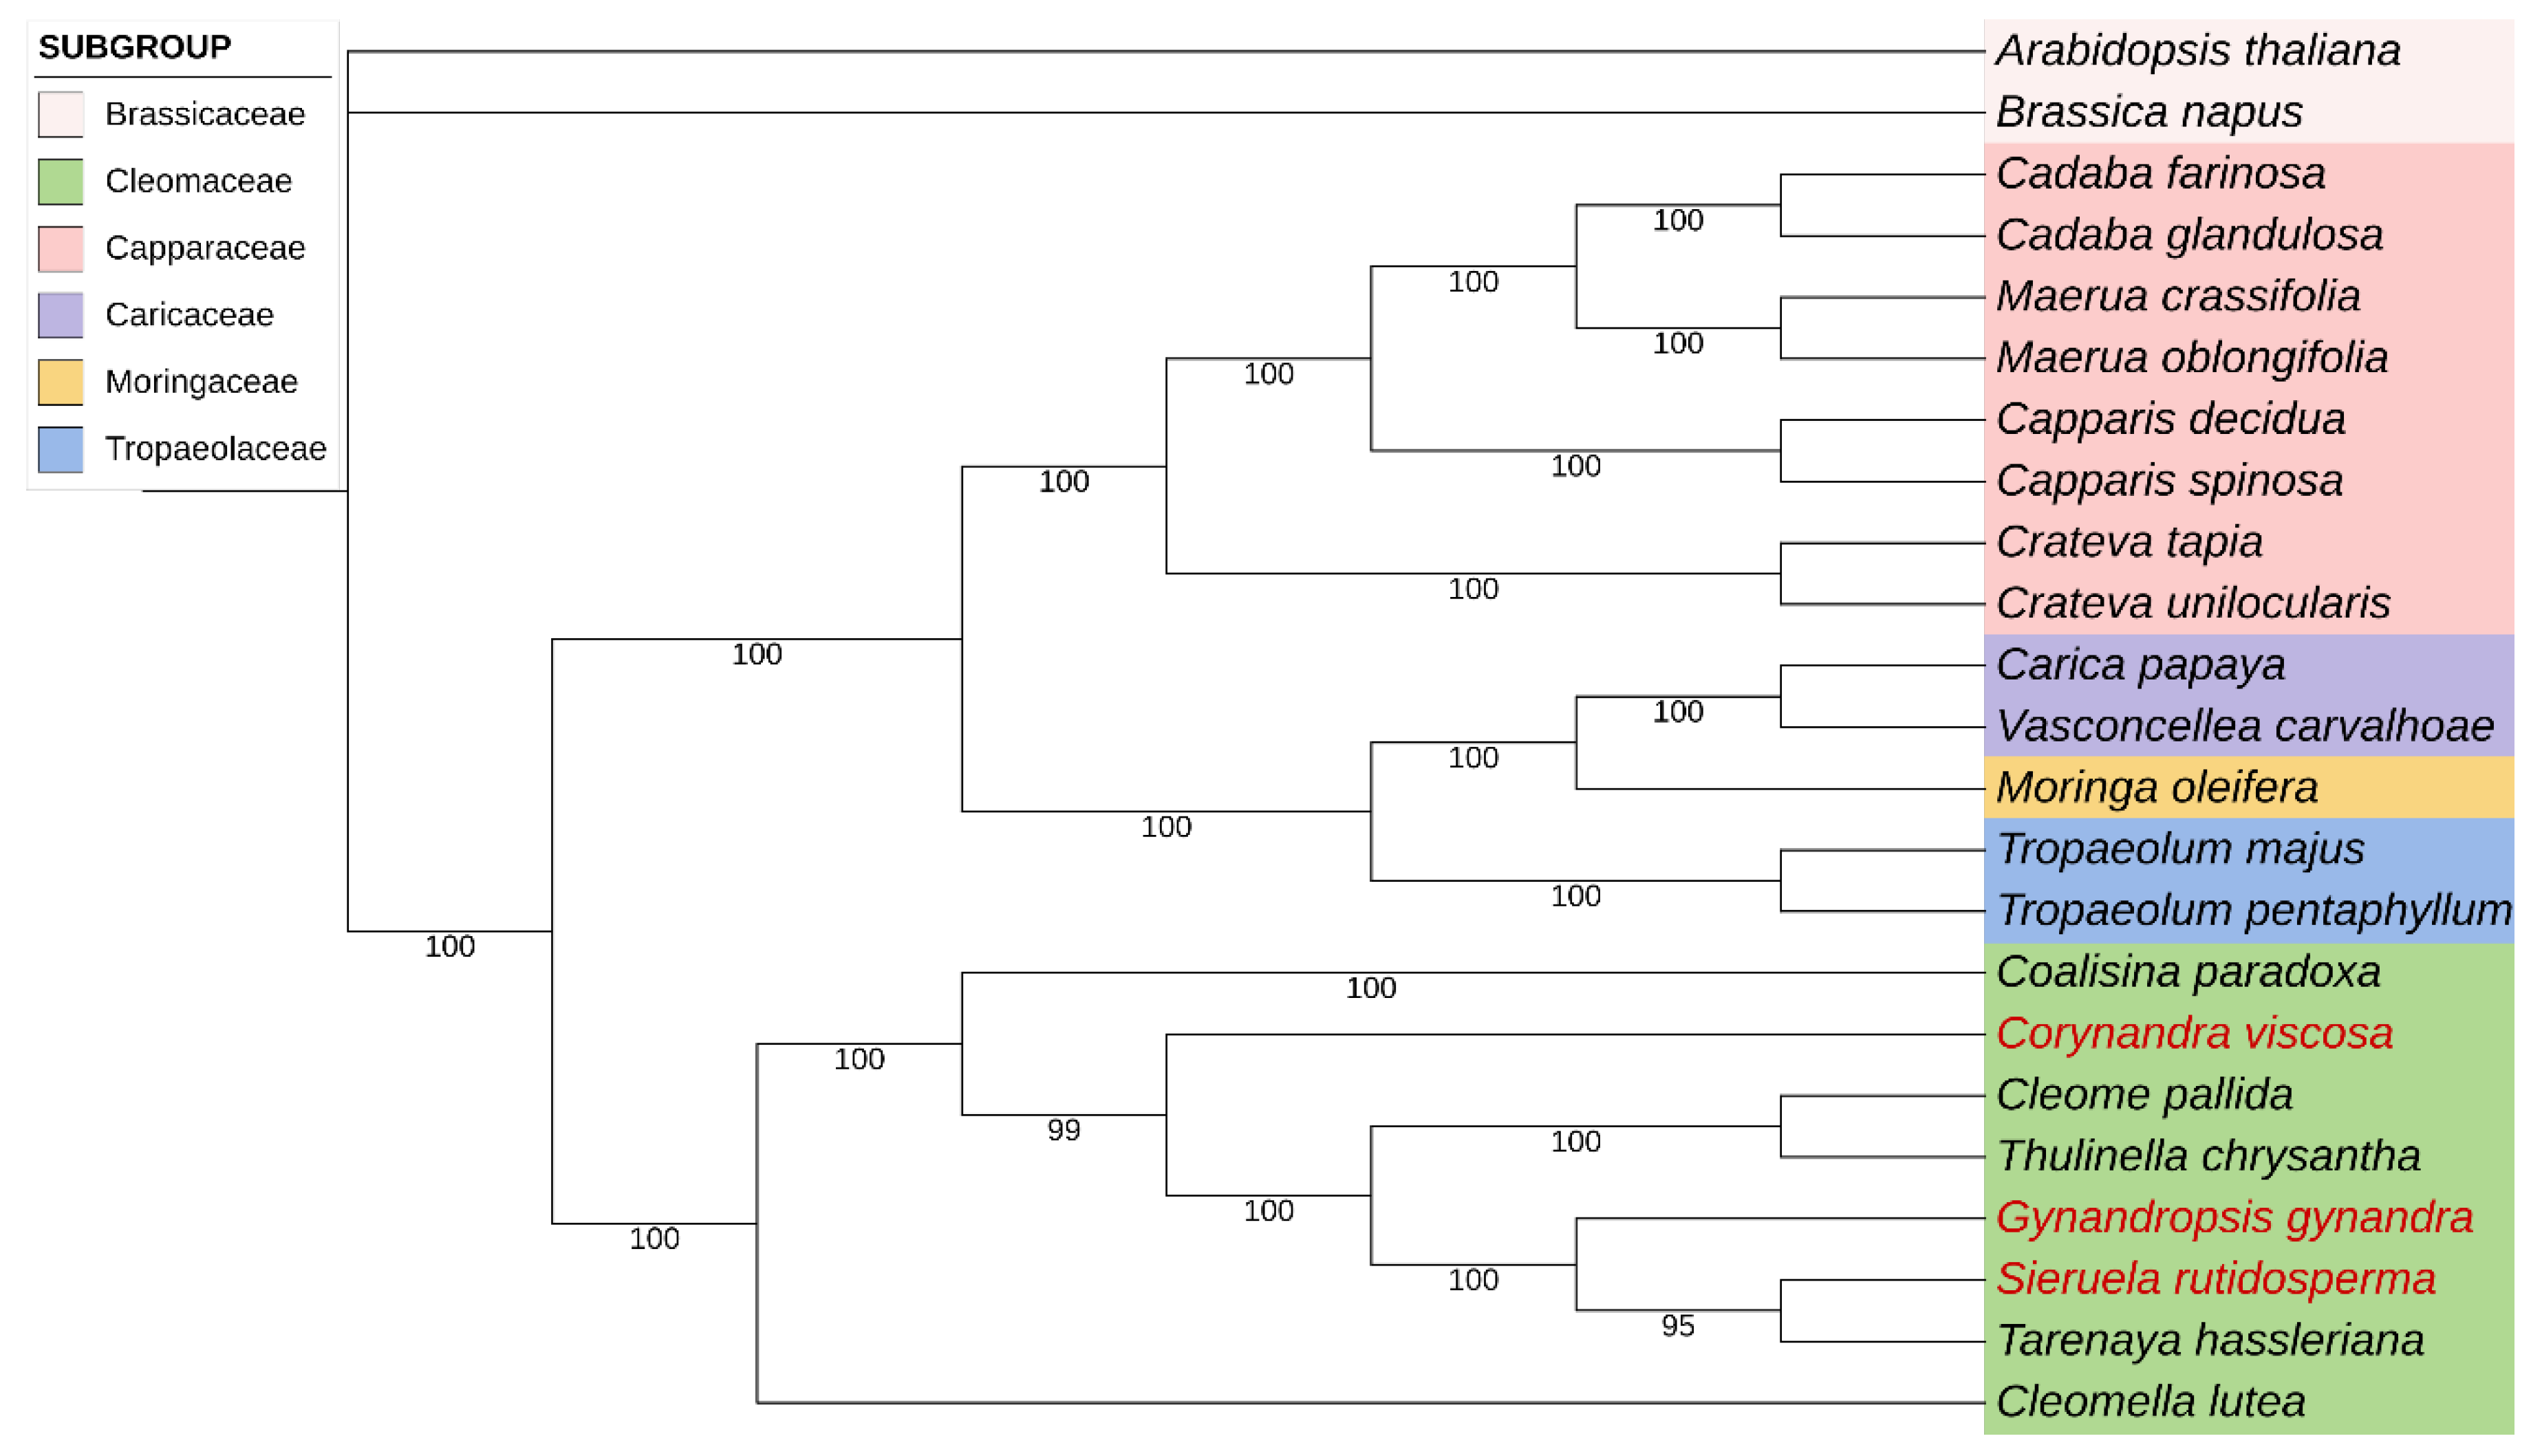
Figure 11.
Bayesian inference (BI) phylogenetic trees were constructed,based on the chloroplast genomes of 23 species. The support values are displayed on the branches of the tree. The species investigated in this study are colored in red.
Figure 11.
Bayesian inference (BI) phylogenetic trees were constructed,based on the chloroplast genomes of 23 species. The support values are displayed on the branches of the tree. The species investigated in this study are colored in red.
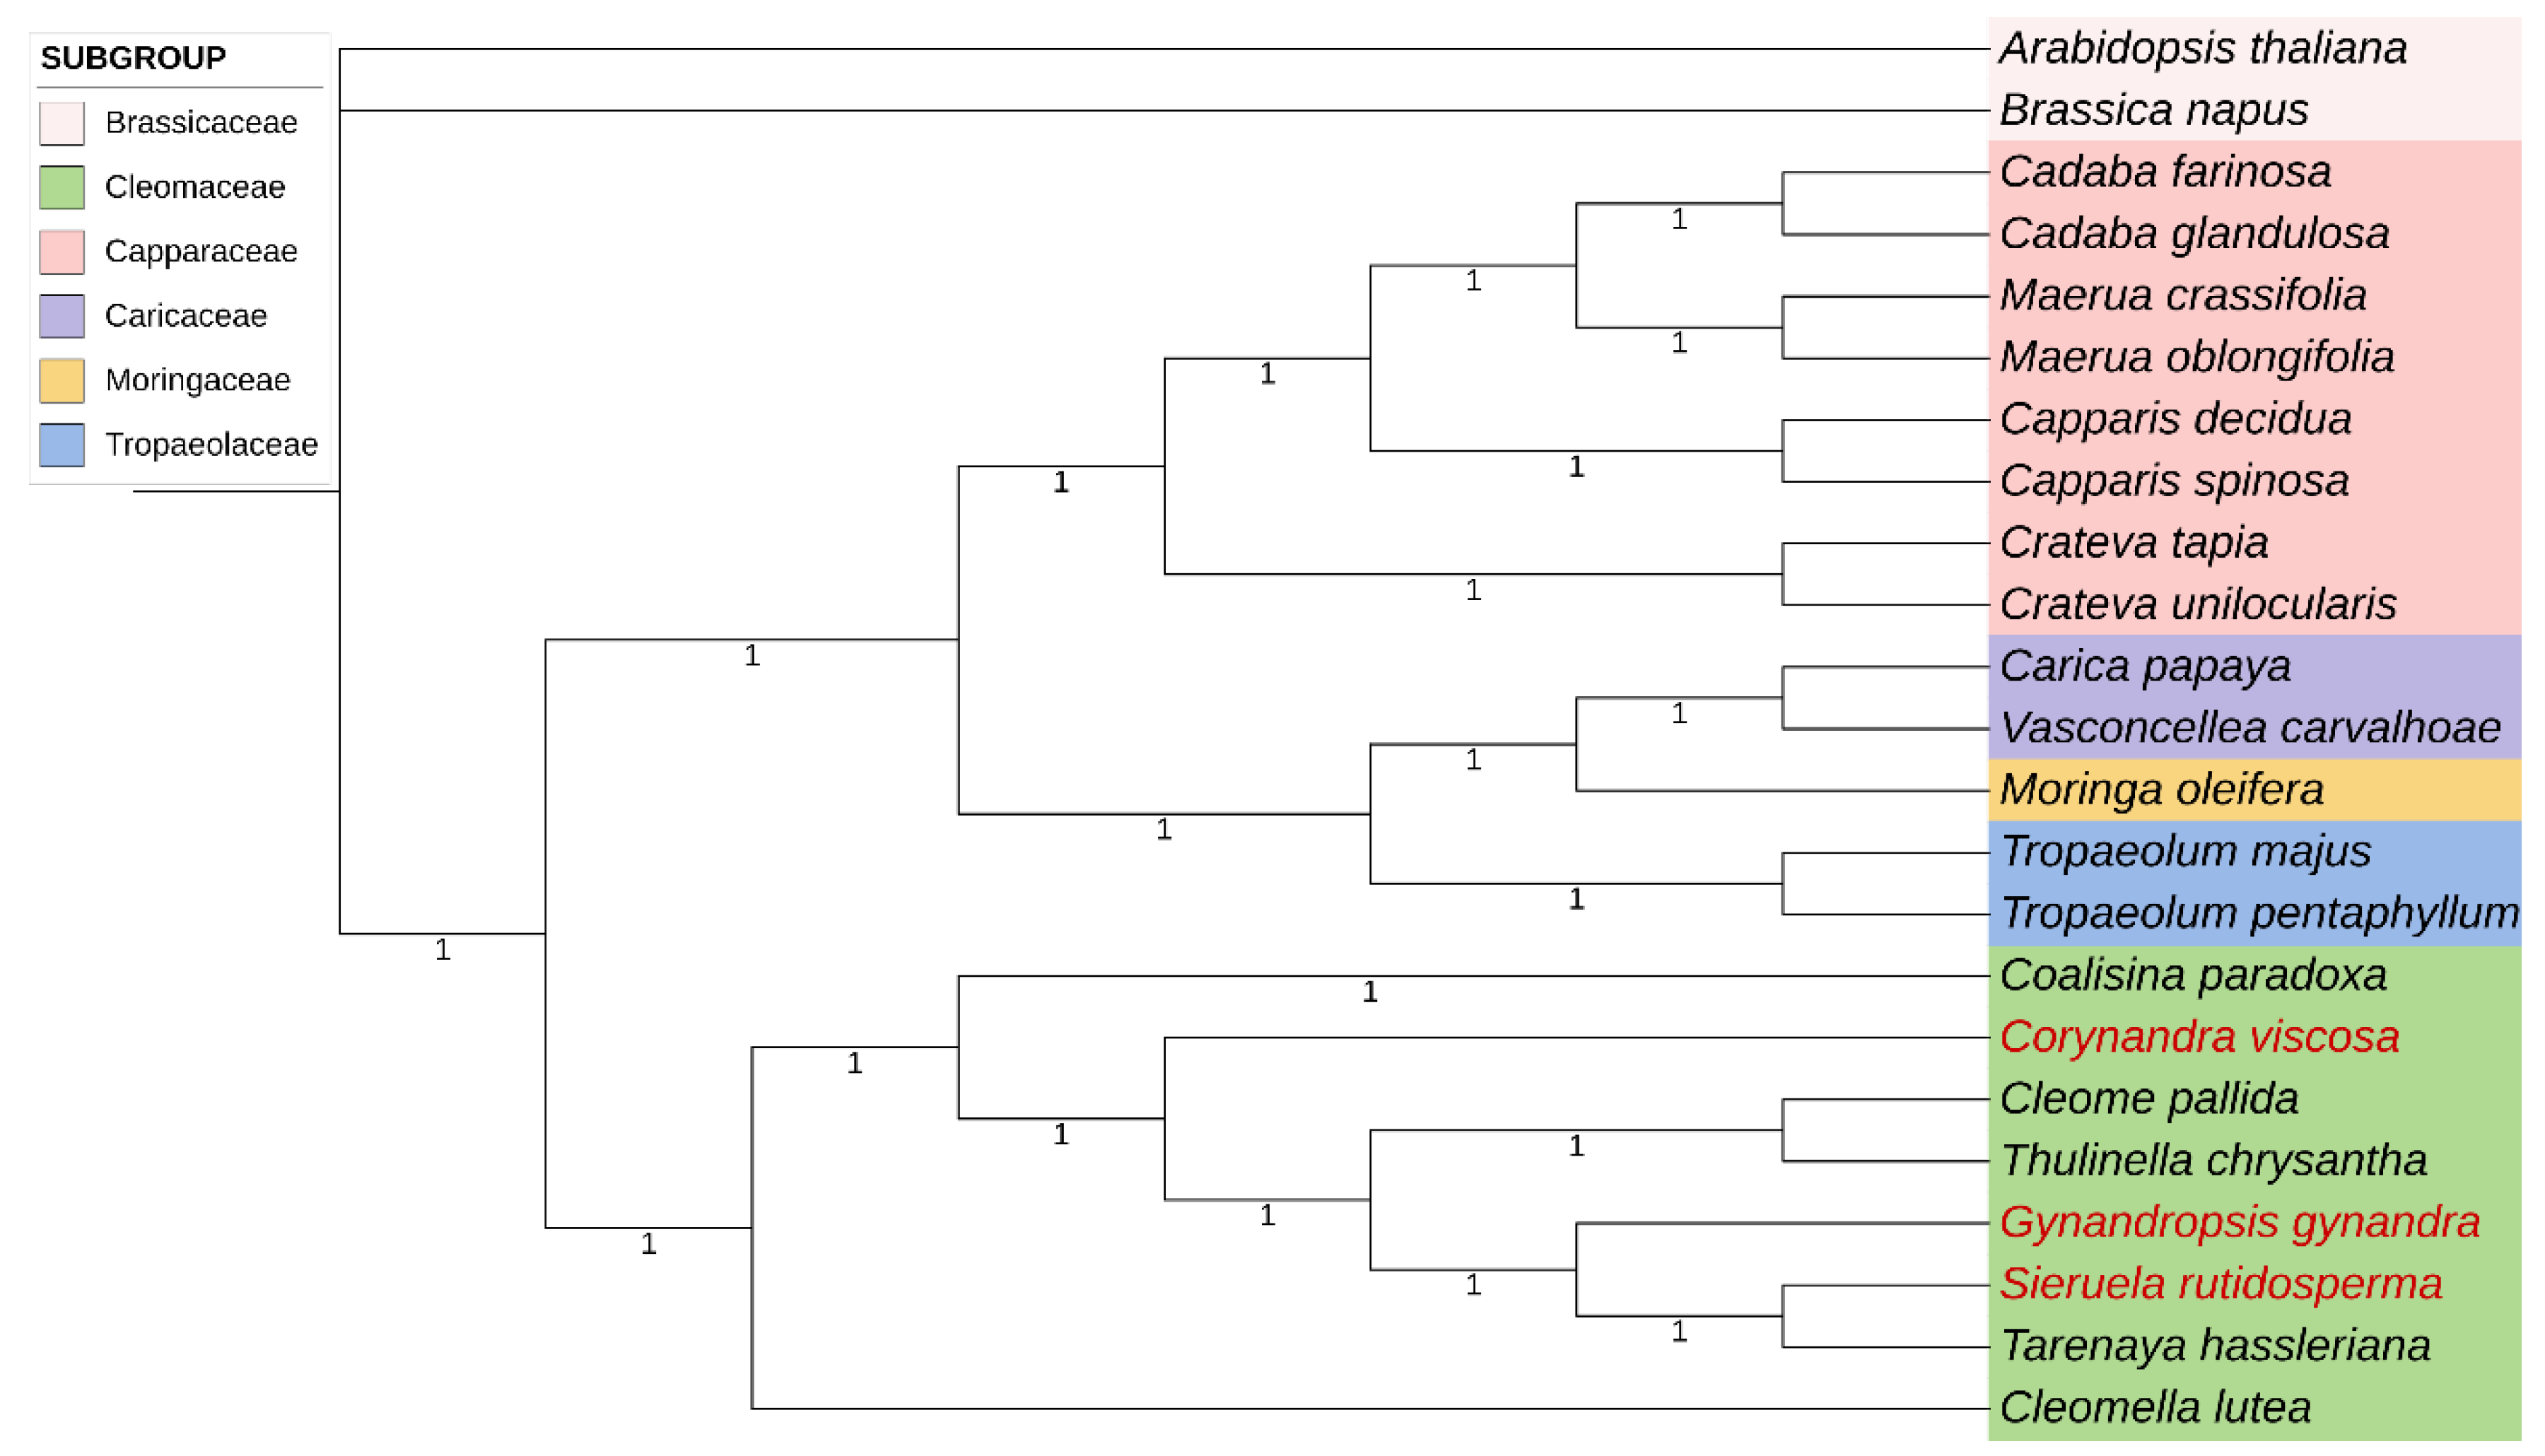
Figure 12.
Maximum likelihood (ML) phylogenetic trees were constructed based on the potential barcode sequences. The support values are displayed on the branches of the tree. The species investigated in this study are colored in red. (a)clpP; (b) matK; (c)ndhF
Figure 12.
Maximum likelihood (ML) phylogenetic trees were constructed based on the potential barcode sequences. The support values are displayed on the branches of the tree. The species investigated in this study are colored in red. (a)clpP; (b) matK; (c)ndhF
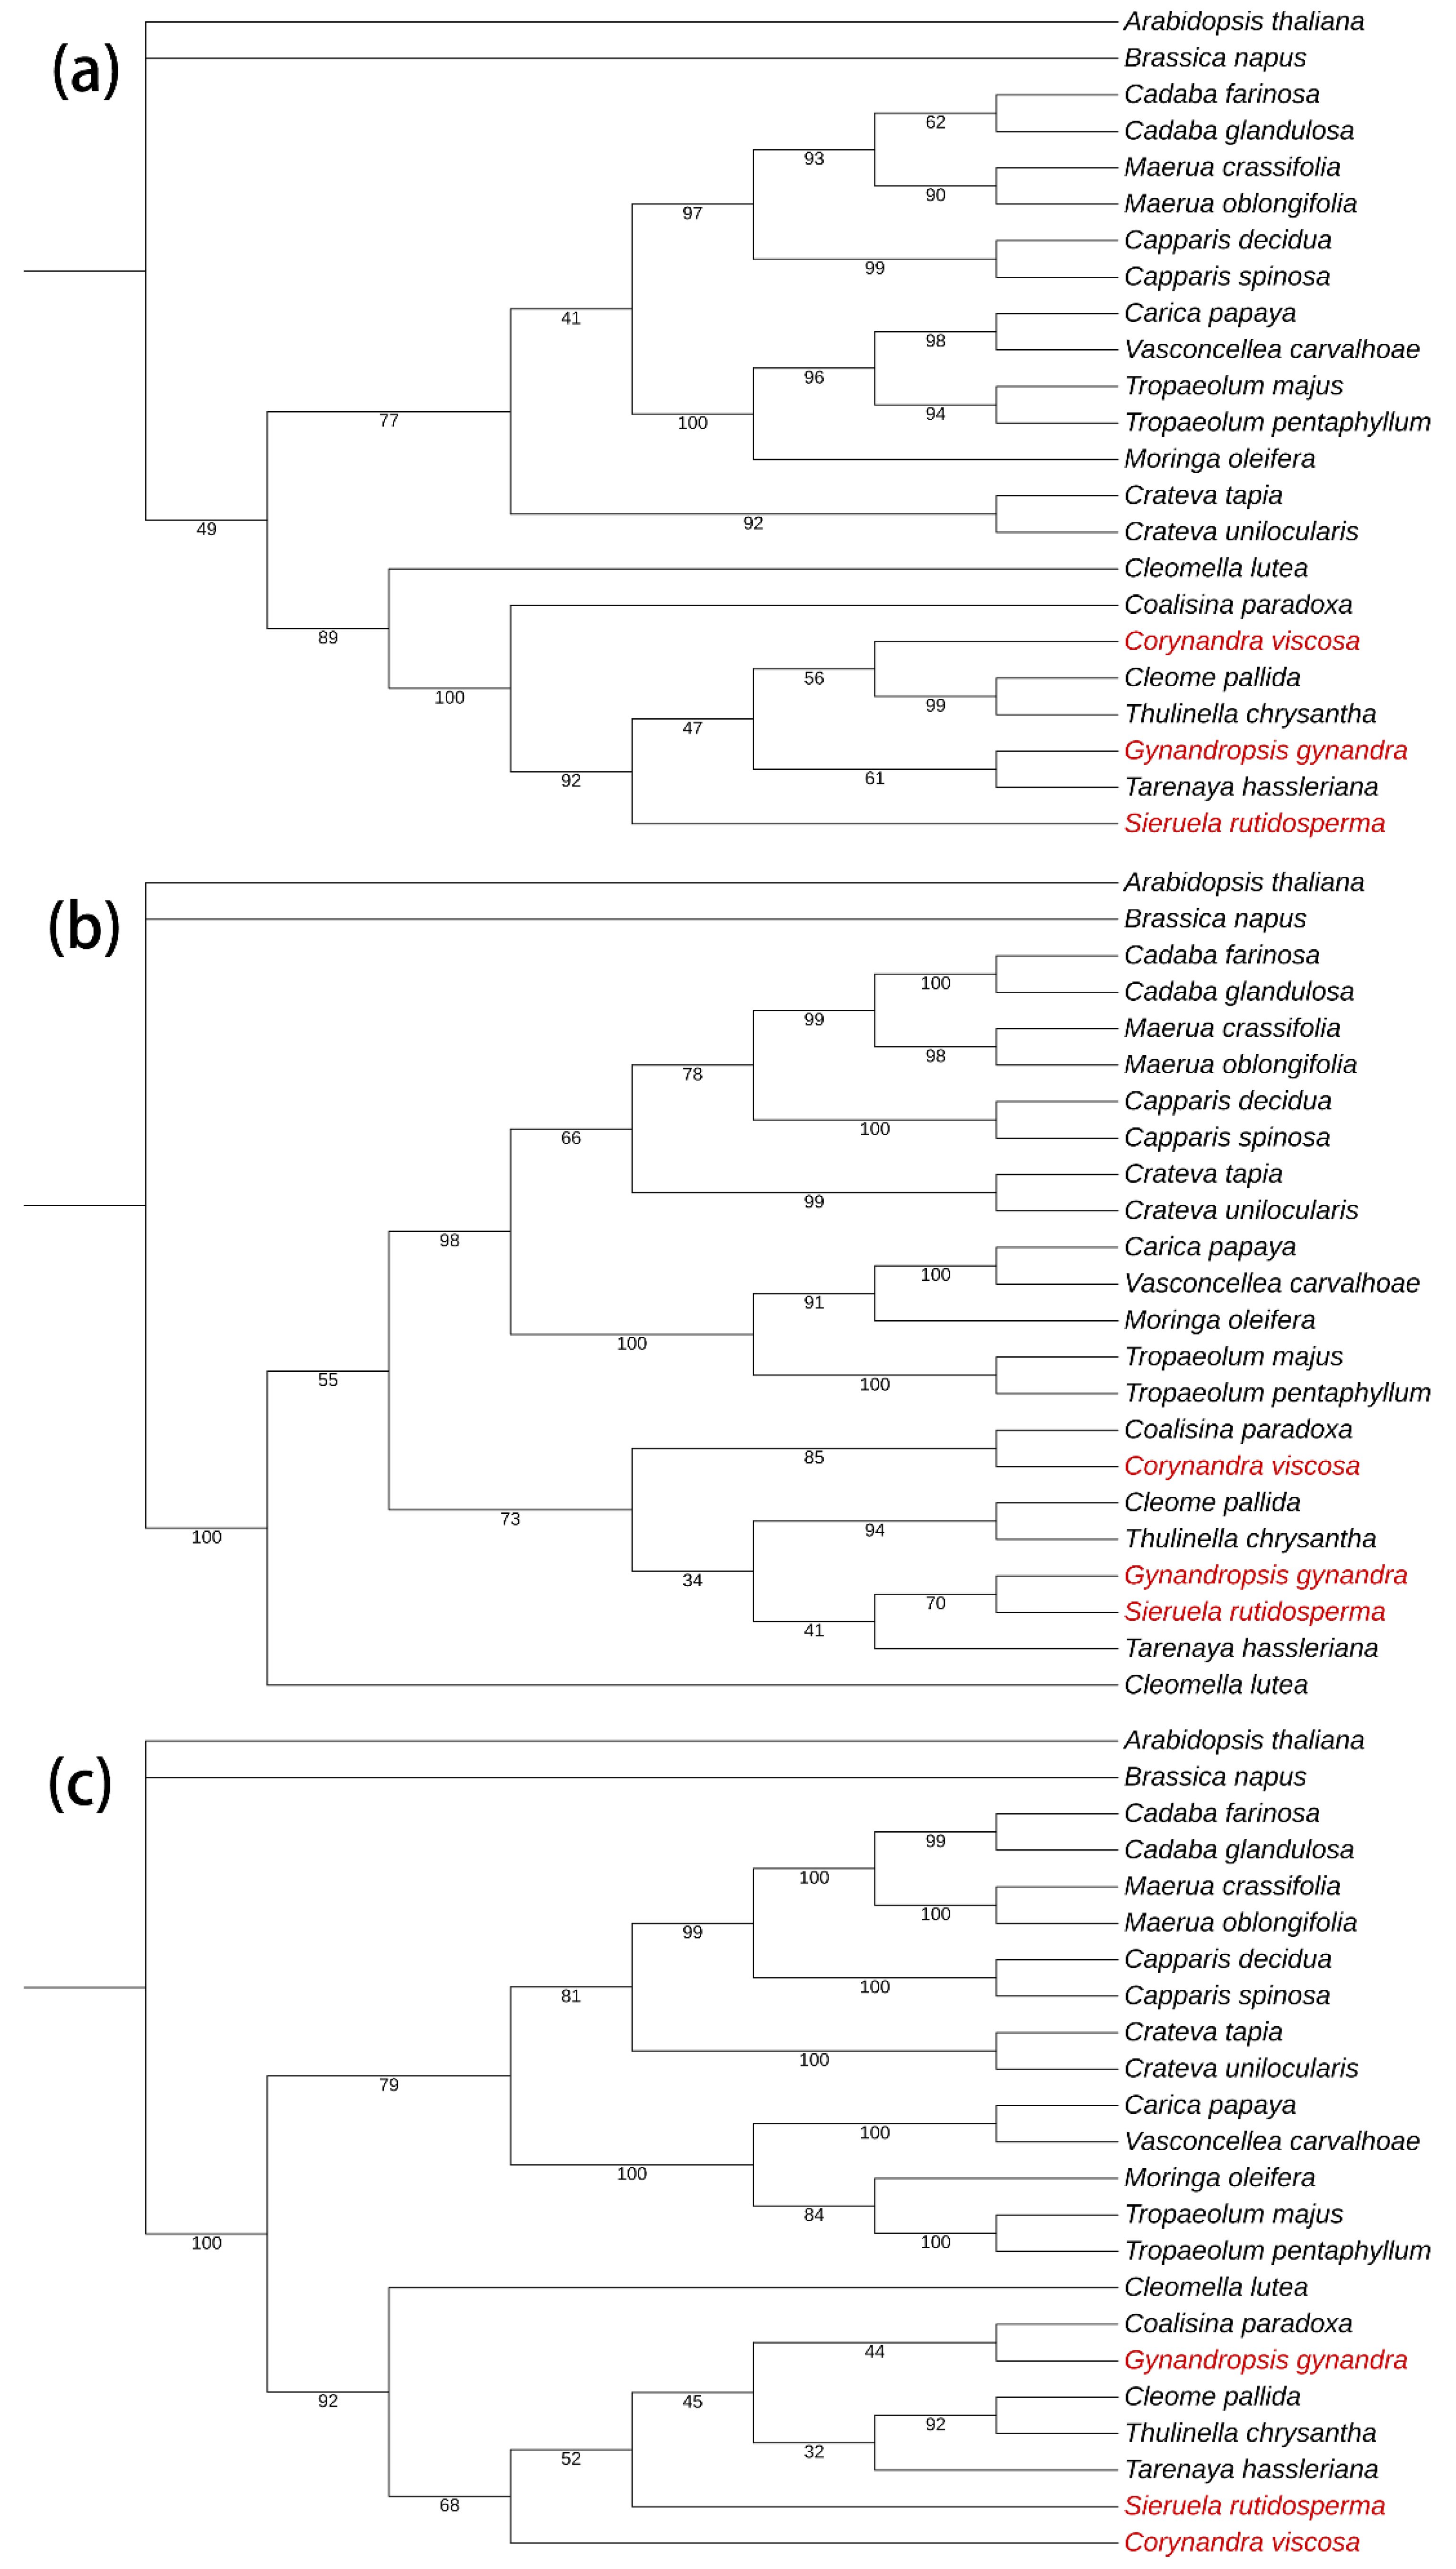
Figure 13.
Maximum likelihood (ML) phylogenetic trees were constructed based on the high variant intergenic regions. The support values are displayed on the branches of the tree. The species investigated in this study are colored in red. (a) atpF-atpH; (b) atpH-atpL; (c) petN-pabM
Figure 13.
Maximum likelihood (ML) phylogenetic trees were constructed based on the high variant intergenic regions. The support values are displayed on the branches of the tree. The species investigated in this study are colored in red. (a) atpF-atpH; (b) atpH-atpL; (c) petN-pabM
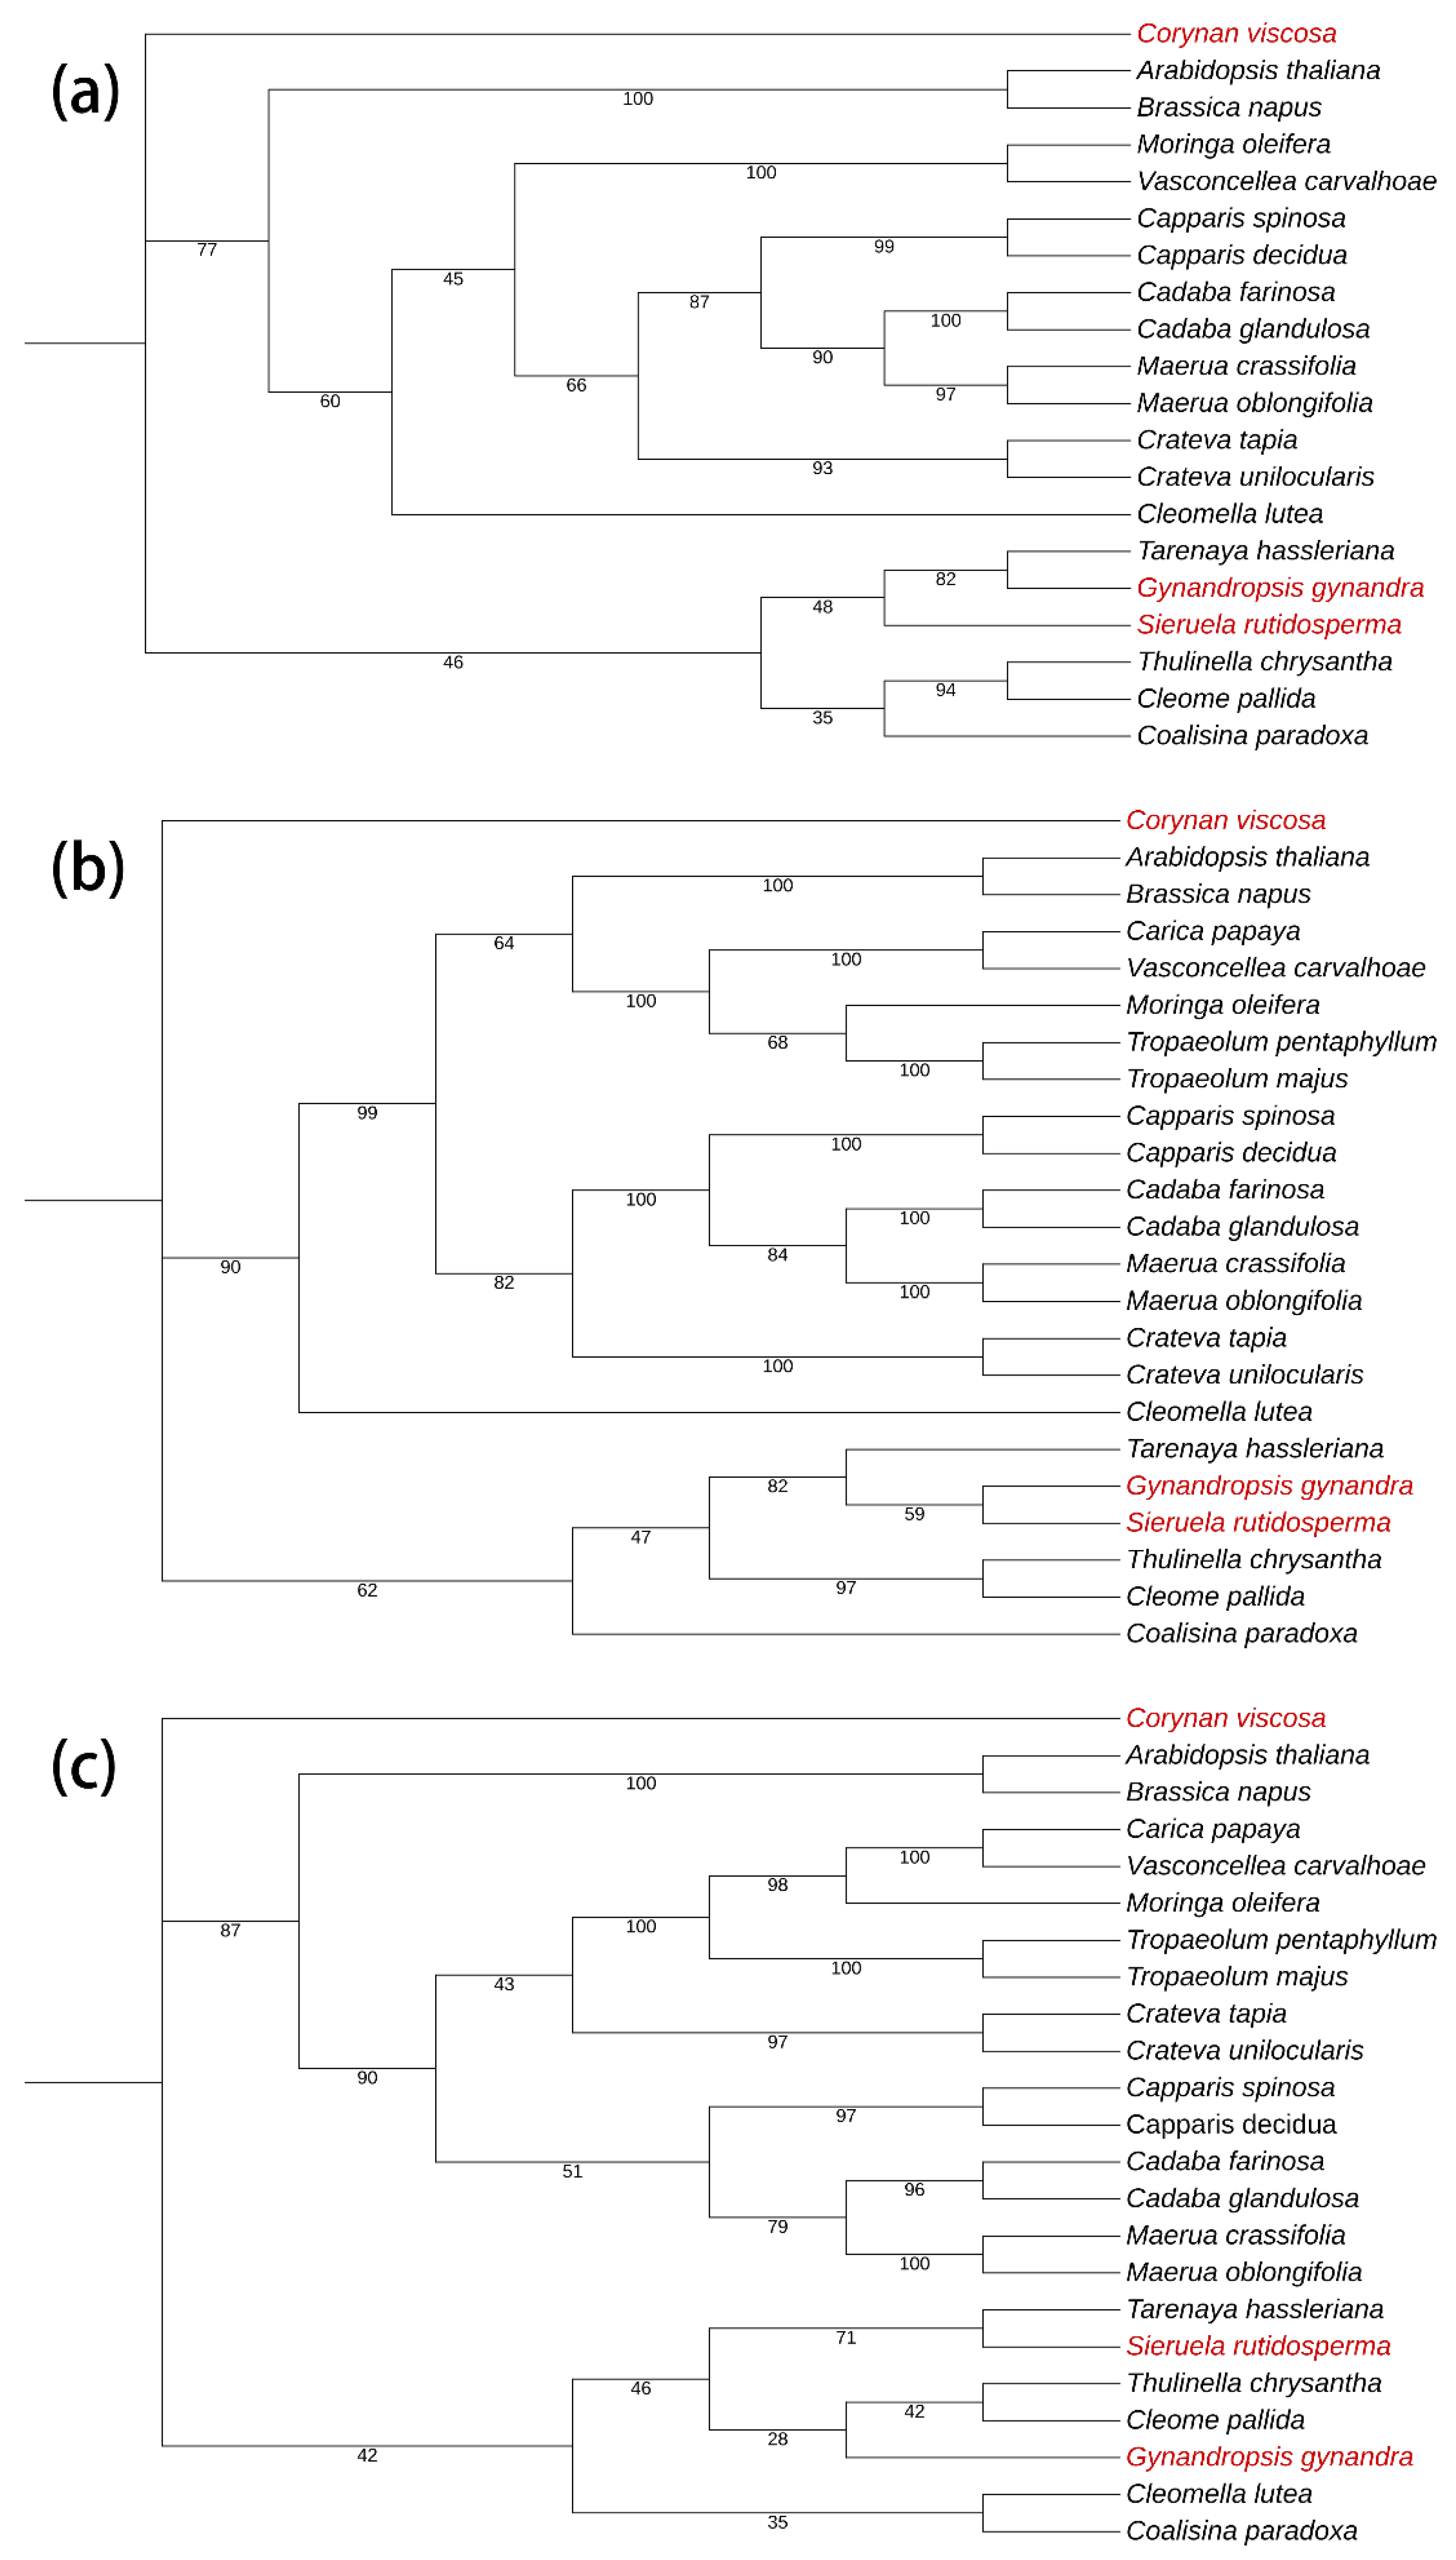

Table 1.
Summary of the complete chloroplast genomes of the three Cleomaceae species.
| Genome features | Corynandra viscosa | Sieruela rutidosperma | Gynandropsis gynandra |
|---|---|---|---|
| Total length (bp) | 158,041 | 157,073 | 158,152 |
| LSC length (bp) | 87,178 | 86,422 | 87,242 |
| SSC length (bp) | 18,495 | 18,485 | 18,548 |
| IRa length (bp) | 26,184 | 26,083 | 26,181 |
| IRb length (bp) | 26,184 | 26,083 | 26,181 |
| Genes | 131 | 131 | 132 |
| Protein-coding genes (CDS) | 84 | 84 | 86 |
| tRNA genes | 37 | 37 | 37 |
| rRNA genes | 8 | 8 | 8 |
| pseudo genes | 2 | 2 | 1 |
| GC% | 36.02 | 36.02 | 35.81 |
| total genome | 36.02 | 36.02 | 35.81 |
| LSC | 33.68 | 33.68 | 33.42 |
| SSC | 29.03 | 28.94 | 28.55 |
| IR | 42.38 | 42.43 | 42.36 |
| genes(total/different) | 131 | 131 | 132 |
| CDS(total/different) | 84/79 | 84/78 | 86/79 |
| tRNA(total/different) | 37/28 | 37/30 | 37/30 |
Table 2.
Base composition of the complete chloroplast genomes of the three Cleomaceae species.
| Species | Region | A (%) | T (%) | C (%) | G (%) | AT (%) | GC (%) |
|---|---|---|---|---|---|---|---|
| Corynandra viscosa | LSC | 32.35 | 33.98 | 17.33 | 16.35 | 66.32 | 33.68 |
| SSC | 35.23 | 35.74 | 14.98 | 14.05 | 70.97 | 29.03 | |
| IR | 28.81 | 28.81 | 21.19 | 21.19 | 57.62 | 42.38 | |
| Total | 31.51 | 32.47 | 18.34 | 17.68 | 63.98 | 36.02 | |
| Sieruela rutidosperma | LSC | 32.25 | 34.08 | 17.36 | 16.32 | 66.33 | 33.68 |
| SSC | 35.47 | 35.59 | 15.00 | 13.95 | 71.06 | 28.94 | |
| IR | 28.79 | 28.79 | 21.21 | 21.21 | 57.58 | 42.42 | |
| Total | 31.48 | 32.50 | 18.36 | 17.67 | 63.98 | 36.02 | |
| Gynandropsis gynandra | LSC | 32.41 | 34.17 | 17.21 | 16.21 | 66.58 | 33.42 |
| SSC | 35.42 | 36.03 | 14.78 | 13.77 | 71.45 | 28.55 | |
| IR | 28.82 | 28.82 | 21.18 | 21.18 | 57.64 | 42.36 | |
| Total | 31.57 | 32.62 | 18.24 | 17.57 | 64.19 | 35.81 |
Disclaimer/Publisher’s Note: The statements, opinions and data contained in all publications are solely those of the individual author(s) and contributor(s) and not of MDPI and/or the editor(s). MDPI and/or the editor(s) disclaim responsibility for any injury to people or property resulting from any ideas, methods, instructions or products referred to in the content. |
© 2024 by the authors. Licensee MDPI, Basel, Switzerland. This article is an open access article distributed under the terms and conditions of the Creative Commons Attribution (CC BY) license (http://creativecommons.org/licenses/by/4.0/).
Copyright: This open access article is published under a Creative Commons CC BY 4.0 license, which permit the free download, distribution, and reuse, provided that the author and preprint are cited in any reuse.


