
Submitted:
25 August 2024
Posted:
26 August 2024
You are already at the latest version
Abstract
Dendritic cells (DCs) are known as major antigen-presenting cells, and lymph nodes (LNs) play an important role in the DC-mediated immune response. This study focused on infiltration of CD1a-positive DCs (CD1a-DCs) in regional LNs in 70 cases of gallbladder cancer (GBC). The results showed that LNs infiltration by CD1a-DCs was associated with unfavorable clinical outcomes in patients with GBC in univariate analyses, but all cases categorized as CD1a-DCs high group at regional LNs had nodal metastasis. Therefore, LNs infiltration by CD1a-DCs was not an independent prognostic factor identified by multivariate analyses. The subgroup analyses in cases with LN metastasis group (n = 32), significant impact of CD1a-DCs infiltration into metastatic LNs was not observed. In contrast, CD1a-DCs infiltration into primary tumor had a significant impact on surgical outcomes. As the results of previous reports that focused on CD1a-DCs infiltration in regional LNs of other organs were varied, the role and significance of CD1a-DCs infiltration in regional LNs may be different according to the tumor histology or primary site. Accumulation of further studies is needed to clarify the role and significance of CD1a-DCs infiltration into regional LNs of solid cancers.
Keywords:
dendritic cell
; CD1a
; S100
; lymph node
; gallbladder cancer
1. Introduction
Gallbladder cancer (GBC) is an aggressive malignancy with a poor prognosis. The 5-year survival rate of GBC is 39.8% and the 5-year survival rates per tumor stage were 70.9% in Stage II, 30.4% in Stage IIIA, 29.7% in Stage IIIB, 7.3% in Stage IVA, and 4.1% in Stage IVB [1]. Patients with early-stage GBC unfortunately rarely exhibit symptoms and the diagnosis by imaging modality is often difficult [2], with many GBC cases being detected later with advanced cancer. Only about 19.8% of GBC cases are diagnosed in Stage I [1]. However, there is no established effective treatment for unresectable and recurrence GBC at the present time.
Dendritic cells (DCs) are a highly heterogeneous cell population comprised of several subsets with distinct origins, locations, markers, and migratory and functional properties [3]. Classical DCs (cDCs) are specialized antigen-processing and presenting cells, equipped with high phagocytic activity as immature cells and high cytokine producing capacity as mature cells [4]. DCs usually exist in two different functional states, mature and immature. These are distinguished by many features, but the ability to activate antigen-specific naïve T cells in secondary lymphoid organs is the hallmark of mature DCs. Immature DCs are poor inducers of naïve lymphocyte effector responses and do not release immunostimulatory cytokines. Indeed, immature DCs act as sentinels against invading pathogens, but also as tissue scavengers, capturing apoptotic and necrotic cells [5].
DCs, as key activators of the adaptive immune response, would be expected to have a central role in inducing antitumor immune responses and the many functional actions of these cells show in cancer patients emphasize the relevant roles they may, indeed, play in anti-tumor immune responses [7].
The immune microenvironment in the lymph nodes (LNs) is orchestrated by immune cells including macrophages, DCs, T cells, B cells and non-immune cells, such as fibroblastic reticular cells, blood endothelial cells and lymphatic endothelial cells. One of the key regulators of the host immune system that attacks cancer cells are DCs, which are highly specialized antigen-presenting cells that play crucial roles in the initiation of cellular immunity [8].
Among the various functional attributes of DCs, endogenous migration of DCs from antigen encounter site/tumor site or in the case of ex vivo generated DC vaccines, their migration from the injection site to draining LNs is critical, as it permits DCs to carry out their most important role of interacting with and activating adaptive immune cells [8].
CD1 molecules are structurally related to MHC I and like them, present antigen to αβ and γδ T cells. The 5 CD1 isoforms in humans fall into 3 groups on the basis of sequence homology and immune functions. Group 1 contains CD1a, CD1b and CD1c, which present antigens to clonally diverse T cells. CD1a presents a broad array of lipid antigens making it a highly versatile mediator of many different immune responses [8] and as markers for immature dendritic cells such as Langerhans cells present in human skin.
Previous reports have indicated that tumor infiltration by CD1a positive DCs (CD1a-DCs) was associated with favorable clinical outcomes in GBC [9]. Several studies have indicated that the infiltration of DCs into LNs was associated with favorable clinical outcomes in carcinomas of the breast [10], oral squamous cell carcinoma [11] and laryngeal cancer [12]. To the best of our knowledge, there has been no report focusing on DCs infiltration into regional LNs of GBC. Thus, the aim of the present study was to clarify the status as well as clinical impact of CD1a-DC infiltration into regional LNs in patients with GBC.
2. Results
2.1. Patients and Assessment of DCs in Regional LNs of Patients with GBC
The clinicopathological features of patients with GBC (n = 70) and the results of assessment of DCs in regional LNs are summarized in Table 1. The mean age at the time of surgery was 71.1 ± 8.8 years; 29 cases (41.4%) were male and 41 cases (58.6%) were female, and 32 cases had LN metastasis. During the assessment of CD1a-DCs at regional LNs, 14 cases (20.0%) were classified as the high CD1a-DCs group, and the remaining 56 cases (80.0%) were classified as the low CD1a-DCs group. During the assessment of S100-DCs at regional LNs, 45 patients (64.3%) were classified into the high S100-DCs group, and the remaining 25 patients (35.7%) were classified in the low S100-DCs group. Representative histological figures of DCs at reginal LNs are shown in Figure 1. Adjuvant therapy was performed in 37 cases (52.9%).
2.2. Association between Clinicopathological Features and the Status of DCs in the Regional LNs of Patients with GBC
The association between clinicopathological features and the status of CD1a-DCs in regional LNs are summarized in Table 2. Advanced T-stage group (T3/T4) was significantly correlated with the high CD1a-DCs group (P = 0.017). Significant association was observed between the high CD1a-DCs group and LN metastasis (P < 0.000). Of note, all high CD1a-DCs cases had LN metastasis and CD1a-DCs were observed at the nearby metastatic tumor. No high-density CD1a-DCs infiltration was observed in LNs without lymph node metastasis. We assessed the infiltration of CD1a-DCs into primary tumor tissue as documented in our previous study [10] but no significant association was found between CD1a-DCs infiltration into the primary tumor and LNs.
The association between clinicopathological features and the status of the S100-DCs in regional LNs are summarized in Table 3. In contrast to CD1a-DCs, there was no significant relationships between the clinicopathological features (age, sex, T-stage, LN metastasis, distant metastasis, and status of adjuvant therapy) and the de-gree of S100-DCs infiltration into regional LNs.
2.3. Kaplan-Meier Survival Curves According to the Infiltration of CD1a- and S100- DCs into Regional LNs
The survival curves for OS, DSS and RFS according to the status of CD1a-DC and S100-DC infiltration into regional LNs are shown in Figure 2. The high CD1a-DC in the LNs group showed significantly worse OS (P = 0,028), worse DSS (P = 0.010), and worst RFS (P = 0.020) than those patients in the low high CD1a-DC in the LNs group. In contrast, the status of S100-DC infiltration in LNs had no detectable significant impact on OS, DSS and RFS.
2.4. Kaplan-Meier Survival Curves According to the Infiltration of CD1a- and S100- DCs into Regional LNs
The survival curves for OS, DSS and RFS according to the status of CD1a-DC and S100-DC infiltration into regional LNs are shown in Figure 2. The high CD1a-DC in the LNs group showed significantly worse OS (P = 0,028), worse DSS (P = 0.010), and worst RFS (P = 0.020) than those patients in the low high CD1a-DC in the LNs group. In contrast, the status of S100-DC infiltration in LNs had no detectable significant impact on OS, DSS and RFS.
2.5. Univariate Analyses for DSS, OS and RFS in All Patients (n = 70)
The results of univariate analysis of potential factors associated with OS, DSS and RFS are summarized in Table 4. The factors significantly associated with OS were T stage (T1 / T2 vs. T3 / T4; P < 0.000), N stage (N0 vs. N1 / N2; P = 0.001), M stage (M0 vs. M1; P = 0.003) and CD1a-DCs in LNs (high vs. low; P = 0.028).
The factors significantly associated with DSS were T stage (T1 / T2 vs. T3 / T4; P < 0.000), N stage (N0 vs. N1 / N2; P = 0.000), M stage (M0 vs. M1; P = 0.000), CD1a status in tumor (high vs. low; P = 0.041) and CD1a-DCs status in LN (high vs. low; P = 0.010).
Factors associated with RFS were T stage (T1 / T2 vs. T3 / T4; P = 0.001), N stage (N0 vs. N1 / N2; P = 0.001), M stage (M0 vs. M1; P < 0.000), CD1a-DCs status in LN (high vs. low; P = 0.020) and adjuvant therapy (done vs. not done).
2.6. Multivariate Analyses of Factors Associated with OS, DSS and RFS (n = 70)
The results of the multivariate analyses are listed in Table 5. The only factor significantly associated with OS and DSS was T stage, and the only factor significantly associated with RFS was M stage. The CD1a-DC status in LNs showed no significant impact on OS, DSS and RFS due to confounding of the N stage (high-density CD1a-DCs infiltration was only observed in metastatic LNs).
2.7. Subgroup Analyses in Cases in the LN Metastasis Group
To confirm the impact of CD1a-DC infiltration in metastatic LNs, we performed the subgroup analyses in cases with LN metastasis group (n = 32). The survival curves for OS, DSS and RFS according to the status of CD1a-DC infiltration in regional LNs and primary tumor are shown in Figure 3. In metastatic LNs, a significant impact of CD1a-DCs infiltration was not observed in any OS, DSS or RFS. In contrast, a significant impact of CD1a-DCs infiltration into primary tumor was observed in each OS (P = 0.002), DSS (P = 0.001) and RFS (P = 0.001), that were consistent with our previous study findings [11].
The results of univariate analysis of factors associated with OS, DSS and RFS in cases with LN metastasis are summarized in Table 6. The factors significantly associated with OS were M stage (P = 0.049) and CD1a-DCs in tumor (P = 0.002), and adjuvant therapy (P = 0.010). The factors significantly associated with DSS were the M stage (P = 0.010) and CD1a-DCs in tumor (P = 0.001). The factors significantly associated with RFS were the M stage (P = 0.017) and CD1a-DCs in tumor (P = 0.001).
3. Discussion
Previous reports have indicated that infiltration of CD1a-DCs into primary tumor is associated with favorable clinical outcomes in GBC [10]. DCs take up antigens and pathogens, generate MHC–peptide complexes, migrate from the sites of antigen acquisition to secondary lymphoid organs and, finally, they physically interact with and stimulate T lymphocytes [13]. CCR7 and its ligands are crucially important for DC migration into lymph nodes from tumor [14,15,16]. Anti-tumoral responses depend upon a specialized subset of conventional DCs that transport tumor antigens to draining lymph nodes and cross-present antigen to activate cytotoxic T lymphocytes [17]. We hypothesized that CD1a-DCs in LNs play a fundamental role in antitumor immunity in patients with GBC. Therefore, we speculated that LN infiltration by CD1a-DCs would be associated with favorable clinical outcomes and that if CD1a-DCs migrated into regional LNs from the primary site, that there would be CD1a-DCs in not only metastatic LNs but also LNs without cancer metastasis.
Contrary to our expectations, the results showed that LNs infiltration by CD1a-DCs was associated with unfavorable clinical outcomes in patients with GBC. The results also revealed that all cases with high CD1a-DCs numbers in LNs had LN metastasis. Therefore, the impact of LN infiltration by CD1a-DCs on unfavorable clinical outcomes is considered as confounding as LN metastasis. In fact, LN infiltration by CD1a-DCs was not an independent prognostic factor revealed by multivariate analyses of OS, DSS and RFS. In addition, subgroup analyses of cases with LN metastasis, LN infiltration by CD1a-DCs had no significant impact on OS, DSS and RFS. In contrast, CD1a-DCs infiltration into primary tumor was significantly associated with OS, DSS and RFS, findings consistent with our previous study [11].
We had initially hypothesized that the numbers of CD1a-DCs in non-metastatic sentinel LNs would not be different from that in metastatic LNs, if CD1a-DCs migrate from primary tumors to sentinel LNs. However, the number of CD1a-DCs in non-metastatic sentinel LNs was significantly fewer than that of metastatic DCs, whereas the number of S100-DCs was not different between metastatic LNs and non-metastatic LNs. These results indicate a hypothesis that a component of CD1a-DCs in metastatic LNs may differentiate from monocytes through interaction with metastatic tumors other than migration from the primary tumor to LNs.
Several studies have investigated the association between CD1a-DCs infiltration into LNs and in the primary lesion of various organs, such as breast [18,19,20,21,22,23], skin (melanoma) [24,25,26,27], larynx [12], oral cavity [28,29], stomach [30] and the uterus [31] using various experimental approaches. However, the results were at best variable, and the role and significance of CD1a-DCs infiltration into regional LNs and/or primary tumor still remains unclear.
In breast cancer, a number of studies have reported that the degree of CD1a-DCs infiltration into LNs was similar in metastatic LNs and non-metastatic LNs [18,20,21] and that CD1a-DCs infiltration into LNs had no significant impact on prognosis [18,21]. On the other hand, Rocca et al. reported that the degree of the CD1a-DCs infiltration into metastatic LNs was significantly lower than into non-metastatic LNs [19]. Yang et al. [22]. compared the baseline infiltration of CD1a-DCs infiltration between sentinel LNs and non-sentinel LNs and their results appeared to indicate that the number of CD1a-DCs was lower in sentinel LNs than in non-sentinel LNs (3.3 % vs. 7.0 %), although statistical significance was not reached. Zheng et al. [23] investigated the impact of CD1a-DCs infiltration into the primary lesion of triple-negative breast cancer and their results indicated a significant association between CD1a-DCs infiltration and a worse OS. The later study also found a significant association between CD1a-DCs infiltration and PD-L1 expression in triple-negative breast cancer.
In melanoma, CD1a-DCs numbers were significantly decreased in non-sentinel LNs compared to sentinel LNs [24,25] and frequencies of CD1a-DCs subsets in sentinel LNs, assessed by flow cytometry, were related to local recurrence [26]. Barbour et al. [27] investigated CD1a-DCs infiltration into metastatic LNs of melanoma and suggested that low numbers of CD1a-DCs infiltration was correlated with reduced effector cell activation.
In oral squamous cell carcinoma, CD1a-DCs infiltration was found to be significantly higher in metastatic LNs than in non-metastatic LNs [28], whereas one study reported no significant difference in CD1a-DCs infiltration between metastatic- and non-metastatic LNs [29]. In laryngeal squamous cell carcinoma, no significant difference in CD1a-DCs infiltration between metastatic LNs and non-metastatic LNs was found. However, CD1a-DCs infiltration into LNs was significantly reduced after chemoradiotherapy compared to the treatment-naive group [12].
In gastric cancer, no significant difference in CD1a-DCs infiltration was observed between metastatic LNs and non-metastatic LNs [31]. In patients with endometrial and cervical cancers, there were significantly higher numbers of CD1a-DCs in the sentinel LNs compared to the non-sentinel LNs, although no significant difference of CD1a-DCs infiltration was found between metastatic sentinel LNs and non-metastatic sentinel LNs [31].
The limitations of the present research include the small sample size, the retrospective nature of the study, and that the assessment of mature DCs was only an indirect marker of S100. Although we initially tried to assess mature DCs using IHC of CD83, assessment of CD83 positive cells was difficult because their intensity revealed by IHC was faint and the dendritic shapes of CD83-positive cells were unclear.
To the best of our knowledge, this is the first study that has focused on CD1a-DCs infiltration into regional LNs of GBC patients. The results indicate strong confounding between CD1a-DCs and LN metastasis. As the varied results of previous studies, which mainly focused on CD1a-DCs infiltration into regional LNs of other organs, the role and significance of CD1a-DCs infiltration into regional LNs may be different according to the tumor histology or the primary site. The studies which focused on CD1a-DCs infiltration into primary tumor and regional LNs were few in number and the evaluation methods of CD1a-DCs were not uniform. Therefore, accumulation of further research findings are required to clarify unequivocally the role and significance of CD1a-DCs infiltration into regional LNs and primary tumor.
4. Materials and Methods
4.1. Patients
A total of 101 consecutive patients with GBC who underwent surgical resection of their primary lesion at Saga University Hospital between 2000 and 2020 were initially enrolled in the study. After the exclusion of patients with non-invasive or intramucosal cancer (pTis or pT1a), no LNs harvested, non-curative resection and synchronous advanced gastric cancer, a total of 70 patients with GBC were included (Figure 4). All patients provided informed consent for the use of resected tissue, and the study protocol was approved by the Ethics Committee of the Faculty of Medicine at Saga University (No. 2023–02-R-08). Clinical and histopathological staging were based on the TNM Classification of Malignant Tumors (8th edition) provided by the Union for International Cancer Control.
4.2. Immunohistochemistry
Immunohistochemistry (IHC) for CD1a and S100 was performed using a single representative block of formalin-fixed, paraffin-embedded tumor and LNs specimens obtained from each patient. Sections (4 μm) were deparaffinized, and antigen retrieval was performed using Histofine Heat Processor Solution pH 9 (Nichirei Biosciences, Tokyo, Japan) and an automatically controlled thermostat (Histofine HEAT PROII; Nichirei Biosciences). The following primary antibodies were used: mouse monoclonal anti-CD1a antibody (clone 010; IS06930–2; prediluted; Dako, Glostrup, Denmark) and rabbit polyclonal anti-S100 antibody (GA50461–2 J; prediluted; Dako). The Envision+ System (Dako) was used as the secondary antibody. Slides were visualized using diaminobenzidine tetrahydrochloride, and nuclei were counterstained with hematoxylin. An Autostainer Plus (Dako) was used for staining of specimens.
4.3. Assessment of CD1a-DCs and S100-DCs
IHC slides were scanned using NanoZoomer S360 (Hamamatsu Photonics, Shizuoka, Japan) to obtain digital images. CD1a-DCs and S100-positive DCs (S100-DCs) were evaluated by measuring hot spots at a ×100 magnification. In cases with LN metastasis, DCs in metastatic LNs were measured. Patient cohorts were divided into high- (> 10 / ×100 magnification) and low-group (≤ 10 / ×100 magnification), according to previous report [9].
4.4. Statistical Analysis
All statistical analyses were performed using JMP Pro ver. 13.1.0 software (SAS Institute, Cary, NC, US). Student’s t-test, Pearson’s chi-squared test and a linear regression analysis were employed when appropriate to make comparisons between 2 groups. Overall survival (OS) was defined as the period from surgery to death or the last follow-up. Disease-specific survival (DSS) was defined as the period from surgery to cancer-related death or the last follow-up. Relapse free survival (RFS) was defined as the period from surgery to cancer relapse or the last follow-up. The maximum follow-up period in the study was 120 months, with a median follow-up time of 47.7 months. The survival curve was plotted using the Kaplan-Meier method, and a log-rank test was conducted.
Funding
This study was financially supported by the Japan Society for the Promotion of Science KAKENHI Grant-in-Aid for Scientific Research (research project no. 22K16913). This study was also funded by The Soda Toyoji Memorial Foundation (research project no. JS20220057)
Author Contributions
Conceptualization and design, S.M. and K.K.; diagnoses and treatment to patients, T.T., T.I. and H.N; acquisition of data, S.M. and K.K.; writing-original draft of manuscript, S.M. and K.K.; material preparation and pathological assessments, S.M., K.K. and K.K.; analysis and interpretation of data, S.M. and K.K.
Institutional Review Board Statement
The study protocols were approved by the Ethics Committee of Saga University Hospital (approval number: 2023-02-R-08).
Informed Consent Statement
Written informed consent was obtained from all patients for the use of their clinical data and tissue samples for research purposes.
Data Availability Statement
Data contained within the article can be obtained from the authors upon reasonable request.
Conflicts of Interest
The authors have no conflicts of interest to declare.
Abbreviations
CCR7, C-Chemokine receptor 7; DC, dendritic cell; DSS, disease specific survival; FFPE, Formalin-Fixed Paraffin-Embedded; GBC, gallbladder cancer; IHC, Immunohistochemistry; LN, lymph node; OS, overall survival; RFS, relapse free survival
References
- Ishihara, S.; Horiguchi, A.; Miyakawa, S.; Endo, I.; Miyazaki, M.; Takada, T. Biliary tract cancer registry in Japan from 2008 to 2013. J Hepatobiliary Pancreat Sci. 2016, 23, 149–157. [Google Scholar] [CrossRef] [PubMed]
- Jang, J.Y.; Kim, S.W.; Lee, S.E.; Hwang, D.W.; Kim, E.J.; Lee, J.Y.; Kim, S.J.; Ryu., J.K.; Kim, Y.T. Differential diagnostic and staging accuracies of high resolution ultrasonography, endoscopic ultrasonography, and multidetector computed tomography for gallbladder polypoid lesions and gallbladder cancer. Ann Surg. 2009; 250, 943–949. [Google Scholar] [CrossRef]
- Waisman, A.; Lukas, D.; Clausen, B.E.; Yogev, N. Dendritic cells as gatekeepers of tolerance. Semin Immunopathol. 2017, 39, 153–163. [Google Scholar] [CrossRef]
- Geissmann, F.; Manz, M.G.; Jung, S.; Sieweke, M.H.; Merad, M.; Ley, K. Development of monocytes, macrophages, and dendritic cells. Science. 2010, 5966, 656–661. [Google Scholar] [CrossRef]
- Patente, T.A.; Pinho, M.P.; Oliveira, A.A.; Evangelista, G.C.M.; Bergami-Santos, P.C.; Barbuto, J.A.M. Human Dendritic Cells: Their Heterogeneity and Clinical Application Potential in Cancer Immunotherapy. Front Immunol. 2019, 9, 3176. [Google Scholar] [CrossRef] [PubMed]
- Li, Y.L.; Hung, W.C. Reprogramming of sentinel lymph node microenvironment during tumor metastasis. J Biomed Sci. 2022, 29, 84. [Google Scholar] [CrossRef] [PubMed]
- Seyfizadeh, N.; Muthuswamy, R.; Mitchell, D.A.; Nierkens, S.; Seyfizadeh, N. Migration of dendritic cells to the lymph nodes and its enhancement to drive anti-tumor responses. Crit Rev Oncol Hematol. 2016, 107, 100–110. [Google Scholar] [CrossRef]
- Yoo, H.J.; Kim, N.Y.; Kim, J.H. Current Understanding of the Roles of CD1a-Restricted T Cells in the Immune System. Mol Cells. 2021, 44, 310–317. [Google Scholar] [CrossRef]
- Kai, K.; Tanaka, T.; Ide, T.; Kawaguchi, A.; Noshiro, H.; Aishima, S. Immunohistochemical analysis of the aggregation of CD1a-positive dendritic cells in resected specimens and its association with surgical outcomes for patients with gallbladder cancer. Transl Oncol. 2021, 14, 100923. [Google Scholar] [CrossRef]
- Giorello, M.B.; Matas, A.; Marenco, P.; Davies, K.M.; Borzone, F.R.; Calcagno, M.L.; García-Rivello, H.; Wernicke, A.; Martinez, L.M.; Labovsky, V.; Chasseing, N.A. CD1a- and CD83-positive dendritic cells as prognostic markers of metastasis development in early breast cancer patients. Breast Cancer. 2021, 28, 1328–1339. [Google Scholar] [CrossRef]
- Gonçalves, A.S.; Costa, N.L.; Arantes, D.A.; de Cássia Gonçalves Alencar, R.; Silva, T.A.; Batista, A.C. Immune response in cervical lymph nodes from patients with primary oral squamous cell carcinoma. J Oral Pathol Med. 2013, 42, 535–540. [Google Scholar] [CrossRef]
- Kawasaki, K.; Kai, K.; Minesaki, A.; Maeda, S.; Yamauchi, M.; Kuratomi, Y. Chemoradiotherapy and Lymph Node Metastasis Affect Dendritic Cell Infiltration and Maturation in Regional Lymph Nodes of Laryngeal Cancer. Int J Mol Sci. 2024, 25, 2093. [Google Scholar] [CrossRef]
- Théry, C.; Amigorena, S. The cell biology of antigen presentation in dendritic cells. Curr Opin Immunol. 2001, 13, 45–51. [Google Scholar] [CrossRef] [PubMed]
- Ohl, L.; Mohaupt, M.; Czeloth, N.; Hintzen, G.; Kiafard, Z.; Zwirner, J.; Blankenstein, T.; Henning, G.; Förster, R. CCR7 governs skin dendritic cell migration under inflammatory and steady-state conditions. Immunity. 2004, 21, 279–288. [Google Scholar] [CrossRef]
- Brandum, EP.; Jørgensen, AS.; Rosenkilde, MM.; Hjortø, GM. Dendritic Cells and CCR7 Expression: An Important Factor for Autoimmune Diseases, Chronic Inflammation, and Cancer. Int J Mol Sci. 2021, 22, 8340. [Google Scholar] [CrossRef] [PubMed]
- Weber, M.; Hauschild, R.; Schwarz, J.; Moussion, C.; de Vries, I.; Legler, D.F.; Luther, S.A.; Bollenbach, T.; Sixt, M. Interstitial dendritic cell guidance by haptotactic chemokine gradients. Science. 2013, 339, 328–332. [Google Scholar] [CrossRef] [PubMed]
- Gardner, A.; Ruffell, B. Dendritic Cells and Cancer Immunity. Trends Immunol. 2016, 37, 855–865. [Google Scholar] [CrossRef]
- He, H.; Somlo, G.; Yun, Y.; Chu, P.G. Dendritic cell infiltration in lymph node positive breast carcinomas. Breast J. 2009, 15, 218–220. [Google Scholar] [CrossRef]
- La Rocca, G.; Anzalone, R.; Corrao, S.; Magno, F.; Rappa, F.; Marasà, S.; Czarnecka, A.M.; Marasà, L.; Sergi, C.; Zummo, G.; Cappello, F. CD1a down-regulation in primary invasive ductal breast carcinoma may predict regional lymph node invasion and patient outcome. Histopathology. 2008, 52, 203–212. [Google Scholar] [CrossRef]
- Poindexter, N.J.; Sahin, A.; Hunt, K.K.; Grimm, E.A. Analysis of dendritic cells in tumor-free and tumor-containing sentinel lymph nodes from patients with breast cancer. Breast Cancer Res. 2004, 2004 6, R408–15. [Google Scholar] [CrossRef]
- Blenman, K.R.M.; He, T.F.; Frankel, P.H.; Ruel, N.H.; Schwartz, E.J.; Krag, D.N.; Tan, L.K.; Yim, J.H.; Mortimer, J.E.; Yuan, Y.; Lee, P.P. Sentinel lymph node B cells can predict disease-free survival in breast cancer patients. NPJ Breast Cancer. 2018, 2018 4, 28. [Google Scholar] [CrossRef]
- Yang, Y.J.; Lim, S.J.; Song, J.Y. Tc-99m diphosphonate as a potential radiotracer to detect sentinel lymph nodes in patients with breast cancer. Nucl Med Mol Imaging. 2010, 2010 44, 62–68. [Google Scholar] [CrossRef]
- Zheng, J.; Wei, Y.; Li, X.; Shen, Z.; Zhang, Y.; Huang, B.; Jiang, Y.; Wang, D. Higher CD1a Levels Correlate with PD-L1 Expression and Predict Worse Overall Survival in Triple-Negative Breast Carcinoma. Breast Care (Basel). 2022, 2022 17, 31–39. [Google Scholar] [CrossRef]
- Vermi, W.; Bonecchi, R.; Facchetti, F.; Bianchi, D.; Sozzani, S.; Festa, S.; Berenzi, A.; Cella, M.; Colonna, M. Recruitment of immature plasmacytoid dendritic cells (plasmacytoid monocytes) and myeloid dendritic cells in primary cutaneous melanomas. J Pathol. 2003, 200, 255–268. [Google Scholar] [CrossRef]
- Botella-Estrada, R.; Dasí, F.; Ramos, D.; Nagore, E.; Herrero, M.J.; Giménez, J.; Fuster, C.; Sanmartín, O.; Guillén, C.; Aliño, S. Cytokine expression and dendritic cell density in melanoma sentinel nodes. Melanoma Res. 2005, 2005 15, 99–106. [Google Scholar] [CrossRef]
- van den Hout, M.F.C.M.; Koster, B.D.; Sluijter, B.J.R.; Molenkamp, B.G.; van de Ven, R.; van den Eertwegh, A.J.M.; Scheper, R.J.; van Leeuwen, P.A.M.; van den Tol, M.P.; de Gruijl, T.D. Melanoma Sequentially Suppresses Different DC Subsets in the Sentinel Lymph Node, Affecting Disease Spread and Recurrence. Cancer Immunol Res. 2017, 2017 11, 969–977. [Google Scholar] [CrossRef]
- Barbour, A.H.; Coventry, B.J. Dendritic cell density and activation status of tumour-infiltrating lymphocytes in metastatic human melanoma: possible implications for sentinel node metastases. Melanoma Res. 2003, 2003 13, 263–269. [Google Scholar] [CrossRef]
- Gonçalves, A.S.; Costa, N.L.; Arantes, D.A.; de Cássia, G.; Alencar, R.; Silva, T.A.; Batista, A.C. Immune response in cervical lymph nodes from patients with primary oral squamous cell carcinoma. J Oral Pathol Med. 2013; 42, 535–540. [Google Scholar] [CrossRef]
- Sakakura, K.; Chikamatsu, K.; Sakurai, T.; Takahashi, K.; Murata, T.; Oriuchi, N.; Furuya, N. Infiltration of dendritic cells and NK cells into the sentinel lymph node in oral cavity cancer. Oral Oncol. 2005 41, 89–96. [CrossRef]
- Nakamura, K.; Ninomiya, I.; Oyama, K.; Inokuchi, M.; Kinami, S.; Fushida, S.; Fujimura, T.; Kayahara, M.; Ohta, T. Evaluation of immune response according to the metastatic status in the regional lymph nodes in patients with gastric carcinoma. Oncol Rep. 2010, 2010 24, 1433–1441. [Google Scholar] [CrossRef]
- Kara, P.P.; Ayhan, A.; Caner, B.; Gultekin, M.; Ugur, O.; Bozkurt, M.F.; Usubutun, A.; Under, A. Analysis of dendritic cells in sentinel lymph nodes of patients with endometrial and patients with cervical cancers. Int J Gynecol Cancer. 2009, 2009 19, 1239–1243. [Google Scholar] [CrossRef]
Figure 1.
Representative images of immunohistochemistry of CD1a (a: high group, b: low group) and S100 (c: high group, d: low group). Original magnification of each photo was ×200, insets are enlarged images of high magnification of dendritic cells (original magnification ×400).
Figure 1.
Representative images of immunohistochemistry of CD1a (a: high group, b: low group) and S100 (c: high group, d: low group). Original magnification of each photo was ×200, insets are enlarged images of high magnification of dendritic cells (original magnification ×400).
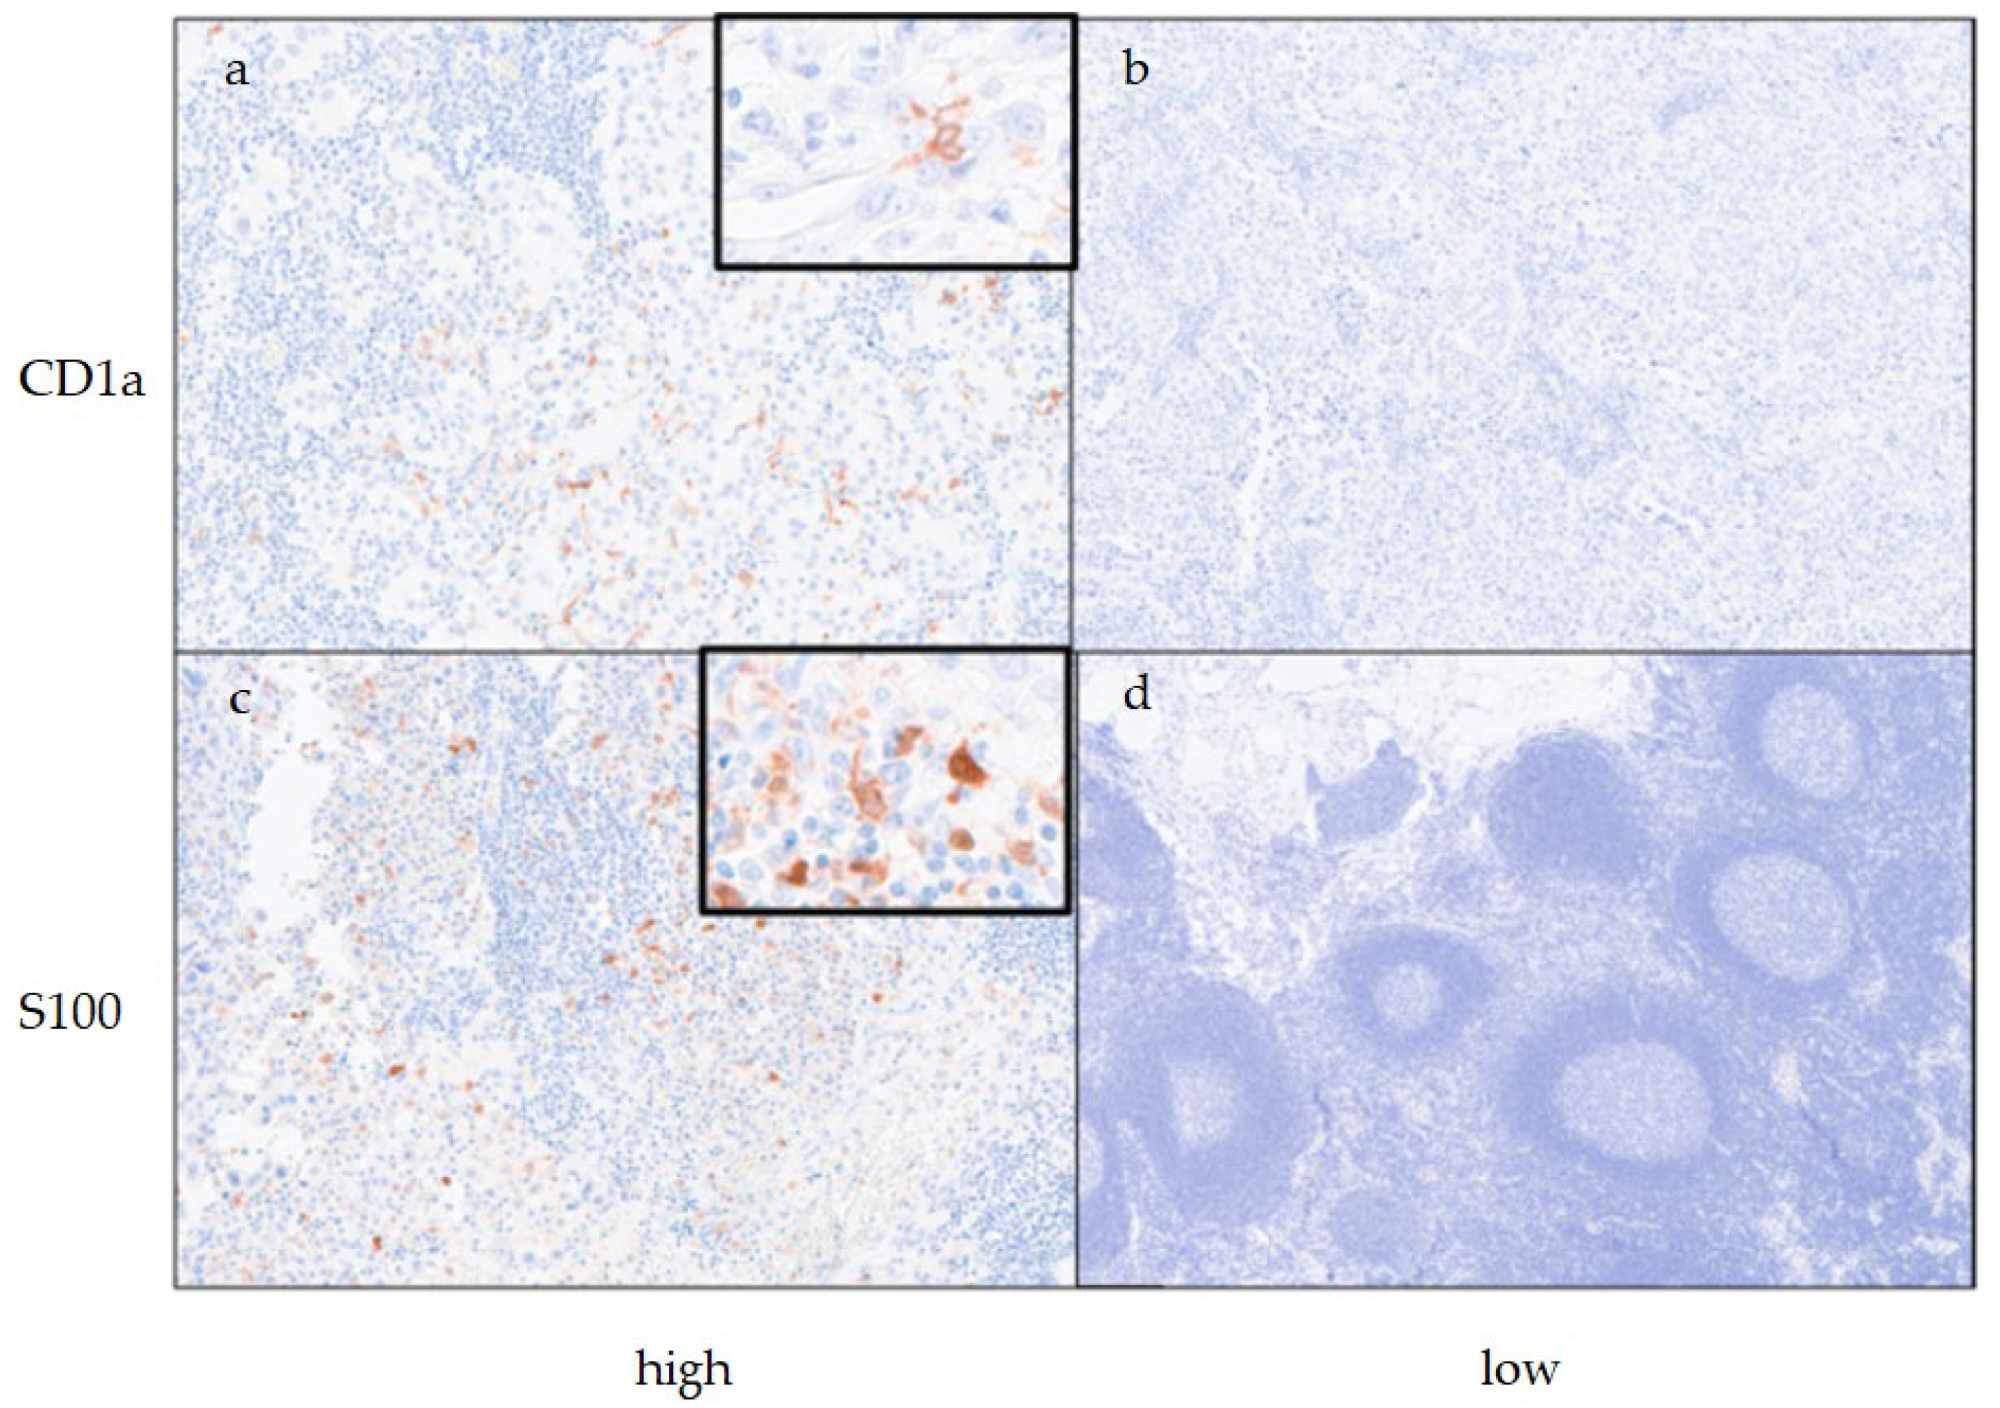
Figure 2.
Overall survival (OS), disease-specific survival (DS) and relapse free survival (RFS) curves according to CD1a-positive dendritic cell infiltration into regional lymph nodes (a-c), and S100-positive dendritic cell infiltration into regional lymph nodes (d-f).
Figure 2.
Overall survival (OS), disease-specific survival (DS) and relapse free survival (RFS) curves according to CD1a-positive dendritic cell infiltration into regional lymph nodes (a-c), and S100-positive dendritic cell infiltration into regional lymph nodes (d-f).
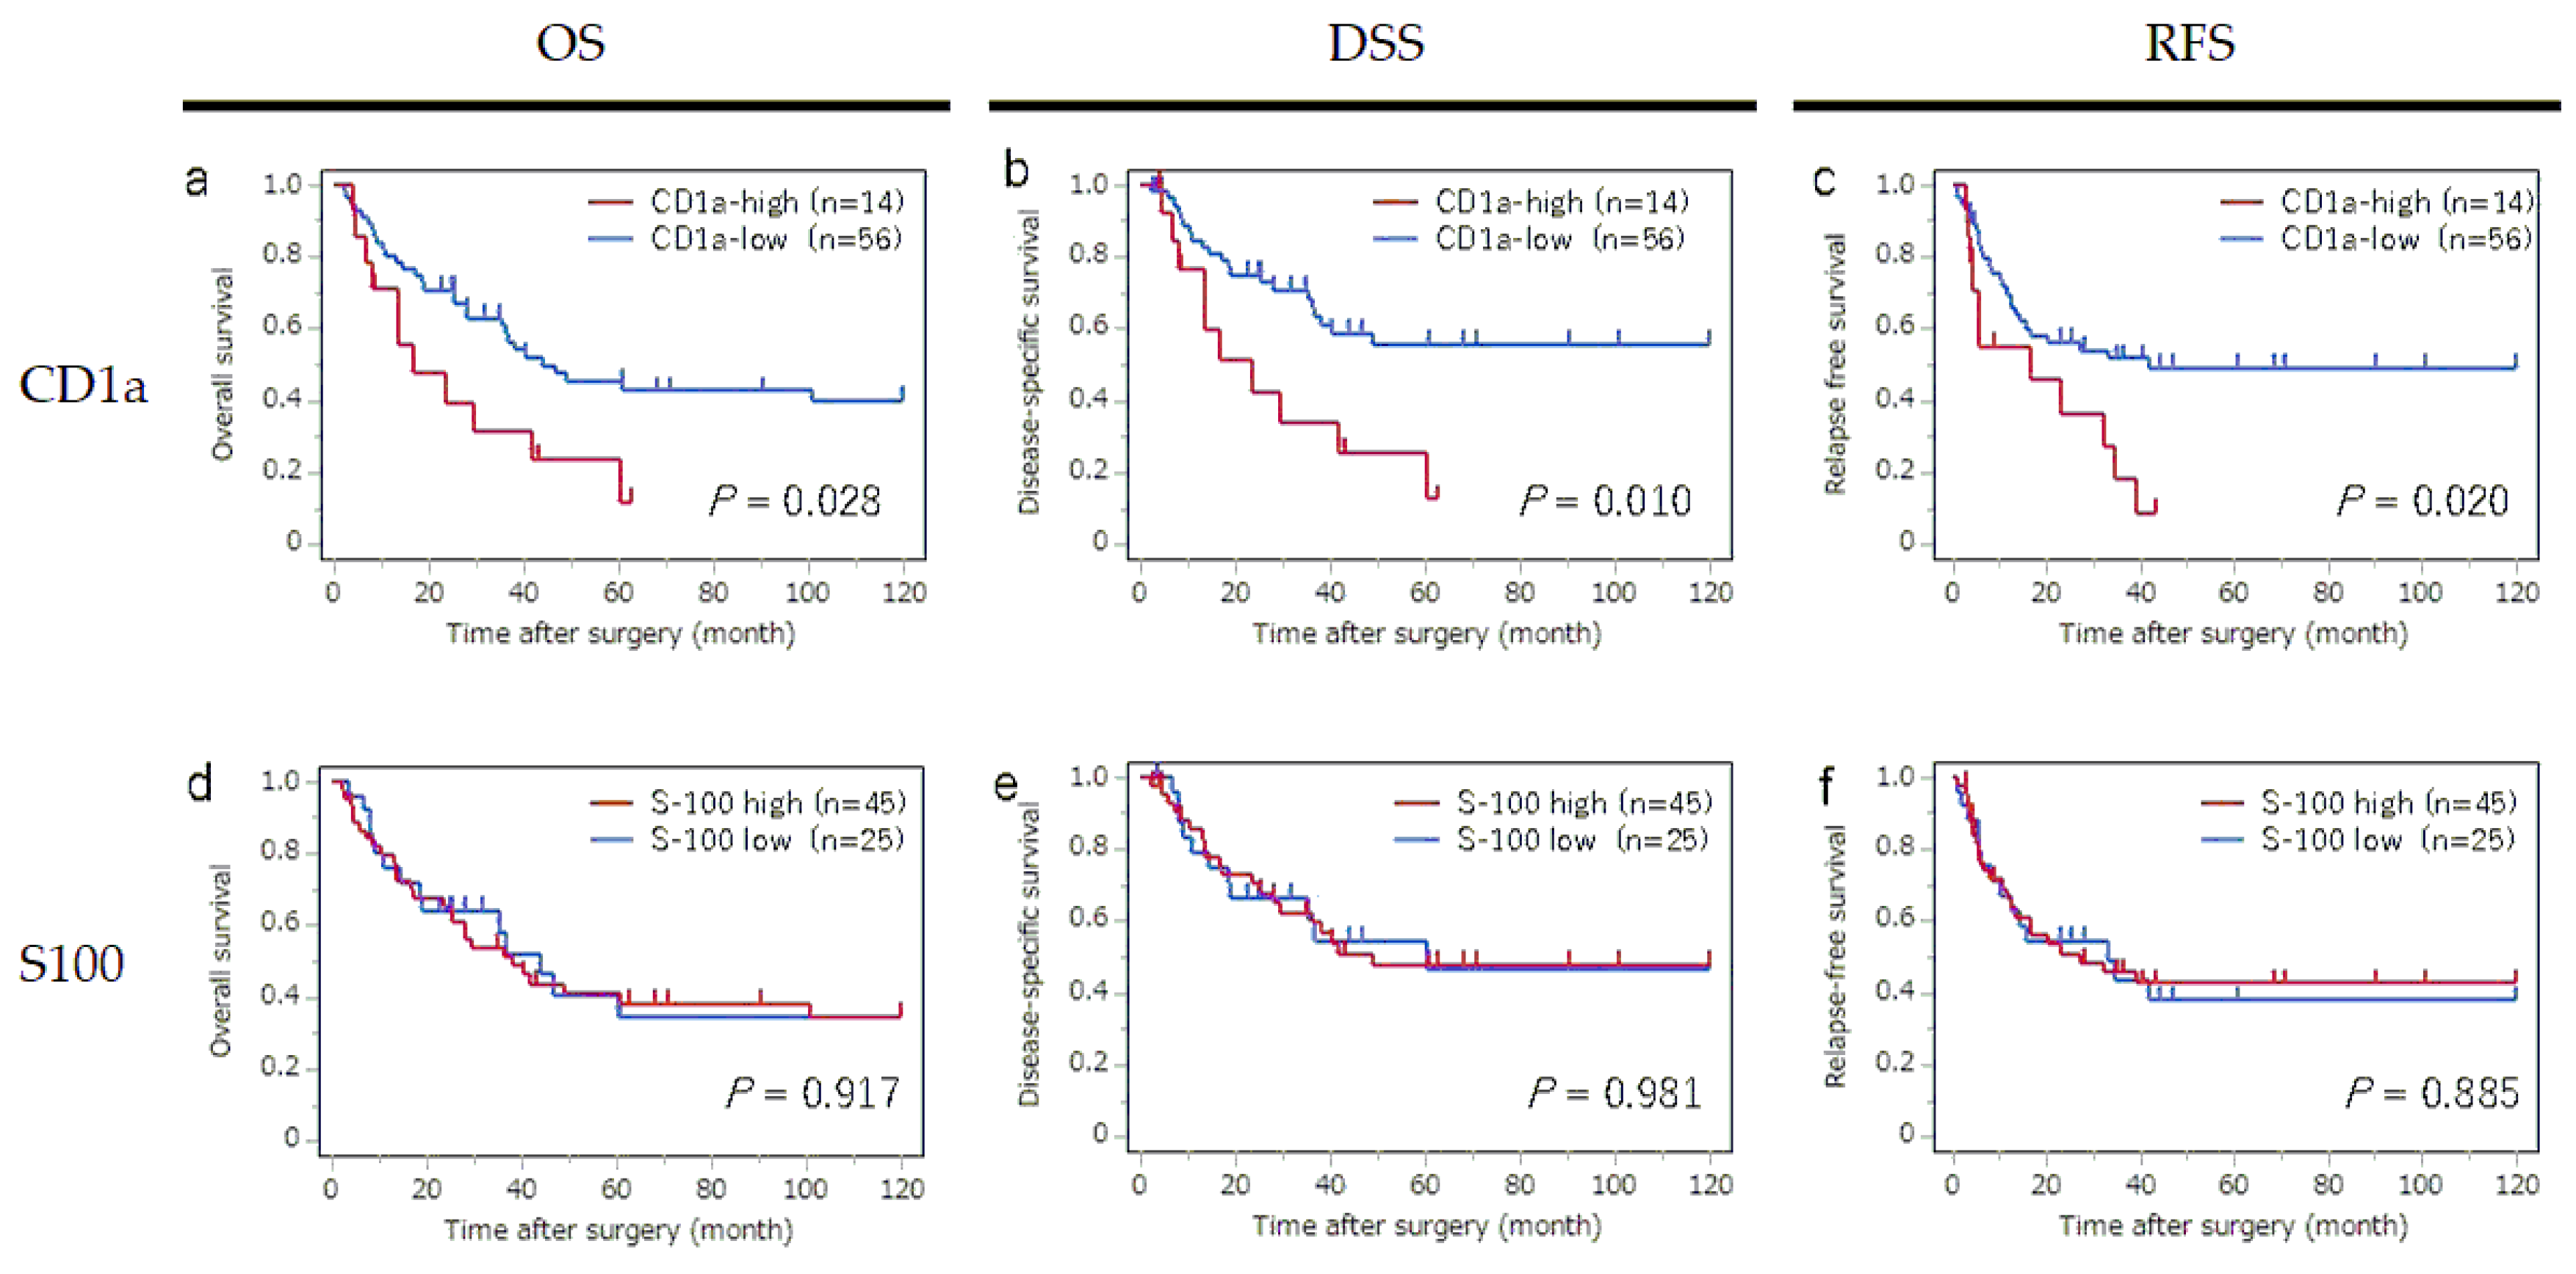
Figure 3.
Subgroup analyses in cases with LN metastasis group (n = 32). Survival curves for overall survival (OS), disease free survival (DSS) and relapse free survival (RFS) according to the status of CD1a-DC infiltration into regional lymph nodes (a-c) and primary tumor (d-f) are shown. No significant impact of CD1a-DCs infiltration into regional lymph nodes was found on OS, DSS and RFS. In contrast, a significant impact of CD1a-DCs infiltration into primary tumor was found for OS (P = 0.002), DSS (P = 0.001) and RFS (P = 0.001).
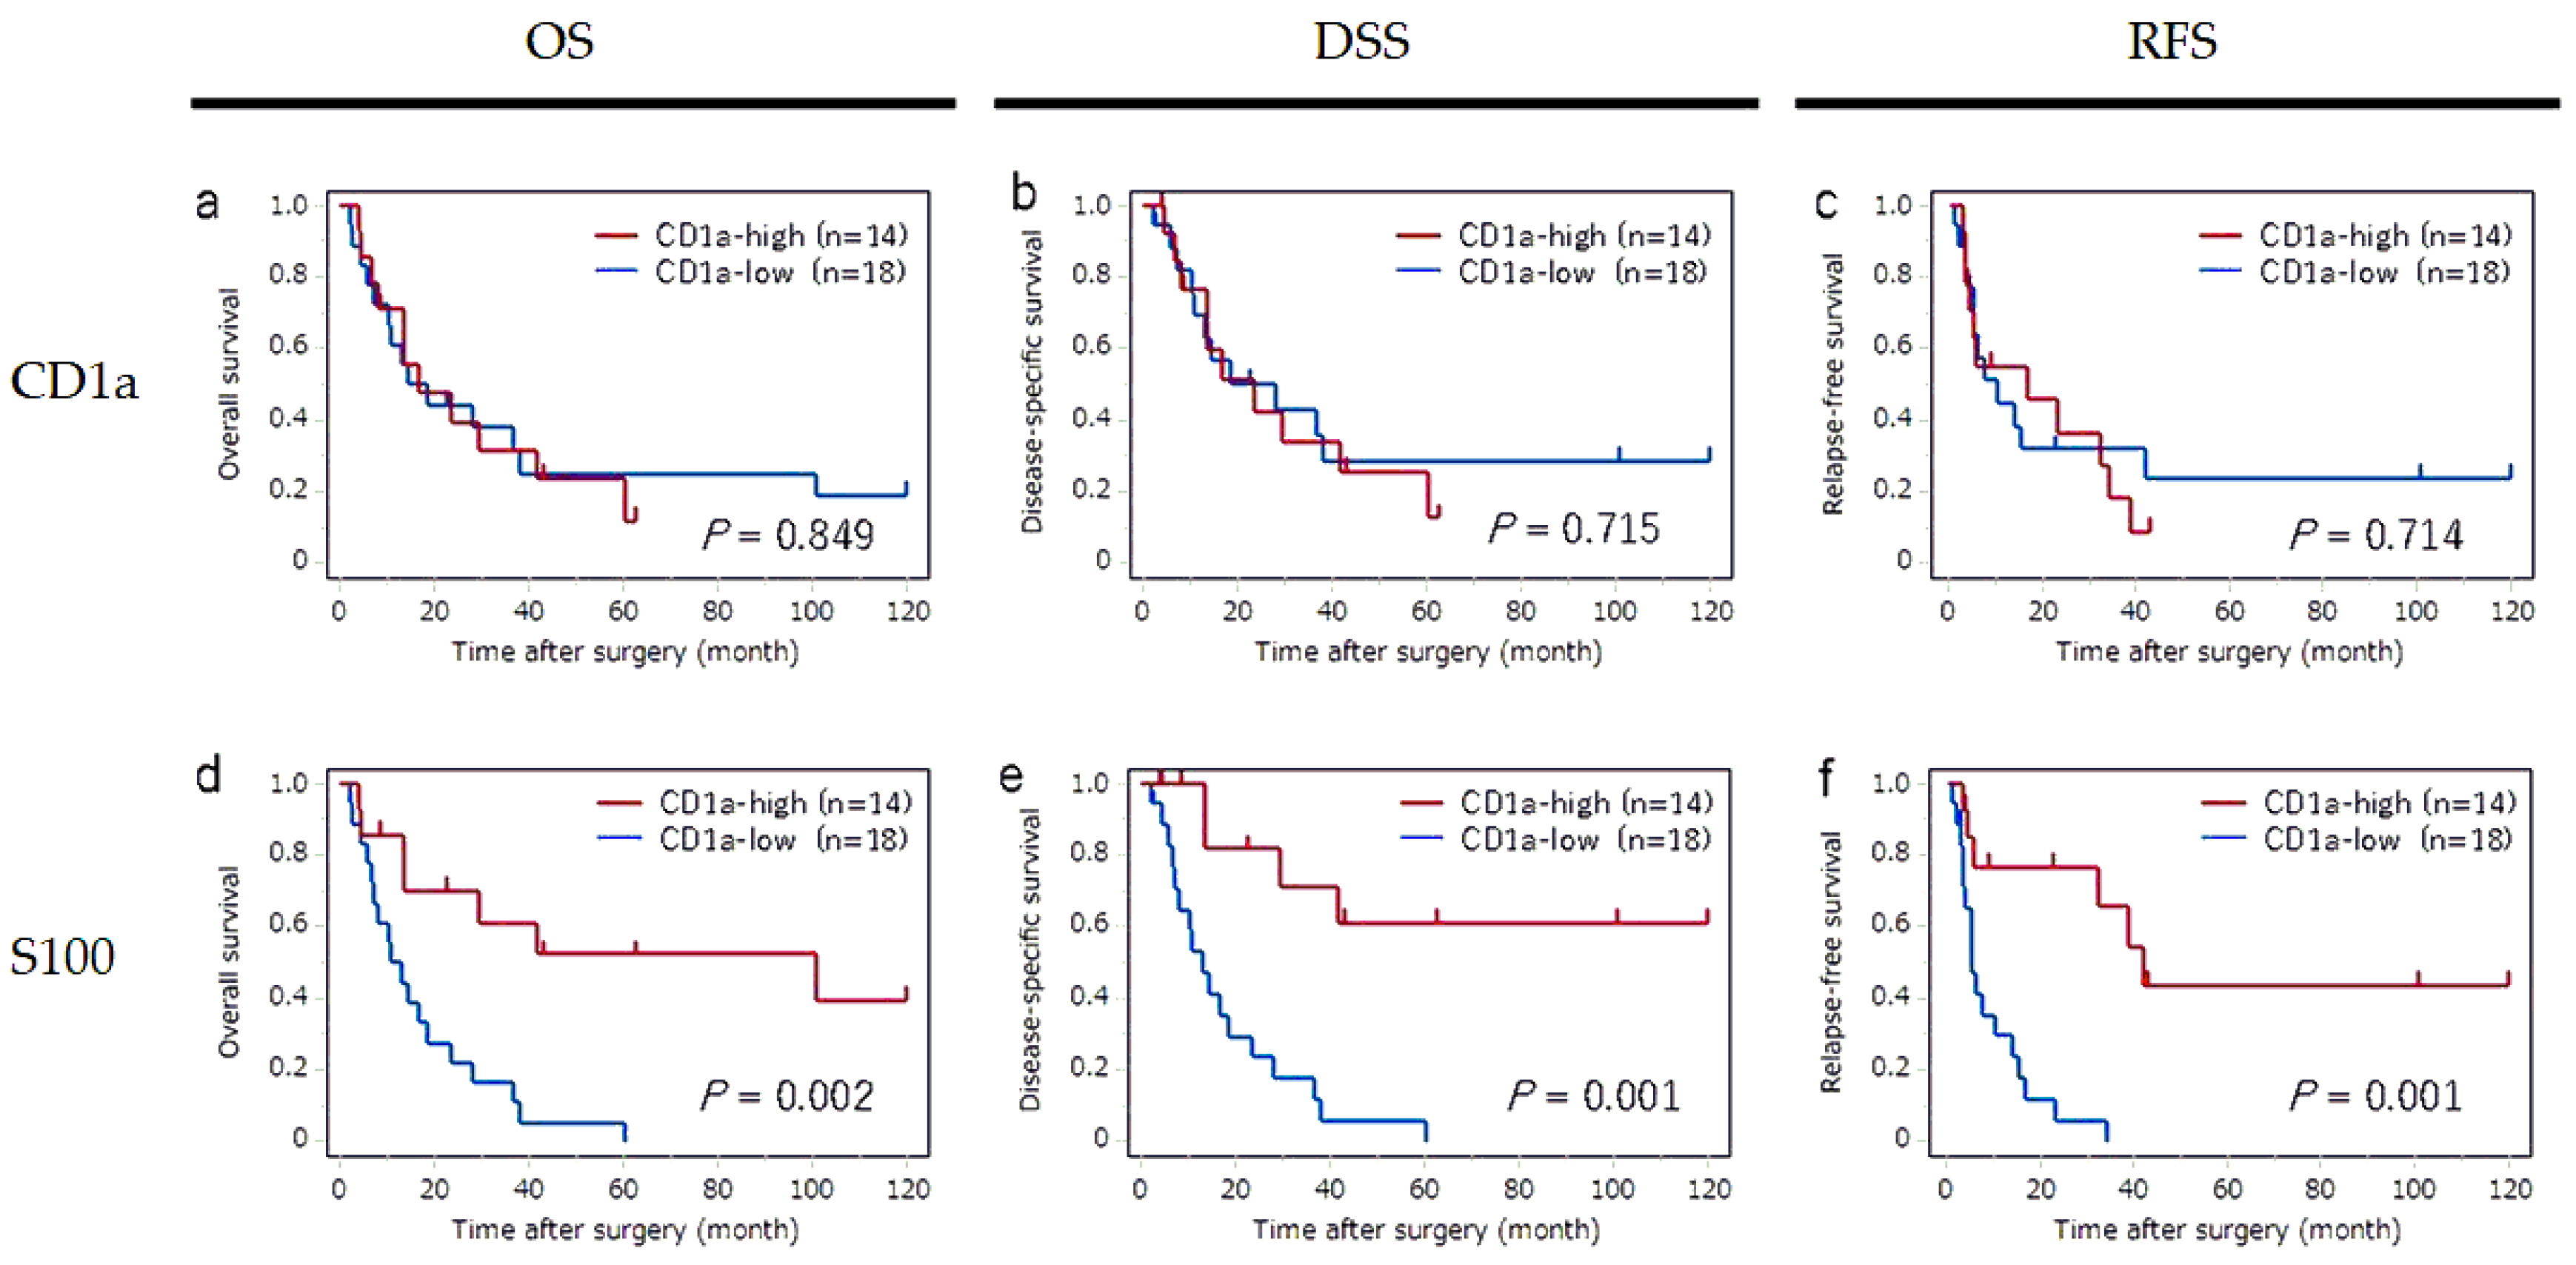
Figure 4.
Flow chart showing case selection criteria.
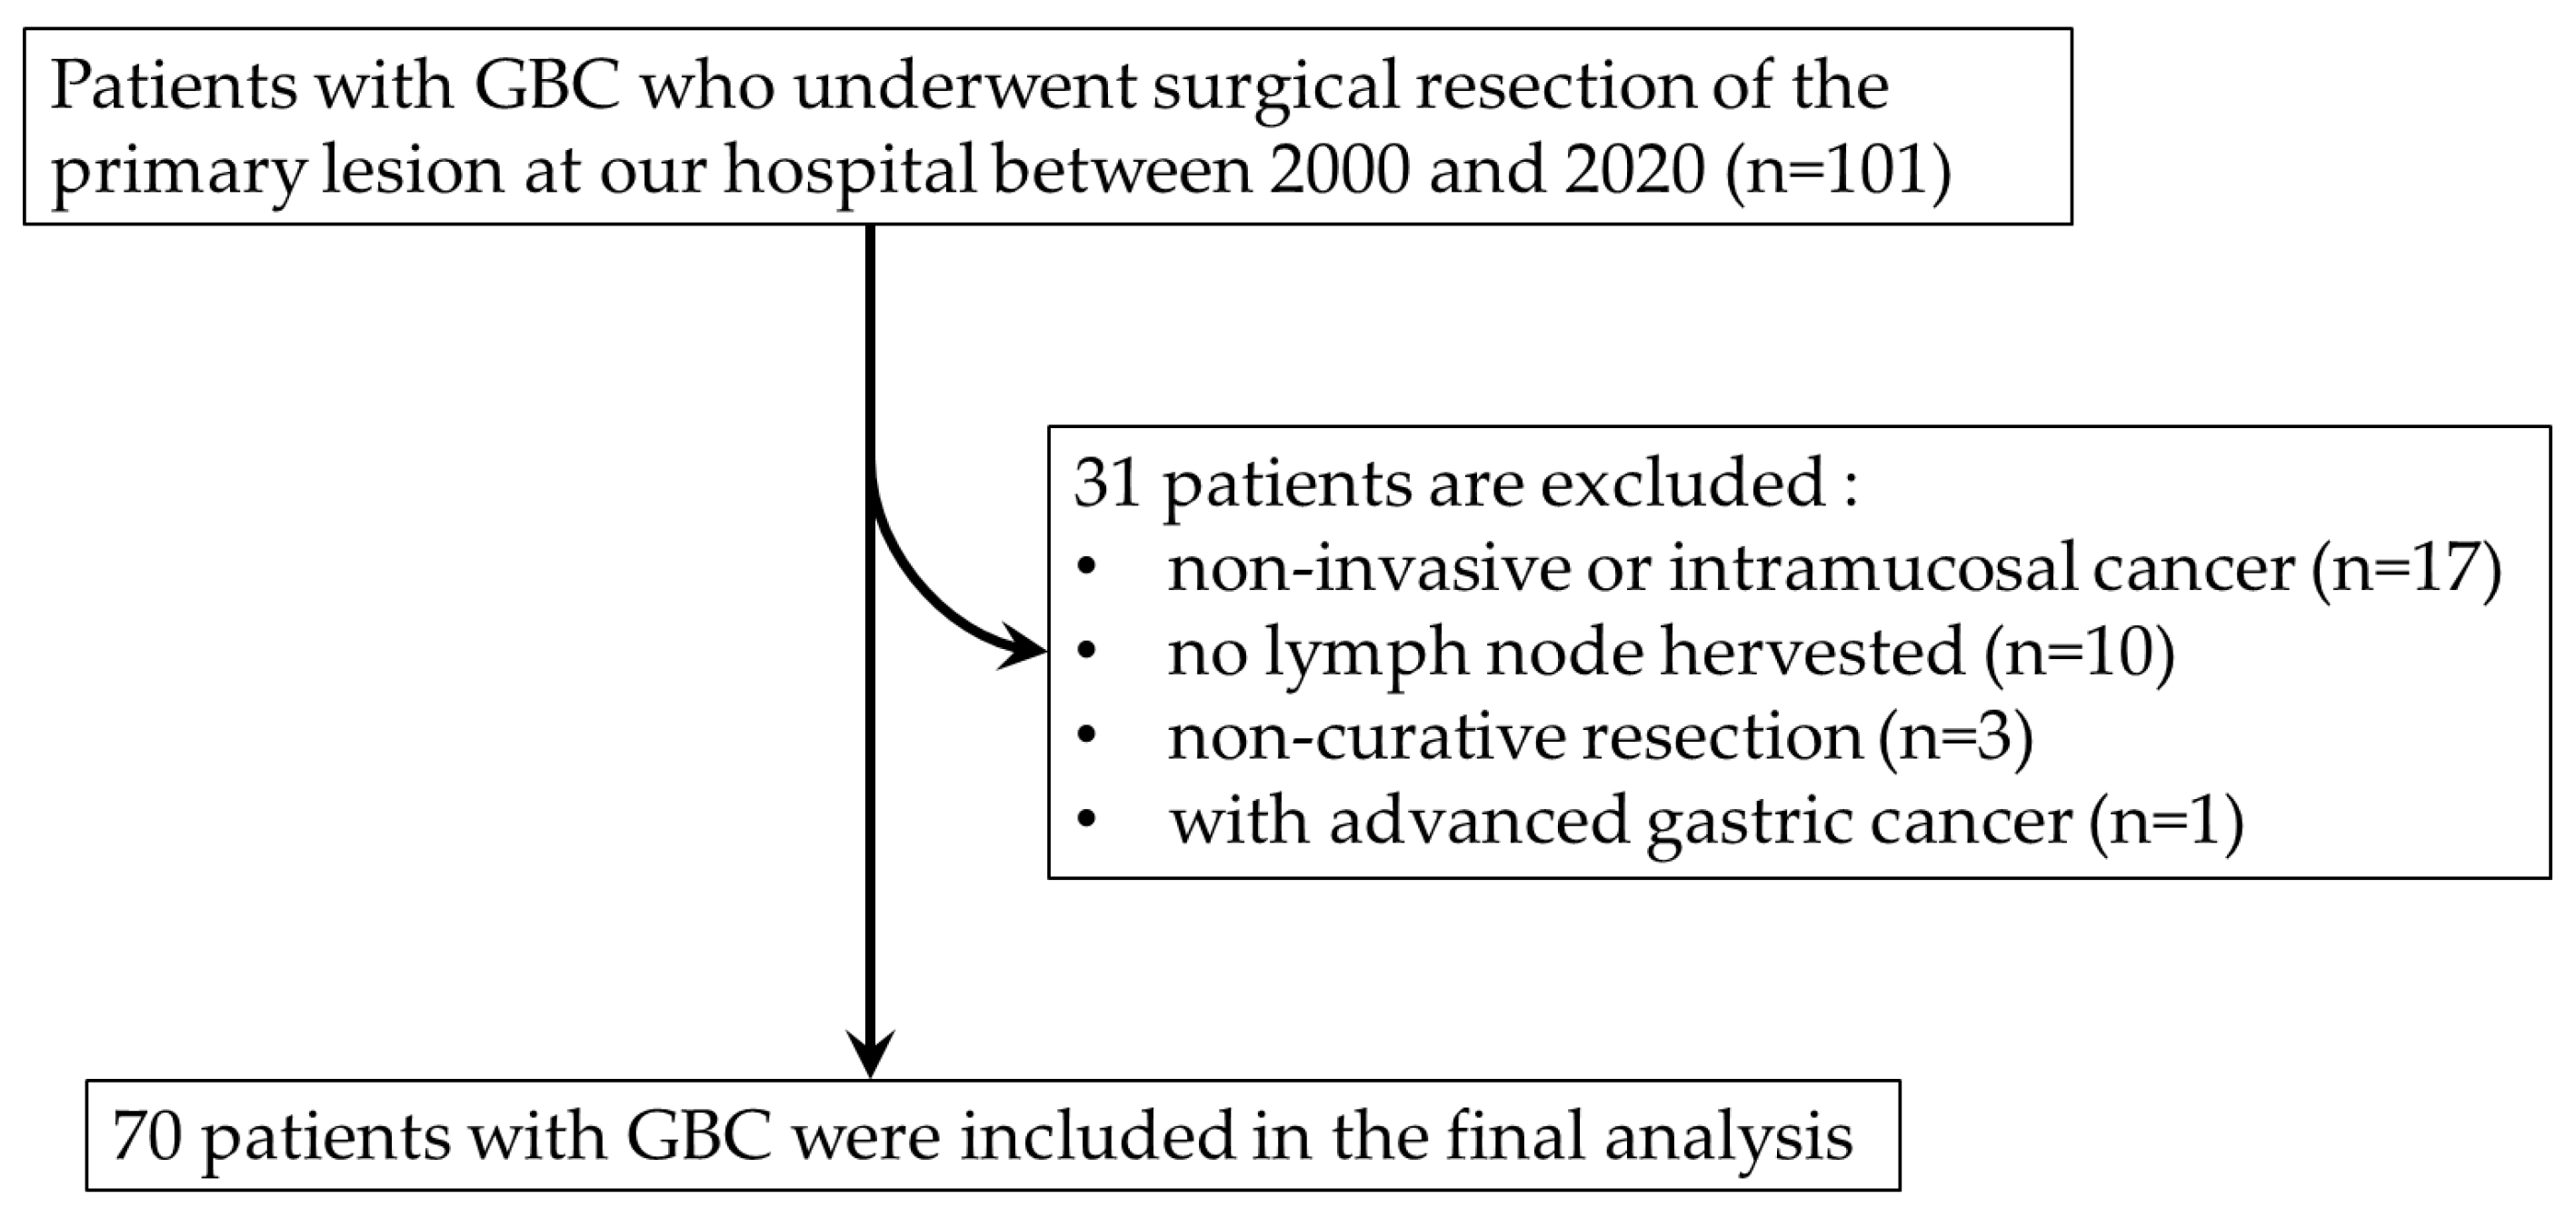

Table 1.
Clinicopathological features and the status of DCs in regional LNs of GBC (n = 70).
| Age (mean ± SD) | 71.1 ± 8.8 | |
| Gender | ||
| Male | 29 (41.4) | |
| Female | 41 (58.6) | |
| T (%) | ||
| 1b | 7 (10) | |
| 2a | 11 (15.7) | |
| 2b | 18 (25.7) | |
| 3 | 28 (40) | |
| 4 | 6 (8.6) | |
| N (%) | ||
| N0 | 38 (54.3) | |
| N1 | 27 (38.6) | |
| N2 | 5 (7.1) | |
| M (%) | ||
| M0 | 61 (87.1) | |
| M1 | 9 (12.9) | |
| CD1a-DCs in LN | ||
| high | 14 (20.0) | |
| low | 56 (80.0) | |
| S100-DCs in LN | ||
| high | 45 (64.3) | |
| low | 25 (35.7) | |
| Adjuvant therapy | ||
| done | 37 (52.9) | |
| not done | 33 (47.1) |
1 Abbreviations: DCs, dendritic cells; SD, standard deviation.
Table 2.
Association between clinicopathological features and the status of CD1a-DCs infiltration at regional LNs (n = 70).
Table 2.
Association between clinicopathological features and the status of CD1a-DCs infiltration at regional LNs (n = 70).
| Characteristics | CD1a-DCs high (n = 14) | CD1a-DCs low (n = 56) | P-value |
|---|---|---|---|
| Age (mean ± SD) | 70.9 ± 8.66 | 71.9 ± 9.43 | 0.718 |
| Male / Female (%) | 6 / 8 (42.9 / 57.1) | 23 / 33 (41.1 / 58.9) | 1.000 |
| T1b, T2 / T3, T4 (%) | 3 / 11 (21.4 / 78.6) | 33 / 23 (58.9 / 41.1) | 0.017 |
| N0 / N1, N2 (%) | 0 / 14 (0.0 / 100.0) | 38 / 18 (32.1 / 67.8) | <0.0001 |
| M0 / M1 (%) | 11 / 3 (78.6 / 21.4) | 6 / 50 (10.7 / 89.3) | 0.370 |
| CD1a-DCs in tumor (high / low) | 8 / 6 (57.1 / 42.9) | 27 / 29 (48.2 / 51.8) | 0.766 |
| Adjuvant therapy (done / not done) | 8 / 6 (57.1 / 42.9) | 29 / 27 (51.8 / 48.2) | 0.772 |
Abbreviations: DCs, dendritic cells; SD, standard deviation.
Table 3.
Association between clinicopathologic features and the status of S100-DCs infiltration at regional LNs (n = 70).
Table 3.
Association between clinicopathologic features and the status of S100-DCs infiltration at regional LNs (n = 70).
| Characteristics | S100-DCs high (n = 45) | S100-DCs low (n = 25) | P-value |
|---|---|---|---|
| Age (mean ± SD) | 70.9 ± 8.69 | 71.4 ± 9.05 | 0.821 |
| Male / Female (%) | 21 / 24 (46.7 / 53.3) | 8 / 17 (32.0 / 68.0) | 0.313 |
| T1b, T2 / T3, T4 (%) | 24 / 21 (53.3 / 46.7) | 12 / 13 (48.0 / 52.0) | 0.804 |
| N0 / N1, N2 (%) | 23 / 22 (51.1/ 48.9) | 15 / 10 (60.0 / 40.0) | 0.617 |
| M0 / M1 (%) | 40 / 5 (88.9 / 11.1) | 21 / 4 (84.0 / 16.0) | 0.712 |
| Adjuvant therapy (done / not done) | 24 / 21 (53.3 / 46.7) | 13 / 12 (52.0 / 48.0) | 1.000 |
Abbreviations: DCs, dendritic cells; SD, standard deviation.
Table 4.
Univariate analyses for DSS, OS, RFS in all patients (n = 70).
| OS | DSS | RFS | ||||
| Label | HR (95% CI) | P-value | HR | P-value | HR | P-value |
| Age < 71 yrs |
1.204 (0.651-2.225) | 0.554 | 1.680 (0.828-3.408) | 0.151 | 1.498 (0.786-2.855) | 0.220 |
| Gender (male) | 1.225 (0.661-2.274) | 0.519 | 0.980 (0.475-2.021) | 0.957 | 0.974 (0.505-1.879) | 0.937 |
| T3, T4 | 4.444 (2.242-8.809) | < 0.000 | 7.431 (3.023-18.266) | < 0.000 | 3.419 (1.709-6.839) | 0.001 |
| N1, N2 | 3.025 (1.605-5.670) | 0.001 | 4.014 (1.882-8.564) | 0.000 | 3.199 (1.636-6.254) | 0.001 |
| M1 | 3.501 (1.542-7.950) | 0.003 | 4.986 (2.114-11.759) | 0.000 | 6.006 (2.691-13.409) | < 0.000 |
| Low CD1a-DCs in tumor | 1.636 (0.878-3.048) | 0.121 | 2.159 (1.033-4.509) | 0.041 | 1.530 (0.798-2.934) | 0.201 |
| High CD1a-DCs in LN | 2.195 (1.890-4.423) | 0.028 | 2.714 (1.272-5.790) | 0.010 | 2.327 (1.144-4.733) | 0.020 |
| High S100-DCs in LN | 1.035 (0.542-1.976) | 0.917 | 0.991 (0.474-2.070) | 0.981 | 0.952 (0.490-1.850) | 0.885 |
| Adjuvant therapy (done) | 1.389 (0.739-2.612) | 0.308 | 2.078 (0.953-4.530) | 0.066 | 3.409 (1.597-7.281) | 0.002 |
Abbreviations: HR, Hazard ratio; CI, confidence interval; OS, overall survival; DSS, disease-specific survival; RFS, relapse free survival.
Table 5.
Multivariate analyses of factors associated with OS, DSS and RFS (n = 70).
| OS | DSS | RFS | ||||
| Label | HR | P-value | HR | P-value | HR | P-value |
| Age < 71 yrs |
0.884 (0.424-1.842) | 0.742 | 1.050 (0.448-2.462) | 0.911 | 1.143 (0.543-2.404) | 0.725 |
| T3, T4 | 3.741 (1.542-9.072) | 0.004 | 5.560 (1.791-17.256) | 0.003 | 1.585 (0.633-3.970) | 0.326 |
| N1, N2 | 1.393 (0.548-3.540) | 0.486 | 1.183 (0.394-3.546) | 0.765 | 1.363 (0.514-3.610) | 0.534 |
| M1 | 1.889 (0.738-4.833) | 0.185 | 2.357 (0.878-6.328) | 0.089 | 2.764 (1.240-7.460) | 0.045 |
| Low CD1a-DCs in tumor | 1.521 (0.765-3.024) | 0.232 | 1.769 (0.803-3.897) | 0.157 | 1.208 (0.574-2.542) | 0,619 |
| High CD1a-DCs in LN | 1.214 (0.542-2.722) | 0.637 | 1.486 (0.610-3.620) | 0.384 | 1.204 (0.520-2.784) | 0.665 |
| Adjuvant therapy (done) | 0.734 (0.327-1.648) | 0.454 | 0.826 (0.297-2.298) | 0.715 | 2.006 (0.807-4.984) | 0.134 |
Abbreviations: HR, Hazard ratio; CI, confidence interval; OS, overall survival; DSS, disease-specific survival; RFS, relapse free survival.
Table 6.
Univariate analyses for OS, DSS, and RFS in LN metastasis group (n = 32).
| OS | DSS | RFS | ||||
| Label | HR (95% CI) | P-value | HR | P-value | HR | P-value |
| Age < 71 yrs |
1.666 (0.738-3.761) | 0.219 | 1.920 (0.798-4.622) | 0.145 | 2.068 (0.900-4.753) | 0.087 |
| Gender (male) | 1.795 (0.245-1.269) | 0.164 | 1.674 (0.671-4.176) | 0.269 | 1.077 (0.441-2.627) | 0.871 |
| T3, T4 | 4.207 (0.976-18.136) | 0.054 | 7.282 (0.967-54.849) | 0.054 | 2.249 (0.663-7.628) | 0.193 |
| M1 | 2.498 (1.006-6.205) | 0.049 | 3.566 (1.355-9.382) | 0.010 | 3.159 (1.233-8.092) | 0.017 |
| Low CD1a-DCs in tumor | 4.495 (1.716-11.774) | 0.002 | 7.068 (2.282-21.898) | 0.001 | 6.871 (2.207-21.390) | 0.001 |
| High CD1a-DCs in LN | 1.081 (0.484-2.418) | 0.849 | 1.173 (0.497-2.768) | 0.715 | 1.166 (0.5103-2.664) | 0.716 |
| High S100-DCs in LN | 1.532 (0.638-3.681) | 0.340 | 1.186 (0.477-2.946) | 0.714 | 1.083 (0.457-2.564) | 0.856 |
| Adjuvant therapy (done) | 0.338 (0.149-0.769) | 0.010 | 1.956 (0.745-5.136) | 0.173 | 0.840 (0.328-2.153) | 0.716 |
Abbreviations: HR, Hazard ratio; CI, confidence interval; OS, overall survival; DSS, disease-specific survival; RFS, relapse free survival.
Disclaimer/Publisher’s Note: The statements, opinions and data contained in all publications are solely those of the individual author(s) and contributor(s) and not of MDPI and/or the editor(s). MDPI and/or the editor(s) disclaim responsibility for any injury to people or property resulting from any ideas, methods, instructions or products referred to in the content. |
© 2024 by the authors. Licensee MDPI, Basel, Switzerland. This article is an open access article distributed under the terms and conditions of the Creative Commons Attribution (CC BY) license (https://creativecommons.org/licenses/by/4.0/).
Copyright: This open access article is published under a Creative Commons CC BY 4.0 license, which permit the free download, distribution, and reuse, provided that the author and preprint are cited in any reuse.


