
Submitted:
22 August 2024
Posted:
25 August 2024
You are already at the latest version
Abstract
The tea leaf paradox (TLP) describes unsteady fluid motions which help entrain and deposit suspended particles at the center of rotation. Various applications depend on the TLP for particle separations spanning across orders of magnitude in length scales and is an important problem in fluid mechanics. Despite papers describing the phenomena, the efficacy of particle separation using the TLP remains unclear as to the relative importance of for example hydrostatics, particle-fluid density ratio, wall friction, liquid bath aspect ratio and the rotation speed. The dynamics involved are notably complex and require a careful tuning of each variable. In this study, we have investigated the role of the limit of the aggregation dynamics in rotational flows within 3D-printed vessels of various sizes in tandem with particle imaging to probe the dissipation effects on the particle motions. We have found that the liquid bath aspect ratio limits how much aggregation may occur for a particle-fluid density ratio greater than unity (e.g., $\rho_p/\rho_f >1$, where $\rho_p$ is the density of the particle and $\rho_f$ is the ambient fluid density.
Keywords:
Tea Leaf Paradox
; Separations
; Viscous effects
; rotational flow
; Dissipation
1. Introduction
As in Einstein’s depiction of the collection of tea leaves in a stirred cup of tea [1], the apparent paradox of the formation of a cone by negatively buoyant particles due to secondary flows (e.g., tea leaf paradox (TLP)) has garnered significant attention for understanding natural phenomena (e.g. sediment transport in cylindrical vessels [2] and in side-cavities [3] ), spurring various educational endeavors [4,5,6], and driving a host of commercial applications. Some of the commercial applications include: microfluidic particle enrichment or separation [7,8,9]; dissolution testing [10]; whirlpool separation [11,12,13]; cell transport [14]; and aerogel fabrication [15]. Broadly speaking, understanding the propagation of unsteady secondary flows is of relevance to commercial piping systems, hemodynamics, and the meandering of rivers [16]. Across all of these applications, the physics involved in the TLP notably may span orders of magnitude in terms of the governing length scales based on the established literature [7,13,17], yet a comprehensive description of how the TLP forms across length scales and the limitations therein remains inconclusive in the literature.
At first glance, it is not obvious whether the flow indeed must be steady (e.g.,is a steady Bodewadt flow sufficient for aggregation? [18,19,20]) or unsteady (e.g., Are spin-down flows a prerequisite for aggregation? [2]). Other questions involving the ambient phase include the importance of the hydrostatic pressure gradient and the rotation rate and acceleration. With regard to the walls, how does the roughness and macroscopic features change the particle aggregation rate and morphology of the cone? Also, how does the initial condition of the particle concentration gradient within the vessel change the final deposition morphology? What is the role of the particle density and shape on the final cone formation? With these questions in mind, we open up the possibility of many future studies which may probe the salient features of the TLP and to tune the hydrodynamics for a variety of applications.
In light of the many open questions, in this study, we have focused on the role of the limits of the TLP with respect to the viscous losses due to the walls for negatively buoyant fluorescent solid spherical microplastics (e.g., polyethylene in ethanol) harnessing 3D printing to create custom cylindrical vessels of various radii. The vessel rotation was set by an Arduino connected to a stepper motor capable of rotating the vessels at 212 rotations per minute. The primary objectives of this study was to control the height and radius of the fluid bath as well as the rotation rate to probe the dissipation effects in the TLP. Our results show that the surface area to volume ratio of the ambient fluid (e.g. isopropanol) sets the collection efficiency of the central aggregation provided that the alcohol bath dimensions are not in the lubrication regime. We have demonstrated herein that while the TLP is indeed a ubiquitous phenomenon and widely probed, it has surprisingly rich and rather complicated hydrodynamics where the simple rotation of a dispersed phase in a cup does not guarantee the formation of a cone.
2. Materials and Methods
In this study, we developed a rotational system controlled by an Arduino Uno (ELEGOO UNO R3) board to investigate the Tea Leaf Paradox. The Arduino board and power source were connected to a digital stepper driver (DM320T, STEPPERONLINE), which controlled the motor (Nema 17, STEPPERONLINE) (see Figure 1(a)). 3D-printed vessels (with radii cm) using a Formlabs 3+ Stereolithography (SLA) printer (See Figure 1(a)) was mounted onto the motor shaft to spin the vessels between 76.6-212 rotations per minute (rpm). The vessels were spun at various angular speeds,. The liquid bath was isopropanol (IPA) with density kg/m3, and viscosity, 2.27 mPa·s. We have chosen IPA to allow for the particles to sediment. We note that in all subsequent discussion, the subscript `d’ is used for the drop, `f’ for the fluid in the vessel. The bath depth,H was varied between 0.2 - 2 cm which allowed us to vary the surface-area-to-volume ratio as,
[1/m] allowed us to characterize the TLP such that as grows larger, we may expect for the dissipative effects to dominate the dynamics in the TLP.
Another important initial condition is the distribution and amount of particles used in the setup. The total particle mass, was kept constant across different fluid depths, H ( 0.03, 0.1, and 0.34 g for 1, 2, and 4 cm, respectively). Red polyethylene microspheres (150702-1, Cospheric) with diameter, 53-63 m and density, kg/m3 were added to the bath to visualize the flow dynamics in TLP. Since keeping the particle concentration, c, fixed can make it difficult to image the aggregation, we have chosen to fix the total particle mass added to the system for each cup instead to obtain more consistent imaging results. The fluid volume and bulk particle density in our experiment are shown in Table 1.
For the TLP imaging, a digital single-lens reflex (DSLR) camera (Nikon D3200) with a 35mm lens (AF-S DX NIKKOR, Nikon) was used for all images and videos. The particles were illuminated by green LED light (Thorlabs) which was first collimated and directed through a cylindrical lens to achieve a light sheet which illuminated the fluorescent particles at the bottom of the vessel. A red filter then allowed the camera to isolate the particles within the cup (see Figure 1(a)).
The experimental sequence is as follows: 1) the Arduino was used to control the motor to rotate the cup filled with IPA and particles for 20s to ensure the whole fluid was rotating; 2) the rotation was then halted and the camera started recording with a frame rate of 60 fps and shutter speed of 1/1000 s as soon as the motor stopped; 3) the recorded video was then processed into individual frames for image processing. For the image processing steps, each image was converted into grayscale and binarized using the Otsu method on Matlab. The binarized images were used to measure the area of particle aggregation near the center of the cup over time. The processing steps are depicted in Figure 1(b).
The relevant dimensionless numbers are described next in the context of the timescale of the particle collection, . By the Pi theorem, we suspect that the following variables are relevant to the TLP:
where mm2/s is kinematic viscosity of the fluid at room temperature and m/s2 is gravitational acceleration. Since there are two basic dimensions (e.g., length and time), we expect four dimensionless terms as shown in Equation 3,
where ℓ is the dimensionless length scale, is the Reynolds number, is the Froude number, and is the dimensionless time scale of the system. The quantity is the Ekman time scale. Based on these dimensionless parameters, of the system is and thus allowing for the fluid inertia to suspend the particles once the rotation stops. The Froude number varied between 0.36-2 and thus gravity effects grow more dominant at smaller and helps disperse the particles at early times.
3. Results
Figure 2 displays the top view of the particle movement within the vessels of various sizes over time at fixed and . At t=0s, when the motor shaft ceases to rotate the vessel, the fluid dynamics changes from rigid body rotation to an unsteady spin-down process. During rigid body motion, the liquid bath forms a curved interface and sets the hydrostatic pressure gradient in the radial direction, which will eventually flatten out quickly. Moreover, the rotation of the cup for 20 s allows for the particles to be driven outward due to the centrifugal forcing and sets the initial condition of the proceeding dynamics. Thus, around , most of the fluorescence signal is from the outer edge of the cup for all cup sizes. The separation of the particles during the spin-down process is related to since it controls the rotational time scale of the bulk flow. Thus, for the same , an increase in the R means a decrease in H and a concomitant decrease in the , leading to a decrease in the spin-down time of the bulk fluid. Consequently, for Figure 2a, while the separation occurs quickly even by , s and thus there is residual flow beyond the initial aggregation which drives a asymmetric swirling of the particle aggregate in s. Unlike in the case of conventional tea leaves with jagged edges, spherical particles aggregate and then spread slowly likely due to more particles sedimenting out and reaching the Ekman layer (e.g. s for Figure 2a). In Figure 2b, since the s and an initial aggregation spot is formed at the center before 1 s, the particles which sediment out to the Ekman layer do not make it to the central aggregation as the flow has now significantly stopped. As the cup size is further increased (Figure 2c), we see that now for 4 cm, s and even more of the particles end up sedimenting out instead of aggregating at the center, which shows that the TLP is not universal, but depend on , and the particle sedimentation rate. Also, while is fixed, we also note that the and thus the fluid bath is increasingly becoming a film and viscous forces in the film grows increasingly prominent. Nevertheless, even if, the film Reynolds number, would be , which is never less than 1 and thus never in the lubrication regime.
Figure 3(a) and (b) illustrate the impact of the parameter on the concentration of particles at the center of the vessel (), normalized by the wetted surface area () and the dimensionless time, . At (the lowest depth, H), while the Ekman time (e.g., ) predicts when significant particle accumulation commences, whereas for the intermediate values, , the particle accumulation begins faster than the Ekman time for cm but not for cm. For cm, all follows similar aggregation rates. For cm, at the lowest , the particle separation is slower than the intermediate likely due to the fact that this case has and particle sedimentation time is significantly larger for this case than the other cases.
Figure 3(c) and (d) show the influence of the vessel size at (Figure 3(c)) and (Figure 3(d)), where we suspect that the and not the vessel radius controls the separation dynamics. In Figure 3(c), as the vessel size gets smaller, the separation occurs faster, yet the difference is rather small and virtually indistinguishable between 2 - 4 cm vessels. In Figure 3(d), while the central aggregation grows at similar times, the 4cm vessel causes continual growth of the aggregation instead of growing and plateauing as in the other cases.
Figure 4 exhibit the effect of angular speed on the TLP at fixed and cm−1. The particle aggregation to the center occurs for all case and as increases, a larger number of particles are observed near the bottom of the vessel as shown in Figure 4a. We suggest that the breakage in the symmetry of the patterns formed by the particles are reminiscent of the spiraling due to Ekman spirals, which are more pronounced at larger (Figure 4b). The central aggregation spot is smaller at the lower and it takes longer for the particle aggregation to develop in size with decreasing (Figure 4b). For these reasons, we have selected the highest for all of our experiments throughout the experiments.
Figure 5 displays the local particle concentration , normalized by the initial concentration c. The cm and were fixed to examine the particle distribution during the TLP. Around s, particles began to converge from the walls towards the center of the vessel. This initial movement causes the particle distribution to spread from the walls towards the center, with particles traveling faster from the wall compared to those closer to the center. As the aggregation progresses, the distribution becomes more focused around the center as shown in Figure 5(a) for s. As time progresses, the flow near the side wall slows down due to viscous effects. In contrast, particles in the flow continue to circulate around the center as more particles sediment out to the bottom wall and form a dense particle aggregation at the center. Eventually, the dense aggregation at the center also spreads out slowly over time.
4. Discussion
Driven by the need to understand the various hydrodynamic features which govern the TLP, we first seek to describe the major constituent parts of the classic TLP which we may split into three phases, the ambient fluid, the wall and the dispersed phase (e.g., solid particle, immiscible liquid or gas). For the ambient fluid, the rotational flow must be strong enough to scatter the dispersed phase and the strength of the initial angular momentum and the time the rotation is applied sets the initial condition of the concentration gradient of the dispersed phase. For example, if the rotation is below the critical angular momentum whereby fluid instability drives mixing, the rotation simply acts as a centrifuge and the centrifugal force from the perspective of the particle leads to outward movement for negatively buoyant and inward movement for positively buoyant particles, respectively. The strength of the rotation also sets the hydrostatic pressure balance during steady rotation resulting in rigid body rotation of the fluid bath and a hydrostatic pressure gradient radially outward. For the wall, the TLP typically has an open top (i.e., free surface boundary condition) with a bottom and side walls, which impart a viscous boundary layer and wall-induced lift on the dispersed phase. Moreover, the roughness and macroscopic features on the walls changes the TLP by imparting greater resistance to the flow. For the dispersed phase, the density ratio between the dispersed phase and the ambient phase sets the time scale for the particle to sediment out of the ambient phase, which is typically ignored in studies probing the TLP. The particles also tend to be rough, non-isotropic and non-brownian in the classic TLP (e.g., tea leaves). Moreover, in the classic TLP, the spin-down of a cylindrical vessel allows negatively buoyant particles to experience greater drag at the walls and especially the bottom wall where the centrifugal forces are the least strong, where the decrement in the rotational rate eventually focuses the particles into a cone with an angle of repose. Outside of this classic understanding of the TLP, many questions arise as to the limits of the TLP.
We first describe the hydrostatic pressure distribution in the bath during rigid body rotation [21] in Equation 4:
where is the gauge pressure at the origin, , set at the center of the rotating bath at the liquid-air interface (r and z are the radial and longitudinal coordinates of the cylindrical coordinate system). Thus, if is the thickness of the fluid above the bath height, then . When h is large, the sudden change in the liquid height may be a strong contributing factor to the particle motions due to the conversion of potential to kinetic energy.
To understand the particle movement within the fluid, we suggest the following force balance of the particles in both z and r directions. The force balance in the z direction is shown in Equation 5:
where is the Stokes drag force (the sign depends on whether the particle travels upwards or downwards) and where is the radius of the particle and is the velocity of the flow in the z direction. The gravitational force is given by and the buoyancy force is given by . The density difference between the particle and the fluid allows for the particles to sediment where the rate of the sedimentation is given by Equation 5 under steady conditions,
cm/s and thus the total time to sediment is approximately 13.88 - 111.11 s under static conditions. However, the central aggregation generally occurs on the order of the Ekman time scale and thus we expect the secondary flows to play a much greater role in aggregating the particles prior to the complete sedimentation of all of the particles in solution.
The force balance in the r direction is shown in Equation 7,
where is the drag force in the radial direction (inward or outward depending on the density ratio). The centrifugal force is given by and the buoyancy force . We may thus obtain the radial velocity of a particle moving radially outward as
Since cm/s for cm, respectively, at the highest rotation rate, the 20s rotation time allows most of the particles to start out near the walls prior to stopping the rotation.
Once the rotation is stopped, a viscous boundary layer immediately changes in time where the boundary layer thickness may be given by ( Equation 9),
As the rotation ceases, the boundary layer grows and the viscous effects grow in importance in the particle motions. Moreover, since the particle Reynolds number, or less, their motions are generally well described by Stokes drag and based on the Stokes number, , the particles follow the streamlines. In a typical experiment, with mm and (particle relaxation time). The spin down process drives the inward motion of the particles and once the particles are collected, the blob of particles does not stay still in our experiments as they form a particle suspension which is mobile (which is less likely for jagged, non isotropic particle geometries).
Once the particles are collected at the center of the vessel, assuming that the blob spreads roughly in a monolayer, the flow rate of the particles, Q, at the contact line is given by Equation 10:
where is the initial radius of the blob and denotes the volume fraction of the spherical particles within the blob where is the total volume of the particles and is the volume of the blob. The blob is presumably cylindrical with height and radius, .
From mass conservation, the following scaling may describe the radius of the blob with time:
We may obtain the flow rate, Q from the momentum balance by presuming that the initially collected particle blob is free to spread in time. Lubrication theory applied to the blob with an unknown suspension viscosity, , and density, spreads by gravity. Lubrication theory is justified on the grounds that is small compared to where the equation which describes the gravitational settling of the particle blob is given by, . Since and , we have attained a scaling law for the velocity of the particle flow of the blob,
Substituting u with in Equation 10, the scaling between the radius of the blob with time is then given by,
Thus, the area of the blob which was recorded in would scale with which was plotted in Figure 6. The scaling describes well the slope of the experimental particle collection area after the initial aggregation time (where can be estimated from Q and . At early times, the particle aggregation rapidly grew according to , which we attribute to the complex unsteady flows at the early stages of the spin down process.
5. Conclusions
In this study, we investigated the viscous effects in the Tea Leaf Paradox to study micro particles aggregation and separation in rotation flow. When the fluid depth is shallow or when approaching the Ekman boundary, viscous forces become predominant, significantly inhibiting the TLP. This dominance of viscosity disrupts the expected radial motion of particles towards the center. On the other hand, once particles aggregate at the center of the vessel, the area of particle collection evolves over time. Given sufficient time, this collection area spreads according to a time scale characterized by , reflecting the underlying dynamics of particle distribution and aggregation in a viscous fluid. These results shed light on the viscous effects which influence both the onset and progression of the TLP and it may be of interest for future studies to probe the influence of microgravity environments, electrokinetics, fluid bath stratification, and wall roughness effects.
Author Contributions
H.T. conceptualization, validation, formal analysis, data curation, writing, P.P., conceptualization, investigation, validation, review and editing, M.Y.P. conceptualization, validation, formal analysis, investigation, resources, data curation, writing, review and editing, supervision.
Funding
This research received no external funding.
Data Availability Statement
Data described in this article will be freely available upon request.
Acknowledgments
The authors would like to thank the Baylor University Startup funds for the support of this work.
Conflicts of Interest
The authors declare no conflicts of interest.
References
- Einstein, A. The cause of the formation of meanders in the courses of rivers and of the so-called Baer’s law. Die Naturwissenschaften 1926, 14, 223–224. [Google Scholar] [CrossRef]
- González-Vera, A.; Duran-Matute, M.; van Heijst, G. Morphodynamics of a sediment bed in a fluid-filled cylinder during spin-down: An experimental study. Physical Review Fluids 2018, 3, 124306. [Google Scholar] [CrossRef]
- Kimura, I.; Onda, S.; Hosoda, T.; Shimizu, Y. Computations of suspended sediment transport in a shallow side-cavity using depth-averaged 2D models with effects of secondary currents. Journal of Hydro-environment Research 2010, 4, 153–161. [Google Scholar] [CrossRef]
- Heavers, R.M.; Dapp, R.M. The Ekman layer and why tea leaves go to the center of the cup. The Physics Teacher 2010, 48, 96–100. [Google Scholar] [CrossRef]
- Tandon, A.; Marshall, J. Einstein’s tea leaves and pressure systems in the atmosphere. The Physics Teacher 2010, 48, 292–295. [Google Scholar] [CrossRef]
- Mathijssen, A.J.; Lisicki, M.; Prakash, V.N.; Mossige, E.J. Culinary fluid mechanics and other currents in food science. Reviews of Modern Physics 2023, 95, 025004. [Google Scholar] [CrossRef]
- Raghavan, R.V.; Friend, J.R.; Yeo, L.Y. Particle concentration via acoustically driven microcentrifugation: microPIV flow visualization and numerical modelling studies. Microfluidics and Nanofluidics 2010, 8, 73–84. [Google Scholar] [CrossRef]
- Yeo, L.Y.; Friend, J.R.; Arifin, D.R. Electric tempest in a teacup: The tea leaf analogy to microfluidic blood plasma separation. Applied Physics Letters 2006, 89. [Google Scholar] [CrossRef]
- Song, S.; Zhou, J.; Riaud, A. Effect of viscosity on surface acoustic wave driven collective particle dynamics in sessile droplets: Cloud, cavities, and aggregates. Physics of Fluids 2022, 34. [Google Scholar] [CrossRef]
- Long, D.F.; Perivilli, S.V.; Mauger, J.W. Einstein’s tea leaf paradox and its relevance to dissolution testing. Dissolution Technologies 2014, 21, 17–19. [Google Scholar] [CrossRef]
- Jakubowski, M.; Sterczyska, M.; Matysko, R.; Poreda, A. Simulation and experimental research on the flow inside a whirlpool separator. Journal of Food Engineering 2014, 133, 9–15. [Google Scholar] [CrossRef]
- Jakubowski, M.; Stachnik, M.; Sterczyńska, M.; Matysko, R.; Piepiórka-Stepuk, J.; Dowgiałło, A.; Ageev, O.V.; Knitter, R. CFD analysis of primary and secondary flows and PIV measurements in whirlpool and whirlpool kettle with pulsatile filling: Analysis of the flow in a swirl separator. Journal of Food Engineering 2019, 258, 27–33. [Google Scholar] [CrossRef]
- Stachnik, M.; Jakubowski, M. Multiphase model of flow and separation phases in a whirlpool: Advanced simulation and phenomena visualization approach. Journal of Food Engineering 2020, 274, 109846. [Google Scholar] [CrossRef]
- Horiguchi, I.; Torizal, F.G.; Nagate, H.; Inose, H.; Inamura, K.; Hirata, O.; Hayashi, H.; Horikawa, M.; Sakai, Y. Protection of human induced pluripotent stem cells against shear stress in suspension culture by Bingham plastic fluid. Biotechnology Progress 2021, 37, e3100. [Google Scholar] [CrossRef] [PubMed]
- Zhang, Z.; Zhou, B.; Jia, M.; Wu, C.; Niu, T.; Feng, C.; Wang, H.; Liu, Y.; Lu, J.; Zhang, Z.; others. Einstein’s tea leaf paradox induced localized aggregation of nanoparticles and their conversion to gold aerogels. Science Advances 2023, 9, eadi9108. [Google Scholar] [CrossRef] [PubMed]
- Ahmed, F.; Eames, I.; Moeendarbary, E.; Azarbadegan, A. High-Strouhal-number pulsatile flow in a curved pipe. Journal of Fluid Mechanics 2021, 923, A15. [Google Scholar] [CrossRef]
- Cense, A. Dynamics of Vortices in Shallow Fluid Layers. PhD thesis, Master’s thesis, Eindhoven University of Technology, 2000. Report R-1534-A, 2000.
- Bödewadt, V.U. Die drehströmung über festem grunde. ZAMM-Journal of Applied Mathematics and Mechanics/Zeitschrift für Angewandte Mathematik und Mechanik 1940, 20, 241–253. [Google Scholar] [CrossRef]
- Rahman, M.; Andersson, H.I. Revolving flow of a fluid-particle suspension with suction. Alexandria engineering journal 2018, 57, 2567–2572. [Google Scholar] [CrossRef]
- Moisy, F.; Pasutto, T.; Gauthier, G.; Gondret, P.; Rabaud, M. Spiral patterns in swirling flows. Europhysics News 2003, 34, 104–107. [Google Scholar] [CrossRef]
- White, F.; Xue, H. Fluid Mechanics; McGraw-Hill Education,, 2021. [Google Scholar]
Figure 1.
Schematic representation of the experimental setup and processed images for the TLP experiments (a). A stepper motor rotated a cup filled with IPA fluid, while a DSLR camera recorded the process from the top. (b) The top view of particle distribution in the rotating cup is shown in the original image (top-left). This image was then converted to grayscale (top-right) and further processed into a binary format by using MATLAB to distinguish the particles from the background(bottom-left). A plot of the particle concentration area, , in the center of the cup over time (bottom-right).
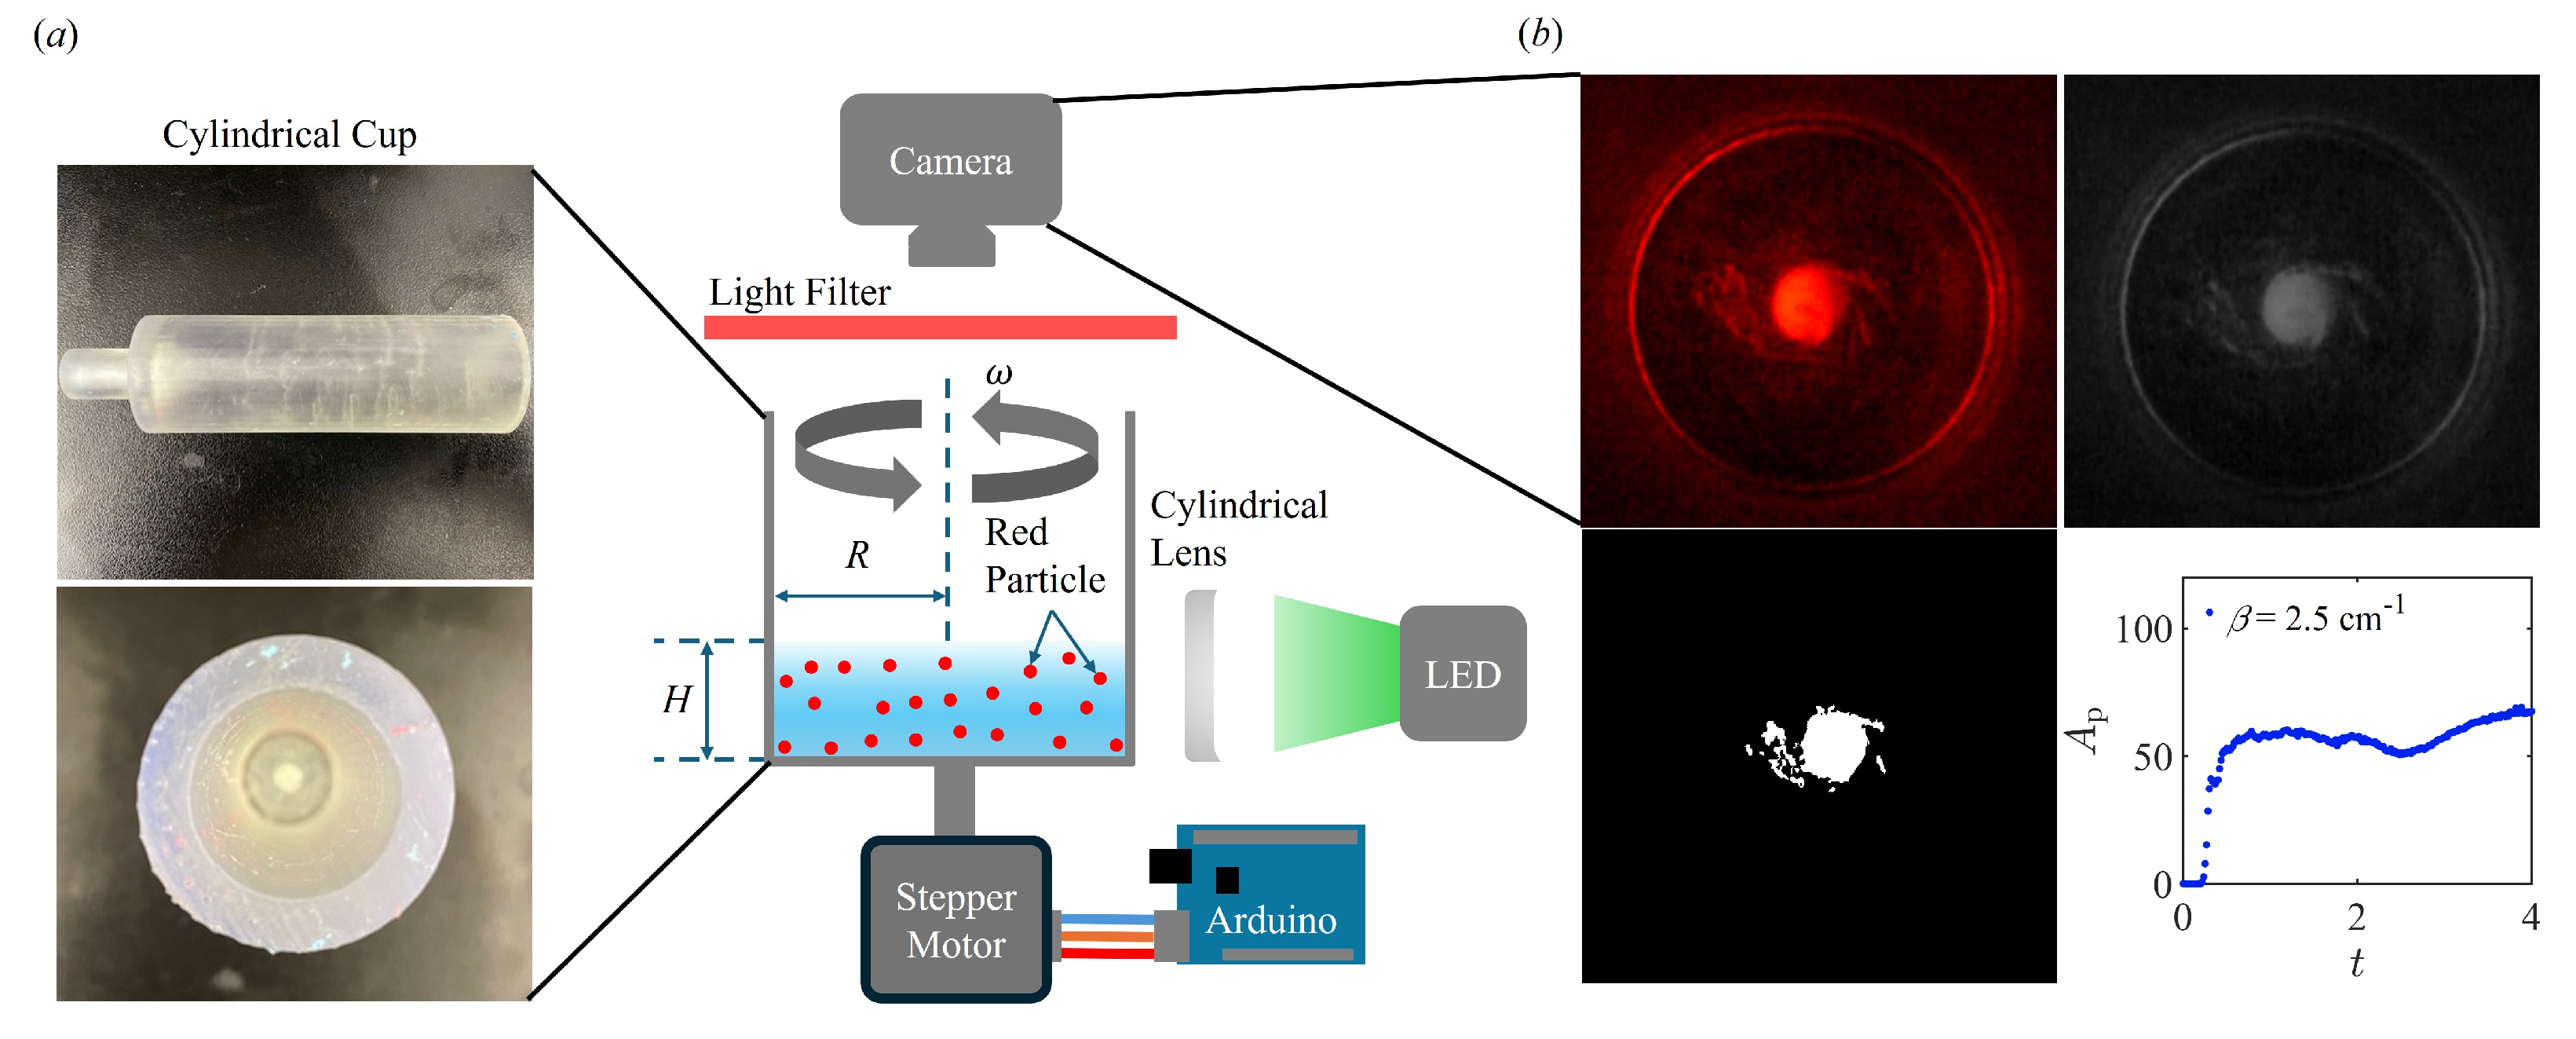
Figure 2.
The top view of the particle movement evolution over time for different vessel radii at rotation speed 22.2 rad/s (over 20 s) and . The scale bar is 0.5 cm for all pictures. (a) cm (b) cm (c) cm.
Figure 2.
The top view of the particle movement evolution over time for different vessel radii at rotation speed 22.2 rad/s (over 20 s) and . The scale bar is 0.5 cm for all pictures. (a) cm (b) cm (c) cm.
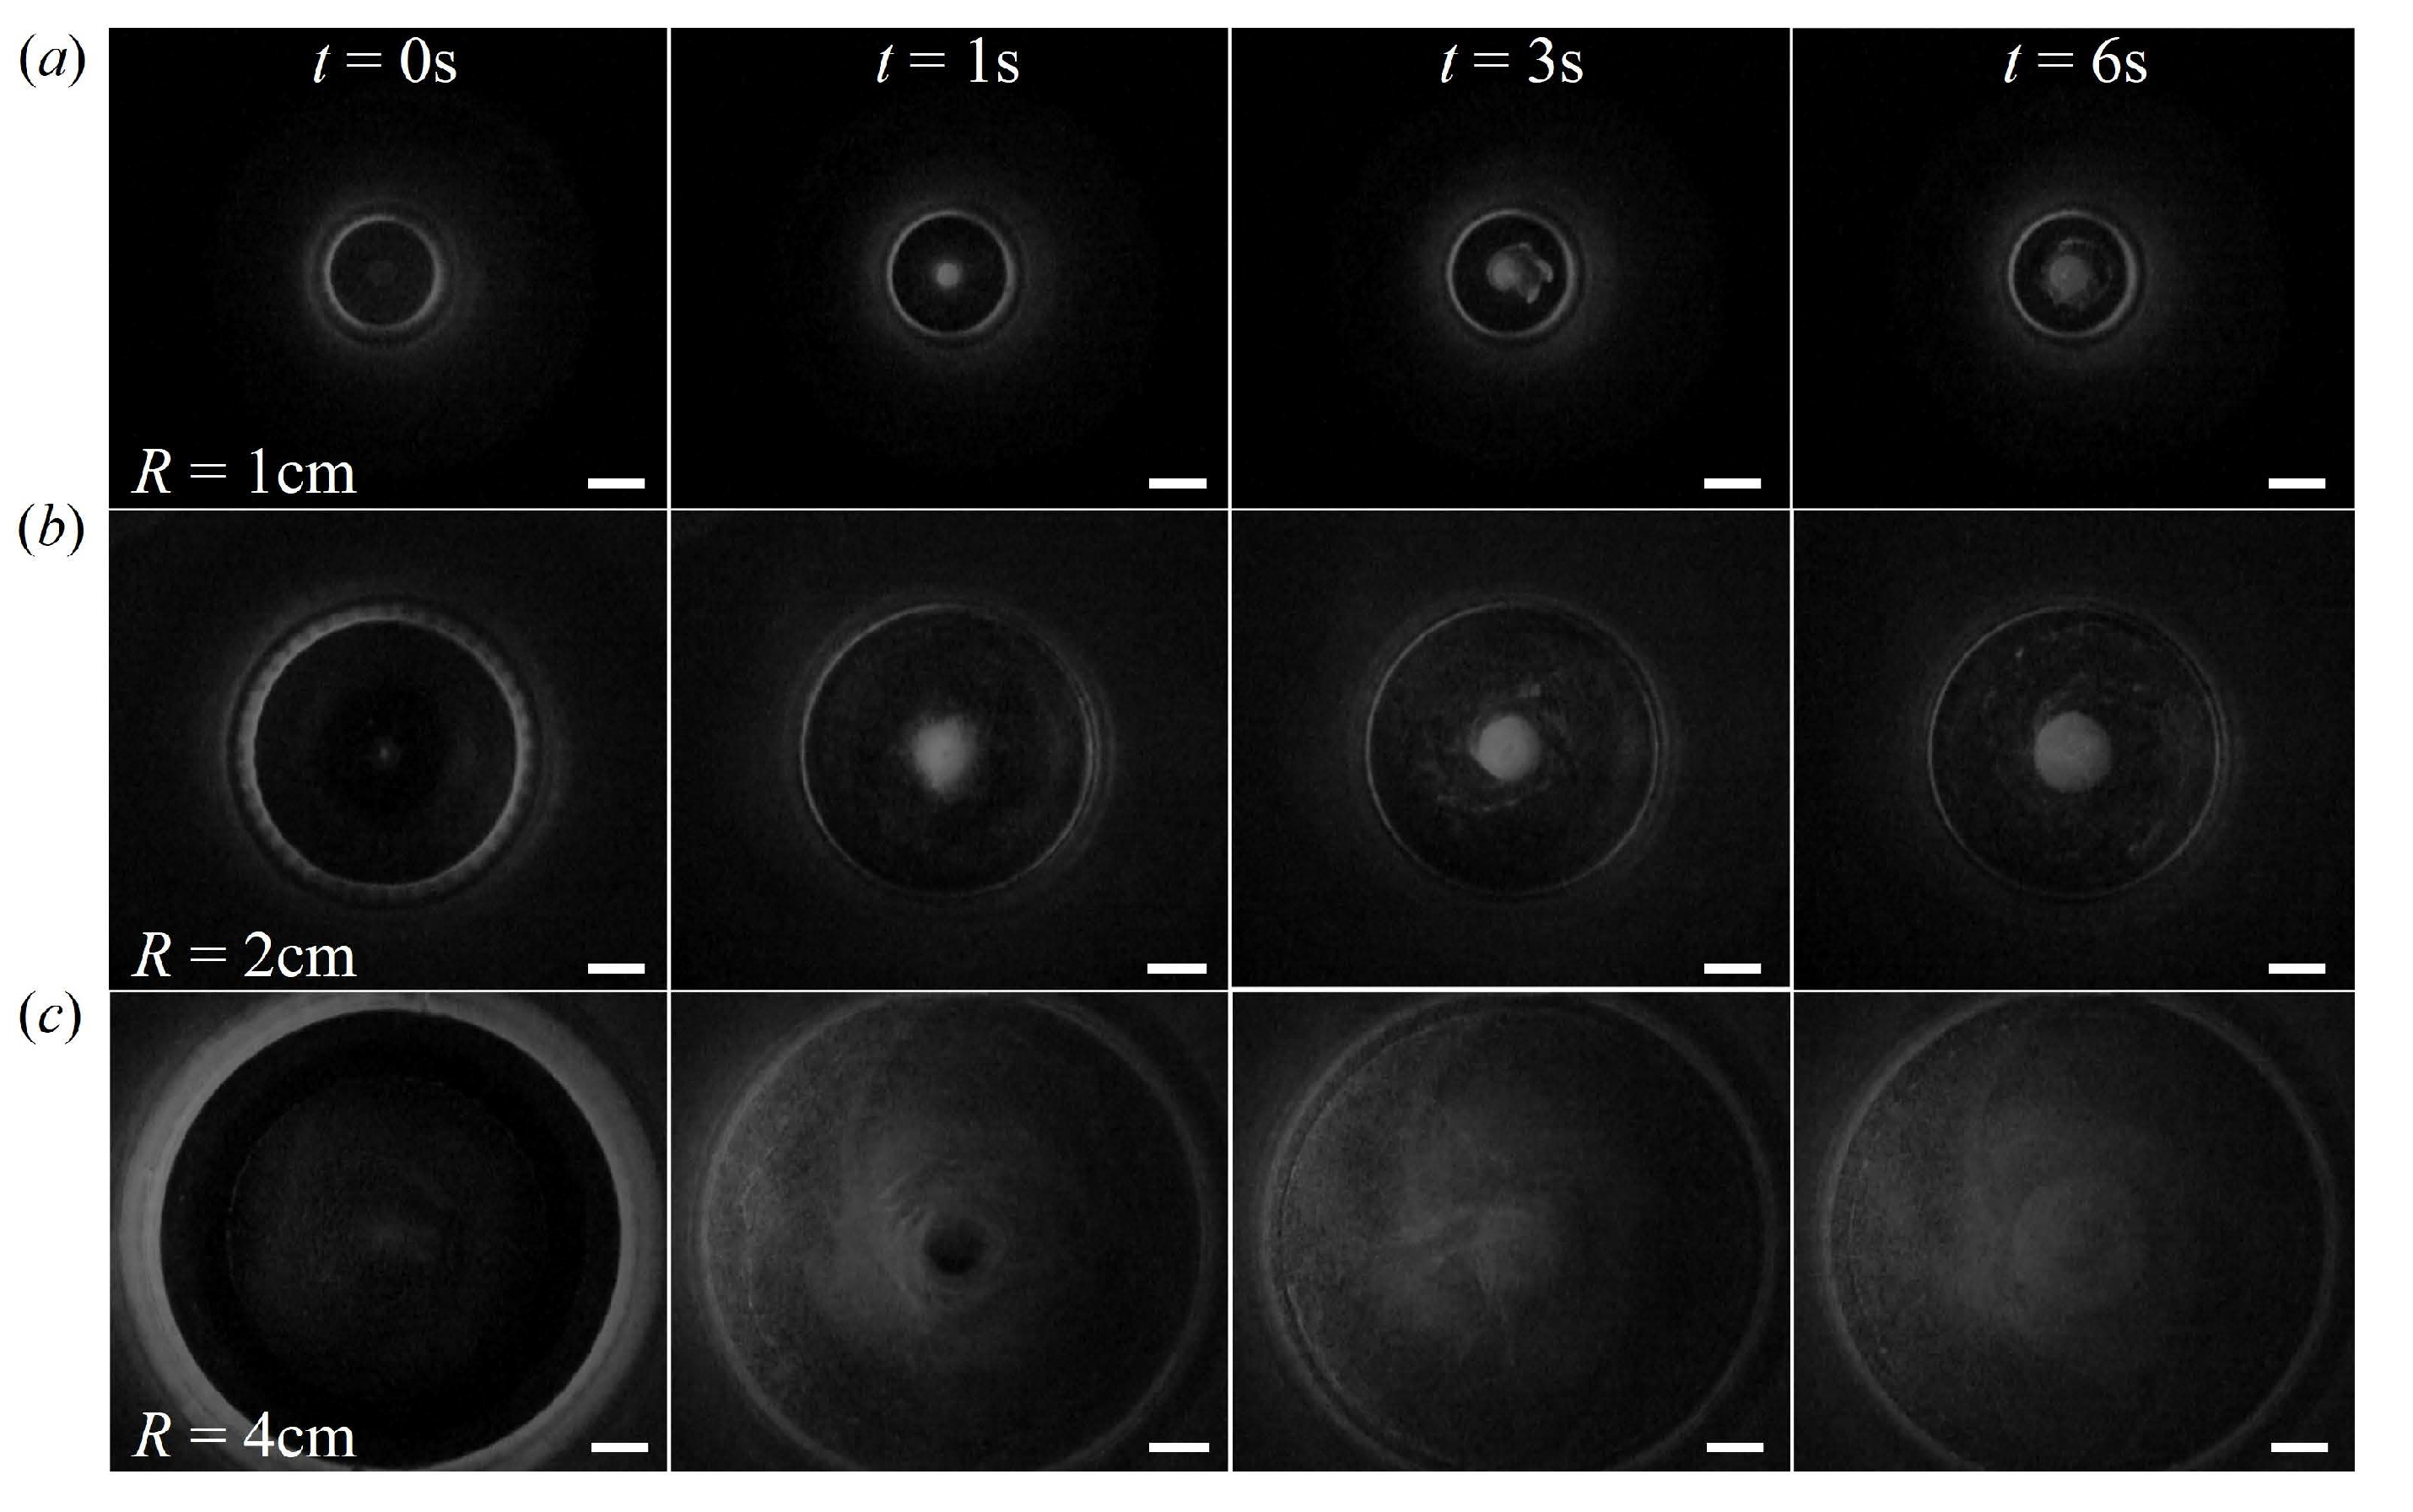
Figure 3.
Effect of R and on the TLP. (a) Effect of on particle distribution in the vessel at cm. (b) Effect of on particle distribution in the vessel at cm. (c) Effect of R on particle distribution in the vessel at . (d) Effect of R on particle distribution in the vessel at .
Figure 3.
Effect of R and on the TLP. (a) Effect of on particle distribution in the vessel at cm. (b) Effect of on particle distribution in the vessel at cm. (c) Effect of R on particle distribution in the vessel at . (d) Effect of R on particle distribution in the vessel at .
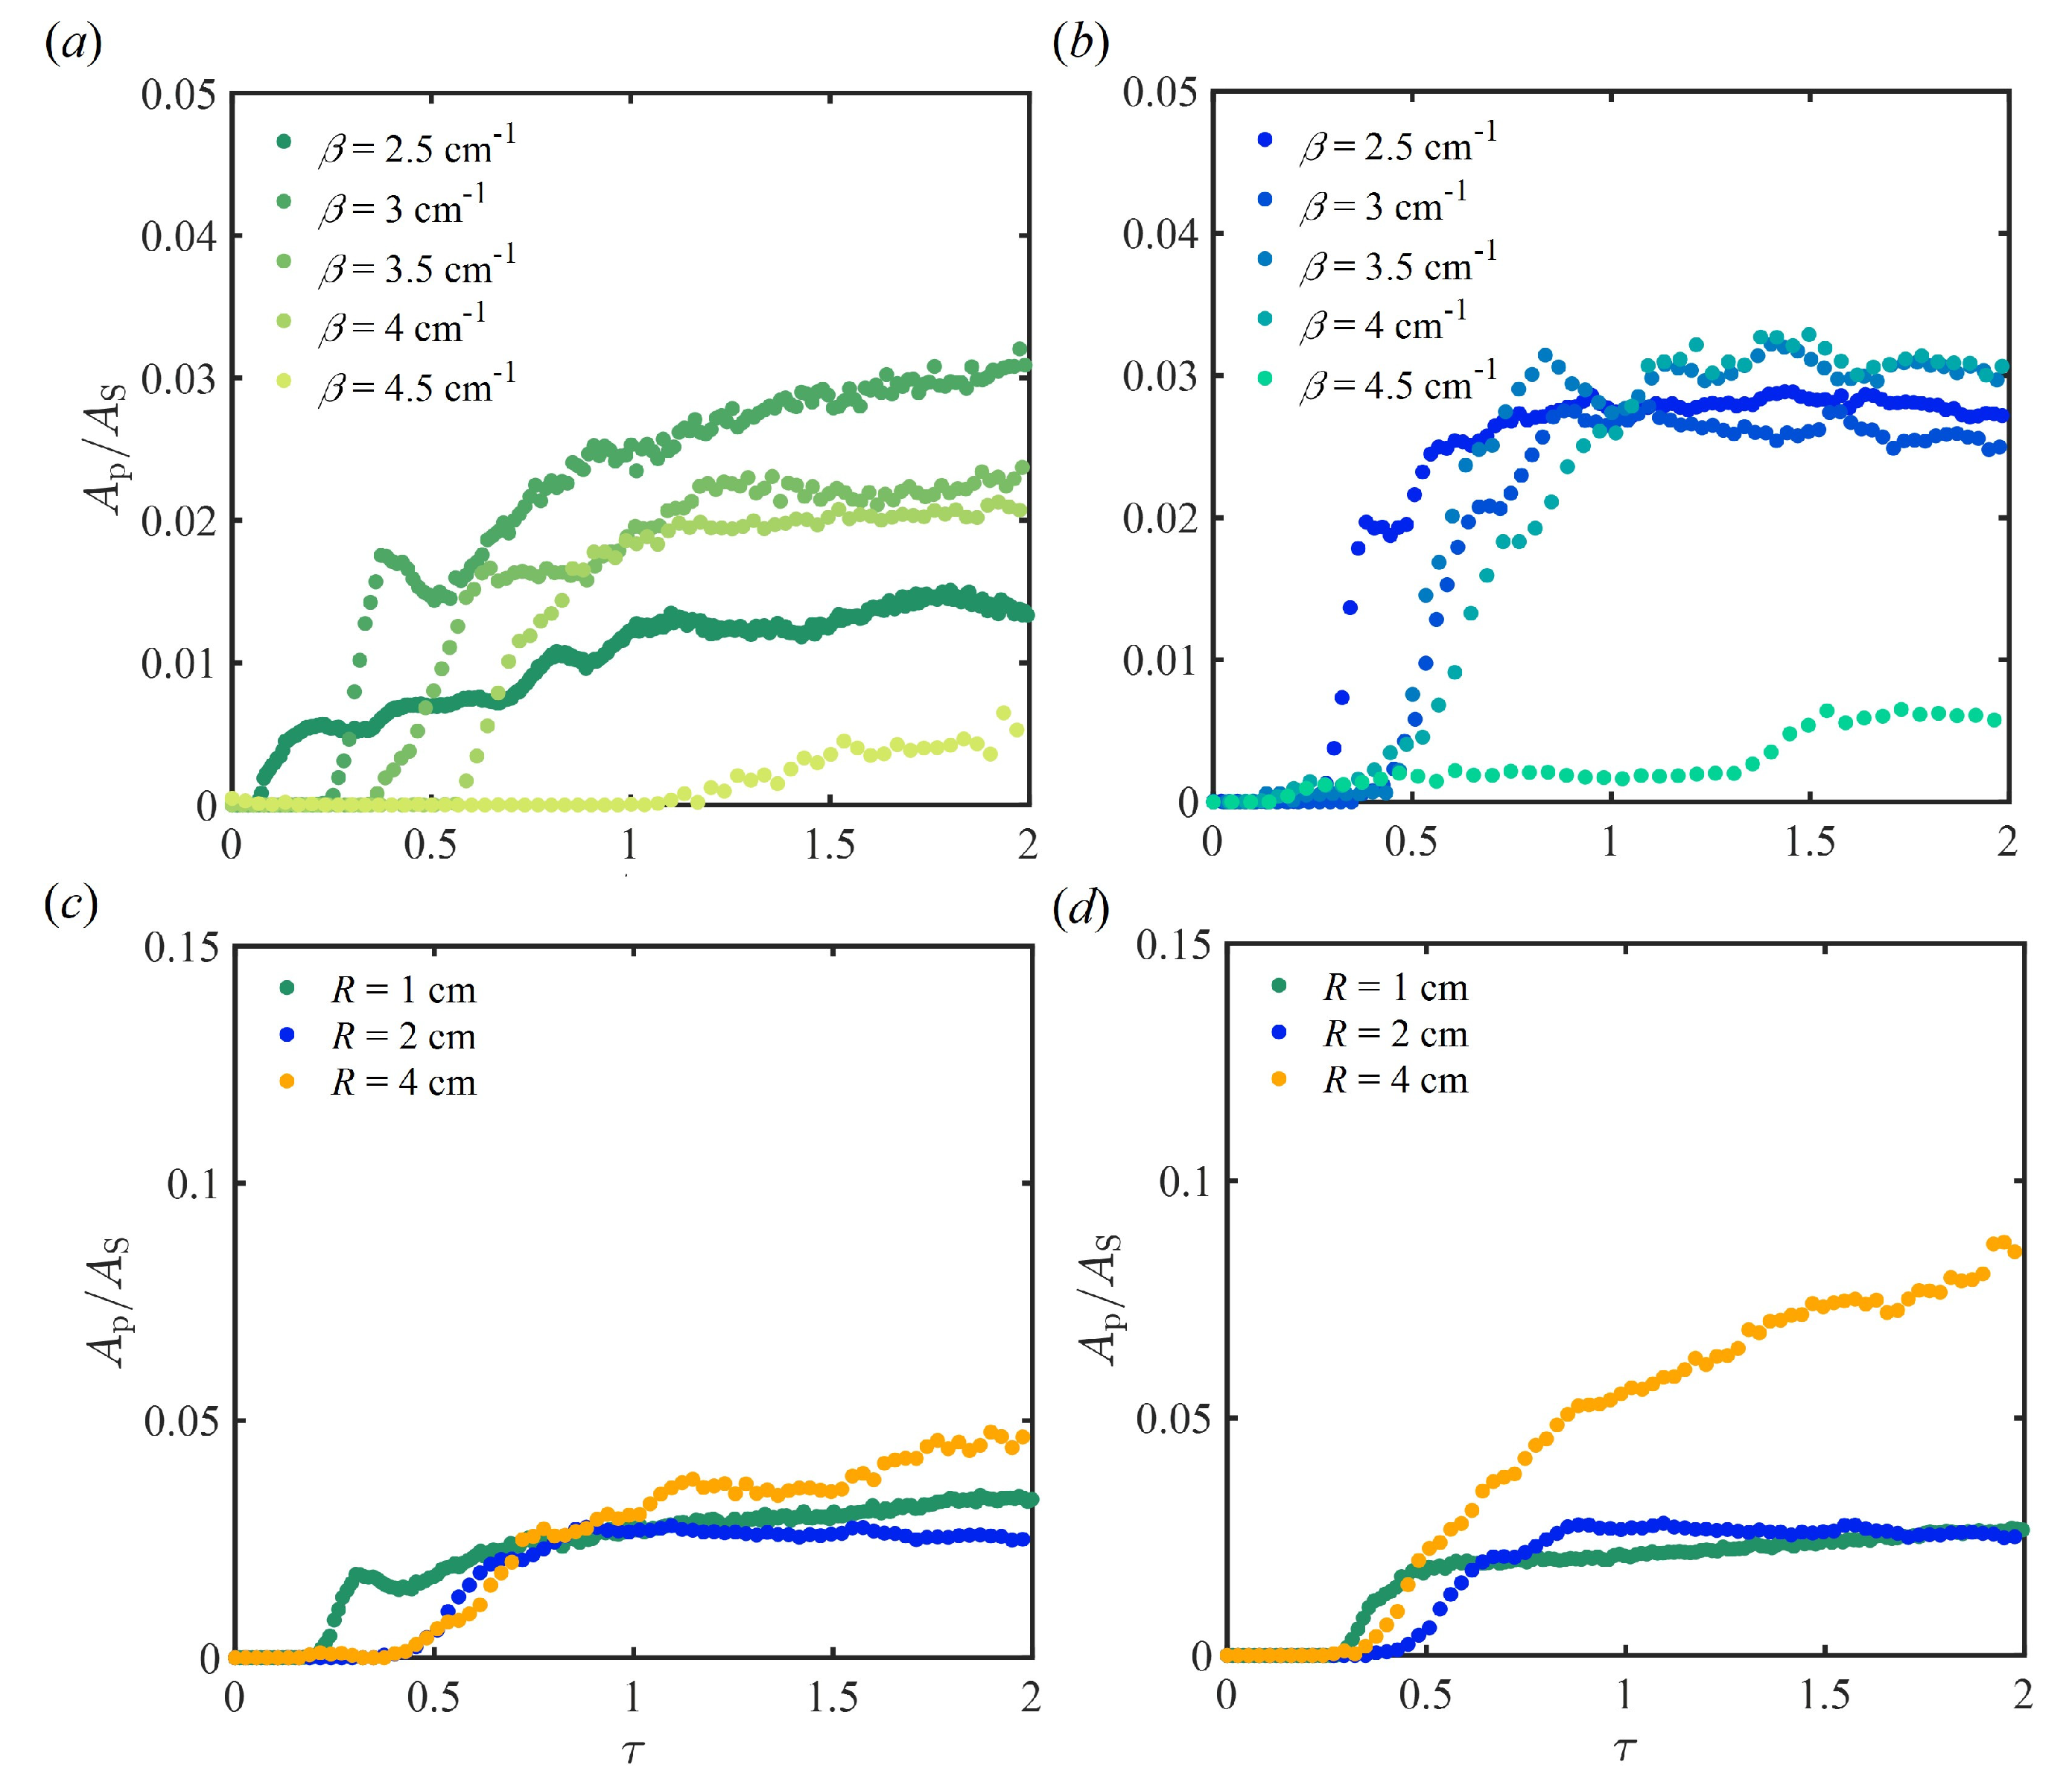
Figure 4.
Effect of on TLP at cm a) Evolution of particle movement with different (b) Effect of on the particle distribution.
Figure 4.
Effect of on TLP at cm a) Evolution of particle movement with different (b) Effect of on the particle distribution.
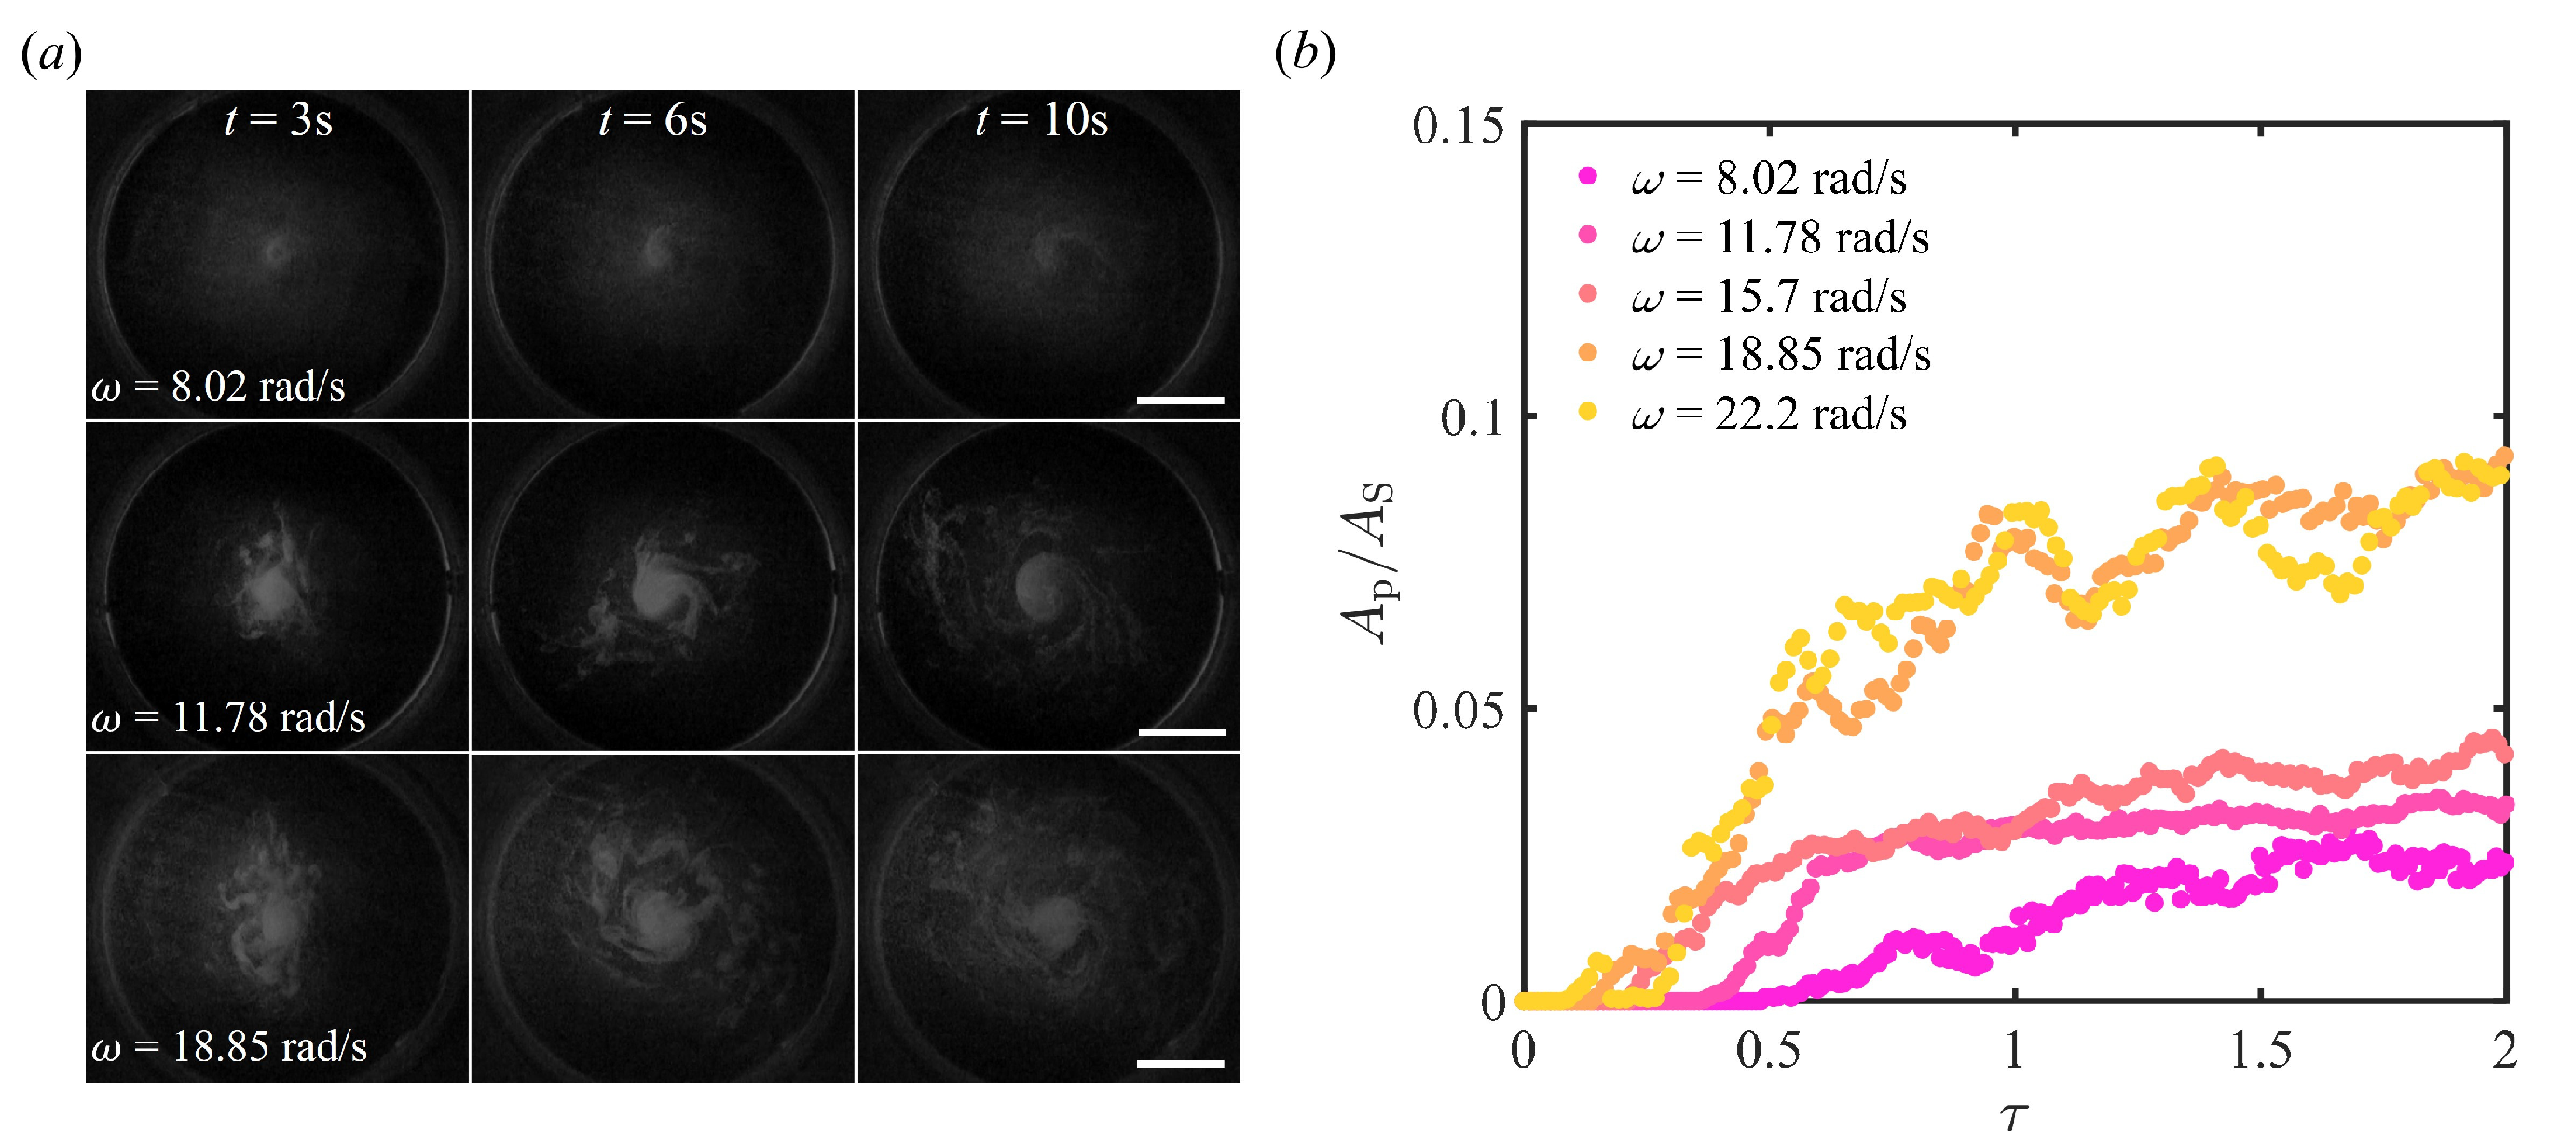
Figure 5.
Particle Tracking Velocimetry (PTV) analysis of flow in the vessel (a) Normalized particle density in the vessel over time at cm and cm−1. (b) Particle velocity magnitude and direction colormap over time.
Figure 5.
Particle Tracking Velocimetry (PTV) analysis of flow in the vessel (a) Normalized particle density in the vessel over time at cm and cm−1. (b) Particle velocity magnitude and direction colormap over time.
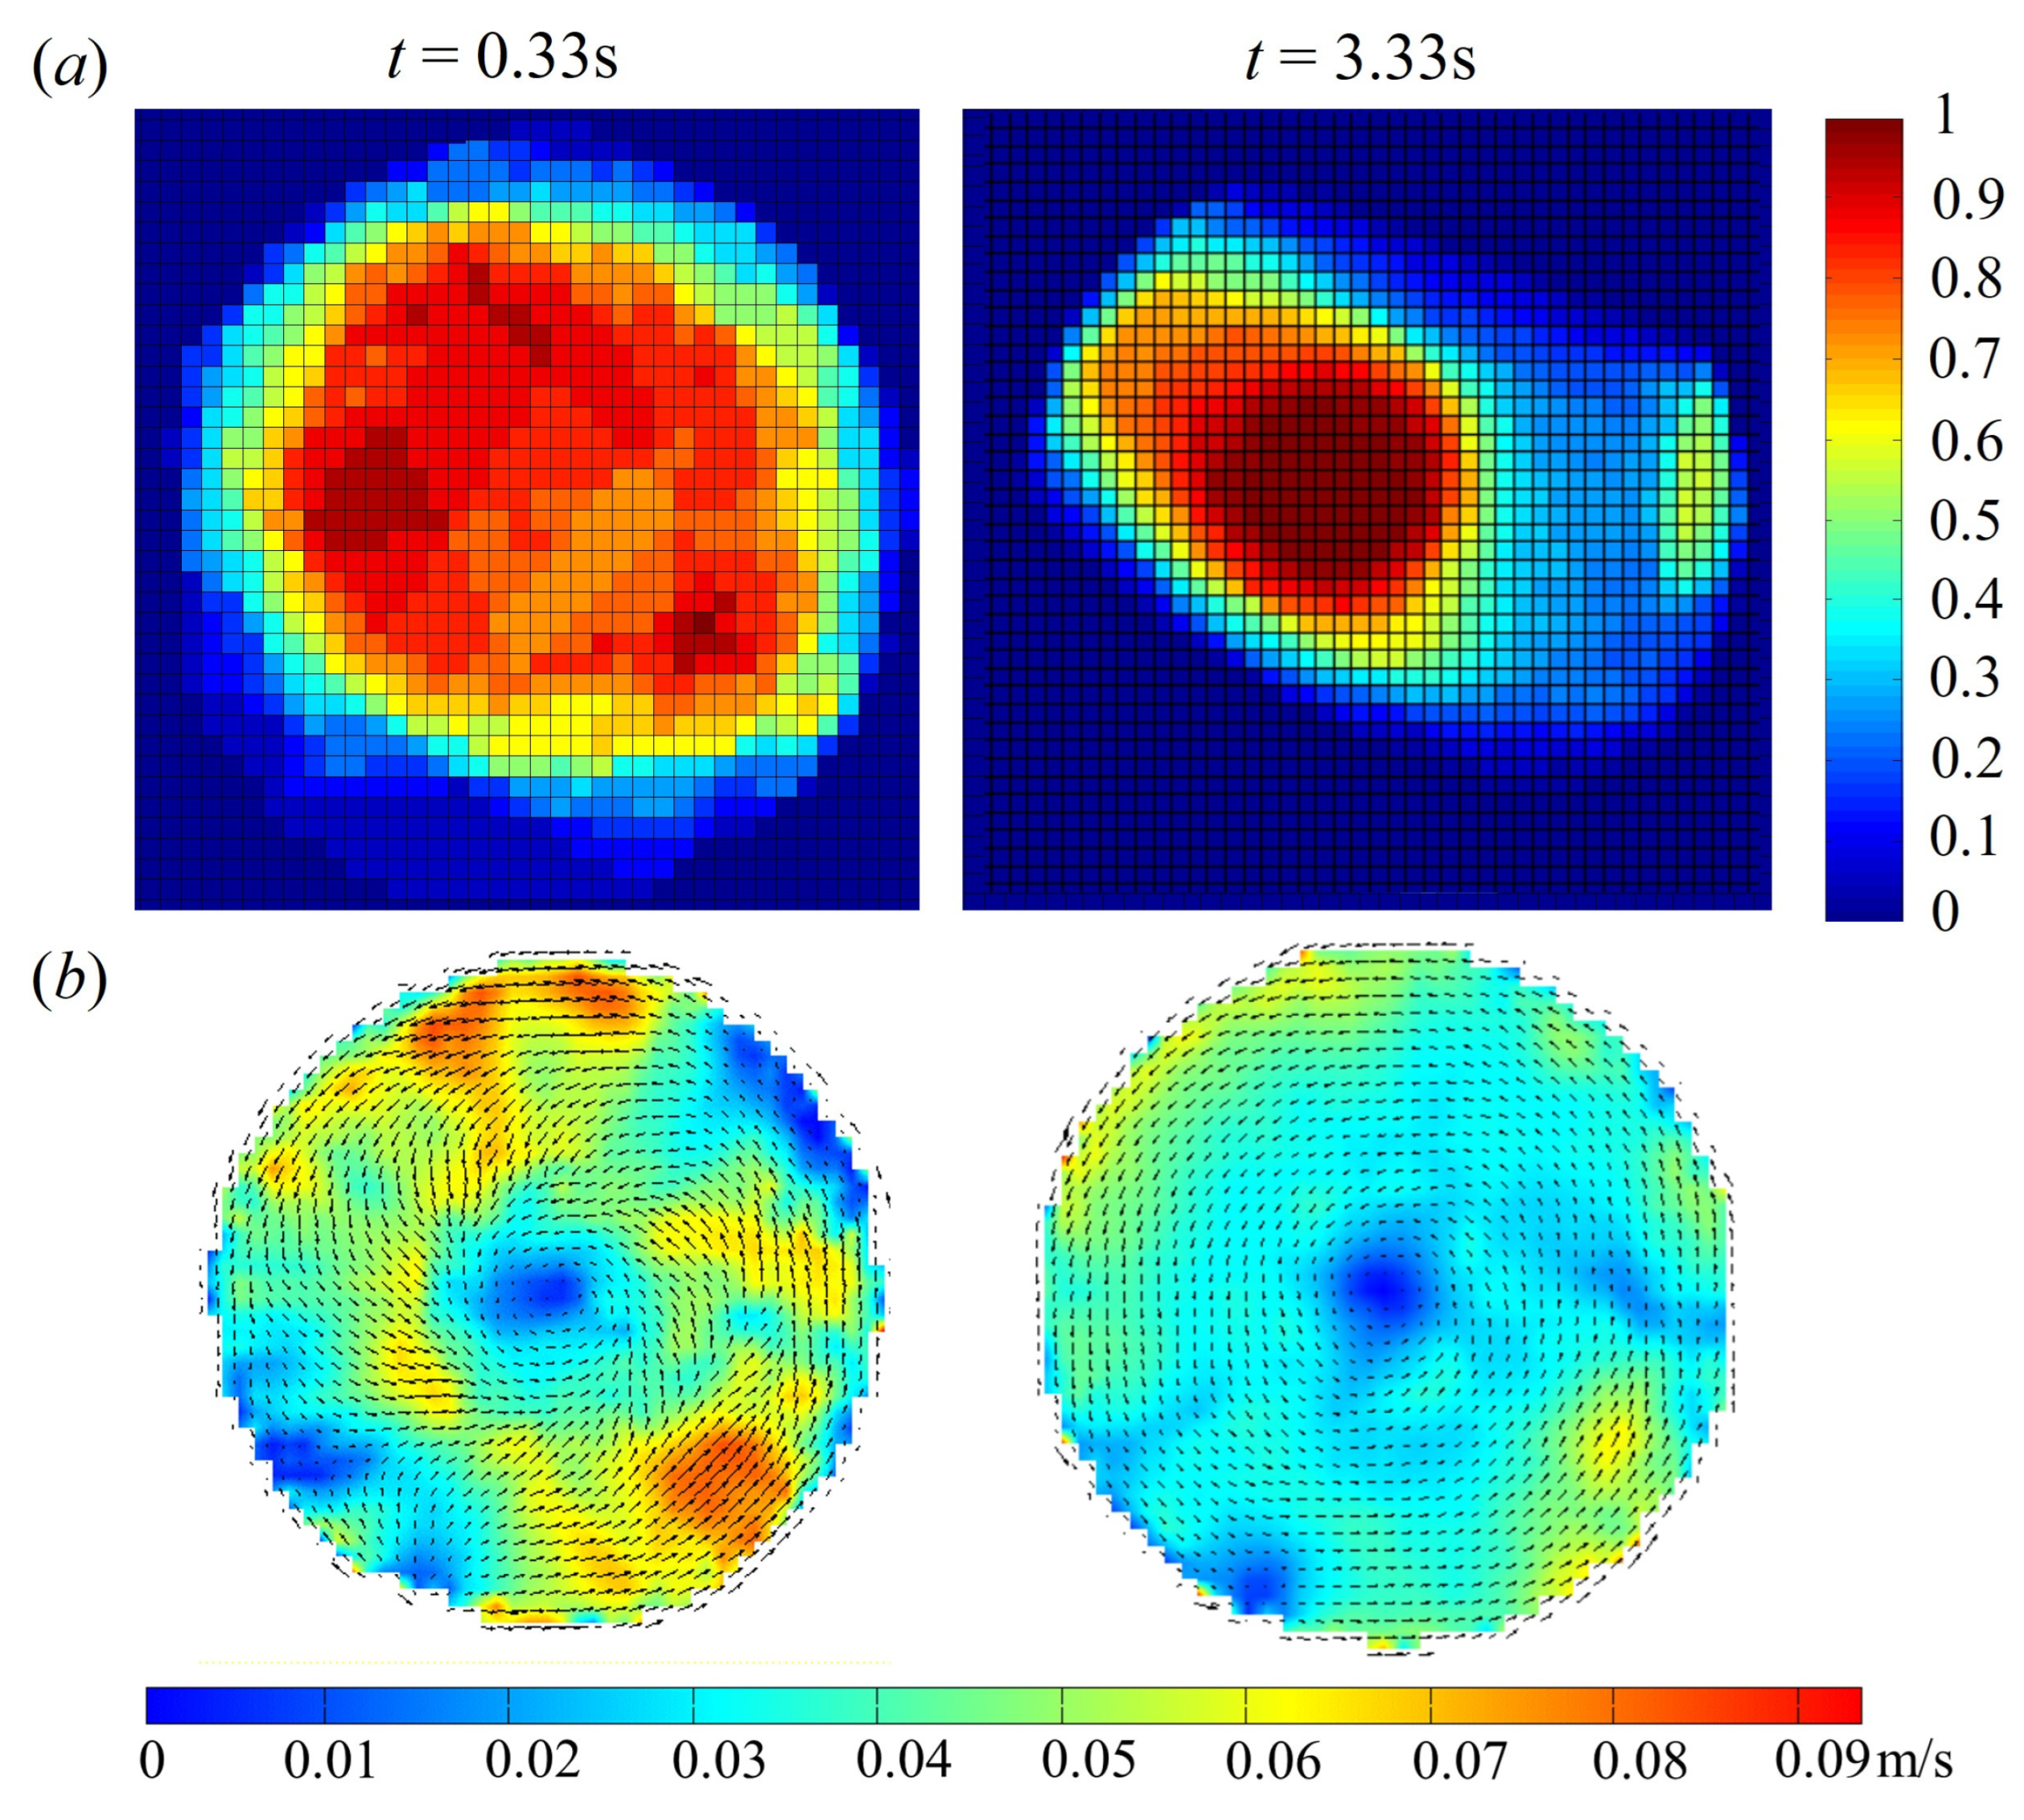
Figure 6.
Log-log plot of particle distribution in the vessel over time. Two scalings line: (solid line) with is fitting parameter, and (dash line) with is fitting parameter.
Figure 6.
Log-log plot of particle distribution in the vessel over time. Two scalings line: (solid line) with is fitting parameter, and (dash line) with is fitting parameter.
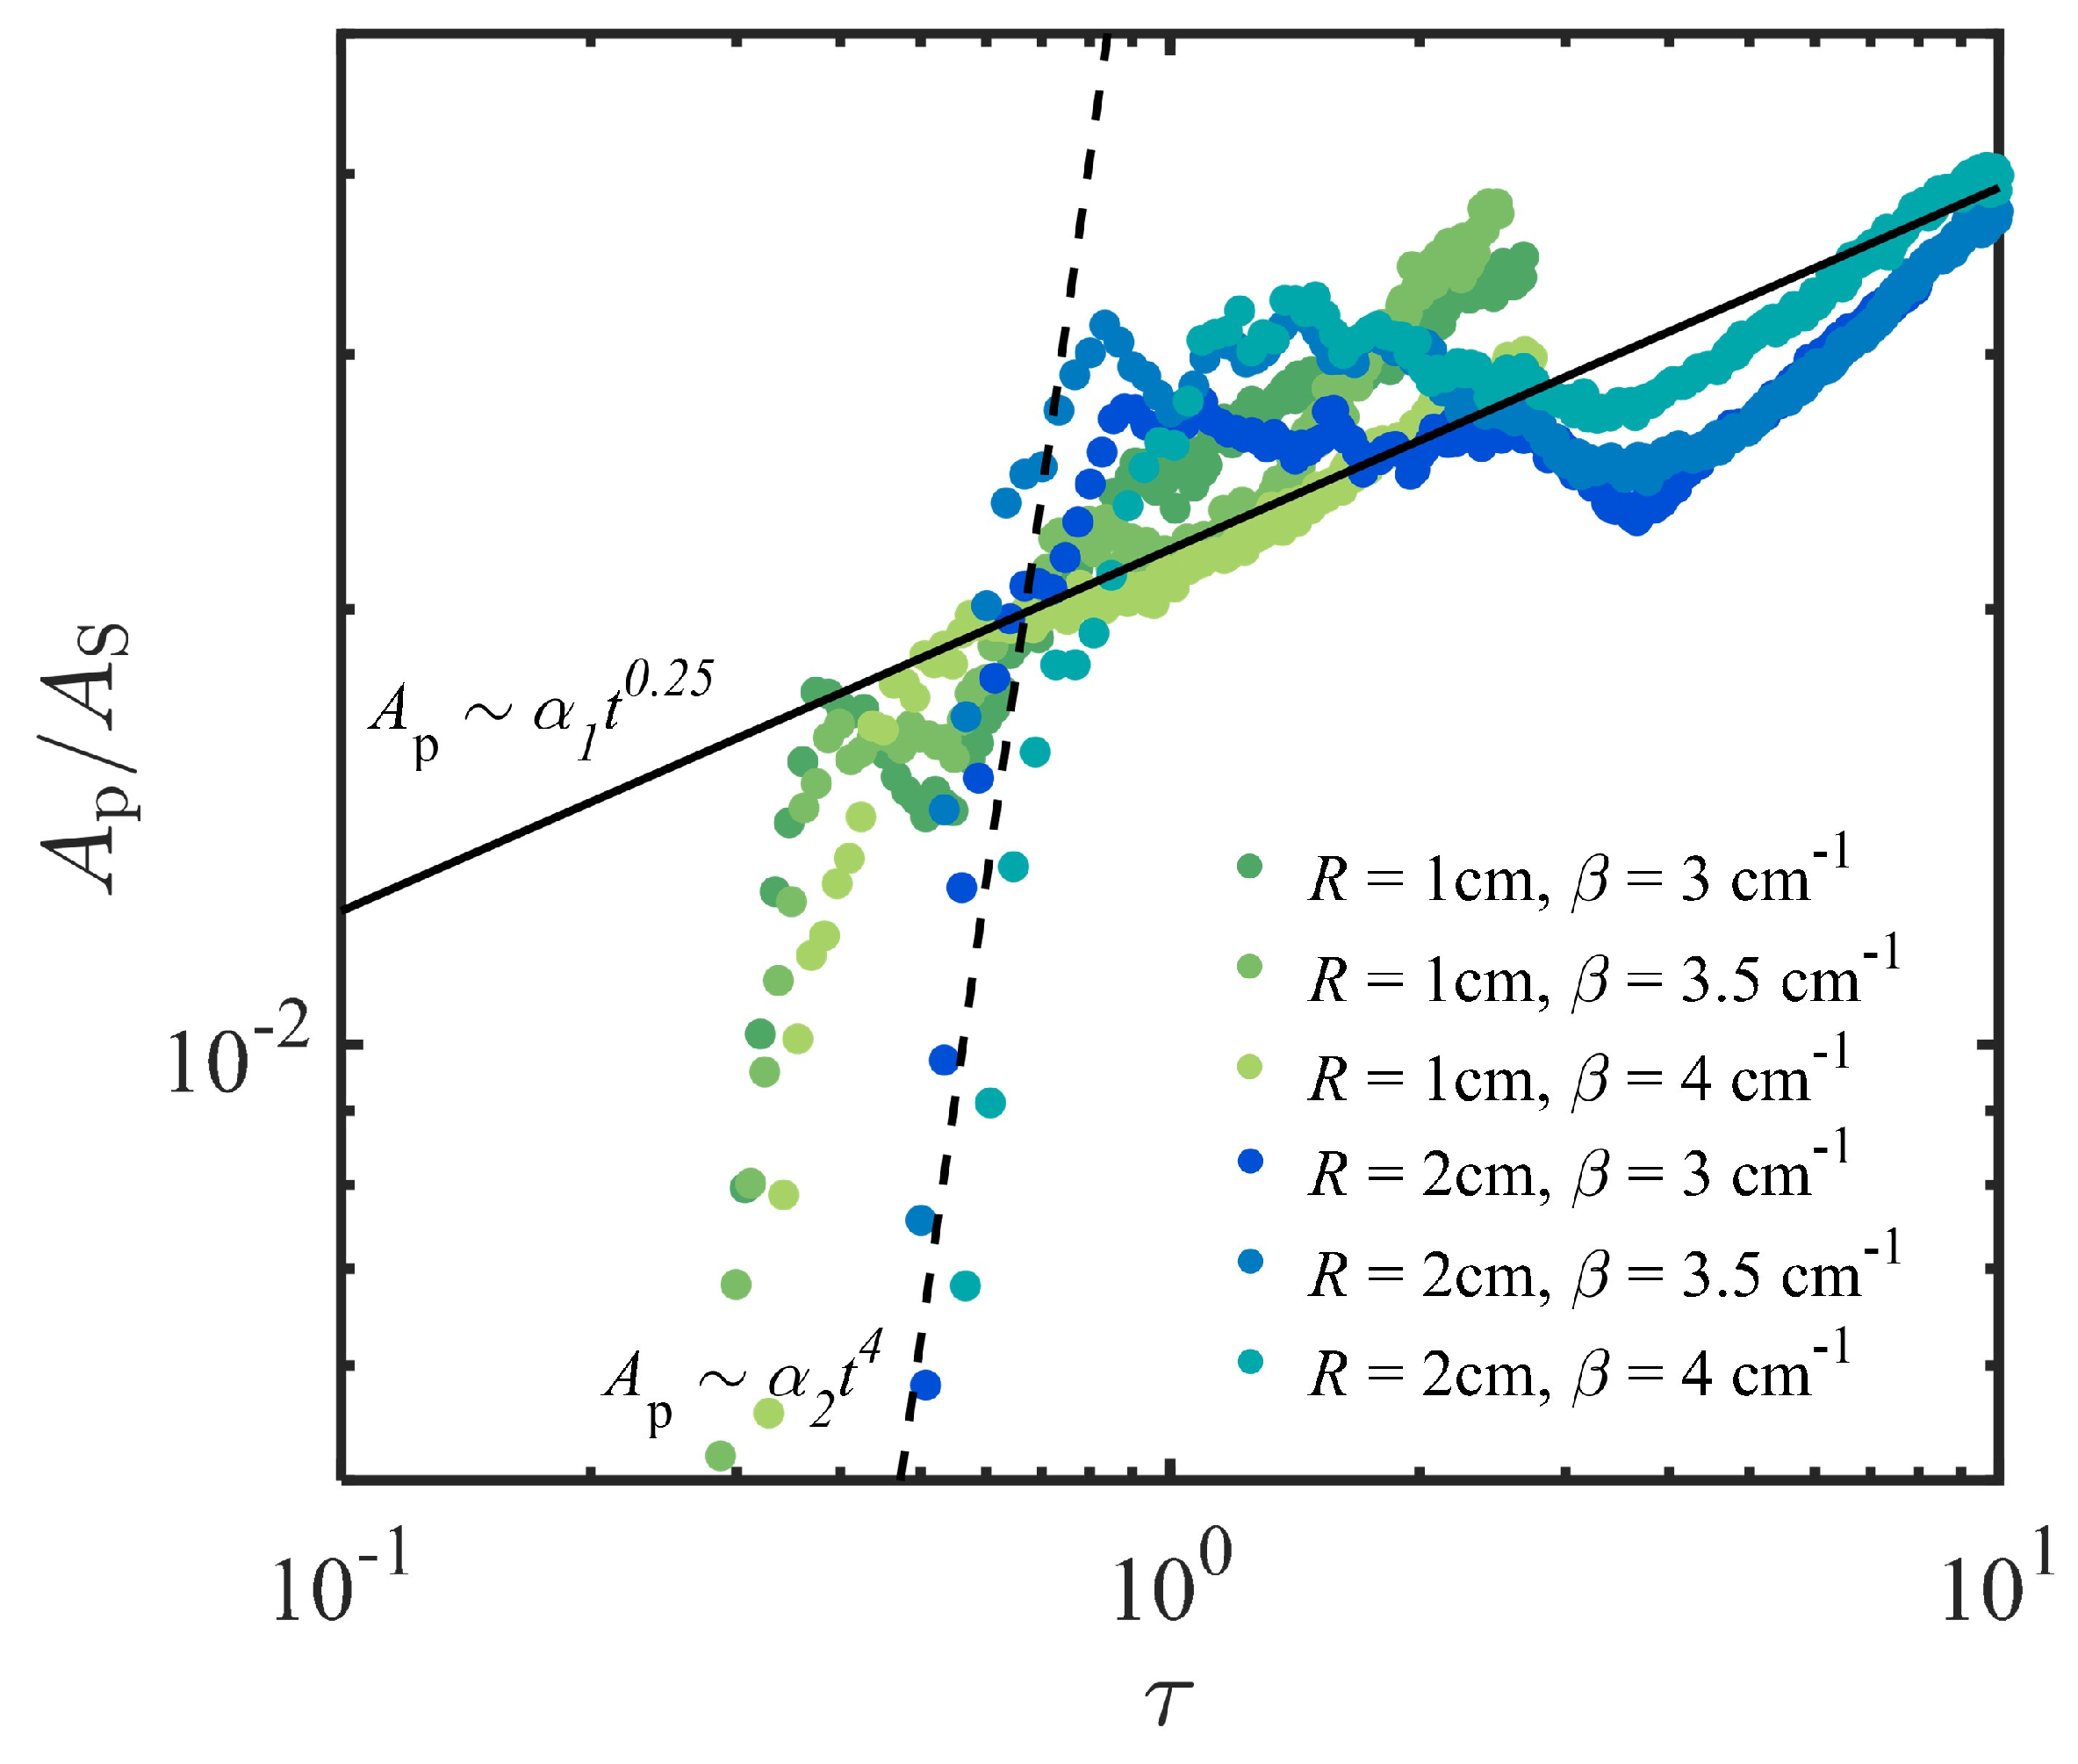

Table 1.
Volume of IPA in vessel and particle concentration,c, over various R and .
| R (cm) | (cm−1) | H (cm) | Vol (cm3) | c (%) |
|---|---|---|---|---|
| 1 | 2.5 | 2 | 6.283 | 0.75 |
| 1 | 3 | 1 | 3.142 | 1.5 |
| 1 | 3.5 | 0.66 | 2.073 | 2.3 |
| 1 | 4 | 0.5 | 1.571 | 3 |
| 1 | 4.5 | 0.4 | 1.257 | 3.75 |
| 2 | 2.5 | 0.66 | 8.294 | 1.5 |
| 2 | 3 | 0.5 | 6.283 | 1.98 |
| 2 | 3.5 | 0.4 | 5.027 | 2.48 |
| 2 | 4 | 0.33 | 4.147 | 3 |
| 2 | 4.5 | 0.2857 | 3.590 | 3.47 |
| 4 | 2.5 | 0.5 | 25.13 | 1.71 |
| 4 | 3 | 0.4 | 20.11 | 2.14 |
| 4 | 3.5 | 0.33 | 16.59 | 2.6 |
| 4 | 4 | 0.2857 | 14.36 | 3 |
| 4 | 4.5 | 0.25 | 12.57 | 3.43 |
Disclaimer/Publisher’s Note: The statements, opinions and data contained in all publications are solely those of the individual author(s) and contributor(s) and not of MDPI and/or the editor(s). MDPI and/or the editor(s) disclaim responsibility for any injury to people or property resulting from any ideas, methods, instructions or products referred to in the content. |
© 2024 by the authors. Licensee MDPI, Basel, Switzerland. This article is an open access article distributed under the terms and conditions of the Creative Commons Attribution (CC BY) license (http://creativecommons.org/licenses/by/4.0/).
Copyright: This open access article is published under a Creative Commons CC BY 4.0 license, which permit the free download, distribution, and reuse, provided that the author and preprint are cited in any reuse.


