Submitted:
21 August 2024
Posted:
22 August 2024
You are already at the latest version
Abstract
Digital transformation and green innovation are critical to firms’ competitive advantage and, thus, firms desire to make digital transformation enhance green innovation. However, the relationship between the digital transformation on green innovation is unclear. Drawing on digital empowerment, we delineate types of digital transformation and their impacts on green innovation in manufacturing firms. Our empirical results indicate that production digitalization and service digitalization have a significant promoting effect on both of green technological innovation and green management innovation. However, the effect of production digitalization on green management innovation is stronger than that of service digitalization. Moreover, environmental regulation enhances the positive effect of service digitalization on green technological innovation and green management innovation. While it enhances the effect of production digitalization on green management innovation. Peer firms’ green innovation strengthens the effect of service digitalization on both of green technological innovation and green management innovation.
Keywords:
Production digitalization
; Service digitalization
; Green innovation
; Environmental regulation
; Peer firms’ green innovation
1. Introduction
Currently, the pursuit of sustainable development strategies that achieve “harmonious coexistence” between firms and the environment has become a global concern [1]. For a long time, the main challenge for firms implementing sustainable development strategies has been how to improve environmental performance while creating new economic growth opportunities. Here green innovation has been expected to produce a double dividend: limiting the environmental burden and contributing to the growth of the economy [2]. In particular, the manufacturing industry, an important pillar in building future development strategies, has also brought serious environmental issues with its rapid growth. Accounting for 20% of global carbon emissions, the manufacturing sector has become the “third major culprit” in carbon emissions. Therefore, how to promote green innovation in the manufacturing industry is a challenging issue that the academic and practical fields urgently need to explore [3]. In fact, most manufacturing firms lack sustained momentum for green innovation: on one hand, green innovation and government environmental regulations significantly increase production and operation cost. constrained by cost pressures, manufacturing firms are reluctant to take the initiative in green innovation [4]. On the other hand, innovation capabilities in firms are relatively low, which makes it difficult to carry out effective green innovation.
The digital transformation, serving as an important lever for sustainable development, empowered by digital technology brings new opportunities and momentum for green innovation. Its characteristics of ubiquity, openness, fluidity, inclusiveness, and virtuality can effectively address the operational cost and technological challenges faced by green innovation in manufacturing firms [5]. However, research on digital transformation and green innovation is fragmented. On one hand, studies on digital transformation have explored how digitalization has disrupted the inherent mechanisms of firms, analyzing the antecedents and pathways of digital transformation [6]. On the other hand, the literature proposes several measurable characteristics that may influence firms’ green innovation. Among these are government subsidies, environmental regulation and executives’ overseas experience [7]. However, existing research on the mechanism of digital transformation and green innovation in manufacturing firms is still insufficient.
Secondly, the effectiveness of different types of digital transformation on green innovation is uncertain. Digital transformation is a process, not an end state, and characterized by the application of digital technology across different business processes, which is inherently heterogeneous. In the industrial economy era, Porter’s value chain model conceptualizes the internal and external activities of a firm as a continuous value-creation process. This model includes both primary and support activities that form the value chain. Support activities encompass business processes such as human resources, financial management, and operations that facilitate primary activities [8]. Primary activities are directly involved in the core value-creation segments of manufacturing, including production and product services processes. The challenges, costs, and goals of digitization transformation vary across different segments, thus their impact on the firm’s sustainable development advantages differs. However, existing research has not yet considered the heterogeneity of digital transformation across different processes and its implications on green innovation.
Hence, grounded in value chain theory and the practice of firms’ digital transformation, this study focuses on the primary activities integral to innovation output, and conceptualize digital transformation as comprising two key dimensions, namely, production digitalization and service digitalization. We would explore the impact of production digitalization and service digitalization on green innovation in manufacturing firms. Moreover, the institutional environment is an important contingency affecting the influence of digital transformation on green innovation. Particularly, in the emerging market of China, the government has always played a significant role in firms’ strategies [4]. Environmental regulatory pressure from policies affects the willingness of manufacturing firms to engage in green innovation, subsequently influence how digital transformation affects green innovation. Then, as market entities, firms are also inevitably influenced by market competition. Firms with similar status and characteristics face analogous market conditions and prospects. To maintain a competitive advantage, the focal firm tends to exhibit herd behavior [9]. Consequently, the green innovation of peer firms will affect the mechanism by which digital transformation influences the focal firm’s green innovation. Based on this, the study will further explore how environmental regulations, reflecting government logic, and the green innovation of peer firms, characterizing market logic, affect the relationship between digital transformation and green innovation.
2. Theoretical Foundation and Literature Review
2.1. Digital Empowerment
Digital empowerment harnesses digital technologies to integrate a firm’s resources, facilitating transition from traditional manufacturing and manual management to digital and intelligent operations, thereby enhancing the competitiveness and sustainable development capabilities of the firms. It emphasizes top-down authority delegation, particularly in encouraging decentralized organizational structures that maximize employee potential [10]. Empowerment enables organizations to form agile teams to tackle uncertainty. By analyzing and mining data, firms can uncover patterns and trends hidden within the data. This leads to a deeper understanding of customer needs and market trends, which in turn facilitates business processes, product design improvements, and increased customer satisfaction [11]. At the same time, the rapid processing and dynamic presentation of data can make corporate decision-making and management more efficient. Therefore, the development of digital technology provides organizations with more opportunities and space to explore the value of data, promoting innovation and development.
Specifically, digital empowerment mainly includes three dimensions: structural, employee, and collaborative empowerment [12]. Firstly, structural empowerment mainly refers to enhancing organizational efficiency, optimizing organizational structure and processes, achieving digital operation and management, strengthening the dynamic capabilities, and assisting firms in making scientific decisions by leveraging digital technology. Secondly, employee empowerment refers to enhancing the ability of the empowered to acquire, control, and manage resources, focusing on improving the individual feelings and internal spiritual support of employees under social environments. Digital technology helps employees improve their knowledge and comprehensive control capabilities by facilitating direct communication among employees and the rapid transmission of information, thereby enhancing their sense of security and stimulating their work potential. This empowerment considers psychological factors of employees and improves their sense of participation, decision-making and belonging. It also stimulates their enthusiasm, initiative and efficient cross-departmental cooperation.
Thirdly, collaborative empowerment through the innovation and application of digital technology is prompting more and more firms to break through existing boundaries, fully explore and utilize digital information, accelerate the integration of external and internal resources, and optimize resource allocation. It fosters a new model of collaborative innovation that transcends firms, spaces, and time. Such a model plays a crucial role in promoting the effective utilization of resources and in driving the innovation output of organizations.
In summary, to break through the status of being at the low end of the manufacturing value chain and environmental pollution, firms must empower traditional manufacturing through new-generation digital technologies, such as artificial intelligence, the Internet of Things, and big data. This will achieve digitalization and intelligence of the manufacturing industry, bolster the impetus for independent innovation and the capacity for technological innovation, address the “bottleneck” issues of key core technologies, and enhance green innovation capabilities. This article will elaborate on the impact mechanism of digital transformation on green innovation from the perspectives of structural, employee, and collaborative empowerment.
2.2. Digitalization and Green Innovation
green innovation primarily creates new products or improves existing product designs, processes, and management for sustainable development with economic and environmental benefits [2,13]. Specifically, it can be divided into green technological innovation and green management innovation [14]. Green technological innovation refers to the use of new environmental protection technologies to prevent and control pollution, which can be applied in both product innovation and processes innovation. This includes the design of green products, energy conservation and pollution prevention [2].
Green management innovation is the adoption of low-carbon, eco-friendly practices to boost resource efficiency and environmental protection in operations, aiming for sustainable development. This mainly includes whether the enterprise undergoes environmental management system certification, increases investment in environmental pollution, implements environmental education and training, and carries out special environmental protection actions [15].
Existing literature primarily analyzes the drivers of green innovation within the theoretical framework of “environment-internal and external-green innovation” [2,16]. On the one hand, it confirms that environmental policies [17], government subsidies [18], consumer green demands [19], stakeholders are the main external pressures for green innovation [20]. On the other hand, the analysis of internal knowledge resources and capabilities within the firms [16], such as managerial awareness of environmental issues, constitutes the main internal impetus for green innovation [15]. Within this above theoretical framework, this study highlights that green innovation stems from the impact of internal and external pressures. It struggles to fully elucidate how firms actively use strategic resources to achieve green innovation and transition towards green development [4].
Especially in the context of new-generation digital technology development and the green transformation of traditional industries, digitalization has emerged as a vital strategic resource for driving green innovation. Digital technology applications offer fresh opportunities, addressing the dilemma of innovation costs and technological breakthroughs. Existing research indicates that the Internet’s aggregation effect on massive industrial data and other resources can improve the operational efficiency, intelligent decision-making, and clean manufacturing level in manufacturing firms [21]. Digitalization optimizes process flow to make the production process greener and the resource allocation more efficient, unleash the potential for corporate green innovation, and thus form a multi-party participatory, interactive green technology innovation network organization [22].
The extant research indicates that the digital transformation has a significant impact on green innovation, which lays a research foundation for this study. However, due to data limitations in the past, research has primarily focused on the regional level, analyzing the mechanisms by which industrial digitalization affects regional green innovation. There is relatively a dearth of micro-level research on the link between digitalization and green innovation. Existing studies lack in-depth discussions on the mechanisms by which digital transformation affects green innovation. Particularly, they often view digital transformation as a single entity, neglecting its diversity and the vary impacts of different digital transformation on green innovation. This paper will explore the effects of production digitalization and service digitalization on green technological innovation and green management innovation. The research framework is shown in Figure 1.
3. Research Hypothesis
3.1. Digital Transformation and Green Innovation
3.1.1. Production Digitalization and Green Innovation
Production digitalization is the core of digital transformation in manufacturing firms. It can empower traditional firms with innovative capabilities, enabling the manufacturing process to evolve from mechanization to intelligence [23]. Based on the digital empowerment theory, this study posits that production digitalization, via structural, employee, and collaborative empowerment, can bolster the innovation resources and capabilities, thus enhance green innovation of manufacturing firms. Specifically, in terms of the structural empowerment, production digitalization enhances the data mining and analysis of manufacturing workshops and production equipment, facilitating agile production. By relying on digital technology, it enables the rapid and cost-effective design of production plans and R&D pathways, thereby saving labor and financial costs, and reducing energy consumption and emissions. As for employee empowerment, production digitalization can improve open innovation. Production personnel are no longer just mechanically carrying out production tasks; instead, they can discern innovative opportunities that improve efficiency, resource conservation, and environmental protection. Furthermore, the prompt dissemination and sharing of production data among staff harness their proactivity and innovative capacity. As for collaborative empowerment, production digitalization helps mitigate information asymmetry in manufacturing processes among suppliers and other partners [24]. It constructs open R&D platforms, reducing knowledge-sharing costs among collaborators [25]. This could improve R&D efficiency and empower the innovation process of green products and technologies. Accordingly, we hypothesize that:
Hypothesis 1a:
Production digitalization enhances green technological innovation.
Hypothesis 1b:
Production digitalization enhances green management innovation.
3.1.2. Service Digitalization and Green Innovation
Service digitalization, referring to primarily focus on the digitalization of marketing and service processes, enable the provision of more personalized and customized products and services. This study posits that service digitalization can elevate the innovation resources and capabilities within the marketing and service processes of the manufacturing value chain, which is conducive to harnessing the potential for green innovation in manufacturing firms. In terms of employee empowerment, service digitalization enables manufacturing firms to collect a large amount of user data and offer continuous feedback for product and service development. Marketing personnel can also receive user data in a timely manner, which enhances the learning ability of marketing personnel to capture and realize innovative inspiration, thereby promoting green innovation.
As for structural empowerment, on one hand, service digitalization expands and optimizes the marketing channels of manufacturing firms to improve marketing efficiency and reduce costs. On the other hand, service digitalization provides a foundation for manufacturing firms to convey value to users, which allows a large number of users to directly participate in the product innovation, convey green demands, and enable products to develop towards users’ demands. Furthermore, digital technology equips manufacturing firms to address more sophisticated user needs, supplying essential user data that underpins green innovation. As for collaboration empowerment, service digitalization enables manufacturing firms to assess and select partners such as suppliers and distributors through data analysis. It also allows for the prompt acquisition of supply and demand information with partners. This process mitigates the risks inherent in cooperation and innovation, alleviates information asymmetry, and bolsters the efficiency of corporate green innovation. Based on the above, this study proposes the hypothesis:
Hypothesis 2a:
Service digitalization enhances green technological innovation.
Hypothesis 2b:
Service digitalization enhances green management innovation.
3.2. The Contingent Value of Institutional Logic
The direct effect of digital transformation on green innovation is influenced by the institutional environment—environmental regulations at the regional level and market pressures at the industry level. The external institutional factors resulting from environmental regulations and market pressures will affect the green innovation strategy of manufacturing firms. Consequently, these influence the mechanism by which digital transformation affects green innovation in manufacturing firms.
3.2.1. The Moderating Role of Environmental Regulation
Attaining sustainable growth in both economic and environmental terms, and enhancing environmental conservation, are pivotal demands and formidable challenges in overcoming the country’s developmental constraints [26]. Environmental regulation is an effective way to address the concern. It refers to governmental legislation, mandates, and standards that govern corporate conduct, specifically aiming to curb environmental pollution. Currently, China’s environmental policies predominantly adopt a command-and-control approach, which reflecting the government’s emphasis on environmental protection and the regulatory strength on corporate energy saving and emission reduction [27].
Existing studies have pointed out that environmental regulations are an important external institutional pressure affecting the efficiency of corporate green innovation [28]. Firms are motivated to respond to governmental environmental protection policies and achieve mandated energy-saving and emission reduction targets to avoid warnings, supervision, or penalties [29]. It is evident that government environmental regulation, as an important external institutional condition, has significant contingent value for the relationship between digital transformation and green innovation. This study proposes that environmental regulations will enhance the positive impact of digital transformation on green innovation.
Firstly, environmental regulation leads to an increase in the pressure for greening in manufacturing firms, which strengthens the motivation for these firms to rely on digital transformation to empower their ability to perceive green demands and enhance green innovation capabilities. The increase in the number of environmental regulation policies means that manufacturing firms receive more administrative orders regarding environmental protection, which leads to an increased pressure of environmental regulation for firms. Due to the deterrent effect of environmental policies, manufacturing firms tend to allocate resources to improve environmental performance and achieve the goals of energy saving and emission reduction [30], then avoid potential political risks and penalties for non-compliance [31].Under environmental regulatory pressures, manufacturing firms often weigh the costs of non-compliance prior to executing production plans. Driven by a rational mindset to preserve economic benefits, they are inclined to adopt green production behaviors. This inclination enhances their willingness to engage in green innovation. As a result, they increasingly leverage digital transformation to bolster their green innovation. Secondly, environmental regulation will guide digital transformation in manufacturing firms, thereby promoting the firms to actively undertake social responsibility [32], fulfilling the mission of environmental protection. Digital transformation is beneficial for stakeholders to reduce information asymmetry, which helps to enhance the green innovation across organizations. Thus, we hypothesize that:
Hypothesis 3a:
Environmental regulation strengthens the positive effect of production digitalization on green technological innovation.
Hypothesis 3b:
Environmental regulation strengthens the positive effect of service digitalization on green technological innovation.
Hypothesis 3c:
Environmental regulation strengthens the positive effect of production digitalization on green management innovation.
Hypothesis 3d:
Environmental regulation strengthens the positive effect of service digitalization on green management innovation.
3.2.2. The Moderating Role of Peer Firms’ Green Innovation
Within the same industry, firms confront identical macro policies and analogous market conditions. Consequently, to mitigate the risks and expenses associated with strategic decision-making, the focal firm often actively emulates the strategies of its peers, a phenomenon denoted as the peer effect [9,33]. The peer effect is common within the industry. According to dynamic competition theory, many scholars believe that in a competitive environment, efficiency has become the key to obtain core competitiveness for firms. Firms will respond to the strategic actions of competitors in the same industry to prevent the loss of competitive advantage [34].
Existing studies indicate that firms will follow the green innovation behaviors of their peers within the same industry [35], as well as their R&D investment [36], and digital transformation [37]. Firms adjust their strategic decisions by interpreting their peers’ actions. The peer effect demonstrates that firms do not make decisions in isolation; their strategic effectiveness is influenced by the actions of other firms in the industry. Therefore, this study introduces green innovation of peer firms as a moderating variable into the research framework, positing that competitive pressure and resource spillover caused by green innovation of peer firms will affect the willingness and ability of manufacturing firms to leverage digital transformation to empower green innovation.
Firstly, when green innovation of peer firms is high, it increases the pressure on the focal manufacturing firm to innovate greenly. Specifically, green innovation of peer firms will promote the firm to utilize production digitalization and service digitalization to perceive green demands and its capacity for green innovation. This is because in a situation where the level of green innovation among peer firms is high, firms that have not advanced green innovation relatively decline in their competitive strength within the industry [34,37]. Based on this, when the level of green innovation among peer firms is high, the institutional pressure from the external market leads the focal manufacturing enterprise to fully recognize the significance of green innovation for sustainable development. This recognition arises from interpreting the green innovation information of other firms in the same industry. To avoid falling behind in competition due to lagging in green innovation, manufacturing firms increasingly prioritize the affirmative contributions of digital transformation to green innovation [35,38].
Secondly, a high level of green innovation among peer firms lead to a spillover of related knowledge and demand. The focal manufacturing firm can acquire and utilize more green innovation resources through digital technology, thereby strengthening the empowering effect of digital transformation on green innovation. In specific terms, firms within the same industry that share a similar survival environment have homogeneous demands for resources such as capital, green technology, and green talent [35]. When the level of green innovation among peers in the industry is high, the focal manufacturing enterprise can imitate the green innovation activities of peer firms to enhance its own green development. Concurrently, digital technology reliance augments the knowledge-sharing effect of green innovation capabilities among firms. It facilitates the construction of digital ecological platforms that empower firms to meet their social responsibilities, and foster the circulation, sharing, and integration of green innovation knowledge among stakeholders. This, in turn, promotes the accumulation of knowledge related to green innovation. Hence, this study proposes the following hypotheses:
Hypothesis 4a:
Peer firms’ green innovation enhances the promoting effect of production digitalization on green technological innovation.
Hypothesis 4b:
Peer firms’ green innovation enhances the promoting effect of service digitalization on green technological innovation.
Hypothesis 4c:
Peer firms’ green innovation enhances the promoting effect of production digitalization on green management innovation.
Hypothesis 4d:
Peer firms’ green innovation enhances the promoting effect of service digitalization on green management innovation.
4. Research Design
4.1. Data Sources and Sample Selection
In this study, we selected the data of the top 500 state-owned manufacturing firms listed on China from 2009 to 2019 as the initial sample. The main reasons for choosing the above research samples are: (1) As important participants in the emerging market, Chinese firms are not only following the internal requirements of green economic development by implementing sustainable development strategies, but also taking on the responsibility of actively responding to environmental challenges. China has become the world’s largest manufacturing country. However, the rapid development of the manufacturing industry has also brought about serious environmental issues, with accounting for about 30% of the total domestic carbon emissions. The Chinese government encourages the vigorous development of green technology and puts forward higher requirements for the green innovation of manufacturing firms. (2) According to the overall situation of China’s manufacturing industry, state-owned firms occupy a dominant position in both basic livelihood industries and key industries for national security, and they are the main force in promoting the digital economy and achieving the digitalization and greening of our country.(3)Additionally, to avoid the impact of the COVID-19 pandemic, this study ultimately selects the period from 2009 to 2019 as the sample interval. Based on the initial sample, this study excludes firms with severely missing data, as well as ST and *ST firms. To eliminate the impact of outliers, a 1% and 99% level trimming is performed on all continuous variables. After the above screening, this study ultimately obtained an unbalanced panel sample of 423 listed manufacturing firms, with a total of 5091 observations. All data were sourced from the China Stock Market & Accounting Research (CSMAR).
4.2. Variable Definition and Measurement
4.2.1. Dependent Variable
Green innovation refers to the development of new or the improvement of existing product designs and organizational management innovation activities that firms undertake to achieve the dual goals of economic and environmental benefits for sustainable development [2]. Drawing on existing research by Xi and Zhao [15], this study specifically divides green innovation into green technological innovation and green management innovation.
Green technological innovation. Patent application is considered a key indicator measuring the level of technological innovation of firms [39]. Specifically, invention patents have a higher level of innovation compared to utility models and design patents. Invention patents can serve listed firms during the application stage. Therefore, this study uses the number of green invention patent application to measure green technological innovation.
Green management innovation. Referring to the research by Li, et al. [3], we measure green management innovation using five indicators. (1) whether the firm has the environmental protection management system;(2) whether the firm took the environmental protection special actions;(3) whether the firm introduced education and training;(4) whether ISO9001 certification has been passed; (5) whether ISO14001 certification has been passed. The comprehensive scores obtained by the above five indicators are used to measure green management innovation.
4.2.2. Explanatory Variables
Production Digitalization takes value one when the firm has undergone digital transformation in the production and manufacturing-related processes, and zero otherwise. Service Digitalization is assigned a value of one if the firm has undergone digital transformation in the marketing and customer service-related processes, and zero otherwise.
Specifically, as an important strategy for high-quality development in the face of rapid technology evolution, digital transformation is more likely to be reflected in the management discussion and analysis (MD&A) of annual report with summary and guidance [40,41]. Hence, using the MD&A in annual report to measure the firm’s digital transformation can ensure the validity of the measurement results. Draws on the approach of Wu, et al. [42] by conducting a text analysis of the annual reports and counting the frequency of keywords related to digitalization, this study identified keywords from the two dimensions, namely digital technology categories and digital technology application. The root words for digital technology categories include Big Data, Intelligent, Cloud Computing, Blockchain, Internet, IoT, E-commerce, Digitalization, Information Systems, Intelligent, Smart Manufacturing, Intelligent Control, Robotics, Digital Intelligence, Automation, Cloud, Wisdom, Virtual, Digital Twin, etc. The root words for the digital technology application are: (1) Production digitalization: The digital technology application in the production and manufacturing process, including production, manufacturing, factory, industrial park, industrial zone, equipment, machinery, process, product quality, etc.; (2) Service digitalization: The application links of digital technology in marketing and service processes, including marketing, sales, customer, user, full-cycle solutions, business model, product services, etc. In addition, this paper measures the digitalization of support processes, including finance, accounting, office, operations, human resource management and training, etc.
Based on the keyword list, we then used Python to screen out the sentences containing keywords related to digital transformation from the MD&A. At the same time, to ensure that these sentences accurately reflect the digital transformation activities and strategy of the focus firm, four master students in the team whose research direction is organizational strategic change were asked to examine these sentences containing the keywords, make judgments and delete the unrelated information.
4.2.3. Moderating Variables
Environmental regulation. Environmental regulation is measured by the proportion of industrial pollution control completed investment in the added value of the secondary industry.
Peer Firms’ Green Innovation. Drawing from Delmas and Kohli [43]’s study, peer firms’ green innovation is measured by the average green innovation of the same year and industry, excluding the focus firm itself.
4.2.4. Control Variables
Control variables are selected based on existing research related to the green innovation. Drawing on the approach of Xie, et al. [1], the control variables include whether the CEO also serves as the chairman, CEO political connections, equity concentration, firm history, firm performance, HHI, industry integration of informatization and industrialization, financial constraints, state-owned shareholding ratio, directors scale, CEO age, CEO’s education as control variables. The measure is shown in Table 1.
5. Empirical Test
5.1. Descriptive Statistics and Correlations Analysis
We report the means, standard deviations, maximum values, and minimum values in Table 2, and the correlations analysis of the variables in Table 3. As illustrated in Table 3, there is a significant positive correlation between production digitalization and green technological innovation (b=0.042, p<0.01), and service digitalization also shows a significant positive correlation with green technological innovation and green management innovation (b=0.141, p<0.01; b=0.026, p<0.1). This indicates that explanatory variables are valid for the analysis. Furthermore, none of the correlation coefficients among the variables surpass the critical value of 0.7, and the variance inflation factor (VIF) is less than 10, which suggests that multicollinearity is not a significant issue in this study.
5.2. Hypothesis Testing
Table 4 reports the estimates of the green technological innovation models. Model 1 included control variables. Model 2 tested the effects of digital transformation on green technological innovation. The results show that production digitalization positively influences green technological innovation (b=0.891, p<0.01), while service digitalization positively influences green technological innovation (b=7.422, p<0.05), Hypothesis 1a and 2a are supported.
Model 3-5 presents the contingency mechanism for the effects of digital transformation on green technological innovation. In Models 3-5, environmental regulation and different digital transformation’s interactions, peer firms’ green innovation and different digital transformation’s interactions were respectively added. Finally, model 5included all interaction effects simultaneously. Results did not change significantly across different model specifications, which suggested that our findings were quite robust. Hence, we tested our hypotheses based on the results of model 5, the most complete model specification.
In model 5, the regression coefficient of the interaction term between environmental regulation and production digitalization is positive and significant (b=0.175, p<0.1), while the regression coefficient of the interaction term between environmental regulation and service digitalization is positive and significant (b=0.394, p<0.01). These results support Hypothesis 3a and 3b. To more intuitively demonstrate the moderating effect of environmental regulation on the relationship between digital transformation and green technological innovation, Figure 2 and Figure 3 have been plotted. Figure 2 shows that when environmental regulation is higher, the positive effect of production digitalization on green technological innovation is more pronounced, which is consistent with Hypothesis 3a. Meanwhile, Figure 3 indicates that at higher levels of environmental regulation, the positive effect of service digitalization on green technological innovation is stronger. Hypothesis 3b is further supported.
As the model 5 shows, the interaction coefficient of peer firms’ green innovation and production digitalization is positive but not significant (b=0.031, p>0.1), so Hypothesis 4a is not supported. Yet the interaction term between peer firm green innovation and service digitalization is positive and significant (b=0.245, p<0.05). Thus, Hypothesis 4b is supported. This significant moderating effect is plotted in Figure 4. As is shown in Figure 4, the slope of service digitalization and green technological innovation is steeper with the high peer firms’ green innovation than with low peer firms’ green innovation. Hypothesis 4b is further supported.
Table 5 reports the estimates of the green management innovation models. Model 1 included control variables. Model 2 tested the effects of digital transformation on green management innovation. The results show that production digitalization positively influences green management innovation (b=0.115, p<0.1), while service digitalization positively influences green management innovation (b=0.162, p<0.01), Hypothesis 1b and 2b are supported.
Model 3-5 of Table 5 presents the contingency mechanism for the effects of digital transformation on green management innovation. In Models 3-5, environmental regulation and different digital transformation’s interactions, peer firms’ green innovation and different digital transformation’s interactions were respectively added. Finally, model 5included all interaction effects simultaneously. As mentioned before, we tested our hypotheses based on the results of model 5, the most complete model specification.
In model 5 of Table 5, the regression coefficient of the interaction term between environmental regulation and production digitalization is positive and significant (b=0.038, p<0.1), while the regression coefficient of the interaction term between environmental regulation and service digitalization is positive and significant (b=0.045, p<0.1). These results support Hypothesis 3c and 3d. To more intuitively demonstrate the moderating effect of environmental regulation on the relationship between digital transformation and green management innovation, Figure 5 and Figure 6 have been plotted. Figure 5 shows that the slope of production digitalization and green management innovation is steeper with the high environmental regulation than with low environmental regulation. Meanwhile, Figure 6 indicates that at higher levels of environmental regulation, the positive effect of service digitalization on green management innovation is stronger. Hypothesis 3d is further supported.
As indicated in Model 5 of Table 5, the interaction coefficient between peer firms’ green innovation and production digitalization is negative and not significant (b=-0.018, p>0.1), so Hypothesis 4c is not supported. Yet the interaction term between peer firm green innovation and service digitalization is positive and significant (b=0.045, p<0.1). Thus, Hypothesis 4d is supported. This significant moderating effect is plotted in Figure 7, which illustrates that the slope of service digitalization and green management innovation is steeper at higher levels of peer firms’ green innovation compared to lower levels. Hypothesis 4d is further supported.
6. Robustness Test and Endogeneity Issue
6.1. Robustness Test
This paper employs the Tobit model to examine the effect of digital transformation on green innovation. Table 6 and Table 7 reports the regression results. As is shown in Table 6, there is a significant positive relationship between production digitalization and green technological innovation (b=6.396, p<0.05); while there is a significant positive relationship between service digitalization and green technological innovation (b=7.422, p<0.05). The primary conclusions of green technological innovation models are robust. As is shown in Table 7, there is a significant positive relationship between production digitalization and green management innovation (b=0.172, p<0.1); while there is a significant positive relationship between service digitalization and green management innovation (b=0.249, p<0.1). The main research conclusions of green management innovation models are robust. Furthermore, the direction and significance of the other moderating effects remain essentially consistent. The primary conclusions of green management models are also robust.
6.2. Endogeneity Test
To address potential issues of causal endogeneity, this study employs a one-year lagged green innovation as the dependent variable, representing green technological innovation and green management innovation in period T+1. Additionally, to mitigate endogeneity caused by omitted variables, this study utilizes a two-way fixed-effects model to control for both individual and time factors. This approach reduces the problem of omitted variables.

Table 6.
Robustness Test for Green Technological Innovation.
| Variables | Model 1 | Model 2 | Model 3 | Model 4 | Model 5 | ||||
| Production digitalization | 6.396** | 5.054*** | 4.521*** | 4.644*** | |||||
| (2.913) | (1.340) | (1.300) | (1.271) | ||||||
| Service digitalization | 7.422** | 3.062** | 2.245** | 2.179 | |||||
| (3.314) | (1.413) | (1.455) | (1.461) | ||||||
| Production digitalization * Environmental regulation | 0.248 | 0.322 | |||||||
| (0.922) | (0.931) | ||||||||
| Service digitalization* Environmental regulation | 1.570* | 1.585* | |||||||
| (0.865) | (0.829) | ||||||||
| Production digitalization* Peer firms’ green innovation | 1.236** | 1.119** | |||||||
| (0.514) | (0.514) | ||||||||
| Service digitalization * Peer firms’ green innovation | 1.614*** | 1.466*** | |||||||
| (0.587) | (0.532) | ||||||||
| Environmental regulation | 8.761 | 8.478 | 0.676 | 6.311 | 0.614 | ||||
| (6.737) | (6.294) | (0.998) | (6.409) | (0.988) | |||||
| Peer firms’ green innovation | 1.051*** | 0.902*** | 0.858*** | 2.367** | 2.381** | ||||
| (0.347) | (0.310) | (0.315) | (1.066) | (0.985) | |||||
| Support digitalization | 4.591 | 2.001 | 0.980 | 0.990 | 1.145 | ||||
| (3.228) | (2.636) | (1.009) | (1.090) | (1.026) | |||||
| Production staff scale | 4.132 | 3.223 | 2.971 | 3.295 | 3.099 | ||||
| (3.258) | (2.543) | (2.261) | (2.409) | (2.374) | |||||
| Chairman | -1.394 | -1.439 | -0.624 | -1.415 | -0.766 | ||||
| (5.181) | (5.045) | (4.203) | (4.769) | (4.277) | |||||
| CEO political connections | -4.941 | -5.179 | -5.956* | -6.558** | -7.067** | ||||
| (3.293) | (3.225) | (3.306) | (3.061) | (3.119) | |||||
| Equity concentration | 0.086 | 0.034 | 0.052 | -0.031 | -0.008 | ||||
| (0.181) | (0.149) | (0.143) | (0.144) | (0.148) | |||||
| Firm history | -13.823*** | -14.292*** | -13.481*** | -13.880*** | -13.217*** | ||||
| (5.141) | (4.065) | (4.460) | (4.216) | (2.975) | |||||
| Firm performance | 40.047 | 38.843 | 35.207 | 41.611 | 37.937 | ||||
| (30.217) | (29.223) | (27.313) | (26.041) | (26.548) | |||||
| HHI | 72.281 | 75.642 | 62.652 | 87.701* | 75.142 | ||||
| (57.720) | (48.456) | (47.437) | (45.598) | (50.171) | |||||
| Integration Index | -1.758 | -1.710 | -1.778 | -2.028 | -2.042 | ||||
| (2.952) | (2.299) | (2.549) | (2.363) | (1.694) | |||||
| Financial constraints | 7.843 | 9.866 | 9.575 | 9.446 | 9.074 | ||||
| (11.847) | (10.023) | (8.555) | (9.707) | (9.941) | |||||
| State-owned shares holding ratio | 0.096 | 0.093 | 0.085 | 0.117* | 0.107* | ||||
| (0.068) | (0.065) | (0.057) | (0.069) | (0.064) | |||||
| Directors scale | 1.497 | 1.251 | 1.232 | 1.220 | 1.199 | ||||
| (1.170) | (1.083) | (1.083) | (1.143) | (1.106) | |||||
| CEO’s age | 0.073 | -0.089 | -0.134 | -0.043 | -0.086 | ||||
| (0.301) | (0.272) | (0.230) | (0.265) | (0.239) | |||||
| CEO’s education | 3.481* | 2.969* | 2.618* | 3.163* | 2.822* | ||||
| (1.792) | (1.648) | (1.526) | (1.776) | (1.603) | |||||
| Year | Yes | Yes | Yes | Yes | Yes | ||||
| Industry | Yes | Yes | Yes | Yes | Yes | ||||
Note:*p < 0.1;**p < 0.05;***p < 0.01.
Table 7.
Robustness Test for Green Management Innovation.
| Variables | Model 1 | Model 2 | Model 3 | Model 4 | Model 5 | ||||
| Production digitalization | 0.172* | 0.043 | 0.030 | 0.038 | |||||
| (0.101) | (0.059) | (0.061) | (0.061) | ||||||
| Service digitalization | 0.249* | 0.113* | 0.119* | 0.116* | |||||
| (0.131) | (0.059) | (0.064) | (0.064) | ||||||
| Production digitalization * Environmental regulation | 0.055* | 0.053* | |||||||
| (0.032) | (0.032) | ||||||||
| Service digitalization * Environmental regulation | 0.075** | 0.072** | |||||||
| (0.041) | (0.041) | ||||||||
| Production digitalization * Peer firms’ green innovation | -0.031 | -0.028 | |||||||
| (0.052) | (0.052) | ||||||||
| Service digitalization * Peer firms’ green innovation | 0.082** | 0.080** | |||||||
| (0.038) | (0.038) | ||||||||
| Environmental regulation | 0.144 | 0.169 | 0.017 | 0.177 | 0.023 | ||||
| (0.312) | (0.312) | (0.044) | (0.314) | (0.045) | |||||
| Peer firms’ green innovation | -0.001 | -0.002 | -0.002 | 0.008 | 0.007 | ||||
| (0.018) | (0.018) | (0.018) | (0.076) | (0.076) | |||||
| Support digitalization | 0.028 | 0.042 | 0.024 | 0.016 | 0.016 | ||||
| (0.106) | (0.105) | (0.044) | (0.044) | (0.044) | |||||
| Production staff scale | 0.134 | 0.131 | 0.134 | 0.132 | 0.135 | ||||
| (0.107) | (0.109) | (0.110) | (0.109) | (0.110) | |||||
| Chairman | -0.211 | -0.216 | -0.224 | -0.215 | -0.223 | ||||
| (0.145) | (0.144) | (0.145) | (0.144) | (0.145) | |||||
| CEO political connections | 0.173 | 0.152 | 0.158 | 0.148 | 0.154 | ||||
| (0.174) | (0.175) | (0.174) | (0.175) | (0.175) | |||||
| Equity concentration | -0.006 | -0.005 | -0.005 | -0.005 | -0.005 | ||||
| (0.007) | (0.007) | (0.007) | (0.007) | (0.007) | |||||
| Firm history | -0.923*** | -0.926*** | -0.927*** | -0.922*** | -0.923*** | ||||
| (0.108) | (0.108) | (0.109) | (0.109) | (0.109) | |||||
| Firm performance | 1.710 | 1.743 | 1.677 | 1.726 | 1.662 | ||||
| (1.060) | (1.063) | (1.067) | (1.060) | (1.066) | |||||
| HHI | -3.566 | -3.500 | -3.351 | -3.674 | -3.521 | ||||
| (3.633) | (3.540) | (3.552) | (3.519) | (3.537) | |||||
| Integration Index | 0.036* | 0.035* | 0.035* | 0.034* | 0.034* | ||||
| (0.019) | (0.019) | (0.020) | (0.020) | (0.020) | |||||
| Financial constraints | 0.325 | 0.349 | 0.363 | 0.357 | 0.371 | ||||
| (0.319) | (0.315) | (0.315) | (0.316) | (0.315) | |||||
| State-owned shares holding ratio | 0.003 | 0.003 | 0.003 | 0.003 | 0.003 | ||||
| (0.003) | (0.003) | (0.003) | (0.003) | (0.003) | |||||
| Directors scale | -0.000 | 0.003 | 0.004 | 0.003 | 0.003 | ||||
| (0.036) | (0.036) | (0.036) | (0.036) | (0.036) | |||||
| CEO’s age | -0.000 | -0.000 | -0.000 | -0.001 | -0.001 | ||||
| (0.009) | (0.009) | (0.009) | (0.009) | (0.009) | |||||
| CEO’s education | 0.074 | 0.067 | 0.066 | 0.068 | 0.068 | ||||
| (0.063) | (0.063) | (0.063) | (0.064) | (0.063) | |||||
| Year | Yes | Yes | Yes | Yes | Yes | ||||
| Industry | Yes | Yes | Yes | Yes | Yes | ||||
Note:*p < 0.1;**p < 0.05;***p < 0.01.
6.3. Supplementary Analysis
This paper has indicated that service digitalization and production digitalization can promote green technological innovation and green management innovation. However, it remains unclear whether the green innovation driven by digital transformation has a positive impact on firm value. Hence, this paper further explores the impact of green innovation on financial and environmental performance. Specifically, financial performance is measured by Tobin’s Q, return on assets, and sales. Environmental performance is measured by environmental performance and honors. As detailed in Table 8, Models 1 to 3 reveal that green technological innovation has a significant positive relationship with the Tobin’s Q (b=0.074, p<0.05), the return on assets (b=0.004, p<0.05), and sales (b=0.003, p<0.05). Yet green management innovation has no effect on the Tobin’s Q (b=0.008, p>0.1), return on assets (b=-0.001, p>0.1), and sales (b=-0.001, p>0.1). Model 4 and Model 5 show that green technological innovation has a significant positive relationship with environmental honors (b=0.213, p<0.01); green management innovation has a significant positive relationship with environmental performance and honors (b=0.566, p<0.01;b=0.206, p<0.01). In summary, production digitalization and have a positive impact on both of financial performance and environmental performance, whereas service digitalization positively affects only environmental performance.
7. Conclusion and Implications
7.1. General Conclusions
In this paper, digital transformation is conceptualized as comprising two key dimensions, namely, production digitalization and service digitalization. We examine the effects of service digitalization and production digitalization on green innovation, and analyze the contingent value of institutional logic, such as environmental regulation and peer firms’ green innovation. Our results demonstrate that, production digitalization and service digitalization have a significant promoting effect on both of green technological innovation and green management innovation. However, the effect of production digitalization on green management innovation is stronger than that of service digitalization. This suggests that production digitalization only focuses on the digitalization of the firm’s production and manufacturing processes, with weak connectivity and collaboration with non-production processes, making it difficult to effectively empower green management innovation. Moreover, environmental regulation enhances the positive effect of service digitalization on green technological innovation and green management innovation. While it enhances the effect of production digitalization on green management innovation. Peer firms’ green innovation strengthens the effect of service digitalization on both of green technological innovation and green management innovation.
7.2. Theoretical Contributions
Our findings contribute to the existing literature in three major ways. First, based on the digital empowerment theory, this study explains the mechanism by which digital transformation affects green innovation in manufacturing firms. It also verifies the heterogeneous impact of different digital transformation on green technological innovation and green management innovation, which enriches the research field of digital transformation. Secondly, green innovation is an essential means to achieve national high-quality development goals, offering dual benefits: reducing environmental pollution and increasing organizational innovation [44]. Previous research has primarily concentrated on the economic value and environmental benefits of green innovation [45], little study has examined the empowering role of digital transformation on green innovation. This study further expands the research on the driving mechanisms behind green innovation. Thirdly, this study, based on institutional logic, further explores the contingent mechanism of institutional factors in the relationship between digital transformation and green innovation. The results highlight the moderating roles of peer firms’ green innovation and environmental regulation, which enriches the research on the effect mechanism of digital transformation on green innovation.
7.3. Practical Implications
The study has the following practical significance. First, manufacturing firms should highly value the significance of digital transformation for green innovation. By enhancing the digitalization of production and services segments, the firms can gradually increase the innovation capability and facilitates green innovation. Second, manufacturing firms should integrate green innovation, institutional environment, and digital transformation into a cohesive strategic framework. They must consider the differences in the effect of digital transformation on green innovation under various institutional environments. Governments should, in conjunction with firms’ characteristics, adopt appropriate environmental regulation policies and explore more suitable incentive policies to guide the synergistic development of greening and digitization in manufacturing firms.
7.4. Limitations and future research directions
The study has limitations that provide avenues for further research. First, due to data availability, this study only discussed the impact of digital transformation on green technological innovation and green management innovation. Future research could introduce additional dimensions of green innovation, such as green process innovation and green product innovation [4]. Secondly, this study only took manufacturing firms as the sample to examine the impact of digital transformation on green innovation. Future studies should expand the research samples to include a broader range of industries to understand the effects of digital transformation on green innovation more comprehensively.
Author Contributions
FF: Conceptualization, Investigation, Resources, Writing—original draft, Writing—review & editing. SL: Conceptualization, Investigation, Resources, Visualization, Writing—original draft, Writing—review & editing.
Data Availability Statement
The datasets for this study can be found in the CSMAR.
Conflicts of Interest
The authors declare that the research was conducted in the absence of any commercial or financial relationships that could be construed as a potential conflict of interest.
References
- X. Xie, D. Luo, and Y. Gao, Collaborative mechanism of supply chain enterprises based on green innovation: An empirical study Journal of Industrial Engineering Management 33 (2019) 116-124.
- Xie, X.M.; Huo, J.G.; Zou, H.L. Green process innovation, green product innovation, and corporate financial performance: A content analysis method. J. Bus. Res. 2019, 101, 697–706. [CrossRef]
- W. Li, Y. Zhang, M. Zheng, X. Li, G. Cui, and H. Li, Chinese listed companies’ green governance and its evaluation research. Management World. 35 (2019) 126-133+160.
- X. Xie, and Q. Zhu, How can green innovation solve the dilemmas of” harmonious coexistence”. Management World. 37 (2021) 128-149+129.
- J. Xiao, and P. Zeng, Does digitalization improve the quality and quantity of enterprise green innovation? ——based on resource perspective. Studies in Science of Science. (2022) 1-19.
- Y. Yang, J. Lei, H. Chen, and Y. Wu, The mechanisms of processing and manufacturing firms’ digital transformation: Case studies based on resource orchestration. Journal of Management Case Study. 15 (2022) 198-220.
- X. Xie, and Y. Han, How can local manufacturing enterprises achieve luxuriant transformation in green innovation? A multi-case study based on attention-based view. Management World. 38 (2022) 76-106.
- S. Yi, and W. Liang, How do the traditional commercial enterprises innovate and transform ——the construction of the value co-creation platform network from the perspective of service-dominant logic. Chinese Industrial Economy. (2023) 171-188.
- H. Deng, and J. Zhao, Peer effects in economic decision-making of China’s local governments. Chinese Industrial Economy. (2018) 59-78.
- M. Chi, D. Ye, and J. Wangs, How can Chinese small- and medium-sized manufacturing enterprises improve the new product development (npd) performance? From the perspective of digital empowerment. Nankai Business Review. 23 (2020) 63-75.
- X. Sun, J. Li, and M. Zhang, Data empowerment for the value chain ascension of intelligent manufacturing enterprises: A review and prospects. Financial and Accounting Communication. (2023) 26-31.
- University of New South Wales; Leong, C.; Pan, S.L.; Newell, S.; University of Sussex; Cui, L.; Shanghai University of Finance and Economics The Emergence of Self-Organizing E-Commerce Ecosystems in Remote Villages of China: A Tale of Digital Empowerment for Rural Development. MIS Q. 2016, 40, 475–484. [CrossRef]
- ChenY.-S. The Driver of Green Innovation and Green Image– Green Core Competence. J. Bus. Ethic. 2008, 81, 531–543. [CrossRef]
- García-Granero, E.M.; Piedra-Muñoz, L.; Galdeano-Gómez, E. Measuring eco-innovation dimensions: The role of environmental corporate culture and commercial orientation. Res. Policy 2020, 49, 104028. [CrossRef]
- L. Xi, and H. Zhao, Senior executive dual environmental cognition, green innovation, and enterprise sustainable development performance. Economic Management. 44 (2022) 139-158.
- Cao, H.; Chen, Z. The driving effect of internal and external environment on green innovation strategy-The moderating role of top management’s environmental awareness. Nankai Bus. Rev. Int. 2019, 10, 342–361. [CrossRef]
- J. Liu, and Y. Xiao, China’s environmental protection tax and green innovation: Incentive effect or crowding-out effect? Economic Research. 57 (2022) 72-88.
- Q. Li, and Z. Xiao, Heterogeneous environmental regulation tools and green innovation incentives: Evidences from green patents of listed companies. Economic Research Journal. 55 (2020) 192-208.
- W. Wu, L. Jinjin, Z. Aimei, and Q. Zhen, Green cancer and corporate green innovation: A scenarist study of digital business models in the context of quality development orientation. Science & Technology Progress and Policy. 1-12.
- Delgado-Ceballos, J.; Aragón-Correa, J.A.; Ortiz-De-Mandojana, N.; Rueda-Manzanares, A. The Effect of Internal Barriers on the Connection Between Stakeholder Integration and Proactive Environmental Strategies. J. Bus. Ethic- 2011, 107, 281–293. [CrossRef]
- H. Zhou, H. Li, and L. Zhao, Research on the impact of manufacturing digital transformation on green innovation performance: The moderating effects of digital level. Science-Technology and Management. 23 (2021) 33-43.
- X. Xie, Y. Wu, and L. Yan, Enterprise green development path and policy suggestions under the background of digital age. Ecological Economy. 31 (2015) 88-91.
- W. Jing, and B. Sun, Digital economy promotes high-quality economic development: A theoretical analysis framework. Economist. (2019) 66-73.
- F. Meng, Y. Xu, and G. Zhao, Research on the transformation process of high-end equipment.
- manufacturing enterprises to intelligent manufacturing:Based on.
- digital empowerment perspective. Scientific Decision Making. (2019) 1-24.
- H. Yin, H. Yu, and Q. Xie, Research on intelligent transformation and upgrading of manufacturing enterprises based on value chain optimization. China Science and Technology Forum. (2021) 113-122.
- Z. Wang, Y. Cao, and S. Lin, The characteristics and heterogeneity of environmental regulation’s impact on enterprises’green technology innovation ———based on green patent data of listed firms in China. Studies in Science of Science. 39 (2021) 909-919+929.
- Wang, C.; Yang, Y.; Zhang, J. China's sectoral strategies in energy conservation and carbon mitigation. Clim. Policy 2015, 15, S60–S80. [CrossRef]
- C. R. Carter, and L. M. Ellram, Reverse logistics: A review of the literature and framework for future investigation. Journal of business logistics. 19 (1998) 85.
- J. Xu, J. Guan, and Y. Lin, Institutional pressures,top managers’environmental awareness and environmental innovation practices:An institutional theory and upper echelons theory perspective. Management review. 29 (2017) 72-83.
- B. Zhang, and S. Zhao, Research on the impact of government subsidies on green innovation of enterprises ——the moderating effect of political connection and environmental regulation. Science Research Management. 1-12.
- Berrone, P.; Fosfuri, A.; Gelabert, L.; Gomez-Mejia, L.R. Necessity as the mother of ‘green’ inventions: Institutional pressures and environmental innovations. Strat. Manag. J. 2012, 34, 891–909. [CrossRef]
- Y. Zhu, H. Gao, Q. Ding, and Y. Hu, Impact of local environmental target constraint intensity on the quality of enterprise green innovation: Moderating effects based on the digital economy. China Population,Resources and Environment. 32 (2022) 106-119.
- C. Wang, and X. Li, Research on the relationship between peers’voluntary disclosure and corporate earnings management: Based on the management earnings forecast. Economic Management. 44 (2022) 172-189.
- Chiou, T.-Y.; Chan, H.K.; Lettice, F.; Chung, S.H. The influence of greening the suppliers and green innovation on environmental performance and competitive advantage in Taiwan. Transp. Res. Part E Logist. Transp. Rev. 2011, 47, 822–836. [CrossRef]
- X. Wang, and X. Chu, Research on the peer group effect of green technology innovation in manufacturing enterprises: Reference function based on multi-level situationd. Nankai Business Review. 25 (2022) 68-81.
- Xiong, H.; Wang, P.; Bobashev, G. Multiple peer effects in the diffusion of innovations on social networks: a simulation study. J. Innov. Entrep. 2018, 7, 1–18. [CrossRef]
- C. YuJiao, S. TieBo, and H. JianBin, Digital transformation of enterprises: Is the company following peers in the same industry? Or in the same area?——research on decision process based on institutional theory. Studies in Science of Science. 40 (2022) 1054-1062.
- Y. Qi, B. Du, and W. Xin, Mission embeddedness and pattern selection of digital strategic transformation of soes: A case study based on the typical practice of digitalization in three central enterprises. Management World. 37 (2021) 137-158+110.
- W. Li, and F. Wang, Intelligent transformation,cost stickiness and enterprise performance —an empirical study based on traditional manufacturing enterprises. Studies in Science of Science. 40 (2022) 91-102.
- J. Wu, and B. Guan, The effect of top management team characteristics on international market entry mode: The mediating role of attention. Management Review. 27 (2015) 118-131.
- Wang, S.-Q.; Zhang, S.; Shang, G.-Y. Impact of Subsidiary TMT Network Attention on Innovation: The Moderating Role of Subsidiary Autonomy. Manag. Organ. Rev. 2022, 18, 1077–1115. [CrossRef]
- F. Wu, H. Hu, H. Lin, and X. Ren, Enterprise digital transformation and capital market performance:Empirical evidence from stock liquidity Management World. 37 (2021) 130-144+110.
- Delmas, M.A.; Kohli, A. Can Apps Make Air Pollution Visible? Learning About Health Impacts Through Engagement with Air Quality Information. J. Bus. Ethics 2020, 161, 279–302. [CrossRef]
- Rennings, K.; Ziegler, A.; Ankele, K.; Hoffmann, E. The influence of different characteristics of the EU environmental management and auditing scheme on technical environmental innovations and economic performance. Ecol. Econ. 2005, 57, 45–59. [CrossRef]
- L. Rekik, and F. Bergeron, Green practice motivators and performance in smes: A qualitative comparative anaysis. Journal of Small Business Strategy. 27 (2017) 1-18.
Figure 1.
Research Framework.
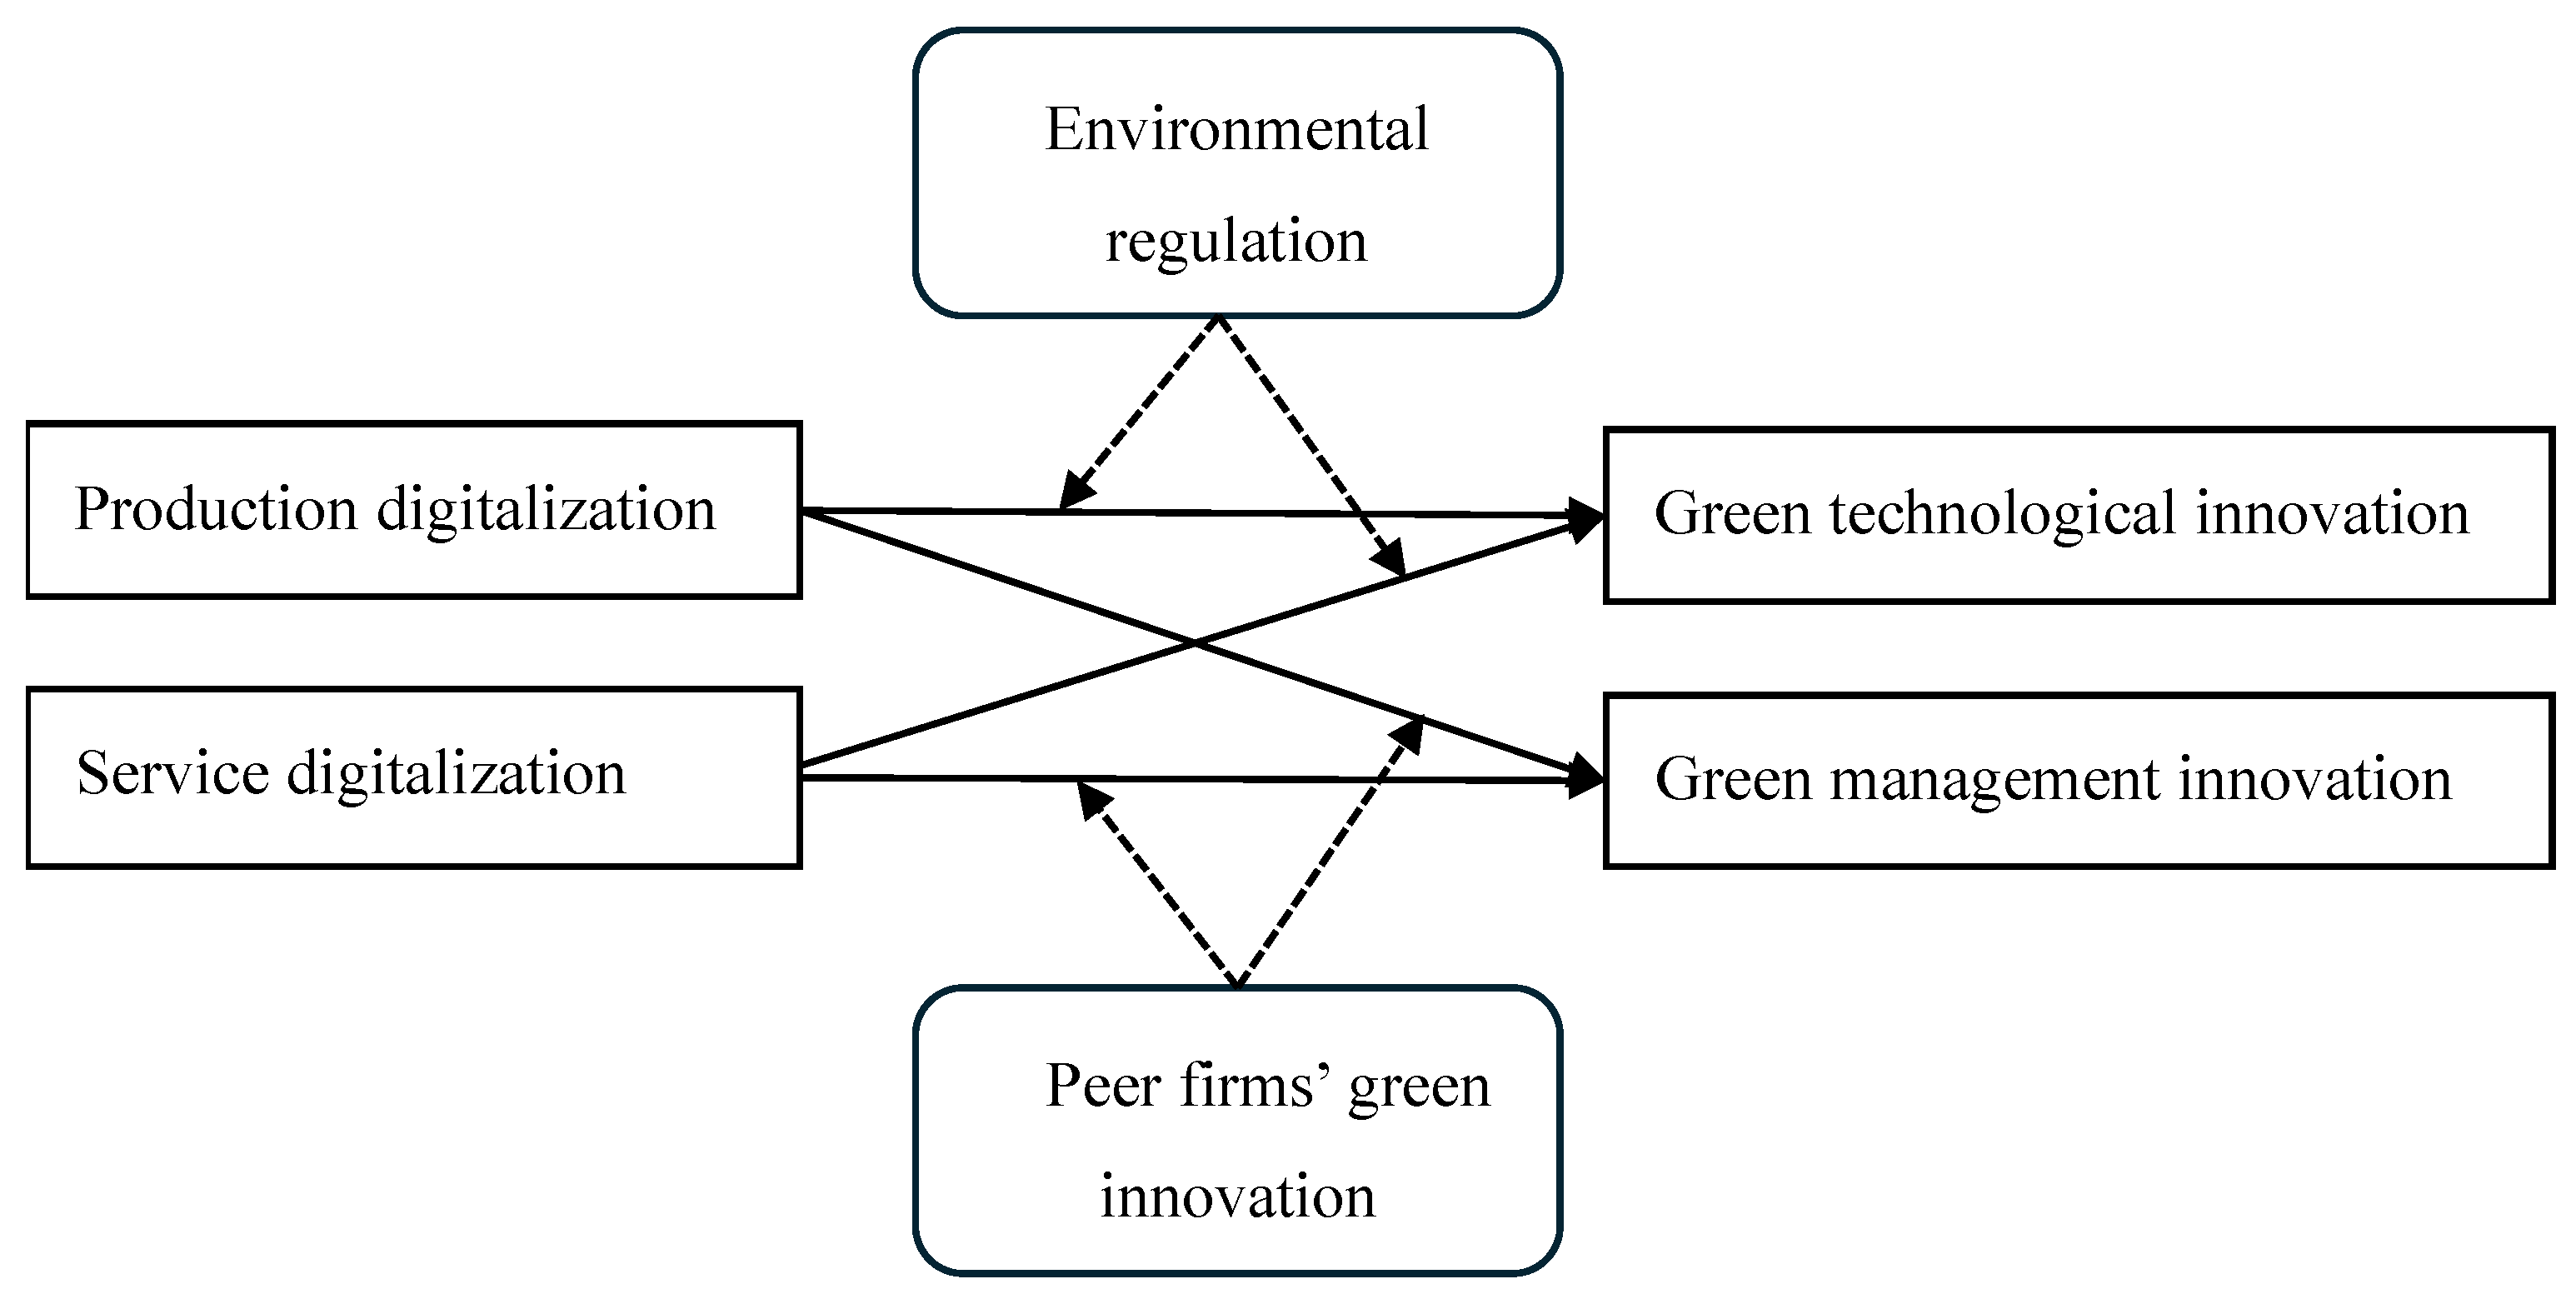
Figure 2.
The Moderating Effect of Environmental Regulation on the Relationship between Production Digitalization and Green Technological Innovation.
Figure 2.
The Moderating Effect of Environmental Regulation on the Relationship between Production Digitalization and Green Technological Innovation.
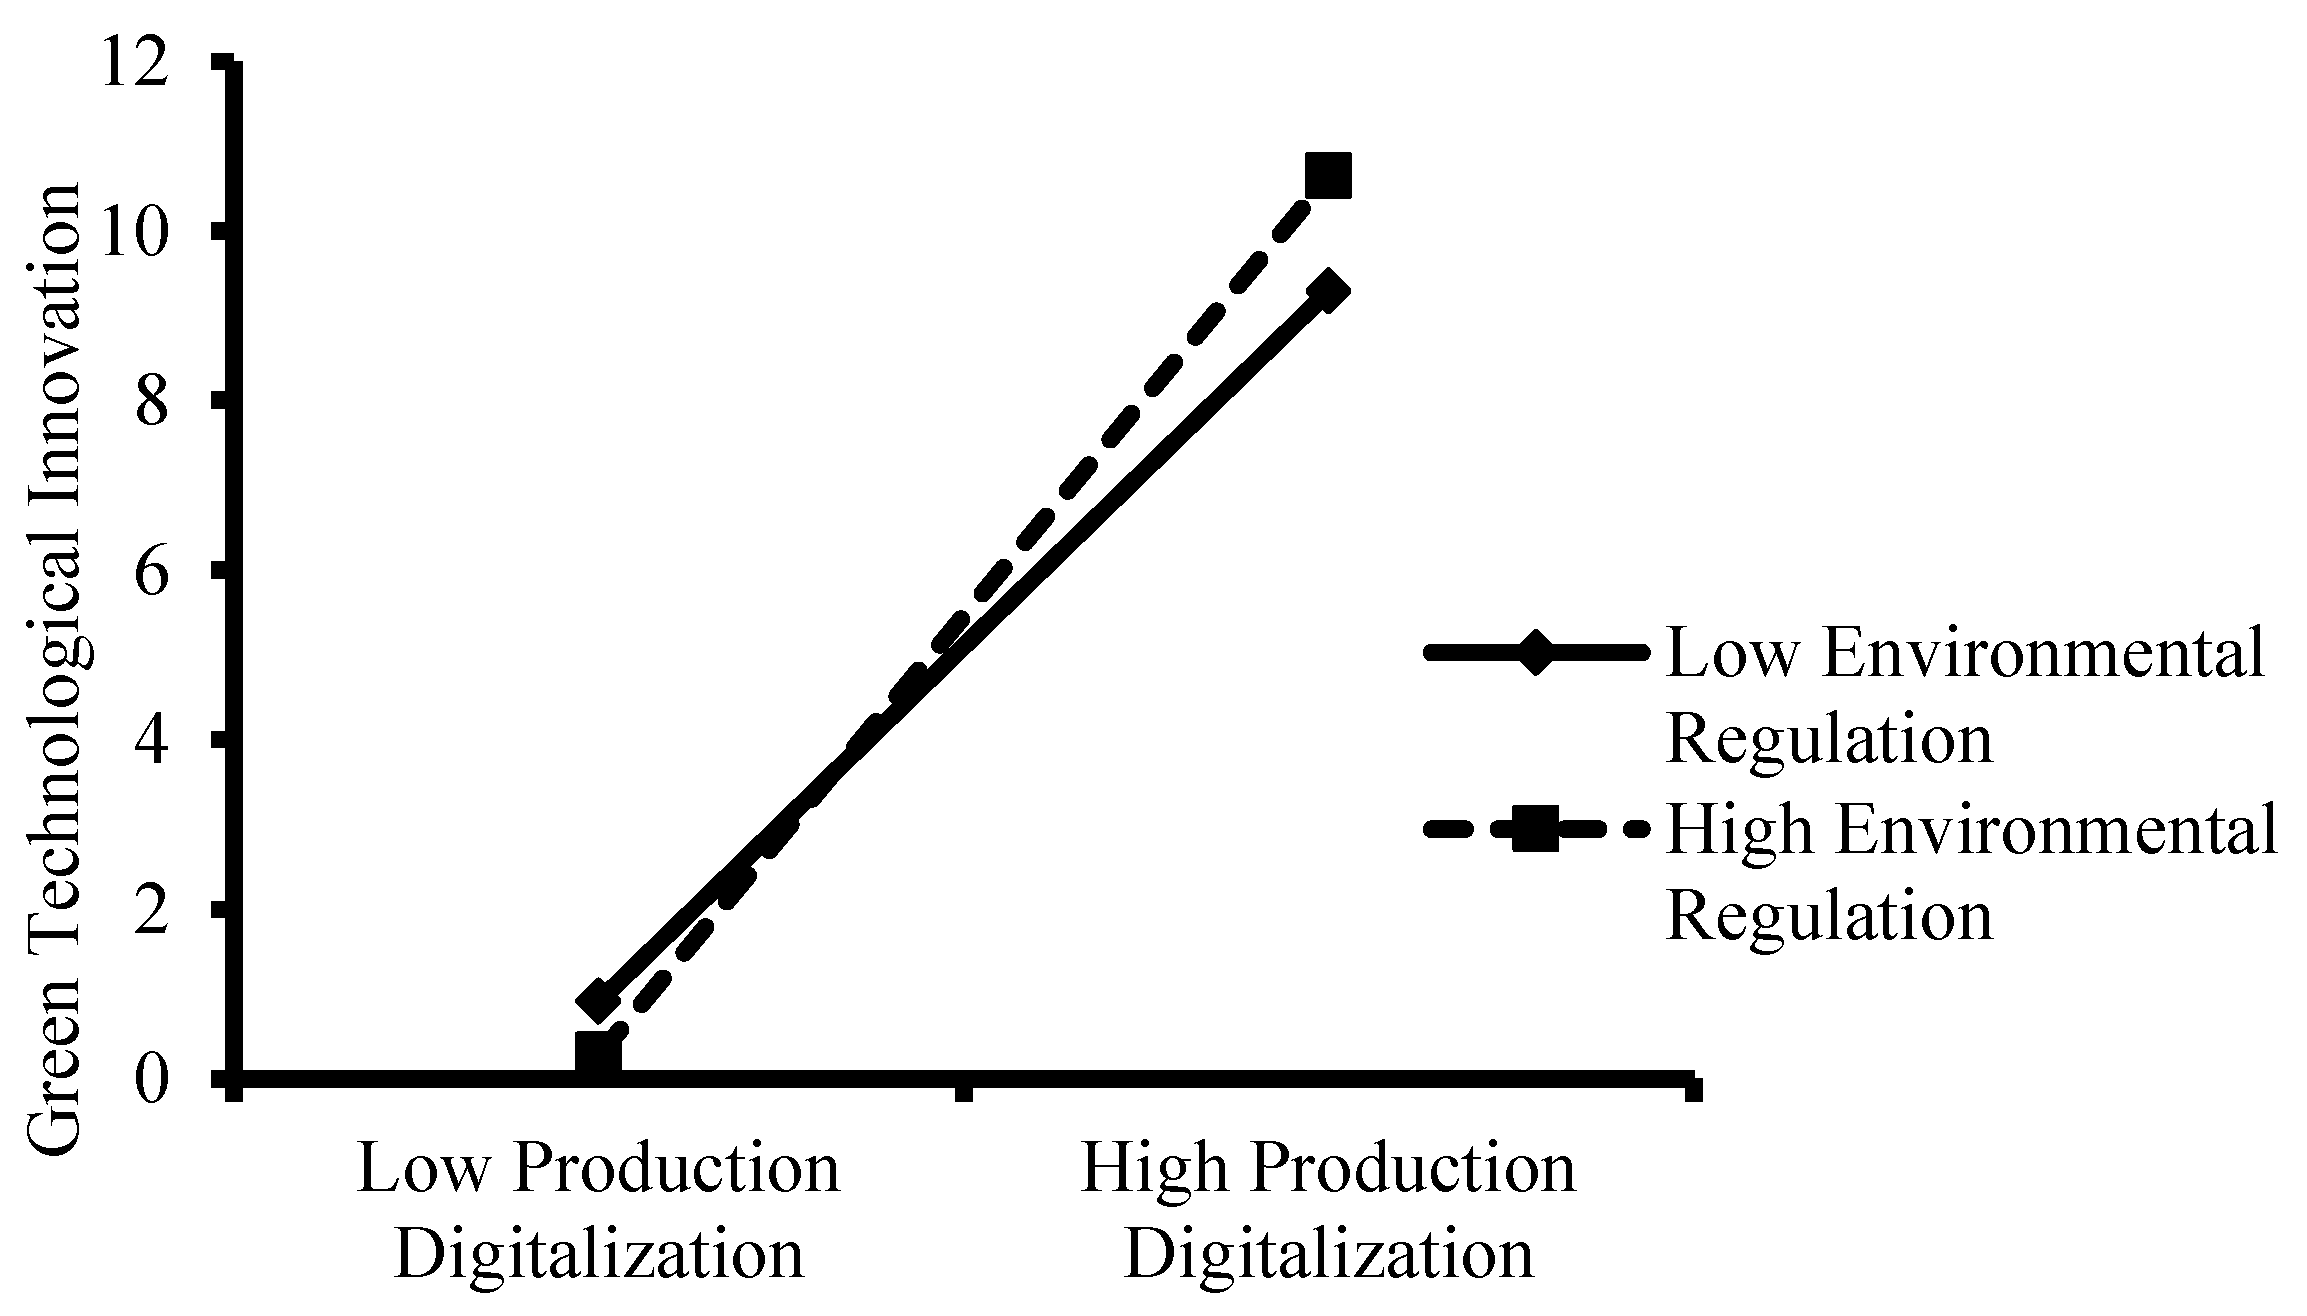
Figure 3.
The Moderating Effect of Environmental Regulation on the Relationship between Service Digitalization and Green Technological Innovation.
Figure 3.
The Moderating Effect of Environmental Regulation on the Relationship between Service Digitalization and Green Technological Innovation.
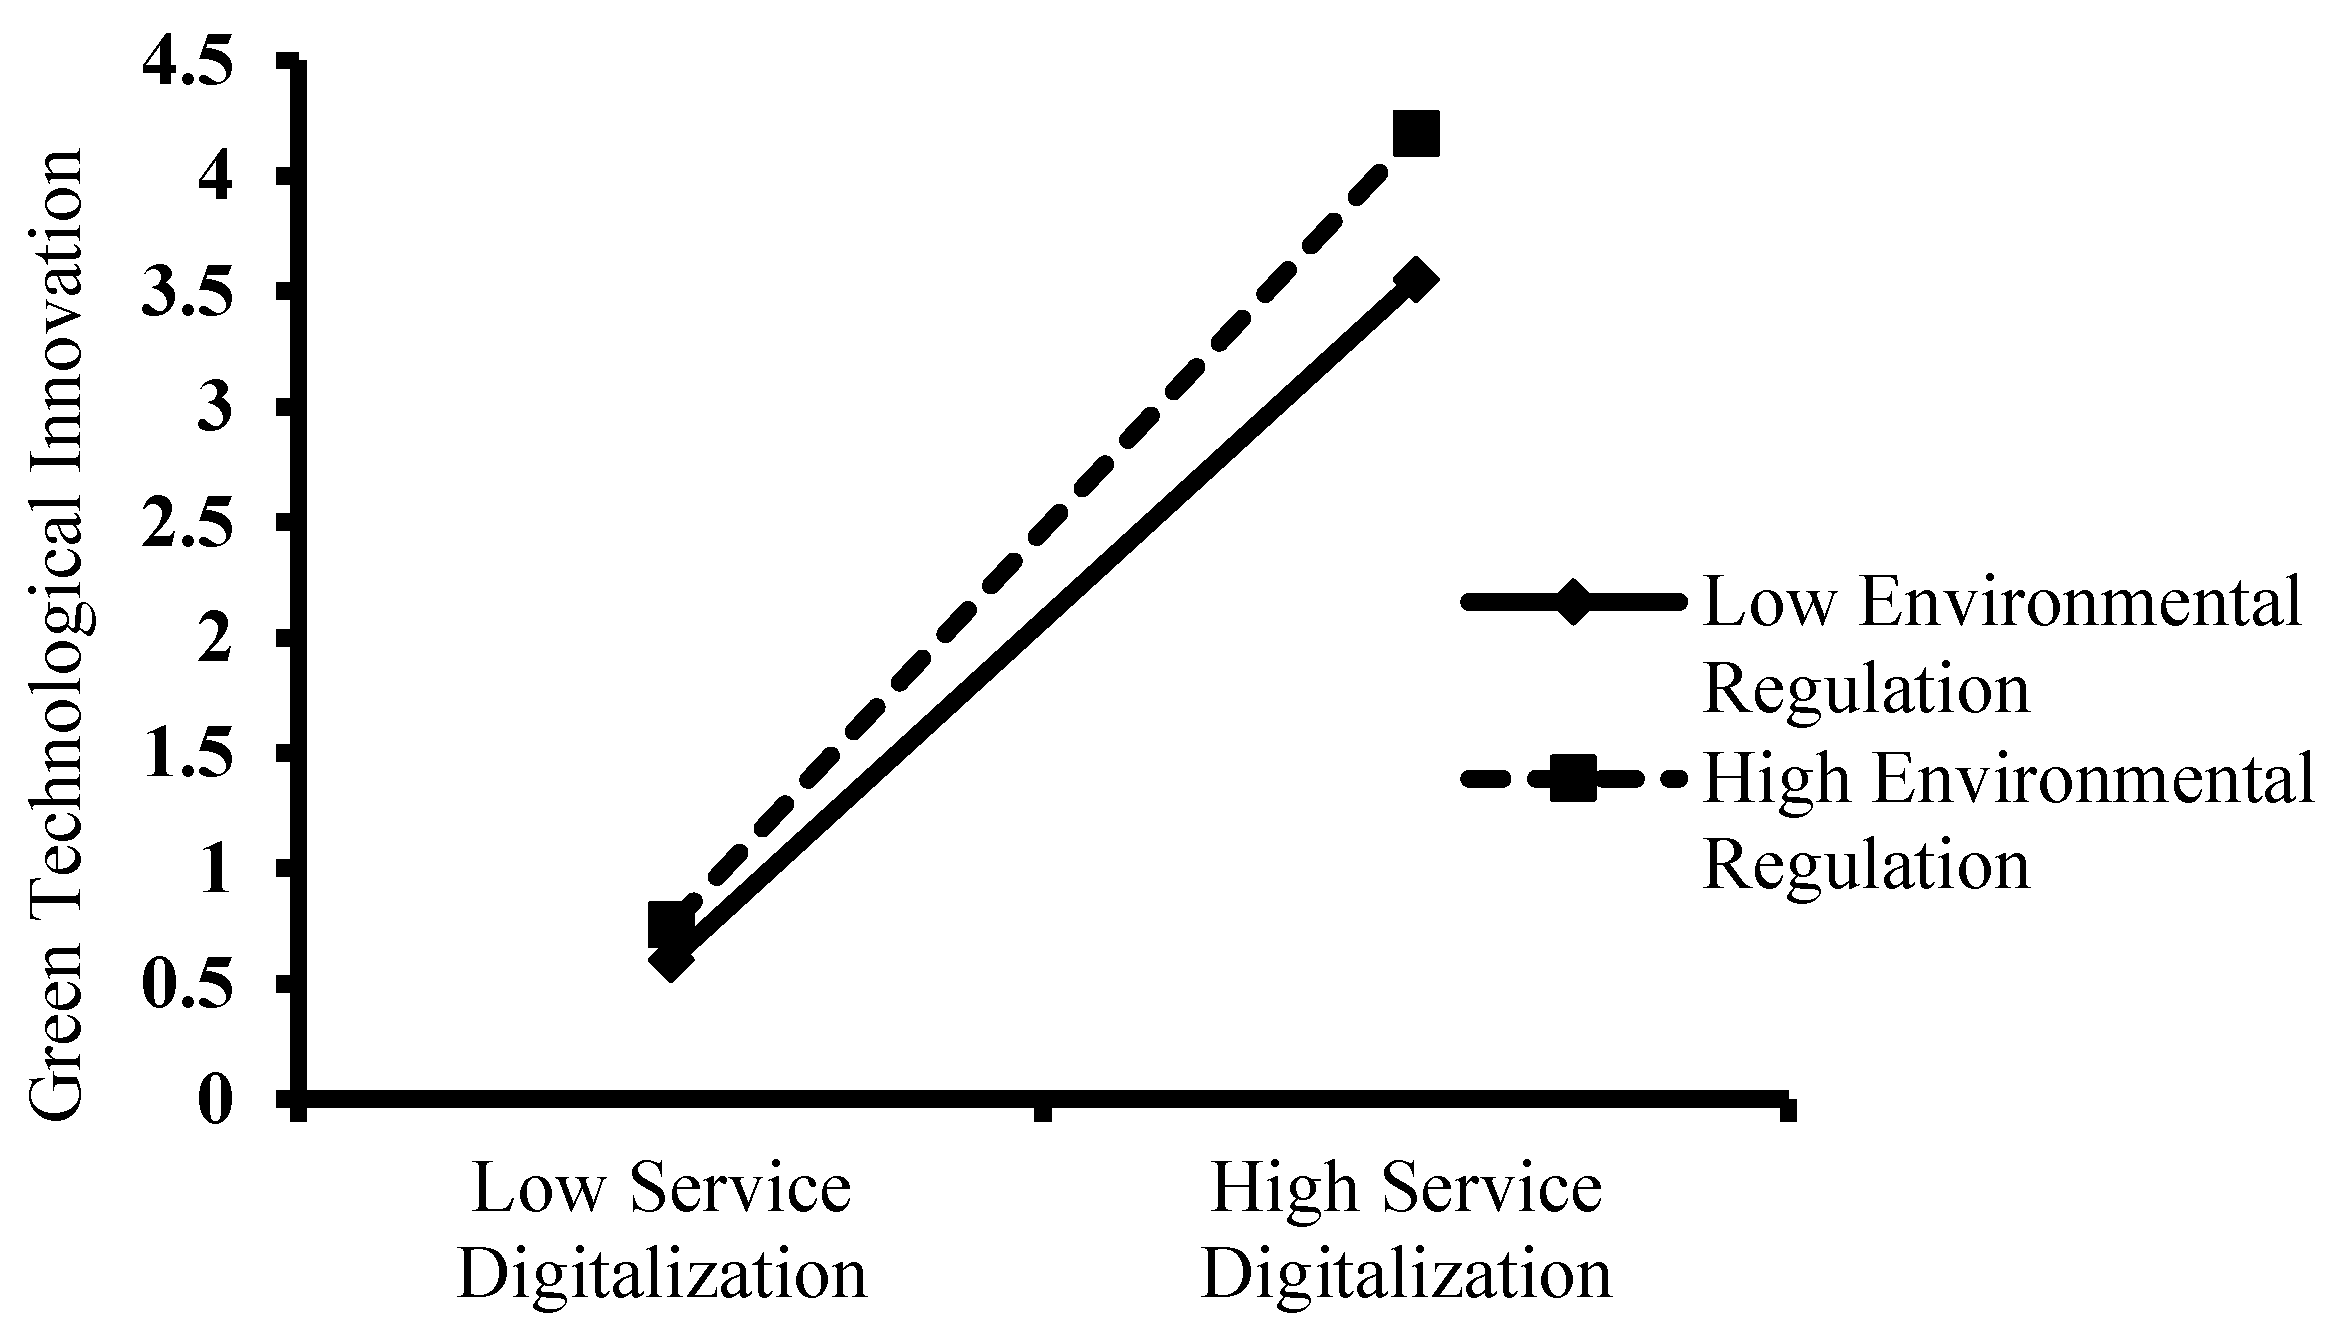
Figure 4.
The Moderating Effect of Peer Firms’ Green Innovation on the Relationship between Service Digitalization and Green Technological Innovation.
Figure 4.
The Moderating Effect of Peer Firms’ Green Innovation on the Relationship between Service Digitalization and Green Technological Innovation.
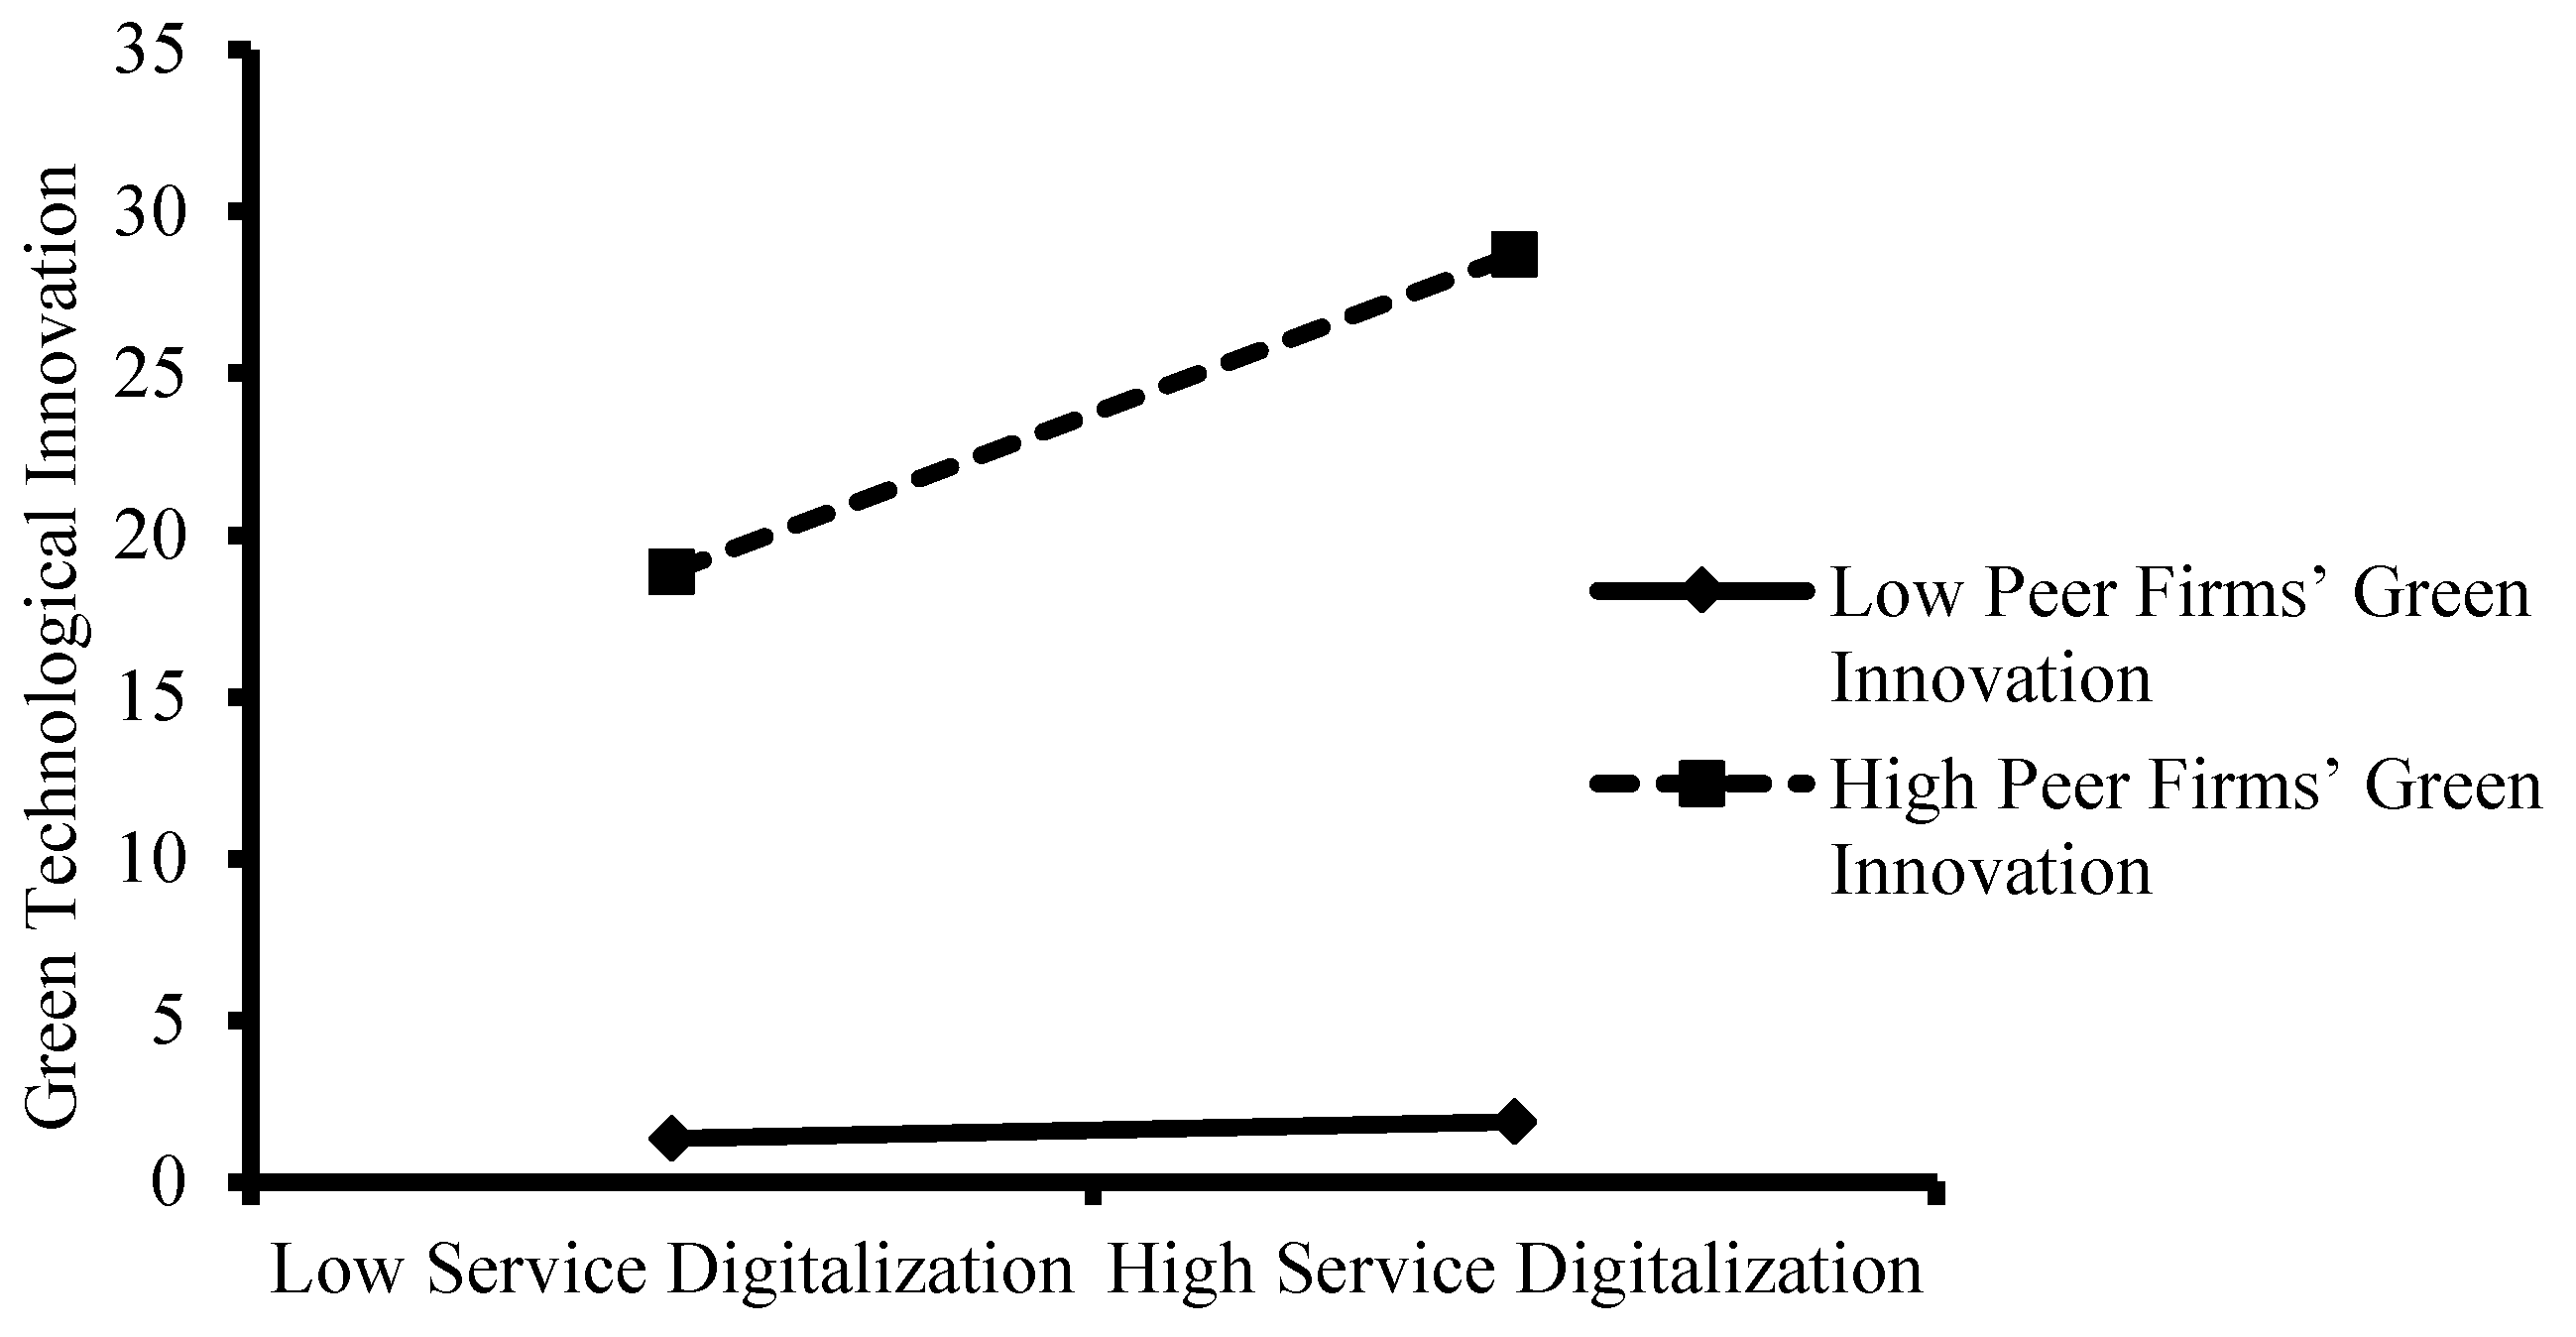
Figure 5.
The Moderating Effect of Environmental Regulation on the Relationship between Production Digitalization and Green Management Innovation.
Figure 5.
The Moderating Effect of Environmental Regulation on the Relationship between Production Digitalization and Green Management Innovation.
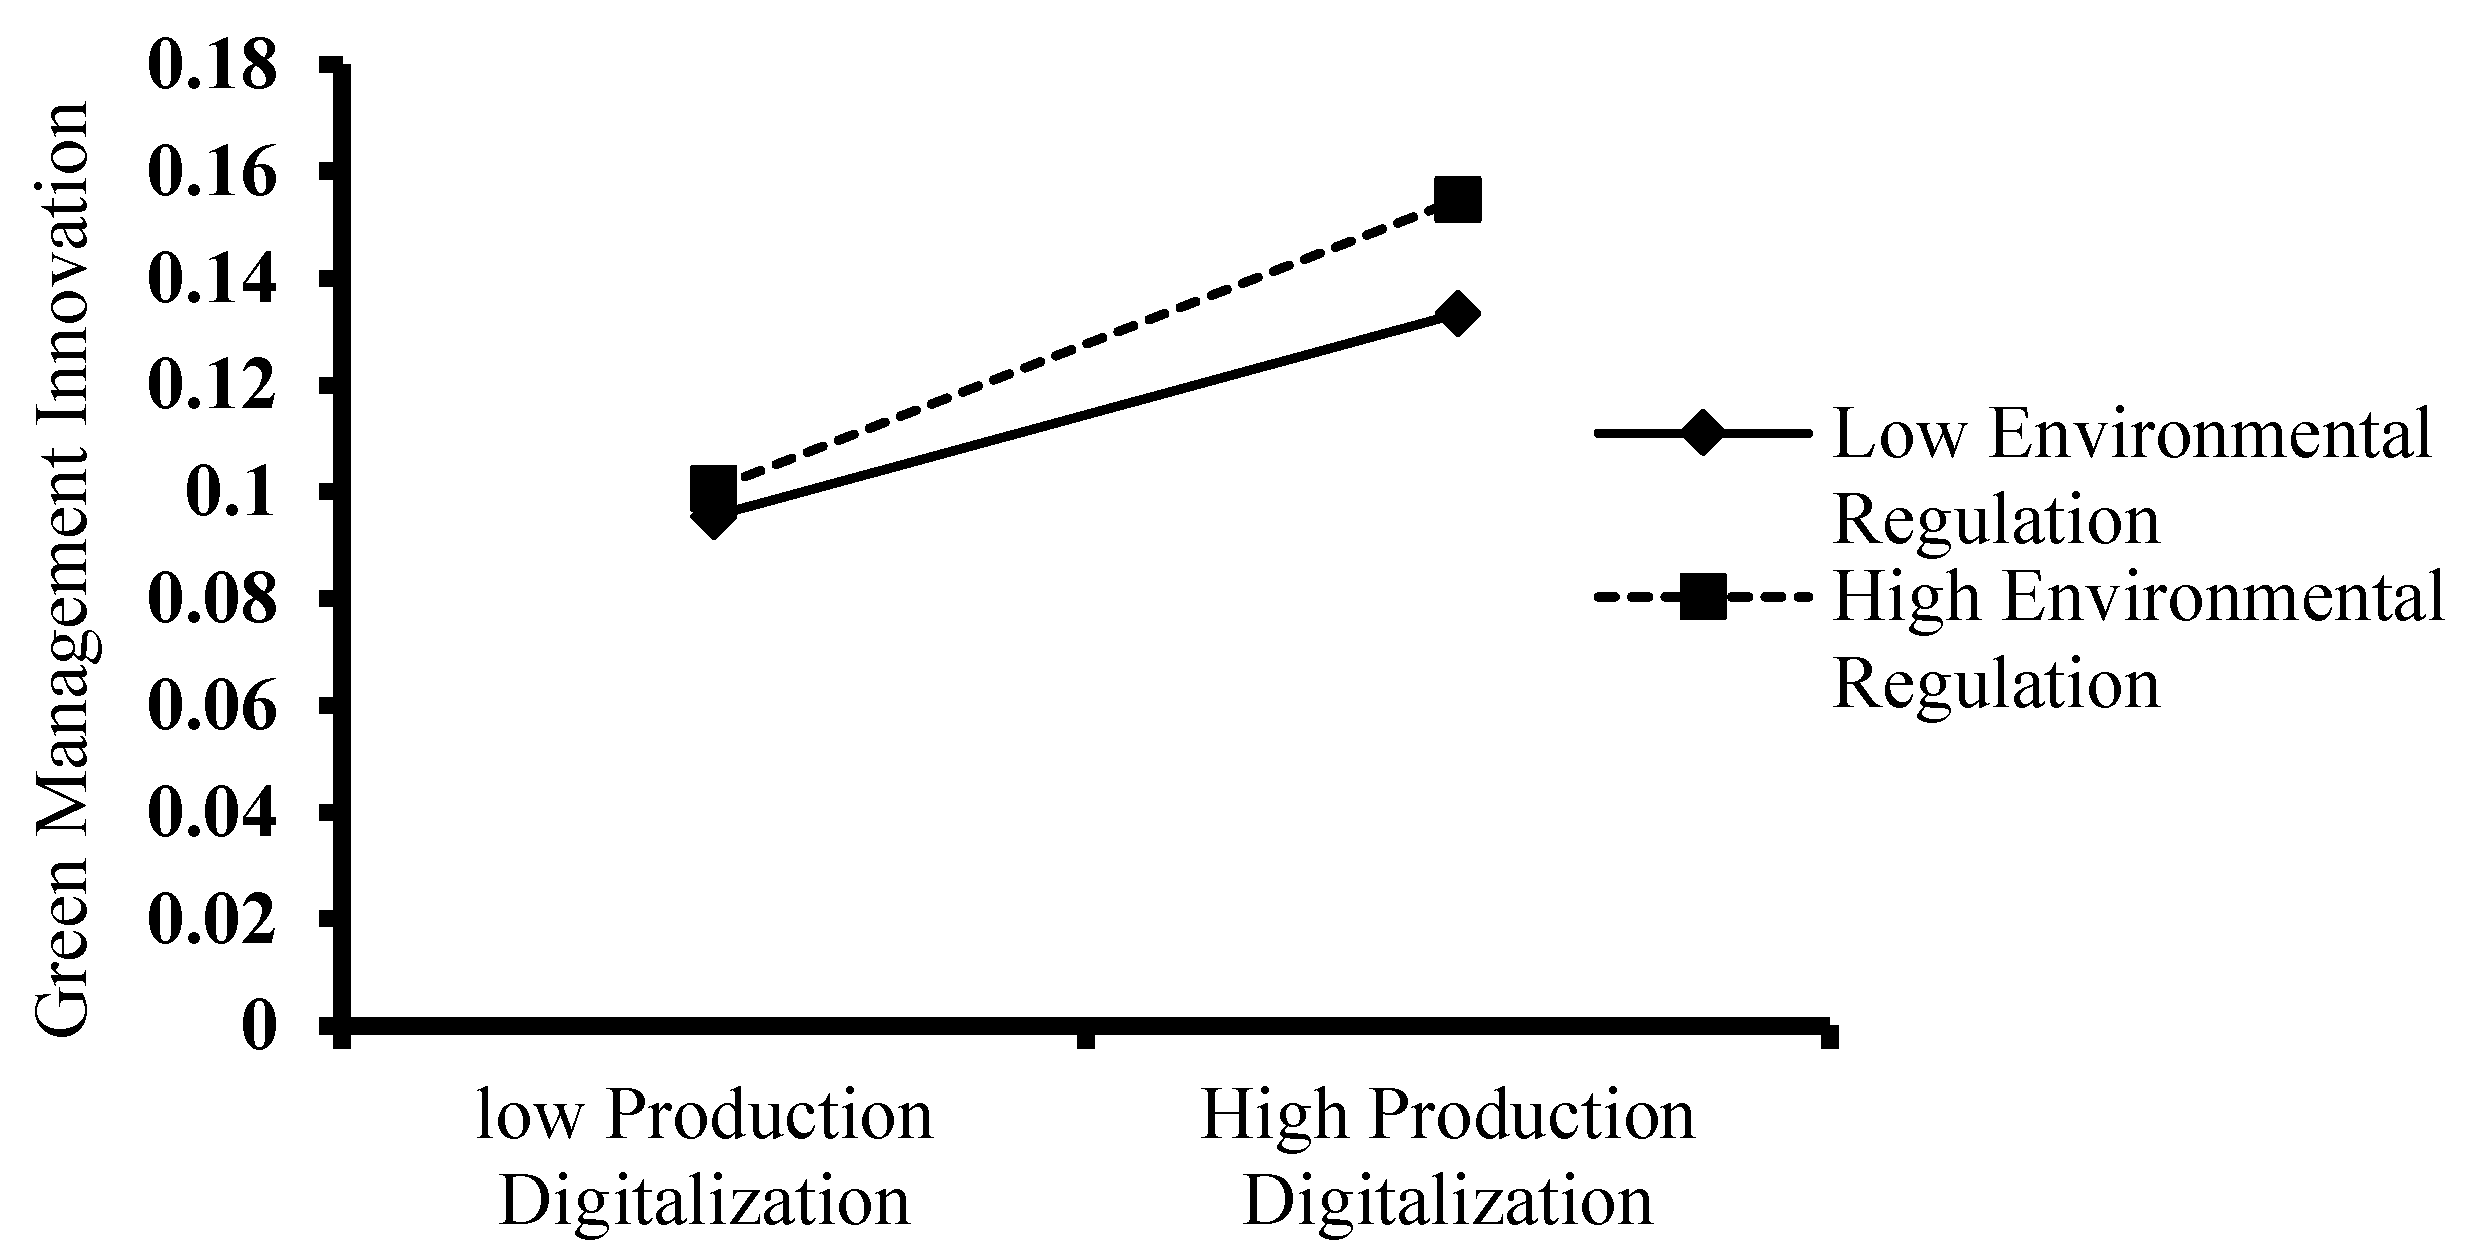
Figure 6.
The Moderating Effect of Environmental Regulation on the Relationship between Service Digitalization and Green Management Innovation.
Figure 6.
The Moderating Effect of Environmental Regulation on the Relationship between Service Digitalization and Green Management Innovation.
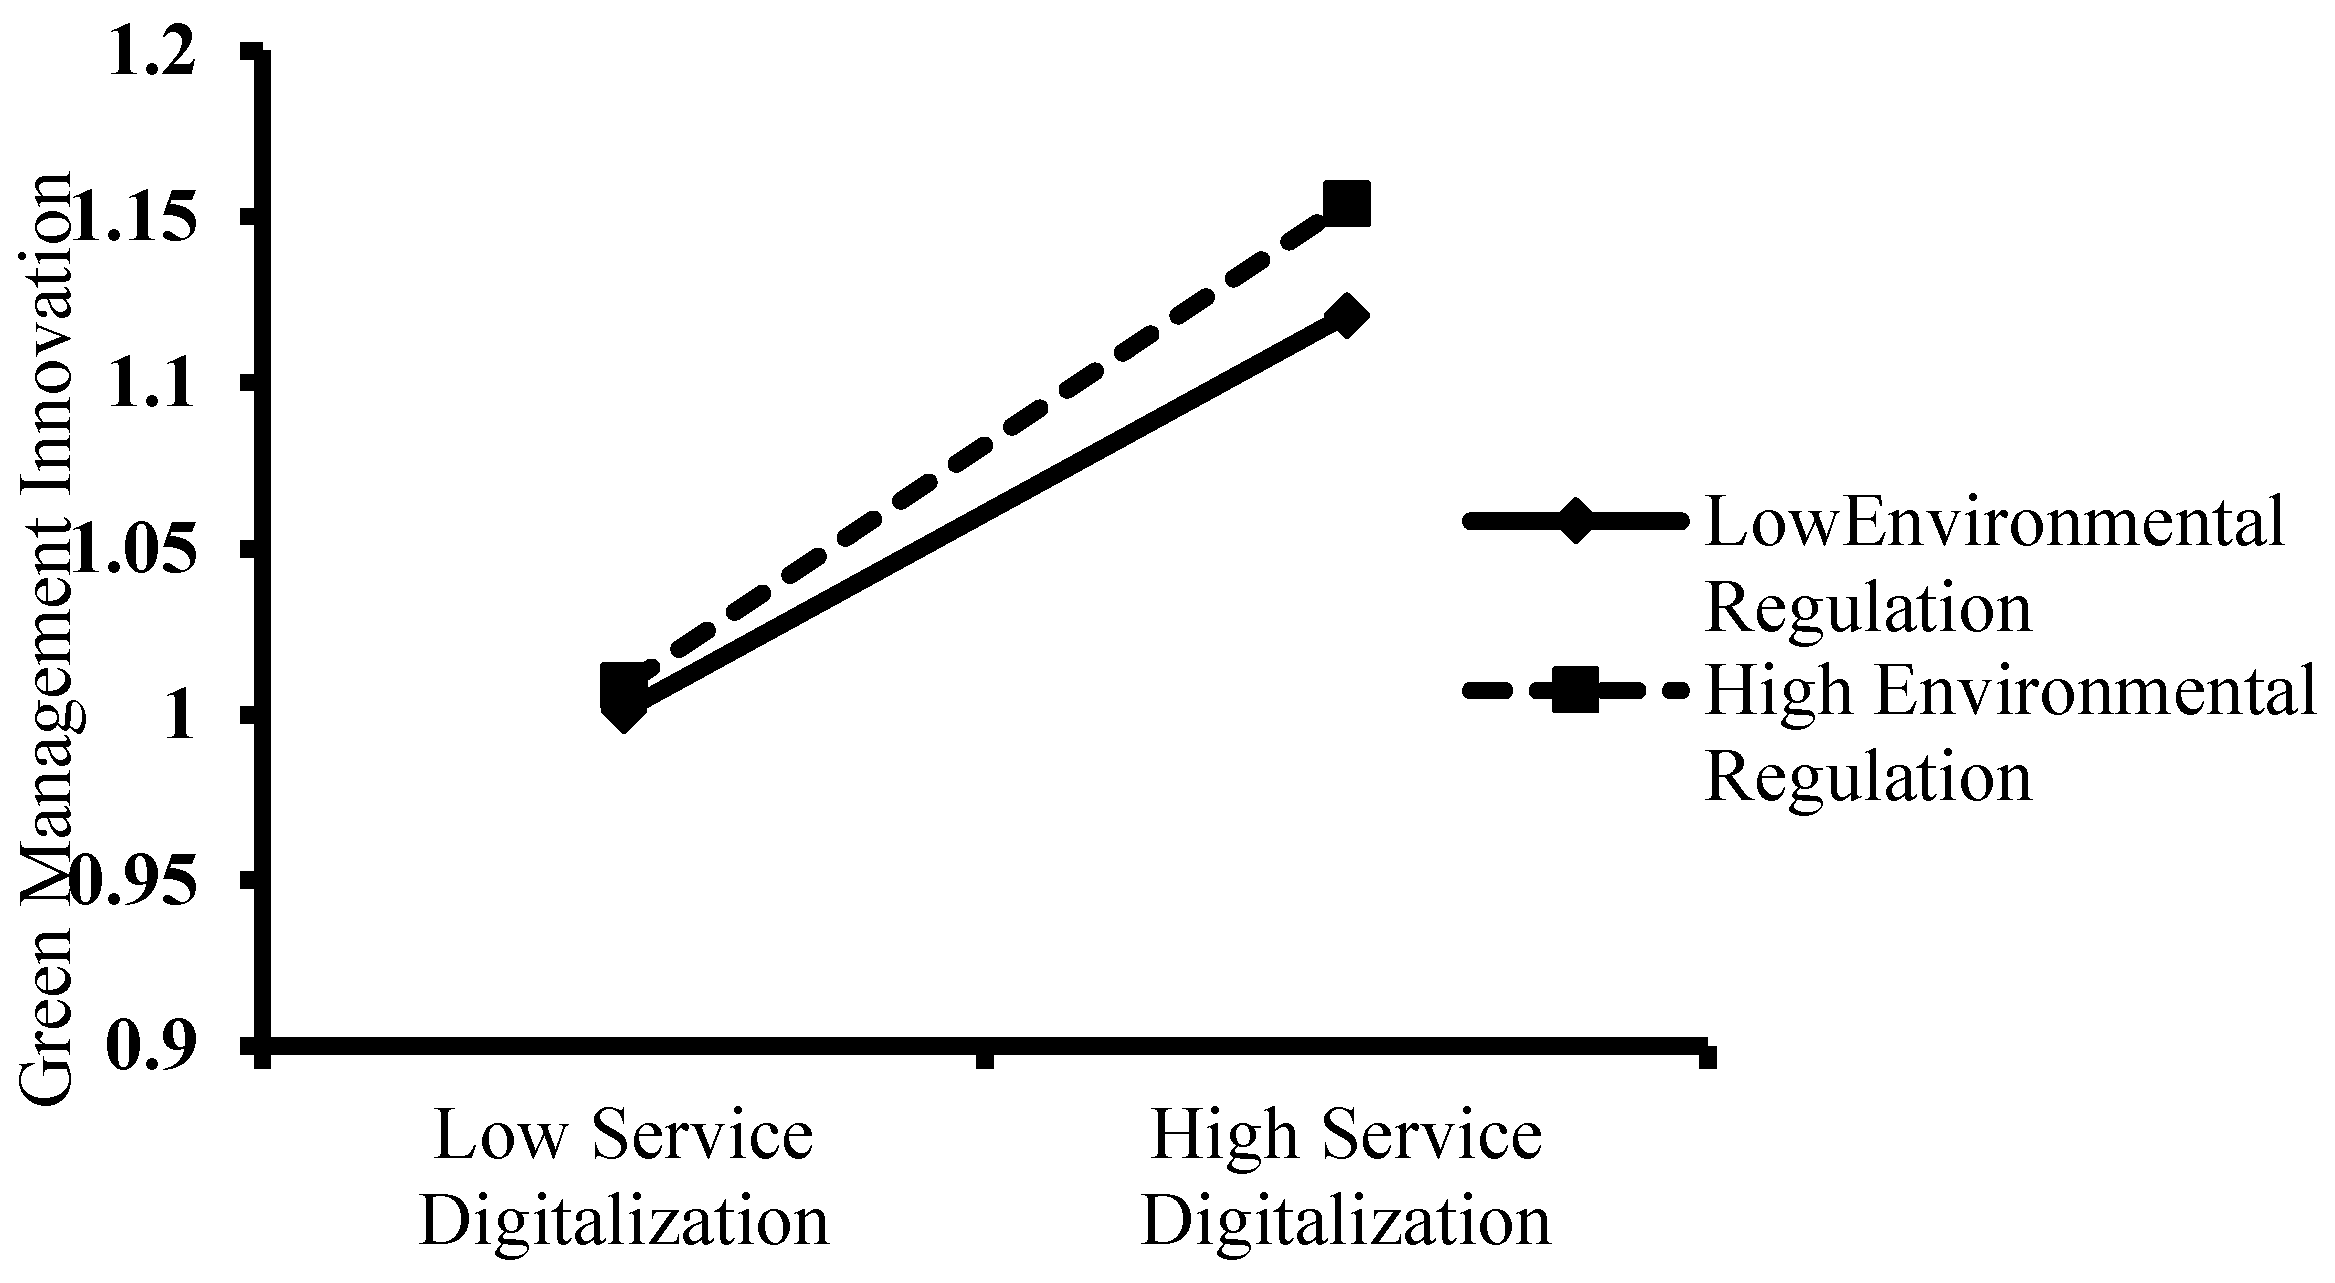
Figure 7.
The Moderating Effect of Peer Firms’ Green Innovation on the Relationship between Service Digitalization and Green Management Innovation.
Figure 7.
The Moderating Effect of Peer Firms’ Green Innovation on the Relationship between Service Digitalization and Green Management Innovation.
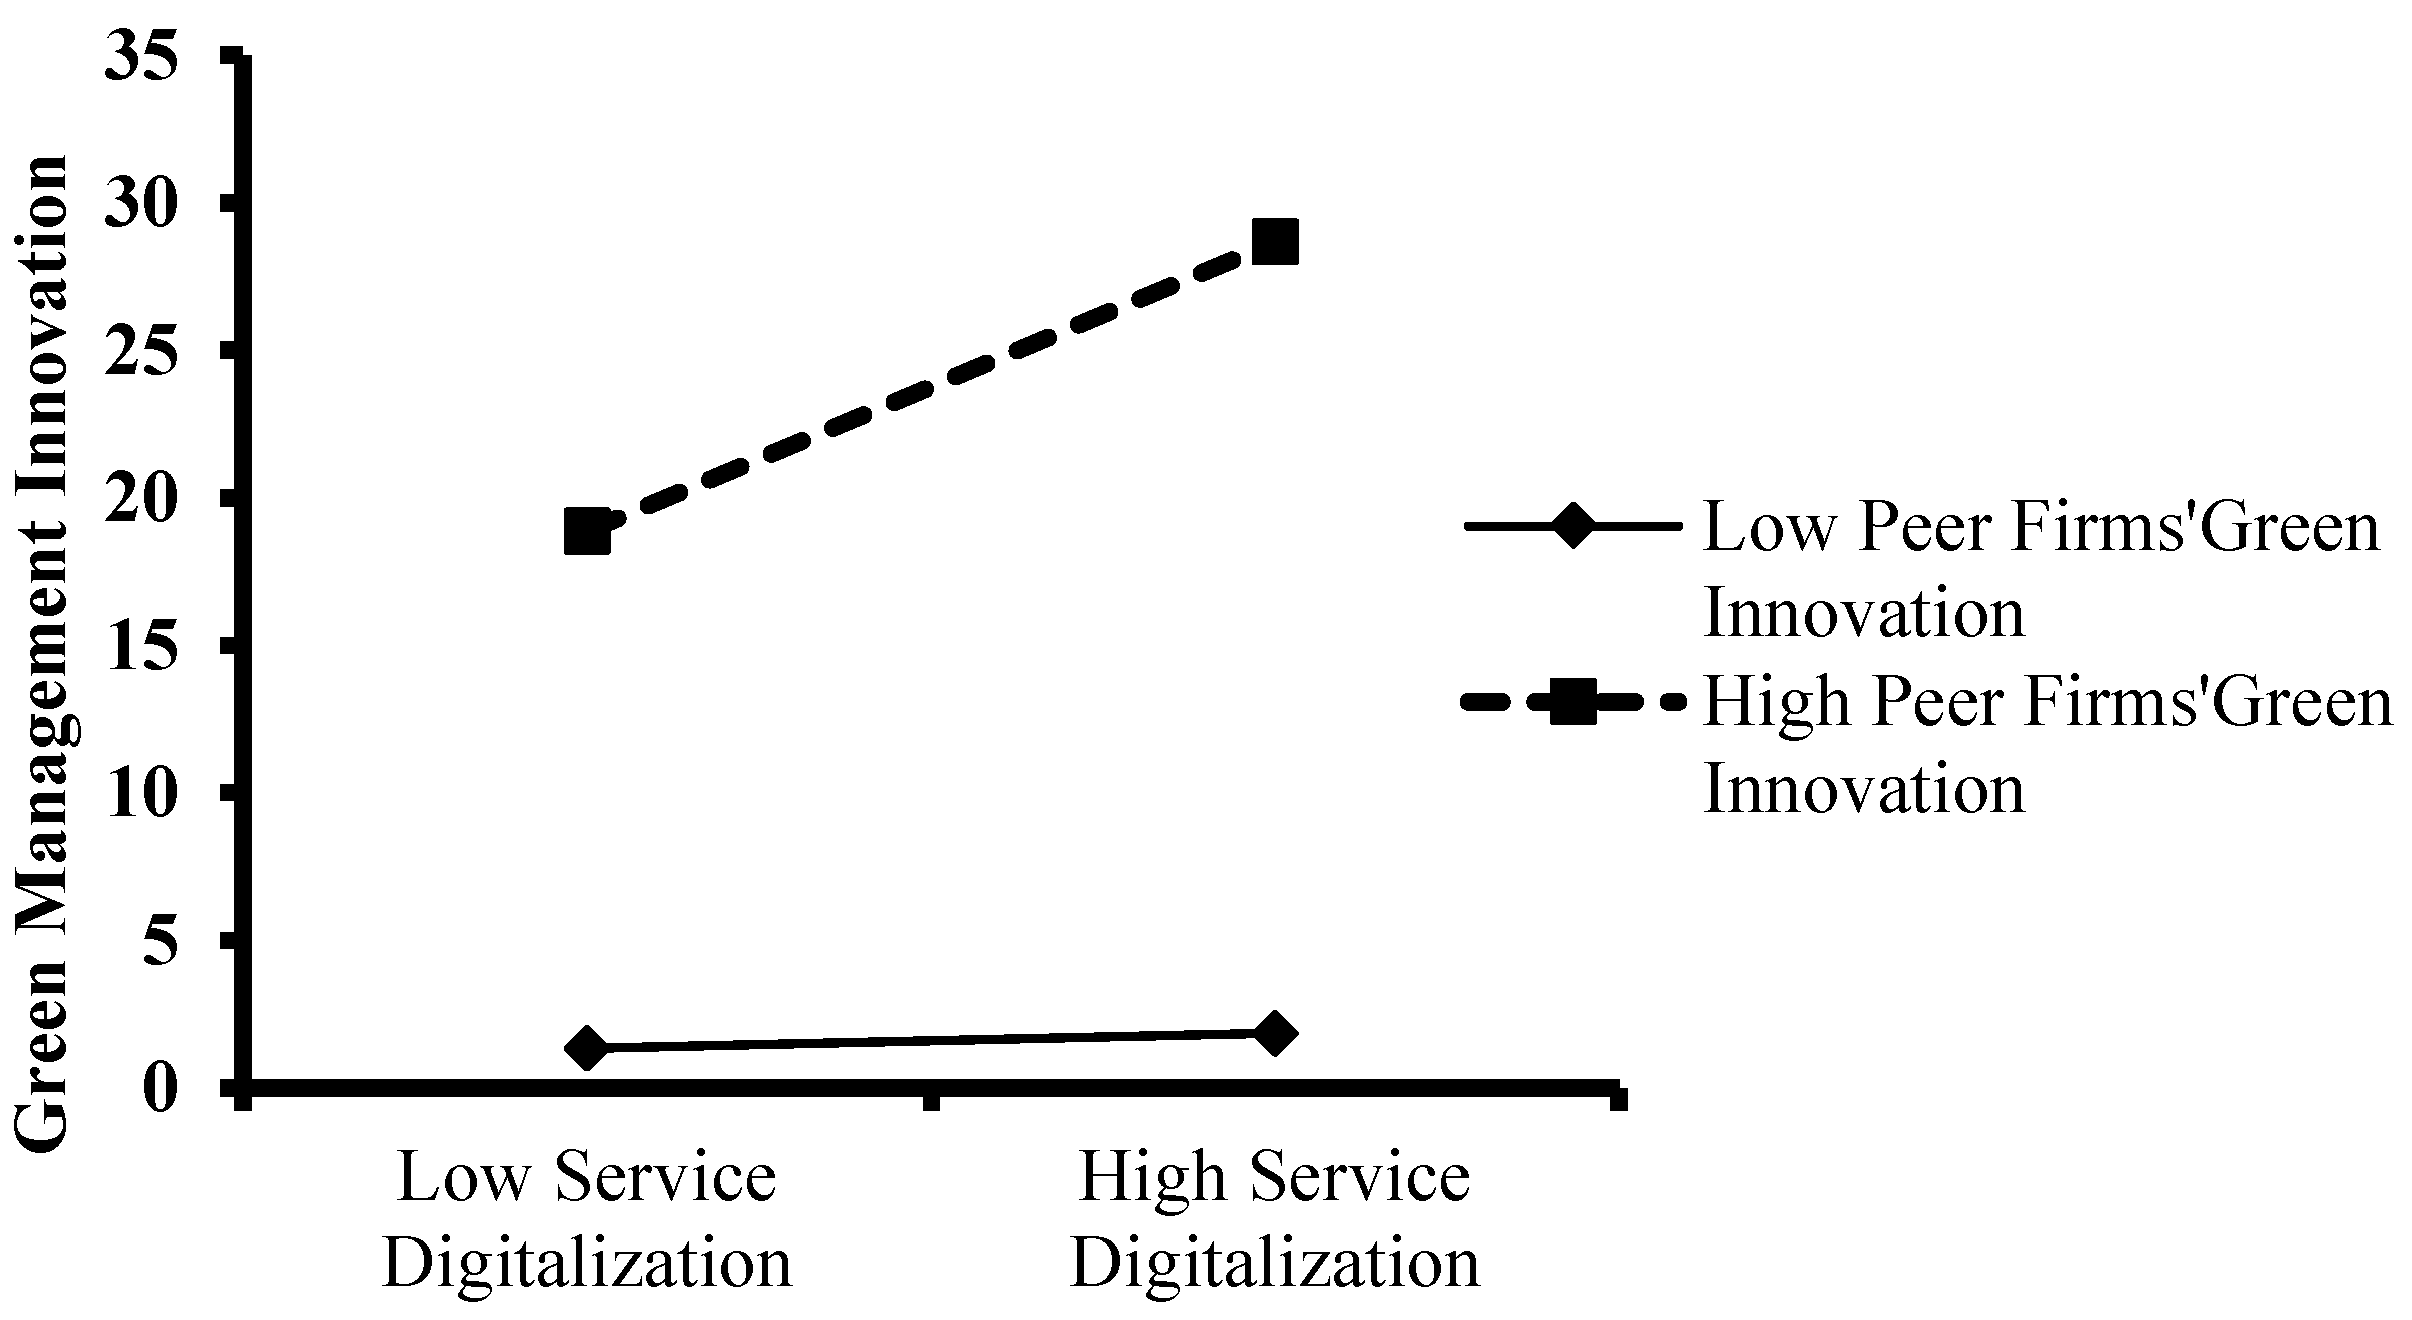
Table 1.
Variable Names and Definitions.
| Variables | Definition |
|---|---|
| Green technological innovation | The number of green invention patent application. |
| Green management innovation | The comprehensive scores obtained by the five indicators. |
| Production digitalization | whether the firm has undergone digital transformation in the production and manufacturing-related processes, Yes =1, No=0. |
| Service digitalization | whether the firm has undergone digital transformation in the marketing and customer service-related processes, Yes =1, No=0. |
| Environmental regulation | the proportion of industrial pollution control completed investment in the added value of the secondary industry. |
| Peer Firms’ Green Innovation | the average green innovation of the same year and industry, excluding the focus firm itself. |
| Chairman | whether the CEO also serves as the chairman, Yes =1, No=0. |
| CEO political connections | Whether the CEO is a representative of the National People’s Congress or the Chinese People’s Political Consultative Conference, Yes =1, No=0. |
| Equity concentration | The sum of the shareholding percentages of the top three shareholders. |
| Firm history | Total number of years since the firm established. |
| Firm performance | Return on assets (ROA) |
| HHI | Herfindahl Index is calculated by the firm’s market share in the industry based on the book value of its owners’ equity。 |
| Integration Index | The index of industry integration of informatization and industrialization. |
| Financial constraints | Asset-liability ratio. |
| State-owned shares holding ratio | The ratio of state-owned shares in the total capital stock. |
| Directors scale | Number of board directors. |
| CEO’s age | Number of years from the CEO’s birth to the sample year. |
| CEO’s education | Below a bachelor’s degree are represented by 0;a bachelor’s degree is represented by 1; a master’s degree is represented by 2; a doctoral degree is represented by 3. |
Table 2.
Descriptive Statistics.
| Variables | Mean | S.D | Max | Min |
| Green technological innovation | 1.667 | 6.396 | 0 | 49 |
| Green management innovation | 1.360 | 1.402 | 0 | 5 |
| Production digitalization | 0.501 | 0.5 | 0 | 1 |
| Service digitalization | 0.336 | 0.472 | 0 | 1 |
| Support digitalization | 0.577 | 0.494 | 0 | 1 |
| Environmental regulation | 0.202 | 0.162 | 0 | 2.451 |
| Peer firms’ green innovation | 2.396 | 4.031 | 0 | 27.261 |
| Production staff scale | 8.051 | 1.308 | 1.609 | 11.033 |
| Chairman | 0.245 | 0.43 | 0 | 1 |
| CEO political connections | 0.082 | 0.274 | 0 | 1 |
| Equity concentration | 48.611 | 20.144 | 0 | 87.71 |
| Firm history | 12.023 | 6.938 | 1 | 29 |
| Firm performance | 0.067 | 0.053 | -0.054 | 0.229 |
| HHI | 0.058 | 0.049 | 0.011 | 0.243 |
| Integration index | 49.385 | 5.754 | 38.34 | 62.1 |
| Financial constraints | 0.441 | 0.184 | 0.06 | 0.815 |
| State-owned shares holding ratio | 6.412 | 16.428 | 0 | 69.27 |
| Directors scale | 8.874 | 1.808 | 5 | 18 |
| CEO’s age | 49.836 | 6.367 | 30 | 75 |
| CEO’s education | 3.498 | 0.945 | 0 | 6 |
Table 3.
Correlation Analysis.
| 1 | 2 | 3 | 4 | 5 | 6 | 7 | 8 | 9 | 10 | |
| 1. Green technological innovation | 1 | |||||||||
| 2. Green management innovation | 0.113*** | 1 | ||||||||
| 3. Production digitalization | 0.042*** | 0.022 | 1 | |||||||
| 4. Service digitalization | 0.141*** | 0.026* | 0.339*** | 1 | ||||||
| 5. Support digitalization | 0.021 | 0.057*** | 0.500*** | 0.286*** | 1 | |||||
| 6.Environmental regulation | 0.049*** | 0.027* | -0.019 | -0.159*** | -0.02 | 1 | ||||
| 7. Peer Firms’ Green Innovation | 0.190*** | 0.021 | 0.135*** | 0.227*** | 0.065*** | 0.039*** | 1 | |||
| 8.Production staff scale | 0.181*** | 0.229*** | 0.198*** | 0.064*** | 0.153*** | 0.046*** | 0.103*** | 1 | ||
| 9. Chairman | 0.045*** | -0.067*** | 0.005 | 0.045*** | -0.004 | -0.065*** | 0.055*** | -0.055*** | 1 | |
| 10. CEO political connections | 0.074*** | 0.027* | -0.001 | -0.036** | 0 | 0.011 | -0.001 | -0.046*** | 0.225*** | 1 |
| 11. Equity concentration | 0.005 | 0.050*** | 0.022 | -0.049*** | -0.007 | -0.012 | 0.01 | 0.112*** | -0.031** | -0.007 |
| 12. Firm history | 0.041*** | 0.097*** | 0.186*** | 0.120*** | 0.256*** | 0.042*** | -0.015 | 0.334*** | -0.213*** | -0.141*** |
| 13. Firm performance | -0.026* | -0.037** | 0.008 | -0.028* | 0.001 | -0.103*** | -0.045*** | -0.222*** | 0.120*** | 0.047*** |
| 14. HHI | 0.008 | 0.013 | -0.037** | -0.119*** | 0.014 | 0.064*** | -0.027* | 0.248*** | -0.103*** | -0.051*** |
| 15. Integration Index | 0.027* | 0.017 | 0.434*** | 0.410*** | 0.411*** | -0.176*** | 0.167*** | 0.110*** | 0.062*** | -0.054*** |
| 16. Financial constraints | 0.132*** | 0.116*** | 0.018 | 0.029** | 0.036** | 0.078*** | 0.095*** | 0.461*** | -0.092*** | -0.036** |
| 17. State-owned shares holding ratio | 0.023 | 0.081*** | -0.035** | -0.011 | -0.029* | 0.028* | 0.029* | 0.123*** | -0.134*** | -0.045*** |
| 18. Directors scale | 0.063*** | 0.141*** | 0.01 | -0.052*** | -0.005 | 0.104*** | -0.040*** | 0.205*** | -0.161*** | -0.015 |
| 19. CEO’s age | 0.02 | 0.016 | 0.085*** | 0.069*** | 0.098*** | -0.028* | -0.035** | 0.097*** | 0.221*** | 0.001 |
| 20. CEO’s education | 0.104*** | 0.065*** | 0.017 | 0.091*** | 0.009 | -0.015 | 0.023 | 0.069*** | 0.02 | 0.034** |
Note:***p<0.01, **p<0.01, *p<0.05.
Table 4.
Regression Results for Green Technological Innovation.
| Variables | Model 1 | Model 2 | Model 3 | Model 4 | Model 5 |
| Production digitalization | 0.891*** | 0.636*** | 0.818*** | 0.777*** | |
| (0.301) | (0.158) | (0.164) | (0.163) | ||
| Service digitalization | 0.794*** | 0.392*** | 0.608*** | 0.547*** | |
| (0.325) | (0.143) | (0.149) | (0.150) | ||
| Production digitalization * Environmental regulation | 0.181* | 0.175* | |||
| (0.101) | (0.100) | ||||
| Service digitalization* Environmental regulation | 0.375*** | 0.394*** | |||
| (0.101) | (0.100) | ||||
| Production digitalization* Peer firms’ green innovation | 0.028 | 0.031 | |||
| (0.115) | (0.115) | ||||
| Service digitalization * Peer firms’ green innovation | 0.252** | 0.245** | |||
| (0.107) | (0.107) | ||||
| Environmental regulation | 2.301** | 2.385** | 0.306** | 2.335** | 0.365** |
| (1.014) | (1.012) | (0.148) | (1.011) | (0.148) | |
| Peer firms’ green innovation | 0.288*** | 0.284*** | 0.279*** | 0.965*** | 0.978*** |
| (0.045) | (0.045) | (0.045) | (0.178) | (0.178) | |
| Support digitalization | 0.507* | 0.208 | 0.075 | 0.071 | 0.060 |
| (0.296) | (0.303) | (0.124) | (0.125) | (0.124) | |
| Production staff scale | 0.185 | 0.092 | 0.087 | 0.113 | 0.108 |
| (0.208) | (0.209) | (0.208) | (0.209) | (0.208) | |
| Chairman | -0.060 | -0.082 | -0.148 | -0.079 | -0.145 |
| (0.359) | (0.358) | (0.357) | (0.358) | (0.357) | |
| CEO political connections | -0.889* | -0.838* | -0.813* | -0.869* | -0.843* |
| (0.463) | (0.461) | (0.460) | (0.461) | (0.460) | |
| Equity concentration | 0.004 | 0.007 | 0.005 | 0.004 | 0.002 |
| (0.014) | (0.014) | (0.014) | (0.014) | (0.014) | |
| Firm history | -0.359*** | -0.441*** | -0.405*** | -0.446*** | -0.411*** |
| (0.127) | (0.128) | (0.128) | (0.128) | (0.128) | |
| Firm performance | 8.305*** | 8.641*** | 8.173*** | 8.666*** | 8.203*** |
| (2.618) | (2.610) | (2.607) | (2.609) | (2.606) | |
| HHI | 8.601 | 8.987 | 9.633 | 9.178 | 9.835 |
| (6.170) | (6.150) | (6.136) | (6.171) | (6.159) | |
| Integration Index | 0.115 | 0.110 | 0.099 | 0.116 | 0.105 |
| (0.071) | (0.071) | (0.071) | (0.071) | (0.071) | |
| Financial constraints | 0.499 | 0.747 | 0.875 | 0.681 | 0.808 |
| (0.999) | (0.997) | (0.995) | (0.998) | (0.995) | |
| State-owned shares holding ratio | 0.001 | 0.001 | -0.000 | 0.001 | -0.000 |
| (0.008) | (0.008) | (0.008) | (0.008) | (0.008) | |
| Directors scale | 0.130 | 0.129 | 0.116 | 0.112 | 0.100 |
| (0.101) | (0.101) | (0.101) | (0.101) | (0.101) | |
| CEO’s age | 0.029 | 0.025 | 0.027 | 0.025 | 0.027 |
| (0.024) | (0.024) | (0.024) | (0.024) | (0.024) | |
| CEO’s education | 0.405** | 0.404** | 0.365** | 0.403** | 0.365** |
| (0.161) | (0.160) | (0.160) | (0.160) | (0.160) | |
| Constant | -9.066*** | -7.920** | -5.471* | -5.991* | -5.598* |
| (3.217) | (3.216) | (3.225) | (3.244) | (3.239) | |
| Year | Yes | Yes | Yes | Yes | Yes |
| Industry | Yes | Yes | Yes | Yes | Yes |
| R-squared | 0.080 | 0.087 | 0.092 | 0.089 | 0.094 |
Note:*p < 0.1;**p < 0.05;***p < 0.01.
Table 5.
Regression Results for Green Management Innovation.
| Variables | Model 1 | Model 2 | Model 3 | Model 4 | Model 5 |
| Production digitalization | 0.115* | 0.028 | 0.021 | 0.026 | |
| (0.069) | (0.036) | (0.037) | (0.037) | ||
| Service digitalization | 0.162** | 0.073** | 0.075** | 0.073** | |
| (0.074) | (0.034) | (0.035) | (0.035) | ||
| Production digitalization * Environmental regulation | 0.039* | 0.038* | |||
| (0.023) | (0.023) | ||||
| Service digitalization* Environmental regulation | 0.045* | 0.045* | |||
| (0.024) | (0.024) | ||||
| Production digitalization* Peer firms’ green innovation | -0.019 | -0.018 | |||
| (0.027) | (0.027) | ||||
| Service digitalization* Peer firms’ green innovation | 0.045* | 0.045* | |||
| (0.025) | (0.025) | ||||
| Environmental regulation | 0.100 | 0.120 | 0.018 | 0.123 | 0.017 |
| (0.232) | (0.232) | (0.033) | (0.232) | (0.034) | |
| Peer firms’ green innovation | -0.001 | -0.002 | -0.003 | -0.001 | -0.001 |
| (0.010) | (0.010) | (0.010) | (0.042) | (0.042) | |
| Support digitalization | 0.024 | 0.029 | 0.012 | 0.012 | 0.012 |
| (0.068) | (0.069) | (0.029) | (0.029) | (0.029) | |
| Production staff scale | 0.075 | 0.072 | 0.074 | 0.072 | 0.074 |
| (0.048) | (0.048) | (0.048) | (0.048) | (0.048) | |
| Chairman | -0.144* | -0.146* | -0.149* | -0.146* | -0.149* |
| (0.082) | (0.082) | (0.082) | (0.082) | (0.082) | |
| CEO political connections | 0.130 | 0.125 | 0.129 | 0.123 | 0.127 |
| (0.106) | (0.106) | (0.106) | (0.106) | (0.106) | |
| Equity concentration | -0.004 | -0.003 | -0.003 | -0.003 | -0.003 |
| (0.003) | (0.003) | (0.003) | (0.003) | (0.003) | |
| Firm history | -0.045 | -0.042 | -0.040 | -0.043 | -0.041 |
| (0.029) | (0.029) | (0.029) | (0.029) | (0.029) | |
| Firm performance | 1.299** | 1.322** | 1.272** | 1.316** | 1.266** |
| (0.598) | (0.597) | (0.598) | (0.598) | (0.599) | |
| HHI | -2.321 | -2.280 | -2.207 | -2.370* | -2.290 |
| (1.416) | (1.415) | (1.416) | (1.421) | (1.422) | |
| Integration Index | 0.019 | 0.019 | 0.019 | 0.018 | 0.018 |
| (0.016) | (0.016) | (0.016) | (0.016) | (0.016) | |
| Financial constraints | 0.261 | 0.261 | 0.268 | 0.264 | 0.271 |
| (0.228) | (0.228) | (0.228) | (0.229) | (0.229) | |
| State-owned shares holding ratio | 0.002 | 0.002 | 0.002 | 0.002 | 0.002 |
| (0.002) | (0.002) | (0.002) | (0.002) | (0.002) | |
| Directors scale | -0.001 | 0.002 | 0.002 | 0.001 | 0.001 |
| (0.023) | (0.023) | (0.023) | (0.023) | (0.023) | |
| CEO’s age | -0.001 | -0.001 | -0.001 | -0.001 | -0.001 |
| (0.006) | (0.005) | (0.006) | (0.006) | (0.006) | |
| CEO’s education | 0.045 | 0.041 | 0.040 | 0.042 | 0.040 |
| (0.037) | (0.037) | (0.037) | (0.037) | (0.037) | |
| Constant | 0.111 | 0.097 | 0.098 | 0.182 | 0.147 |
| (0.734) | (0.736) | (0.740) | (0.744) | (0.744) | |
| Year | Yes | Yes | Yes | Yes | Yes |
| Industry | Yes | Yes | Yes | Yes | Yes |
| R-squared | 0.051 | 0.053 | 0.054 | 0.053 | 0.054 |
Note:*p < 0.1;**p < 0.05;***p < 0.01.
Table 8.
Green innovation Variables on Financial and Environmental Performance.
| Variables | Model 1 | Model 2 | Model 3 | Model 4 | Model 5 |
| Tobin’s Q | ROA | Sales | Environmental performance | Environmental honors | |
| green technological innovation | 0.074** | 0.004** | 0.003** | 0.122 | 0.213*** |
| (0.032) | (0.002) | (0.001) | (0.078) | (0.054) | |
| green management innovation | 0.008 | -0.001 | -0.001 | 0.206*** | 0.566*** |
| (0.016) | (0.001) | (0.001) | (0.038) | (0.033) | |
| Production staff scale | 0.078* | -0.004* | -0.004** | 0.114 | 0.262*** |
| (0.042) | (0.002) | (0.002) | (0.102) | (0.049) | |
| Chairman | -0.098 | 0.007** | 0.004 | -0.111 | 0.269** |
| (0.065) | (0.004) | (0.003) | (0.156) | (0.114) | |
| CEO political connections | -0.243*** | -0.004 | 0.001 | -0.065 | -0.203 |
| (0.089) | (0.005) | (0.003) | (0.216) | (0.170) | |
| Equity concentration | -0.011*** | -0.000 | -0.000 | 0.013** | -0.004 |
| (0.003) | (0.000) | (0.000) | (0.006) | (0.003) | |
| Firm history | -0.078*** | 0.005*** | 0.003*** | 0.087 | -0.002 |
| (0.027) | (0.002) | (0.001) | (0.065) | (0.008) | |
| HHI | -0.683 | 0.099 | 0.115** | -0.305 | -2.052* |
| (1.369) | (0.077) | (0.053) | (3.308) | (1.201) | |
| Integration Index | 0.038*** | -0.001** | -0.001*** | 0.071** | 0.047 |
| (0.012) | (0.001) | (0.000) | (0.030) | (0.036) | |
| Financial constraints | -0.083 | -0.019* | -0.041*** | 0.681 | 0.376 |
| (0.188) | (0.011) | (0.007) | (0.454) | (0.320) | |
| R&D Investment Intensity | 0.010 | -0.004*** | -0.003*** | 0.030 | -0.026 |
| (0.010) | (0.001) | (0.000) | (0.025) | (0.019) | |
| Constant | 0.999* | 0.186*** | 0.180*** | -4.761*** | -6.840*** |
| (0.550) | (0.031) | (0.021) | (1.329) | (1.620) | |
| Year | Yes | Yes | Yes | Yes | Yes |
| Industry | Yes | Yes | Yes | Yes | Yes |
| R-squared | 0.091 | 0.050 | 0.074 | 0.060 | 0.085 |
Note:*p < 0.1;**p < 0.05;***p < 0.01.
Disclaimer/Publisher’s Note: The statements, opinions and data contained in all publications are solely those of the individual author(s) and contributor(s) and not of MDPI and/or the editor(s). MDPI and/or the editor(s) disclaim responsibility for any injury to people or property resulting from any ideas, methods, instructions or products referred to in the content. |
© 2024 by the authors. Licensee MDPI, Basel, Switzerland. This article is an open access article distributed under the terms and conditions of the Creative Commons Attribution (CC BY) license (http://creativecommons.org/licenses/by/4.0/).
Copyright: This open access article is published under a Creative Commons CC BY 4.0 license, which permit the free download, distribution, and reuse, provided that the author and preprint are cited in any reuse.


