
Submitted:
20 August 2024
Posted:
21 August 2024
You are already at the latest version
Abstract
The social, environmental and scientific significance of the urban climate has shaped a research stream at Universitat Jaume I’s Climate Lab. Previous research has found higher temperature trends at urban observatories. This study examines in depth the features of the urban environment and the thermal behaviour of land use and land cover and the changes which have taken place. The CORINE Land Cover database was used to delimit the primary Land Use Land Cover (LULC) and its changes between 1990 and 2018. Once this had been established, land surface temperatures (LSTs) between 1985 and 2023 were retrieved from the Landsat database available on the Climate Engine website. Analysis of the primary land cover showed the greatest thermal increase in artificial surfaces, especially in industrial, commercial and transport units which are common on their outskirts. These areas also have the highest temperatures on a monthly basis with the biggest differences occurring in the summer. The results are less clear for urban fabrics and agricultural areas due to their diversity and complexity. The study concludes that urban growth and its commercial and industrial environment has an undeniable effect on the temperatures recorded by urban observatories and enables better decision-making when setting up weather stations for a more detailed time study of the urban heat island (UHI).
Keywords:
urban climate
; land surface temperature
; LST
; CORINE Land Cover
; Landsat
; land use and land cover (LULC)
1. Introduction
Urban climate is a topic of unquestionable scientific interest. From a socio-demographic standpoint, although cities take up only a small part of land, over 50% of the world’s population live in them [1] and it is expected that by 2050 almost seven out of ten people will do so [2]. Millions of people’s health and wellbeing may be impacted by rising temperatures and the presence of pollutants [3,4,5]. Indeed, urban sprawl has a wide range of consequences for the environment due to the increase in paved surfaces, for health with rising mortality rates, and for the economy owing to higher energy demand [6]. Just for good measure, the urban climate also has a bearing on one of the scientific topics to have generated the largest (if not the most) number of studies: climate change. The aforementioned impact of urban climate on temperatures is the most prominent Achilles heel of the climate change hypothesis. The principal observatories tracking the evolution of global temperatures were located in large and rapidly growing cities and have been swallowed up in a thermal bubble known as the Urban Heat Island (UHI), which is the biggest downside of urbanisation [7]. These two factors together have led to an exponential increase in research on UHI in recent decades [8,9], especially since 2012 [10]. The topic and its beginnings can, of course, be traced back to L. Howard’s study of London in 1820 [11], more than two centuries ago, and there have been frequent reviews of articles on the subject [10,12].
UHI is defined as the presence of higher temperatures in urban areas versus non-urban areas [13]. The latter areas, defined as rural, are a blend of distinct agricultural areas and equally diverse vegetation spaces in mid-latitude countries [14]. Higher urban temperatures are the outcome of two heat sources: firstly, urban structures which store and radiate the sun’s heat, and secondly anthropogenic heat sources [15]. Concerning the first source of heat, namely solar heat storage and emission, urbanisation involves replacing soil and vegetation with impervious surfaces and urban structures [16]. Specifically, asphalt and concrete have a high thermal mass, streets flanked by tall buildings on both sides are low-ventilation canyons, and air conditioners and vehicles are sources of heat [10]. Other authors rightly add the alteration of radiation exchanges between the surface and the atmosphere due to the rise in pollutants and aerosols [11]. A more comprehensive list of processes taking place in urban areas would include anthropogenic heat production; the reduction of latent heat loss due to paved surfaces, efficient drainage systems and sparse vegetation; little loss of sensible heat owing to lower wind speed; increased absorption of solar radiation in urban canyons; a decrease in outgoing long-wave radiation; increased heat storage in building materials caused by their high capacity to retain heat during the day and release it at night; and re-emission of atmospheric long-wave radiation to the ground due to the greater presence of pollutants [17].
Satellite imagery is an outstanding resource for studying UHI to such an extent that most of the recent research on this topic has tapped into it [11]. GOES data have been harnessed to study the urban area of Boston [18], while the urban area of Phoenix (Arizona), also in the United States, was analysed with high-resolution Quickbird imagery [9]. MODIS LST data are the basis for the UHI study of twelve Indian cities with over 2.5 million inhabitants [19] and a study of 717 cities worldwide [20]. Landsat data are a standard resource in LST studies [21,22,23,24,25,26,27,28], owing to their high spatial coverage and resolution, free access and long time series [29]. Although there are limitations and uncertainties when deriving LSTs from Landsat imagery [30], it does allow data to be obtained every 30 metres, a spatial resolution which cannot be achieved with weather observatories [1]. On the other hand, Landsat data are acquired every 16 days and are exclusively diurnal which means that the night-time intensity of UHI is not captured [25]. This has led to strategies to estimate night-time UHI by drawing on satellite imagery as well [13].
The intensity and spatial pattern of UHI hinge on the characteristics of the land surface which are heavily influenced by land use/land cover (LULC) [3,31]. Each LULC has a different effect on temperature as it presents unique optical spectrum, humidity and temperature properties [32]. It thus makes sense to link remote sensing data with this spatial resolution to the various land covers [20,23,28,33,34]. The combination of Landsat satellite and CORINE Land Cover data has been used to obtain LST data and study UHI, albeit with a limited number of images [24], as the authors had to process them to derive LST.
While a large number of UHI studies have investigated cities in China, the United States and Canada [10], there is no shortage of studies in Spain [4,17,24,27,35,36,37,38,39,40,41,42,43,44,45,46,47], where UHI is equally significant as the country’s urban population stood at 82% in 2023 according to World Bank figures [48]. Spain is also one of the European countries with the greatest development of artificial cover [27,43]. Indeed, some references overlap with the one presented here in their study area, albeit with a different perspective, namely weather stations and the Spanish Land Use and Land Cover Information System (SIOSE in Spanish) database [49].
This study, enabled by the Climate Engine platform, allows for a long time period which is a prerequisite identified in LST studies with Landsat images [50]. The study’s objectives were to:
- determine the variation in land cover and land use around the main urban areas between 1990 and 2018
- determine the main flows between the two dates
- derive monthly and annual temperatures for each land cover
- calculate thermal trends
- ascertain the monthly thermal behaviour of the main land covers
2. Materials and Methods
2.1. Study Area
The study area was the main urban nuclei in the regions of Valencia and Murcia on the Spanish Mediterranean coast. These cities were the four provincial capitals—from north to south, Castellon, Valencia and Alicante in the Valencian Region, and Murcia in the Region of Murcia, as well as Elche, the third largest urban area in the Valencian Region (Figure 1) which we added.
The region has seen a significant increase in urban space, already demonstrated in previous studies [51] using aerial photographs comparing the 1956 American flight by the Army Map Service of the United States Department of Defense [52] and the 2018 images from the National Plan of Aerial Orthophotography (PNOA in Spanish) available at the Geographic Information National Centre (CNIG in Spanish) [53]. The first advance in this new research consisted of going back a significant step in time by georeferencing the urban maps of the provincial capitals dated 1910 [54], also available electronically at the CNIG. This gives a fairly robust idea of the urban development of the main cities over the last hundred years (Figure 2).
In Spain, the smallest administrative division is the municipality, below the regions and provinces. Table 1 shows the official population data by municipality, even though urban areas in large cities stretch beyond these limits.
While municipal data can provide a rough estimate, this study went beyond these administrative boundaries. After a first test, taking municipal boundaries as a study framework was discarded given the sometimes fringe location of the official AEMET observatories within the administrative boundaries, as is the case of the Castellon-Almazora observatory (Figure 2), and the enormous disparity in size of the municipalities: from 142.7 km2 in Castellon and Almazora and 136 km2 in Valencia, the areas increase southwards, rising to 202 km2 in Alicante and 325.5 km2 in Elche before culminating in 885 km2 in Murcia, one of the largest municipalities in Spain. The geographical context in which urban areas stretch across municipal boundaries prompted us to draw a polygon centred on operational urban observatories at a scale of 1:75000, giving an area of about 417 km2 for each urban area; this enabled us to quantify the artificial growth around the observatories whilst keeping a rural environment and thus to ascertain the impact of major land use changes on temperatures.
2.2. Materials
Two databases were harnessed in this study. Firstly, CORINE Land Cover, with its five available versions, 1990, 2000, 2006, 2012 and 2018. 1990 [56] and 2018 [57], were used to observe the start and end points of the series. This facilitated an analysis of changes in land use and land cover in recent decades in the surroundings of urban observatories.
CORINE classifies the terrain into various land covers with a degree of detail at three levels, from the most generic Level 1 to the most detailed Level 3. Level 1 has four categories: artificial surfaces, agricultural surfaces, forest and seminatural areas and wetlands, which are expanded into 15 subcategories at Level 2 (Table 2) and 44 at Level 3 [58]. In this paper, Level 2 (intermediate level) was used to distinguish between urban and industrial areas while also keeping the number of categories to a minimum.
The figures for urban growth (Figure 2) were based on the images from the American flight series B (1945-1946), produced by the Army Map Service of the United States Department of Defense at a scale of 1:32,000, and frames from the 2018 PNOA flight. Both are available at the CNIG via Web Map Service (WMS) and through the CNIG download centre.
The other database used was Land Surface Temperatures (LSTs) measured by the Landsat satellite constellation [59]. Although the series began in 1972 [22], Landsat 5,7,8,9 have completed a database of surface temperatures since 1984 with a resolution of 30 metres, accessible as a result of the Climate Engine project [60,61]. This is one of several applications which have built in Google Earth Engine (GEE) and can play a significant role in climate monitoring [62]. Some papers have already made progress in using Climate Engine and LULC to study UHI [63,64,65,66]. To the best of the authors’ knowledge based on the citation list of the reference article [60], this is one of the first UHI studies using Climate Engine and LULC and a pioneer in cities in Europe and, therefore, in Spain. A study on several cities in Bulgaria was restricted to establishing the correlation between NDVI and LST [67].
2.3. Methods
At the National Centre for Geographic Information’s download centre [68], CORINE data were retrieved in the form of two multipolygon layers, one for the Peninsula-Balearic Islands and the other for the Canary Islands. Once the Peninsula-Balearic Islands layer had been extracted, the data were read, analysed and displayed using R software packages (Table 3).
The first step was to download and read the files with the information from the CORINE Land Cover database stored with EPSG code 25830. EPGS is the initialism for “European Petroleum Survey Group” [69], originally from the oil industry and nowadays used as a reference. EPSG 25830 corresponds to the reference system ETRS89 projection UTM zone 30N. Both files from 1990 and 2018 were cropped with the administrative boundaries of the regions of Valencia and Murcia for better, faster handling. The administrative data were extracted with the R geodata package. Their reference system is geographic, WGS84 (EPSG 4326), so they were first transformed to the ETRS89/EPSG 25830 of the CORINE Land Cover layers. A legend was also added with the levels of the CORINE Land Cover layers and a colour palette designed for the maps.
QGIS software was used firstly to reference the 1910 urban maps, and secondly to visualise the data and define the study area in each urban nucleus. These areas, one for each urban area in the study, were used to crop the CORINE Land Cover study areas. The next step, again with R, consisted of intersecting these 1990 and 2018 LULC areas. These are the layers of flows between LULC which obviously include polygons where there have been changes and others where LULC has stayed the same. These layers were dissolved to join the sectors in the same flow. The area was then calculated. These layers were used in the flow graphs.
There were around a hundred flows between land use categories for each of the five urban areas and the most significant ones with a surface area of over 4-4.5 km2 were selected. This simplified the analysis by avoiding dozens of land use changes in a very small area. Other lesser flows were added to these main ones to complete the table of trends and the urban area as a whole, the abovementioned polygons measuring some 145 km2 which were smaller in area in the cases of Castellon, Valencia and Alicante that included marine portions.
The next step, consisting of retrieving LST data from the Climate Engine website [61,70], was entirely manual and provided data from a point or an area. The LULC change layer for each urban area was saved in shapefile format with the polygons of each land use change. This is the format supported by the website. The intricacies of the boundaries prevented downloading the data for each polygon and the entire period of available years (1984-2023) in a single go. Up to five downloads per polygon (445 downloads in total) had to be made, a tedious yet necessary process. To prevent errors when selecting and assigning polygons, the process was performed following prior visualisation of the polygons in QGIS software. Data for 1984 have been eliminated since their records begin in the month of April.
Once the temperature data had been obtained, 1,000 observations per urban area were randomly sampled to check that the data corresponded to the correct flows. This was followed by a twofold process consisting of locating the outliers and their imputation by means of the capping method. This method replaces the upper outliers with the 95th percentile value and the lower ones with the 5th percentile. Next, temporary reference files were created to locate the months with no Landsat images and therefore no data available. The missing data were replaced by the Weight Moving Average method based on the two closest observations (Table 4).
3. Results
There is a difference of almost forty years between the first (1990) and the most recent publication of CORINE Land Cover data (2018). These four decades brought sweeping changes to this flat, coastal and vibrant territory led by tourism [71] and a growing population [72]. First, these changes will be analysed before looking at their impact on surface temperatures.
3.1. LULC in 1990 and 2018 in Castellon
The urban area of Castellon is the most northerly of the areas analysed. It is a flat area, spreading out across the Mijares flood plain and delta and bounded by low mountainous zones. In administrative terms, to the north of the River Mijares there is the municipality of Castellon, the provincial capital, which housed the historical observatory until 1975 in a secondary school in the town centre, and the municipality of Almazora, where the observatory is still operating in the Mijares industrial area close to the river of the same name. To the south and by population, there is the urban area of Villarreal whose industrial park is connected to the west to Onda and to the south to Alquerias, a route which is rounded off with Burriana which covers the southern side of the Mijares delta.
Permanent crops, the typical orange trees of the Valencian Region, were the main cultivation in both 1990 and 2018. In 1990, at 244 km2 they accounted for 76% of the surface area, a figure which by 2018 had fallen to 189 km2 or 58.9%. Heterogeneous agricultural areas also decreased from 23 km2 to 13 km2. The most striking increases are in two categories of artificial surfaces, namely the urban fabric and industrial, commercial and transport units. Each gained some 21 km2 to reach 40 km2 and 29 km2, 12.6% and 9%, respectively. The historical observatory located in the Francisco Ribalta secondary school is in the provincial capital’s city centre. Although records began in 1879, the first years have been lost and they have only been preserved since 1911. Hence, it was always surrounded by an urban environment which has steadily grown as shown by the 1990 and 2018 maps (Figure 3). Indeed, an almost continuous urban-industrial environment has emerged running from the coastal strip of Castellon and Almazora through the capital and extending towards Villarreal where it splits into two arcs to the west and south. This growth has surrounded the current Castellon-Almazora observatory, originally on a small industrial estate which is now much larger.
As Figure 4 shows, permanent crops remained dominant, yet artificial surfaces, both urban fabric and also industrial, commercial and transport units (16 km2 each), had grown at their expense in the urban-industrial continuum described above. The new urban areas wrested from permanent crops equal the urban fabric of 1990. Artificial surfaces have also taken territory from other agricultural areas and natural vegetation, albeit to a much lesser extent. This includes the almost 5 km2 of urban fabric built in what used to be heterogeneous agricultural areas. The abandonment of orange groves is well documented by their reversion to minor uses such as pastures, heterogeneous agricultural areas and scrub and/or herbaceous vegetation associations.
3.2. LULC in 1990 and 2018 in Valencia
The urban area around the city of Valencia studied here is the main part of the regional capital, leaving aside the southern section where l’Albufera Natural Park is located. The city of Valencia was initially on the southern bank of the River Turia, a few kilometres from the coast. However, urban growth over the course of the 20th century meant that the city reached the coastline (Figure 5). The weather observatory was set up in the University of Valencia’s La Nau building in the original city location and operated between 1859 and 1937. The baton was taken up by the current observatory in the then new urban areas to the north of the old Turia riverbed in Viveros Park, defined by the CORINE Land Cover base as an artificial, non-agricultural vegetated area.
Urban and industrial development spread in other directions following the main communication routes: to the west towards Madrid and to the south towards Alicante. In 1990, there were three main agricultural areas around Valencia: permanent crops, arable land and heterogeneous agricultural areas. The urban counterpoint to the famous “Huerta de Valencia” market garden zone was the 61 km2 of urban fabric and 26 km2 of industrial, commercial and transport units. By 2018, these agricultural areas had lost 55 km2 with the main beneficiaries being the artificial sectors, especially industrial, commercial and transport units. In this year, artificial surfaces made up 48% of Valencia’s urban environment compared to 32% in 1990. The territorial transfers are more complex in Valencia since, as noted above, there were three agricultural areas in the “Huerta de Valencia” and all three helped to extend new urban, commercial and industrial developments. Industrial, commercial and transport units took more than 10 km2 from permanent crops, almost 8 km2 from arable land and just over 5 km2 from heterogeneous agricultural areas, in total more than 23 km2, which accounts for the 100% increase in their size. The urban fabric also grew at the expense of these agricultural areas, albeit to a lesser extent (Figure 6).
3.3. LULC in 1990 and 2018 in Alicante
Alicante is the most distinctive Valencian provincial capital in terms of its location, set in the arid lands of the south and on the coast. Its city hall is barely 190 metres in a straight line across the famous Alicante Esplanade from the port, specifically from the plaque showing the 0-metre reference level of Spanish cartography. Its closeness to the coast might be explained by the protective presence of two imposing castles, San Fernando and Santa Barbara. The plain they overlook has seen the expansion of the capital of Alicante and the successive allocation of its historical weather observatories: Asylum Garden (1855-1875), Former Provincial Secondary School (1876-1938) and Garden City, since 1938 and still in operation. As its name suggests, it is in a small area of discontinuous urban fabric, barely 130 metres from the northern edge of Alicante’s urban fabric. Between 1933 and 1938, the Provincial Secondary School’s observatory worked alongside another which was first set up in the seismological centre and later in the aforementioned San Fernando Castle.
Two agricultural areas predominated around Alicante in 1990: permanent crops (53 km2), especially fruit trees, and heterogeneous agricultural areas (135 km2). Evidence of its location in the more arid southeast was the 54 km2 taken up by scrub and/or herbaceous vegetation associations. Meanwhile, artificial surfaces had 33 km2 in urban fabric, namely Alicante’s urban nucleus with expansion to the northwest in the neighbouring municipality of San Vicente del Raspeig and towards the north in the population nuclei of Muchamiel and San Juan, plus the Alicante and El Campello coastal strip. The impact of tourism left its mark. The 9 km2 of industrial estates were scattered across Alicante and San Vicente (Figure 7).
Almost 40 years later, artificial surfaces had grown significantly, especially in the north. They had practically overrun the municipality of San Vicente, to the extent that Alicante’s neighbouring town experienced a similar expansion. The coastal strip had become an urban continuum. Urban fabric stood at almost 70 km2, 23.5% of the territory, while industrial, commercial and transport units covered just over 20 km2 (Figure 8).
The once predominant heterogeneous agricultural areas divided their land especially into urban areas (27.2 km2), primary uses, such as pastures (25.9) and scrub and/or herbaceous vegetation associations (28.1). The urban fabric rounded off its growth at the expense of another agricultural cover, permanent crops. Industrial, commercial and transport units increased by taking space away from heterogeneous agricultural areas, permanent crops and scrub and/or herbaceous vegetation associations. There were significant territorial transfers between non-artificial surfaces. In addition to those mentioned above originating in heterogeneous agricultural areas, there was also the flow from scrub and/or herbaceous vegetation associations to pastures and from permanent crops, with heterogeneous agricultural areas finally as beneficiaries. There were other flows, under 10 km2, from heterogeneous agricultural areas to permanent crops or from permanent crops to pastures or scrub and/or herbaceous vegetation associations, reflecting the prevalent decline in agriculture on the Mediterranean coast in general [73] and in the province of Alicante in particular [74] (Figure 8).
3.4. LULC in 1990 and 2018 in Elche
The municipality of Elche, which is next to Alicante, lies on the same flat land deposited by the tertiary seas. Indeed, Alicante’s El Altet airport, one of the busiest in Spain as it welcomes tourist flows to the sunny southeast [75], is in the municipality of Elche. It is here that one of the weather observatories still in operation is located. In this respect, Elche has no historical records prior to the beginning of the 20th century, yet it does have three weather stations which began taking measurements around the middle of the last century: one of them in the city expansion area, on the left bank of the Segura River; another on the edge of the historic centre on the right bank; and a third, Elche-Campo Agrícola, which as its name suggests is on land which was turned from a heterogeneous agricultural area into an industrial, commercial and transport unit.
As was to be expected and just like in nearby Alicante, heterogeneous agricultural areas were dominant here in 1990 at 214 km2, slightly over half of the territory. By 2018, however, they had shrunk to 111 km2, meaning that by then they only accounted for a quarter. This is still a striking figure for a single cover, yet it does speak to a sharp decline. Next in line are scrub and/or herbaceous vegetation associations (86 km2) and two other agricultural areas, permanent crops and arable land. Interestingly, there are 15 km2 of wetlands in the Santa Pola salines and El Hondo lagoons. In the late 20th century, the urban fabric of Elche together with neighbouring parts of Santa Pola on the coast and Aspe and Crevillente inland covered 21 km2 while industrial, commercial and transport units added almost 6 km2 of artificial surfaces to the area (Figure 9).
By 2018, the urban fabric had grown to almost 50 km2 and the industrial and commercial part was over 20 km2. The urban-industrial expansion follows a clear linear west-east trend alongside the communication routes between Murcia and Alicante. Growth is more urban towards the coastal and, therefore, tourist area of Santa Pola (Figure 9). This artificial growth took place to the detriment of permanent crops and heterogeneous agricultural areas since scrub and/or herbaceous associations were maintained, and arable land even increased (Figure 10).
3.5. LULC in 1990 and 2018 in Murcia
Murcia extends the flat lands where the communication routes run towards the eastern Andalusian coast. However, the city is far from the sea, dominating its fertile “huerta” (market garden area). A series of mountain ranges herald the Betic elevations to which they belong and in fact have the same characteristic southwest-northeast alignment. There have been many ups and downs in weather measurements. The first observatory was founded in 1856, in the very characteristic location of the Provincial Secondary School, and the measurements continued until 1954 when they were switched a little further north in the urban nucleus to the university campus. This observatory’s life was extremely short and in 1967 recordings began in the Vistabella neighbourhood. Although this observatory is still in operation, it is restricted to temperature and rainfall values as in 2000 the main weather centre was relocated to the boundary of the Guadalupe district.
The overwhelming agricultural ascendancy in these flat lands on the shores of the Mediterranean is a constant and Murcia is no exception. Permanent crops at 28.6% and heterogeneous agricultural areas at 38.1% account for two thirds of this territory. They are made up of the northern part of the municipality of Murcia plus a small sector of Santomera in the north-eastern corner together with, in the north-western part and in an anti-clockwise direction, part of Molina de Segura and almost the entirety of the municipalities of Alguazas and Las Torres de Cotillas. The jigsaw is rounded off with Alcantarilla, wholly surrounded by Murcia. The agricultural landscape was completed by the meagre 17 km2 of arable land, barely 4% of the area. 49 km2 were taken up by scrub and/or herbaceous associations and 11 km2 were open spaces with little or no vegetation, the highest figure in the five urban areas. These spaces with little or no vegetation stand in contrast to 16.6 km2 of forests. Although the south is more arid, the Murcia area is the only one to host some mountainous terrain, specifically the Sierra de Carrascoy. The urban fabric covered an area of almost 35 km2, especially the urban nucleus of the capital and the distinct and numerous districts were lined up in the same direction as the plain. The picture was finished by 8 km2 of industrial, commercial and transport units, mainly in Alcantarilla and its neighbouring areas, and along the road between Murcia and Molina de Segura (Figure 11).
These industrial areas had increased by 248%, occupying 28 km2 in 2018. They had grown from less than 2% to almost 7% and mushroomed around most of the urban nuclei, forming a network to the northwest of the capital of Murcia. The urban fabric took up 60 km2, gaining from heterogeneous agricultural areas, permanent crops and scrub and/or herbaceous vegetation associations. Industrial, commercial and transport units had also pushed back these agricultural areas. As in Valencia, the strong pressure exerted by the capital and its adjacent urban areas generated a conurbation which devoured and broke up its famous “Huerta” [76]. There were also transfers between agricultural uses, in particular the decline of permanent crops giving way to heterogeneous agricultural areas, the most prominent territorial flow at 43 km2 and which is very striking in the cartography. Alguazas experienced a completely opposite flow (Figure 12).
3.6. Landsat LSTs
In short, the surroundings of the large cities of the Valencian Region and Murcia, a prominent part of the prosperous Mediterranean arc, have seen an increase in artificial surfaces mainly at the expense of the decline in agriculture and, to a lesser extent, in abandoned land taken up by scrub and/or herbaceous vegetation associations or by open spaces with little or no vegetation. The process is typical of the Spanish Mediterranean basin [27]. Only arable land has increased. In Valencia and Alicante, the process has resulted in their urban and industrial fabrics becoming the main land cover. In the other urban environments, one or another kind of agricultural use (permanent crops in Castellon, heterogeneous agricultural areas in Elche and Murcia) is still prevalent, although it is on the decline. Even so, only in the Valencia and Alicante areas do artificial surfaces outnumber agricultural ones (Table 5a,b).
There are numerous LULCs and also many territorial transfers between them. It should be recalled that there are 15 Level 2 LULCs used and around one hundred combinations of these land covers between 1990 and 2018 for each urban area. To facilitate this analysis, we only took into consideration the most significant land covers in terms of area.
The changes in annual LST values by urban area show the characteristic phases of the global series with an early decline associated with the June 1991 eruption of the Pinatubo volcano in the Philippines [77] followed by a weak upturn in values in what has been termed the global warming hiatus [78]. These two phases can be seen in the series of all LULC changes. By contrast, there is the thermal downturn of 1996, barely perceptible in Murcia, the one in 2002, more prominent in the southern urban areas, the one in 2012, particularly pronounced in Murcia, and the one in 2021, which conversely is found in the two northern observatories (Figure 13).
They also coincide in the higher averages of the industrial, commercial and transport units whose values are especially striking in Castellon and Valencia. The Plana de Castellon presents an average temperature of its urban fabric which is 1.1-1.6ºC higher than the surrounding agricultural fields, values that rise in the case of the industrial, commercial and transport units to 3.7-4.3ºC. The differences between surrounding fields and urban fabrics are smaller for the other urban areas. Indeed, in the case of Alicante urban fabrics have lower temperatures. Its location, which is unique among the urban areas studied as it is open to the sea, might have an influence due to local sea breezes (Figure 13 and Table 6).
The low urban values have prompted a more detailed study of the reasons, targeting the urban structure. The urban fabric cover is at Level 2 accuracy, but when going down to the more detailed Level 3, CORINE Land Cover separates continuous urban fabric and discontinuous urban fabric. When extracting data for urban fabrics, this factor which lowers their averages is not taken into account. To confirm this, LST points were extracted in the urban fabrics of Valencia and two towns on its outskirts, Godella and Torrent, which are continuous urban fabrics, and they were compared with discontinuous urban fabrics in their vicinity. The temperatures of these discontinuous fabrics were 25.7ºC compared to 27.7ºC in Godella, 27.9ºC in Valencia and as high as 28.3ºC in Torrent.
Hence, LST averages were calculated for the urban nuclei of the five main cities under study. As expected, these urban nuclei reveal differences with respect to their adjacent agricultural and vegetation areas. As noted above, the contrasts are very sharp in Castellon and smaller in the case of Alicante. In Valencia, they are +0.5ºC in the case of permanent crops and practically non-existent for scrub and/or herbaceous vegetation associations, which, on the other hand, are very scarce in the Valencian urban area. In Elche, they are +0.7-0.8ºC, very close to the margin of non-artificial use, whereas in Murcia permanent crops are 1.8ºC lower in their LST, 0.8 for heterogeneous agricultural areas and 0.4 for the plentiful scrub and/or herbaceous vegetation associations (Table 6).
The differences vary around this average both annually (Figure 13) and monthly (Figure 14). They tend to be smaller in the winter months, gradually widening to reach their peak in June, July and August. Landsat images are diurnal and thus reflect UHI characteristics during the hottest hours of the day. This evolutionary pattern is quite patent in Castellon while in Valencia it is blurred by the behaviour of permanent crops. In Alicante, agricultural areas are warmer than the urban nucleus. The capital of Alicante already had the softening effect of its proximity to the sea, but this is reflected even more in the warmer months when the sea breezes are stronger. In Elche, the greatest differences are from April to June, and in the hottest months arable land is warmer than urban fabrics. This is also true in nearby Murcia, which most likely explains the special features of this use in areas which are more southerly and at the same time more arid.
The thermal evolution of the urban areas of Elche and Murcia includes some exclusive LULCs. In the case of Elche, there are marine wetlands, the Santa Pola salines and the El Hondo lagoons, while Murcia has the Sierra de Carrascoy forests. Although coastal lagoons are a typical formation in the Mediterranean arc, i.e., a low coastline where the sea swell has spread the materials deposited by torrential watercourses, these lagoons have not always been preserved. Consequently, they are only found in the Elche study area. The most significant of these lagoons, L’Albufera in Valencia, lies outside the city’s urban area. As for forests, they are usually preserved in mountainous areas where sloping terrain hinders human settlement. Conservation of these wooded areas against residential and tourist encroachment has been helped by their declaration as protected areas, often natural parks.
Elche’s wetlands show much lower thermal values than those of the rest of the land covers. Their average temperature of 24.5ºC is far below the 28ºC of the agricultural land covers, the 28.7ºC of the urban nucleus and, of course, the over 30ºC of the industrial, commercial and transport units. Similar circumstances can be observed in Murcia’s forests whose average is even lower at 24.1ºC (Figure 13 and Figure 14), a good example of the role that wooded areas can play in softening the UHI effect.
As with the thermal averages, the trends are particularly high for industrial, commercial and transport units, especially with the conversion of agricultural land into this kind of artificial units. The trends diminish when the conversion is in urban or agricultural land cover. For example, the change of heterogeneous agricultural areas is always below 0.1ºC/year (Table 7).
The trends are high, shaped by a colder period at the beginning. The recovery of values after the fall due to the volcanic veil of 1991 leaves a very flat trend line which has even included some negative trends since 2000. Most of them are trends in agricultural or shrub/herbaceous land cover (Figure 15).
4. Discussion
LST values are always higher than air temperature values and more variable [79]. The higher LST values and trends in industrial, commercial and transport units are extremely clear evidence in all the urban areas analysed. The results match those obtained at seasonal level also by applying Landsat and CORINE Land Cover in the city of Barcelona [24], 300 kilometres north of our study area. Nonetheless, they are not so clear in urban fabrics, especially if the distinction between continuous and discontinuous fabrics is disregarded. The aforementioned study notes a greater difference in urban fabrics which may be down to the fact that it does not take into account agricultural uses but does consider covers that are more differentiated in their behaviour in relation to urban impervious ones such as green urban areas and forests.
The main factor in LST varies over the course of the day where vegetation is the most prominent during daylight hours and paving at night [79]. Other studies summarise it in the percentage of paved area [9], since an increase in the latter will reduce the percentage of vegetated area. As discussed above, Landsat LST data only capture diurnal data, meaning that the greater vegetation differences between agricultural and natural areas and industrial, commercial and transport units result in a large thermal contrast between these land covers. Urban areas have more densely populated zones, more industrial, commercial and transport units and more traffic owing to their greater activity [11,13] and our results show that they make the greatest LULC contribution to UHI.
The vegetation cover would explain the thermal distinctiveness of arable land which is only vegetated for part of the year, always with more discreet plant growth and with high temperature averages which, as noted above, can be higher than those found in urban nuclei.
There is no shortage of Landsat studies in which dry agriculture generates the highest LSTs [23,33]. Mediterranean natural and agricultural landscapes around cities in summer are covered by a mixture of scattered trees, dry grasses and bare soil that has already warmed up by the time the Landsat goes by [28], since their heat conduction capacity is low and they heat up quickly. Cropland and bare soil can reverse the UHI [40,42,43]. Meanwhile, urban areas with their buildings create shade which prevents warming [43].
Equally there is no shortage of contradictory conclusions explained by the scale effect [7] and the many factors shaping LST in a space as heterogeneous as the urban area and its surroundings [1]. Harnessing Landsat data from diurnal imagery hinders capturing the much higher and easier to characterise [13], UHI intensity at night [25]. Studies in the city of Phoenix (Arizona) with high-resolution Quickbird imagery concur with these results [9], yet conversely, a study with GOES satellite data on the urban environment of Boston found the highest surface UHI intensity in the middle hours of the day due to the lower thermal inertia of its artificial areas [18]. A large city such as Boston falls into the category of cities with high population density and a large cluster of human activities which experience more intense UHI during daytime hours [80]. Daytime UHI in the studied sector of the Spanish Mediterranean is higher in summer since the impact of the lower presence of vegetation is greater at this time of year [79]. Other Landsat studies reflect the highest intensity in the spring and summer months [23,24]. However, as at daily level, the studies reveal a great diversity of results on a seasonal scale due to the significance of local factors. Even in the Mediterranean area of our research, cities such as Athens and Parma have the highest UHI during the day [12], while in Thessaloniki [81], Salamanca [39], Málaga [42] and Zaragoza [37] it is at night. Madrid, Rome and Athens have a higher urban impact in summer whereas the highest intensity in winter is observed in cities such as Lisbon [80], Zaragoza [37], Malaga [42] and Barcelona [17,35].
Numerous studies point to the lower LST in urban vegetation areas. Although this is not so well documented here, it is an effect shown in the Murcian Sierra de Carrascoy forests, making increased green areas the most significant resource for reducing UHI [40]. Urban fabrics with a greater vegetation presence will diminish the rise in LST [1], and this also explains why LST is lower in discontinuous fabrics which are more vegetated than continuous ones. This is because the percentage of impervious surfaces is the main factor in LST [79]. The scale factor is further complicated by the fact that continuous urban fabrics include compact structures, typical of historic centres, which are more energy-efficient than less dense models found in more recent urban extensions [30]. Mediterranean cities such as the ones in our study have a very dense urban structure [82].
As for the water bodies in Elche’s urban environment, they have low LST values which can be accounted for by their large specific heat capacity and high water evaporation which enables the regulation of atmospheric humidity and temperature [21]. Likewise, the weakness of Alicante’s thermal values might be attributed to its closeness to the coast, and thus to a water body, and the greater intensity of the breeze system [28]. Barcelona, a city which is also located next to the sea, has shown a mitigation of UHI intensity in the summer months when breezes are strongest [35]. While city size is a consideration, cities can be affected by the presence of water bodies and prevailing winds [11] and these local aspects are thought to be more influential than the city’s size [80]. Once a threshold is crossed, wind can eventually eliminate UHI [39,41,42].
This research and other studies mentioned in the references leave open some issues for the future: using night-time images [13] for learning about night-time UHI at high spatial resolution; obtaining daily LST data to ascertain the effect of meteorological factors such as wind [11,38], which are judged to be more important than those related to the shape or size of the urban area [83], acquiring data from weather stations whose location could be improved by these results, and drawing on NDVI data as a proxy for the percentage of urban green areas [25].
5. Conclusions
Prompted by the robust urban growth of the main cities on Spain’s eastern coast, the study’s objectives were to:
- determine the variation in land cover and land use around the main urban areas between 1990 and 2018
- determine the main flows between the two dates
- derive monthly and annual temperatures for each land cover
- calculate thermal trends
- ascertain the monthly thermal behaviour of the main land covers
Firstly, the analysis of the CORINE Land Cover LULCs led to the expected conclusion of substantial growth in artificial surfaces, especially in the urban areas of Valencia and Alicante where these artificial surfaces are now predominant.
The second point, which is closely tied to the first one, is that this artificial growth took place at the expense of agricultural land and the few natural covers, usually scrub and/or herbaceous vegetation associations, which remained in this fertile territory of high economic development and prolonged and intense settlement.
Once the LST series had been obtained for each polygon indicative of a change between LULCs, the next two objectives, the annual and monthly LST averages, were worked out which, in turn, enabled us to interpret the thermal behaviour of the various covers. The results are shaped by the flyover of the Landsat satellites in the middle hours of the day.
The highest average values are found, with significant differences compared to agricultural peri-urban areas, in industrial, commercial and transport units which are devoid of vegetation, the main factor affecting LST during daylight hours. They are thus the main UHI driver. The results for urban fabrics are more diverse, reflecting the complexity of a cover which includes continuous and discontinuous urban fabrics. In the former, it is even possible to differentiate between historic centres with narrow streets and more recent urban developments in the form of city expansions. The thermal behaviour differs and the results are extremely complex.
The differences are, thus, greater between urban nuclei and agricultural areas, particularly in the case of permanent crops and not so much for scrub and/or herbaceous vegetation associations. Unlike urban areas, this cover and open spaces with little or no vegetation generate hardly any shade at the beginning of the daylight hours which may explain the slight thermal differences. The arable land in Elche and Murcia, only vegetated for part of the year and smaller in growth, shares the same behaviour. Alicante is unique with non-artificial areas featuring averages equal to or higher than those of urban areas, a trait explained by its coastal location and consequent strong breezes, especially in summer. The lowest thermal values are in wetlands and forests which are only to be found in Elche and Murcia, respectively.
As for the trends, they present very high values influenced by the thermal drop at the beginning of the study period brought about by the eruption of the Pinatubo volcano in June 1991. As in the case of LSTs, the highest values are for industrial, commercial and transport units. Recalculated from 2000 onwards, the trends are fairly flat and, in some cases, even downward.
These are the main conclusions of this study which seeks to shed light on the complex issue of UHI in terms of methodology and results. As noted above, further studies will of course be needed to gain greater insight.
Author Contributions
All the authors, including Enrique Montón Chiva and José Quereda Sala, have contributed to the design of the methodology and implementation of this research. They also helped in obtaining the Landsat temperature data. Enrique Montón Chiva performed the data processing and the graphical and cartographic visualisation of the results with QGIS and R. Enrique Montón Chiva wrote the first draft. José Quereda Sala took part in the review of this first draft and in writing and editing subsequent drafts. Enrique Montón Chiva and José Quereda Sala read and approved the final manuscript.
Funding
This research received no external funding.
Acknowledgments
The authors would like to acknowledge and recognize the great contribution that the Climate Engine website represents, made possible by the public availability of Landsat images. At the same time, they recognize the work of creating, maintaining and improving open source software such as QGIS and R. This publication has been prepared using European Union’s Copernicus Land Monitoring Service information;<https://doi.org/10.2909/5c1f2e03-fcba-47b1-afeb-bc05a47bada0> <https://doi.org/10.2909/71c95a07-e296-44fc-b22b-415f42acfdf0>” “Generated using European Union’s Copernicus Land Monitoring Service information; <https://doi.org/10.2909/5c1f2e03-fcba-47b1-afeb-bc05a47bada0> <https://doi.org/10.2909/71c95a07-e296-44fc-b22b-415f42acfdf0>.
Conflicts of Interest
The authors declare no conflicts of interest.
References
- Peng, J.; Jia, J.; Liu, Y.; Li, H.; Wu, J. Seasonal Contrast of the Dominant Factors for Spatial Distribution of Land Surface Temperature in Urban Areas. Remote Sensing of Environment 2018, 215, 255–267. [Google Scholar] [CrossRef]
- World Bank Group. Urban Development. Available online: https://www.worldbank.org/en/topic/urbandevelopment/overview (accessed on 18 June 2024).
- Li, X.; Zhou, W.; Ouyang, Z.; Xu, W.; Zheng, H. Spatial Pattern of Greenspace Affects Land Surface Temperature: Evidence from the Heavily Urbanized Beijing Metropolitan Area, China. Landscape Ecology 2012, 27, 887–898. [Google Scholar] [CrossRef]
- Hidalgo-García, D.; Arco-Díaz, J. Spatiotemporal Analysis of the Surface Urban Heat Island (SUHI), Air Pollution and Disease Pattern: An Applied Study on the City of Granada (Spain). Environmental Science and Pollution Research 2023, 30, 57617–57637. [Google Scholar] [CrossRef] [PubMed]
- Bradford, K.; Abrahams, L.; Hegglin, M.; Klima, K. A Heat Vulnerability Index and Adaptation Solutions for Pittsburgh, Pennsylvania. Environmental Science & Technology 2015, 49, 11303–11311. [Google Scholar] [CrossRef]
- Nwakaire, C. M.; Onn, C. C.; Yap, S. P.; Yuen, C. W.; Onodagu, P. D. Urban Heat Island Studies with Emphasis on Urban Pavements: A Review. Sustainable Cities and Society. [CrossRef]
- Li, W.; Bai, Y.; Chen, Q.; He, K.; Ji, X.; Han, C. Discrepant Impacts of Land Use and Land Cover on Urban Heat Islands: A Case Study of Shanghai, China. Ecological Indicators 2014, 47, 171–178. [Google Scholar] [CrossRef]
- Deilami, K.; Kamruzzaman, M.; Liu, Y. Urban Heat Island Effect: A Systematic Review of Spatio-Temporal Factors, Data, Methods, and Mitigation Measures. International Journal of Applied Earth Observation and Geoinformation 2018, 67, 30–42. [Google Scholar] [CrossRef]
- Zheng, B.; Myint, S. W.; Fan, C. Spatial Configuration of Anthropogenic Land Cover Impacts on Urban Warming. Landscape and Urban Planning 2014, 130, 104–111. [Google Scholar] [CrossRef]
- Kim, S. W.; Brown, R. D. Urban Heat Island (UHI) Intensity and Magnitude Estimations: A Systematic Literature Review. Science of the Total Environment. [CrossRef]
- Ivajnšič, D.; Kaligarič, M.; Žiberna, I. Geographically Weighted Regression of the Urban Heat Island of a Small City. Applied Geography 2014, 53, 341–353. [Google Scholar] [CrossRef]
- Santamouris, M. Heat Island Research in Europe: The State of the Art. Advances in Building Energy Research 2007, 1, 123–150. [Google Scholar] [CrossRef]
- Sun, Y.; Wang, S.; Wang, Y. Estimating Local-Scale Urban Heat Island Intensity Using Nighttime Light Satellite Imageries. Sustainable Cities and Society 2020, 57. [Google Scholar] [CrossRef]
- Oke, T. R.; Mills, G.; Christen, A.; Voogt, J. A. Urban Climates by T. R. Oke; 2017.
- Rizwan, A. M.; Dennis, L. Y. C.; Liu, C. A Review on the Generation, Determination and Mitigation of Urban Heat Island. Journal of Environmental Sciences 2008, 20, 120–128. [Google Scholar] [CrossRef] [PubMed]
- Zhou, W.; Qian, Y.; Li, X.; Li, W.; Han, L. Relationships between Land Cover and the Surface Urban Heat Island: Seasonal Variability and Effects of Spatial and Thematic Resolution of Land Cover Data on Predicting Land Surface Temperatures. Landscape Ecology 2014, 29, 153–167. [Google Scholar] [CrossRef]
- Martin-Vide, J.; Moreno-Garcia, M. C. Probability Values for the Intensity of Barcelona’s Urban Heat Island (Spain). Atmospheric Research 2020, 240. [Google Scholar] [CrossRef]
- Chang, Y.; Xiao, J.; Li, X.; Frolking, S.; Zhou, D.; Schneider, A.; Weng, Q.; Yu, P.; Wang, X.; Li, X.; Liu, S.; Wu, Y. Exploring Diurnal Cycles of Surface Urban Heat Island Intensity in Boston with Land Surface Temperature Data Derived from GOES-R Geostationary Satellites. Science of the Total Environment 2021, 763. [Google Scholar] [CrossRef]
- Siddiqui, A.; Kushwaha, G.; Nikam, B.; Srivastav, S. K.; Shelar, A.; Kumar, P. Analysing the Day/Night Seasonal and Annual Changes and Trends in Land Surface Temperature and Surface Urban Heat Island Intensity (SUHII) for Indian Cities. Sustainable Cities and Society 2021, 75. [Google Scholar] [CrossRef]
- Deng, X.; Yu, W.; Shi, J.; Huang, Y.; Li, D.; He, X.; Zhou, W.; Xie, Z. Characteristics of Surface Urban Heat Islands in Global Cities of Different Scales: Trends and Drivers. Sustainable Cities and Society 2024, 107. [Google Scholar] [CrossRef]
- Du, J.; Xiang, X.; Zhao, B.; Zhou, H. Impact of Urban Expansion on Land Surface Temperature in Fuzhou, China Using Landsat Imagery. Sustainable Cities and Society 2020, 61. [Google Scholar] [CrossRef]
- Chen, F.; Yang, S.; Yin, K.; Chan, P. Challenges to Quantitative Applications of Landsat Observations for the Urban Thermal Environment. Journal of Environmental Sciences (China), 2017, 59, 80–88. [Google Scholar] [CrossRef]
- Aslan, N.; Koc-San, D. Analysis of Relationship between Urban Heat Island Effect and Land Use/Cover Type Using Landsat 7 ETM+ and Landsat 8 OLI Images. In International Archives of the Photogrammetry, Remote Sensing and Spatial Information Sciences—ISPRS Archives; International Society for Photogrammetry and Remote Sensing, 2016; Vol. 41, pp 821–828. [CrossRef]
- Lemus-Canovas, M.; Martin-Vide, J.; Moreno-Garcia, M. C.; Lopez-Bustins, J. A. Estimating Barcelona’s Metropolitan Daytime Hot and Cold Poles Using Landsat-8 Land Surface Temperature. Science of the Total Environment 2020, 699. [Google Scholar] [CrossRef]
- Yuan, F.; Bauer, M. E. Comparison of Impervious Surface Area and Normalized Difference Vegetation Index as Indicators of Surface Urban Heat Island Effects in Landsat Imagery. Remote Sensing of Environment 2007, 106, 375–386. [Google Scholar] [CrossRef]
- Guo, A.; Yang, J.; Sun, W.; Xiao, X.; Cecilia, J. X.; Jin, C.; Li, X. Impact of Urban Morphology and Landscape Characteristics on Spatiotemporal Heterogeneity of Land Surface Temperature. Sustainable Cities and Society 2020, 63. [Google Scholar] [CrossRef]
- Hidalgo-García, D.; Arco-Díaz, J. Modeling the Surface Urban Heat Island (SUHI) to Study of Its Relationship with Variations in the Thermal Field and with the Indices of Land Use in the Metropolitan Area of Granada (Spain). Sustainable Cities and Society 2022, 87. [Google Scholar] [CrossRef]
- Oliveira, A.; Lopes, A.; Niza, S. Local Climate Zones in Five Southern European Cities: An Improved GIS-Based Classification Method Based on Copernicus Data. Urban Climate 2020, 33. [Google Scholar] [CrossRef]
- Mirchooli, F.; Sadeghi, S. H.; Darvishan, A. K. Analyzing Spatial Variations of Relationships between Land Surface Temperature and Some Remotely Sensed Indices in Different Land Uses. Remote Sensing Applications: Society and Environment 2020, 19. [Google Scholar] [CrossRef]
- Salvati, A.; Coch, H.; Morganti, M. Effects of Urban Compactness on the Building Energy Performance in Mediterranean Climate. In Energy Procedia; Elsevier Ltd., 2017; Vol. 122, pp 499–504. [CrossRef]
- Tepanosyan, G.; Muradyan, V.; Hovsepyan, A.; Pinigin, G.; Medvedev, A.; Asmaryan, S. Studying Spatial-Temporal Changes and Relationship of Land Cover and Surface Urban Heat Island Derived through Remote Sensing in Yerevan, Armenia. Building and Environment 2021, 187, 107390. [Google Scholar] [CrossRef]
- Oke, T. R. The Energetic Basis of the Urban Heat Island. Quart. J. R. Met. Soc, 1982, 108, 551. [Google Scholar] [CrossRef]
- Bala, R.; Prasad, R.; Yadav, V. P. A Comparative Analysis of Day and Night Land Surface Temperature in Two Semi-Arid Cities Using Satellite Images Sampled in Different Seasons. Advances in Space Research 2020, 66, 412–425. [Google Scholar] [CrossRef]
- Chen, H.; Deng, Q.; Zhou, Z.; Ren, Z.; Shan, X. Influence of Land Cover Change on Spatio-Temporal Distribution of Urban Heat Island —a Case in Wuhan Main Urban Area. Sustainable Cities and Society 2022, 79. [Google Scholar] [CrossRef]
- Salvati, A.; Roura, H. C.; Cecere, C. Assessing the Urban Heat Island and Its Energy Impact on Residential Buildings in Mediterranean Climate: Barcelona Case Study. Energy and Buildings 2017, 146, 38–54. [Google Scholar] [CrossRef]
- Dienst, M.; Lindén, J.; Saladié, Ò.; Esper, J. Detection and Elimination of UHI Effects in Long Temperature Records from Villages—A Case Study from Tivissa, Spain. Urban Climate 2019, 27, 372–383. [Google Scholar] [CrossRef]
- Barrao, S.; Serrano-Notivoli, R.; Cuadrat, J. M.; Tejedor, E.; Sánchez, M. A. S. Characterization of the UHI in Zaragoza (Spain) Using a Quality-Controlled Hourly Sensor-Based Urban Climate Network. Urban Climate 2022, 44. [Google Scholar] [CrossRef]
- Vicente-Serrano, S. M.; Cuadrat-Prats, J. M.; Saz-Sánchez, M. A. Spatial Patterns of the Urban Heat Island in Zaragoza (Spain). Climate Research Clim Res 2005, 30, 61–69. [Google Scholar] [CrossRef]
- Alonso, M. S.; Fidalgo, M. R.; Labajo, J. L. The Urban Heat Island in Salamanca (Spain) and Its Relationship to Meteorological Parameters. CLIMATE RESEARCH Clim Res 2007, 34, 39–46. [Google Scholar] [CrossRef]
- Gago, E. J.; Berrizbeitia, S. E.; Torres, R. P.; Muneer, T. Effect of Land Use/Cover Changes on Urban Cool Island Phenomenon in Seville, Spain. Energies 2020, 13. [Google Scholar] [CrossRef]
- Acero, J. A.; Arrizabalaga, J.; Kupski, S.; Katzschner, L. Urban Heat Island in a Coastal Urban Area in Northern Spain. Theoretical and Applied Climatology 2013, 113, (1–2). [Google Scholar] [CrossRef]
- Senciales-González, J. M.; Rodrigo-Comino, J.; Smith, P. Surveying Topographical Changes and Climate Variations to Detect the Urban Heat Island in the City of Málaga (Spain). Geographical Research Letters 2020, 46, 521–543. [Google Scholar] [CrossRef]
- Hidalgo-García, D.; Arco-Díaz, J. Space–Time Analysis of the Earth’s Surface Temperature, Surface Urban Heat Island and Urban Hotspot: Relationships with Variation of the Thermal Field in Andalusia (Spain). Urban Ecosystems 2023, 26, 525–546. [Google Scholar] [CrossRef]
- Moreno, H. L.; Sánchez, S.-G.; López, M. E. R.; González, F. J. N. Thermal Characterization of Urban Heat Island (UHI) According to Urban Morphology of Madrid. In III International Congress on Construction and Building Research; 2015.
- Lehoczky, A.; Sobrino, J.; Skoković, D.; Aguilar, E. The Urban Heat Island Effect in the City of Valencia: A Case Study for Hot Summer Days. Urban Science 2017, 1. [Google Scholar] [CrossRef]
- Quereda, J.; Montón, E.; Quereda, V.; Mollá, B. Significant Climate Warming (1950-2013) in the Spanish Mediterranean: Natural Trend or Urban Heat Island (UHI). Tethys 2016, 2016, 11–20. [Google Scholar] [CrossRef]
- Quereda Sala, J.; Montón Chiva, E.; Quereda Vázquez, M. V.; Mollà Cantavella, B. The Urban Effect (UHI) in Spanish Mediterranean. Wulfenia 2015, 22, 89–100. [Google Scholar]
- World Bank Group. Urban Population (% of Total Population)—Spain, 2024. Available online: https://data.worldbank.org/indicator/SP.URB.TOTL.IN.ZS?locations=ES (accessed on 19 June 2024).
- Jato-Espino, D. Spatiotemporal Statistical Analysis of the Urban Heat Island Effect in a Mediterranean Region. Sustainable Cities and Society 2019, 46. [Google Scholar] [CrossRef]
- Chen, X.; Zhang, Y. Impacts of Urban Surface Characteristics on Spatiotemporal Pattern of Land Surface Temperature in Kunming of China. Sustainable Cities and Society 2017, 32, 87–99. [Google Scholar] [CrossRef]
- Quereda, J.; Montón, E.; Quereda, V. Climate Warming in the Spanish Mediterranean: Its Magnitude and Nature. Tethys 2020, 2020, 1–9. [Google Scholar] [CrossRef]
- CNIG. Work from Orto-AMS 1956-1957 CC-BY 4.0 Scne.Es. Available online: https://centrodedescargas.cnig.es/CentroDescargas/index.jsp (accessed on 21 February 2019).
- CNIG. Work from PNOAHISTORICO 2004-2022 CC-BY 4.0 Scne.Es. Available online: https://centrodedescargas.cnig.es/CentroDescargas/index.jsp (accessed on 21 February 2019).
- Rocafort, C.; Dalmau, C.; Chias Carbó, B. España Regional. Planos; Alberto Martín, 1910; Vol. 3.
- INE. Municipality Population, 2023. Available online: https://www.ine.es/dynt3/inebase/index.htm?padre=525 (accessed on 3 April 2024).
- Copernicus Land Monitoring Service. CORINE Land Cover 1990 (Vector/Raster 100 m), Europe, 6-Yearly CC-BY 4.0 Scne.Es. [CrossRef]
- Copernicus Land Monitoring Service. CORINE Land Cover 2018 (Vector/Raster 100 m), Europe, 6-Yearly. CC-BY 4.0 Scne.Es. [CrossRef]
- Copernicus. CORINE Land Cover Nomenclature Guidelines, 2024. Available online: https://land.copernicus.eu/content/corine-land-cover-nomenclature-guidelines/html/ (accessed on 21 February 2019).
- Climate Engine Team. Dataset Information. Landsat At-Surface Reflectance/Landsat Top-Of-Atmosphere Reflectance. Available online: https://support.climateengine.org/article/104-datasetsinfo (accessed on 11 July 2024).
- Huntington, J. L.; Hegewisch, K. C.; Daudert, B.; Morton, C. G.; Abatzoglou, J. T.; McEvoy, D. J.; Erickson, T. Climate Engine: Cloud Computing and Visualization of Climate and Remote Sensing Data for Advanced Natural Resource Monitoring and Process Understanding. Bulletin of the American Meteorological Society 2017, 98, 2397–2409. [Google Scholar] [CrossRef]
- Desert Research Institute and University of California Merced. Climate Engine, Version 2.1. (1985-2023). Available online: http://climateengine.org (accessed on 20 March 2024).
- Ravanelli, R.; Nascetti, A.; Cirigliano, R. V.; Rico, C. D.; Leuzzi, G.; Monti, P.; Crespi, M. Monitoring the Impact of Land Cover Change on Surface Urban Heat Island through Google Earth Engine: Proposal of a Global Methodology, First Applications and Problems. Remote Sensing 2018, 10. [Google Scholar] [CrossRef]
- Zhang, H.; Yin, Y.; An, H.; Lei, J.; Li, M.; Song, J.; Han, W. Surface Urban Heat Island and Its Relationship with Land Cover Change in Five Urban Agglomerations in China Based on GEE. Environmental Science and Pollution Research 2022, 29, 82271–82285. [Google Scholar] [CrossRef]
- Purio, M. A.; Yoshitake, T.; Cho, M. Assessment of Intra-Urban Heat Island in a Densely Populated City Using Remote Sensing: A Case Study for Manila City. Remote Sensing 2022, 14. [Google Scholar] [CrossRef]
- Rejuso, A. M.; Cortes, A. C.; Blanco, A. C.; Cruz, C. A.; Babaan, J. B. Spatio-Temporal Analysis of Urban Heat Island in Mandaue City, Philippines. In International Archives of the Photogrammetry, Remote Sensing and Spatial Information Sciences—ISPRS Archives; International Society for Photogrammetry and Remote Sensing, 2019; Vol. 42, pp 361–367. [CrossRef]
- Ravanelli, R.; Nascetti, A.; Cirigliano, V.; Rico, C. D.; Leuzzi, G.; Monti, P.; Crespi, M. Monitoring of the Urban Heat Island through Google Earth Engine: A Global Methodology and Its Application to Different Cities of the United States, 2018.
- Gkatzioura, P. E.; Perakis, K. Analysis of Urban Heat Island (UHI) through Climate Engine and ARCGIS PRO in Different Cities of Bulgaria, 2022.
- CNIG. Donwload Center. Available online: https://centrodedescargas.cnig.es/CentroDescargas/index.jsp (accessed on 15 January 2024).
- Stal, C.; Sloover, L. D.; Verbeurgt, J.; Wulf, A. D. On Finding a Projected Coordinate Reference System. Geographies 2022, 2, 245–257. [Google Scholar] [CrossRef]
- Climate Engine Team. On-Demand Insights from Climate and Earth Observations Data, 2024. https://www.climateengine.org/.
- Mejjad, N.; Rossi, A.; Pavel, A. B. The Coastal Tourism Industry in the Mediterranean: A Critical Review of the Socio-Economic and Environmental Pressures & Impacts. Tourism Management Perspectives. [CrossRef]
- Masot, A. N.; Alonso, G. C.; Moriche, Á. E. Spatial Analysis of the Rural-Urban Structure of the Spanish Municipalities. ISPRS International Journal of Geo-Information 2020, 9. [Google Scholar] [CrossRef]
- Jiménez-Olivencia, Y.; Ibáñez-Jiménez, Á.; Porcel-Rodríguez, L.; Zimmerer, K. Land Use Change Dynamics in Euro-Mediterranean Mountain Regions: Driving Forces and Consequences for the Landscape. Land Use Policy 2021, 109. [Google Scholar] [CrossRef]
- López Ortiz, M. I.; Melgarejo Moreno, J. Evolución Histórica de La Agricultura de La Provincia de Alicante, 1900-2000. In Libro Jubilar en Homenaje al Profesor Antonio Gil Olcina. Edición ampliada; Servicio de Publicaciones de la Universidad de Alicante, 2016; pp 1063–1085. [CrossRef]
- Hrushka, V. V.; Horozhankina, N. A.; Boyko, Z. V.; Korneyev, M. V.; Nebaba, N. A. Transport Infrastructure of Spain as a Factor in Tourism Development. Journal of Geology, Geography and Geoecology 2021, 30, 429–440. [Google Scholar] [CrossRef]
- Martí, P.; García-Mayor, C. The Huerta Agricultural Landscape in the Spanish Mediterranean Arc: One Landscape, Two Perspectives, Three Specific Huertas. Land 2020, 9, 1–22. [Google Scholar] [CrossRef]
- McCormick, M. P.; Thomason, L. W.; Trepte, C. R. Atmospheric Effects of the Mt Pinatubo Eruption. Nature 1995, 373, 399–404. [Google Scholar] [CrossRef]
- Medhaug, I.; Stolpe, M. B.; Fischer, E. M.; Knutti, R. Reconciling Controversies about the “Global Warming Hiatus.” Nature Publishing Group 2017. [CrossRef]
- Buyantuyev, A.; Wu, J. Urban Heat Islands and Landscape Heterogeneity: Linking Spatiotemporal Variations in Surface Temperatures to Land-Cover and Socioeconomic Patterns. Landscape Ecology 2010, 25, 17–33. [Google Scholar] [CrossRef]
- Founda, D.; Pierros, F.; Petrakis, M.; Zerefos, C. Interdecadal Variations and Trends of the Urban Heat Island in Athens (Greece) and Its Response to Heat Waves. Atmospheric Research 2015, 161–162, 1–13. [Google Scholar] [CrossRef]
- Giannaros, T. M.; Melas, D. Study of the Urban Heat Island in a Coastal Mediterranean City: The Case Study of Thessaloniki, Greece. Atmospheric Research 2012, 118, 103–120. [Google Scholar] [CrossRef]
- Evola, G.; Gagliano, A.; Fichera, A.; Marletta, L.; Martinico, F.; Nocera, F.; Pagano, A. UHI Effects and Strategies to Improve Outdoor Thermal Comfort in Dense and Old Neighbourhoods. In Energy Procedia; Elsevier Ltd., 2017; Vol. 134, pp 692–701. [CrossRef]
- Lai, J.; Zhan, W.; Voogt, J.; Quan, J.; Huang, F.; Zhou, J.; Bechtel, B.; Hu, L.; Wang, K.; Cao, C.; Lee, X. Meteorological Controls on Daily Variations of Nighttime Surface Urban Heat Islands. Remote Sensing of Environment 2021, 253. [Google Scholar] [CrossRef]
Figure 1.
Location map of the urban areas surveyed.
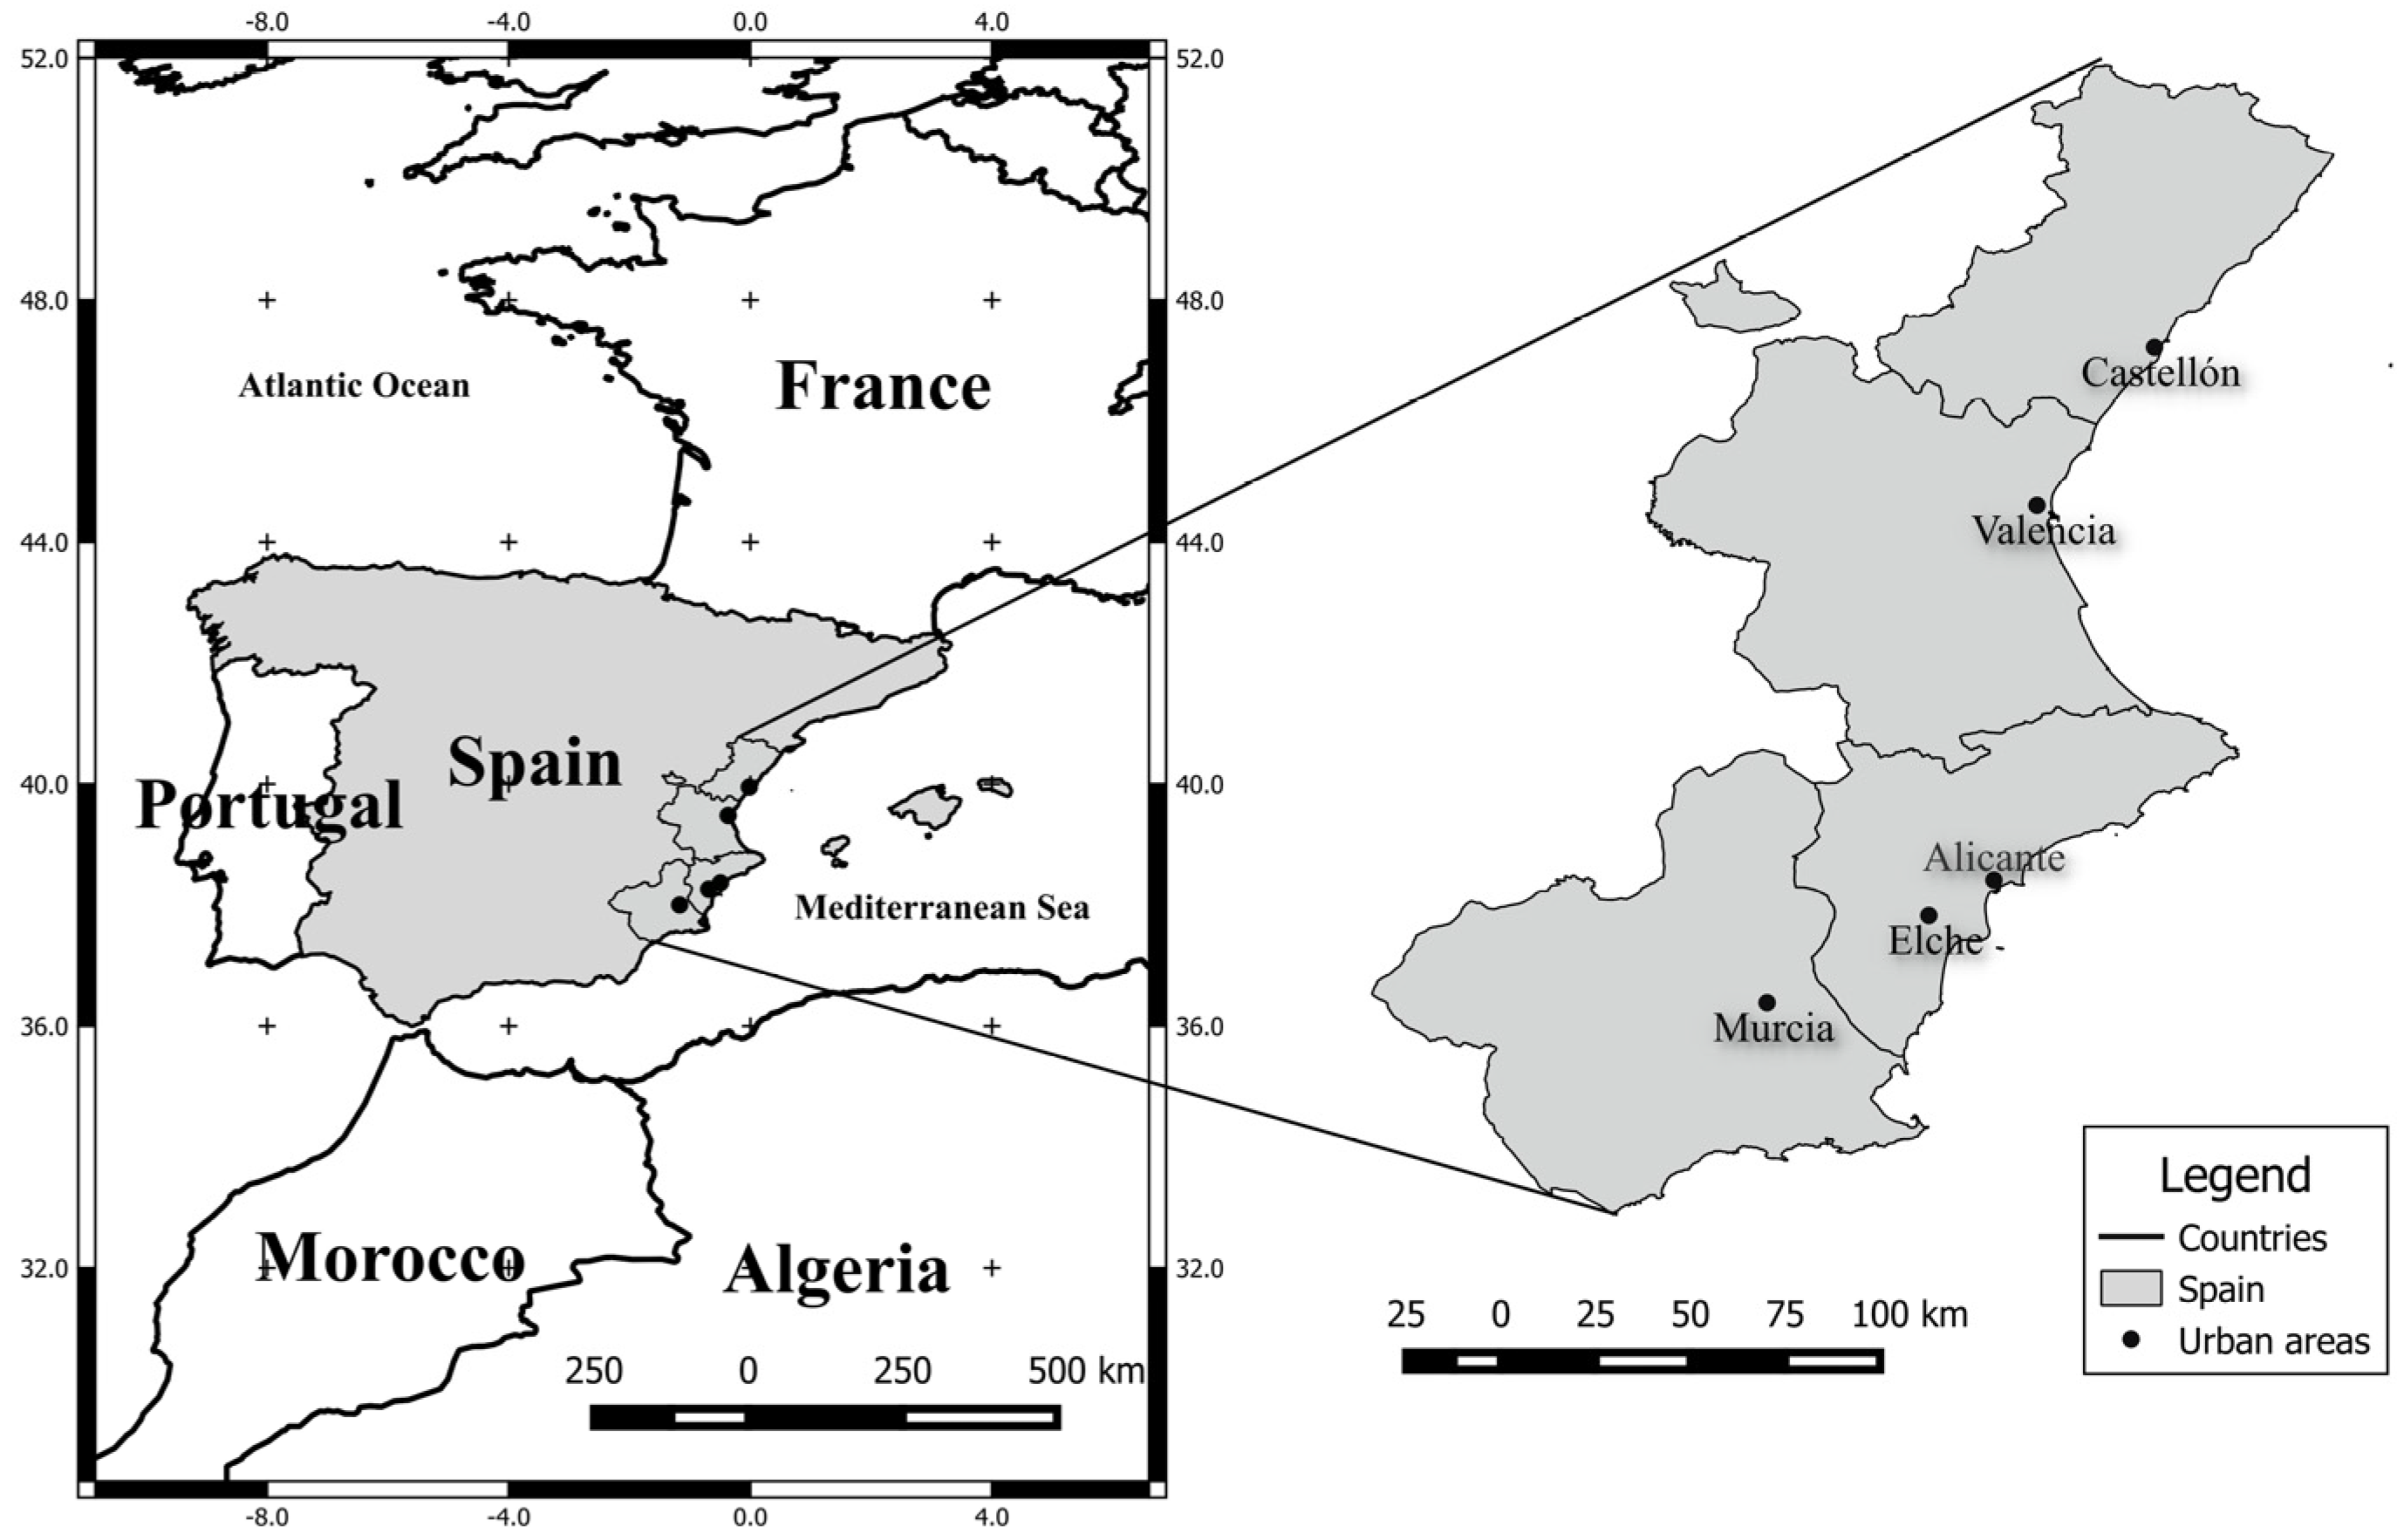
Figure 2.
Growth of urban centres above 100,000 inhabitants and location of State Meteorological Agency (AEMET in Spanish) weather observatories. Source: [52,53,54].
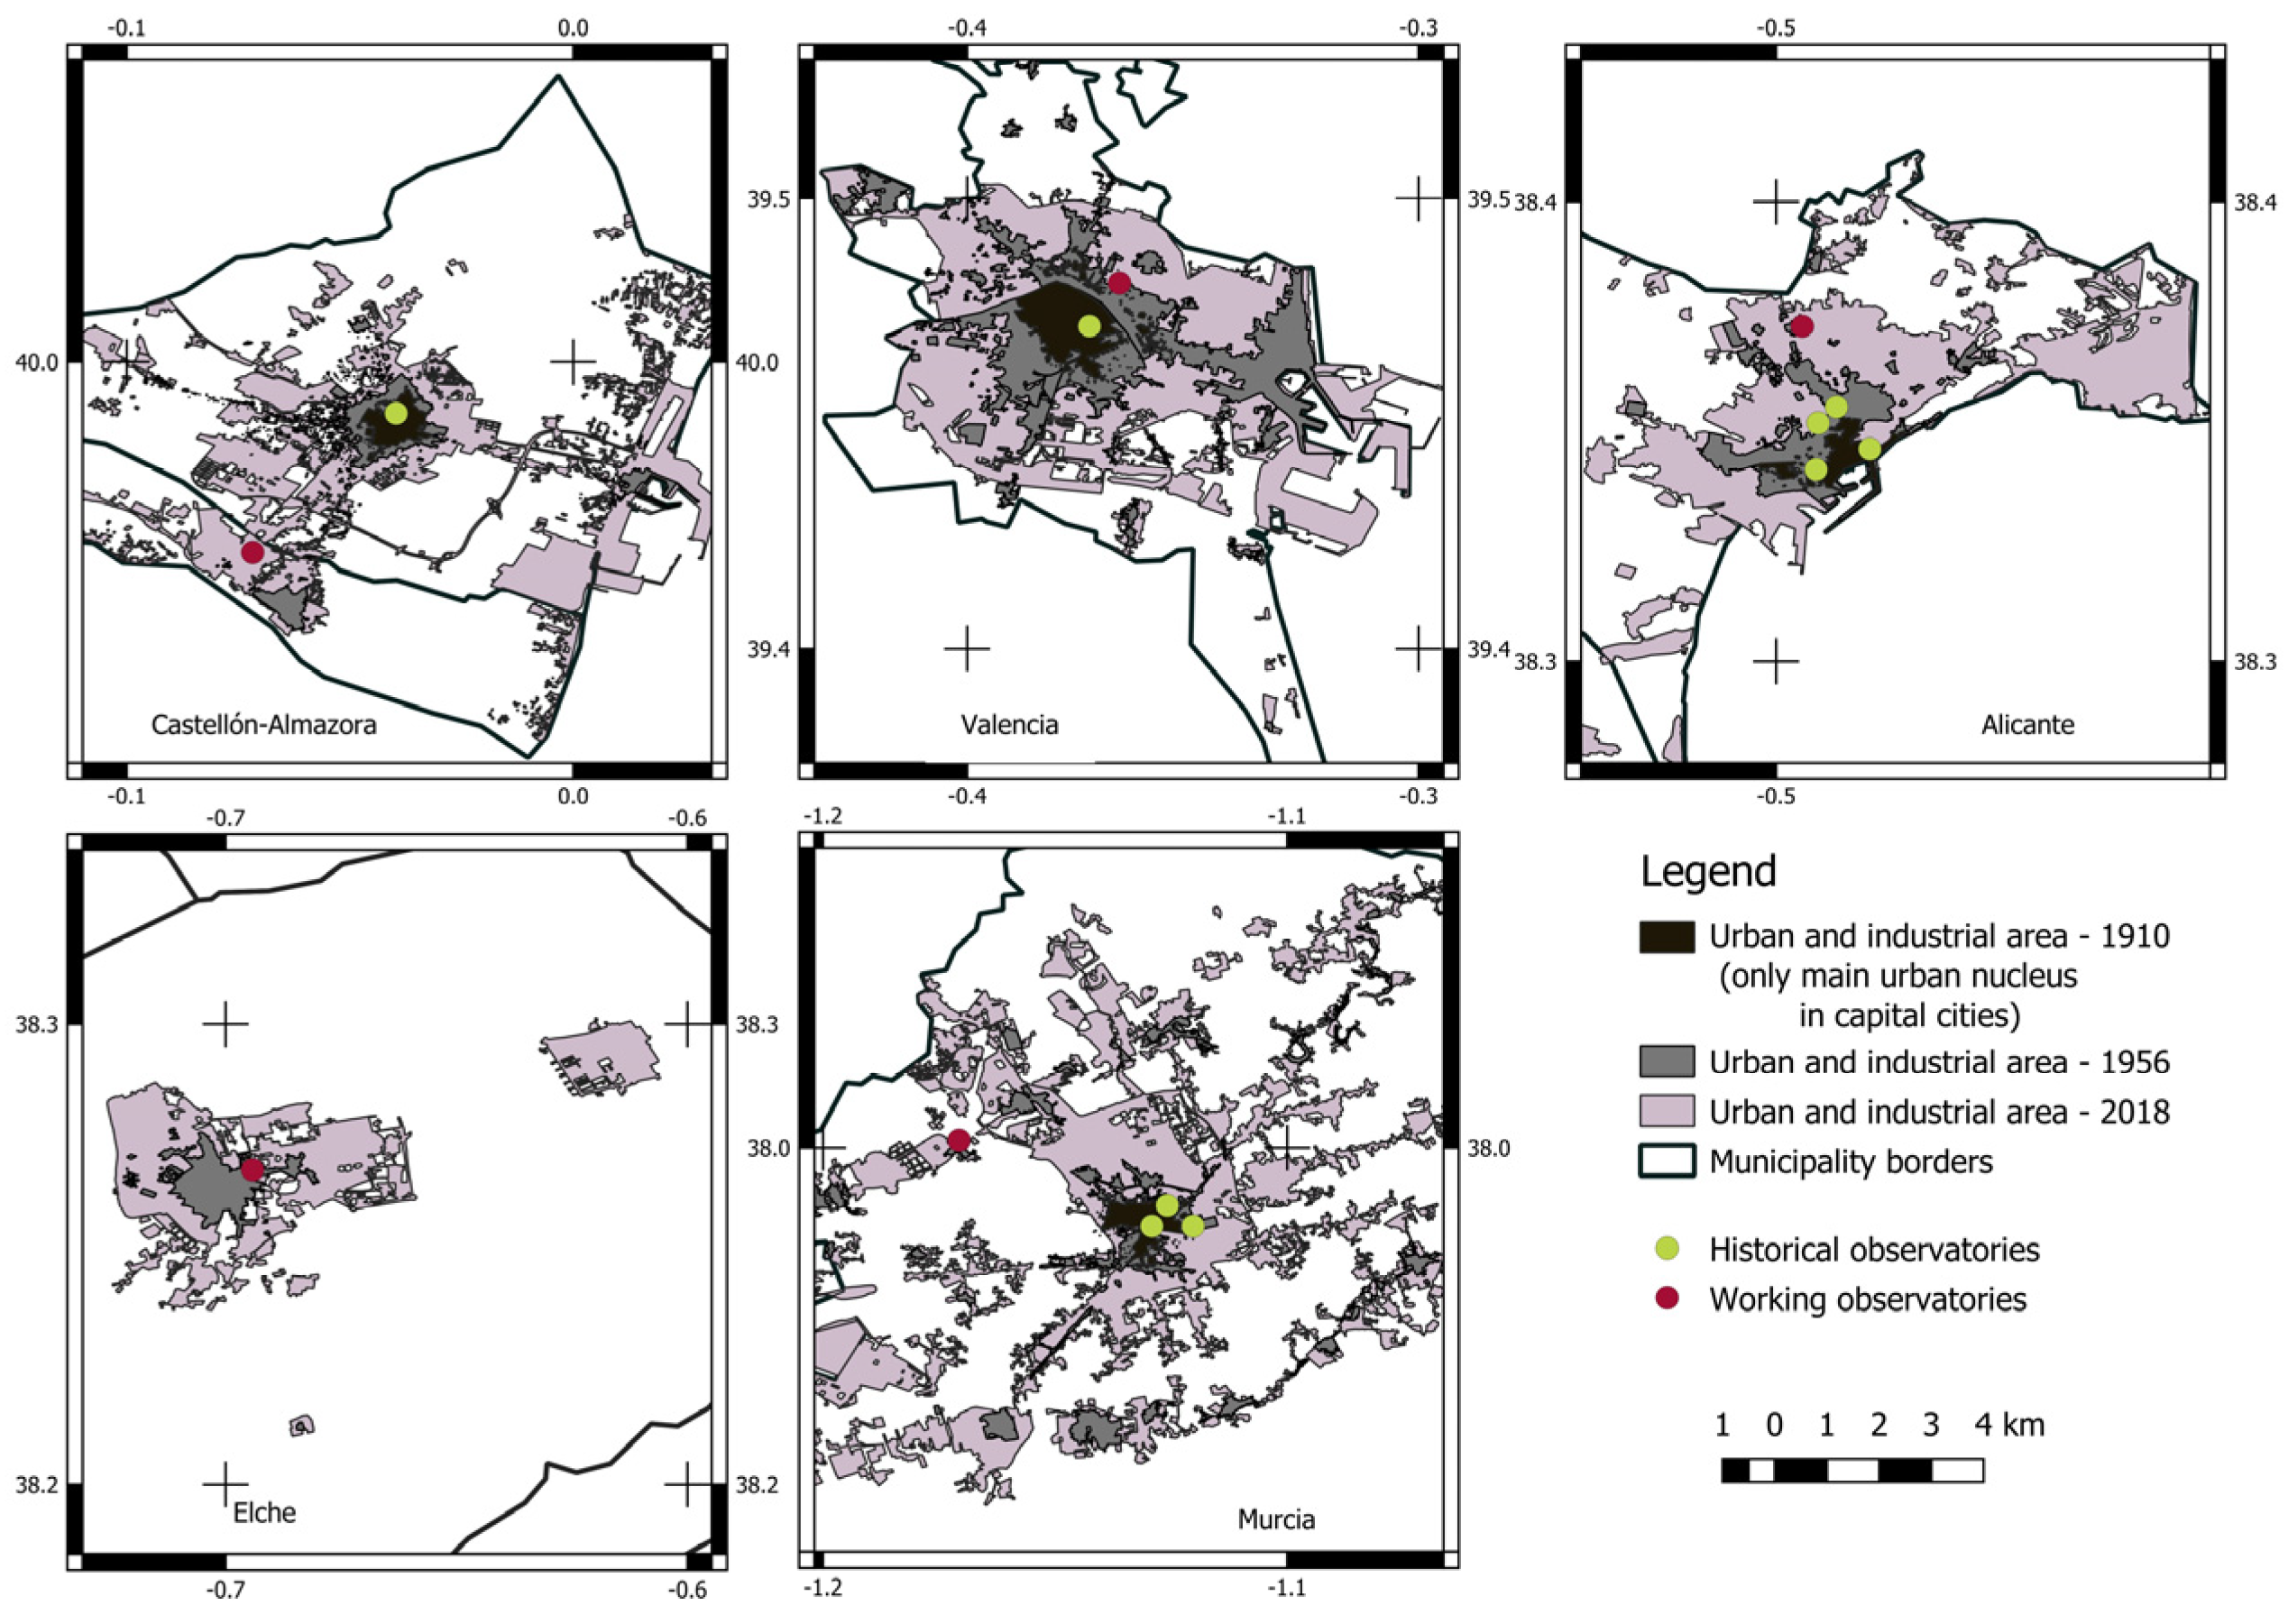
Figure 3.
LULC distribution in Castellon’s urban area between 1990 (left) and 2018 (right). Source: “Generated using European Union’s Copernicus Land Monitoring Service information; <https://doi.org/10.2909/5c1f2e03-fcba-47b1-afeb-bc05a47bada0> <https://doi.org/10.2909/71c95a07-e296-44fc-b22b-415f42acfdf0>”.
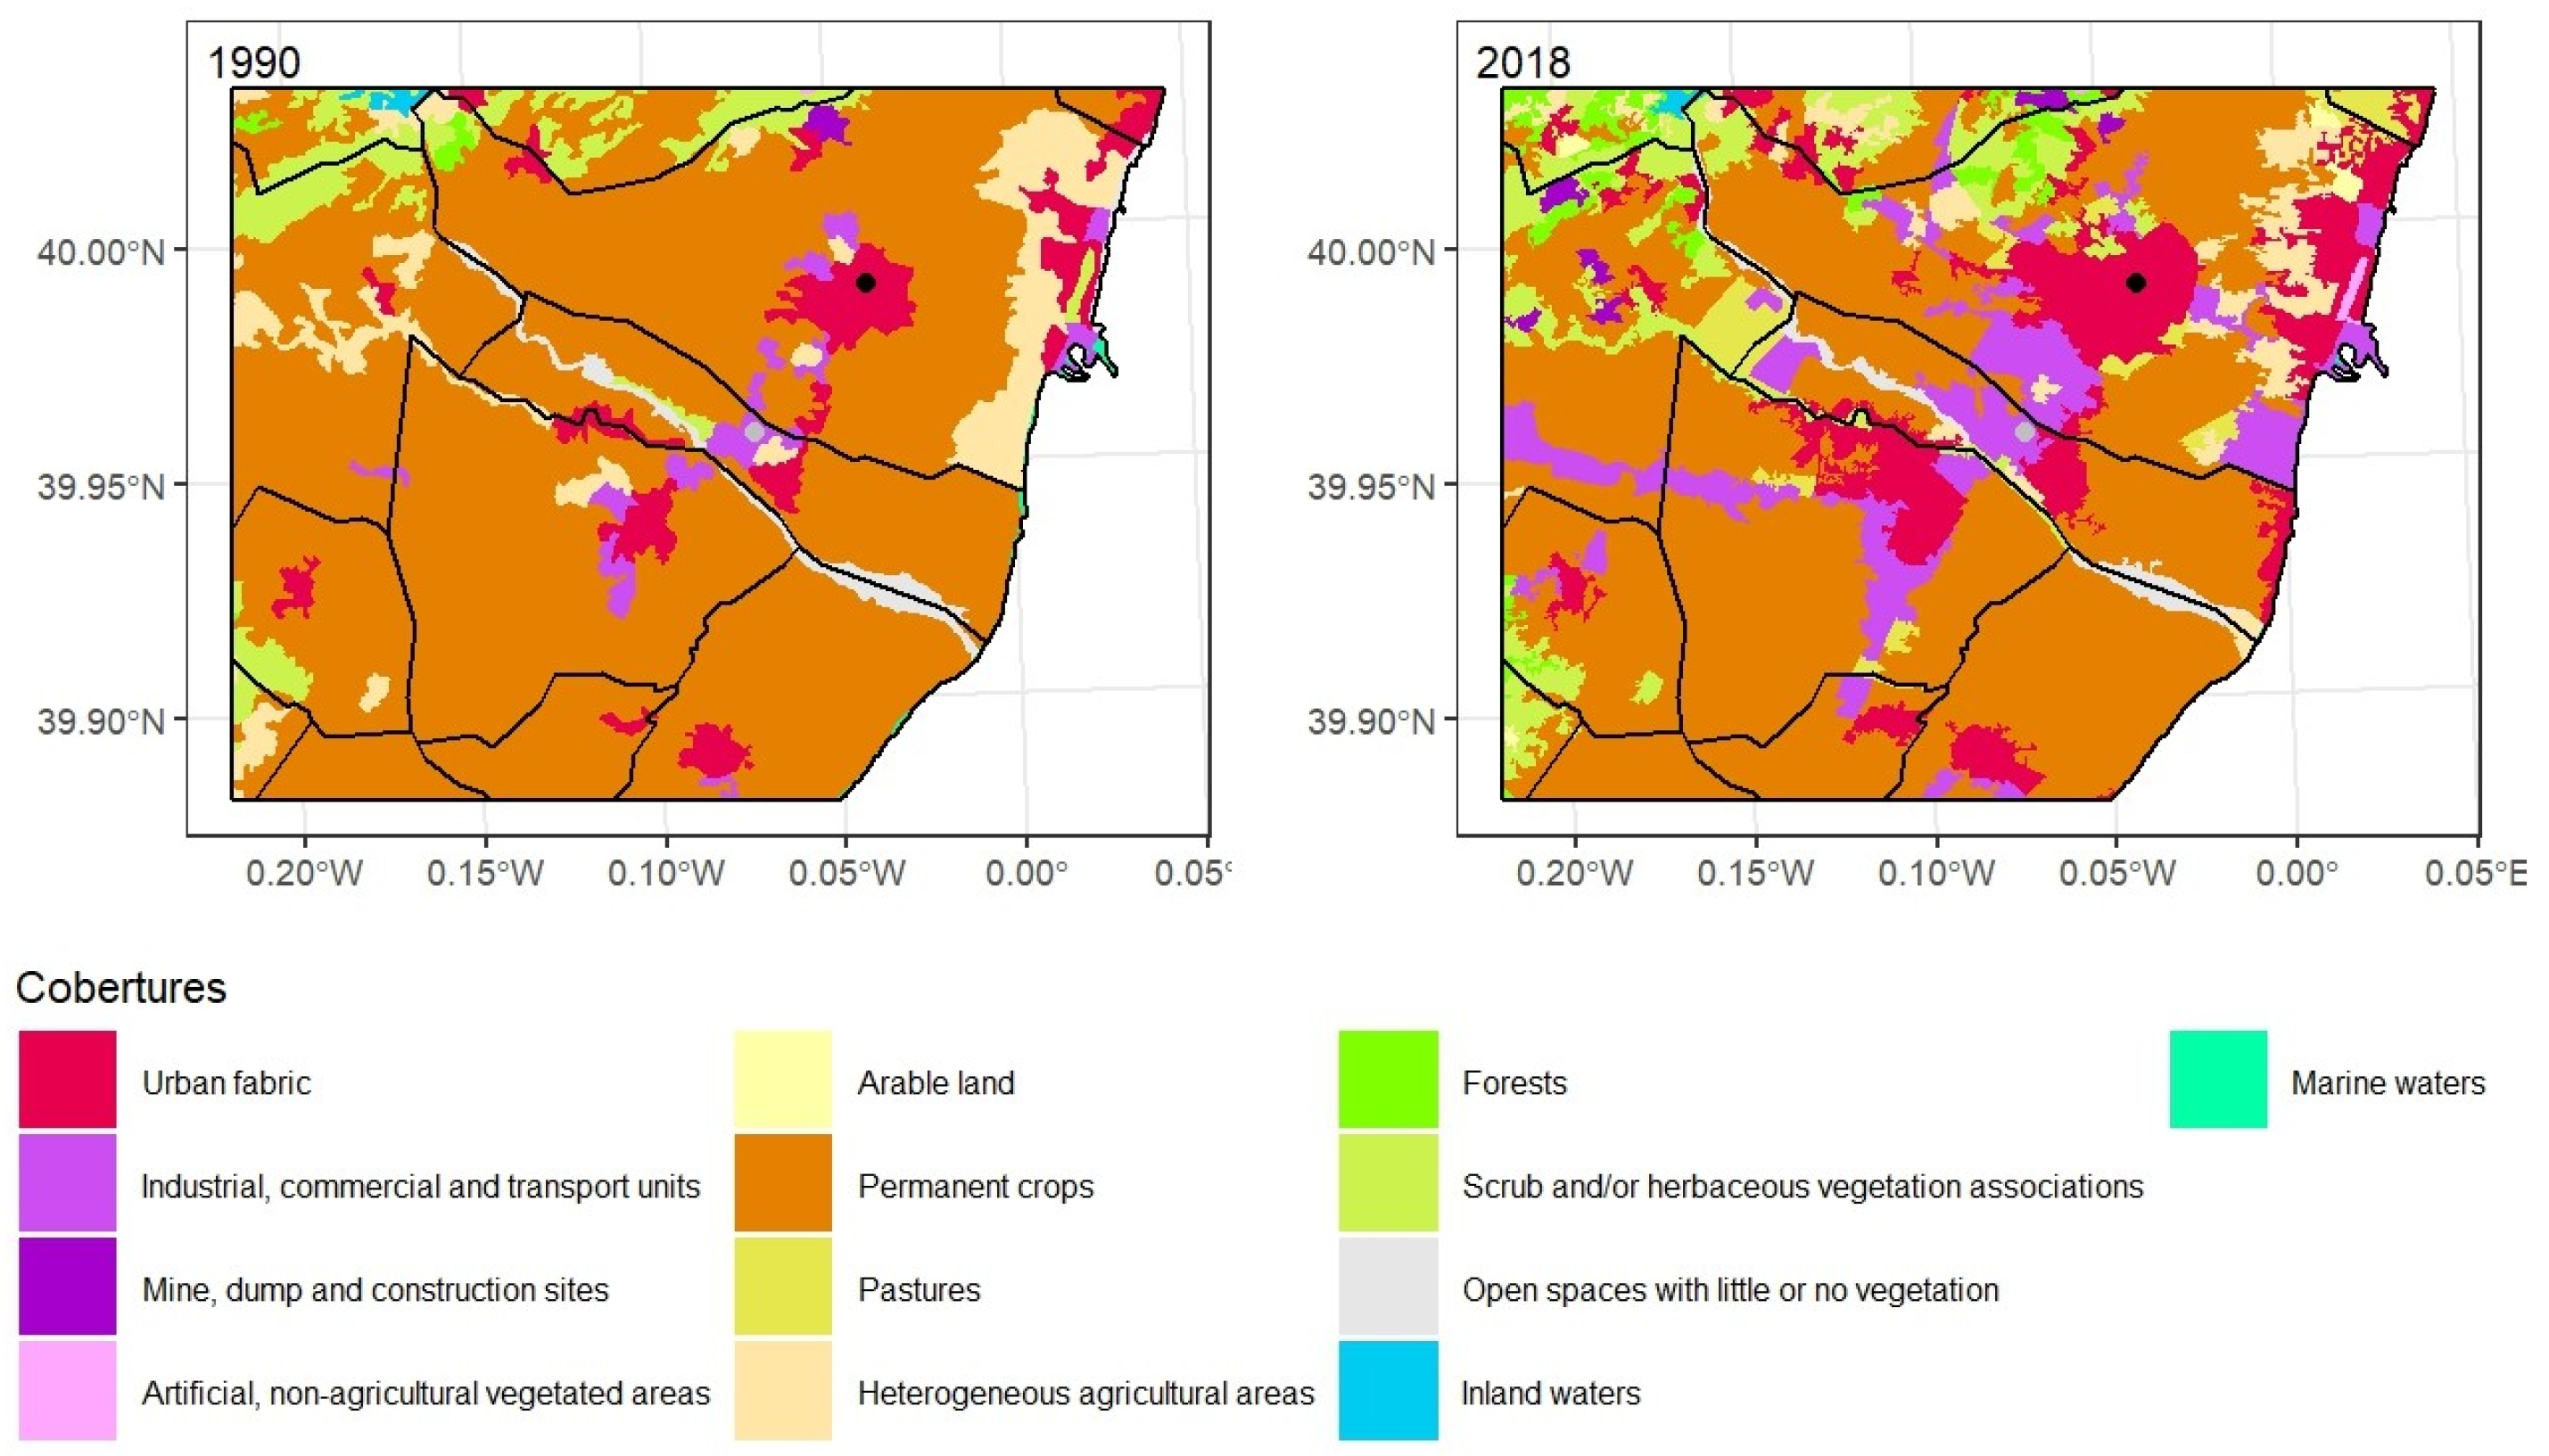
Figure 4.
LULC flows in Castellon’s urban area between 1990 and 2018. Source: “Generated using European Union’s Copernicus Land Monitoring Service information; <https://doi.org/10.2909/5c1f2e03-fcba-47b1-afeb-bc05a47bada0> <https://doi.org/10.2909/71c95a07-e296-44fc-b22b-415f42acfdf0>”.
Figure 4.
LULC flows in Castellon’s urban area between 1990 and 2018. Source: “Generated using European Union’s Copernicus Land Monitoring Service information; <https://doi.org/10.2909/5c1f2e03-fcba-47b1-afeb-bc05a47bada0> <https://doi.org/10.2909/71c95a07-e296-44fc-b22b-415f42acfdf0>”.
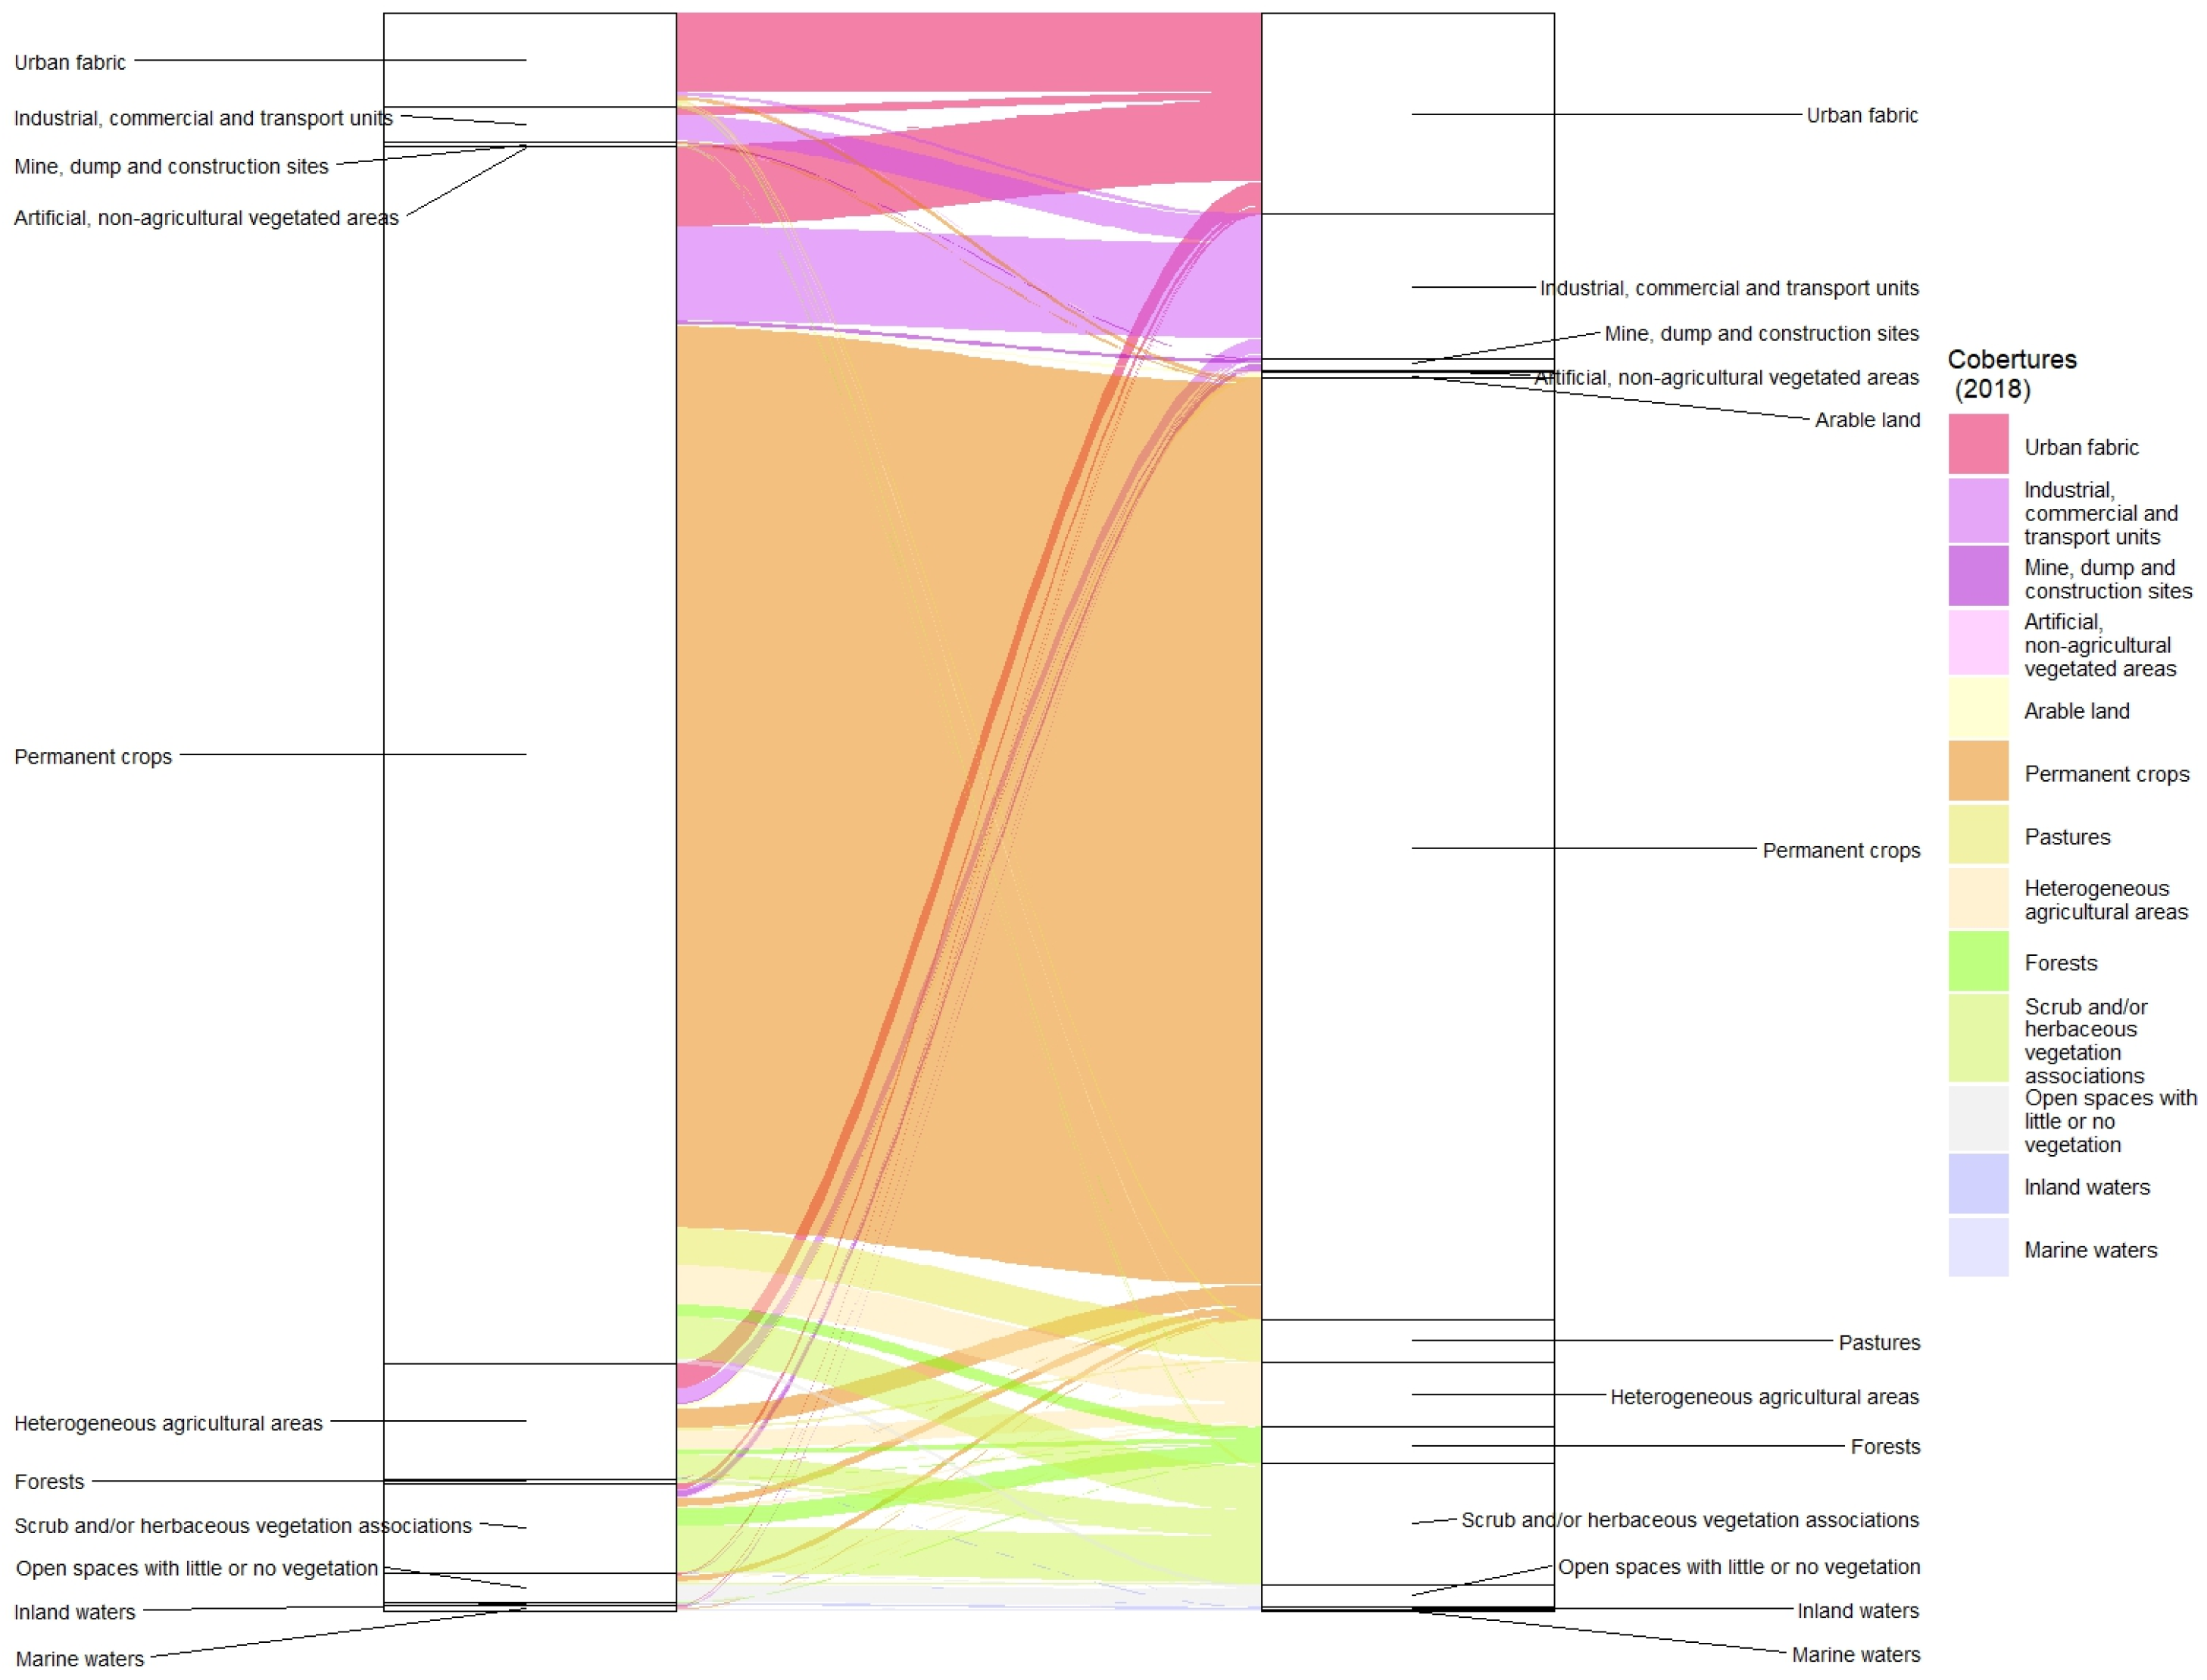
Figure 5.
LULC distribution in Valencia’s urban area between 1990 (left) and 2018 (right). Source: “Generated using European Union’s Copernicus Land Monitoring Service information; <https://doi.org/10.2909/5c1f2e03-fcba-47b1-afeb-bc05a47bada0> <https://doi.org/10.2909/71c95a07-e296-44fc-b22b-415f42acfdf0>”.
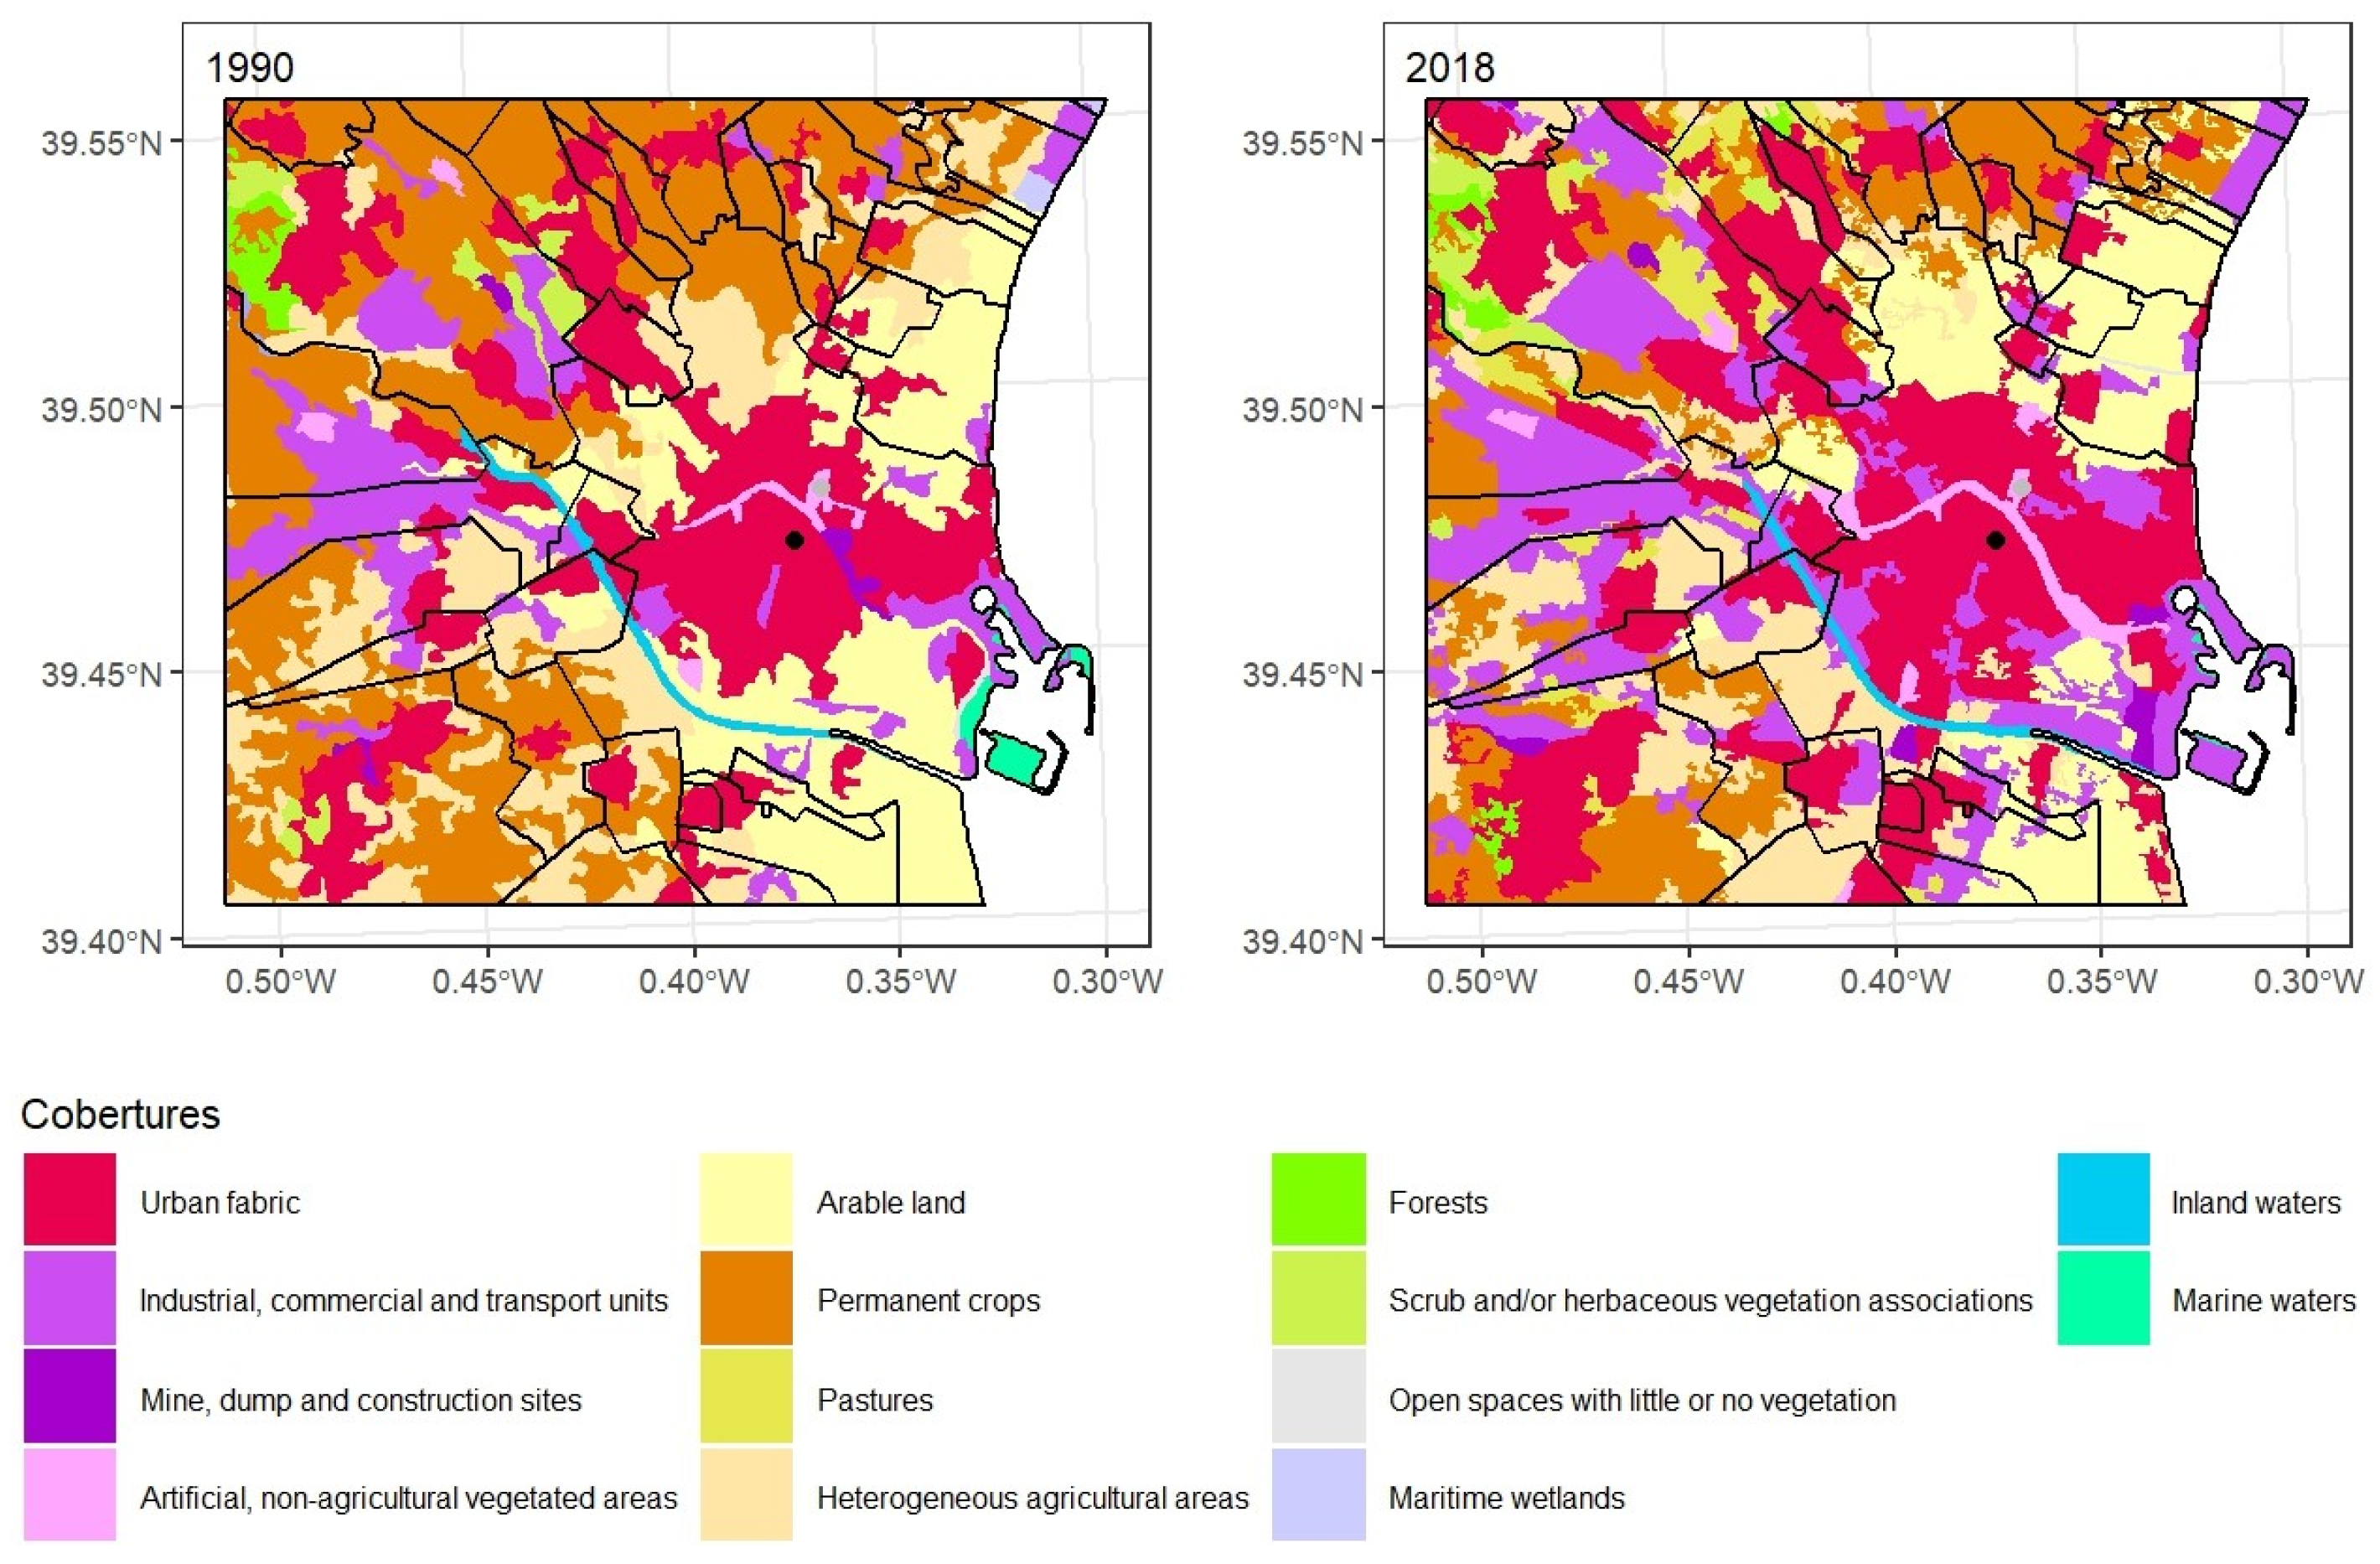
Figure 6.
LULC flows in Valencia’s urban area between 1990 and 2018. Source: “Generated using European Union’s Copernicus Land Monitoring Service information; <https://doi.org/10.2909/5c1f2e03-fcba-47b1-afeb-bc05a47bada0> <https://doi.org/10.2909/71c95a07-e296-44fc-b22b-415f42acfdf0>”.
Figure 6.
LULC flows in Valencia’s urban area between 1990 and 2018. Source: “Generated using European Union’s Copernicus Land Monitoring Service information; <https://doi.org/10.2909/5c1f2e03-fcba-47b1-afeb-bc05a47bada0> <https://doi.org/10.2909/71c95a07-e296-44fc-b22b-415f42acfdf0>”.
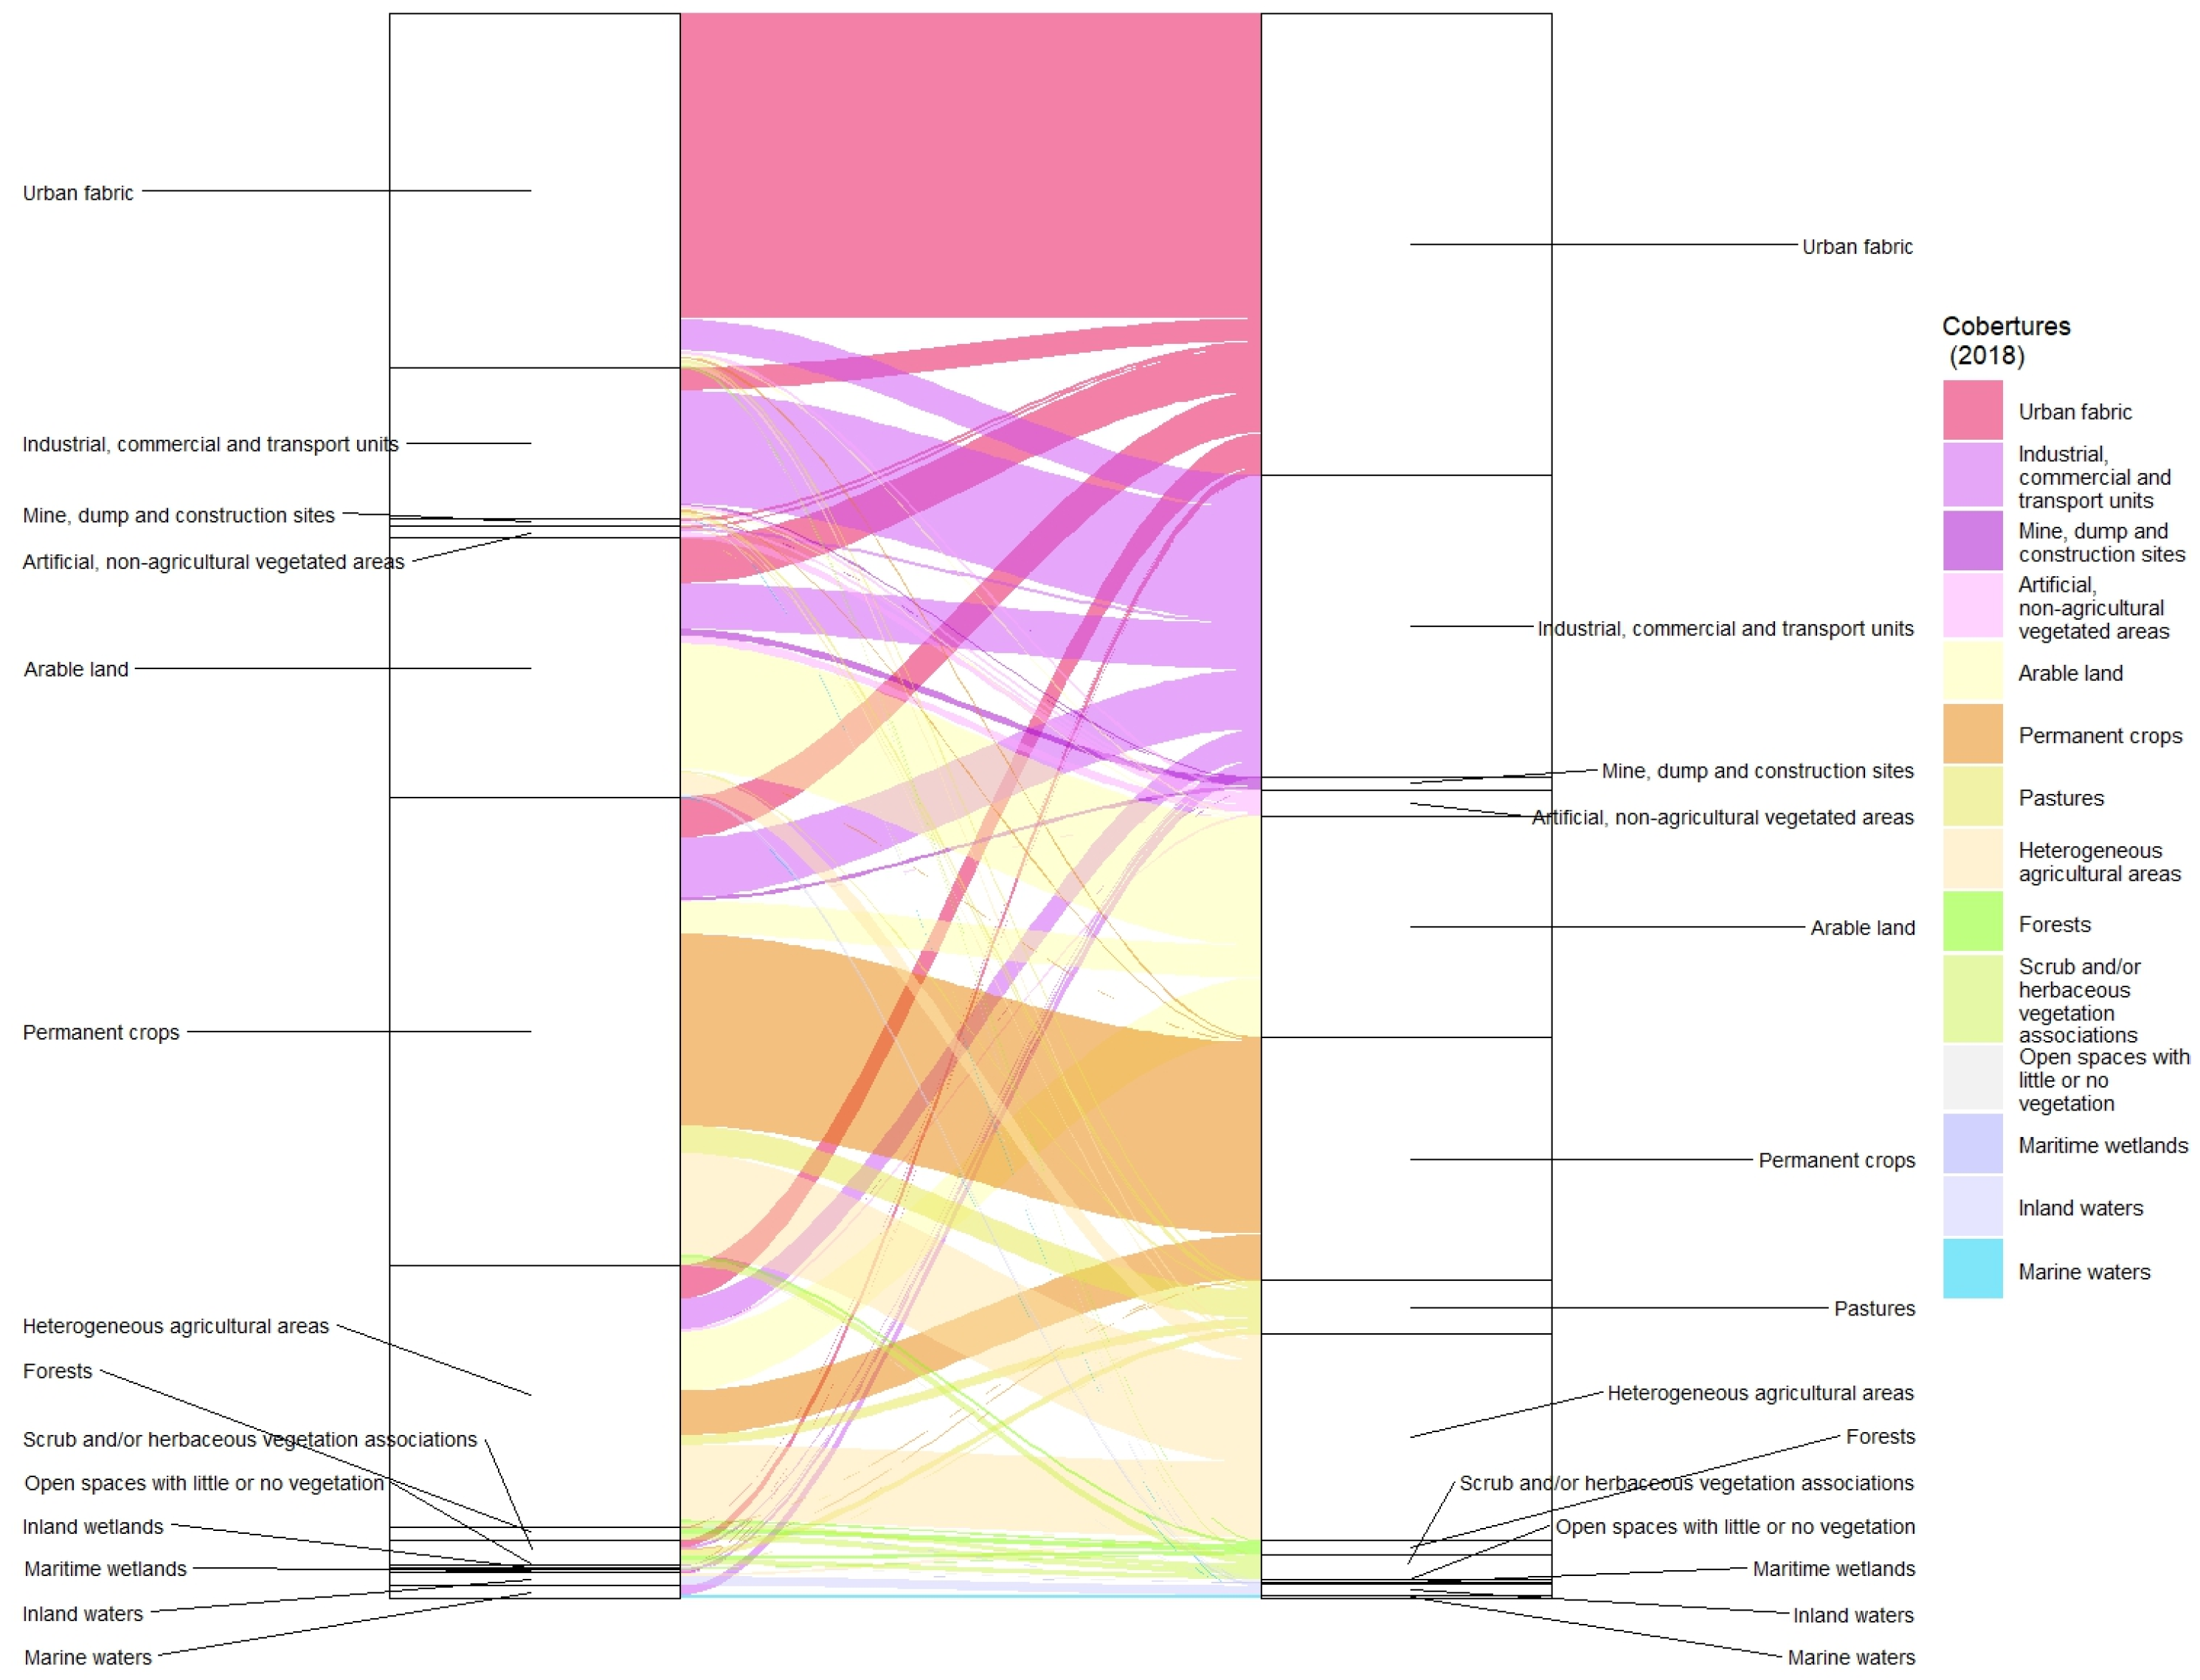
Figure 7.
LULC distribution in Alicante’s urban area between 1990 (left) and 2018 (right). Source: “Generated using European Union’s Copernicus Land Monitoring Service information; <https://doi.org/10.2909/5c1f2e03-fcba-47b1-afeb-bc05a47bada0> <https://doi.org/10.2909/71c95a07-e296-44fc-b22b-415f42acfdf0>”.
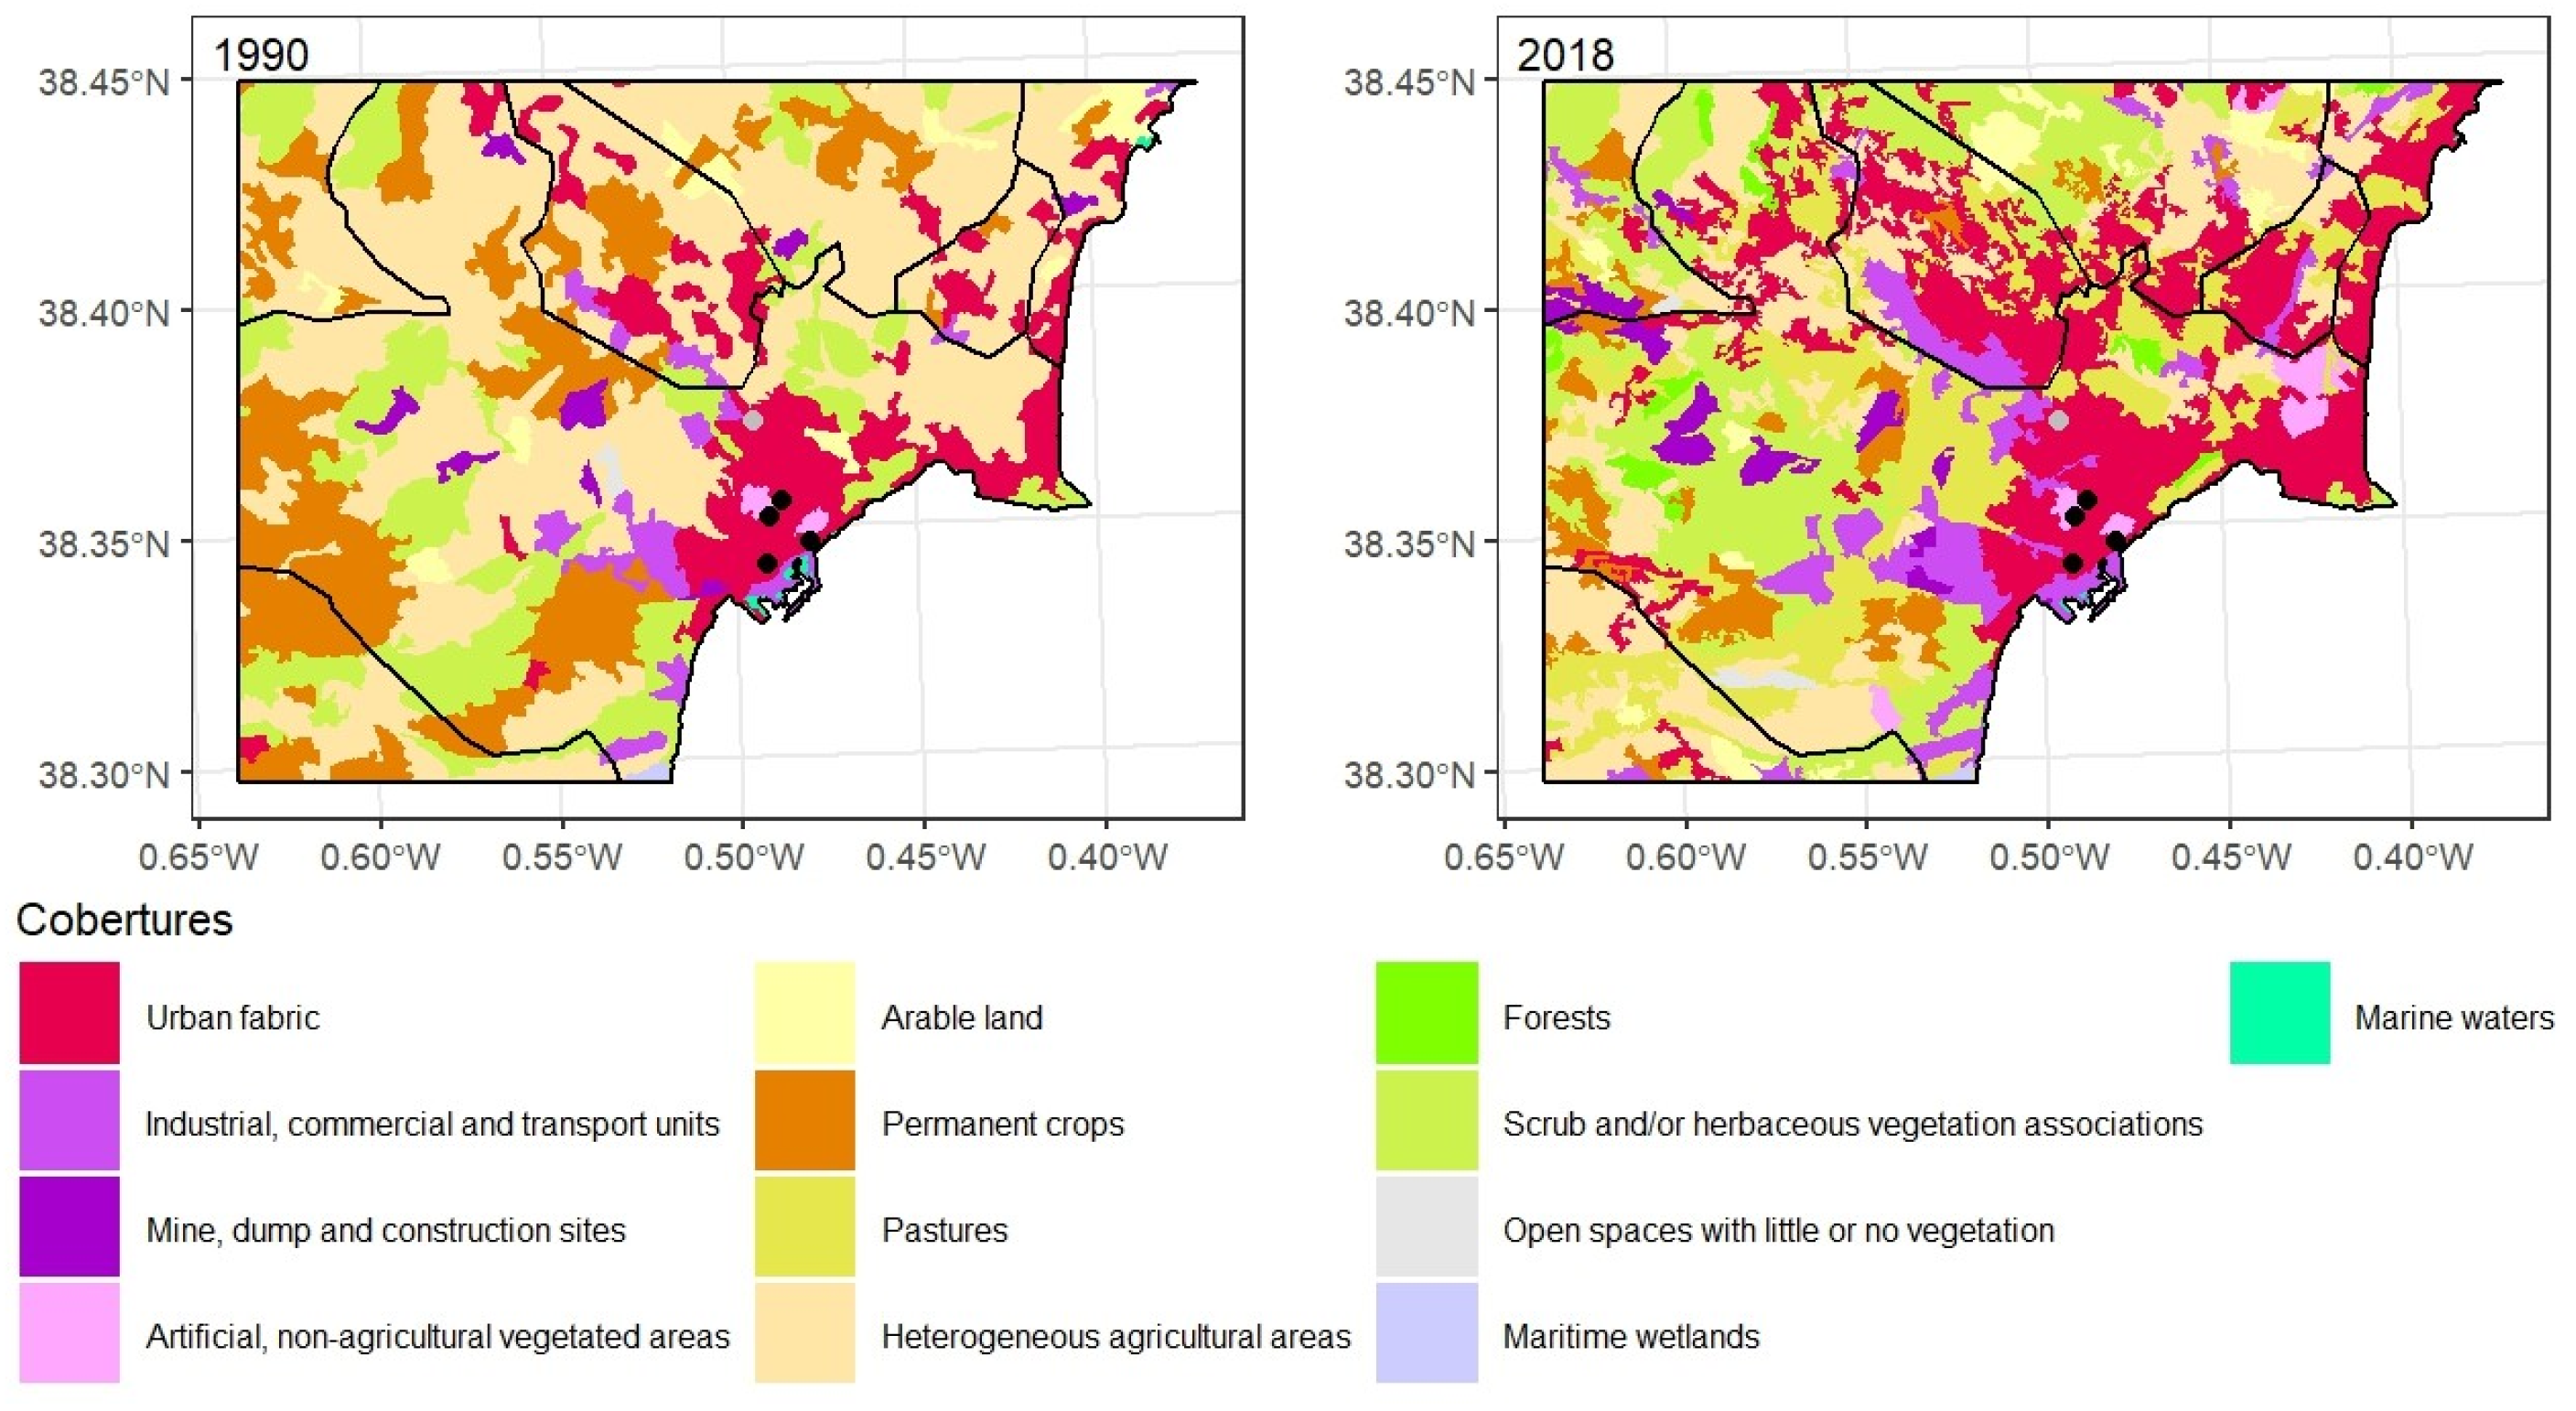
Figure 8.
LULC flows in Alicante’s urban area between 1990 and 2018. Source: “Generated using European Union’s Copernicus Land Monitoring Service information; <https://doi.org/10.2909/5c1f2e03-fcba-47b1-afeb-bc05a47bada0> <https://doi.org/10.2909/71c95a07-e296-44fc-b22b-415f42acfdf0>”.
Figure 8.
LULC flows in Alicante’s urban area between 1990 and 2018. Source: “Generated using European Union’s Copernicus Land Monitoring Service information; <https://doi.org/10.2909/5c1f2e03-fcba-47b1-afeb-bc05a47bada0> <https://doi.org/10.2909/71c95a07-e296-44fc-b22b-415f42acfdf0>”.
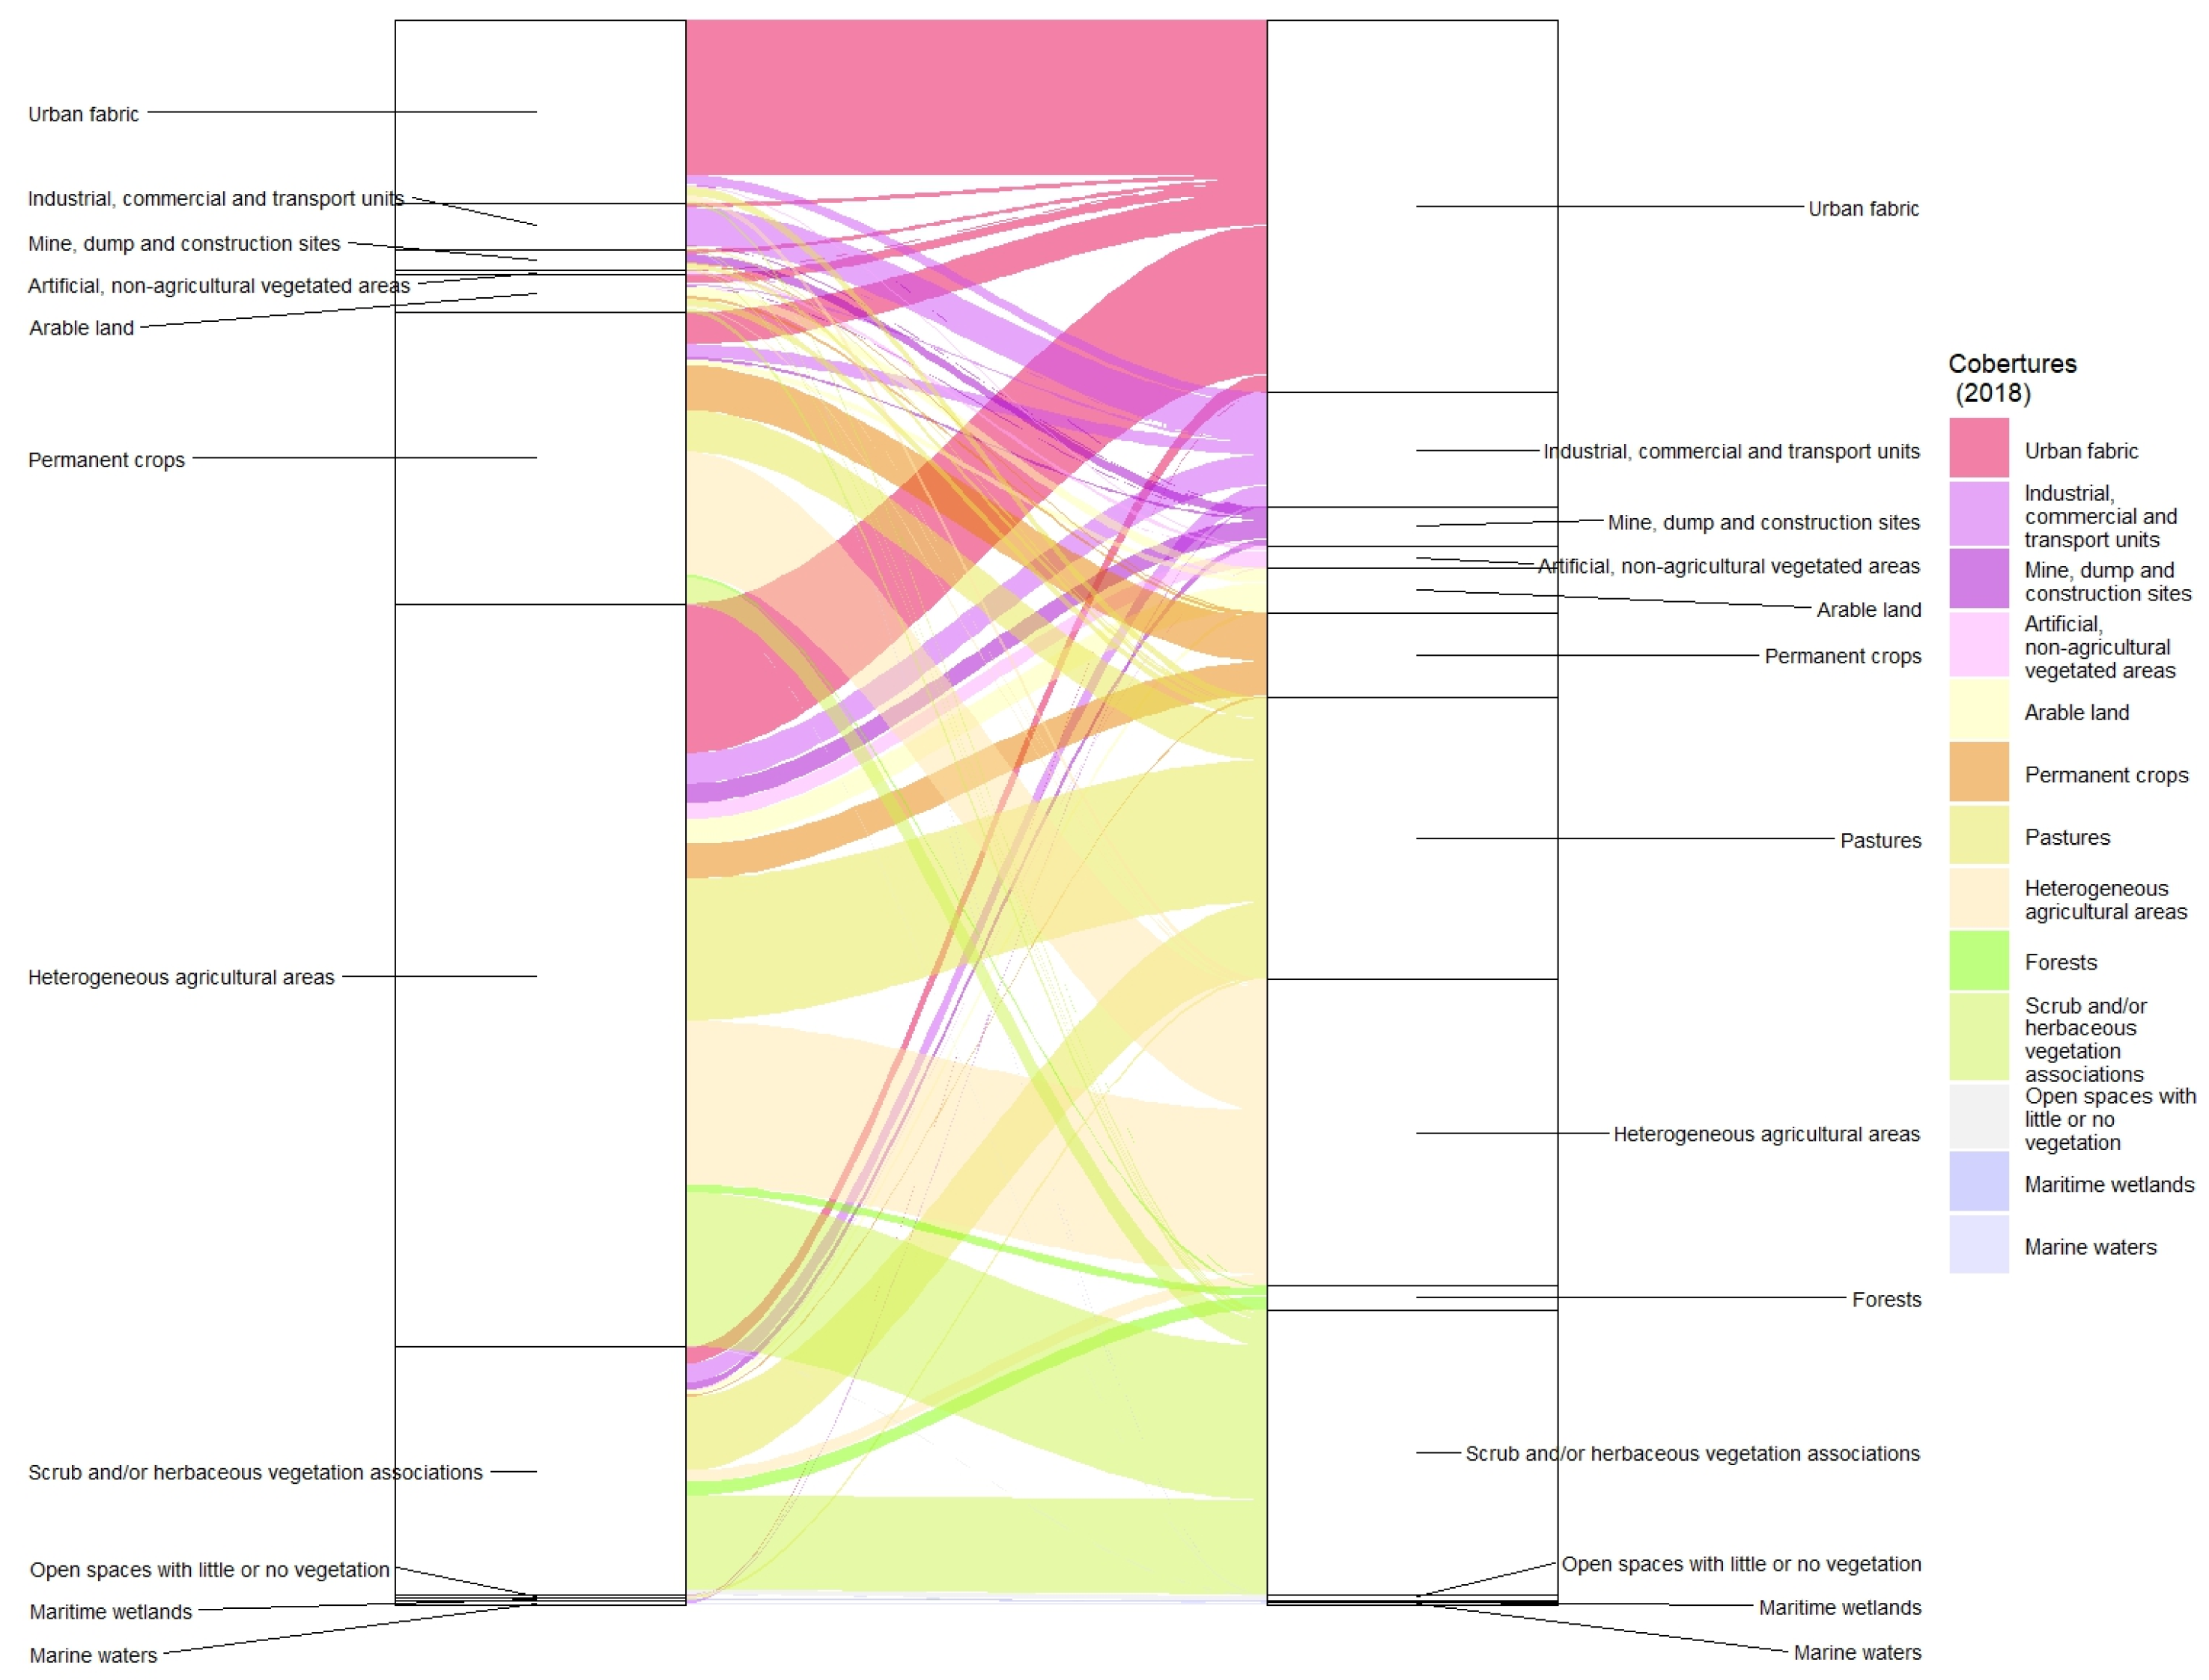
Figure 9.
LULC distribution in Elche’s urban area between 1990 (left) and 2018 (right). Source: “Generated using European Union’s Copernicus Land Monitoring Service information; <https://doi.org/10.2909/5c1f2e03-fcba-47b1-afeb-bc05a47bada0> <https://doi.org/10.2909/71c95a07-e296-44fc-b22b-415f42acfdf0>”.
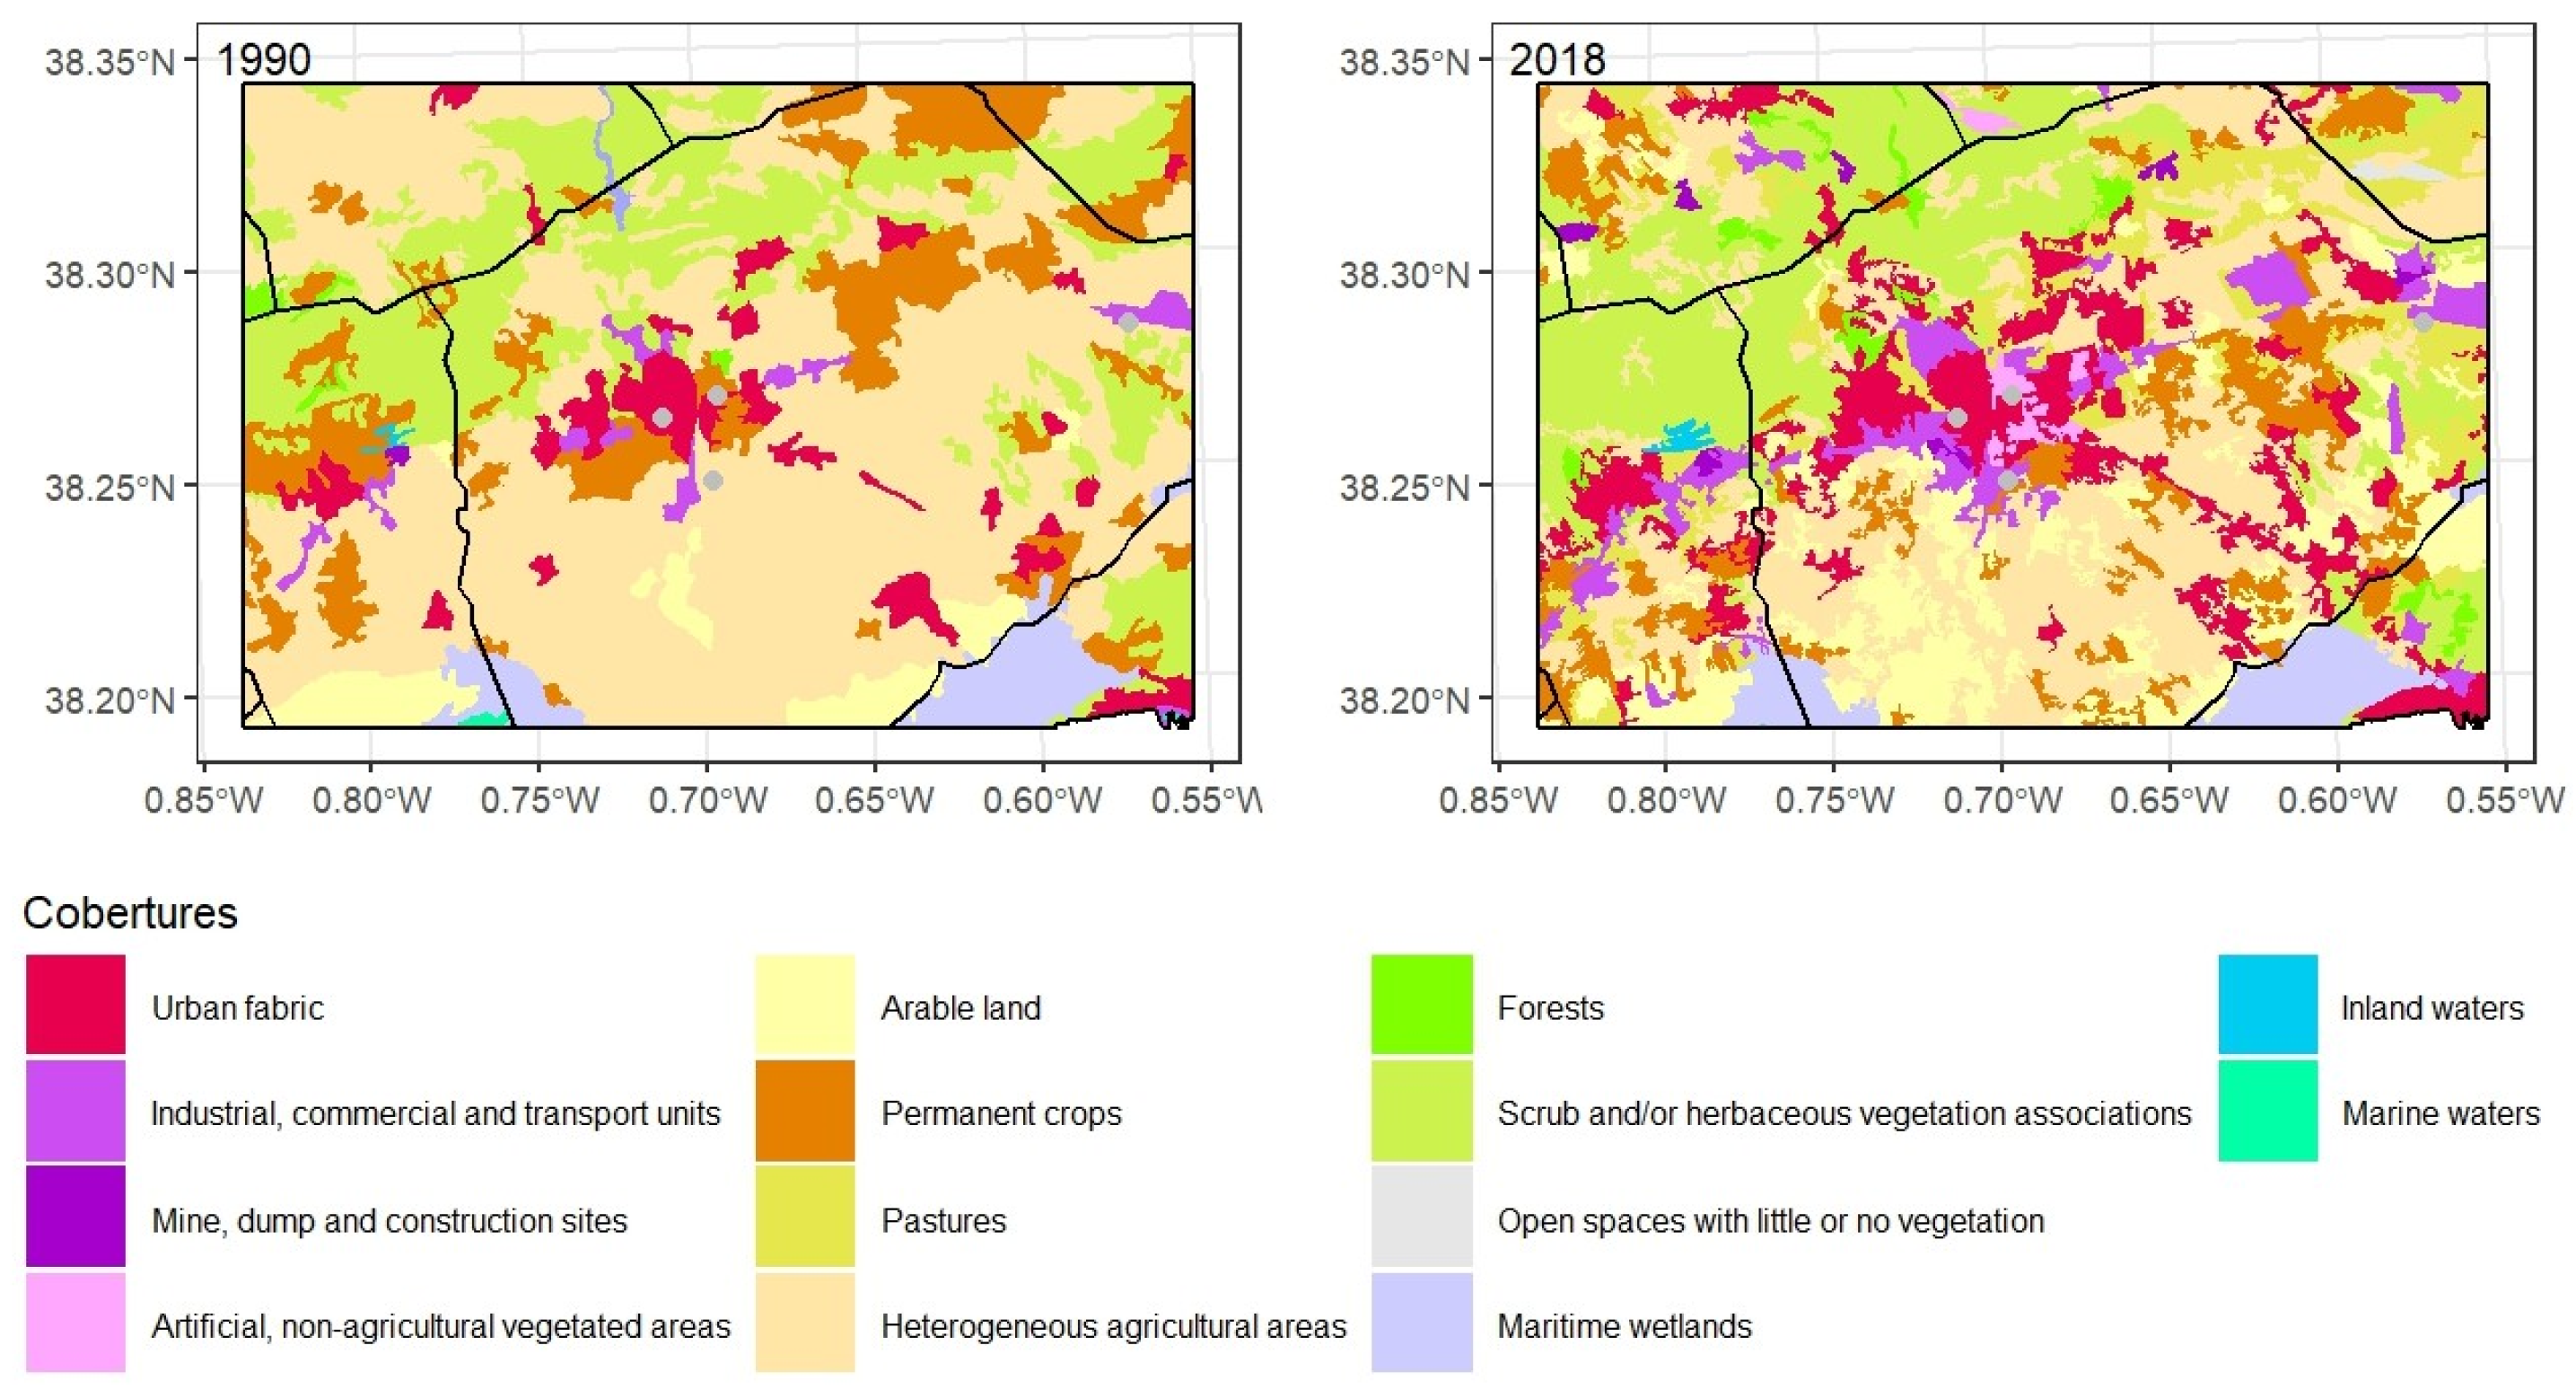
Figure 10.
LULC flows in Elche’s urban area between 1990 and 2018. Source: “Generated using European Union’s Copernicus Land Monitoring Service information; <https://doi.org/10.2909/5c1f2e03-fcba-47b1-afeb-bc05a47bada0> <https://doi.org/10.2909/71c95a07-e296-44fc-b22b-415f42acfdf0>”.
Figure 10.
LULC flows in Elche’s urban area between 1990 and 2018. Source: “Generated using European Union’s Copernicus Land Monitoring Service information; <https://doi.org/10.2909/5c1f2e03-fcba-47b1-afeb-bc05a47bada0> <https://doi.org/10.2909/71c95a07-e296-44fc-b22b-415f42acfdf0>”.
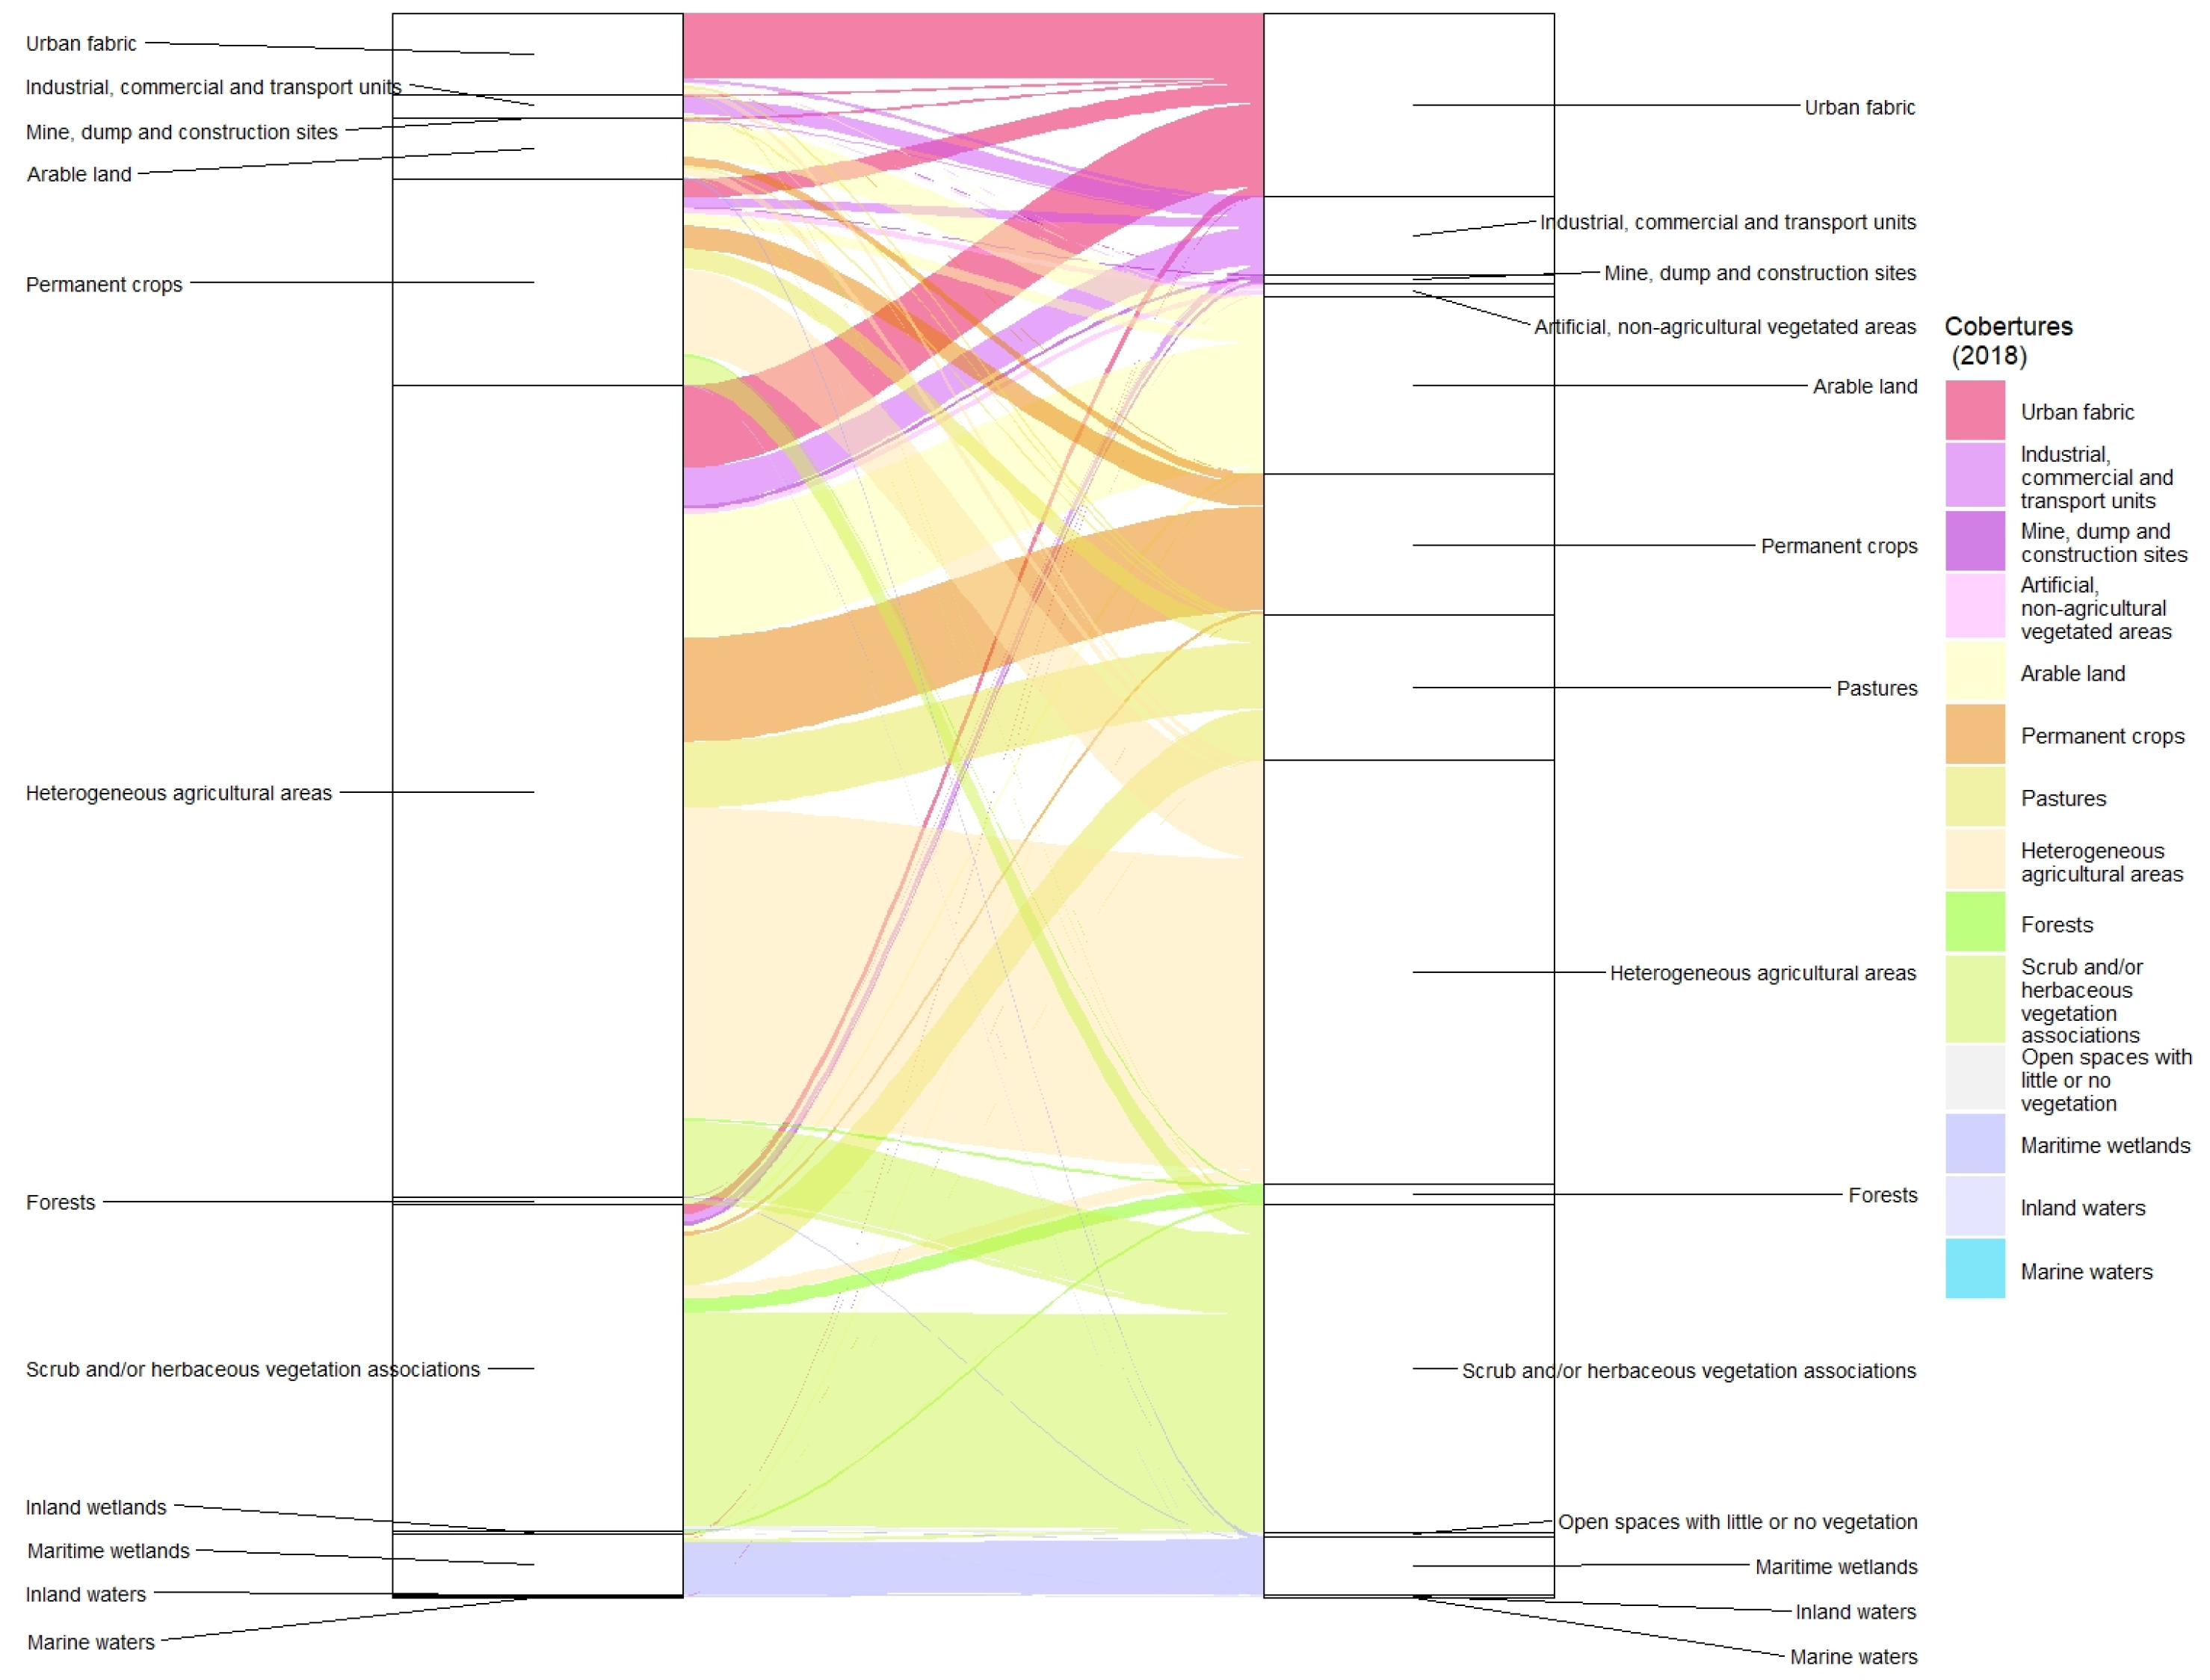
Figure 11.
LULC distribution in Murcia’s urban area between 1990 (left) and 2018 (right). Source: “Generated using European Union’s Copernicus Land Monitoring Service information; <https://doi.org/10.2909/5c1f2e03-fcba-47b1-afeb-bc05a47bada0> <https://doi.org/10.2909/71c95a07-e296-44fc-b22b-415f42acfdf0>”.
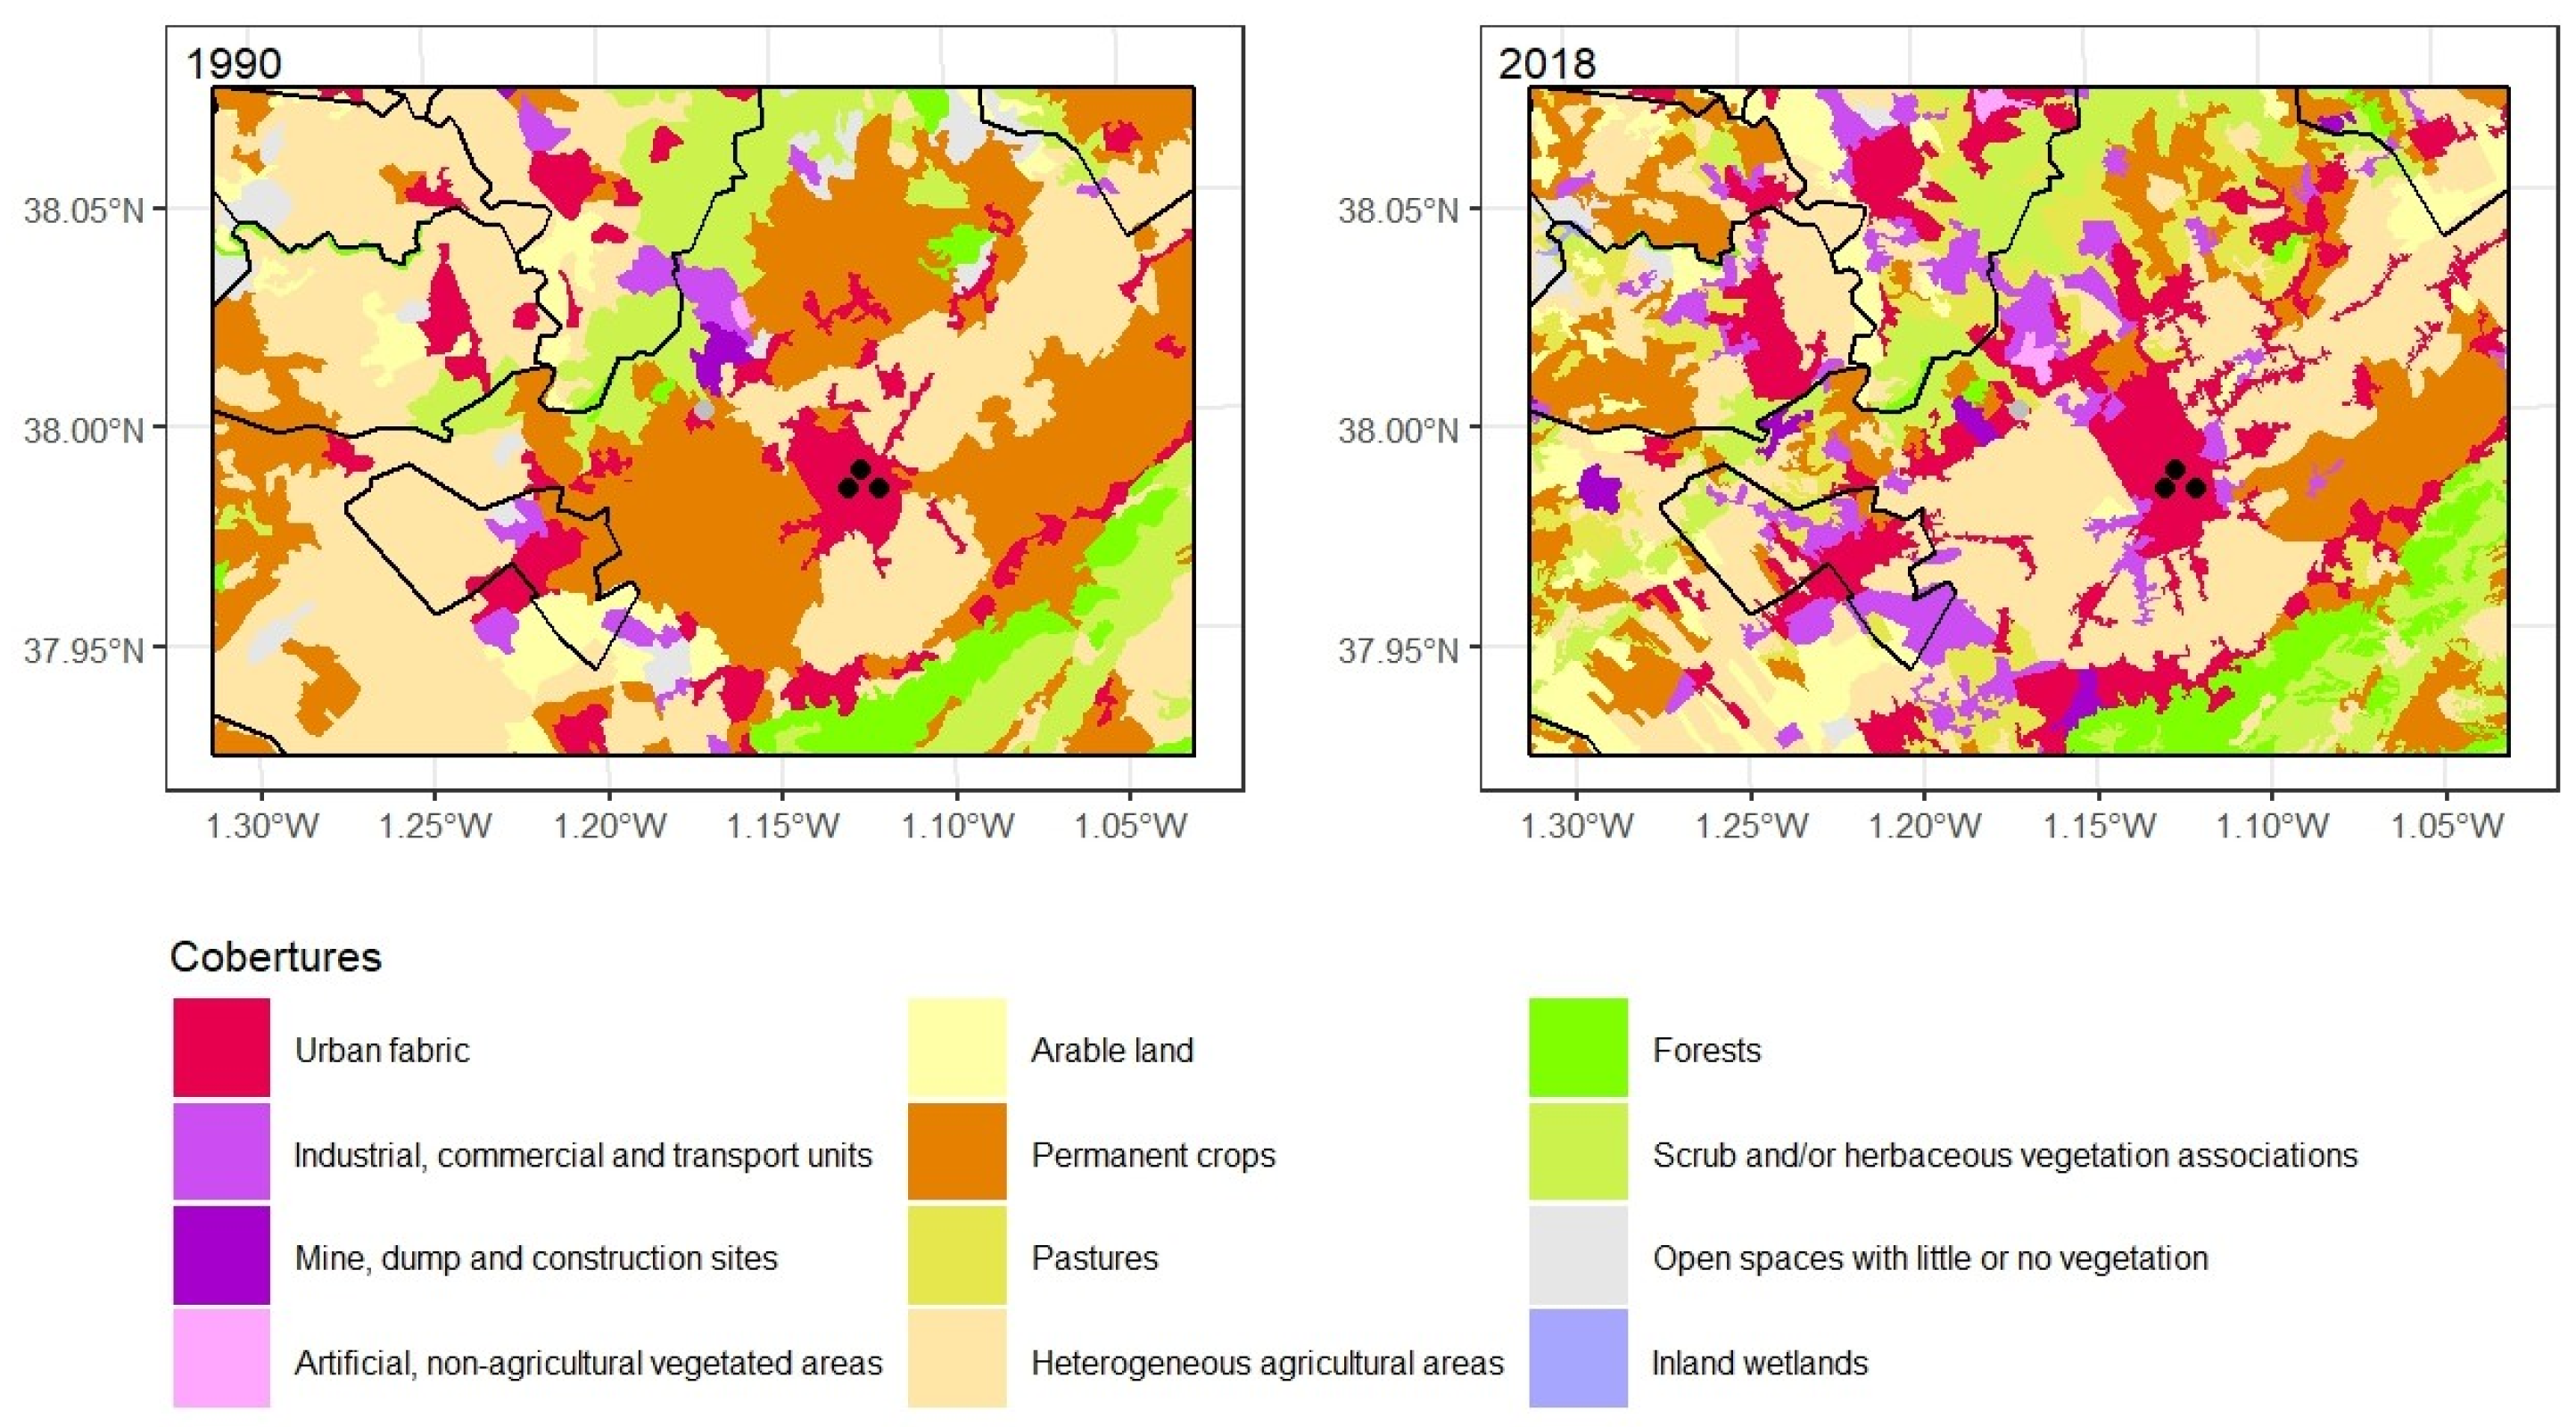
Figure 12.
LULC flows in Murcia’s urban area between 1990 and 2018. Source: “Generated using European Union’s Copernicus Land Monitoring Service information; <https://doi.org/10.2909/5c1f2e03-fcba-47b1-afeb-bc05a47bada0> <https://doi.org/10.2909/71c95a07-e296-44fc-b22b-415f42acfdf0>”.
Figure 12.
LULC flows in Murcia’s urban area between 1990 and 2018. Source: “Generated using European Union’s Copernicus Land Monitoring Service information; <https://doi.org/10.2909/5c1f2e03-fcba-47b1-afeb-bc05a47bada0> <https://doi.org/10.2909/71c95a07-e296-44fc-b22b-415f42acfdf0>”.
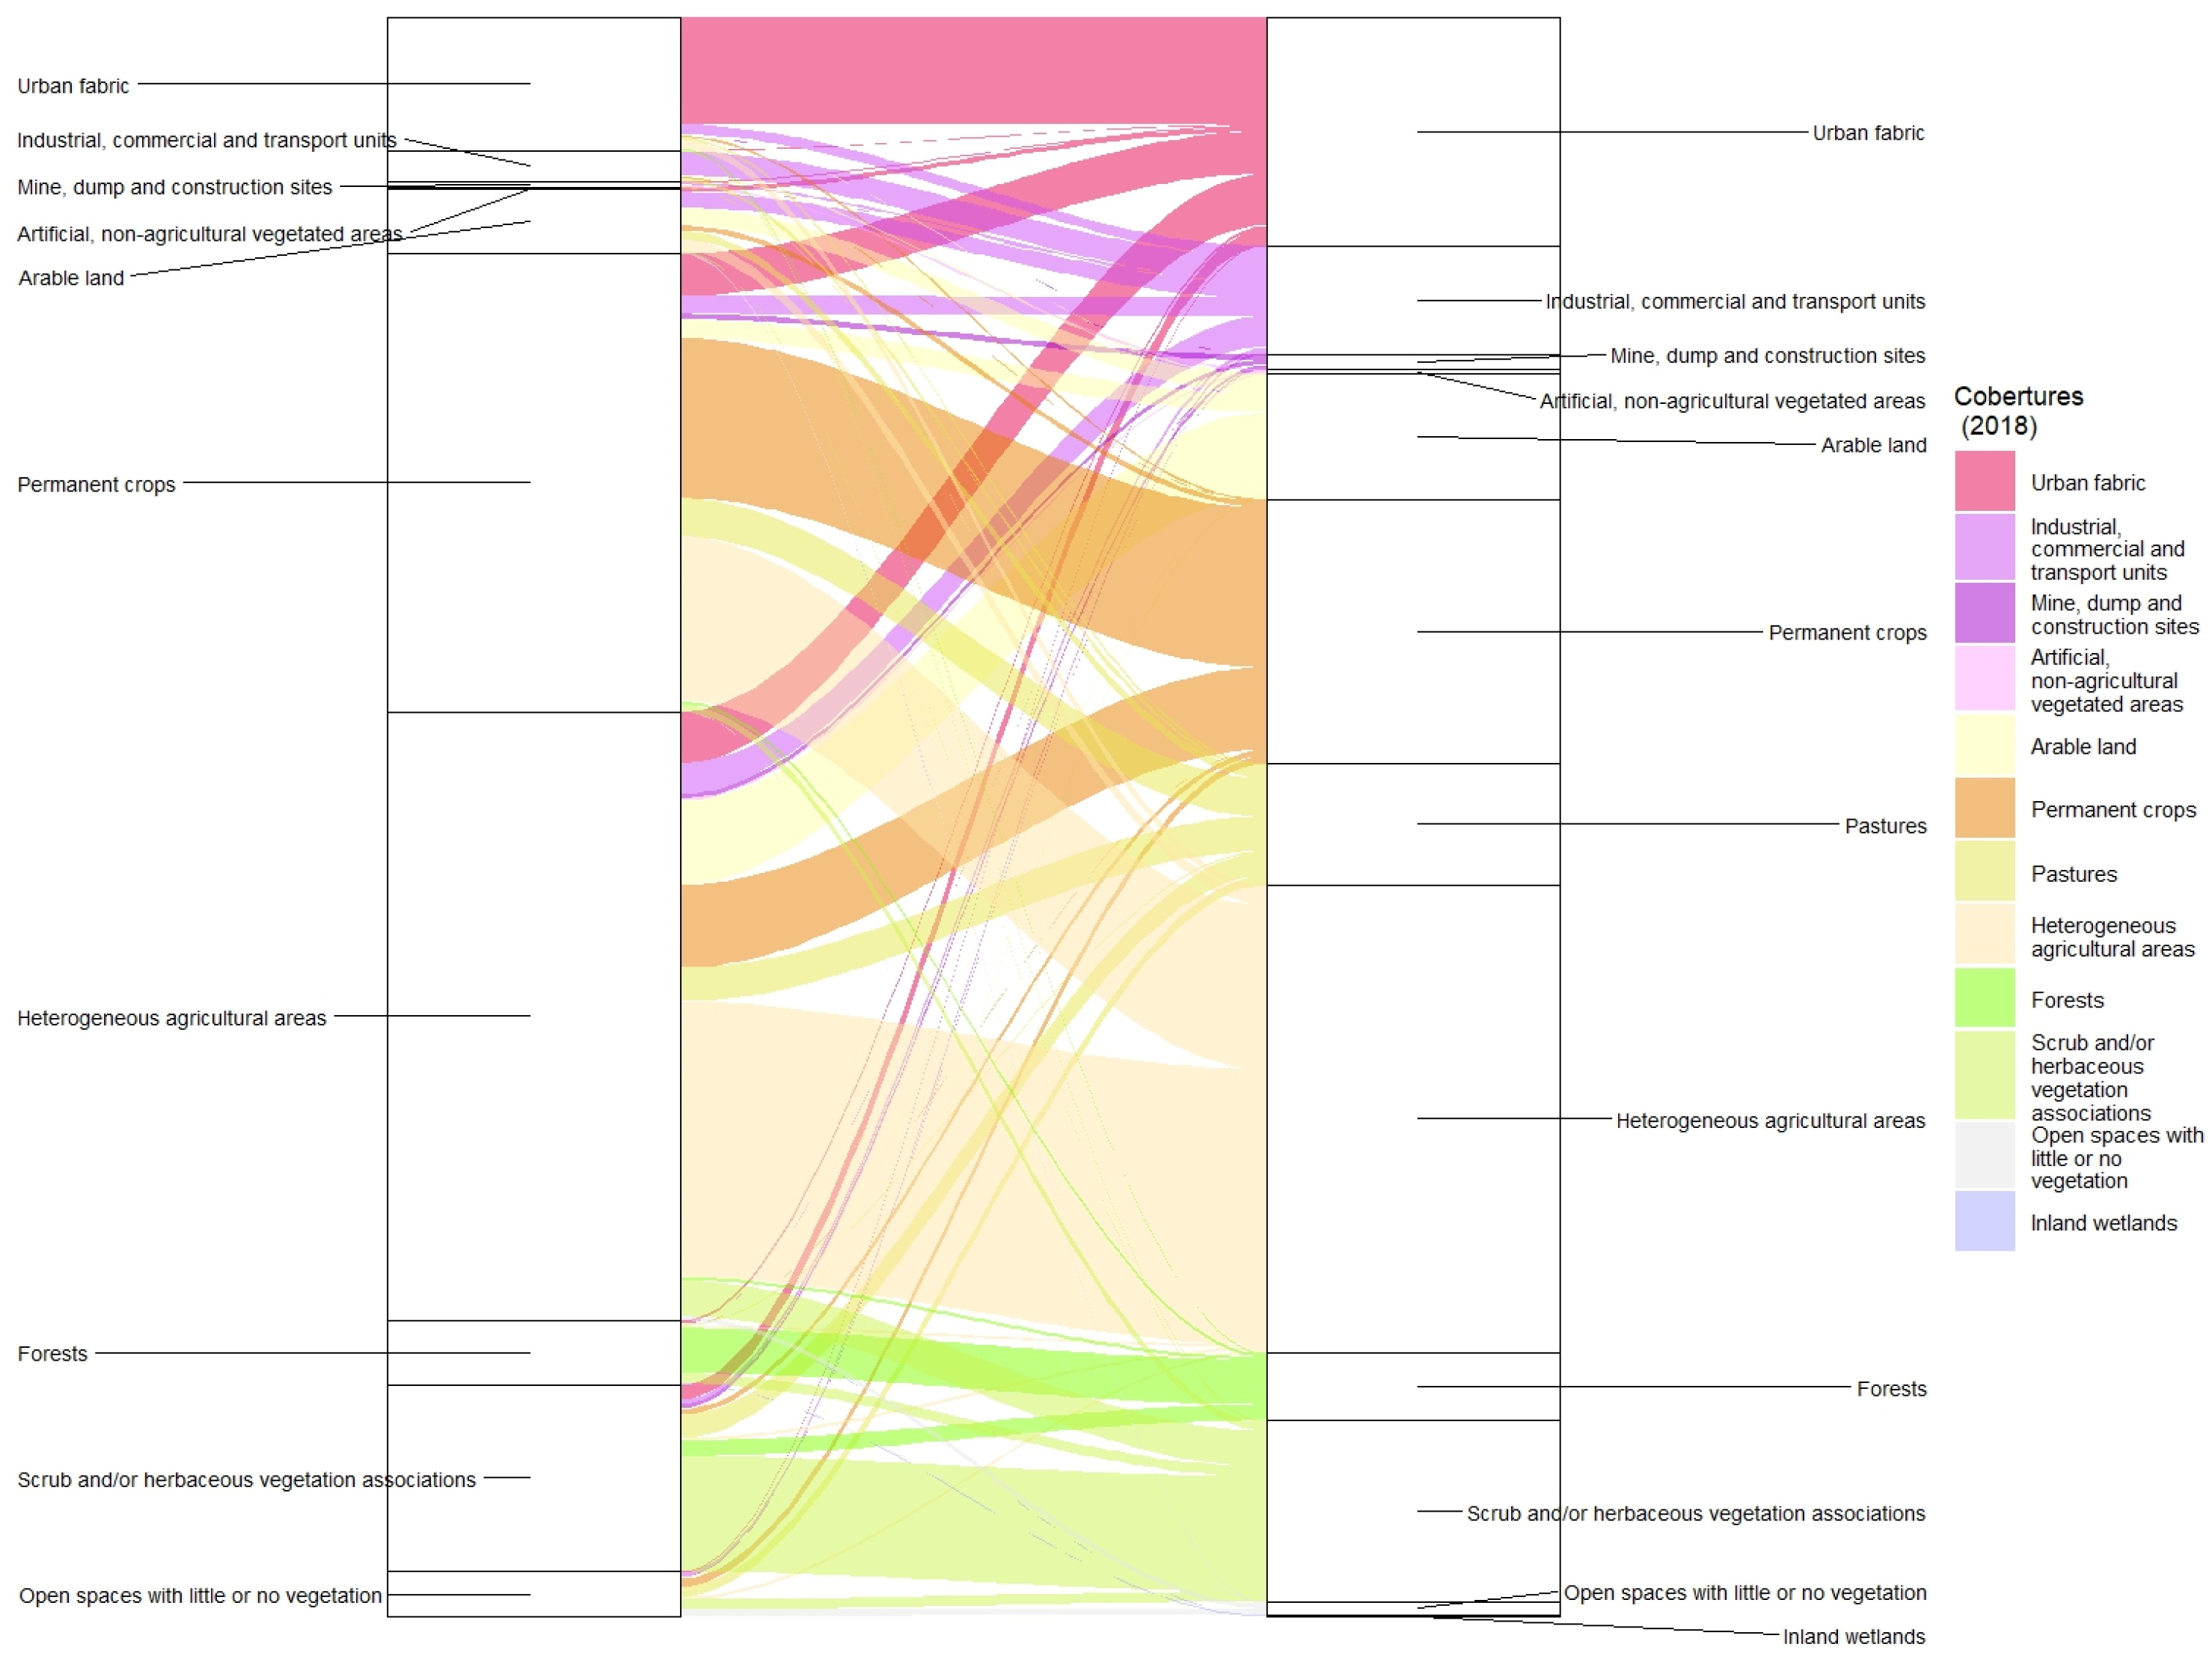
Figure 13.
Annual evolution of LST by urban area for constant uses. Source: [60,61,70]. “Generated using European Union’s Copernicus Land Monitoring Service information; <https://doi.org/10.2909/5c1f2e03-fcba-47b1-afeb-bc05a47bada0> <https://doi.org/10.2909/71c95a07-e296-44fc-b22b-415f42acfdf0>”.
Figure 13.
Annual evolution of LST by urban area for constant uses. Source: [60,61,70]. “Generated using European Union’s Copernicus Land Monitoring Service information; <https://doi.org/10.2909/5c1f2e03-fcba-47b1-afeb-bc05a47bada0> <https://doi.org/10.2909/71c95a07-e296-44fc-b22b-415f42acfdf0>”.
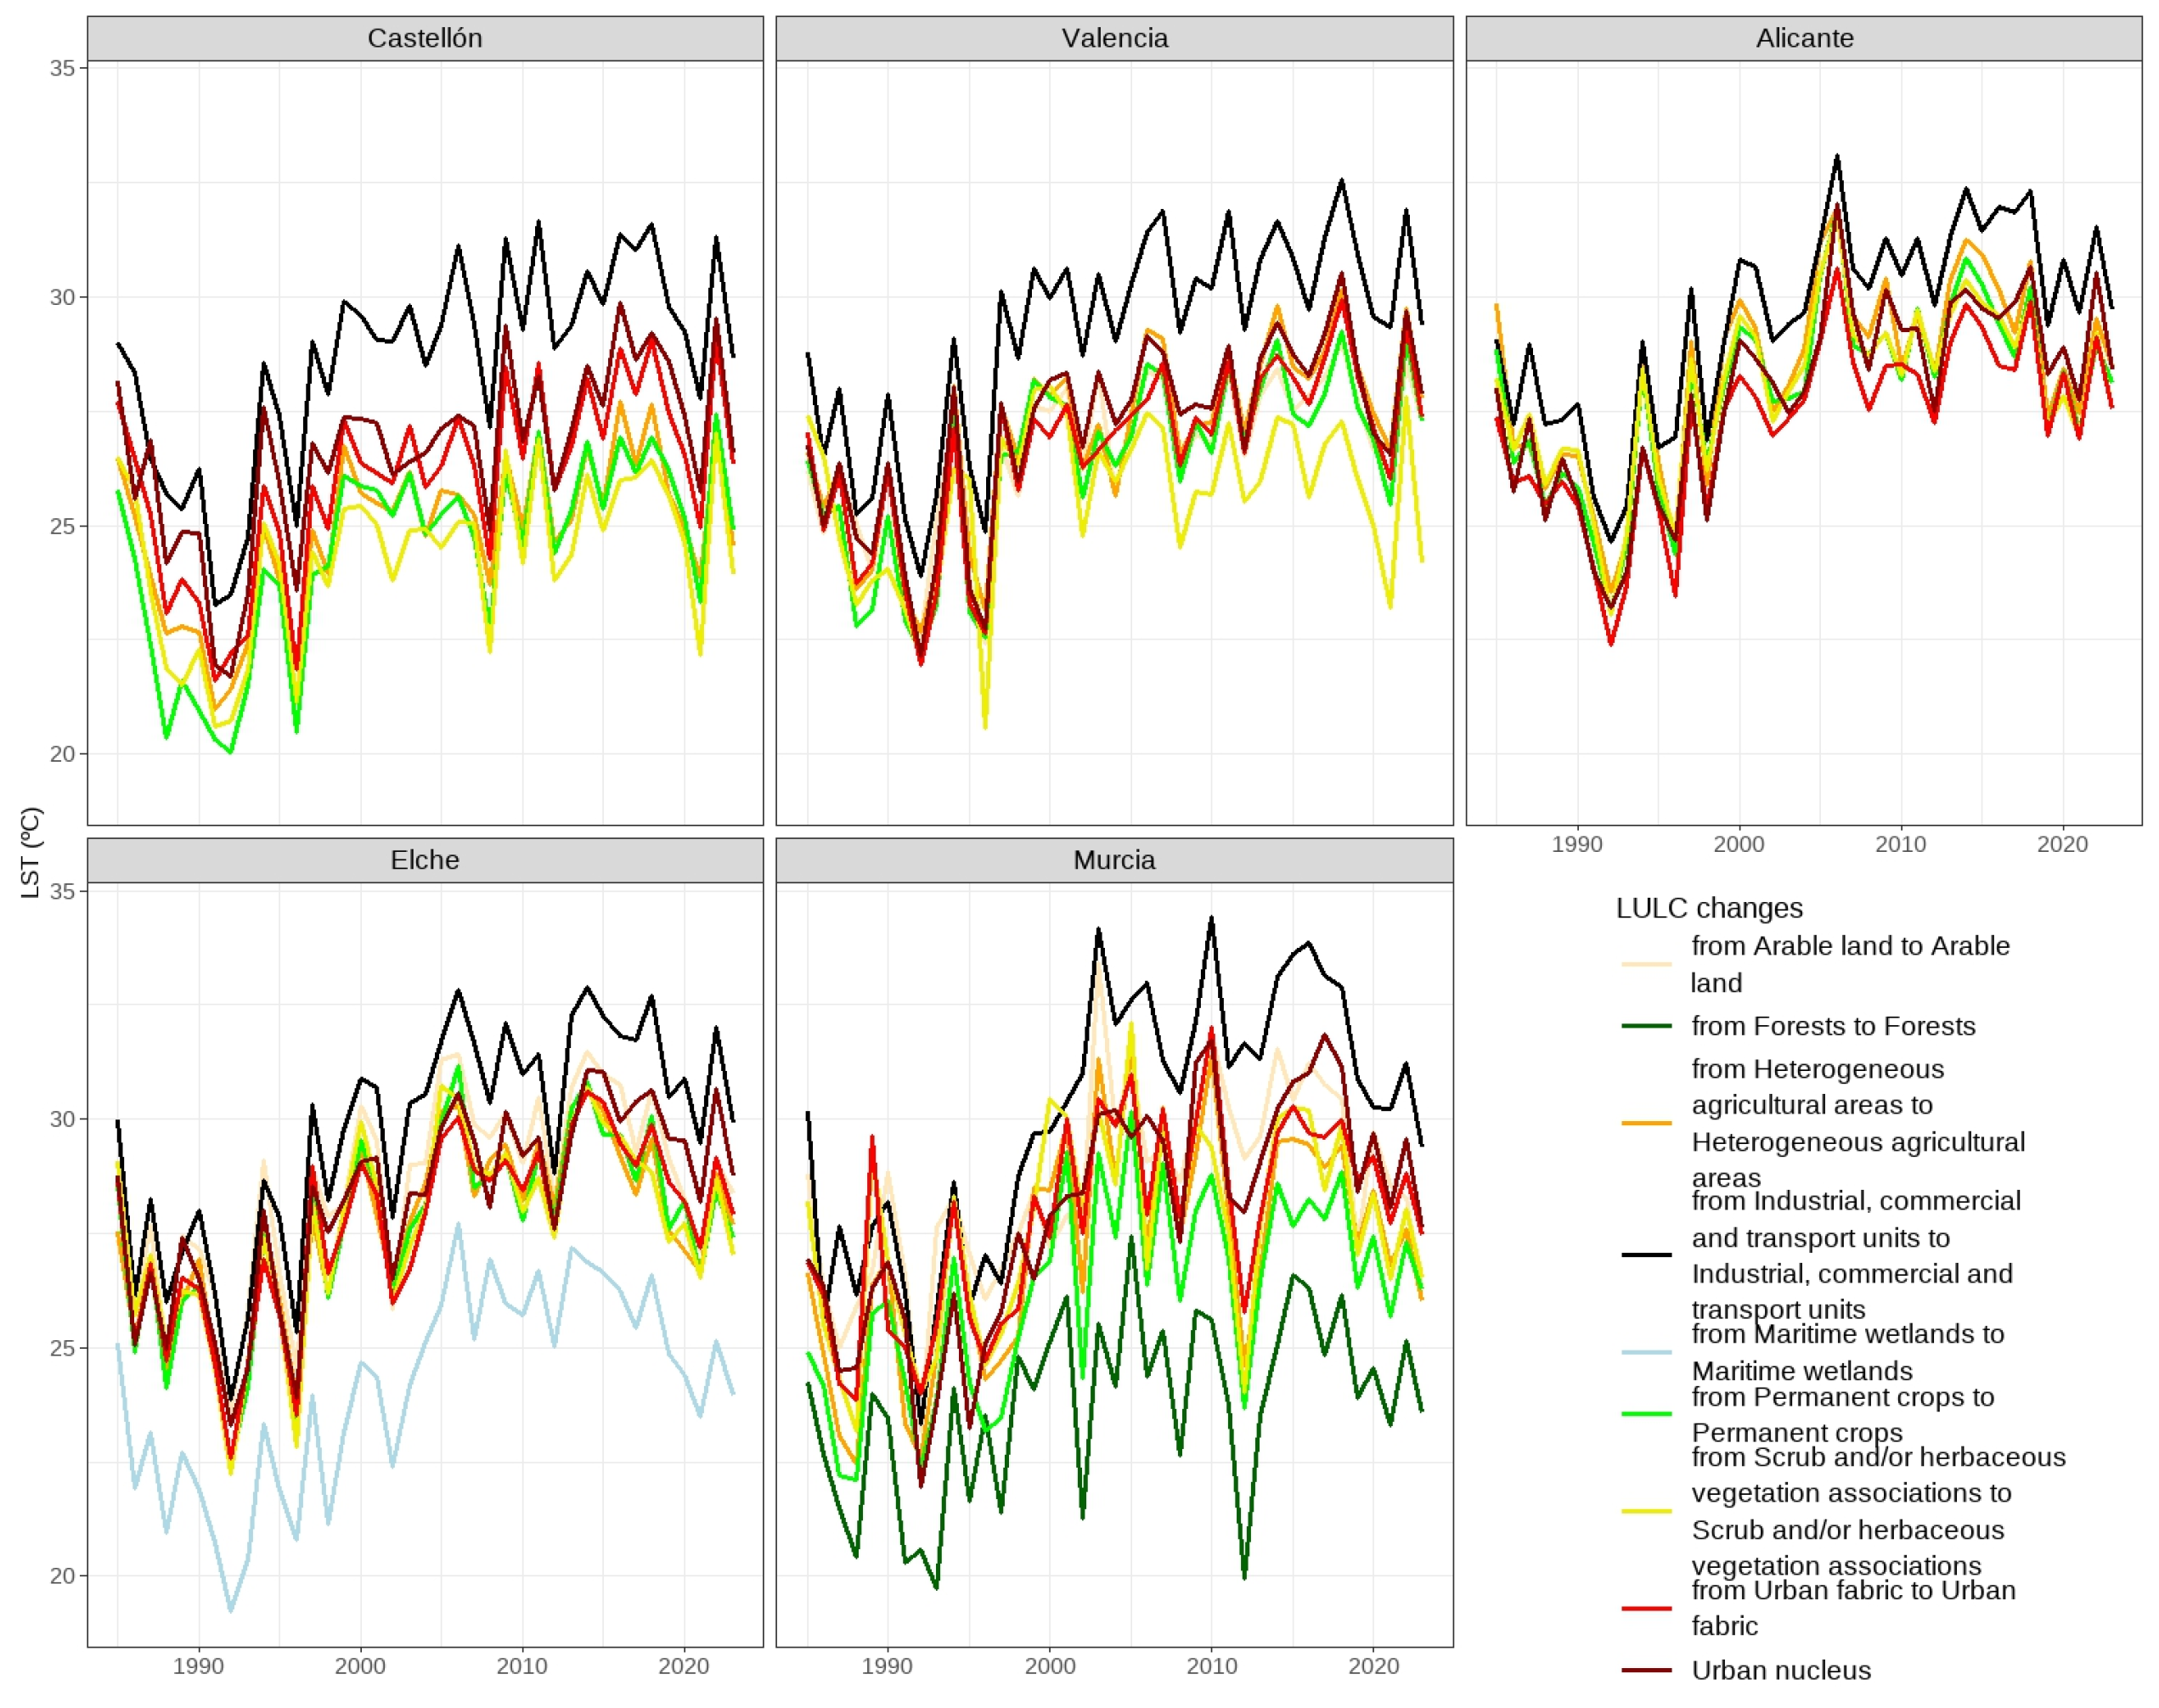
Figure 14.
Monthly evolution of LST by urban area for constant uses. Source: [60,61,70]. “Generated using European Union’s Copernicus Land Monitoring Service information; <https://doi.org/10.2909/5c1f2e03-fcba-47b1-afeb-bc05a47bada0> <https://doi.org/10.2909/71c95a07-e296-44fc-b22b-415f42acfdf0>”.
Figure 14.
Monthly evolution of LST by urban area for constant uses. Source: [60,61,70]. “Generated using European Union’s Copernicus Land Monitoring Service information; <https://doi.org/10.2909/5c1f2e03-fcba-47b1-afeb-bc05a47bada0> <https://doi.org/10.2909/71c95a07-e296-44fc-b22b-415f42acfdf0>”.
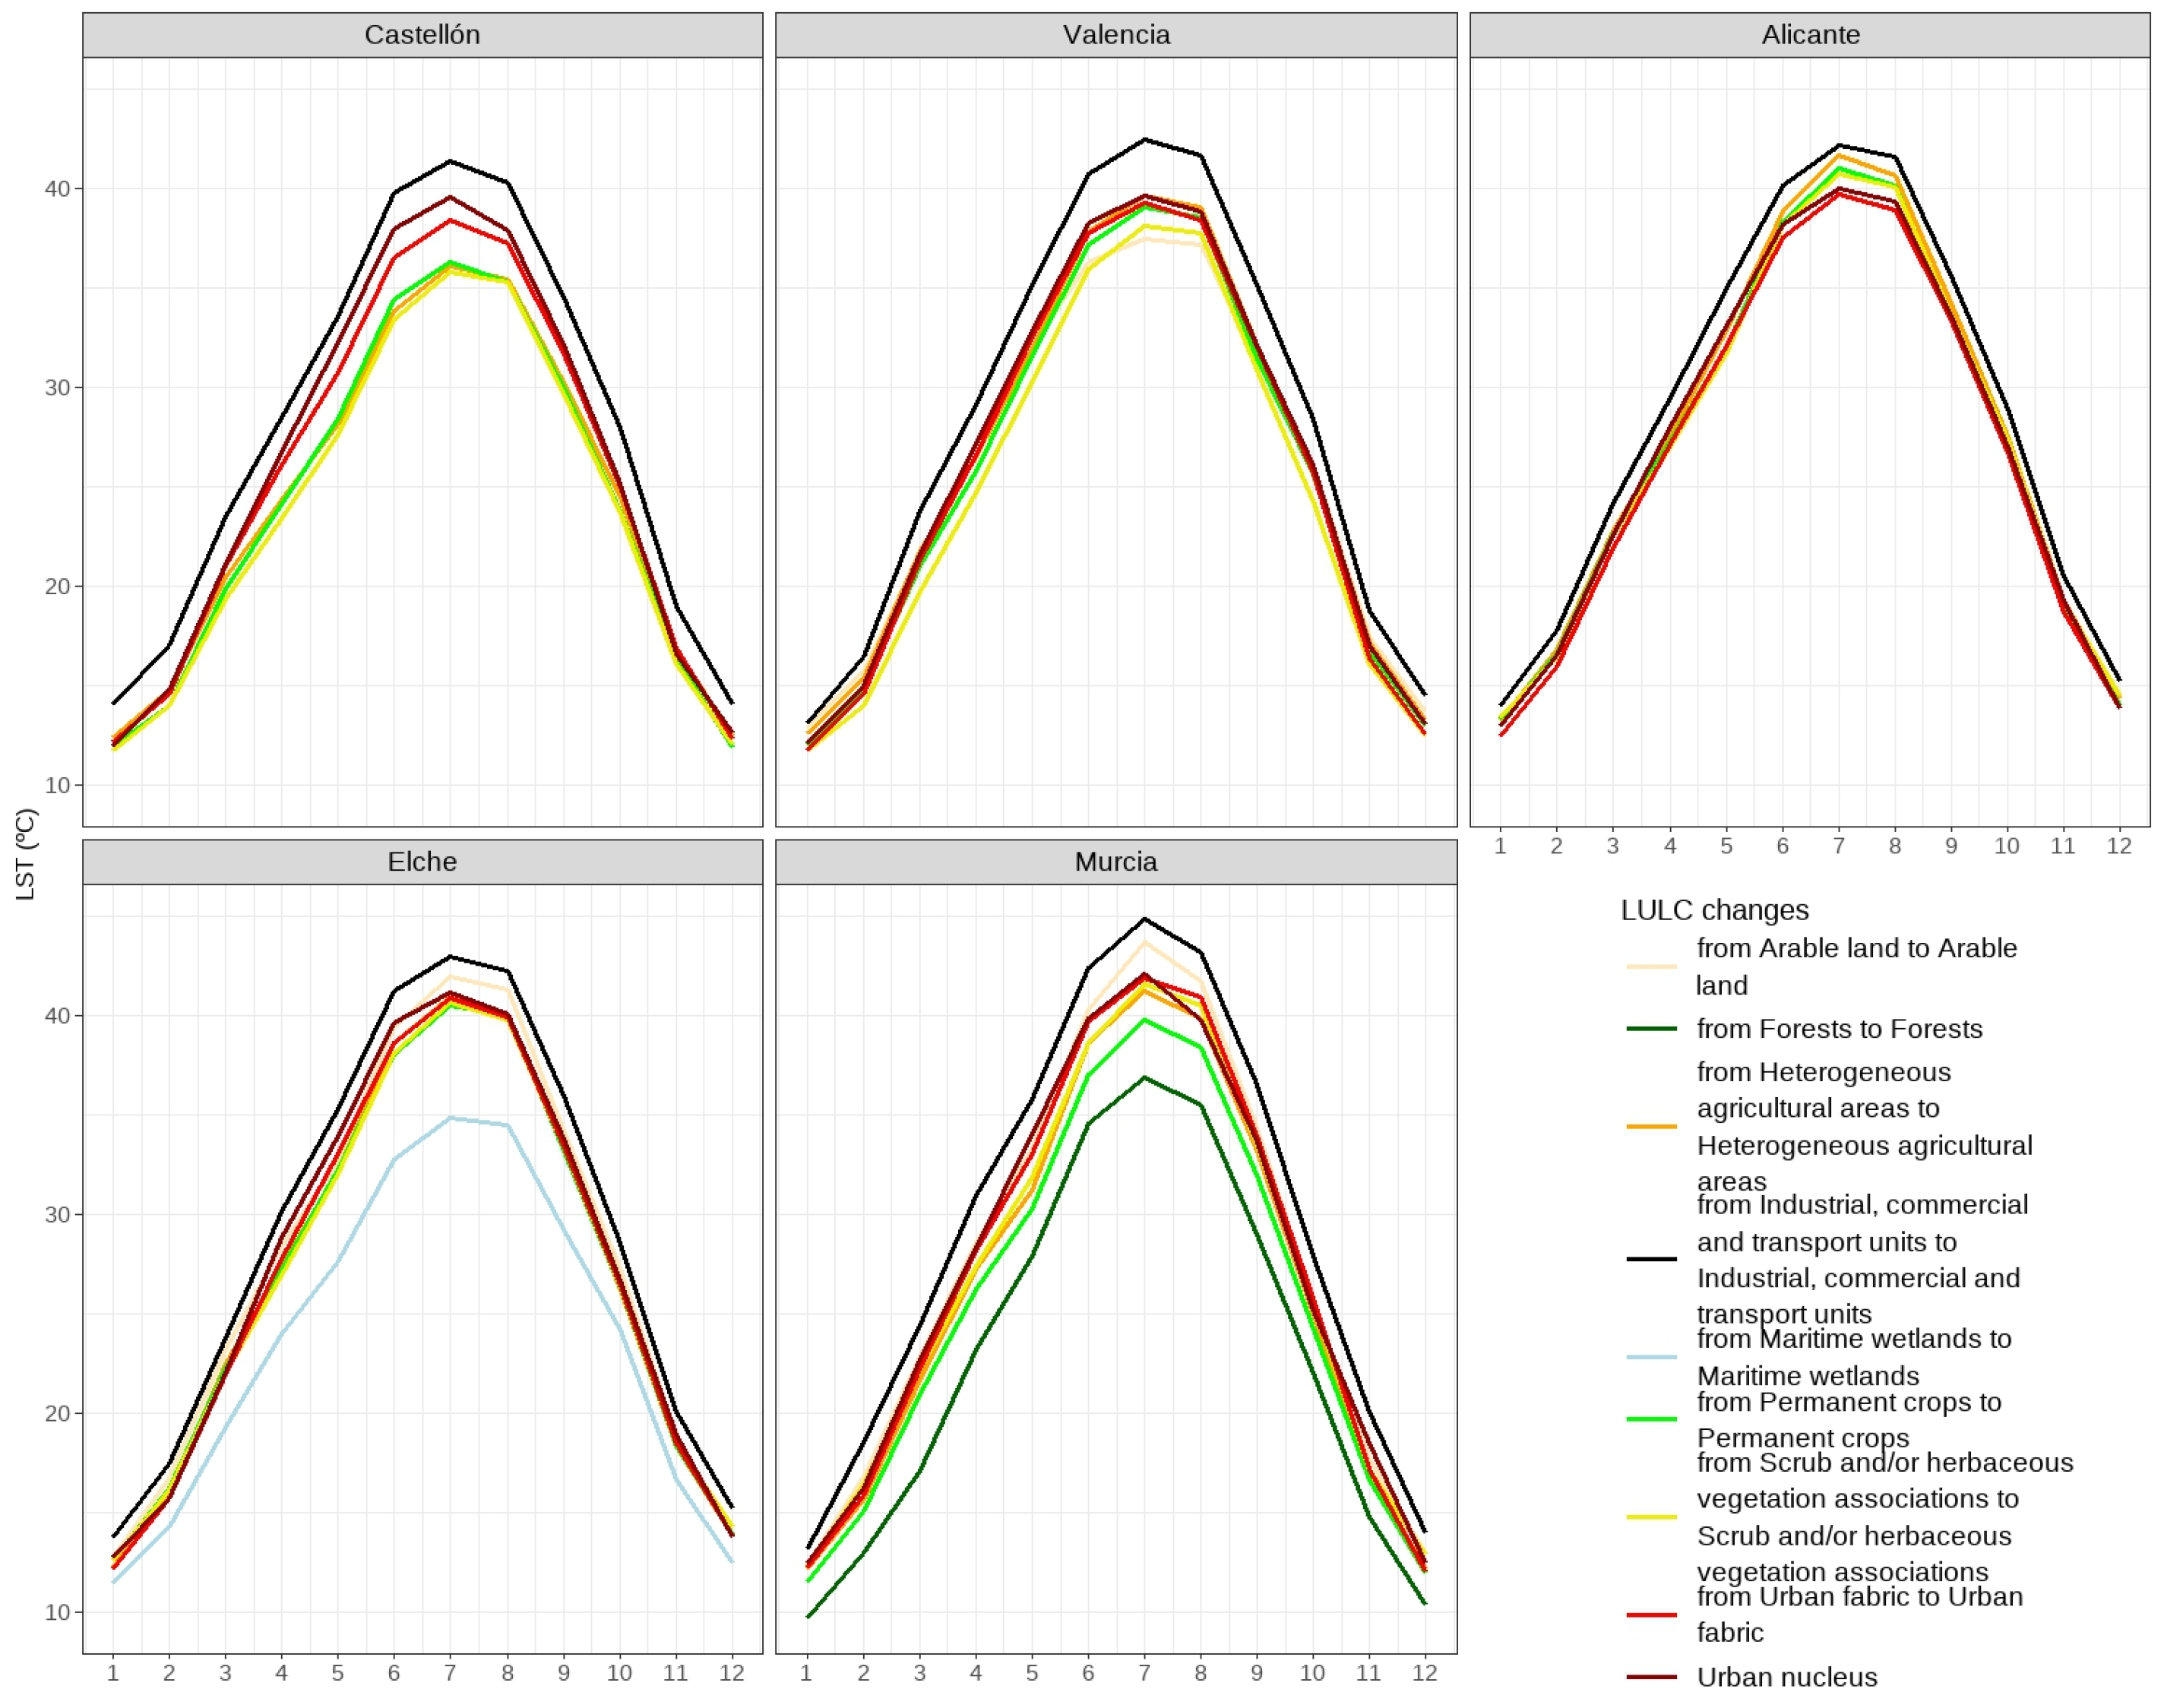
Figure 15.
LST trends (ºC/year) since 2000 by urban area for constant uses. Source: [60,61,70]. “Generated using European Union’s Copernicus Land Monitoring Service information; <https://doi.org/10.2909/5c1f2e03-fcba-47b1-afeb-bc05a47bada0> <https://doi.org/10.2909/71c95a07-e296-44fc-b22b-415f42acfdf0>”.
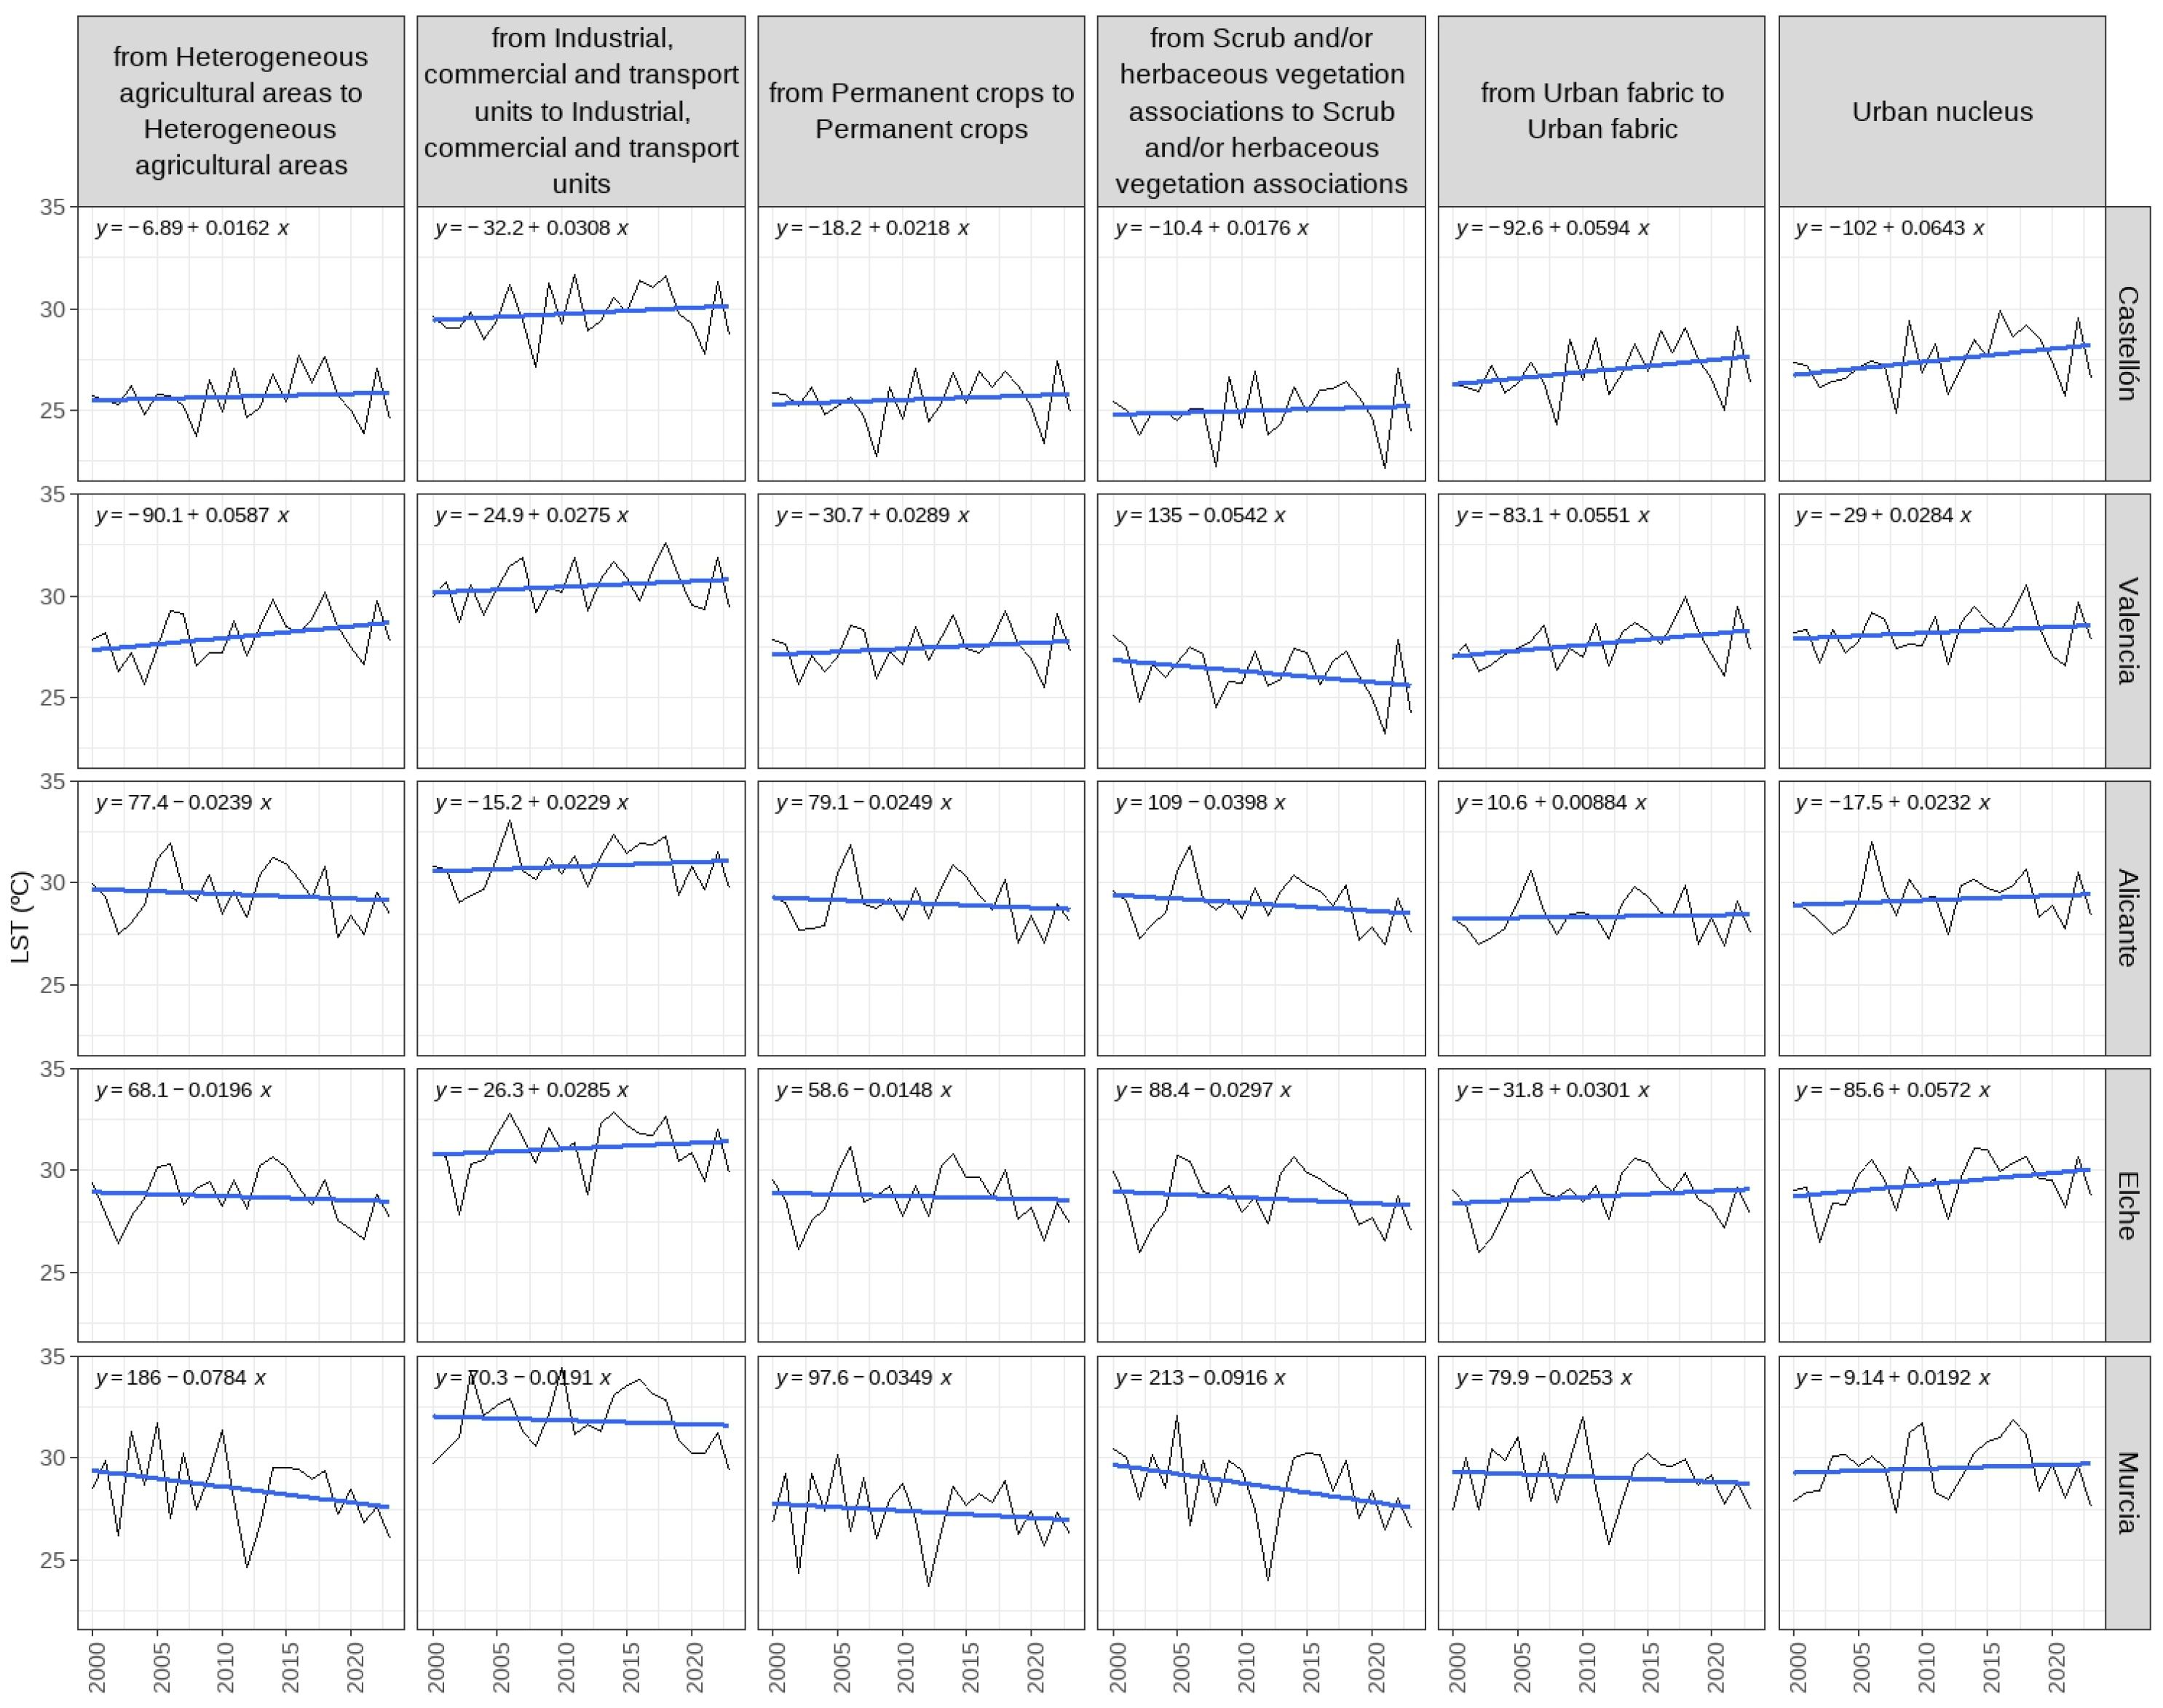

Table 1.
Municipal population and percentage of the provincial total (2023).
| Municipalities | Population | % provincial |
|---|---|---|
| Castellon | 176,238 | 29.18 |
| Valencia | 807,693 | 30.41 |
| Alicante | 349,282 | 17.91 |
| Elche | 238,293 | 12.22 |
| Murcia | 469,177 | 30.22 |
Source: [55].
Table 2.
Level 1 and 2 categories and level codes in CORINE Land Cover.
| Level 1 | Level 2 | Codes |
|---|---|---|
| Artificial surfaces | Urban fabric | 11 |
| Artificial surfaces | Industrial, commercial and transport units | 12 |
| Artificial surfaces | Mine, dump and construction sites | 13 |
| Artificial surfaces | Artificial, non-agricultural vegetated areas | 14 |
| Agricultural areas | Arable land | 21 |
| Agricultural areas | Permanent crops | 22 |
| Agricultural areas | Pastures | 23 |
| Agricultural areas | Heterogeneous agricultural areas | 24 |
| Forest and seminatural areas | Forests | 31 |
| Forest and seminatural areas | Scrub and/or herbaceous vegetation associations | 32 |
| Forest and seminatural areas | Open spaces with little or no vegetation | 33 |
| Wetlands | Inland wetlands | 41 |
| Wetlands | Maritime wetlands | 42 |
| Wetlands | Inland waters | 51 |
| Wetlands | Marine waters | 52 |
Source: [58].
Table 3.
R software packages used in the study.
| Package | Tasks |
|---|---|
| geodata | Administrative boundaries |
| sf | Spatial data processing |
| utils | Reading csv files |
| data.table | Linking CORINE layers with categories |
| dlookr | Outlier imputation |
| imputeTS | Missing data imputation |
| tidyverse | Data processing, results by areas and comparative tables 1990-2018 |
| ggplot2 | Graphic visualisation |
| grDevices | Saving graphs and maps |
Table 4.
Number of outliers and missing data in the data for the urban areas.
| Urban area |
Total flows |
Analyzed flows |
outliers | Missing Data |
Observations |
|---|---|---|---|---|---|
| Castellon | 79 | 16 | 21 | 208 | 29,013 |
| Valencia | 106 | 20 | 54 | 199 | 36,868 |
| Alicante | 86 | 18 | 38 | 186 | 34,880 |
| Elche | 96 | 20 | 66 | 215 | 39,525 |
| Murcia | 94 | 23 | 18 | 612 | 29,795 |
The final step was to analyse the LST data with the R tidyverse package to get monthly averages by year, LULC flow and urban area, annual averages by LULC flow and urban area, and monthly averages by LULC flow and urban area.
Table 5.
a. Area in km2 of main artificial uses by year and urban area. b. Area in km2 of main agricultural uses by year and urban area
Table 5.
a. Area in km2 of main artificial uses by year and urban area. b. Area in km2 of main agricultural uses by year and urban area
| a | ||||||||
|
Urban Area |
Urban fabric |
Urban fabric |
Ind., com., & transp. 1 |
Ind., com., & transp. 1 |
Artificial Total |
|||
| 1990 | 2018 | 1990 | 2018 | 2018 | ||||
| Castellon | 18.9 | 40.4 | 7.7 | 29.0 | 69.4 | |||
| Valencia | 61.6 | 80.3 | 26.2 | 52.5 | 132.8 | |||
| Alicante | 33.4 | 67.8 | 8.5 | 20.8 | 88.6 | |||
| Elche | 21.4 | 48.1 | 5.9 | 20.6 | 68.7 | |||
| Murcia | 34.8 | 59.8 | 8.2 | 28.4 | 88.2 | |||
| b | ||||||||
|
Urban Area |
Arable land |
Arable land |
Perm. crop 2 |
Perm. crop 2 |
Het. agr. 3 |
Het. agr. 3 |
Agric. Total 4 |
|
| 1990 | 2018 | 1990 | 2018 | 1990 | 2018 | 2018 | ||
| Castellon | 0.0 | 1.3 | 244 | 189.0 | 23.1 | 13.0 | 203.3 | |
| Valencia | 45.1 | 38.4 | 81.2 | 42.3 | 45.6 | 35.8 | 116.5 | |
| Alicante | 6.8 | 8.1 | 53.2 | 15.5 | 135.0 | 56.0 | 79.6 | |
| Elche | 16.0 | 46.8 | 54.2 | 37.0 | 214.0 | 111.0 | 194.8 | |
| Murcia | 17.0 | 32.8 | 120.0 | 69.2 | 160.0 | 122.0 | 224.0 | |
1 Industrial, commercial and transport units. “Generated using European Union’s Copernicus Land Monitoring Service information; <https://doi.org/10.2909/5c1f2e03-fcba-47b1-afeb-bc05a47bada0> <https://doi.org/10.2909/71c95a07-e296-44fc-b22b-415f42acfdf0>” 2 Permanent crops. 3 Heterogeneous agricultural areas. 4 Agricultural. In green, increasing changes. In red, decreasing changes. In bold, the main land use by year and urban use in the two tables. In the case of the totals, the main artificial or agricultural use. “Generated using European Union’s Copernicus Land Monitoring Service information; <https://doi.org/10.2909/5c1f2e03-fcba-47b1-afeb-bc05a47bada0> <https://doi.org/10.2909/71c95a07-e296-44fc-b22b-415f42acfdf0>”.
Table 6.
Average LST (ºC/year) in the most significant unchanged LULC flows.
| Urban Area |
Urb. Urb. 1 |
Ind. Ind. 2 |
Pcrop. pcrop. 3 |
Hga. Hga. 4 |
Scrub. scrub. 5 |
Urban Nucleus |
|---|---|---|---|---|---|---|
| Castellon | 26.4 | 29.1 | 24.9 | 25.2 | 24.6 | 27.1 |
| Valencia | 27.1 | 29.7 | 26.9 | 27.5 | 26.0 | 27.6 |
| Alicante | 27.7 | 30.0 | 28.3 | 28.7 | 28.3 | 28.3 |
| Elche | 28.1 | 30.2 | 28.0 | 28.0 | 27.9 | 28.7 |
| Murcia | 28.3 | 30.5 | 26.6 | 27.6 | 28.0 | 28.4 |
1 From urban fabric to urban fabric. 2 From industrial, commercial and transport units to industrial, commercial and transport units. 3 From permanent crops to permanent crops. 4 From heterogeneous agricultural areas to heterogeneous agricultural areas. 5 From Scrub and/or herbaceous vegetation associations to Scrub and/or herbaceous vegetation associations.
Table 7.
LST trends (ºC/year) in the most significant LULC flows.
| Urban Area |
Urb. Urb. 1 |
Pcrop. Urb. 2 |
Ind. Ind. 3 |
Pcrop. Ind. 4 |
Pcrop. pcrop. 5 |
Hga. Hga. 6 |
Hga Pcrop. 7 |
|---|---|---|---|---|---|---|---|
| Castellon | 0.104 | 0.127 | 0.125 | 0.184 | 0.115 | 0.078 | 0.082 |
| Valencia | 0.112 | 0.109 | 0.138 | 0.137 | 0.111 | 0.116 | 0.099 |
| Alicante | 0.106 | 0.099 | 0.129 | 0.123 | 0.096 | 0.097 | 0.068 |
| Elche | 0.110 | 0.106 | 0.146 | 0.152 | 0.105 | 0.101 | 0.094 |
| Murcia | 0.111 | 0.127 | 0.168 | 0.127 | 0.107 | 0.108 | 0.082 |
1 From urban fabric to urban fabric. 2 From permanent crops to urban fabric. 3 From industrial, commercial and transport units to industrial, commercial and transport units. 4 From permanent crops to industrial, commercial and transport units. 5 From permanent crops to permanent crops. 6 From heterogeneous agricultural areas to heterogeneous agricultural areas. 7 From heterogeneous agricultural areas to permanent crops. Source: [60,61,70]. “Generated using European Union’s Copernicus Land Monitoring Service information; <https://doi.org/10.2909/5c1f2e03-fcba-47b1-afeb-bc05a47bada0> <https://doi.org/10.2909/71c95a07-e296-44fc-b22b-415f42acfdf0>”.
Disclaimer/Publisher’s Note: The statements, opinions and data contained in all publications are solely those of the individual author(s) and contributor(s) and not of MDPI and/or the editor(s). MDPI and/or the editor(s) disclaim responsibility for any injury to people or property resulting from any ideas, methods, instructions or products referred to in the content. |
© 2024 by the authors. Licensee MDPI, Basel, Switzerland. This article is an open access article distributed under the terms and conditions of the Creative Commons Attribution (CC BY) license (https://creativecommons.org/licenses/by/4.0/).
Copyright: This open access article is published under a Creative Commons CC BY 4.0 license, which permit the free download, distribution, and reuse, provided that the author and preprint are cited in any reuse.


