
Submitted:
20 August 2024
Posted:
21 August 2024
You are already at the latest version
Abstract
Infections due to Candida spp., they are a threat to global health, with high rates of morbidity and mortality due to their drug resistance, especially in immunocompromised people. Thus, the search for new alternatives is urgent today. In recent years, combined therapy with compounds of natural origin has been proposed as an alternative. Considering the biological potential of isoespintanol (ISO) and continuing with its study, the objective of this research was to assess the effect of ISO in combination with the antifungals, fluconazole (FLZ), amphotericin B (AFB) and caspofungin (CASP), against clinical isolates of C. tropicalis and evaluate the cytotoxic effect of this compound in the acute phase (days 0 and 14) and chronic phase (days 0, 14, 28, 42, 56, 70 and 84), in female mice (Mus musculus) of the Balb/c lineage. The results show that ISO can potentiate the effect of FLZ, AFB and CASP, showing synergism with these antifungals. Evaluation of the mice by direct vision showed no behavioral changes or variation in weight during treatment; furthermore, the analysis of the cytokines IFN-γ and TNF in plasma, peritoneal cavity lavage (PCL) and bronchoalveolar lavage (BAL) indicated that there was no inflammation process and histopathological studies of lung, liver and kidney showed no signs of toxicity caused by ISO; this was consistent with the analysis of oxaloacetic transaminases (GOT) and pyruvic transaminases (GPT), which remained in the standard range. These findings indicate that ISO does not have a cytotoxic effect at the doses evaluated. Our results place ISO as a monoterpene of interest in the search for compounds with pharmacological potential.
Keywords:
Synergism
; antifungal
; isoespintanol
; in vivo toxicity
1. Introduction
The adaptive capacity of Candida spp. in hospital environments, together with the expression of various virulence factors, the poor availability of antifungal drugs and expressed drug resistance, represent a great challenge in medical practice. Compounds of natural origin, especially from plants, play a primary role as a source of specialized metabolites with recognized medicinal properties; due to their wide chemical diversity, these metabolites can be used directly as bioactive compounds, as drug prototypes or used as pharmacological tools for different targets [1,2,3]. Furthermore, potential efficacy and minimal side effects are the key advantages of plant-based products, making them appropriate tools to be used in therapeutic treatments [4] and are inspiration for the synthesis of non-natural molecules, in addition, they provide important clues to identify and develop synergistic drugs [5].
Combination therapy has become an interesting area in the development of new therapeutic strategies against fungal infections; among the advantages to consider the use of this therapy are: (i) the potential increase in effectiveness and the degree of elimination of these pathogens; (ii) a broader spectrum of activity, directed at potentially resistant pathogens; (iii) prevent the emergence of resistance; and (iv) combination therapy may allow reduced doses of individual antifungal drugs that may minimize toxicity [6,7]. Greater efficacy of antifungal drugs such as fluconazole (FLZ), amphotericin B (AFB), nystatin and caspofungin (CASP) in combination with monoterpene phenols against Candida auris has been demonstrated [8]. Furthermore, the synergism of Ocimum sanctum essential oils with FLZ and ketoconazole (KZL) against different candida isolates, including both susceptible and resistant strains [9] has also been reported; likewise, the potentiation of the antifungal action of AFB by the essential oil of Thymus vulgaris has been indicated [10]. In monoterpenes such as thymol, a synergistic effect has been demonstrated in combination with antifungals such as nystatin, against Candida spp. involved in oral cavity infection [11]; likewise, thymol and carvacrol have been documented with synergistic action with FLZ [12,13]. The combined therapy of thymol and carvacrol with caprylic acid (CA) and its mechanism of action against Candida spp., it has also been documented [13]. Thymol has also shown synergy with FLZ against the planktonic growth mode and in biofilms of resistant strains of C. albicans and C. tropicalis; however, the synergy with AFB has been evidenced only in the planktonic cells of candida [14]. Other interaction studies of azoles with Mentha piperita essential oils have shown synergistic profiles against Candida spp., Cryptococcus neoformans and Trichophyton mentagrophytes [15].
Isoespintanol (ISO) (2-isopropyl-3,6-dimethoxy-5-methylphenol), a monoterpene isolated from Oxandra xylopioides (Annonaceae), is recognized as a natural bioactive compound. Its biological potential as an antioxidant [16], anti-inflammatory [17], antispasmodic [18], vasodilator [19], cardioprotective [20] and cryoprotectant in canine semen [21] has been reported. The possible use of this monoterpene as a therapeutic tool for the prevention of diabetes in the early stages of its development has also been suggested [22]. In previous works, we have reported the potential of this monoterpene against human pathogens, specifically hospital-acquired bacteria [23] and yeasts of the Candida genus, demonstrating its action against different cellular targets and the property of inducing the reprogramming of the transcriptome of these yeasts [24,25,26,27], as well as its cytotoxic potential against human tumor cell lines [28].
Considering the important biological potential of ISO, which includes the antifungal effect against FLZ-resistant yeasts and the important differences between in vitro and in vivo experimental environments [28], we hypothesize that ISO can potentiate the effect of commercial antifungals; furthermore, it has no significant cytotoxic effect in vivo at low concentrations. The purpose of this research was to evaluate the effect of ISO in combination with the antifungals, FLZ, AFB and CASP, against clinical isolates of C. tropicalis and to evaluate the cytotoxic effect of this compound, in female mice (Mus musculus), contributing to the study of this monoterpene, which could serve as an important tool in the treatment and control of infectious diseases.
2. Results
2.1. Obtaining and Identification of Isoespintanol
ISO was obtained as a crystalline amorphous solid from the petroleum benzine extract of O. xylopioides leaves, and its structural identification was performed by GC-MS, 1H-NMR, 13C-NMR, DEPT, COSY 1H-1H, HMQC, and HMBC. Information related to obtaining and identifying the ISO was reported in our previous study [25].
2.2. Isoespintanol Action in Combination with Commercial Antifungals
As shown in Figure 1, the ISO-FLZ combination showed a synergistic effect against six of the seven (107, 98, 92, 81, 74 and 03) C. tropicalis isolates evaluated; while the ISO-AFB treatment showed synergistic action against two isolates (107 and 74), and the ISO-CASP treatment only showed synergistic effect in one of the isolates (74) in this study. The antagonistic activity of ISO-AFB (isolates 98) and ISO-CASP (isolates 92 and 84) was also evidenced. As shown in Table 1, the minimum inhibitory concentrations at which 90% of the yeasts are inhibited (MIC90) in synergistic activity were substantially lower compared to the individual MIC90 of the ISO and the antifungals used. MIC90 values were reduced by up to 138.5 and 2 times in FLZ, AFB and CASP respectively.
Table 1 shows the individual and combined MIC90 values of ISO, FLZ, AFB and CASP. Furthermore, the FIC indices and the observed effect.
2.3. ISO In Vivo Toxicity Experiments
2.3.1. Animal Weight
As shown in Table 2 and Table 3 during the acute and chronic phase experiments respectively, the average weight in grams of the animals during the 14 days (acute phase) and 84 days (chronic phase) did not decrease; there was also no mortality among the mice, with any of the doses of ISO evaluated in the experiments.
2.3.2. Global Cell Count
Figure 2 shows the global profile of leukocytes in blood, peritoneal cavity lavage (PCL) and bronchoalveolar lavage (BAL), in the acute phase (Figure 2A–C) and in the chronic (Figure 2D–F), referring to both the control group and the groups inoculated with ISO. A significant reduction was observed in the inoculated groups G3, G4 and G6 compared to group G1 (CTRL + water) and a significant reduction in groups G4 and G6 compared to group G2 (Figure 2A). When counting leukocytes in the PCL and BAL, the values of groups G3, G4, G5 and G6 compared to groups G1 and G2 did not show significant differences in cell reduction (Figure 2B,C), however, there was a significant increase in the G5 group compared to the G2 group in the BAL (Figure 2C). We observed that, in the chronic phase, global blood counts, PCL and BAL did not show a significant difference in any group compared to groups G1 and G2 (Figure 2D–F). Finally, the overall cell count was not significantly affected by ISO treatment.
2.3.3. Differential Cell Counting
Figure 3 shows the differential count of blood leukocytes, PCL and BAL in the acute phase for both the control group and the groups inoculated with ISO. There were significant differences in the number of monocytes in the blood in groups G3, G4 and G6 compared to the amounts in groups G1 and G2 (Figure 3D). Likewise, significant differences were found in the number of neutrophils in the blood in the G4 group compared to the numbers in the G1 group (Figure 3E). There was also an increase with a significant difference in the number of eosinophils in blood in groups G3, G4, G5 and G6 compared to the numbers in G1 and G2 (Figure 3F).
Figure 4 shows the differential count of leukocytes in blood, PCL and BAL in the chronic phase for both the control group and the groups inoculated with ISO. In PCL there was a significant decrease in monocytes in the G5 group compared to the G1 and G2 groups (Figure 4A). In BAL, an increase in neutrophils was observed in groups G3 and G5 compared to group G2 and a significant increase in these same cells for group G4 compared to groups G1 and G2. In blood, a significant increase in neutrophils was evident in groups G3 and G5 compared to group G1. Eosinophils also had a significant increase in all groups G3, G4, G5 and G6 compared to groups G1 and G2.
2.3.4. GOT and GPT Dosage
Figure 5 shows the doses of hepatic transaminases, oxaloacetic transaminase (GOT) and pyruvic transaminase (GPT) in the plasma of the animals after inoculation with ISO in the acute phase (Figure 5A,B) and in the chronic phase (Figure 5C). There was no increase or significant difference in the amounts of GOT and GPT in the groups exposed to the compound compared to the control group in the acute phase. In the chronic phase there was a significant decrease in GPT levels in groups G4 and G5 compared to group G2 (Figure 5C). There was no expression of GOT.
2.3.5. Measurement of Cytokines IFN-γ and TNF
The concentrations in pg/ml of the levels of the cytokines IFN-γ and TNF carried out in plasma, BAL and PCL of each animal were detected only in blood in both the acute and chronic phases, as shown in Figure 6. In the acute phase (Figure 6A,B), no statistically significant values were detected when groups G3, G4, G5 and G6 were compared with control groups G1 and G2. In the chronic phase (Figure 6C) no positive levels in pg/mL of any cytokine were detected.
2.3.6. Histopathological Analysis of Organs (Lung, Liver and Kidney)
The renal fragments presented few microscopic alterations (based on discrete inflammatory infiltrates, mainly in cortical areas) (Figure 7); the lung fragments showed few changes that included: hemorrhage, inflammatory infiltrate and thickening of the alveolar septa (Figure 8). Regarding the liver fragments, the majority presented perivascular infiltrate and only in two cases (in the oil control and in the chronic study with 200 mg) pyogranulomatous granulomas were identified (Figure 9). However, none of the histopathological changes shown with ISO treatment were significant or considered toxic at the doses evaluated. For details of the histopathological analysis, see Supplementary material (Tables S1 and S2).
3. Discussion
The increasing incidence of fungal infections, particularly in immunocompromised people, continues to be a serious public health problem globally. Candida spp., are the pathogens mainly involved, given the wide range of pathogenicity factors expressed, the ability to respond efficiently to environmental stress, resistance to antifungal agents and the high mortality reported, which make medical practice a great challenge [29,30,31]. Thus, the search for new alternatives for the control and treatment of these pathogens is urgent today. In this context, given the advantages of combined therapy, it turns out to be an interesting alternative to contribute to the treatment and control of these pathogens [6,7,15,32].
We report the synergistic effect of ISO in combination with the antifungals FLZ, AFB and CASP, highlighting the effect achieved with ISO-FLZ, against clinical isolates of C. tropicalis resistant to FLZ. We also report the synergistic effect of ISO-AFB and ISO-CASP, although not in all cases. These results are consistent with studies that show synergistic effect of the monoterpene thymol in combination with FLZ against azole-resistant C. tropicalis; as a consequence of these synergistic interactions, the mitochondrial membrane potential was reduced, the production of mitochondrial superoxide increased, and alterations were observed in nuclear morphology, surface and cell ultrastructure [33]. Other studies have shown excellent synergistic activity of monoterpenes such as linalool, citral and citronellal combined with FLZ against strains of C. albicans resistant to FLZ [34]. Likewise, greater efficacy of antifungal drugs in combination with monoterpene phenols was reported against C. auris [8].
The study of combined therapy of monoterpenes and antifungals has been widely documented with an important synergistic effect against Candida spp. The mechanisms involved in the synergistic activity include the inhibition of different stages in the fungal intracellular pathways essential for survival, the increase in the penetration of one antifungal agent due to the action of another on the fungal cell membrane, the inhibition of transporter proteins and the simultaneous inhibition of different cellular targets [11,35]. Monoterpenes such as thymol and carvacrol in combination with FLZ have shown a synergistic effect against Candida spp. [12]; besides, the combined therapy of thymol and nystatin, against Candida spp. has also been documented [11]. The use of combined thymol-FLZ treatments against biofilms and planktonic growth of resistant strains of C. albicans and C. tropicalis has also been reported indicating synergistic action; likewise, thymol-AFB have revealed synergistic action in the plant growth of Candida spp. [14]. Other studies have indicated the mixed treatment of thymol-carvacrol with caprylic acid (CA) against Candida spp., revealing synergism and indicating that the mechanism of this may involve membrane damage by CA, which facilitates the entry of antifungal agents to the cytoplasm and the inhibition of efflux pumps by CA, carvacrol or thymol, causing their accumulation inside the cells and causing cell death [13]. The combined therapy of essential oils with antifungals such as FLZ and KZL [9] and AFB against C. albicans [10] has also been documented, as well as the combination of azoles with Mentha piperita essential oils against Candida spp., Cryptococcus neoformans and Trichophyton mentagrophytes [15].
Azoles act against C14α-demethylase in the biosynthesis of ergosterol, blocking its synthesis and causing the accumulation of toxic sterols, interrupting the function of ergosterol in the cell membrane [36]. However, among the mechanisms of resistance to azoles expressed by these pathogens is the reduction of intracellular accumulation of azoles; this may occur due to lack of drug penetration due to low levels of ergosterol or possible decrease in the ratio between phosphatidylcholine and phosphatidylethanolamine in the plasma membrane, which can change the barrier function of the membrane [37]. In previous works, we demonstrated damage to the membrane permeability of these yeasts, as one of the mechanisms of antifungal action of ISO against C. tropicalis. This damage was attributed to the inhibition of ergosterol synthesis [25,27], so we could suggest that the synergistic effect of ISO with FLZ involves substantial permeabilization of the cell membrane, allowing greater intracellular accumulation of ergosterol pathway intermediate sterols, in addition to greater entry of ISO and FLZ, creating a potential for substantial toxic effects, using lower doses of ISO and FLZ. However, further studies are required to clearly elucidate the synergy mechanism of ISO in combination with FLZ, AFB, and CASP.
On the other hand, in this study we report that the oral administration of different doses of the monoterpene ISO, in female mice (Mus musculus) of the Balb/c lineage, does not have significant toxic effects that can at least be attributed to treatment with ISO. It also does not alter the weight of the animals in the acute phase, nor in the chronic phase. According to the analyzes performed on blood, BAL and PCL, only an increase in the number of eosinophils was observed, mainly in the chronic phase, which must be related to time and constant exposure to the compound over 98 days.
The presence of malignant or premalignant lesions at the tissue level can cause the infiltration of immune system cells and, together with the tissue's own cells, initiate an immune response at the local level that can be of the Th1 type that includes: Interleukin-2 (IL-2), tumor necrosis factor alpha (TNF-α) and interferon gamma (IFN-γ) and the Th2 type with IL-4, IL-5, IL-6, IL-9, IL-10, IL-13) or both [38]. We determined the pattern of IFN-γ and TNF cytokines in the plasma, BAL and PCL of each animal treated with ISO. The results did not show statistically significant values when the values of groups G3, G4, G5 and G6 (treated with ISO) were compared with the control groups G1 and G2 (treated with water and oil respectively). Likewise, in the chronic phase, no positive levels in pg/mL of any cytokine were detected. There was no increase in the cytokines, suggesting that there was no inflammation process in the blood of the animals analyzed.
In general, in the histopathological studies there were non-significant changes in the samples analyzed from the experimental groups; the kidney fragments showed few microscopic alterations; the lung fragments showed changes such as insignificant hemorrhage, inflammatory infiltrate and thickening of the alveolar septa. Regarding the liver fragments, the majority presented little perivascular infiltrate and only in the oil control and in the chronic study at 200 mg, pyogranulomatous granulomas were identified. In general, no significant signs of toxicity were observed. This was corroborated by the biochemical findings that revealed that there was no increase or significant difference in the amounts of GOT and GPT in the mice to which ISO was administered, compared to the control groups in the acute phase; liver enzymes were within standard. In the chronic phase there was a significant decrease in GPT levels in groups G4 and G5, compared to group G2; GOT levels were not detected, since they are expressed when they are above the values of the control groups. These findings demonstrate that there is no toxicity that can be attributed to ISO in the doses administered. These results are consistent with reports [39] of in vivo experiments, using two groups of hamsters (Mesocricetus auratus), where the toxicity of the monoterpenes carvacrol and thymol (100 mg/kg) was evaluated, indicating that they were safe and effective treatments with few side effects on the liver and that they were very promising candidates for the development of effective drugs. However, despite the valuable biological activities of monoterpenes, some of them (α-terpinene, camphor, citral, limonene, pulegone, thujone), have also shown a toxic character, evaluated in vitro and in vivo studies, for so its use must be closely controlled [40].
Our results position ISO as an interesting compound to continue studying and that could, in the future, be used as a therapeutic tool for the control of pathogenic microorganisms. It is important to conduct further research to validate these findings in humans.
4. Materials and Methods
4.1. Reagents
RPMI 1640, was obtained from Thermo Fisher Scientific (Waltham, MA, USA); 3-N-morpholinopropanesulfonic acid (MOPS) was obtained from Merck; sabouraud dextrose agar (SDA), sabouraud dextrose broth (SDB), fluconazole (FLZ), amphotericin B (AFB), caspofungin (CASP) and 2,3,5-triphenyltetrazolium chloride (TCC) used in the synergism experiments, were obtained from Sigma-Aldrich São Paulo, SP, Brazil), xelasine and ketamine were obtained from (Syntec - Brazil; Vetnil - Brazil); ethylenediamine tetraacetic acid (EDTA) (Dinamica - Brazil); phosphate buffered saline (PBS) citrated (LGC - Brazil); Turk's solution (3% acetic acid and 1% methylene blue) (Dinamica - Brazil; Synth - Brazil); rapid panotic dye (Laborclin - Brazil); buffered formalin (Synth - Brazil); hematoxylin-eosin (HE) (Easypath - Brazil); TGO substrate (Labtest - Brazil); TGP substrate solution (Labtest - Brazil); NaOH (Neon - Brazil); blocking solution (1X PBS + 1% bovine serum albumin (BSA) was obtained from Sigma-Aldrich, São Paulo, SP, Brazil; tween 20 (Dinamica - Brazil); sulfuric acid (Dinamica - Brazil); standard recombinant cytokine, capture antibody, detection antibody (biotinylated secondary antibody – 1: 250), detection antibody (biotinylated secondary antibody), streptoavidin enzyme, TMB Solution A and Solution B (3,3',5,5'-Tetramethylbenzidine) and cytokines were obtained from (BD Biosciences - San Diego, CA, USA).
4.2. Obtaining and Identification of Isoespintanol
ISO was obtained as a crystalline amorphous solid from the petroleum benzine extract of O. xylopioides leaves, and its structural identification was performed by GC-MS, 1H-NMR, 13C-NMR, DEPT, COSY 1H-1H, HMQC, and HMBC. Information related to obtaining and identifying the ISO was reported in our previous study [25].
4.3. Strains
Seven clinical isolates of C. tropicalis (107, 98, 92, 84, 81, 74, y 03) were used in this study. The isolates were cultured from blood culture and tracheal aspirate samples from hospitalized patients at the Salud Social S.A.S. from the city of Sincelejo, Colombia. All microorganisms were identified by standard methods: Vitek 2 Compact, Biomerieux SA, YST Vitek 2 Card and AST-YS08 Vitek 2 Card (Ref 420739). SDA medium and BBL CHROMagar Candida medium were used to maintain the cultures until the tests were carried out.
4.4. Isoespintanol Action in Combination with Commercial Antifungals
To obtain the fractional inhibitory concentration indices (FICIs) of the ISO in combination with AFB, FLZ, and CASP against C. tropicalis, the methodologies proposed by Donadu [41] were followed. Serial dilutions were made in RPMI 1640 broth with 0.1% 2,3,5-triphenyltetrazolium chloride (CTT), reaching final concentrations in a range of 1000 - 31.25 µg/mL, 4 - 0.125 µg/mL, 128 - 4 µg /mL, 1 - 0.031 µg/mL, for ISO, AFB, FLZ and CASP respectively. The assay was carried out in a total volume of 200 μL per well distributed as follows: 50 μL ISO + 50 µL of CASP, AFB and FLZ were added (until the previously described concentrations were reached) and 100 µL fungal inoculum at a concentration of 106 CFU/mL. Absorbance readings were measured immediately using a Chromate 4300 ELISA reader at a wavelength of 630 nm, and measurements were subsequently made after 24 hours of incubation at 37 °C. The FIC indices (FICIs) were calculated using the following equation [42]:
The interpretation of the results was carried out following the approach used by [43]. The FICIs are considered to have a synergistic effect (FIC index ≤ 1.0); commutative effect (FIC index=1); no interaction (1.0 < FIC index ≤ 2.0); and antagonistic effect (FIC index > 2.0).
4.5. Preparation of Isoespintanol for Toxicity Experiments
The ISO crystals were dissolved in edible vegetable oil (used as a vehicle) at 45 °C to facilitate dilution. Subsequently, a stock solution was prepared at a concentration of 40 mg/mL with the help of a vortex mixer, and from it the ISO dilutions were prepared at 25, 50, 100 and 200 µg/mL using the same vehicle.
4.6. Animals
The experimental design of this project was based on the recommendations of the Ethical Principles of Animal Experimentation adopted by the Brazilian Society of Laboratory Animal Science (SBCAL) and approved by the Committee on Ethics in the Use of Animals (CEUA) of the Federal University of São Carlos (UFSCar), under opinion n°. 4783100223. Female mice (Mus musculus) of the Balb/c lineage weighing between 15 and 18 grams, from the company ANILAB Animals De Laboratório Criação E Comercio Ltda. These animals have the SPF (Specific Pathogen Free) certificate, which guarantees that they are free of pathogens. All animals were kept in the vivarium of the Department of Morphology and Pathology of the Federal University of São Carlos (DMP - UFSCar), with free access to water and food for rodents in individual cages with air control (ALESCO).
4.7. Exposure to Isoespintanol and Experimental Groups
As shown in the experiment design (Figure 10), six experimental groups were established; all animals were weighed (between 15 and 18 grams) and randomly distributed. Each group received oral treatment with a final volume of 100 μL. In the acute phase experiments, 55 animals were used (10 for each ISO group, 7 for water control and 8 for oil control), the treatment was carried out every 14 days, occurring on day 0 and day 14. In the chronic phase, 55 animals were used (10 for each ISO group, 7 for water control and 8 for oil control), the treatment was carried out on days 0, 14, 28, 42, 56, 70 and 84.
Table 4 shows the exposure to the treatments in each experimental group of animals, carried out in the acute phase after inoculation for 14 days and in the chronic phase for 90 days.
4.8. Animal Weight Measurement
Animals were weighed to check for changes in body mass and behavior after exposure to the compound. Weighing was always carried out in the morning and on days 0 and 14 to study the acute phase. To study the chronic phase, days 0, 14, 28, 42, 56, 70 and 84 were weighed.
4.9. Euthanasia, Blood Cell Collection and Counting, Peritoneal Cavity Lavage (PCL) and Bronchoalveolar Lavage (BAL)
Mice were sacrificed with xelasine and ketamine at 20 mg/kg intra-peritoneally (ip) on day 15 (acute phase) and day 90 (chronic phase). The blood was obtained by puncture of the left brachial vein, using EDTA as an anticoagulant at a final concentration of 0.3 M. To obtain the BAL, 2 mL of citrated PBS (1X [phosphate buffer saline solution: 8 g of NaCl, 0.2 g of KCl, 1.15 g of Na2HPO4, 0.2 g of KH2PO4 and 1 L of distilled water] + 0.5 % sodium citrate) introducing a catheter into the trachea of the animals from which the 2 mL injected. To obtain the PCL, 3 mL of citrated PBS was used, introducing a needle into the peritoneal cavity from which they were extracted. Global blood cell counting, BAL and PCL were performed individually in a Neubauer chamber, and samples were added to Turk's solution (3% acetic acid and 1% methylene blue) at a dilution of 1:20. For differential count and percentages of cells (eosinophils, neutrophils, and mononucleated leukocytes), blood smears and PCL slides were prepared in a Citospin centrifuge (Serocyte® model 2400) stained with Rapid Panotic dye. On each slide, 100 cells were counted, with the help of optical microscopy with a final magnitude of 1000. The plasma was subsequently stored at a temperature of -20 °C to measure cytokines and transaminases GOT and GPT.
4.10. Histological Evaluation of Lung, Liver and Kidney
To analyze the possible involvement of tissues and organs due to indirect toxicity, the following organs were extracted and stored: lung, liver and left kidney from animals in both the acute and chronic phase, standardizing animal 1 and 2 of each group. First, an approximately 4 cm surgical incision was made longitudinally just below the rib cage of each mouse. A small incision was then made in the diaphragm to expose the sternum bone. With this, the thoracic bone cavity was removed for direct access and lung collection. When removing the organs from the abdominal cavity, the same incision was used. Therefore, the liver and kidneys were removed sequentially. After removal, the organs were washed with 1X PBS solution and dried on paper. Subsequently, fixation was carried out in buffered formalin (4 g of NaH2PO4, 6.5 g of Na2HPO4, 100 mL of formaldehyde and 900 mL of distilled water). Subsequently, they were sent to the specific processes previously established to prepare the histological slides, which were stained with two types of stains: Hematoxylin-Eosin (HE). All analysis of the fragments was performed using an opticam binocular optical microscope (model O400S, São Paulo, Brazil), using a 40x objective.
4.11. GOT and GPT Dosaje
The test was performed according to the protocol with the manufacturer's instructions (Lab-Test). Initially, the test tubes were identified and 100 µL of GOT substrate or GPT substrate solution was added, which were incubated in a water bath at 37 °C for 2 minutes. Then, 20 µL of blood plasma from animals exposed or not exposed to the compound was added and a new incubation was carried out in a water bath (37 °C) for 60 min for the GOT test and a 30 min incubation for the GPT test. After incubation, 100 µL of color reagent (AST/GOT and ALT/GPT Liquiform, Labtest, Lagoa Santa, MG, Brasil) was added. After 20 minutes at room temperature, 1 ml of NaOH solution (1.25 mol/L) was added and waited 5 min. Finally, 300 µL of the samples (in triplicate) were transferred to 96-well microtiter plates and the absorbance reading was performed at a wavelength of 505 nm using a plate spectrophotometer (Thermo Scientific™ Multiskan™ GO Microplate Spectrophotometer). In parallel with the sample preparation, the calibration curve was prepared (according to the kit) for subsequent calculations of the GOT and GPT levels in the analyzed simples.
4.12. Measurement of IFN-γ and TNF Cytokines in Plasma, BAL and PCL
To measure the cytokines IFN-γ and TNF, with a direct ELISA (OptEIATM Kit, BD Biosciences), 96-well high affinity microtiter plates were used according to the protocol described below. Between each step, the wells were washed with 300 μL of washing solution (1X PBS [phosphate buffer saline: 8 g NaCl, 0.2 g KCl, 1.15 g Na2HPO4, 0.2 g KH2PO4 and 1 L distilled water] + 0.05% Tween 20, pH 7.4).
Initially, the plate was sensitized with 100 µl/well of solution containing the capture antibody (1:250) diluted in 0.1 M carbonate buffer – pH 9.5 (7.13 g of NaHCO3 and 1.59 g of Na2CO3 in 1 liter of milliwater). Plates were incubated for up to 18 hours at 4°C. After this period, the supernatant was discarded, the plate was washed, and non-specific binding sites were blocked by adding 200 µL of blocking solution (1X PBS + 1% bovine serum albumin [BSA] - Sigma). Again, the plates were incubated for 1 hour at room temperature and then washed. Subsequently, different dilutions of the standard recombinant cytokine (curve) and the samples under study (50 µL/well) were added in triplicate. After a 2-hour incubation, a new washing cycle was performed and 100 µL/well of detection antibody (biotinylated secondary antibody – 1:250) in the case of TNF, and 100 µL/well of detection antibody were added (biotinyl-sided secondary antibody) was added – 1:250) + enzyme (1:250) in the case of IFN-ɤ. After a new incubation of 1 hour and 30 minutes at room temperature and a new washing cycle, 100 µL/well of the enzyme streptoavidin (1:250) was added in the case of TNF, and after 30 minutes the mixture was washed plate again and 100 µL/well of substrate was added. For IFN-ɤ, after 1 hour and 30 minutes of secondary antibody + enzyme incubation, the plate was washed again and 100 µL/well of substrate was added. The substrate used was a 1:1 mixture of TMB Solution A and Solution B (3,3',5,5'-tetramethylbenzidine). Finally, the reaction was blocked by adding 50 µl/well of 2 M sulfuric acid (H2SO4). Absorbance was read at a wavelength of 450 nm using a plate spectrophotometer (Thermo Scientific™ Multiskan™ GO Microplate Spectrophotometer), with concentrations calculated from the titration curve of the cytokine standards and the final concentrations were expressed in pg/mL.
4.13. Statistical Analysis
The data obtained in this study were analyzed using GraphPad Prism 7.0 software (San Diego, California, USA). The entire study was carried out at least in sixfold, with the n value of the sample varying from 6 to 10 (N= 6-10) and in independent experiments. Discrepant data were identified using Grubbs analysis, followed by the Shapiro-Wilk test to verify the parametric or non-parametric nature of the data. To do this, the ANOVA test (analysis of variance) and Tukey's multiple comparisons post-test were applied to the parametric data (the results were presented as mean and standard deviation). For non-parametric data, the Kruskal-Walli’s test and Dunn's multiple comparison post-test were used (the results were presented as the median with the upper and lower quartiles: Me [Q1; Q3]). Statistical significance was established at p < 0.05, the results were expressed as mean ± SEM, except for the dose of cytokines (TNF and IFN-ɤ) which were expressed as mean ± SD due to the analysis carried out with plasma set of animals in each group, and analyzed using the GraphPad Prism program, version 9 (San Diego, California, USA). For the analysis, the One-way ANOVA test (One-way Analysis of Variance) was used, and the post-test was performed using Tukey's method (Tukey's Multiple Comparison Test). The significance level adopted was 5%, where p ≤ 0.05.
5. Conclusions
We report a synergistic effect of ISO in combination with the antifungals FLZ, CASP and AFB, showing a greater effect in the combined ISO-FLZ treatment compared to the ISO-CASP and ISO-AFB treatments in this study. Furthermore, the side effects of ISO in female mice (Mus musculus) of the Balb/c lineage were not significant, indicating that ISO does not exert toxic effects at the concentrations tested on these mice. These results serve as references to continue the study of this monoterpene, given the important antimicrobial potential previously reported, and could serve as an interesting tool for the treatment and control of drug-resistant in-hospital pathogens.
Supplementary Materials
The following supporting information can be downloaded at the website of this paper posted on Preprints.org.
Author Contributions
Conceptualization, O.I.C.-M., A.A.-O. and F.F.A.; methodology, O.I.C.-M., A.A.-O., J.S.M., R.B.S., J.M.A.R., K.F.G., F.F.A. and B.D.L.F.; formal analysis, O.I.C.-M., A.A.-O., G.S.P., J.S.M., R.B.S., J.M.A.R., K.F.G., F.F.A. and B.D.L.F.; investigation, O.I.C.-M., A.A.-O., J.S.M., R.B.S., J.M.A.R., K.F.G., F.F.A. and B.D.L.F.; resources, A.A.-O., G.S.P. and F.F.A.; writing—original draft preparation, O.I.C.-M., A.A.-O., R.B.S., J.M.A.R., K.F.G., F.F.A. and B.D.L.F.; writing—review and editing, O.I.C.-M., A.A.-O., J.S.M., J.M.A.R., K.F.G., F.F.A. and B.D.L.F.; visualization, O.I.C.-M., A.A.-O. and J.S.M.; supervision, O.I.C.-M., A.A.-O. and F.F.A.; project administration, A.A.-O.; funding acquisition, A.A.-O., G.S.P. and F.F.A. All authors have read and agreed to the published version of the manuscript.
Funding
This research was funded with resources from the PSFCB07-2019 project of the University of Córdoba, Montería, Colombia and resources from the project 2022/06210-6 FAPESP from the Federal University of São Carlos, São Carlos, SP, Brazil.
Institutional Review Board Statement
Not applicable.
Informed Consent Statement
Not applicable.
Data Availability Statement
The data presented in this study are available in the article and the supporting information.
Conflicts of Interest
The authors declare no conflict of interest.
References
- Avato, P. Editorial to the Special Issue “Natural products and drug discovery". Molecules 2020, 25, 1128. [Google Scholar] [CrossRef] [PubMed]
- Naman, C.B.; Benatrehina, P.A.; Kinghorn, A.D. Pharmaceuticals, plant drugs. In Breeding Genetics and Biotechnology. Vol. 2. Elsevier Inc. 2016. p. 93-99. [CrossRef]
- Aylate, A.; Agize, M.; Ekero, D.; Kiros, A.; Ayledo, G.; Gendiche, K. In-vitro and in-vivo antibacterial activities of Croton macrostachyus methanol extract against E. coli and S. aureus. Adv Anim Vet Sci 2017, 5, 107–114. [Google Scholar] [CrossRef]
- Bhatia, P.; Sharma, A.; George, A.J.; Anvitha, D.; Kumar, P.; Dwivedi, V.P.; Chandra, N.S. Antibacterial activity of medicinal plants against ESKAPE: An update. Heliyon 2021, 7, e06310. [Google Scholar] [CrossRef] [PubMed]
- Ji, H.-F.; Li, X.-J.; Zhang, H.-Y. Natural products and drug discovery can thousands of years of ancient medical knowledge lead us to new and powerful drug combinations in the fight against cancer and dementia? EMBO reports 2009, 10, 194–200. [Google Scholar] [CrossRef] [PubMed]
- Baddley, J.W.; Pappas, P.G. Antifungal combination therapy clinical potential. Drugs 2005, 65, 1461–1480. [Google Scholar] [CrossRef]
- Ghannoum, M.A.; Fu, Y.; Ibrahim, A.S.; Mortara, L.A.; Shafiq, M.C.; Edwards, J.E.; Criddle, R.S. In vitro determination of optimal antifungal combinations against Cryptococcus neoformans and Candida albicans. Antimicrobial Agents and Chemotherapy 1995, 39, 2459–2465. [Google Scholar] [CrossRef]
- Shaban, S.; Patel, M.; Ahmad, A. Improved efficacy of antifungal drugs in combination with monoterpene phenols against Candida auris. Sci Rep 2020, 10, 1. [Google Scholar] [CrossRef]
- Amber, K.; Aijaz, A.; Immaculata, X.; Luqman, K.A.; Nikhat, M. Anticandidal effect of Ocimum sanctum essential oil and its synergy with fluconazole and ketoconazole. Phytomedicine 2010, 17, 921–925. [Google Scholar] [CrossRef]
- Giordani, R.; Regli, P.; Kaloustian, J.; Mikaïl, C.; Abou, L.; Portugal, H. Antifungal effect of various essential oils against Candida albicans. Potentiation of antifungal action of amphotericin B by essential oil from Thymus vulgaris. Phytotherapy Research 2004, 18, 990–995. [Google Scholar] [CrossRef]
- Dias de Castro, R.; de Souza, P.A.; Dornelas Bezerra, L.; Silva Ferreira, G.; Melo de Brito Costa, E.; Leite Cavalcanti, A. Antifungal activity and mode of action of thymol and its synergism with nystatin against Candida species involved with infections in the oral cavity: An in vitro study. BMC Complement Altern Med 2015, 15, 417. [Google Scholar] [CrossRef]
- Ahmad, A.; Khan, A.; Manzoor, N. Reversal of efflux mediated antifungal resistance underlies synergistic activity of two monoterpenes with fluconazole. European Journal of Pharmaceutical Sciences 2013, 48, 80–86. [Google Scholar] [CrossRef]
- Bae, Y.S.; Rhee, M.S. Short-term antifungal treatments of caprylic acid with carvacrol or thymol induce synergistic 6-Log reduction of pathogenic Candida albicans by cell membrane disruption and efflux pump inhibition. Cellular Physiology and Biochemistry 2019, 53, 285–300. [Google Scholar] [CrossRef]
- Jafri, H.; Ahmad, I. Thymus vulgaris essential oil and thymol inhibit biofilms and interact synergistically with antifungal drugs against drug resistant strains of Candida albicans and Candida tropicalis. J Mycol Med 2020, 30, 100911. [Google Scholar] [CrossRef] [PubMed]
- Tullio, V.; Roana, J.; Scalas, D.; Mandras, N. Evaluation of the antifungal activity of Mentha x piperita (Lamiaceae) of Pancalieri (Turin, Italy) essential oil and its synergistic interaction with azoles. Molecules 2019, 24, 3148. [Google Scholar] [CrossRef]
- Rojano, B.; Saez, J.; Schinella, G.; Quijano, J.; Vélez, E.; Gil, A.; Notario, R. Experimental and theoretical determination of the antioxidant properties of isoespintanol (2-Isopropyl-3,6-Dimethoxy-5-Methylphenol). J Mol Struct 2008, 877, 1–6. [Google Scholar] [CrossRef]
- Rojano, B.; Pérez, E.; Figadère, B.; Martin, M.T.; Recio, M.C.; Giner, R.; Ríos, J.L.; Schinella, G.; Sáez, J. Constituents of Oxandra Cf. xylopioides with anti-inflammatory activity. J Nat Prod 2007, 70, 835–838. [Google Scholar] [CrossRef] [PubMed]
- Gavilánez Buñay, T.C.; Colareda, G.A.; Ragone, M.I.; Bonilla, M.; Rojano, B.A.; Schinella, G.R.; Consolini, A.E. Intestinal, urinary and uterine antispasmodic effects of isoespintanol, metabolite from Oxandra xylopioides leaves. Phytomedicine 2018, 51, 20–28. [Google Scholar] [CrossRef]
- Rinaldi, G.J.; Rojano, B.; Schinella, G.; Mosca, S.M. Participation of NO in the vasodilatory action of isoespintanol. Vitae 2019, 26, 78–83. [Google Scholar] [CrossRef]
- González Arbeláez, L.; Ciocci Pardo, A.; Fantinelli, J.C.; Rojano, B.; Schinella, G.; Mosca, S.M. Isoespintanol, a monoterpene isolated from Oxandra Cf xylopioides, ameliorates the myocardial ischemia-reperfusion injury by AKT/PKCε/ENOS-Dependent pathways. Naunyn-Schmiedeberg’s Arch Pharmacol 2020, 393, 629–638. [Google Scholar] [CrossRef] [PubMed]
- Usuga, A.; Tejera, I.; Gómez, J.; Restrepo, O.; Rojano, B.; Restrepo, G. Cryoprotective effects of ergothioneine and isoespintanol on canine semen. Animals 2021, 11, 2757. [Google Scholar] [CrossRef] [PubMed]
- Di Sarli Gutiérrez, L.; Castro, M.C.; Farromeque Vásquez, S.; Villagarcía, H.G.; González Arbeláez, L.; Rojano, B.; Schinella, G.; Maiztegui, B.; Francini, F. Protective effect of monoterpene isoespintanol in a rat model of prediabetes induced by fructose. Pharmaceuticals 2024, 17, 47. [Google Scholar] [CrossRef] [PubMed]
- Contreras Martínez, O.I.; Angulo Ortíz, A.; Santafé Patiño, G. Antibacterial screening of isoespintanol, an aromatic monoterpene isolated from Oxandra xylopioides Diels. Molecules 2022, 27, 80004. [Google Scholar] [CrossRef]
- Contreras Martínez, O.I.; Angulo Ortíz, A.; Santafé Patiño, G. Antifungal potential of isoespintanol extracted from Oxandra xylopioides Diels (Annonaceae) against intrahospital isolations of Candida spp. Heliyon 2022, 8, 11110. [Google Scholar] [CrossRef]
- Contreras, O.; Angulo, A.; Santafé, G. Mechanism of antifungal action of monoterpene isoespintanol against clinical isolates of Candida tropicalis. Molecules 2022, 27, 5808. [Google Scholar] [CrossRef] [PubMed]
- Contreras Martínez, O.I.; Angulo Ortíz, A.; Santafé Patiño, G.; Peñata-Taborda, A.; Berrio Soto, R. Isoespintanol antifungal activity involves mitochondrial dysfunction, inhibition of biofilm formation, and damage to cell wall integrity in Candida tropicalis. Int J Mol Sci 2023, 24, 10187. [Google Scholar] [CrossRef] [PubMed]
- Contreras-Martínez, O.I.; Angulo-Ortíz, A.; Santafé-Patiño, G.; Aviña-Padilla, K.; Velasco-Pareja, M.C.; Yasnot, M.F. Transcriptional reprogramming of Candida tropicalis in response to isoespintanol treatment. J. of Fungi 2023, 9, 1199. [Google Scholar] [CrossRef]
- Vennin, C.; Cattaneo, C.M.; Bosch, L.; Vegna, S.; Ma, X.; Damstra, H.G.J.; Martinovic, M.; Tsouri, E.; Ilic, M.; Azarang, L.; van Weering, J.R.T.; Pulver, E.; Zeeman, A.L.; Schelfhorst, T.; Lohuis, J.O.; Rios, A.C.; Dekkers, J.F.; Akkari, L.; Menezes, R.; Medema, R.; Baglio, S.R.; Akhmanova, A.; Linn, S.C.; Lemeer, S.; Pegtel, D.M.; Voest, E.E.; van Rheenen, J. Taxanes trigger cancer cell killing in vivo by inducing non-canonical T cell cytotoxicity. Cancer Cell 2023, 41, 1170–1185. [Google Scholar] [CrossRef]
- Mba, I.E.; Nweze, E.I. Mechanism of candida pathogenesis: revisiting the vital drivers. Eur J Clin Microbiol Infect Dis 2020, 1797–1819. [Google Scholar] [CrossRef]
- Černáková, L.; Light, C.; Salehi, B.; Rogel-Castillo, C.; Victoriano, M.; Martorell, M.; Sharifi-Rad, J.; Martins, N.; Rodrigues, C.F. Novel therapies for biofilm-based Candida spp. Infections. In Advances in Experimental Medicine and Biology 2019, 1214, 93–123. [Google Scholar] [CrossRef]
- Salci, T.P.; Negri, M.; Abadio, A.K.R.; Svidzinski, T.I.E.; Kioshima, É.S. Targeting Candida spp. to develop antifungal agents. Drug Discovery Today 2018, 802–814. [Google Scholar] [CrossRef]
- Donkor, M.N.; Donkor, A.M.; Mosobil, R. Combination therapy: synergism among three plant extracts against selected pathogens. BMC Res Notes 2023, 16, 83. [Google Scholar] [CrossRef] [PubMed]
- Zapata-Zapata, C.; Rojas-López, M.; García, L.T.; Quintero, W.; Terrón, M.C.; Luque, D.; Mesa-Arango, A.C. Lippia origanoides essential oil or thymol in combination with fluconazole produces damage to cells and reverses the azole-resistant phenotype of a Candida tropicalis strain. J. of Fungi 2023, 9, 888. [Google Scholar] [CrossRef]
- Zore, G.B.; Thakre, A.D.; Jadhav, S.; Karuppayil, S.M. Terpenoids inhibit Candida albicans growth by affecting membrane integrity and arrest of cell cycle. Phytomedicine 2011, 18, 1181–1190. [Google Scholar] [CrossRef]
- Johnson, M.D.; MacDougall, C.; Ostrosky-Zeichner, L.; Perfect, J.R.; Rex, J.H. Combination antifungal therapy. Antimicrobial Agents and Chemotherapy 2004, 48, 693–715. [Google Scholar] [CrossRef]
- Cowen, L.E. The evolution of fungal drug resistance: Modulating the trajectory from genotype to phenotype. Nature Reviews Microbiology. 2008, 187–198. [Google Scholar] [CrossRef]
- Lupetti, A.; Danesi, R.; Campa, M.; Del Tacca, M.; Steven, K. Molecular basis of resistance to azole antifungals. TRENDS in Molecular Medicine. 2002, 8, 76–81. [Google Scholar] [CrossRef] [PubMed]
- Guimarães, M.; Donadi, E. Immune cellular response to HPV: Current concepts. Braz. J. Infect. Dis. 2004, 8, 1–9. [Google Scholar]
- Youssefi, M.R.; Moghaddas, E.; Tabari, M.A.; Moghadamnia, A.A.; Hosseini, S.M.; Hosseini Farash, B.R.; Ebrahimi, M.A.; Mousavi, N.N.; Fata, A.; Maggi, F.; Petrelli, R.; Dall’Acqua, S.; Benelli, G.; Sut, S. In vitro and in vivo effectiveness of carvacrol, thymol and linalool against Leishmania infantum. Molecules 2019, 24, 2072. [Google Scholar] [CrossRef] [PubMed]
- Wojtunik-Kulesza, K.A. Toxicity of selected monoterpenes and essential oils rich in these compounds. Molecules 2022, 27, 1716. [Google Scholar] [CrossRef]
- Donadu, M.G.; Peralta-ruiz, Y.; Usai, D.; Maggio, F.; Molina-Hernandez, J.B.; Rizzo, D.; Bussu, F.; Rubino, S.; Zanetti, S.; Paparella, A.; Chaves-Lopez, C. Colombian essential oil of Ruta graveolens against nosocomial antifungal resistant Candida strains. J. of Fungi 2021, 7, 383. [Google Scholar] [CrossRef] [PubMed]
- Wadhwa, K.; Kaur, H.; Kapoor, N.; Brogi, S. Identification of Sesamin from Sesamum indicum as a potent antifungal agent using an integrated in silico and biological screening platform. Molecules 2023, 28, 4658. [Google Scholar] [CrossRef]
- Fratini, F.; Mancini, S.; Turchi, B.; Friscia, E.; Pistelli, L.; Giusti, G.; Cerri, D. A Novel interpretation of the fractional inhibitory concentration index: The case Origanum vulgare L. and Leptospermum scoparium J. R. et G. Forst essential oils against Staphylococcus aureus strains. Microbiol Res 2017, 195, 11–17. [Google Scholar] [CrossRef] [PubMed]
Figure 1.
Effect of ISO in combination with FLZ, AFB, and CASP against C. tropicalis. The FICIs Fractional Inhibitory Concentration indices of the different clinical isolates of C. tropicalis are shown.
Figure 1.
Effect of ISO in combination with FLZ, AFB, and CASP against C. tropicalis. The FICIs Fractional Inhibitory Concentration indices of the different clinical isolates of C. tropicalis are shown.
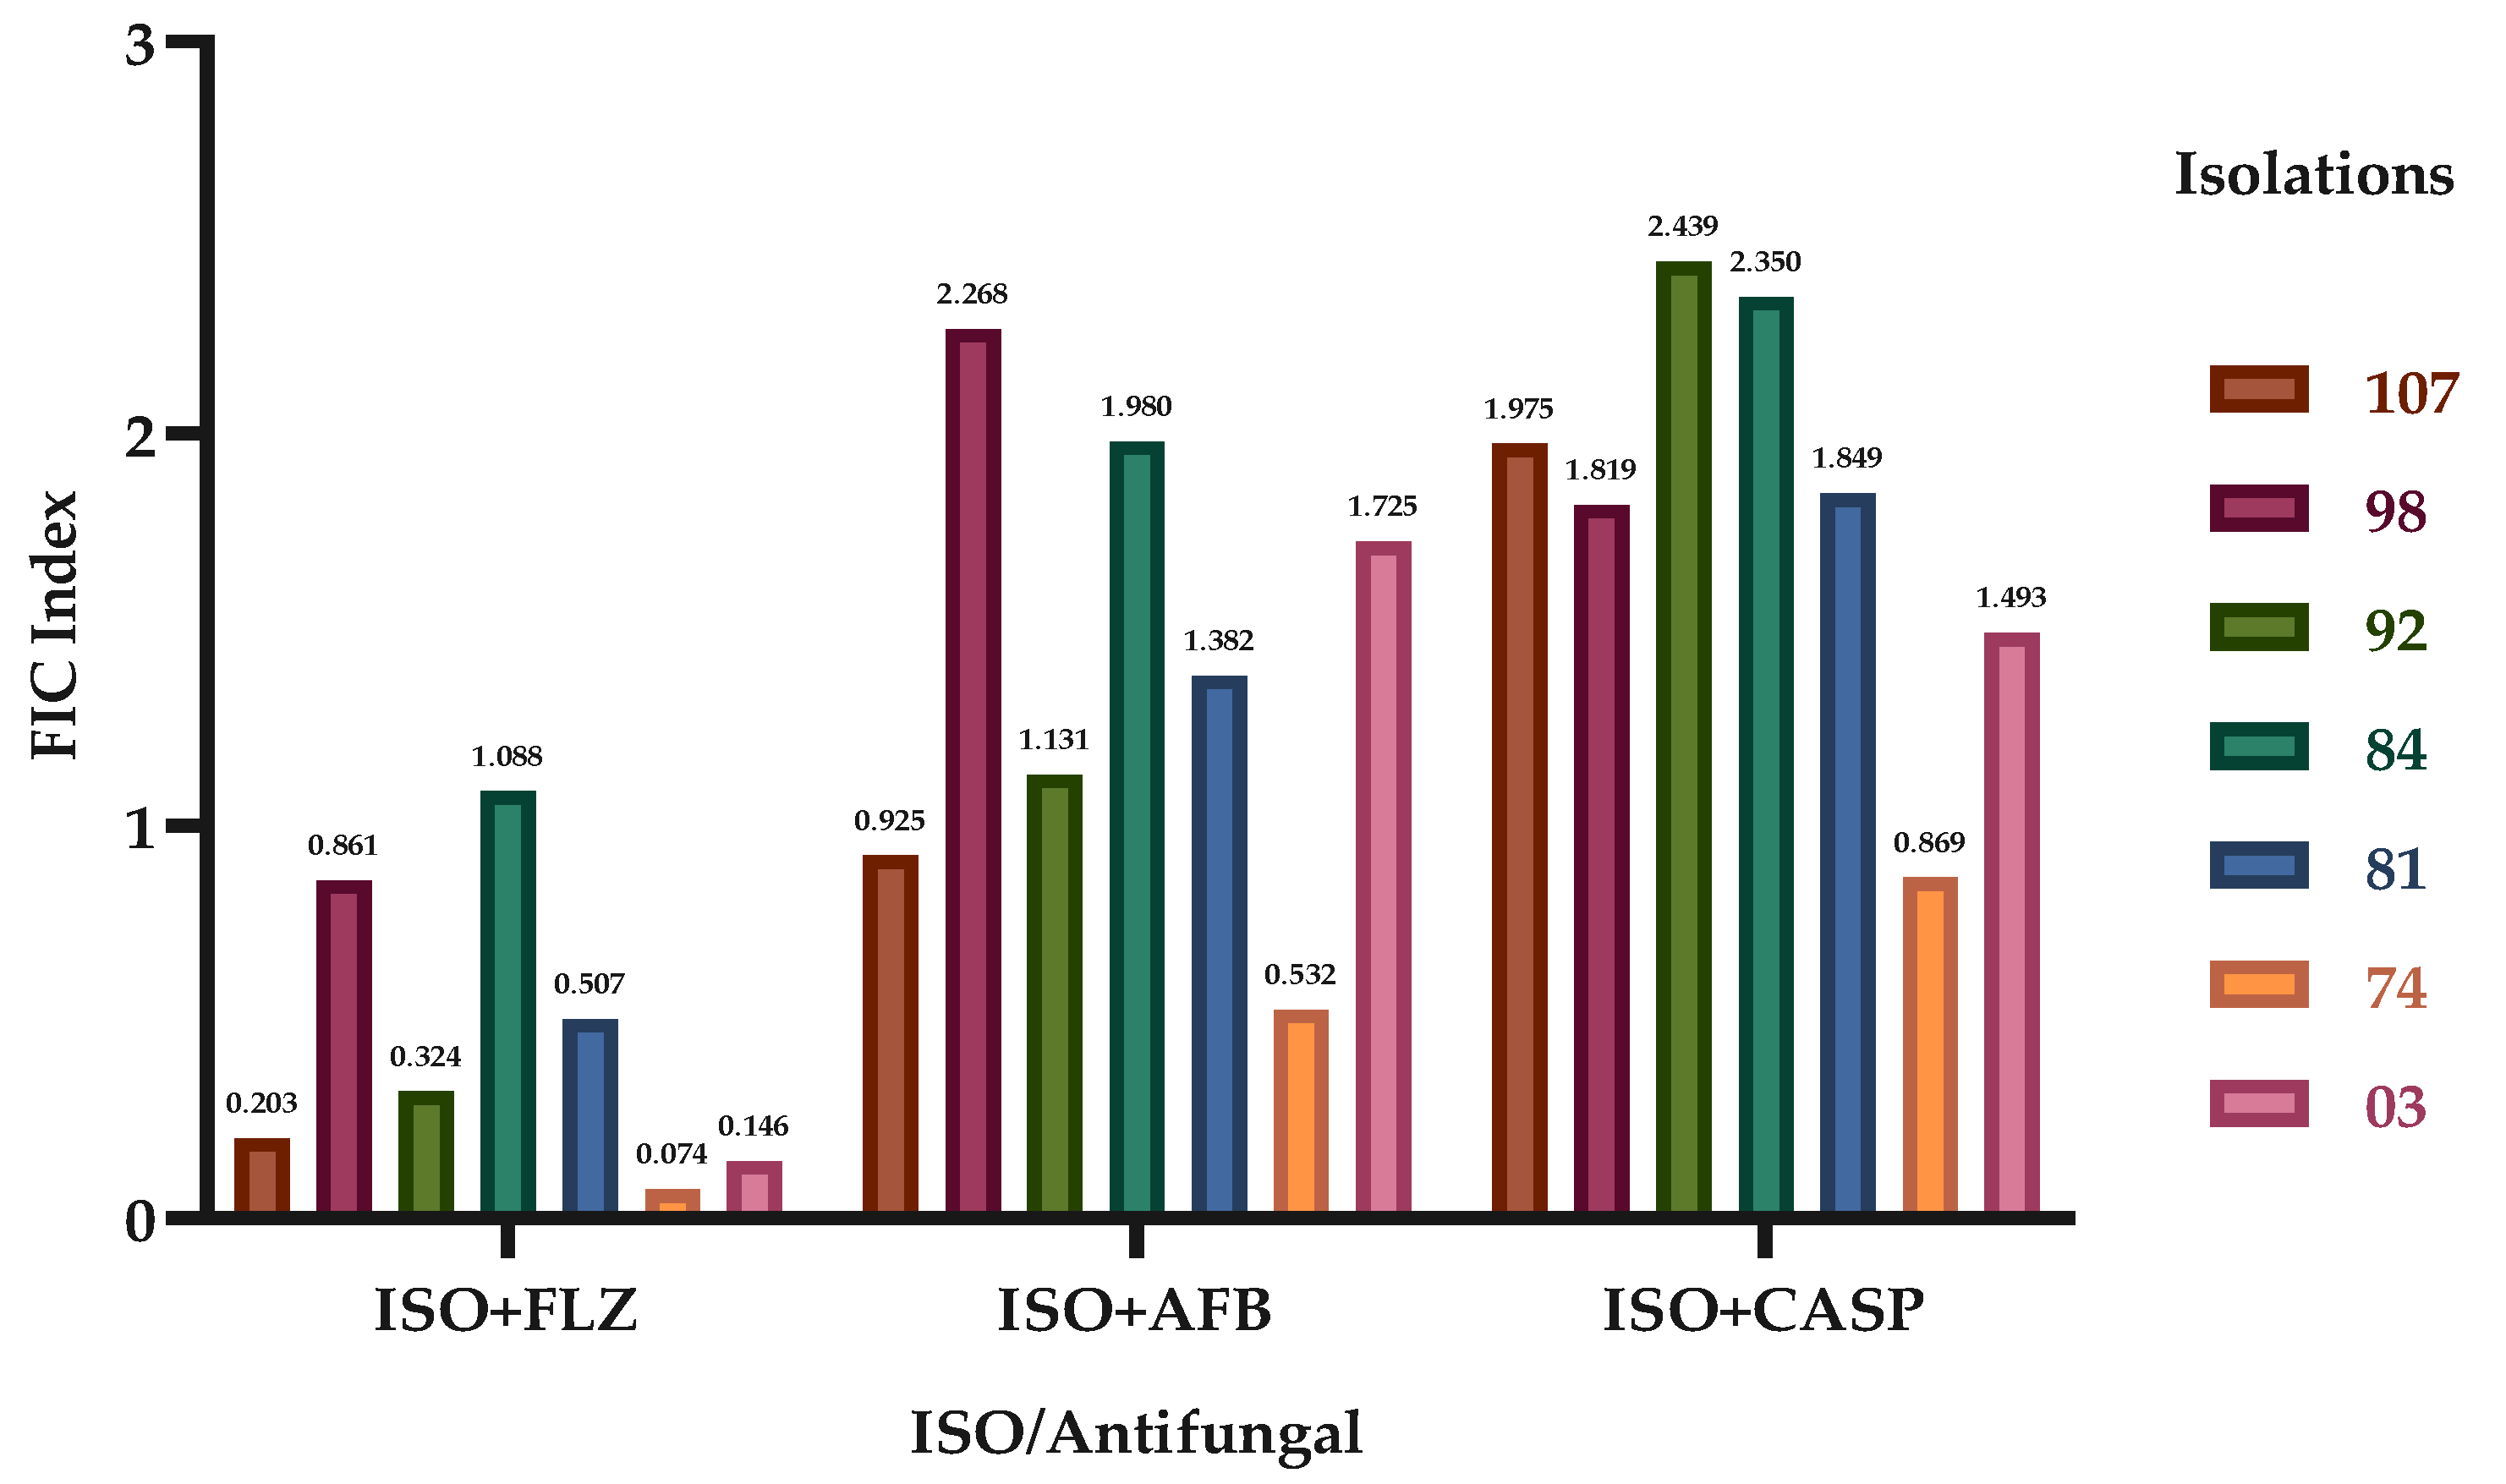
Figure 2.
Global leukocyte count, acute phase (A, B and C) and chronic phase (D, E and F). (A) Acute phase: Blood, (B) acute phase: PCL, (C) acute phase: BAL. (D) chronic phase: Blood, (E) chronic phase: PCL, (F) chronic phase: BAL. Groups: G1: CTRL + water; G2: CTRL + oil; G3 – G6: 25, 50, 100 and 200 mg/ml of the ISO at 14 days. (*) versus G1: * p ≤ 0.05; ***p ≤ 0.001. ****p ≤ 0.0001. (°) vs G2: °p ≤ 0.05. The results were presented with the mean and standard deviation (A, E). The results were presented as the median with the upper and lower quartiles: Me [Q1; Q3] (B, C, D, F).
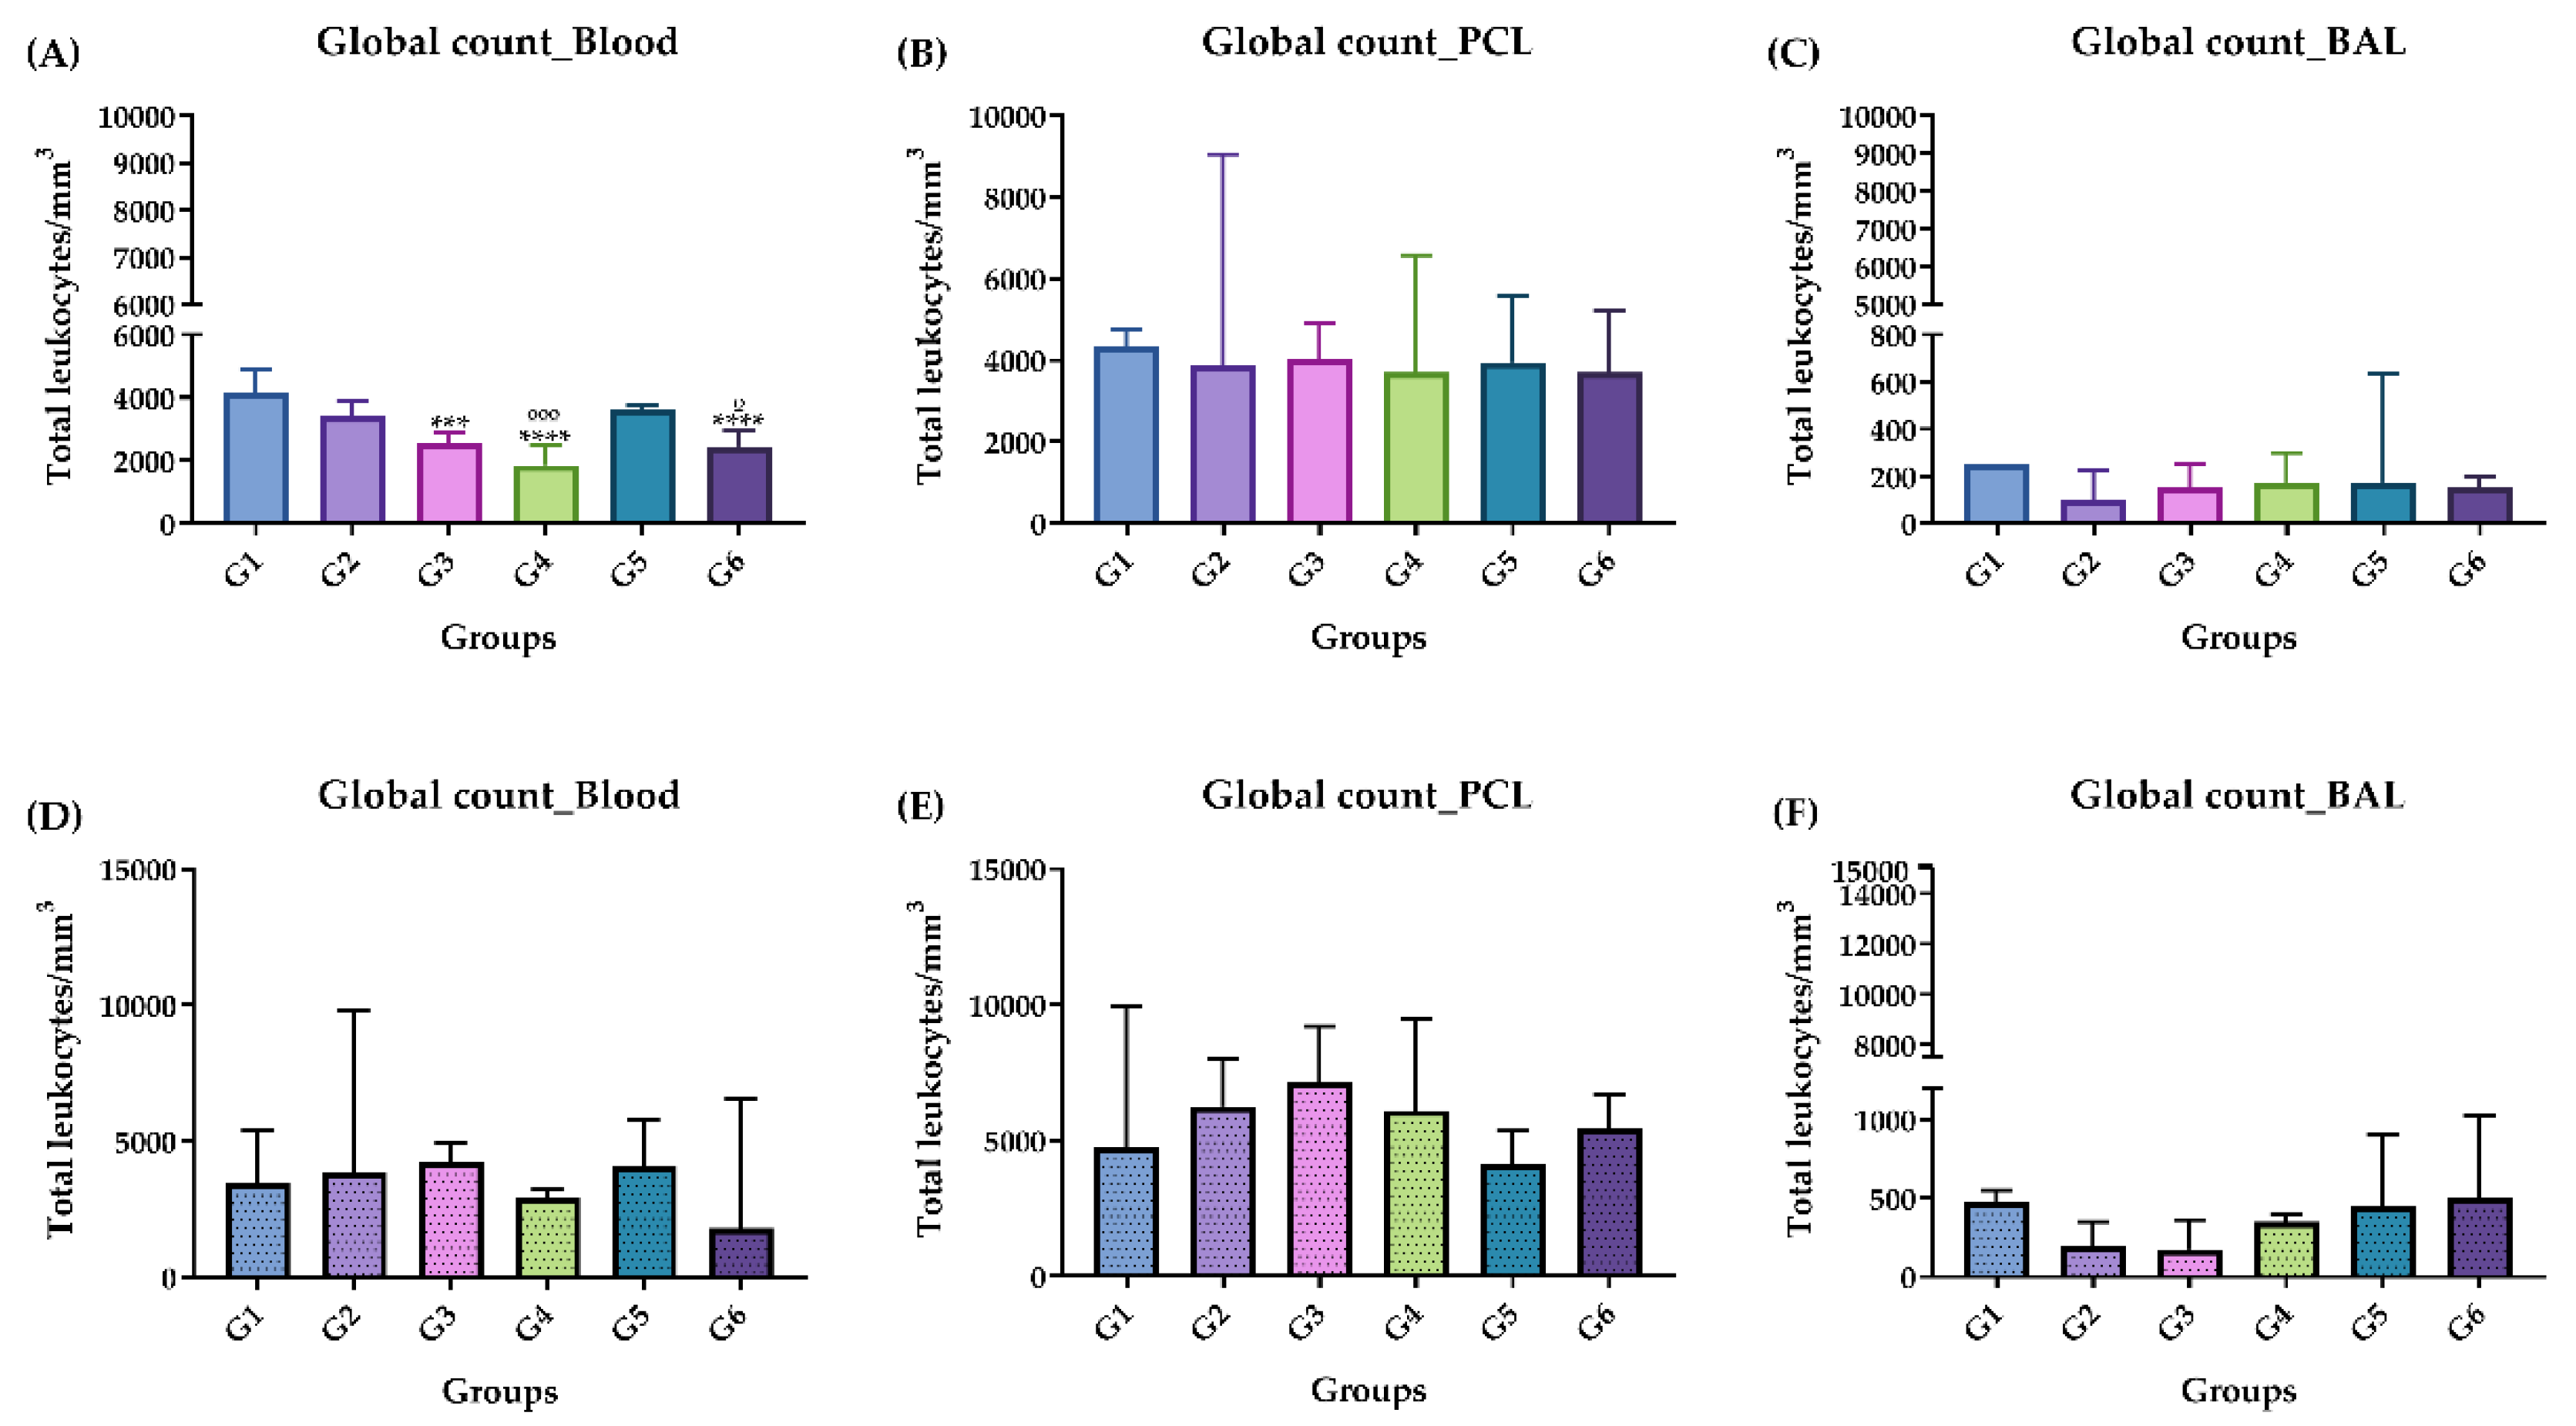
Figure 3.
Differential leukocyte count, acute phase. (A) Monocytes in PCL. (B) Mast cells in PCL. (C) Monocytes in BAL. (D) Monocytes in blood. (E) Neutrophils in blood. (F) Eosinophils in blood. Groups: G1: CTRL + water; G2: CTRL + oil; G3 – G6: 25, 50, 100 and 200 mg/ml of ISO after 14 days. (*) versus G1: * p ≤ 0.05; **p ≤ 0.01; ***p ≤ 0.001. ****p ≤ 0.0001. (°) vs G2: ° p ≤ 0.05; °° p ≤ 0.01; °°° p ≤ 0.001. The results are presented with the mean and standard deviation (B, D). The results were presented as the median with the upper and lower quartiles: Me [Q1; P3] (A, C, E, F).
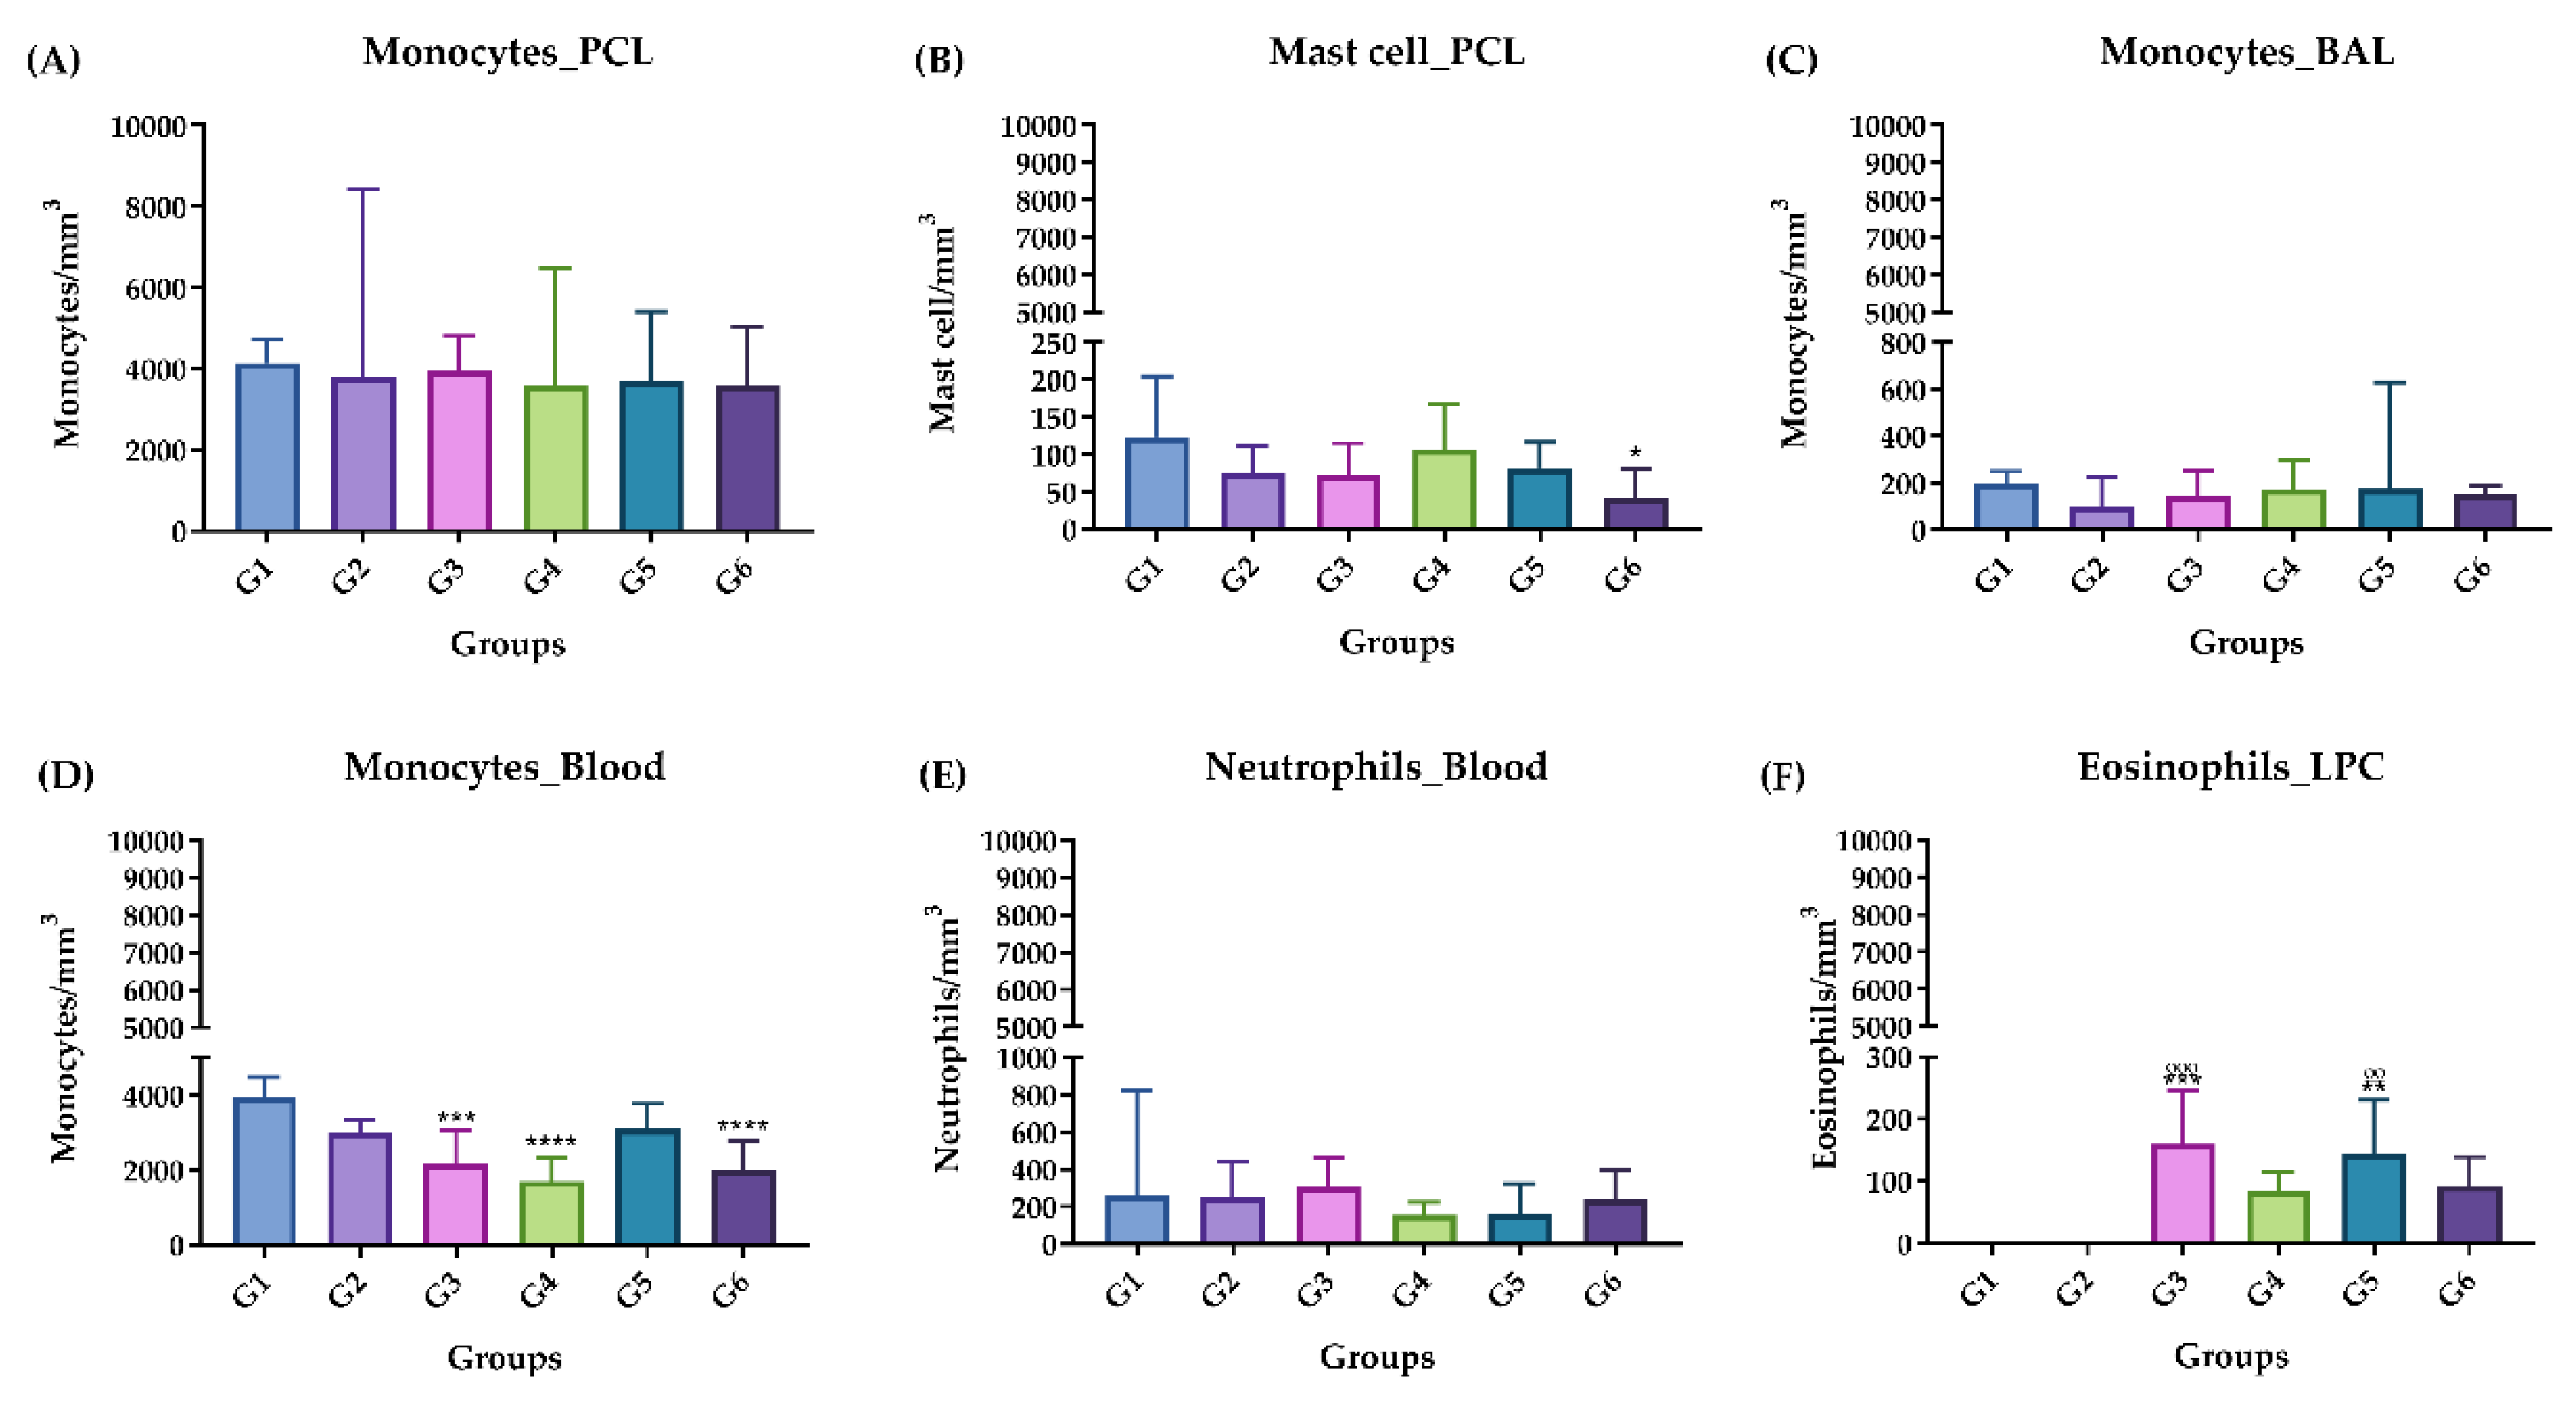
Figure 4.
Differential leukocyte count, chronic phase. (A) Monocytes in PCL. (B) Monocytes in BAL (C) Neutrophils in BAL. (D) Neutrophils in blood. (E) Eosinophils in the blood. Groups: G1: CTRL + water; G2: CTRL + oil; G3 – G6: 25, 50, 100 and 200 mg/ml of the ISO at 90 days. (*) versus G1: * p ≤ 0.05; **p ≤ 0.01; ***p ≤ 0.001. ****p ≤ 0.0001. (°) vs G2: ° p ≤ 0.05; °° p ≤ 0.01; °°° p ≤ 0.001. The results were presented with the mean and standard deviation (B, D). The results were presented as the median with the upper and lower quartiles: Me [Q1; P3] (A, B, C, D, E).
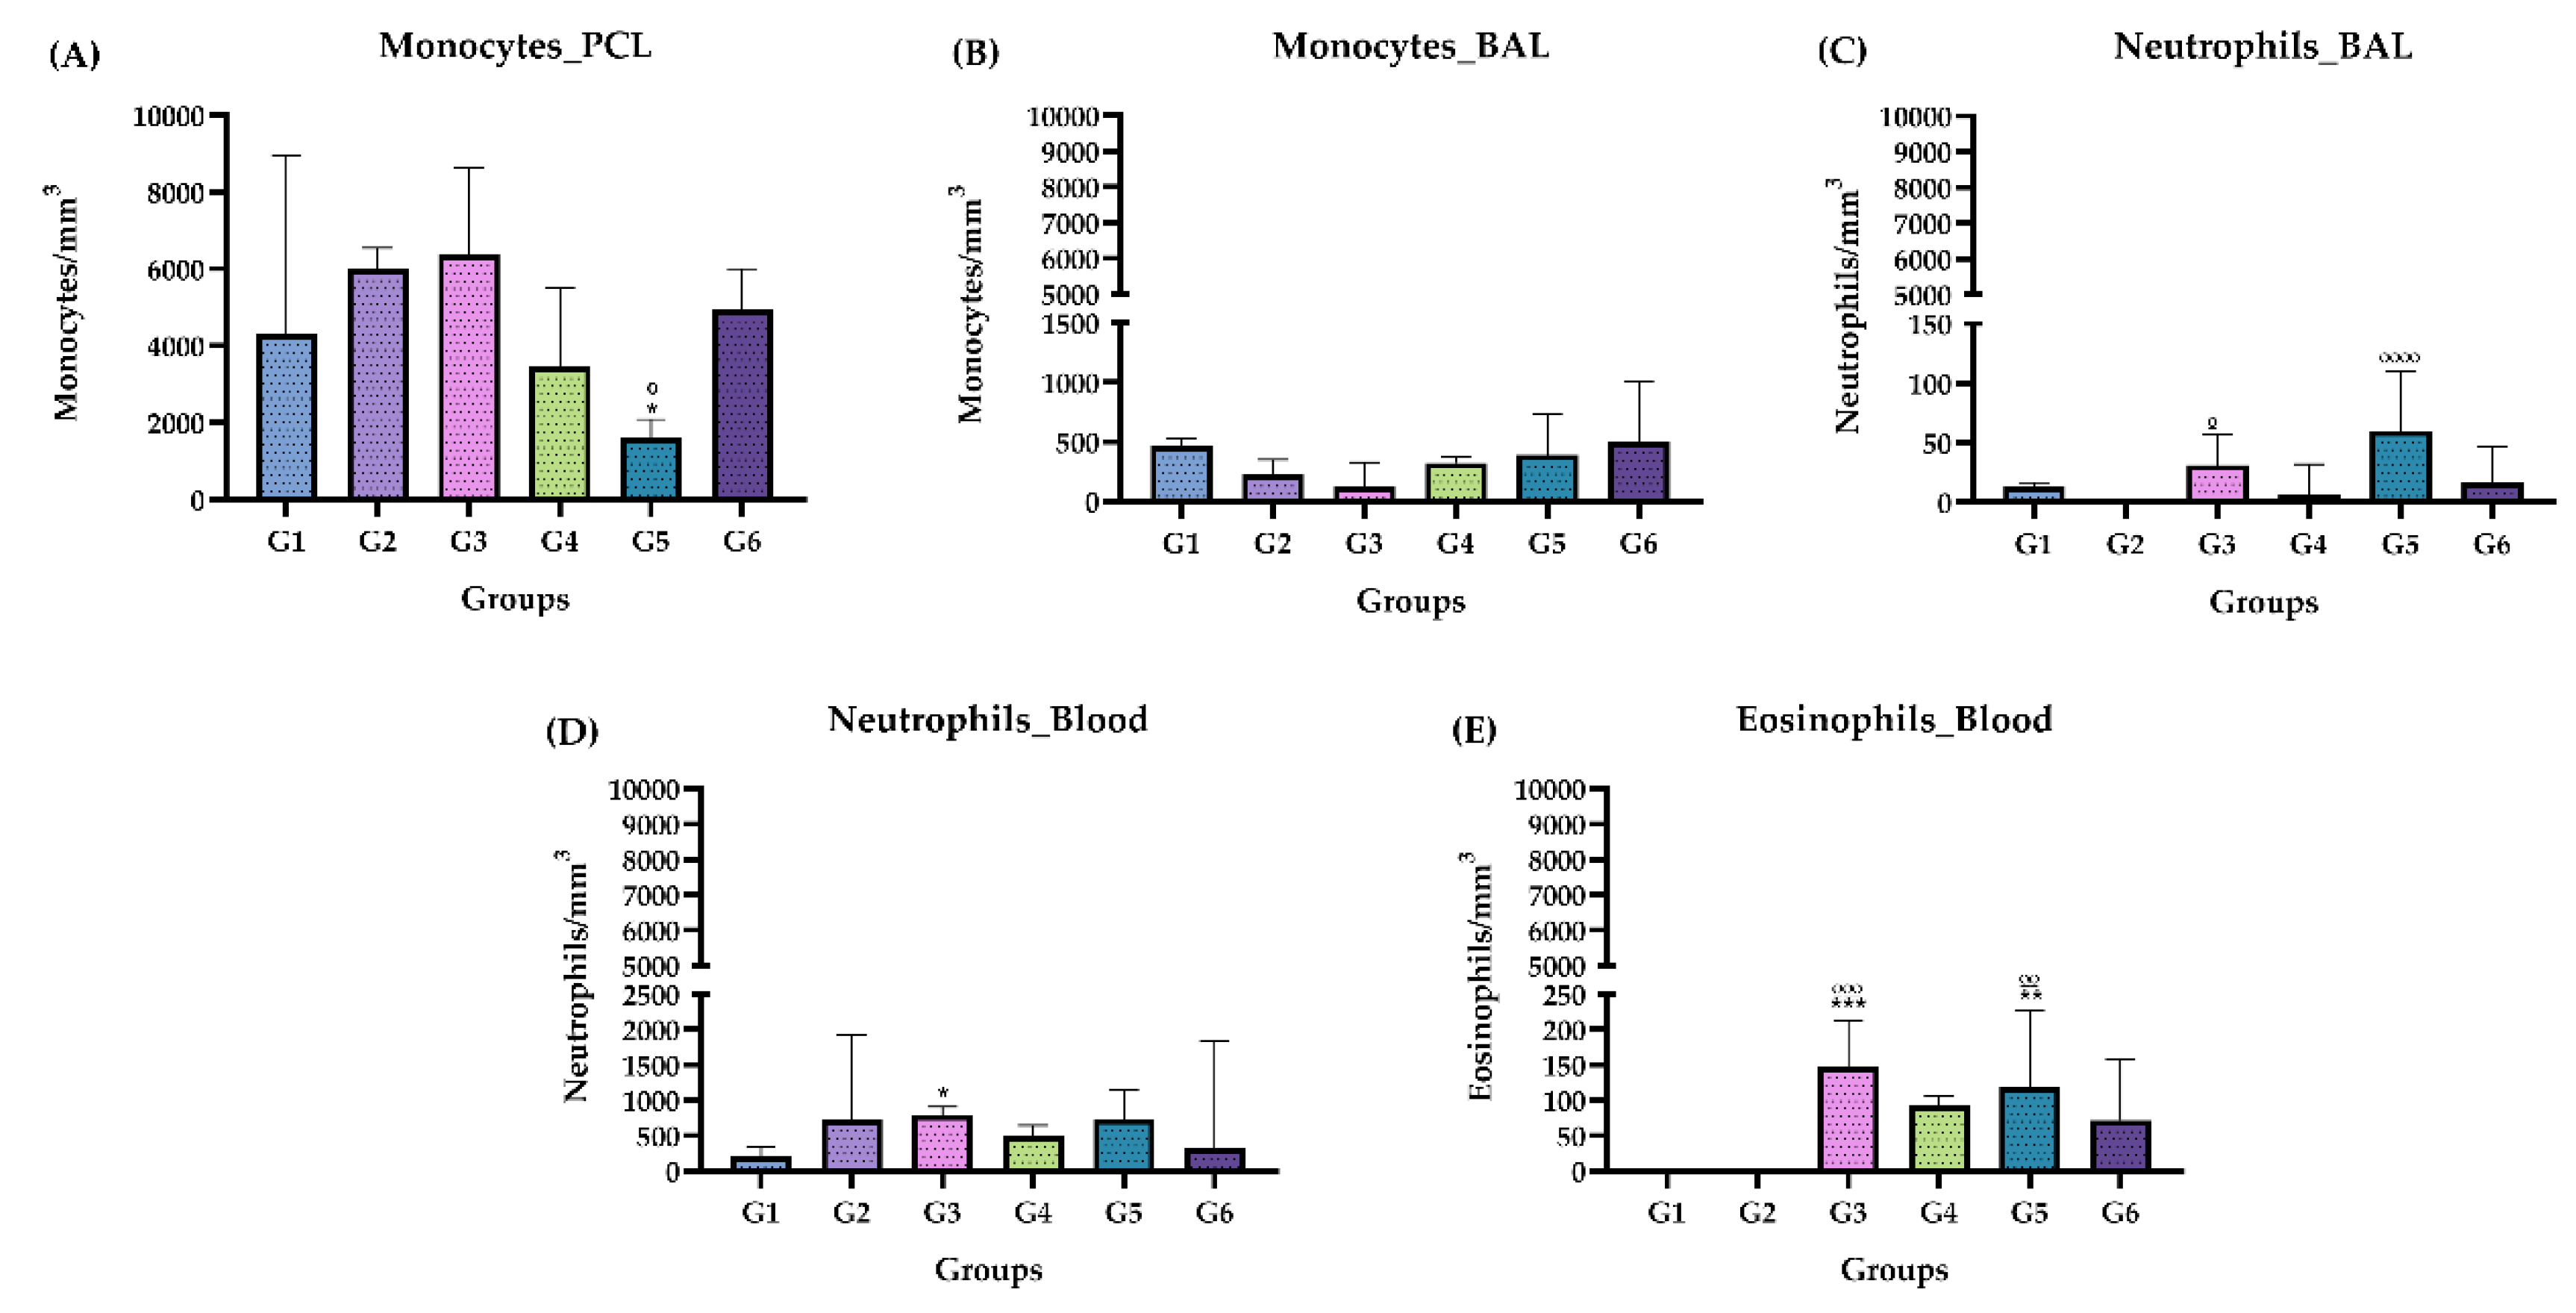
Figure 5.
Doses of GOT and GPT in the acute and chronic phases. (A) Acute phase: GOT. (B) Acute phase: GPT. (C) Chronic phase: GPT. Groups: G1: CTRL + water; G2: CTRL + oil; G3 – G6: 25, 50, 100 and 200 mg/ml of ISO after 14 days. (*) vs G1: * p ≤ 0.05. The results were presented with the mean and standard deviation.
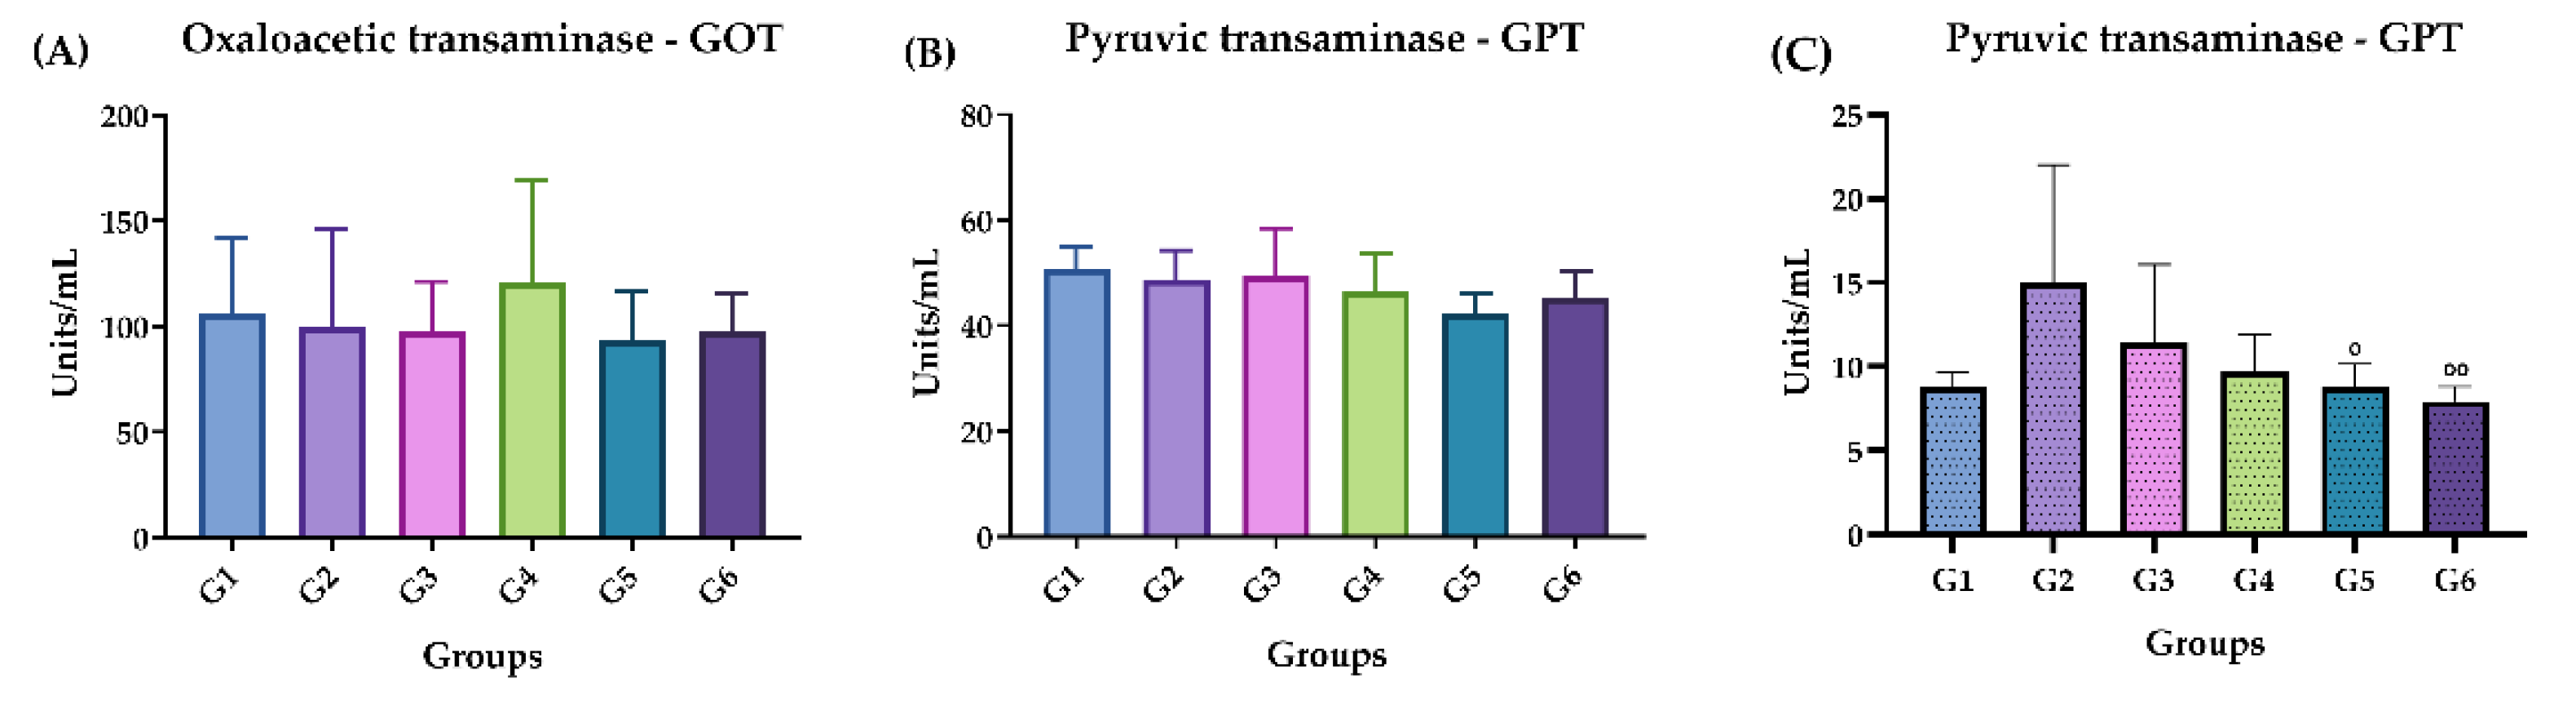
Figure 6.
Measurement of INF-γ and TNF cytokine levels in the acute and chronic phase. (A) Acute phase: IFN-γ. (B) Acute phase: TNF. (C) Chronic phase: IFN-γ. Groups: G1: CTRL + water; G2: CTRL + oil; G3 – G6: 25, 50, 100 and 200 mg/ml of ISO after 14 days. The results were presented as the median with the upper and lower quartiles: Me [Q1; P3.
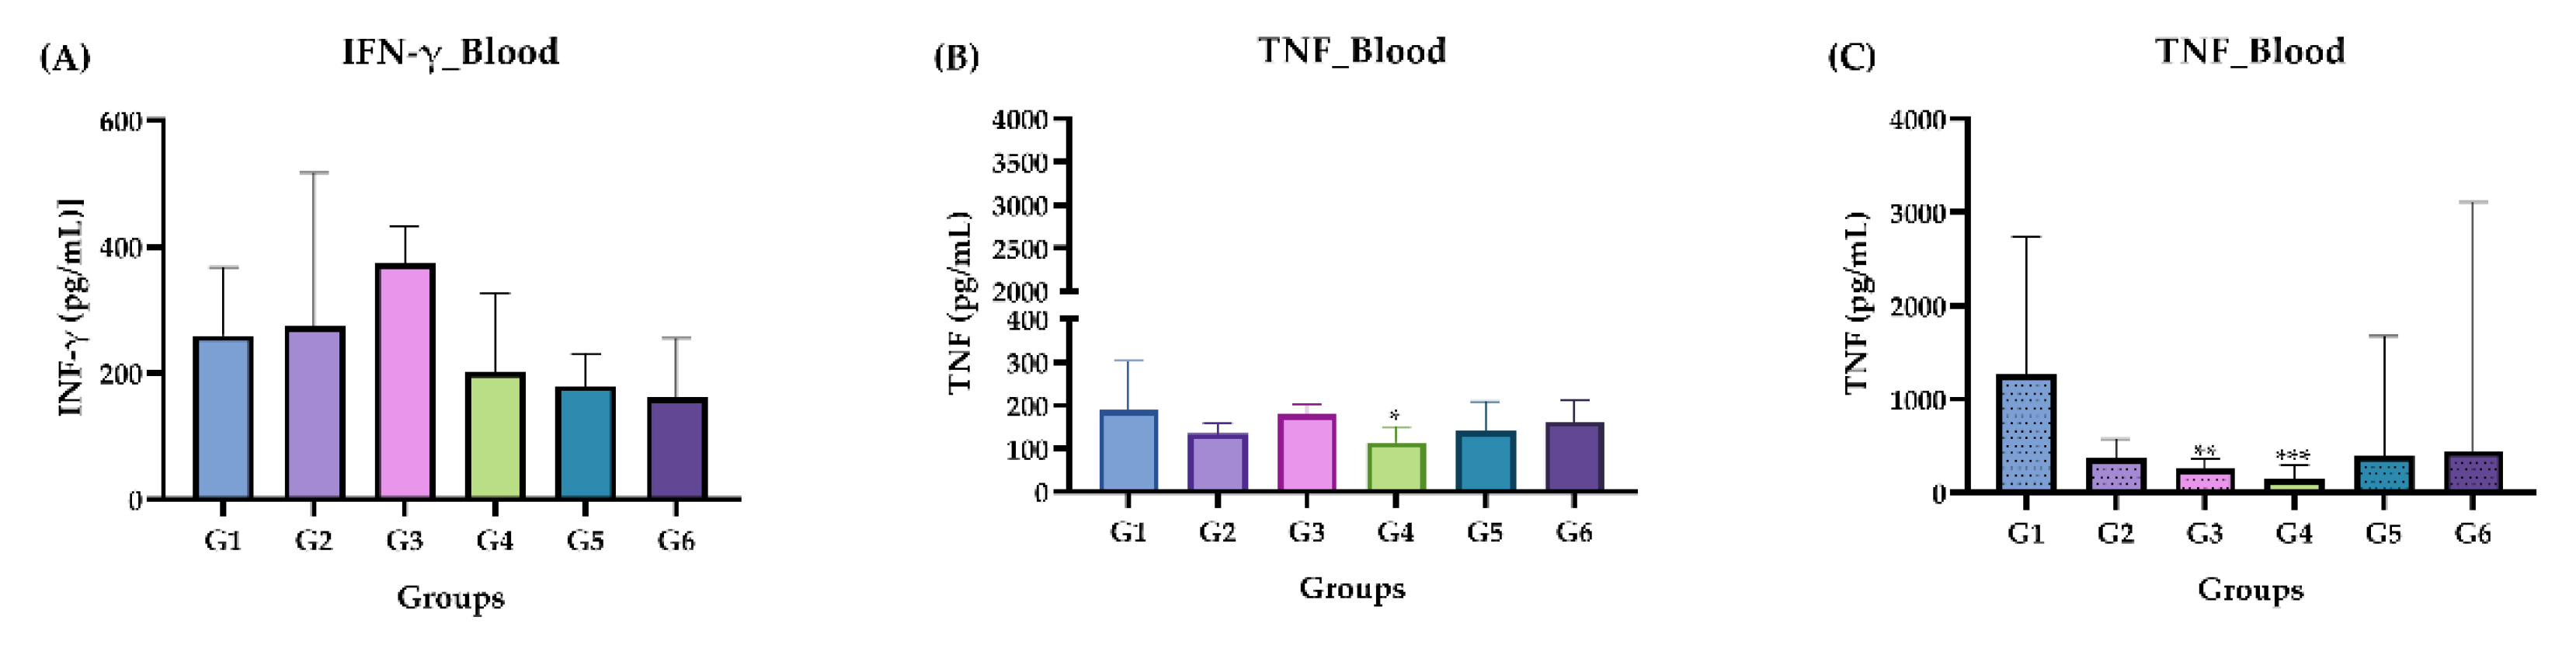
Figure 7.
Histological sections of the kidneys in the acute (a) and chronic (b) phase. (A) control group G1 (water), (B) control group G2 (oil), (C) group G3 (25 mg/kg), (D) group G4 (50 mg/kg), (E) group G5 (100 mg/kg) and (F) group G6 (200 mg/kg). The white arrows indicate areas of lymphoplasmacytic infiltrates, there were no changes in the groups represented in images A, B and F of the chronic phase.
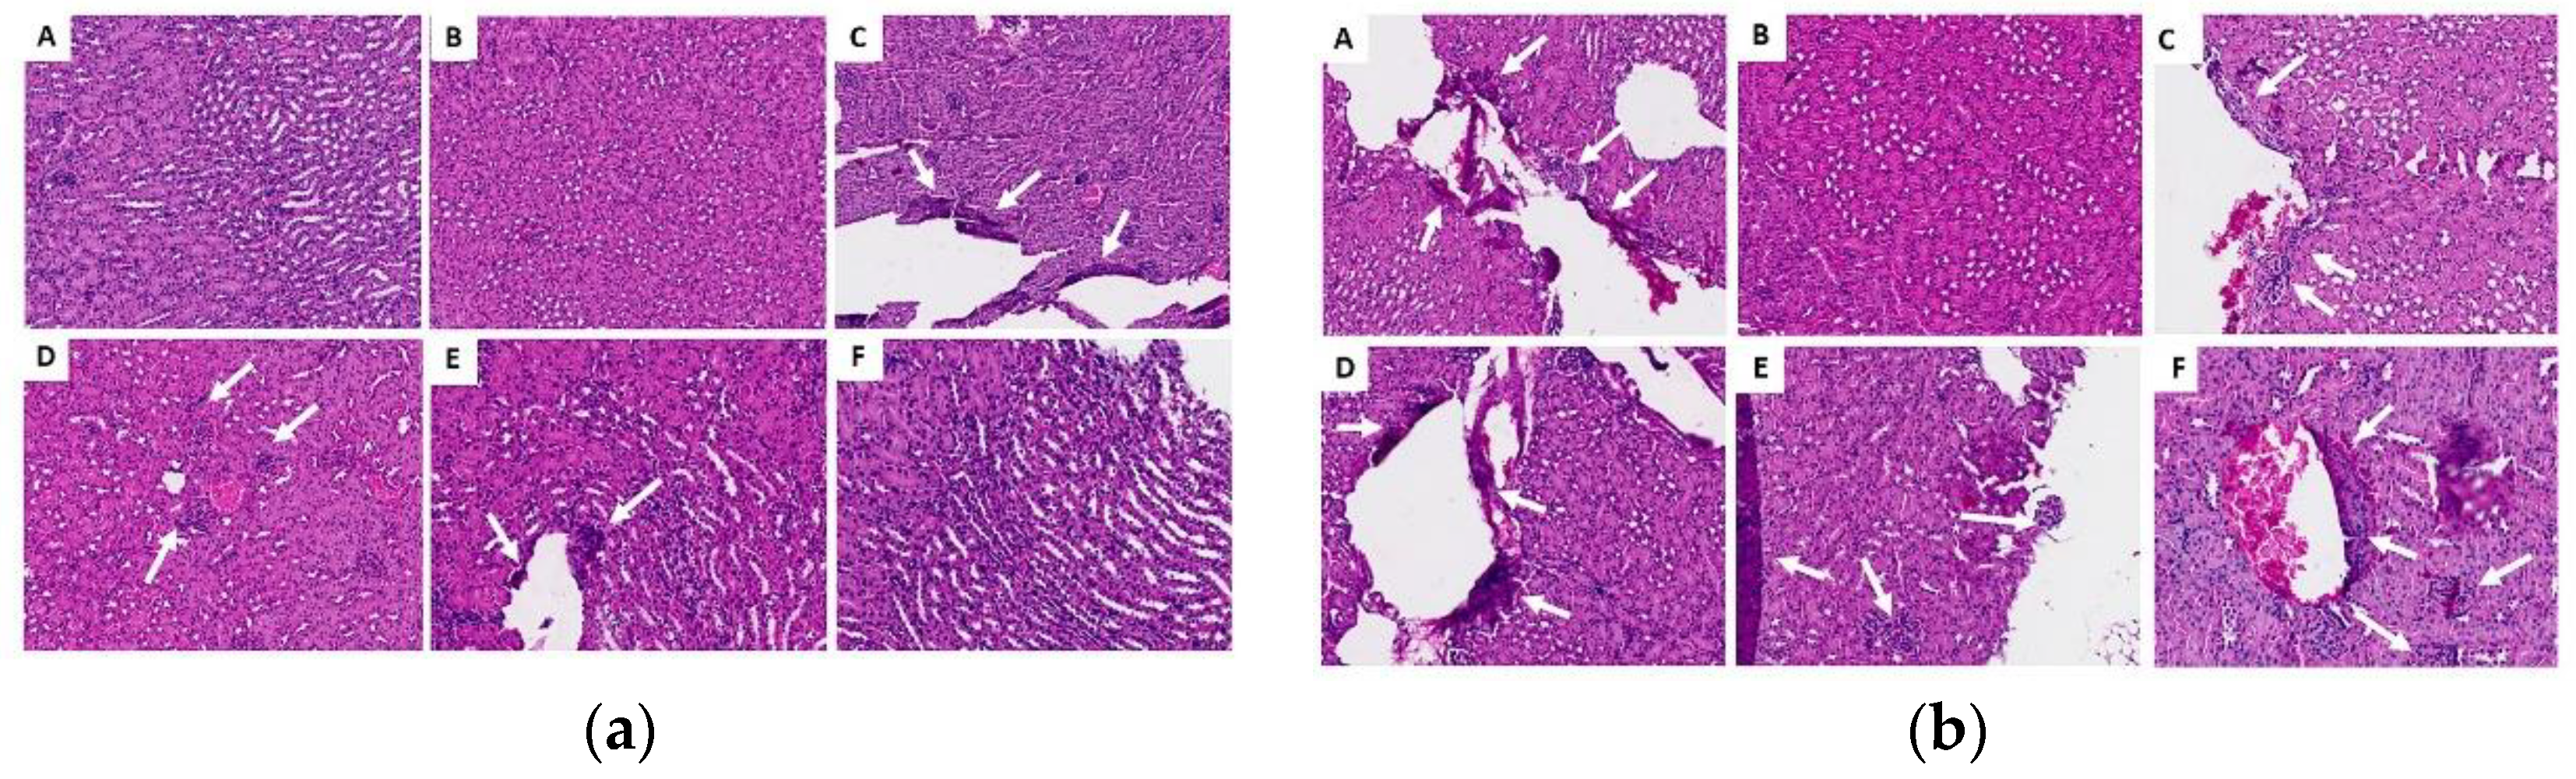
Figure 8.
Histological sections of the lungs in the acute (a) and chronic (b) phase. (A) control group G1 (water), (B) control group G2 (oil), (C) group G3 (25 mg/kg), (D) group G4 (50 mg/kg), (E) group G5 (100 mg/kg) and (F) group G6 (200 mg/kg). Red arrows indicate foci of hemorrhage, white arrows show areas of lymphoplasmacytic infiltrates, and black arrows represent thickening of the alveolar septa.
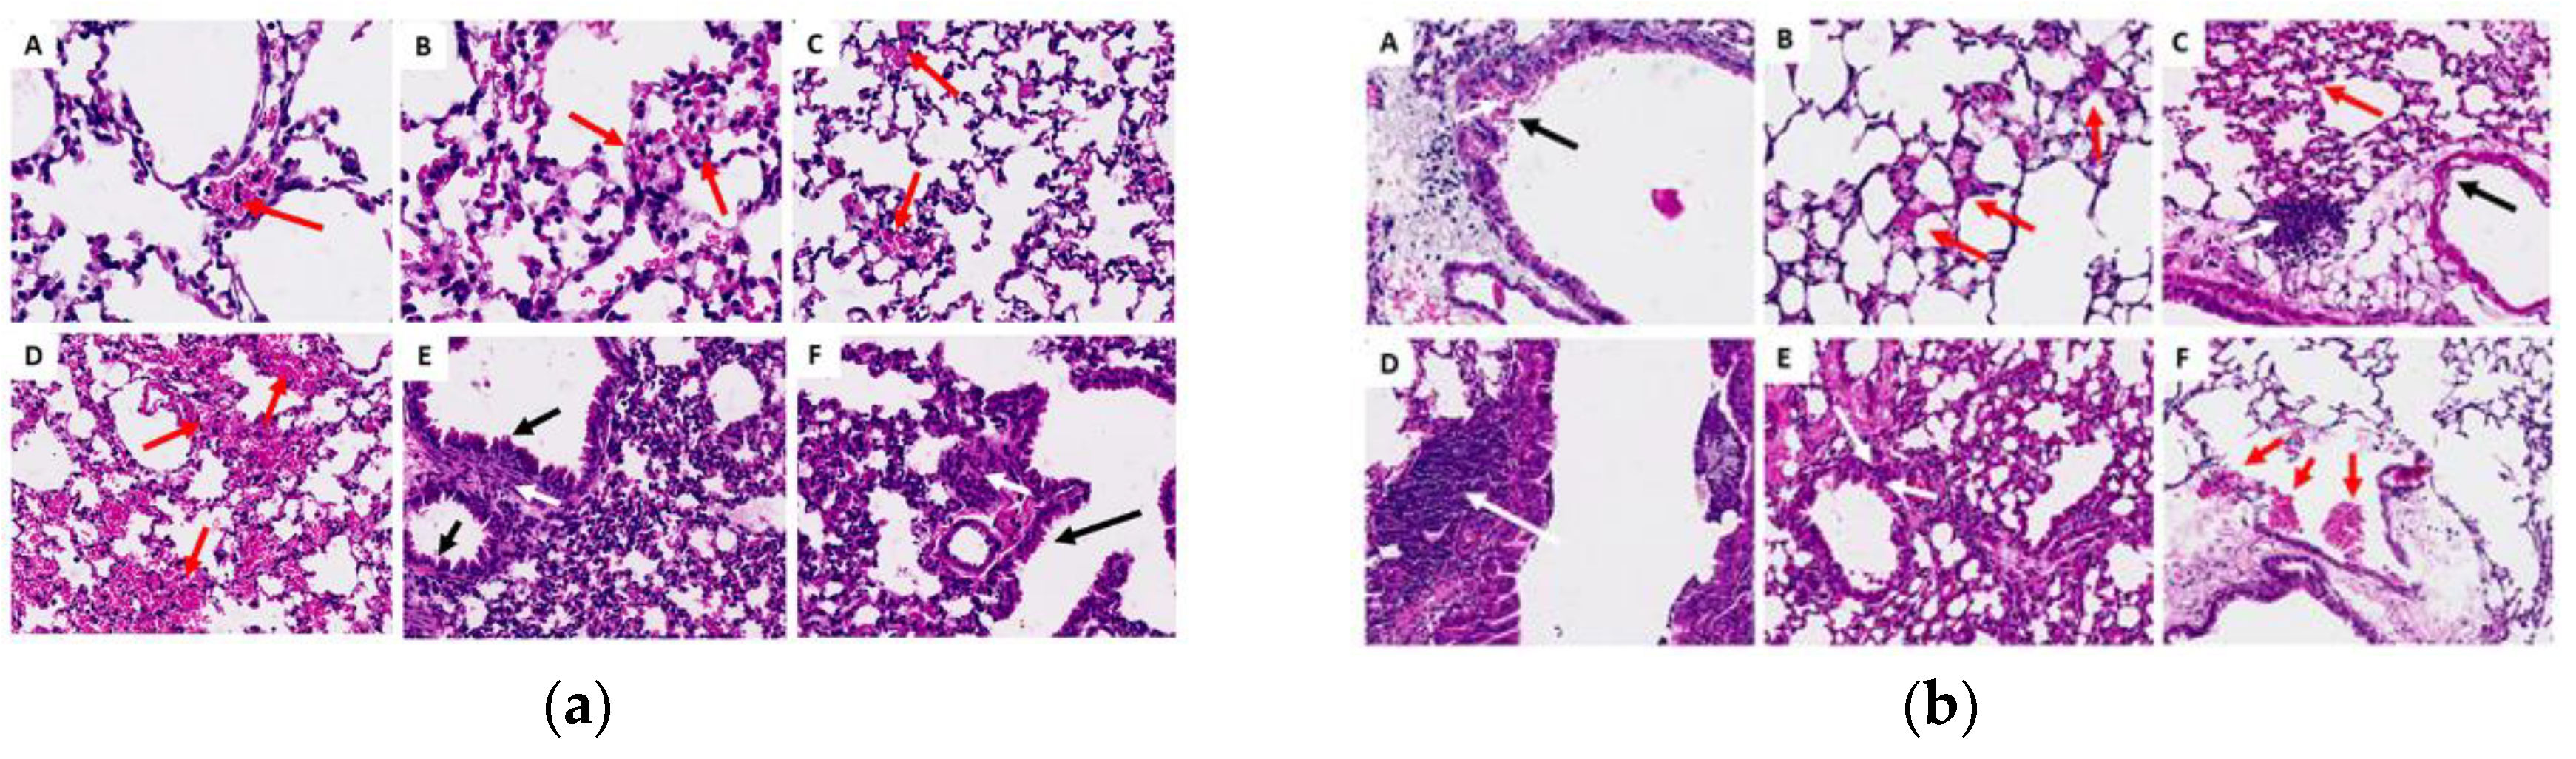
Figure 9.
Histological sections of the liver in the acute (a) and chronic (b) phase. (A) control group G1 (water), (B) control group G2 (oil), (C) group G3 (25 mg/kg), (D) group G4 (50 mg/kg), (E) group G5 (100 mg/kg) and (F) group G6 (200 mg/kg). White arrows indicate areas of lymphoplasmacytic infiltrates, yellow arrows indicate the presence of binucleated hepatocytes (a sign of regeneration), red marks refer to discrete foci of necrosis, and black marks represent areas of granuloma.
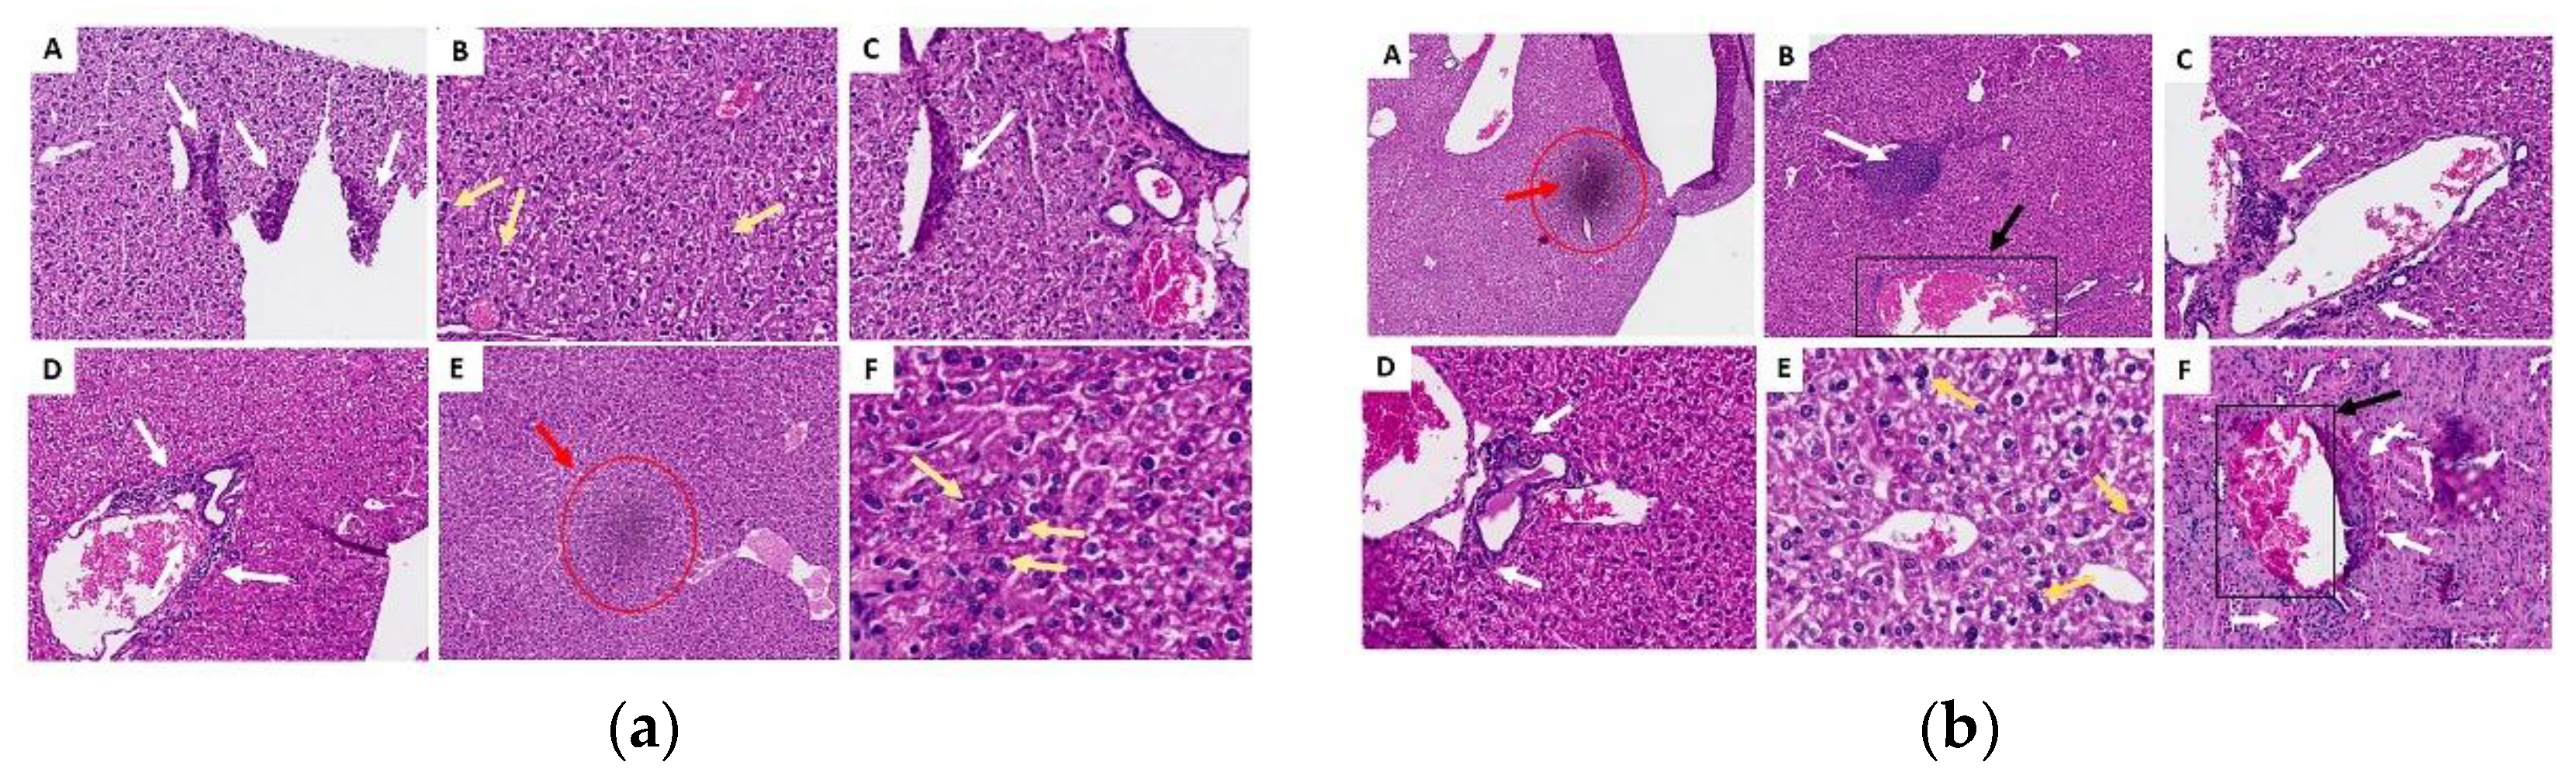
Figure 10.
Experiment design. Female Balb/c mice received oral treatment with 100 μL of different concentrations of the ISO (25, 50, 100 and 2000 mg/mL) every 14 days in an acute (28 days) and chronic (98 days) phase study.
Figure 10.
Experiment design. Female Balb/c mice received oral treatment with 100 μL of different concentrations of the ISO (25, 50, 100 and 2000 mg/mL) every 14 days in an acute (28 days) and chronic (98 days) phase study.
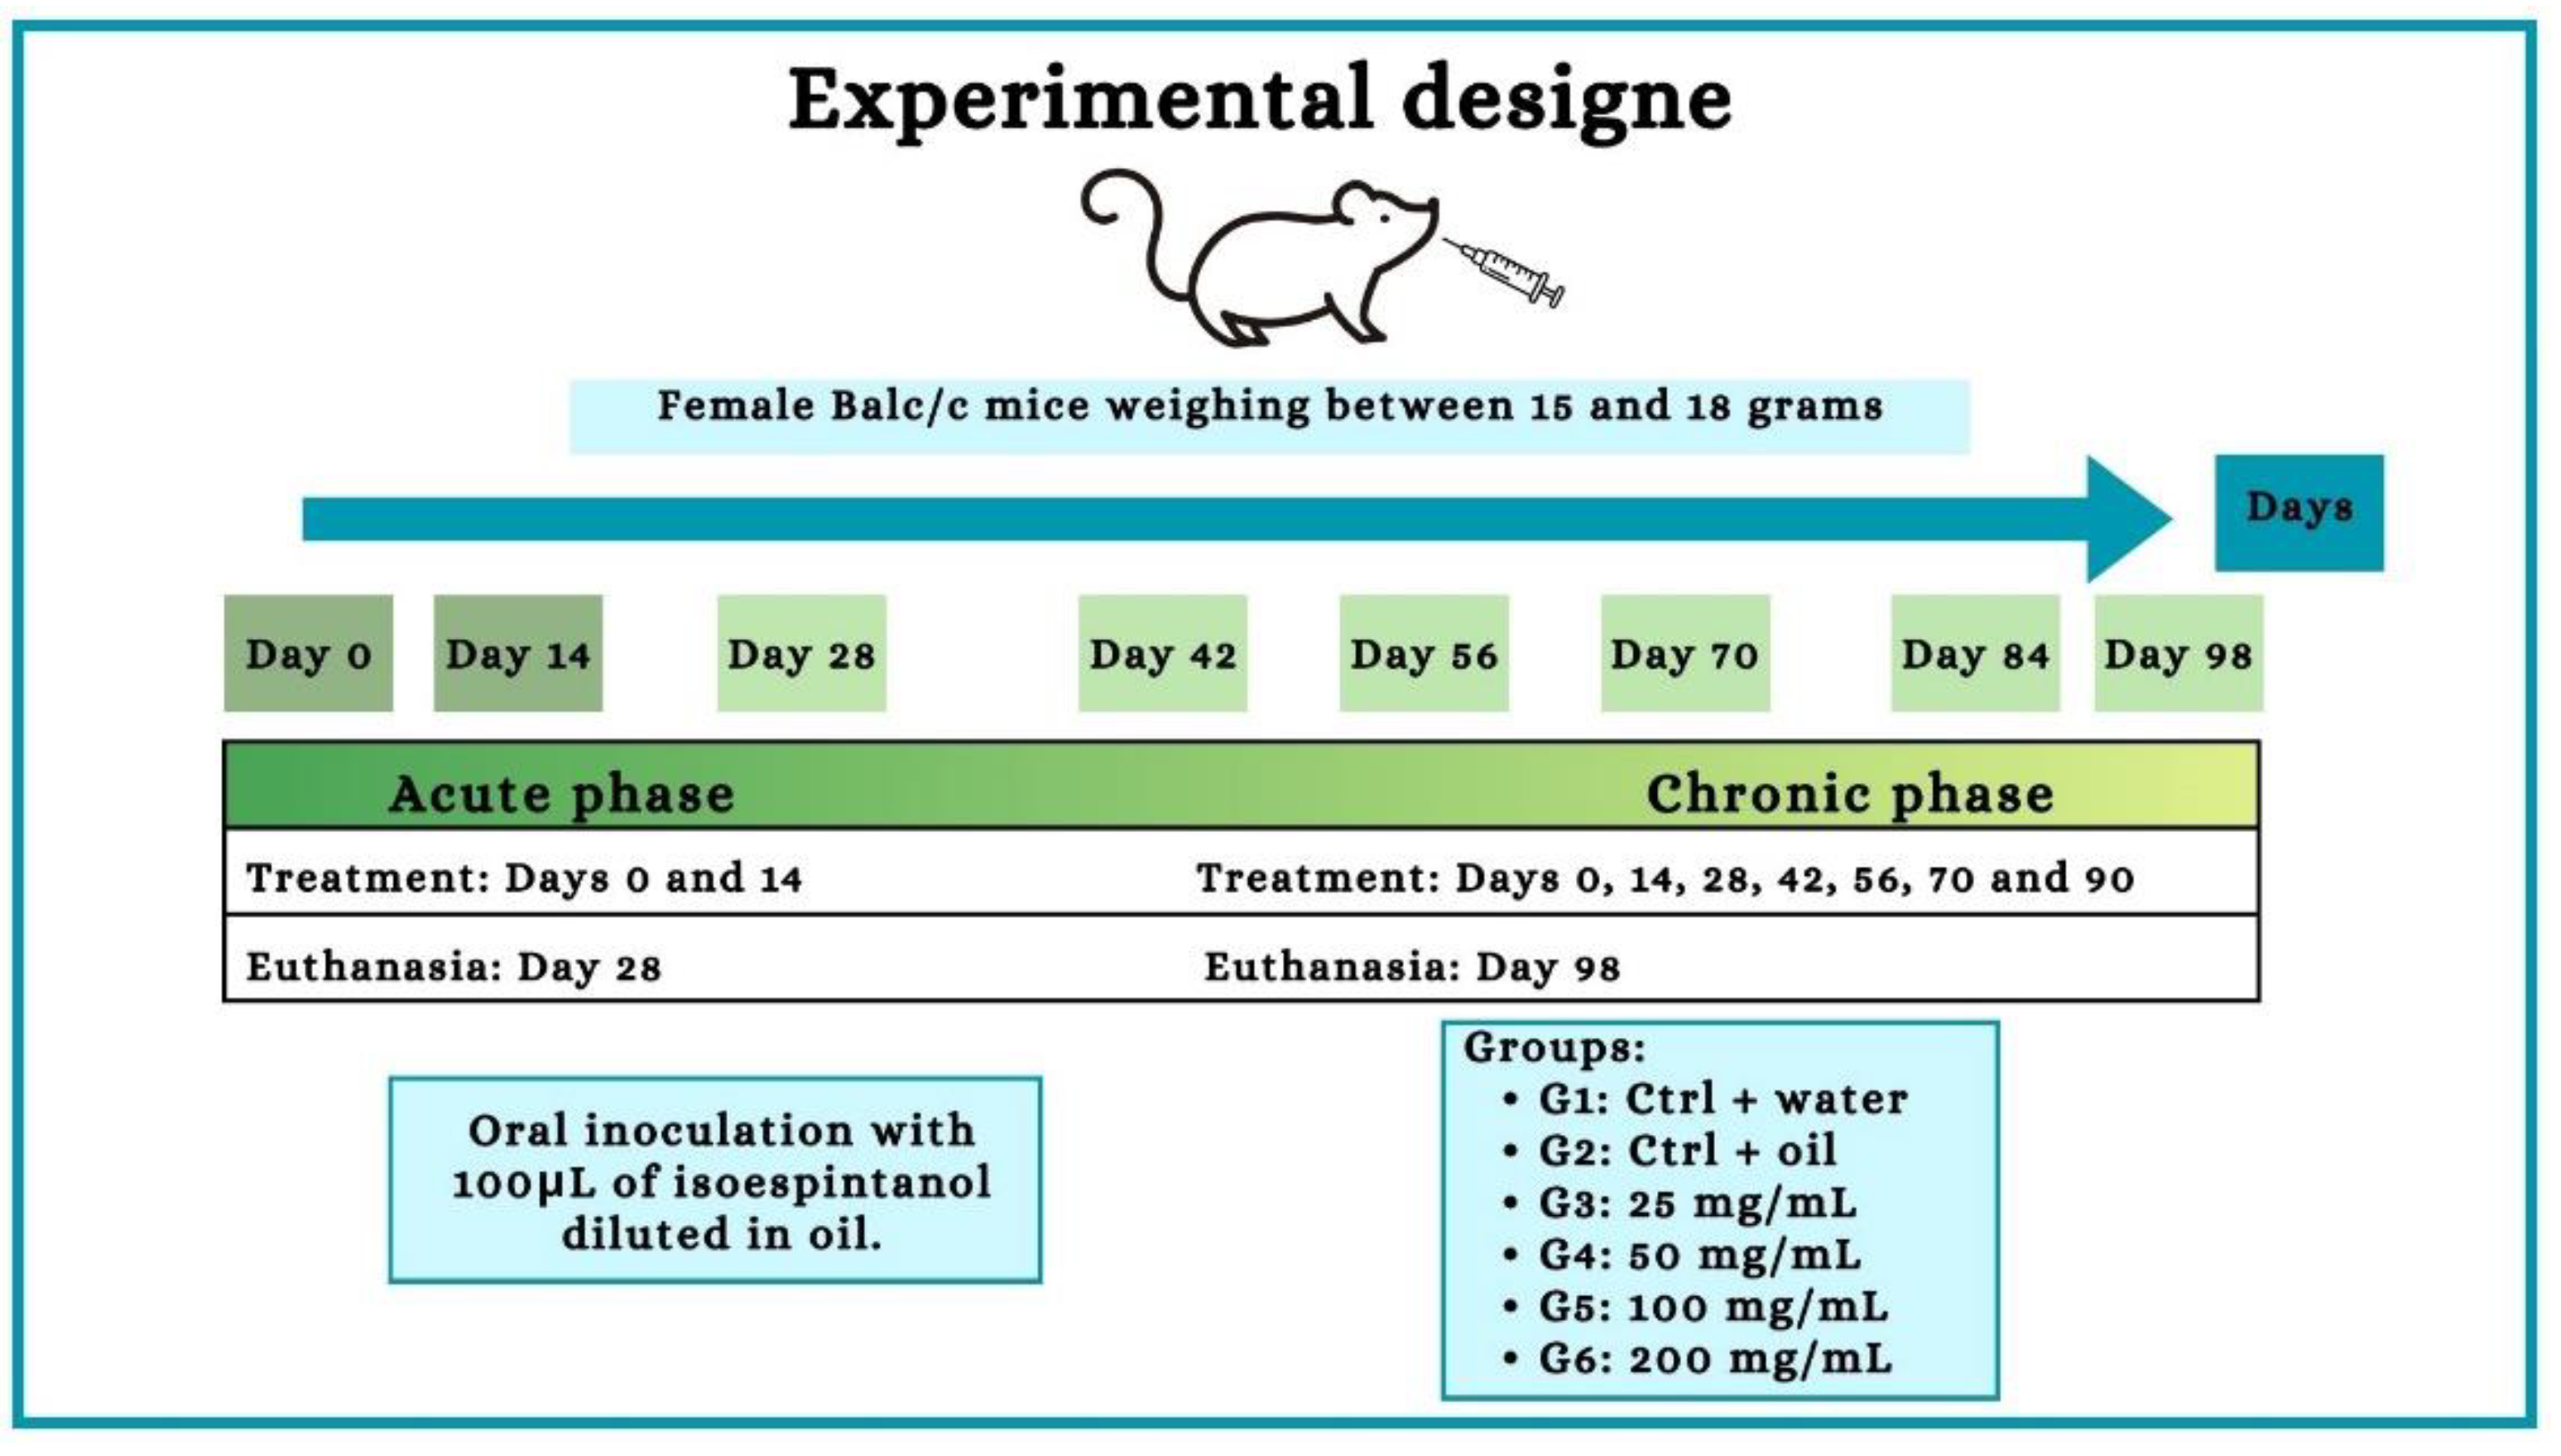

Table 1.
MIC90 values, individually and in combination, of ISO, FLZ, AFB, and CASP against C. tropicalis.
Table 1.
MIC90 values, individually and in combination, of ISO, FLZ, AFB, and CASP against C. tropicalis.
| C. tropicalis | MIC90 SINGLE | MIC90 IN COMBINATION | FIC INDICES | EFFECT | |||||||||
|---|---|---|---|---|---|---|---|---|---|---|---|---|---|
| FLZ | AFB | CASP | ISO | ISO-FLZ | ISO-AFB | ISO-CASP | ISO-FLZ | ISO-AFB | ISO-CASP | ISO-FLZ | ISO-AFB | ISO-CASP | |
| 107 | 75.4 | 2.0 | 0.5 | 362.1 | 45.5-5.8 | 195.3-0.8 | 410.5-0.4 | 0.2 | 0.9 | 2.0 | Sng | Sng | S.I. |
| 98 | 8.0 | 2.1 | 0.5 | 304.1 | 44.8-5.7 | 439.4-1.8 | 339.2-0.3 | 0.9 | 2.3 | 1.8 | Sng | Ant | S.I. |
| 92 | 66.8 | 1.7 | 0.7 | 222.1 | 50.5-6.5 | 165.4-0.7 | 404.1-0.4 | 0.3 | 1.1 | 2.4 | Sng | S.I. | Ant |
| 84 | 358.3 | 2.4 | 0.5 | 416.0 | 394.1-50.5 | 483.3-1.9 | 511.9-0.5 | 1.1 | 2.0 | 2.4 | S.I. | S.I. | Ant |
| 81 | 529.3 | 1.6 | 0.5 | 299.8 | 141.7-18.1 | 237.6-1.0 | 341.9-0.3 | 0.5 | 1.4 | 1.8 | Sng | S.I. | S.I. |
| 74 | 428.5 | 2.5 | 0.5 | 360.1 | 24.0-3.1 | 121.4-0.5 | 175.3-0.2 | 0.1 | 0.5 | 0.9 | Sng | Sng | Sng |
| 03 | 410.0 | 2.0 | 0.6 | 332.7 | 44.1-5.6 | 347.5-1.4 | 316.6-0.3 | 0.1 | 1.7 | 1.5 | Sng | S.I. | S.I. |
| Ant: antagonism; Sng: synergism; S.I.: no interaction. | |||||||||||||
Table 2.
Weight of the animals in the acute phase. Days of ISO inoculation vs average weight in grams of the animal group.
Table 2.
Weight of the animals in the acute phase. Days of ISO inoculation vs average weight in grams of the animal group.
| Days/Groups | G1 | G2 | G3 | G4 | G5 | G6 |
|---|---|---|---|---|---|---|
| 0 | 20.88 | 20.48 | 22.36 | 20.5 | 20.8 | 21.36 |
| 14 | 22.12 | 22.09 | 22.42 | 21.34 | 22.12 | 21.33 |
Table 3.
Weight of animals in the chronic phase. Days of ISO inoculation vs average weight in grams of the animal group.
Table 3.
Weight of animals in the chronic phase. Days of ISO inoculation vs average weight in grams of the animal group.
| Days/Groups | G1 | G2 | G3 | G4 | G5 | G6 |
|---|---|---|---|---|---|---|
| 0 | 21.39 | 20.6 | 21.16 | 19.94 | 21.45 | 22.85 |
| 14 | 21.99 | 21.66 | 22.79 | 21.05 | 23.18 | 23.66 |
| 28 | 22.72 | 22.45 | 23.58 | 21.52 | 24.31 | 24.08 |
| 42 | 22.51 | 22.91 | 23.51 | 21.81 | 24.66 | 23.77 |
| 56 | 23.21 | 23.19 | 24.70 | 21.99 | 25.10 | 24.37 |
| 70 | 24.13 | 23.47 | 24.87 | 21.79 | 25.35 | 24.83 |
| 84 | 24.09 | 21.76 | 25.17 | 22.67 | 25.71 | 25.11 |
Table 4.
Exposure of animals to ISO, carried out in the acute phase after inoculation for 14 days and in the chronic phase for 90 days.
Table 4.
Exposure of animals to ISO, carried out in the acute phase after inoculation for 14 days and in the chronic phase for 90 days.
| Experimental group | Route of administration | Exposure | Volume/animal |
|---|---|---|---|
| G1: CTRL + water | Oral | Wáter | 100 µL |
| G2: CTRL + oil | Oral | Oil | 100 µL |
| G3:25 mg/mL | Oral | ISO 25mg/mL | 100 µL |
| G4: 50 mg/mL | Oral | ISO 50 mg/ml | 100 µL |
| G5: 100 mg/mL | Oral | ISO 100 mg/ml | 100 µL |
| G6: 200 mg/mL | Oral | ISO 200 mg/ml | 100 µL |
Disclaimer/Publisher’s Note: The statements, opinions and data contained in all publications are solely those of the individual author(s) and contributor(s) and not of MDPI and/or the editor(s). MDPI and/or the editor(s) disclaim responsibility for any injury to people or property resulting from any ideas, methods, instructions or products referred to in the content. |
© 2024 by the authors. Licensee MDPI, Basel, Switzerland. This article is an open access article distributed under the terms and conditions of the Creative Commons Attribution (CC BY) license (http://creativecommons.org/licenses/by/4.0/).
Copyright: This open access article is published under a Creative Commons CC BY 4.0 license, which permit the free download, distribution, and reuse, provided that the author and preprint are cited in any reuse.


