Submitted:
20 August 2024
Posted:
21 August 2024
You are already at the latest version
Abstract
Theoretical mathematics is a key evolution factor of Artificial Intelligence (AI). Nowadays, representing a Smart system as a mathematical model helps to analyze any system with under development and support different case studies found in the real life. Additionally, the Markov chain has shown itself to be an invaluable tool for decision-making systems, natural language processing, and predictive modelling. In an Internet of Things (IoT), Machine-to-Machine (M2M) traffic necessitates new traffic models due to its unique pattern and different goals. In this context, we have two types of modeling: 1) Source Traffic modeling used to design stochastic processes such that they match the behavior of physical quantities of measured data traffic (e.g., video, data, voice). 2) Aggregated Traffic modeling which refers to the process of combining multiple small packets into a single packet in order to reduce the header overhead in the network. In real world, the heavy challenge is striking a balance between the model accuracy and dealing with a massive number of M2M devices. On the one hand, due to their reliability, Source traffic models have a competitive advantage over Aggregated traffic models. On the other hand, their complexity is expected to make managing the exponential growth of M2M devices difficult. In this paper, we propose a Markov Modulated Poisson Processes (MMPP) framework to study M2M heterogeneous traffic effects as well as Human-to-Human (H2H) traffic using MMPP. To characterize the H2H and M2M coexistence, we use Markov chains as a stochastic process tool. Once using the traditional evolved Node B (eNodeB), our simulation results show that the network's service completion rate will suffer significantly. In the worst-case scenario, when an accumulative storm of M2M requests attempts to access the network simultaneously, the degradation reaches 8% as a completion task rate. However, using our "Coexistence of Heterogeneous traffic Analyzer and Network Architecture for Long term evolution" (CHANAL) solution, we can achieve a service completion rate of 96%.
Keywords:
IoT
; MMPP
; Markov Chains
; Aggregated traffic models
1. Introduction
Beyond theoretical mathematics, Markov chains find extensive use in a variety of applied fields, including finance, physics, meteorology, chemistry, statistics, etc. Markov chains can be used to analyze states transition simply, rapidly, and accurately. Markov chains can therefore be used in statistics to mimic complex distributions and to forecast the likelihood of future events. Markov chains can be also used to forecast some upcoming natural disasters in the real world, such as earthquakes, tsunamis, and even the spread of disease. The amount of property damage and human casualties these disasters produce might be significantly decreased if they are effectively forecast. Additionally, there will be a significant rise in the simplicity of using the Markov chain due to the transfer matrix's calculation method being highly appropriate for artificial intelligence's computing features [1].
Within the field of Artificial Intelligence (AI), a Markov chain can be a crucial probabilistic method utilized to comprehend and forecast sequential data. Its capacity to represent and analyze dynamic systems makes it relevant and essential for a wide range of AI applications and algorithms. AI techniques incorporate Markov chains to reflect the intrinsically probabilistic aspect of real-world occurrences, like Natural Language Processing (NLP) and Reinforcement Learning (RL). Indeed, Markov chains are utilized in NLP for speech recognition and text generation. For example, a Markov chain can be used to simulate the prediction of the next word in a sentence, where each state is a word and transitions are the likelihood of one word coming after another [2]. Meanwhile, the environment in RL is frequently represented as a Markov Decision Process (MDP), a kind of Markov chain that consists of decisions and rewards. By forecasting future conditions and rewards, agents acquire decision-making skills [3].
In any future telecommunication network, Machine-to-Machine (M2M) and Human-to-Human (H2H) communications are considered to be game-changing elements [4]. Even though M2M and H2H communications can coexist in different domains (such as industrial automation, medical treatment, electrical power networks, and civil transportation), M2M communications is anticipated to play a vital role as a proxy to limit numerous human interventions through the use of Long Term Evolution-Advanced (LTE-A) intelligent systems. Keeping in mind that M2M features need to satisfy evolving technological demands such as LTE-A developments in order to accommodate the variations in H2H and M2M traffic features. Because H2H and M2M patterns are incompatible, coexisting H2H and M2M traffics might present a number of difficulties for a shared network, decreasing its efficacy. M2M traffic is highly homogeneous in comparison to H2H traffic since it uses small data chunks and transfer rates, typically with predictable communication periods and durations [5]. However, accumulative traffic from various sources is expected to be received due to M2M synchronization behavior and a variety of applications with varying pay-loads, times, and data rates. This turns homogeneous M2M traffic into heterogeneous M2M traffic, which quickly saturates the network bandwidth. Saturation is an issue that inevitably affects traffic, services, and applications in both M2M and H2H contexts [6]. Recently, the complexity of processing algorithms in cellular systems (smart sensors, mobile phones, basic stations, satellite systems, etc.) has pushed the boundaries of existing technologies to the limit [7]. According to Heavy Reading [8], mobile operators pay $20 billion annually to overcome service degradation and network breakdown. Therefore, the efficient radio communication strategy is one of the biggest issues that faces researchers, mobile operators, and the 3rd Generation Partnership Project (3GPP) community [9]. In this context, the main performance of homogeneous M2M traffic and H2H traffic is characterized mathematically in our previous work [10]. We used a mathematical model called "Coexistence Analyzer and Network Architecture for Long term evolution" (CANAL) to characterize the key performance of homogeneous M2M traffic as well as H2H traffic. In this context, could CANAL scale to analyze heterogeneous M2M traffic? To answer this question, we consider the traffic modelling in the following section.
2. Traffic Modelling
Stochastic processes that mimic the behavior of the measured data traffic for physical quantities can be used to characterize traffic modelling [11]. There are two types of traffic models: aggregated traffic models (such as high-speed links, backbone networks, and the internet) and source traffic models like voice, video, and data traffic. Packets that replicate real traffic behavior at different sizes and intervals are generated by source traffic simulations, such as SimuLTE simulator [12], Optimised Network Engineering Tool (OPNET) [13], Objective Modular NeTwork (OMNeT) [14], etc. Several common sources of traffic models, including as two-state MMPP, ON/OFF, and Interrupted Poisson Process (IPP) models, are analyzed in [15] using the OPNET modeler. An example of an ON-OFF model is an MMPP or IPP (Interrupted Poisson Process). The Poisson process is modulated by a Markov chain that contains two states: ON and OFF. These states correspond to two values of the Poisson process's intensity; this model is called the ON-OFF model since the intensity is frequently 0 in the off state. We addressed M2M traffic demand in catastrophic scenarios in [16]. Using a source traffic simulator, like SimuLTE, all scenarios are tested to see how well an evolved Node B (eNodeB) can handle a fixed number of H2H traffics while a rising number of M2M requests try to reach an LTE-A network at the same time. The article in [17] states that during a disaster, it is estimated that there would be more than 5*104 devices per cell that may send their payloads simultaneously. We understand that in these situations, source traffic models become very heavy to execute, which makes the usage of aggregated traffic modelling necessary. Finding a fair approximation of the arrival process of several devices while maintaining a good balance between accuracy and simulation performance is the aim of aggregated traffic models for example Simulink simulator [18,19]. For instance, in [10], we looked at how H2H and M2M traffic interact in crowded areas and during emergencies. Based on the suggested design in [20], we also perform a number of simulations in which a single LTE-A network with average arrival rates (λ1; λ2) and service rates (µ1; µ2) for M2M and H2H traffics is assumed. The simulation findings showed that a prioritized LTE-A system could handle more M2M and H2H traffic demands in less time. According to the simulation results, a prioritized LTE-A system for both M2M and H2H traffics may manage more requests in dense area scenarios by lowering the completion rate of lower priority traffic and preserving higher priority traffic without degradation. In contrast, during an emergency, higher priority traffics are prioritized over lower priority traffics, leading to a higher completion rate and the total elimination of low priority traffic. Because it allows H2H and M2M traffics to continue operating simultaneously and uninterrupted, the non-priority traffic approach offers an advantage over other options under these circumstances.
As stated in [21], 3GPP offers two models: Model 1 represents non-synchronized M2M communication, whereas Model 2 represents synchronized M2M traffic, as shown in Figure 1.
In Figure 1, two different traffic models are assumed to evaluate network performance under different access intensities in this diagram:
1. Model 1 of the 3GPP can be thought of as a regular scenario in which M2M devices access the network in a consistent manner over a period of time (i.e., a non-synchronized way).
2. Model 2 of the 3GPP can be viewed as a disaster scenario in which a large number of M2M devices connect to the network in a highly synchronized fashion (e.g., after a power outage).
In [20], the authors propose the Coupled Markov Modulated Poisson Processes (CMMPP) framework, which combines the benefits of both modeling paradigms (Source traffic modelling and Aggregated traffic modeling). It demonstrates the viability of M2M source traffic modeling with only linearly increasing complexity. CMMPP improves the accuracy and flexibility of aggregated M2M traffic models at the cost of moderate computational complexity, as proposed by the aforementioned 3GPP model in [21].
To summarize, an important question meriting a detailed response from all previous works is whether it is feasible to model the traffic of a vast number of autonomous machines using source traffic modeling, which is, in general, more precise than aggregated traffic modeling (e.g., treating the accumulated data from all M2M devices as a single stream).
Practically, we are not in need to know about the actions of a single system to evaluate multiple access and tremendous capability. Thus, the overall behavior of M2M traffic is matched by the aggregated traffic models represented by a simple Poisson process. Because M2M traffic exhibits synchronization behavior, it is anticipated that the average arrival rate (λ) would change with time [22,23]. Aggregated traffic models, such as heterogeneous with time-varying arrival rate [18], are currently a hot topic that should be studied and compared with homogeneous traffic with a constant average arrival rate (λ), as explained in the following section.
3. M2M Heterogeneous Model
To recall, in our previous paper [24], we focused on a constant average arrival rate (λ) in which we strongly assume to have either one H2H arrival or one M2M arrival in the smallest discrete time-period. However, in reality, M2M devices may send their payloads in a synchronization manner. The synchronization behavior of M2M devices leads to different M2M storms that form an accumulative traffic over the time-cycle, which requires deeper analysis and more accurate representation of M2M different traffics. Our new contribution is based on a realistic behavior of M2M devices rather than an ideal and theoretical behavior by turning the constant arrival rate (λ) to an average arrival rate, which varies over time. We are encouraged in this manuscript to consider a Poisson process modulated rate λ(m) for M2M traffic modulated with a β distribution over a time-space Δt and determined by Markovian chain state s(m) (m indicates a Markov state index varying from 0 to M, with M being the total number of states), as shown in Figure 2.
In Figure 2, a MMPP model is used as a framework to accurately model M2M traffic sources by analyzing an event when a huge number of M2M devices behave in a synchronized manner [25,26]. For H2H traffic, our MMPP model has a constant average arrival rate λ(h). As for M2M traffic, it has a variable Poisson process modulated rate λ(m); 0 ≤ m ≤ M.
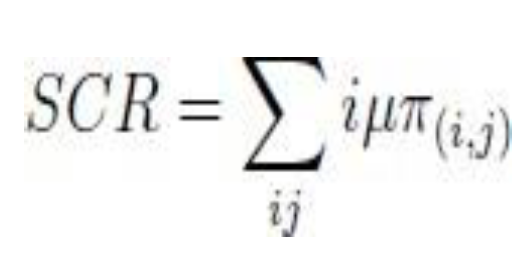
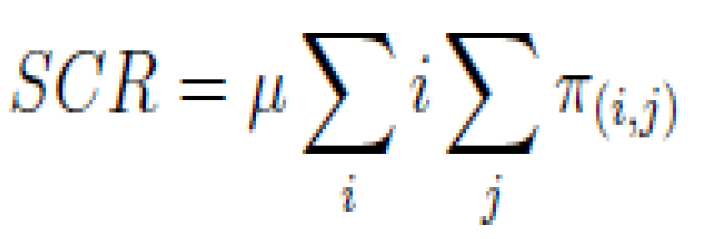
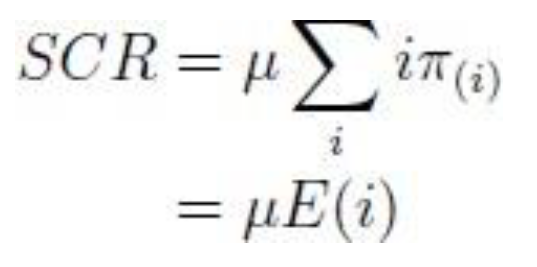
The overall average rate λ(g) of the MMPP is given by:
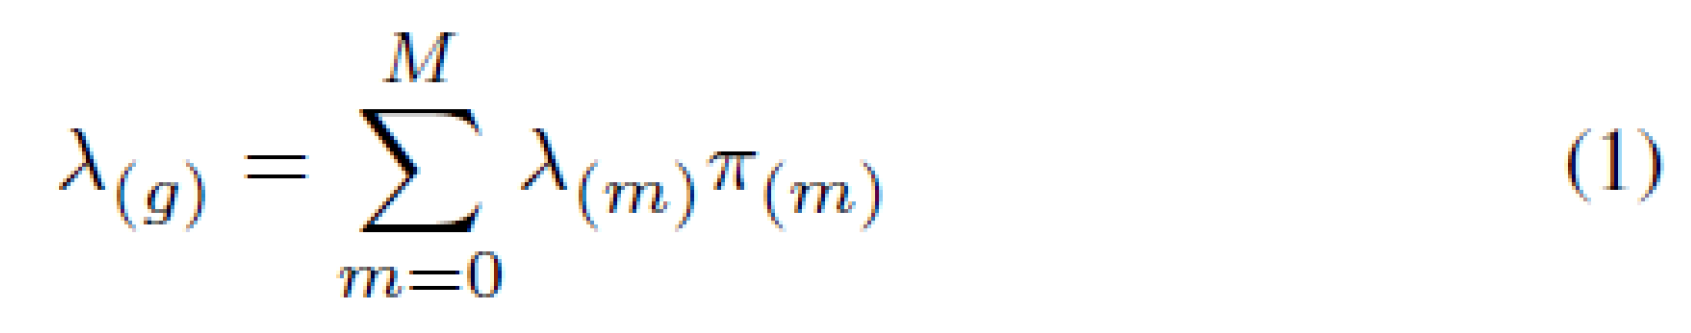
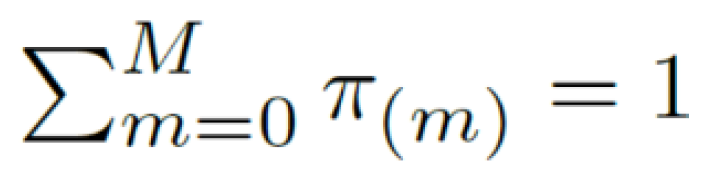
where π(m) is the probability for the system to be in a certain state (m) at a given time space ∆t, with the following constraint:
A basic example of M2M devices modeled by a MMPP model would be a (M+1) states with the first state S(0) representing a "Normal state". The remaining states represent a variable arrival rate over time λ(m) during different "Emergency states" till reaching the "Worst-scenario state" (where m = M).
The process is characterized by a state space and a transition matrix (i.e; a stochastic or probability matrix). Therefore, the probability of transitioning from one state to another depends on the service completion rate for each service.
This principle is depicted in Figure 3, where p(m,m+1) are the transition probabilities between two connected states, let say S(m) to S(m+1).
The system falls into one of the following three cases:
1. Normal state S(0), includes the initial state and has the following equilibrium relationship:
p(0,1)π(0) − p(1,0)π(1)
= 0
2. Emergency states S(m): It occurs when an accumulative storm formed by m groups send their data all together:
All Emergency states S(m) follow the following equilibrium relationship:
p(m−1,m)π(m−1) − [p(m,m−1)
+ p(m,m+1)]π(m) + p(m+1,m)π(m+1)
= 0
where π(m) is the probability to be in the state S(m), and m ∈ [1, 2, 3,…., M−1].
3. Worst-scenario state S(M): it occurs when all groups dispatch their data simultaneously:
S(M) includes the final state, has the following equilibrium relationship:
p(M−1,M )π(M−1) − p(M,M−1)π(M
) = 0
The above three equations can be summarized by the following generic equation:
αp(m−1,m)π(m−1) — [αp(m,m−1)
+ ξp(m,m+1)]π(m) + ξp(m+1,m)π(m+1)
= 0
Where:
- α = 0 in the "Normal state", otherwise α = 1.
- ξ = 0 in the "Worst-scenario state", otherwise ξ = 1.
The state probabilities π(m) resides in the state probability vector Π according to:
While, the transition probabilities can be condensed into a state transition matrix P:
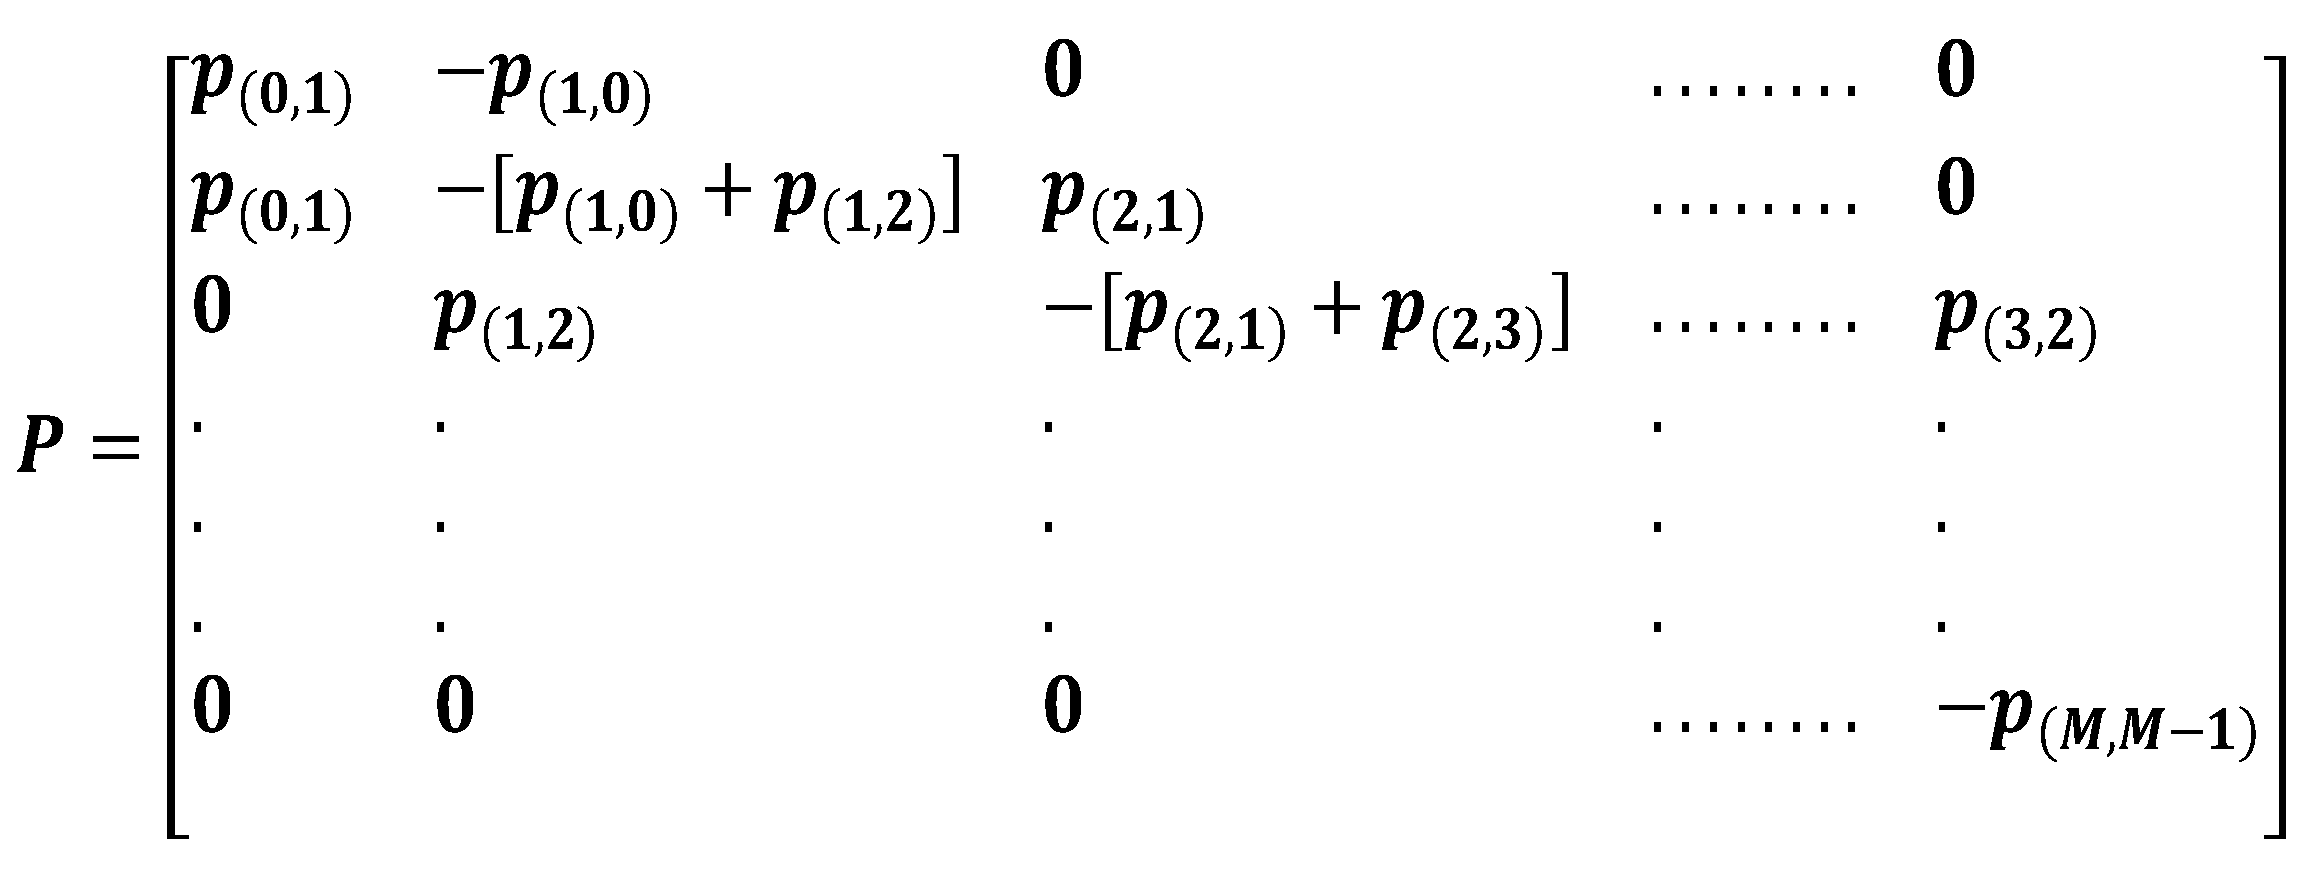
As a result, the equations for the (M+1) states can be represented as a linear system in the following form:
The linear system in (7) should be solved while respecting the following two constraints:
Finally, by solving the above linear system in (7), we can calculate π(0) to π(M).
Also using the equation in (1), we can calculate λ(g).
Emergencies such as natural catastrophes, terrorist attacks and many accidents are not predictable in real life. Based on that, we developed a case study in our previous work [27] based on some use cases such in [28] and 3GPP technical reports [29], because of vague scenarios and lack of statistics and behavior investigations for M2M devices throughout emergency scenarios.
By summarizing our previous case-study, in Table 1, we can extend it to build a heterogeneous M2M case-study represented with three accumulative storms (M=3).
The state transition matrix becomes:
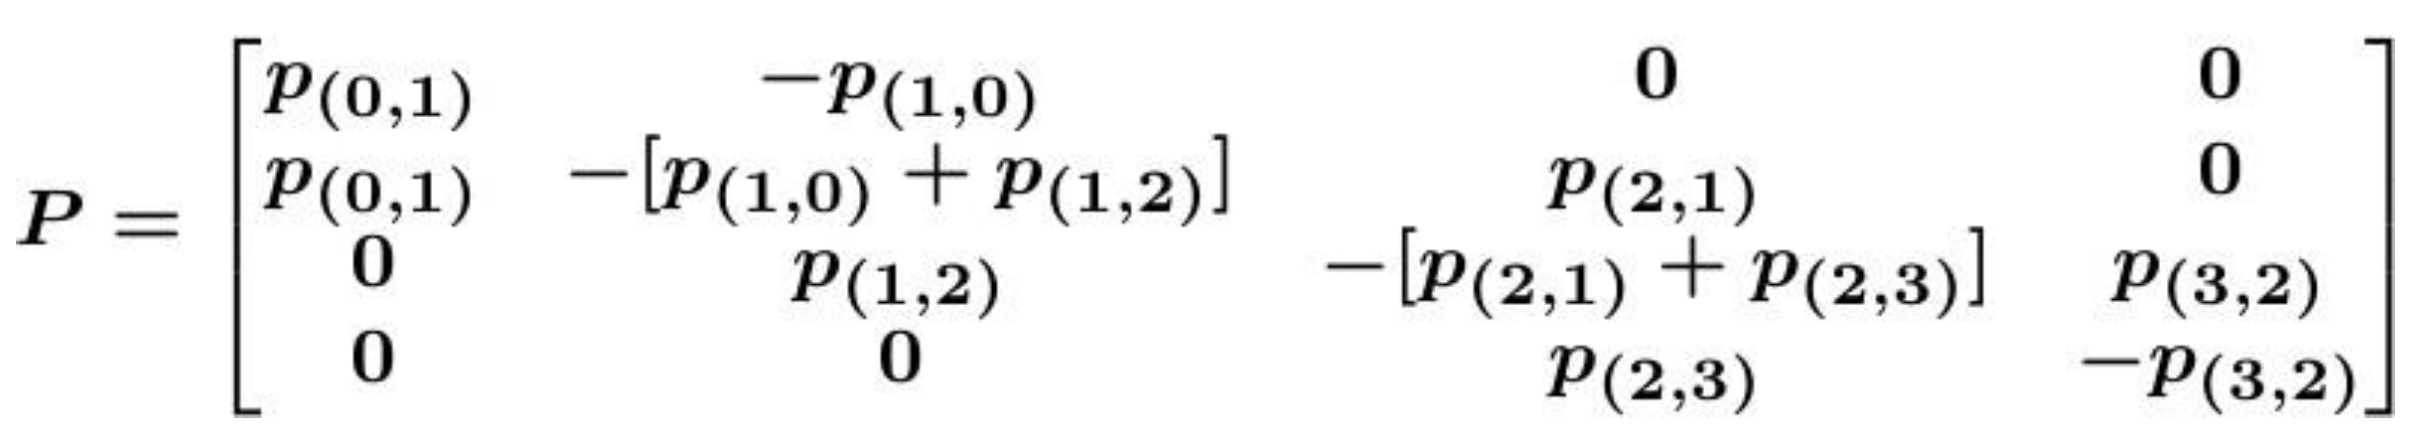
By solving the linear system in (7), we can characterize the behavior of the system mathematically.
Practically, we need to develop a model, which mimics the behavior of the system. Moreover, by comparing both mathematical and empirical results, we can validate our model as a preliminary step to apply some important metrics that measure the impact of M2M heterogeneous traffic on H2H traffic, as explained in the next section.
4. CHANAL Model and Performance Metrics
4.1. CHANAL Model
To recall, in [10] and based on the using case summarized in Table 1, our aim was measuring the mutual impact of M2M homogeneous traffic and H2H traffic in different scenarios while maintaining a sustainable level of services with minimal congestion during emergency events by allowing both M2M and H2H devices to access the network resources efficiently. To reach this goal, we assume that the observation time intervals are so small that at one time interval only one event may occur (either one M2M or one H2H request/completed service). Although this simplification used in our previous CANAL model helps in studying the homogeneous M2M traffic, but it could not be suitable to represent a real case with heterogeneous M2M traffic.
To this end, we extend our work to study the arrival of two requests per time slot. These two requests are attempting to access the network. In case of a system overload, some of the requests will be pushed to the queue and processed following a pre-defined priority.
In this manuscript, we modified our previous model called ”CANAL” [10] with a new version of the architecture known as “CHANAL”, which automatically handles both H2H and M2M traffics while spotting on the homogeneity of M2M traffic. To this end, the model works according to the load-state of M2M requests under different conditions.
CHANAL represents a single uplink cell in an eNodeB with total network resource blocks (c). Traffic types are heterogeneous M2M and H2H traffics. Both traffics are assumed to follow Poisson’s distributions with arrival rates λ(m) and λ(h) respectively [23]. Assuming that μ(m), μ(h) are following exponential distributions for M2M and H2H service rates respectively. Additionally, CHANAL includes a Resource Allocation Control (RAC) used for controlling, managing, and granting access to network requests based on the available resources. The RAC play a critical role in network congestions caused by disastrous events by controlling the resources in an adaptive way to handle the excessive requests of M2M devices, while keeping the H2H requests within the acceptable norms.
In LTE-A standard, an eNodeB bandwidth varies as follows: 1.4, 3, 5, 10, 15 and 20 MHz depending on the operator’s needs. Our CHANAL deducts a bandwidth of 1.4 MHz (6 PRBs) for LTE-M reserved for M2M traffic from the total bandwidth (e.g., 20 MHz) reserved for H2H traffic. It keeps broadening M2M bandwidth while shrinking the H2H bandwidth till soaking up the whole M2M accumulative storms. After the retreat of all M2M storms, it resets M2M and H2H bandwidths to their initial values.
For example, rb(h) is reserved to LTE-A networks for its maximum resource blocks and rb(m) is reserved for LTE-M networks where rb(h) + rb(m) = c. The initial number of resources are normally retained by both rb(h) and rb(m) (e.g., for a bandwidth network LTE-A = 10 MHz: rb(h) = 50 and for a LTE-M network, rb(m) = 6). When a sudden event occurs, the utilization of rb(m) peaks to the maximum. So, the RAC provides additional 6 resources to fulfill the temporary H2H requests. Thus, there are 6 more resources are reserved for M2M: rb(m) = 12 and 6 less resources reserved for H2H, rb(h) = 44 (for LTE-A bandwidth = 10 MHz). More resources will be lent repeatedly until all storms are absorbed or the sudden event recedes.
In addition, CHANAL includes a Queuing Control Unit (QCU) composed of two separate queues, one reserved for H2H and the other for M2M (H2H-Q, M2M-Q) with queue sizes n and o respectively.
The system is considered in the "Full State" when the number of reserved resource blocks for a LTE-A network peaks to rb(h) and/or in a LTE-M network peaks to rb(m). As a result, the queuing process is initiated when the system reaches its cut-off point (the Full State) and a new M2M/H2H device request contends to access the system. In the case of any priority conflict among H2H and M2M traffic requests, the system follows the QCU strategy explained previously in [10].
To better understand how CHANAL works, a flowchart is presented in Figure 4.
The differences and innovations among both CANAL and CHANAL models are shown in Table 2:
4.2. Performance Metrics
We use two performance metrics to measure the mutual impact between H2H and M2M traffics:
4.1.1. Service Completion Rate (scr)
It gives the number of completed requests per time interval and it is based on the service rate and the average arrival requests for certain traffic (e.g., scr(h) and scr(m) which represent the service completion rate for H2H or M2M traffics [30]).
4.1.2. H2H/M2M Resource Utilization (ru(h)/ru(m))
This metric gives the probability of the system to be busy serving H2H/M2M arrivals in terms of the number of utilized rb(h)/rb(m) in each state, compared to the total number of resource blocks used in the network (c).
5. Modeling and Results Discussion
5.1. Modeling
In this section, we present our enhanced model that could generate both M2M and H2H traffics while adding priorities and queuing for both traffics. Assuming that our LTE-A network in which utilizes the FIFO (First In First Out) queue in MATLAB, consists of total number of resources (c =100). M2M requests are served by an LTE-M network with six resources (rb(m) = 6). While H2H requests will be handled by the remaining 94 resources (rb(h) = 94).
To investigate the mutual consequences of H2H and M2M in normal and/or emergency scenarios, we use the theory of queuing to produce exact theoretical results for some performance measures that facilitate a comparison of empirical outcomes with corresponding theoretical outcomes.
We applied many improvements on the model presented in section 4.1 in order to match our CHANAL architecture such as:
- The architecture consists of two servers with two traffic sources (H2H and M2M), where arrivals are determined by Poisson processes with the two parameters λ(h) and λ(m) respectively. Service times have an exponential distribution with rate parameter μ, where 1 is the mean service time.
- Assuming that H2H traffic has a fixed average arrival rate λ(h), with a service rate μ(h) = 1.
- We assume also that M2M heterogeneous traffic has five different variable average arrival rates: λ(m) ∈ {5, 10, 15, 20, 25} with a service rate μ(m) = 1.
- H2H traffic has the same priority as M2M traffic.
- A FIFO queue type is used we consider queue sizes: n = o = 0 for the two traffics H2H and M2M respectively.
- Modulation duration=1000 Seconds.
All notations and parameters used in the simulations are summarized in Table 3:
5.2. Generating the Equilibrium Equations
We generate the equilibrium equations, by considering new arrival events with an average arrival rate λ and service completion rate μ. The system could be in one of the following four states: empty state, occupied state, full state, and queue state.
5.3. Performance
To validate our model, we use the following performance metric:
Service Completion Rate (SCR): it shows the number of completed requests per time interval based on the service rate μ and the number of ongoing requests for a certain traffic (e.g., SCRHP and SCRLP represent the Service Completion Rate for HP/LP traffics).
Because we consider the service completion rate (μ) as constant in our model can be written as follows:
As the sum of conjoint probability leads to the marginal probability, the previous equations can be re-written as follows:
5.4. Performance
In this section, we present our developed model, which can generate H2H and M2M traffics with full flexibility to add priority for any traffic in order to study the mutual impact of H2H traffic on M2M traffics. In addition, we assume that each state is represented by constants S(i, j) as shown in Table 4:
Initially, we consider only a regular eNodeB with the five aforementioned groups and different
variable average arrival rates.
5.4.1. Normal Cycle Scenario
In normal operation, a uniform average arrival rate is expected (scr(m) = scr(h) = 100%) as a result of having only 6 resources to serve 15 instantaneous requests. Figure 5 confirms that all H2H and M2M traffics are all served.
5.4.2. Dense Area Scenario
In this scenario, we consider only a regular eNodeB with the five aforementioned groups and different variable average arrival rates. Meanwhile, a constant average arrival rate for H2H traffic.
In Figure 6, the results show that all H2H traffics are served, and 81% of M2M traffics are served because of having only 6 resources to serve 15 instantaneous requests:
- scr(m) = 81%
- scr(h) = 100%
5.4.3. Worst-Case Scenario
During a worst-case scenario, we assume to receive double H2H traffic with a constant average arrival rate λ(h) = 50 as a result of a disastrous event. Meanwhile, the five groups are gradually synchronized.
In Figure 7, the results show that almost all H2H traffics are fully served with a 96% rate, and 52% of M2M traffics are served:
- scr(m) = 52%
- scr(h) = 96%
6. Simulations and Result Discussions
6.1. Simulator
Our built simulation model is presented in this section. It can produce both H2H and M2M traffics and can add queuing or priority for any type of traffic, whether it be H2H or M2M.
Assume that the total number of resources in our LTE-A network is (c = 100). To fulfil M2M requests, the LTE-M network uses six resources out of all the resources (rb(m) = 6). Consequently, H2H traffic will be handled by the remaining 94 resources (rb(h) = 94).
We conduct multiple simulations based on the architecture proposed in [18] to study the mutual impact of H2H and M2M traffics in normal or emergency scenarios. The architecture uses queuing theory to provide precise theoretical results for some performance measures, which makes it easier to compare empirical results with the corresponding theoretical results. The model undergoes numerous improvements to align with our CHANAL architecture, which is detailed in section (4). These improvements include:
- The architecture consists of two servers with two traffic sources (H2H and M2M), where arrivals are determined by Poisson processes with the two parameters λ(h) and λ(m) respectively.
- Service times have an exponential distribution with rate parameter µ, where 1/µ is the mean service time.
- Assuming that H2H traffic has a fixed average arrival rate λ(h), with a service rate µ(h) = 1.
- We assume also that M2M heterogeneous traffic has five different variable average arrival rates: λ(m) = {5; 10; 15; 20; 25} with a service rate µ(m) = 1.
- H2H and M2M traffics have the same priority.
- A FIFO queue type is used while considering queue sizes n = o = 0 for the two traffics H2H and M2M respectively.
- Simulation duration = 1000 Seconds
6.2. Regular eNodeB Scenarios, Results and Discussions
6.2.1. Normal Cycle Scenario
Initially, we consider only a regular eNodeB with the five aforementioned groups and different variable average arrival rates.
The uniform arrival rate during normal cases is considered as:
Meanwhile, a constant average arrival rate for H2H traffic is considered λ(h) = 25, as shown in Figure 8.
In the results shown in Figure 8, we realize the following:
- In normal operation, a uniform average arrival rate is expected with λ (0) = 15 with a 40% completion rate (scr(m) = 40%) and ru(m) = 100% as a result of having only 6 resources to serve 15 instantaneous requests.
- When receiving a single storm from a synchronized group (Group(1) to Group(5)), a huge degradation in the service completion rate is spotted when moving from λ (1) = 5 with a 100% completion rate till reaching λ (5) = 25 with a 24% completion rate only. These results are obvious as the network has only a fixed number of resources rb(m) = 6 reserved for M2M traffic while having an increasing demand on M2M services: scr(m) = {100%; 60%; 40%; 30%; 24%}.
Additionally, the system utilization peaks to its cut-off point with a ru(m) = 100% due to the high load of arrivals comparing to the available resources in the system except for Group (1).
Since the network allocates the majority of its resources to H2H traffic (rb(h) = 94), there are no restrictions on H2H traffic. Knowing that the average requests per time-interval is 25 (λ(h) = 25) with scr(h) = 100% and ru(h) = 26.5%.
6.2.2. Disaster Scenario
During a disaster, we assume to receive double H2H traffic with constant average arrival rate λ(h) = 50 as a result of a disastrous event. Meanwhile, the five groups are gradually synchronized:
- First "Emergency" storm: when Group(1) submits its data as a result of a sudden event:
- Second "Emergency" storm: when Group(1) and Group(2) dispatch their payloads simultaneously:
- Third "Emergency" storm: when Group(1), Group(2) and Group(3) send their data at the same time:
- Forth "Emergency" storm: when Group(1), Group(2) , Group(3) and Group(4) send their payloads all together:
- "Worst-case" storm: it occurs when the five storms dispatch their data simultaneously:
In the resuts shown in Figure 9, we realize that:
- A huge degradation in the service completion rate can be spotted when receiving the five synchronized groups gradually while moving from Emergency(1) storm (λ(E1) = 5) with a 100% completion rate till reaching Emergency(5) storm (λ(W) = 75) with a 8% completion rate only.
These results are obvious as the network has only a fixed number of resources rb(m) = 6 reserved for M2M traffic while having an increasing demand for M2M services (scr(m) = {100%, 40%, 20%, 12%, 8%}). Additionally, system utilization peaks to its cut-off point with a ru(m) = 100% due to the high load of arrivals compared to the available resources in the system except for Group(1) as mentioned previously.
- H2H traffic doesn’t suffer from any limitation because the network reserves the major amount of resources to H2H traffic rb(h) = 94 while receiving only an average of 50 requests per time-interval (λ(h) = 50) with scr(h) = 100% and ru(h) = 53%
6.3. CHANAL Scenarios, Results and Discussions
As a solution for the service completion rate degradation shown in Figure 8 and Figure 9, we will test our proposed solution "CHANAL", which operates in different modes depending on M2M traffic intensity to tackle the limitation problem of the network.
6.3.1. Normal Scenario
To test the adaptability of our CHANAL during normal scenarios, we consider the same different storms of λ(m) ∈ {5,10,15,20,25} and with a constant H2H average arrival rate λ(h) = 25 while enabling the flexibility of the bandwidth untill it absorbs all previous storms. The results shown in Table 5 reveal that by adapting the number of resources from (rb(m) = 6) used usually in a regular LTE-M network, to (rb(m) = 30) promoted in CHANAL, we can eliminate all M2M storms with a completion rate of 100% (scr(m) = 100%). Meanwhile, H2H traffic doesn’t reveal any degradation with a constant (scr(h) = 100%) due to having enough resources reserved for H2H traffic.
6.3.2. Disaster Scenario
During emergency cases, we are expecting to receive similar previous storms but gradually λ(m) ∈ {5,15,30,50,75} and we assume receiving a double constant H2H average arrival rate λ(h) = 50 while enabling the flexibility of the bandwidth till it absorbs all previous storms. The results shown in Table 6 reveal that by adapting the number of resources from (rb(m) = 6) used usually in a regular LTE-M network, to (rb(m) = 72) promoted in CHANAL, we can eliminate all M2M storms with a completion rate of 96%-100%. Meanwhile, H2H traffic doesn’t reveal any degradation from E1-E4 with a constant (scr(h) = 100%) due to having enough resources reserved for H2H traffic.
Only one drawback can be spotted for H2H traffic in the "worst-case scenario", when its completion rate recedes till reaching 56% (scr(h) = 56%) because the system fulfills 96% of M2M requests by reserving 72 resource blocks for M2M traffic.
But this flaw might be considered acceptable since the " worst-case scenario " with an accumulative storm happens rarely and when it occurs it lasts for a short period of time. Actually, if a disaster case last for a long period of time many operators usually take the decision to ban some H2H traffic (e.g., Watching a movie online) in order to allow emergency traffics to be exchanged easily. So, in this case our solution could be a good replacement of a total elimination of H2H traffic strategy as it keeps H2H traffic working with a 56% completion rate while supporting 96% of M2M requests. Additionally, M2M payloads are sent in the form of a small chunk of data in a bursty forms. Based on the emergency and traffic priority strategy, H2H traffic (e.g., video streaming, VoIP, etc.) are not urgent as M2M traffic (e.g., Health care, fire alarms, flooding sensors, etc.) which can be sent in a split second compared to the massive H2H traffic size.
7. Conclusion
A shared network may face a number of difficulties due to the presence of H2H and M2M traffic and their mutual affects, which lowers the network's efficacy. The incompatibility patterns between H2H and M2M traffics are one of the main causes. In contrast to H2H traffic, M2M traffic is typically very homogeneous. But because of its synchronisation behaviour, heterogeneous traffic is likely to be received in the form of accumulative traffic. Consequently, one of the main issues facing mobile operators is the rapid saturation of the limited bandwidth for LTE-M networks, particularly in light of the exponential growth of M2M devices and the potential for simultaneous payload transmission from all of these devices in an emergency, which will unavoidably lead to overload congestion issues.
In this manuscript, we have modeled and simulated the heterogeneous M2M traffic along with H2H traffic and its consequences on both traffics. We have used the Markov chain concept to model the system behavior and study the impacts on H2H and M2M traffics. Additionally, we have tested our proposed concept called CHANAL as an extension to the classical CANAL. Our CHANAL keeps broadening the LTE-M bandwidth gradually while shrinking LTE-A bandwidth till soaking-up all M2M heterogeneous storms. Moreover, this solution provides an essential resolution of presumable M2M storms especially during disaster and emergency events.
Our simulation results show that using the classical eNodeB, the network will be facing a huge degradation in the service completion rate for M2M and H2H by reaching 8% in the worst-scenario case (λ(w)=75). But using our CHANAL solution and by leasing a maximum 72 resources reserved for M2M traffic from the total network resources, can result in a completion rate of 96% throughout the worst-case scenario.
In our future work, we tend to study non-3GPP technologies (e.g., LoRa, Sigfox, etc.) and the behavior of M2M traffic which uses different LPWANs during disaster events while maintaining a satisfactory QoS towards both M2M and H2H traffics.
Author Contributions
For research articles with several authors, a short paragraph specifying their individual contributions must be provided. The following statements should be used “Conceptualization, A.H.E.F. and A.M.; methodology, A.H.E.F. and A.M.; software, A.H.E.F. and A.M.; validation, A.H.E.F., A.M. and A.N.; formal analysis, A.H.E.F. and A.M.; investigation, A.H.E.F., A.M. and A.N.; resources, A.H.E.F., A.M. and A.N.; data curation, A.H.E.F. and A.M.; writing—original draft preparation, A.H.E.F. ; writing—review and editing, A.H.E.F., A.M. and A.N.; visualization, A.H.E.F. and A.M.; supervision, A.M.; project administration, A.M.; funding acquisition, A.M. All authors have read and agreed to the published version of the manuscript.”.
Funding
This research received no external funding.
Institutional Review Board Statement
Not applicable.
Informed Consent Statement
Not applicable.
Data Availability Statement
Data are contained within the article.
Conflicts of Interest
The authors declare no conflicts of interest.
References
- Shao, H. Theory of Markov chain and its application in several representative examples. the 2nd International Conference on Mathematical Physics and Computational Simulation, Glasgow, UK, August 2024.
- Almutiri, T.; Farrukh, N. Markov Models Applications in Natural Language Processing: A Survey. International Journal of Information Technology and Computer Science. 2022, 14, 1–16. [Google Scholar] [CrossRef]
- van Otterlo, M. Reinforcement Learning and Markov Decision Processes. Reinforcement Learning Adaptation, Learning, and Optimization, vol 12. Springer, Berlin, Heidelberg. [CrossRef]
- Shi, J.; Liu, C.; Hong, X.; Wang, C.-X. Coexistence of delay-sensitive MTC/HTC traffic in large scale networks. Science China Information Sciences 2017, 60, 100302. [Google Scholar] [CrossRef]
- Elmangoush; Corici, A. A.; Steinke, R.; Corici, M.; Magedanz, T. A Frame- work for Handling Heterogeneous M2M Traffic. Procedia Computer Science 2015, 63, 112–119. [Google Scholar] [CrossRef]
- El Fawal, H.; Mansour, A.; Najem, M. V2V Influence on M2M and H2H Traffics during Emergency Scenarios. in Global Advancements in Connected and Intelligent Mobility, IGI Global, Hershey PA, USA, Ed., 2019, pp. 93–134.
- Mansour, A.; Mesleh, R.; Abaza, M. New challenges in wireless and free space optical communications. Optics and Lasers in Engineering 2017, 89, 95–108. [Google Scholar] [CrossRef]
- Reading, H. 2016), Mobile Network Outages Service Degradations, Survey Analysis. Accessed July 2024. [Online]. Available: ttps://www.spirent.com/newsroom/press-releases/02-22-16_heavy-reading-report-mobile-network-outages.
- Gudkova, I.; Samouylov, K.; Buturlin, I.; Borodakiy, V.; Gerasimenko, M.; Galinina, O.; Andreev, S. Analyzing impacts of coexistence between M2M and H2H communication on 3GPP LTE system. in International Conference on Wired/Wireless Internet Communications, Paris, France, May 2014, pp. 162–174.
- El Fawal, A.H.; Najem, M.; Mansour, A.; Le Roy, F.; Le Jeune, D. CTMC modeling for M2M/H2H coexistence in LTE-A/LTE-M networks. in The Journal of Engineering (JoE) 2018, 2018, 1954–1962. [Google Scholar]
- Adas, A. Traffic models in broadband networks. IEEE Communications Magazine 1997, 35, 82–89. [Google Scholar] [CrossRef]
- SimuLTE Modeler Version (0.9.1). Accessed July 2024. [Online]. Available: https://omnetpp.org/download-items/SimuLTE.html.
- OPNET Modeler. Accessed July 2024. [Online]. Available: https://www.riverbed.com/sg/products/steelcentral/opnet.html.
- The OMNeT++ Community. OMNeT++: Discrete Event Simulation in C++, GitHub. Accessed July 2024. Available online: https://github.com/omnetpp/omnetpp.
- Xinjie, C.; Tan, T.; Subramanian, K. Source traffic modeling in OPNET. In Proceedings of the OPNETWORK, Washington DC., USA, September 1999. [Google Scholar]
- El Fawal, A.H.; Mansour, A.; Le Roy, F.; Le Jeune, D. RACH Overload Congestion Mechanism for M2M Communication in LTE-A: Issues and Approaches. IEEE International Symposium on Networks, Computers and Communications (ISNCC), Marrakech, Morocco, May 2017.
- Wang, Y.P.E.; Lin, X.; Adhikary, A.; Grovlen, A.; Sui, Y.; Blankenship, Y.; Bergman, J.; Razaghi, H.S. A Primer on 3GPP Narrowband Internet of Things. IEEE Communications Magazine, March 2017, 55, 117–123. [Google Scholar] [CrossRef]
- Mathworks, website. , M/M/1 Queuing System. Accessed July 2024. [Online]. Available: https://www.mathworks.com/help/simevents/examples/m-m-1-queuing-system.html.
- Hassan, H.; Garcia, J.; Bockstal, C. Aggregate traffic models for VoIP applications. in IEEE International Conference on Digital Telecommunications (ICDT’06), Côte d’Azur, France, August 2006, pp. 70.
- Laner, M.; Nikaein, N.; Drajic, D.; Svoboda, P.; Popovic, M.; Krco, S. , Traffic models for machine-to-machine M2M communications: types and applications. Book chapter of "Machine-to-machine communications, architecture, performance and applications? Edited by M. Dolher and C. Anton, Woodhead Publishing, 2014. Accessed July 2024. [Online]. Available: https://www.eurecom.fr/publication/4265.
- 3GPP. Study on RAN Improvements for Machine-type communications, Technical report, TR 37.868, 2012. Accessed July 2024. [Online]. Available: https://portal.3gpp.org/desktopmodules/Specifications/SpecificationDetails.aspx?specificationId=2630.
- Heffes, H.; Lucantoni, D. A Markov modulated characterization of packe- tized voice and data traffic and related statistical multiplexer performance. IEEE Journal on selected areas in communications 1986, 4, 856–868. [Google Scholar] [CrossRef]
- Paiva, R.C.; Vieira, R.D.; Saily, M. Random access capacity evaluation with synchronized MTC users over wireless networks. in IEEE 73rd Vehicular Technology Conference (VTC2011-Spring), Budapest, Hungary, May 2011, pp. 1–5.
- El Fawal, A.H.; Mansour, A.; Najem, M.; Le Roy, F.; Le Jeune, D. CTMC modeling for M2M/H2H coexistence in a NB-IoT Adaptive eNodeB. in The 11th IEEE International Conference on Internet of Things (iThings 2018), Halifax, Canada, July 2018.
- Le-Ngoc, T.; Shah-Heydari, S. MMPP Modeling of Aggregatred ATM Traffic. in IEEE Canadian Conference on Electrical and Computer Engineering, Waterloo, Canada, May 1998, pp. 129–132.
- Laner, M.; Svoboda, P.; Nikaein, N.; Rupp, M. Traffic models for machine type communications. In Proceedings of the Tenth International Symposium on Wireless Communication Systems (ISWCS), Ilmenau, Germany, August 2013. [Google Scholar]
- El Fawal, A.H.; Mansour, A.; Najem, M.; Le Roy, F.; Le Jeune, D. Adaptive LTE-M eNodeB for Emergency Scenarios. The 8th International Conference on Information and Communication Technologies Convergence ICTC, Jeju Island, Korea, October 2017.
- Lauridsen, M.; Kovacs, I.Z.; Mogensen, P.; Sorensen, M.; Holst, S. Coverage and Capacity Analysis of LTE-M and NB-IoT in a Rural Area. in 2016 IEEE 84th Vehicular Technology Conference (VTC-Fall), Montreal, Canada, September 2016.
- G. T. 45.820.(2015, November) Cellular System Support for Ultra Low Complexity and Low Throughput Internet of Things, v.13.1.0. Accessed July 2024. [Online]. https://www.etsi.org/deliver/etsi_tr/145000_145099/145050/13.01.00_60/tr_145050v130100p.pdf.
- Alqahtani, S. Performance analysis of cognitive-based radio resource allocation in multi-channel LTE-A networks with M2M/H2H coexistence. IET Communications 2017, 11, 655–663. [Google Scholar] [CrossRef]
Figure 1.
The expected arrival rate over time for synchronized and non-synchronized M2M traffics using 3GPP Model 1 and Model 2.
Figure 1.
The expected arrival rate over time for synchronized and non-synchronized M2M traffics using 3GPP Model 1 and Model 2.
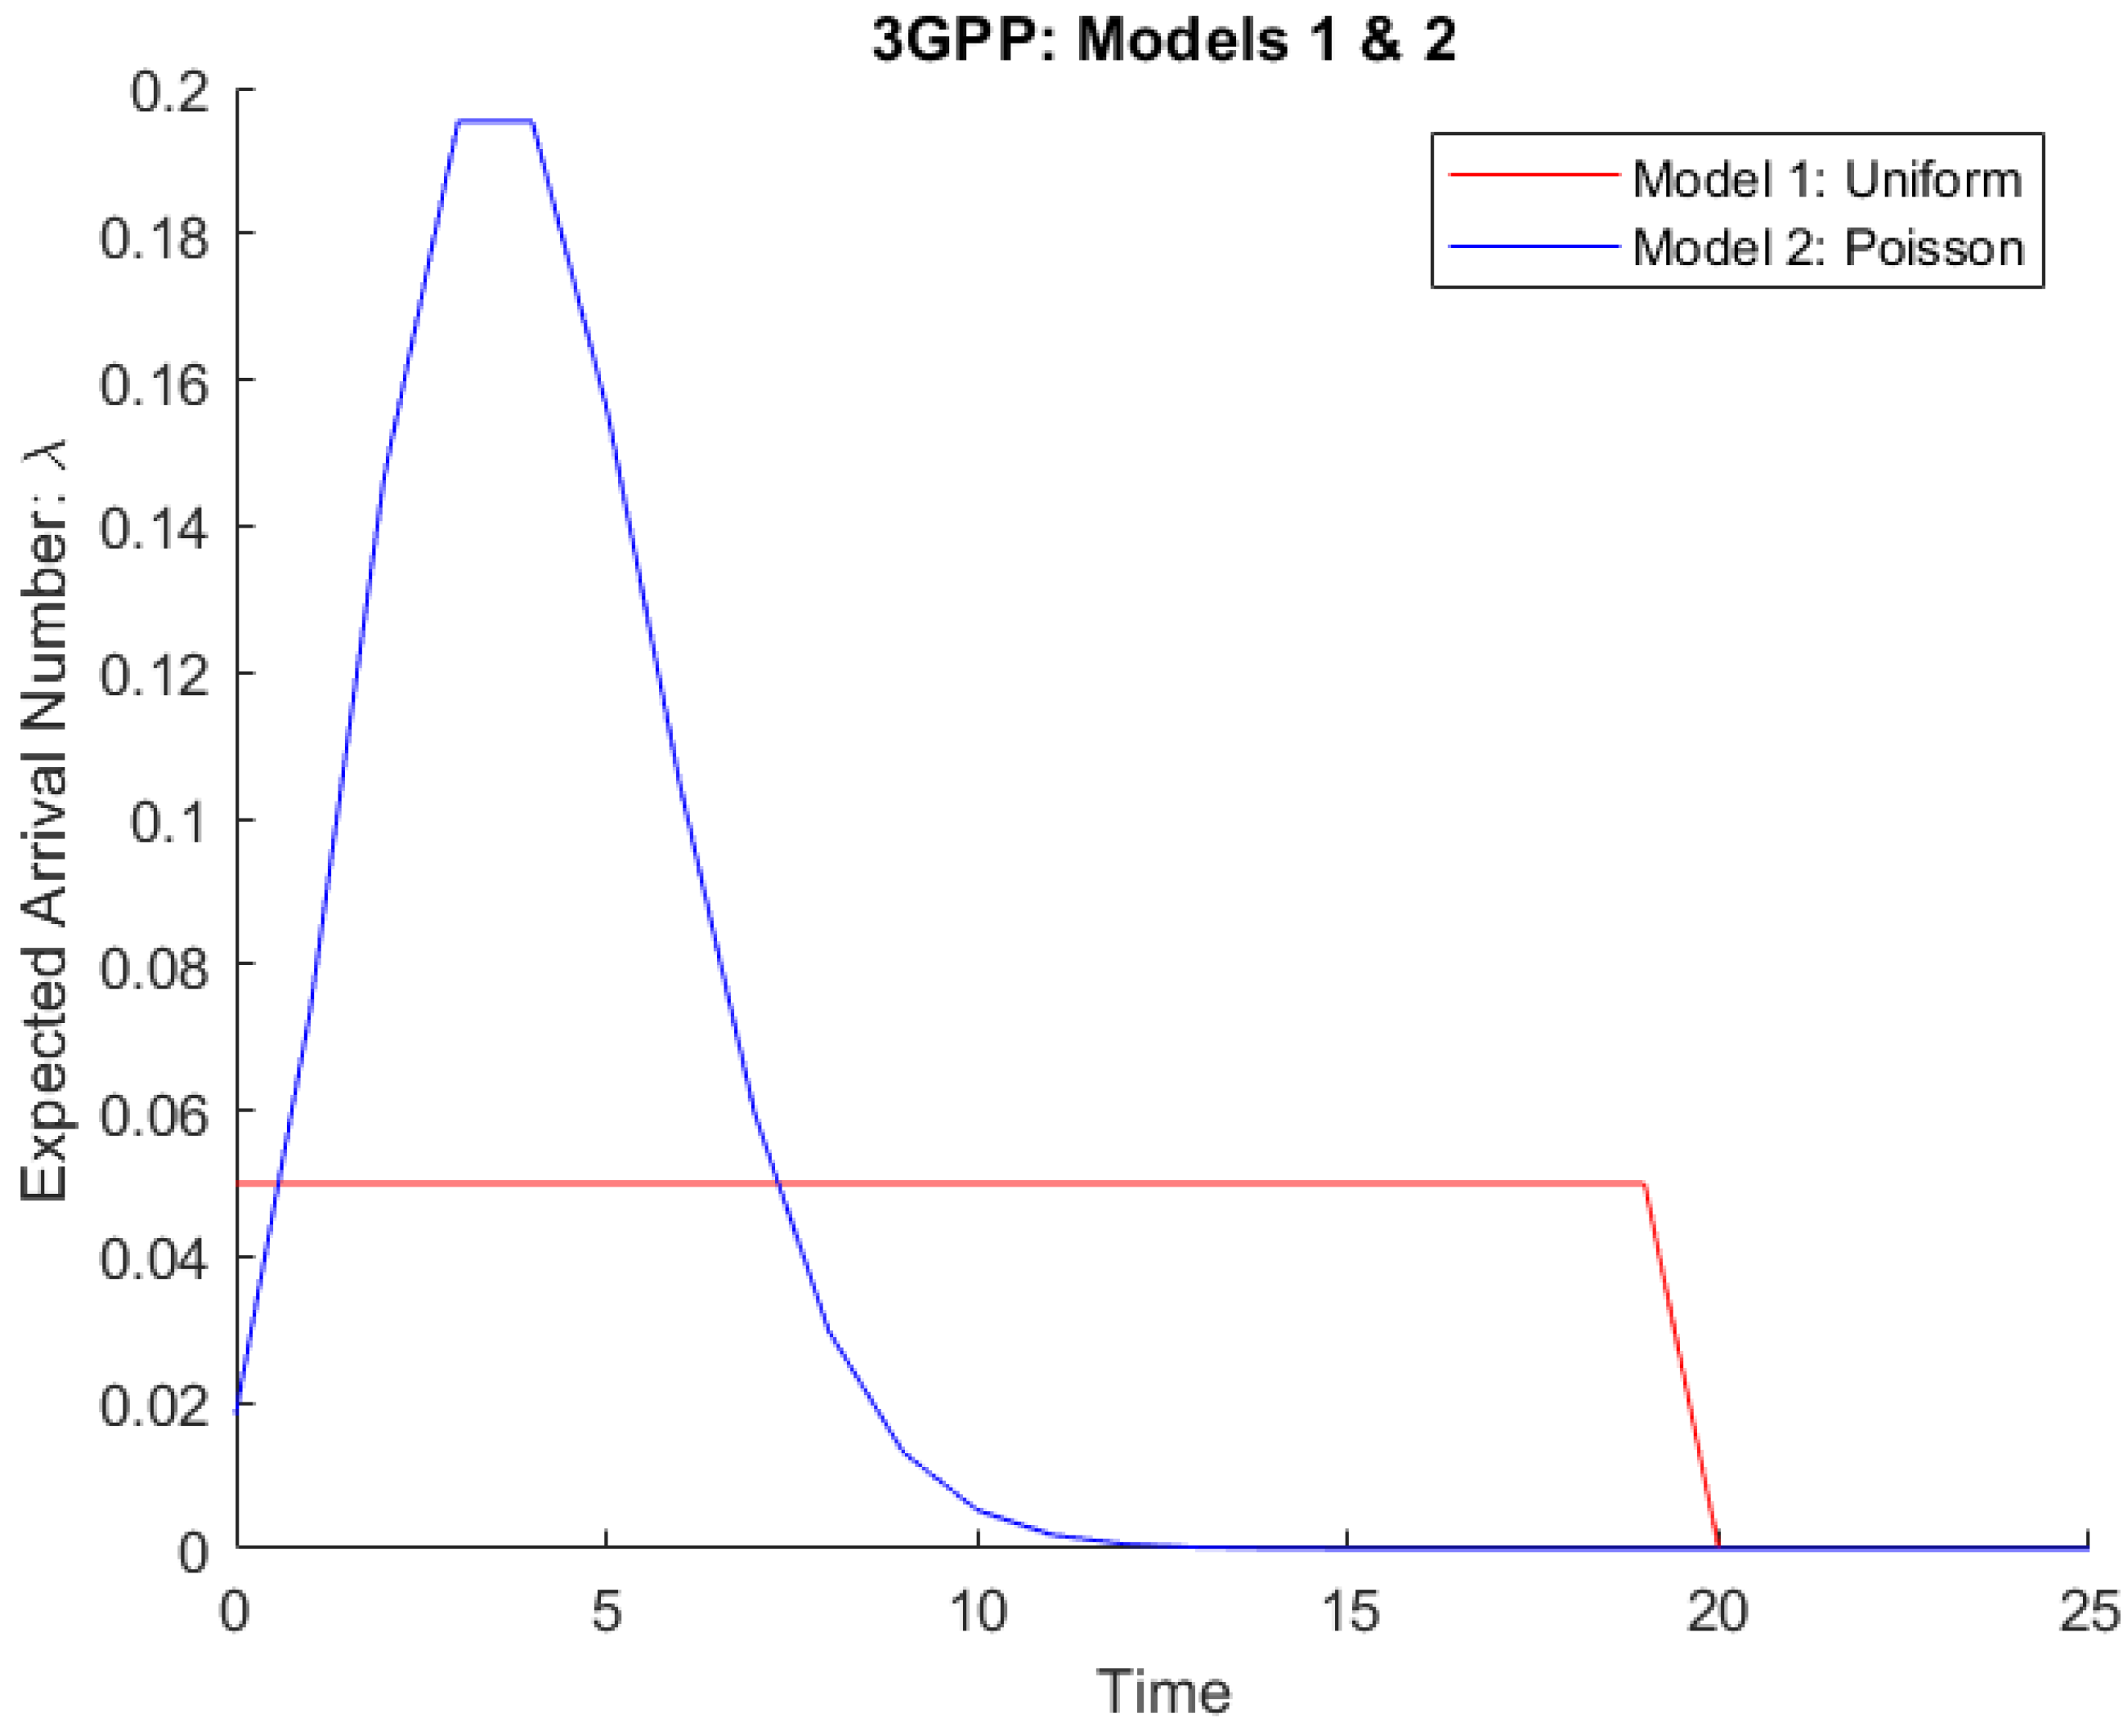
Figure 2.
The interpretation as MMPP for M2M traffic, where λ(m) the mean arrival rate of a Poisson process.
Figure 2.
The interpretation as MMPP for M2M traffic, where λ(m) the mean arrival rate of a Poisson process.
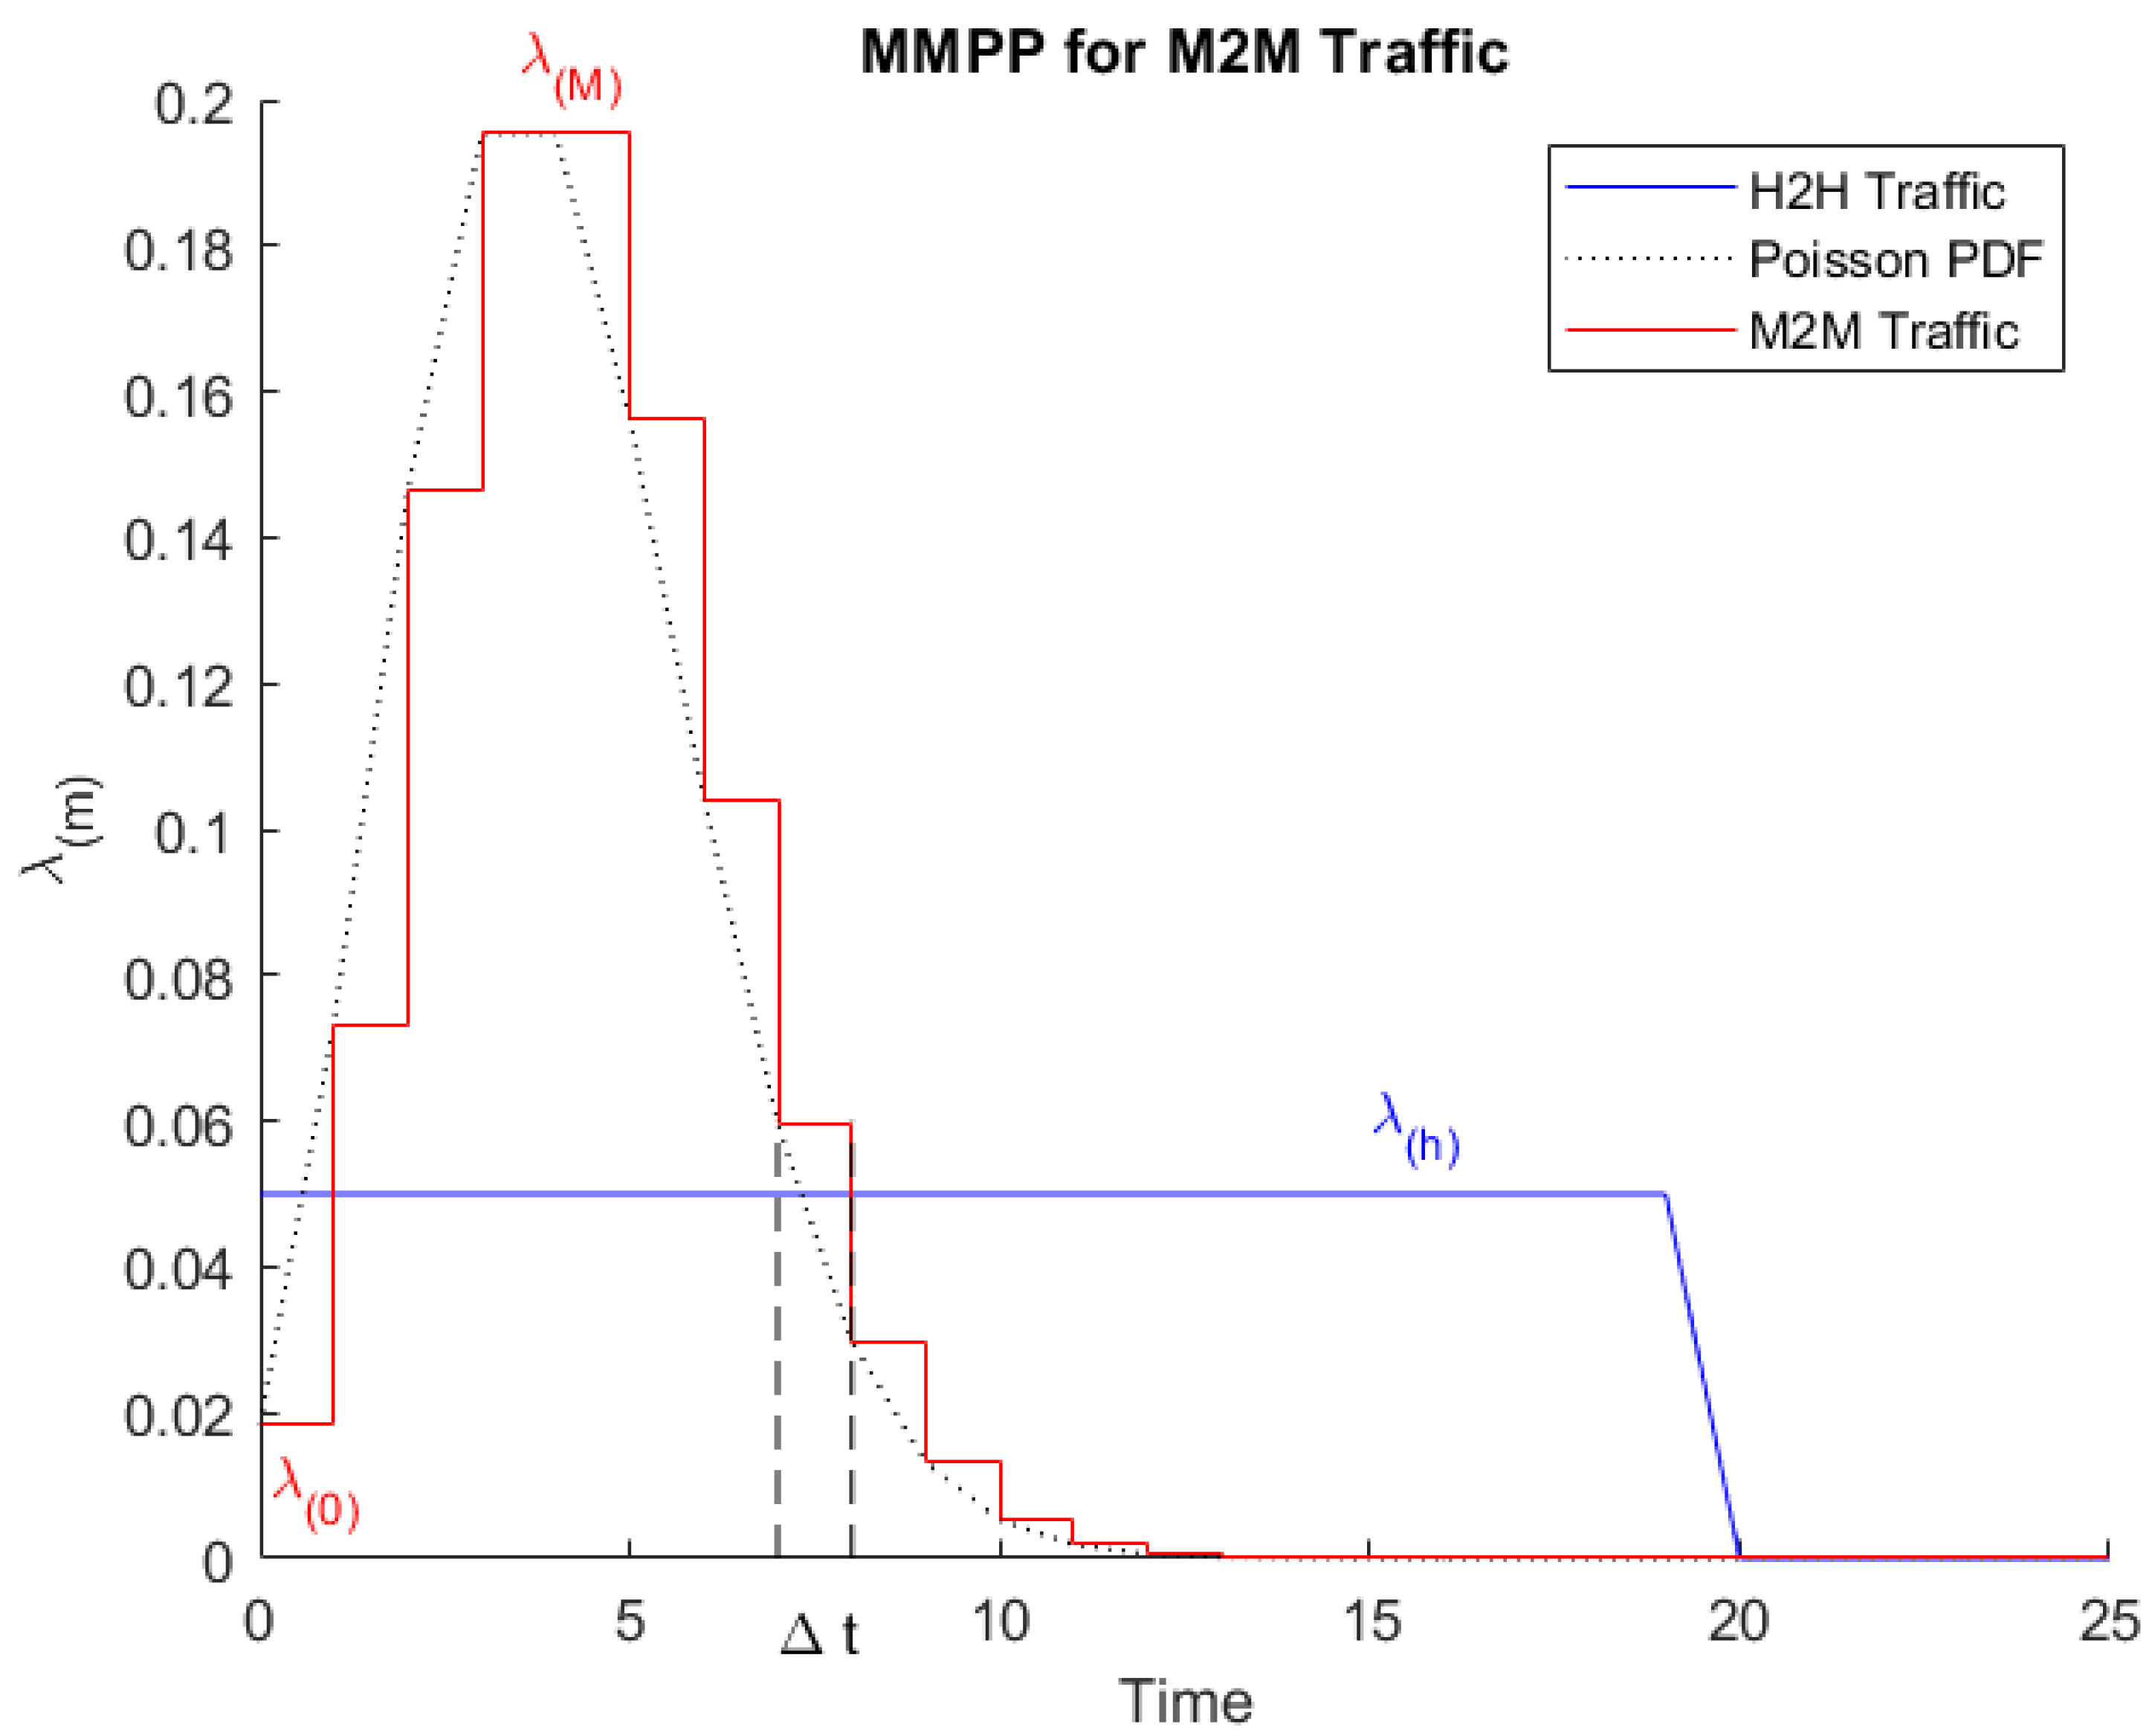
Figure 3.
MMPP model; where: m is the total number of states, p(m,m−1) are the transition probabilities between the states of the chain from S(m) to S(m+1), each Markov chain state S(m) represents a mean arrival rate λ(m).
Figure 3.
MMPP model; where: m is the total number of states, p(m,m−1) are the transition probabilities between the states of the chain from S(m) to S(m+1), each Markov chain state S(m) represents a mean arrival rate λ(m).
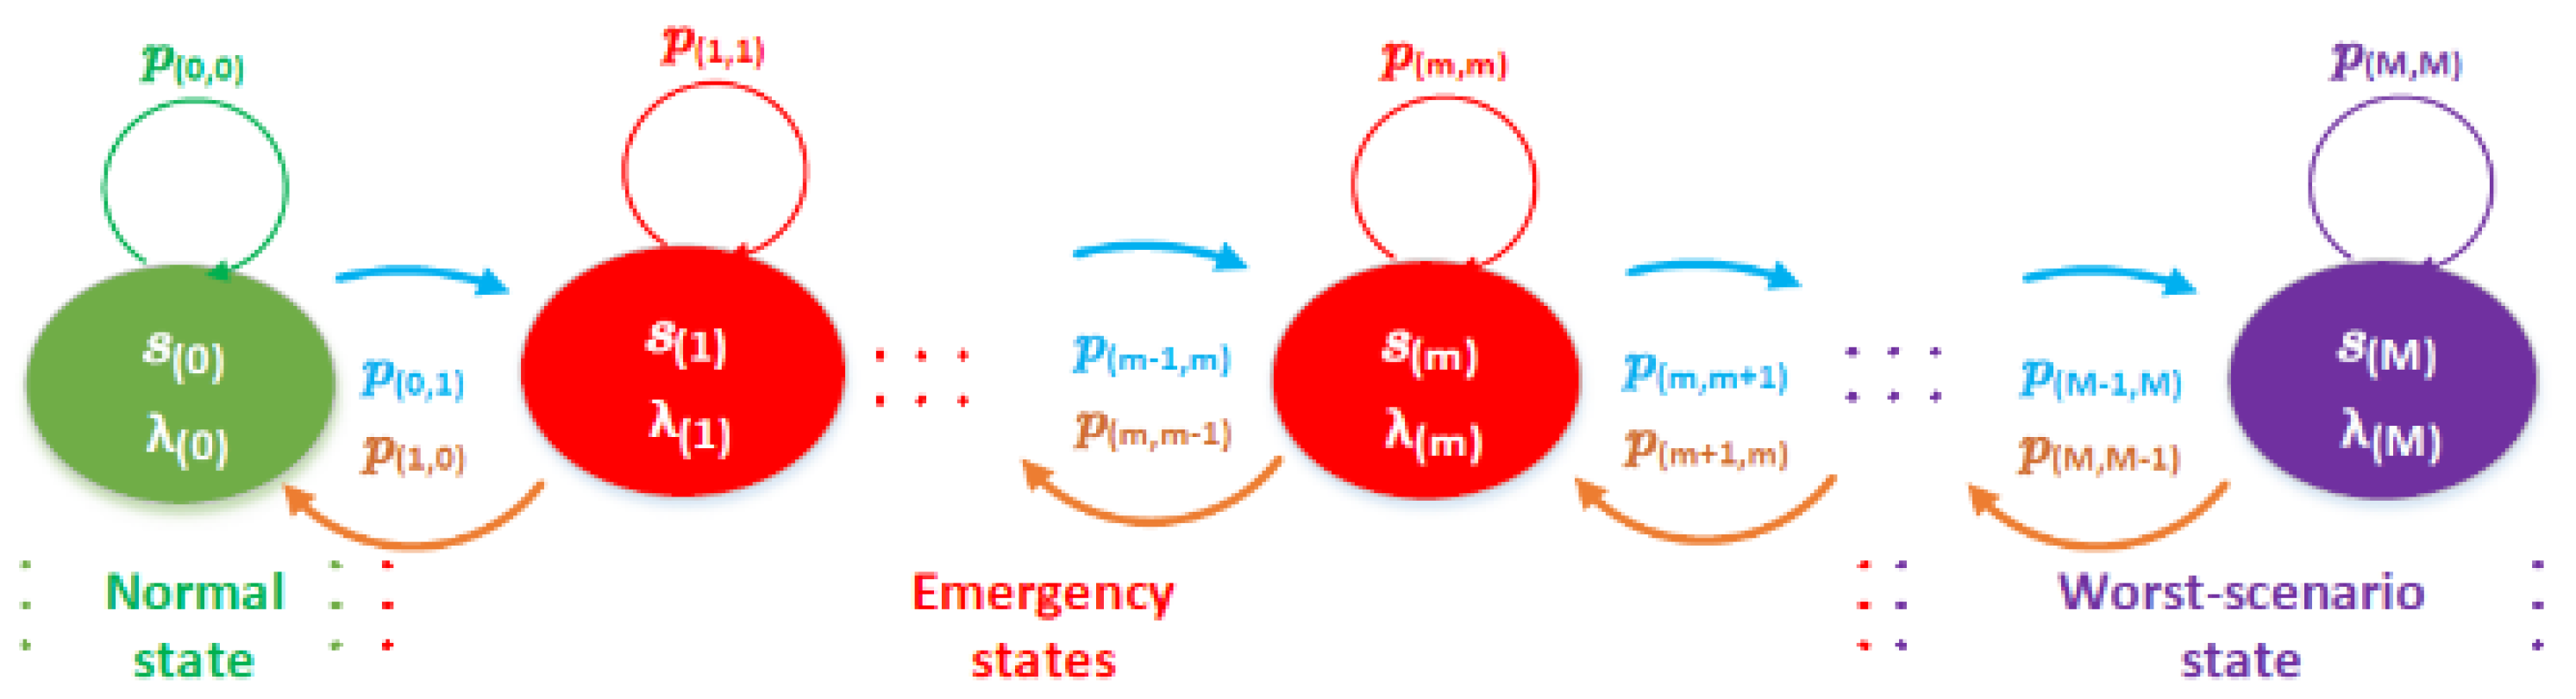
Figure 4.
Flow chart for CHANAL model.
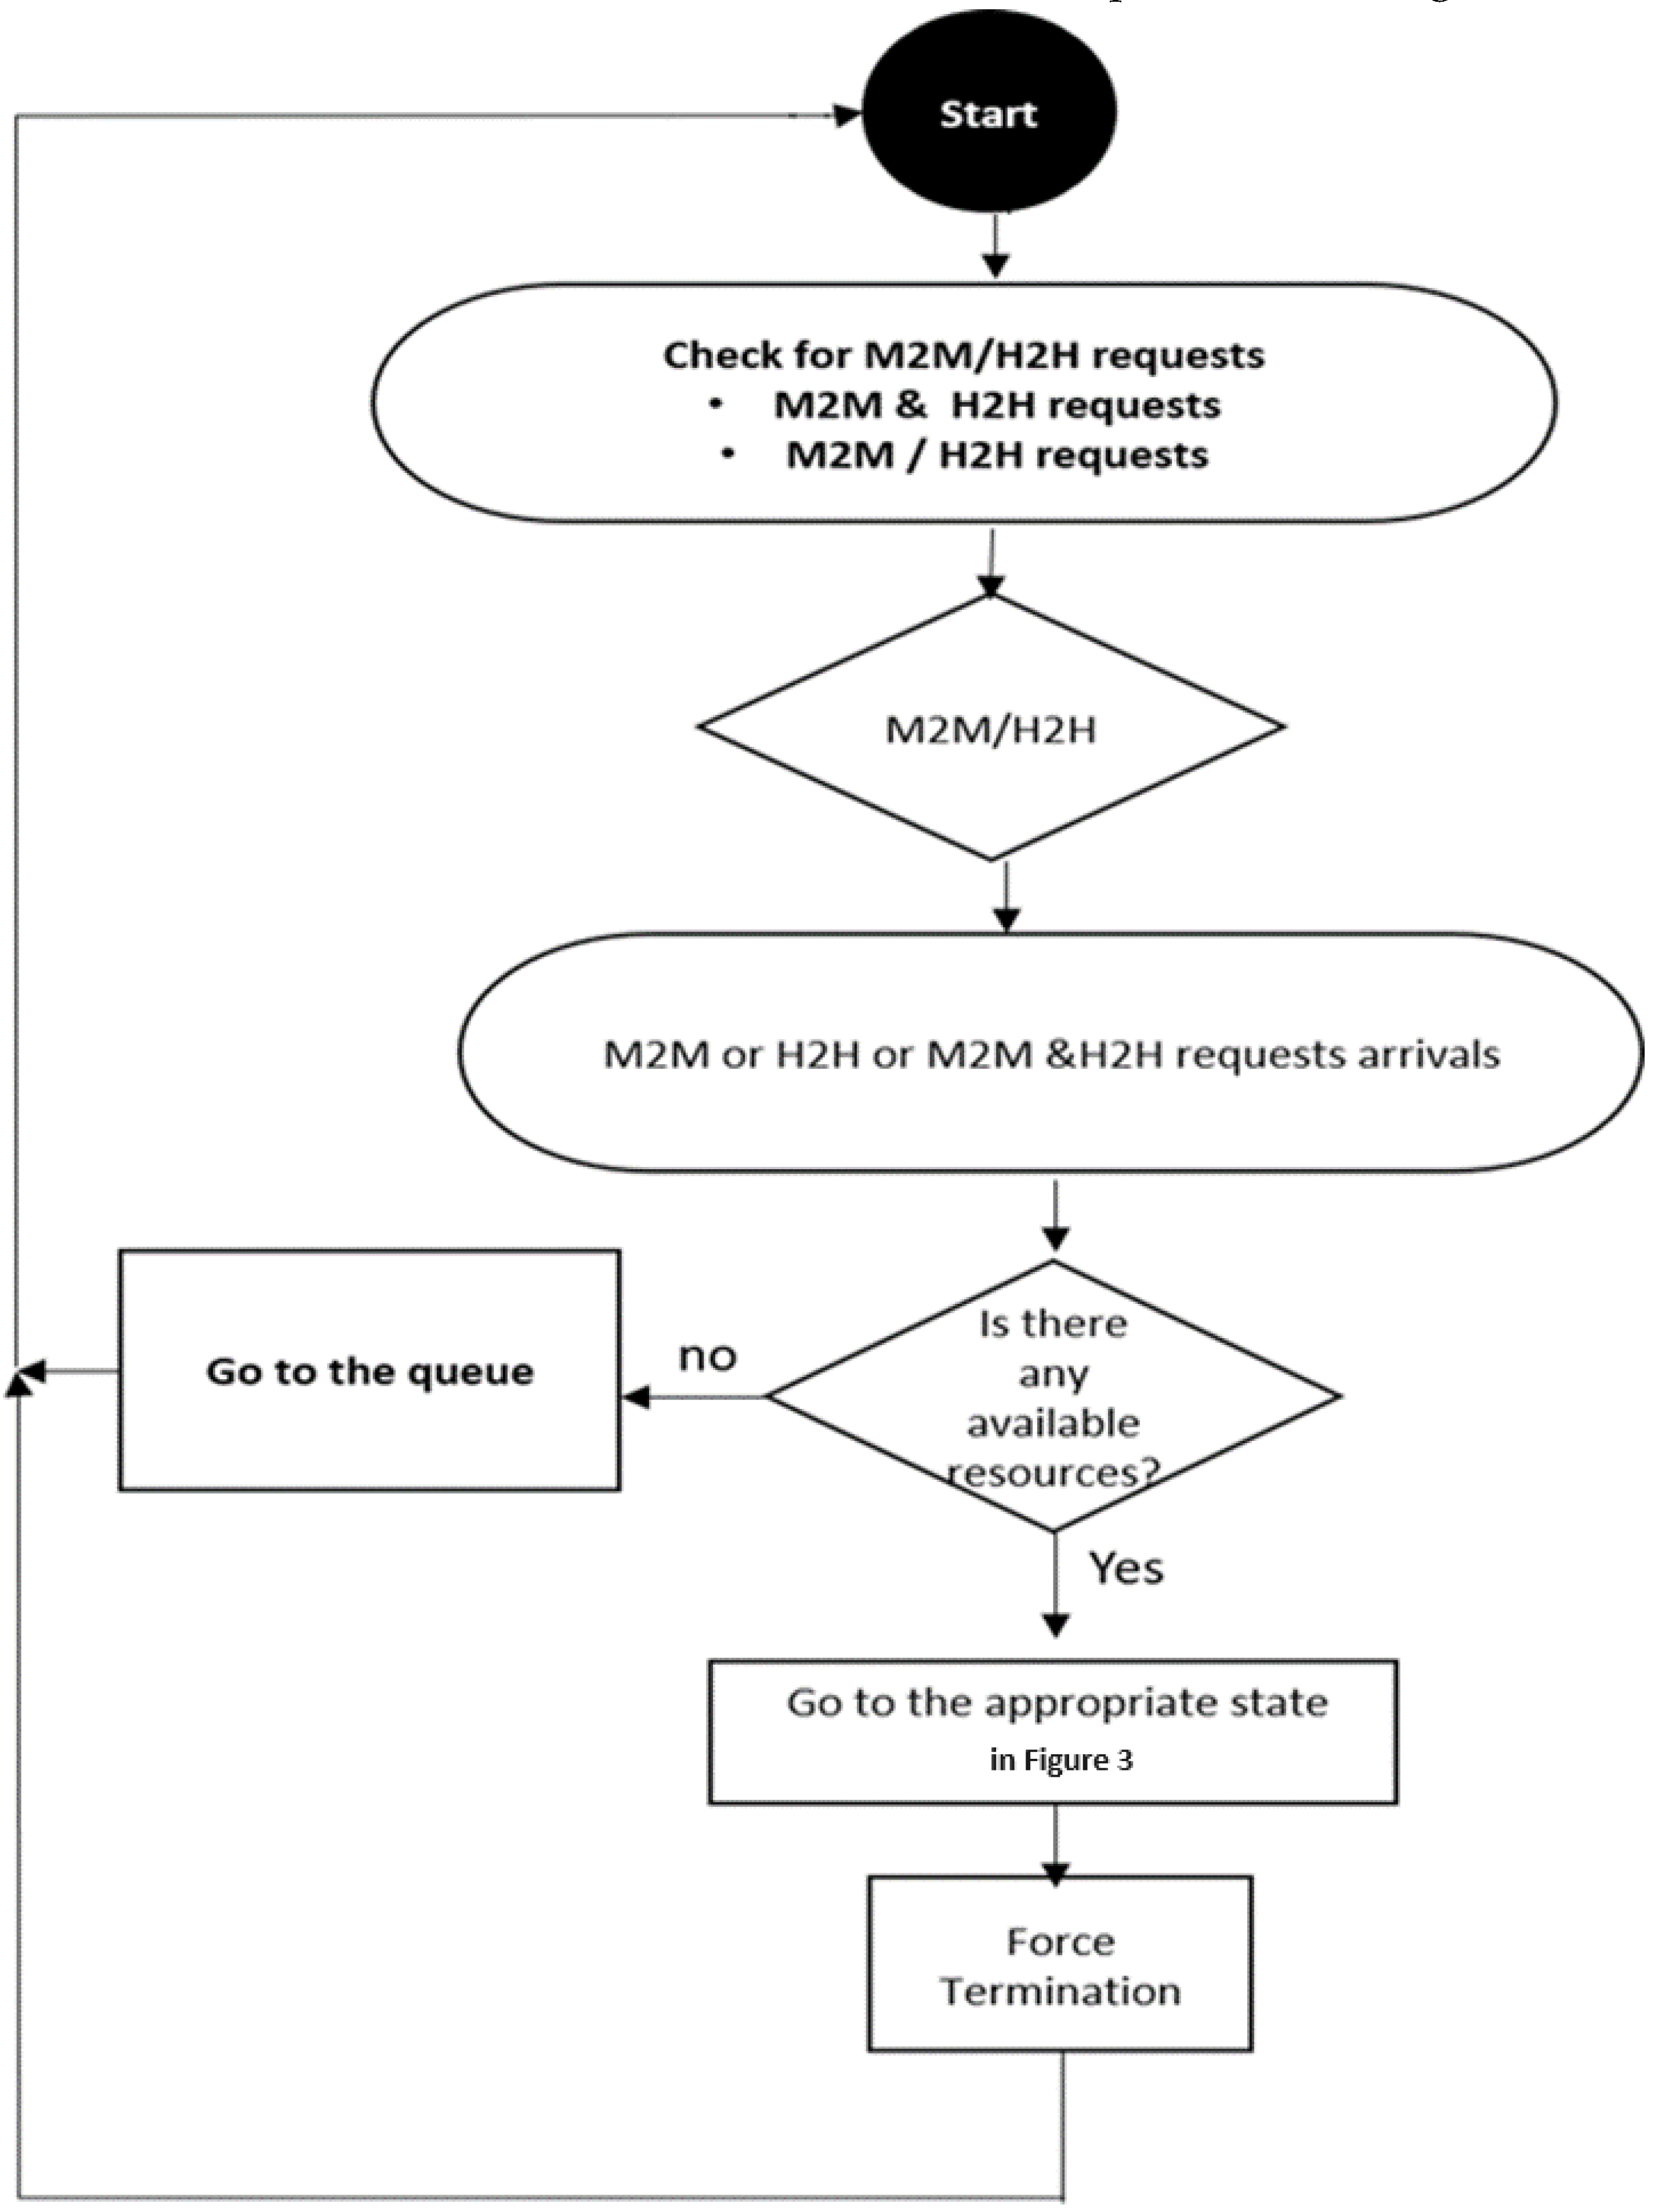
Figure 5.
Regular eNodeB in a normal scenario, where the variation of scr value is based on the values of both λ(m) and λ(h).
Figure 5.
Regular eNodeB in a normal scenario, where the variation of scr value is based on the values of both λ(m) and λ(h).
Figure 6.
: Regular eNodeB in a Dense scenario, where the variation of scr value is based on the values of both λ(m) and λ(h).
Figure 6.
: Regular eNodeB in a Dense scenario, where the variation of scr value is based on the values of both λ(m) and λ(h).

Figure 7.
Regular eNodeB in a Worst-case scenario, where the variation of scr value is based on the values of both λ(m) and λ(h).
Figure 7.
Regular eNodeB in a Worst-case scenario, where the variation of scr value is based on the values of both λ(m) and λ(h).
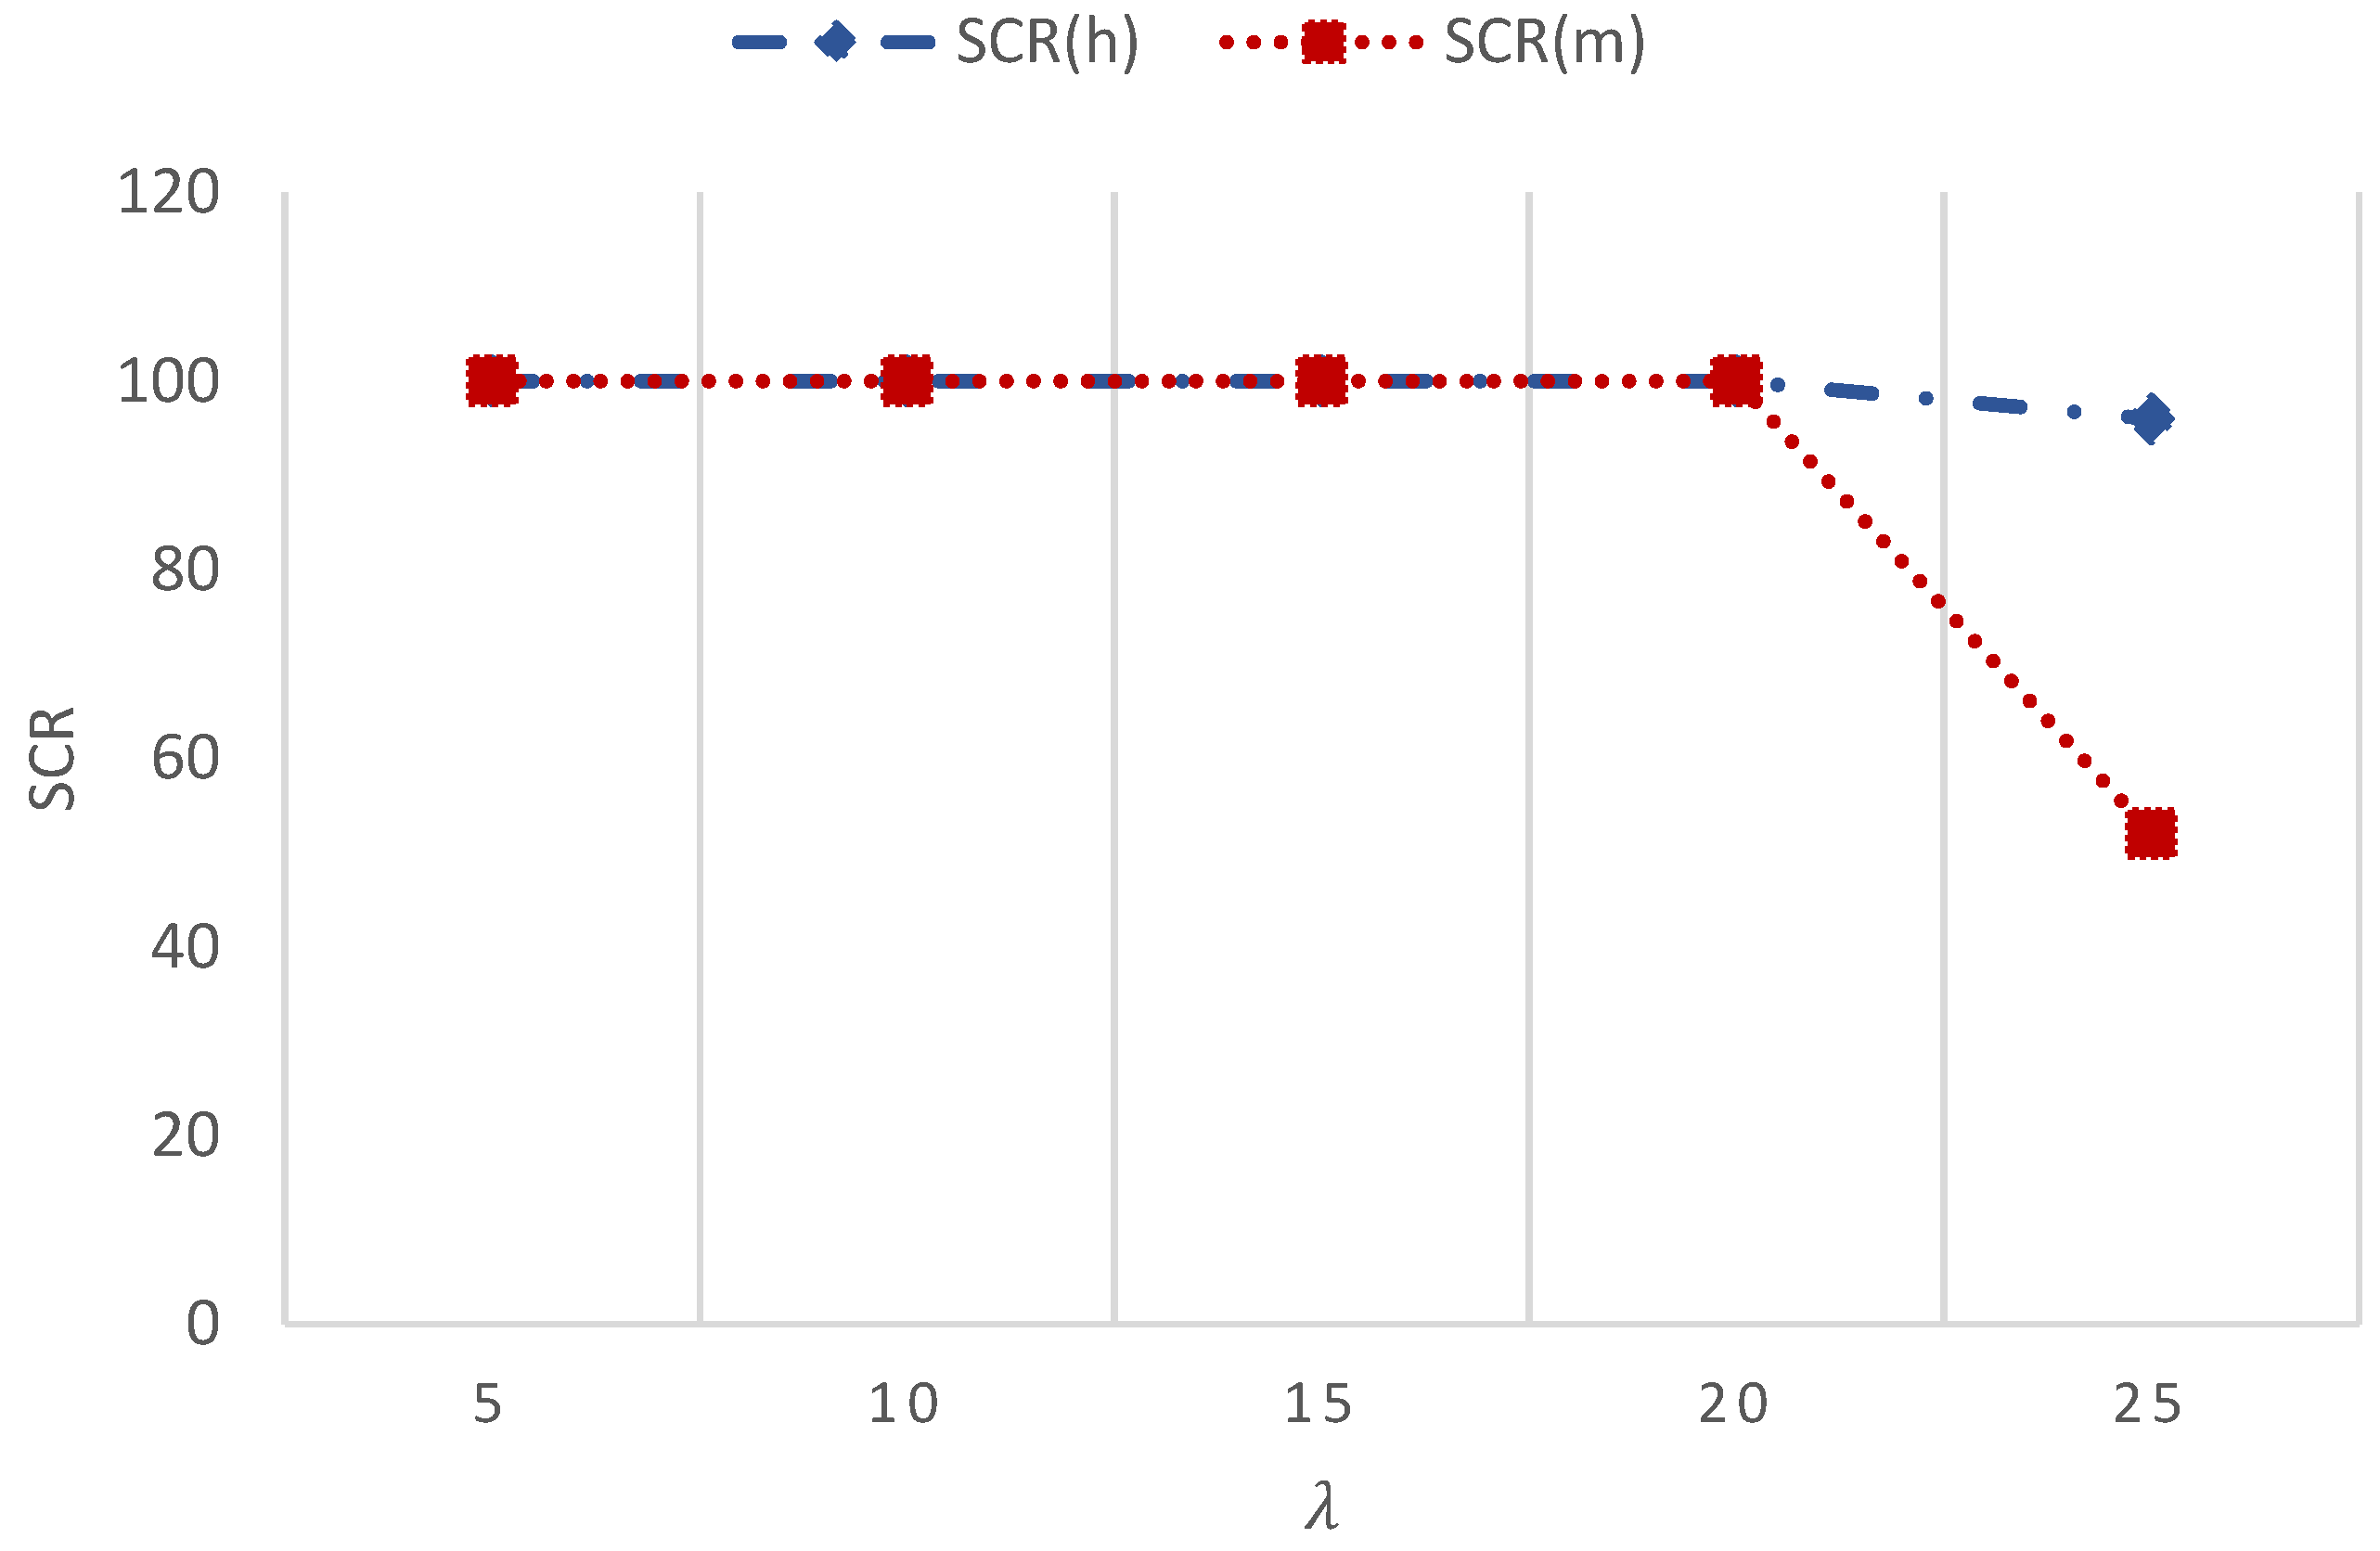
Figure 8.
Regular eNodeB in a normal cycle scenario, where λ(m) is the average arrival rate for M2M traffic, scr is the service completion rate.
Figure 8.
Regular eNodeB in a normal cycle scenario, where λ(m) is the average arrival rate for M2M traffic, scr is the service completion rate.
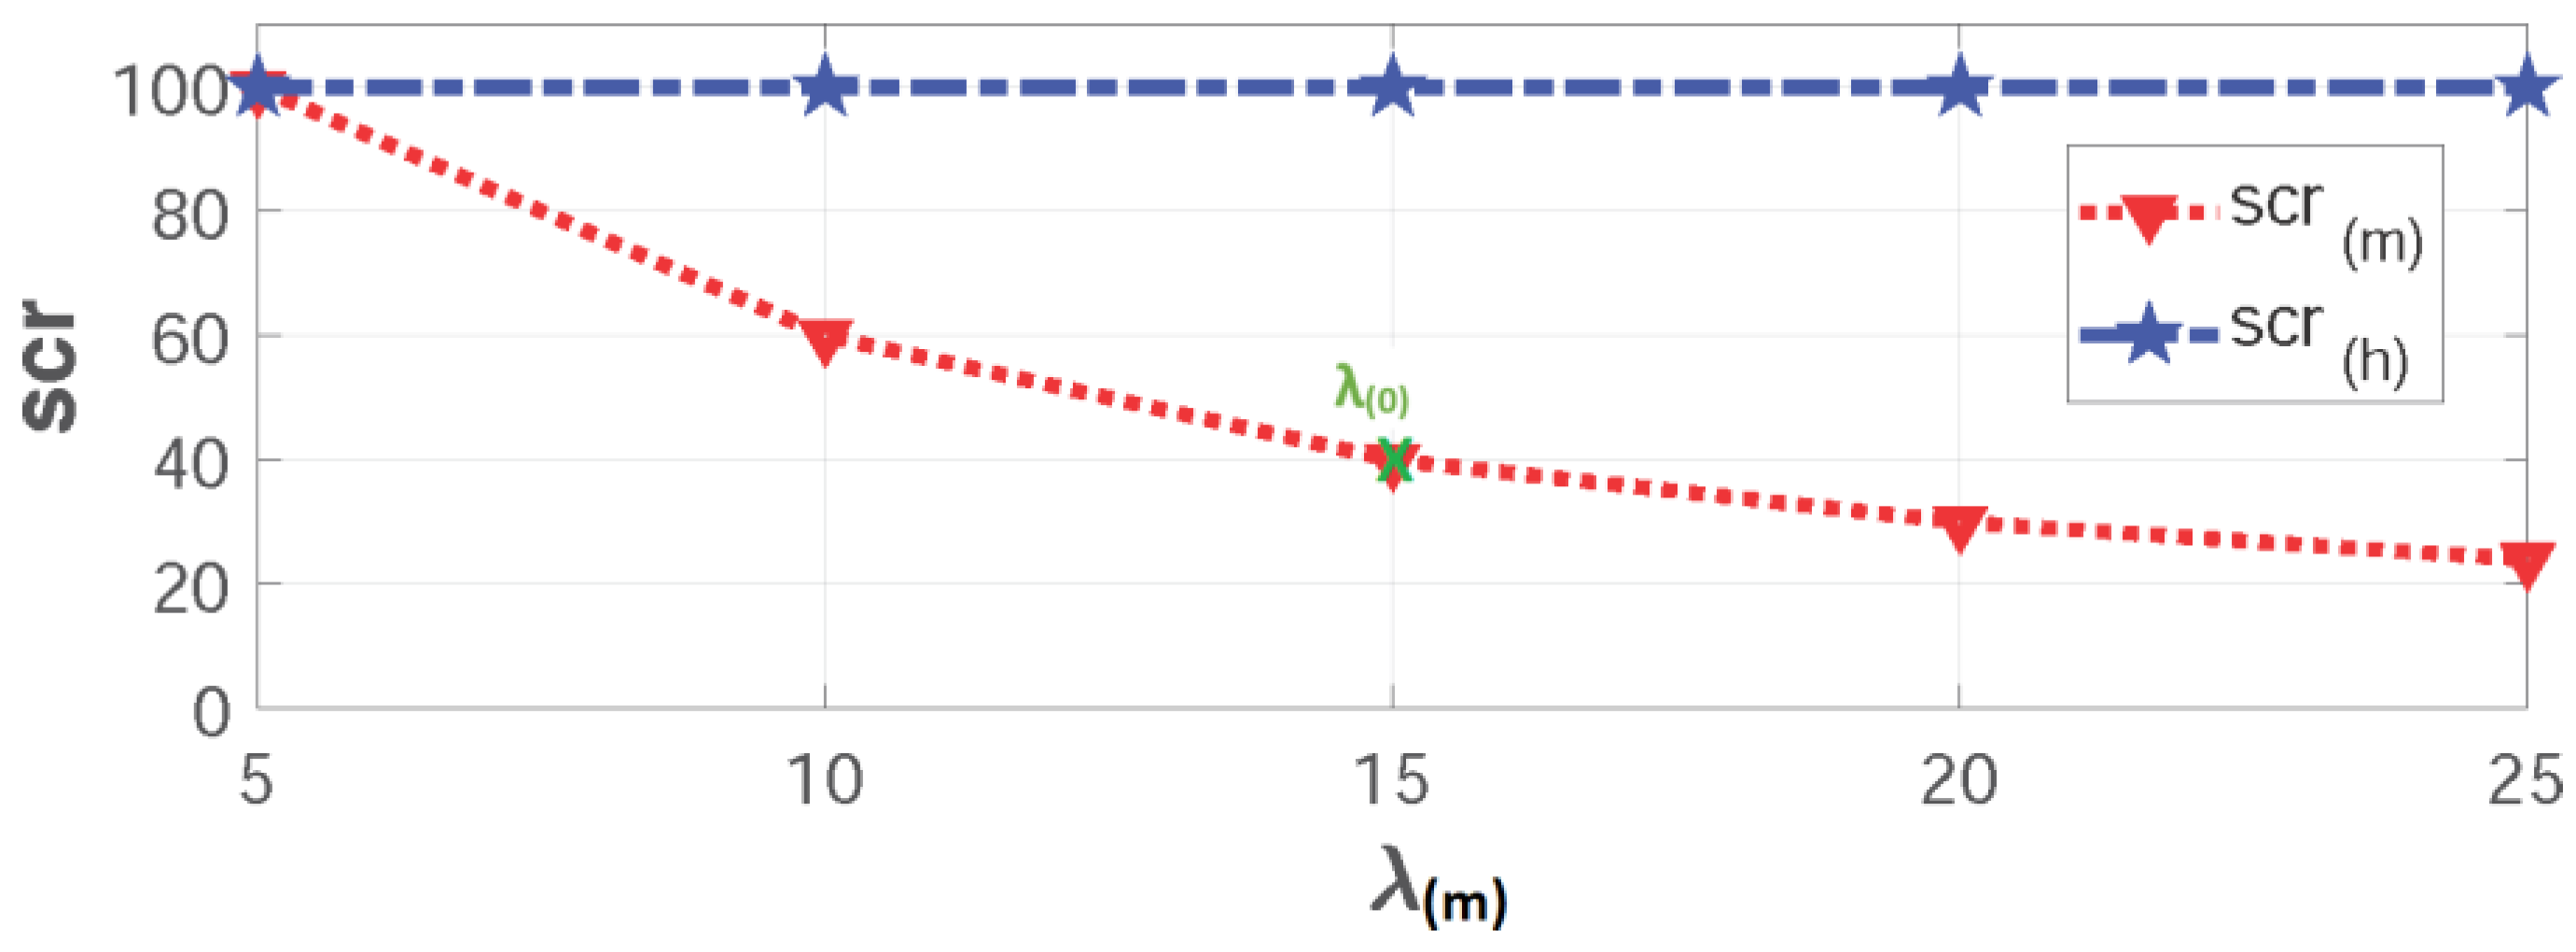
Figure 9.
Regular eNodeB in an emergency scenario, where λ(m) is the average arrival rate for M2M traffic, scr is the service completion rate.
Figure 9.
Regular eNodeB in an emergency scenario, where λ(m) is the average arrival rate for M2M traffic, scr is the service completion rate.
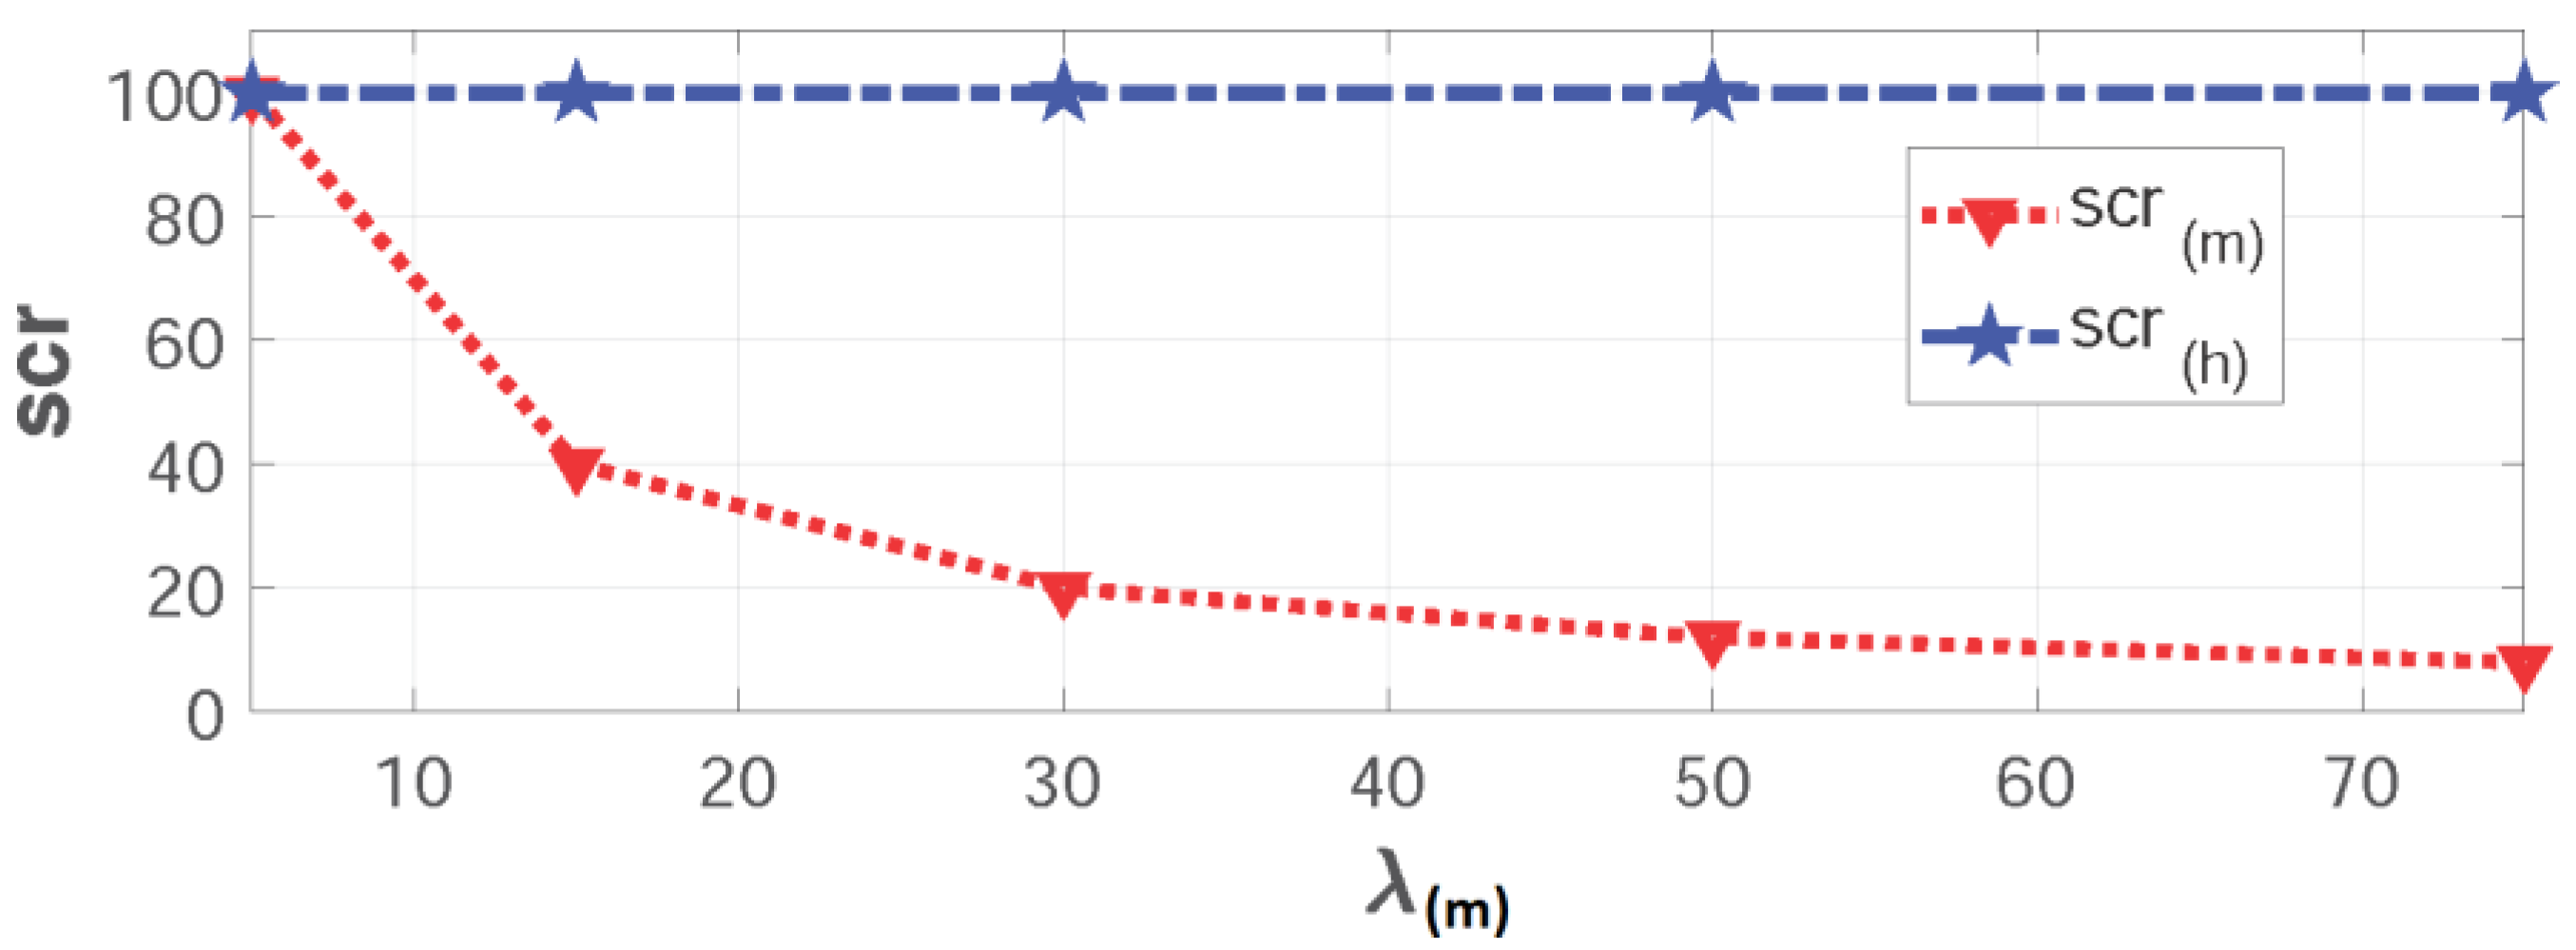

Table 1.
Example of M2M storms when M = 3.
| Group # | M2M Device Type | Message Size (Bytes) |
Rate (msg/day) |
Number of devices (Kilo) |
Storm Rate (Kbps) |
Number of storms (Storm/day) |
|---|---|---|---|---|---|---|
| 1 | Asset tracking | 50 | 100 | 20 | 1600 | 500 |
| 2 | Assisted medical |
100 | 8 | 20 | 3200 | 40 |
| 3 | Environment monitoring |
200 | 24 | 20 | 6400 | 120 |
Table 2.
Comparison between CHANAL and CANAL models.
| Model Characteristics | CHANAL | CANAL |
|---|---|---|
| Heterogeneity traffic | ✓ | ✕ |
| Homogeneity traffic | ✕ | ✓ |
| Synchronization behavior | ✓ | ✕ |
| Real-time behavior | ✕ | ✓ |
| FIFO queuing | ✓ | ✕ |
| Random/Standard queue | ✕ | ✓ |
Table 3.
Description of notations and parameters used in simulations.
| Notation | Value | Description |
|---|---|---|
| rb(m) | 6 | Resource blocks reserved for M2M |
| rb(h) | 94 | Resource blocks reserved for H2H |
| λ(m) | {5, 10, 15, 20, 25} | Average arrival rate for M2M |
| λ(h) | constant | Average arrival rate for H2H |
| μ(m) | 1 | Service completion rate for M2M |
| μ(h) | 1 | Service completion rate for H2H |
| n | 0 | Queue size for H2H |
| o | 0 | Queue size for M2M |
| t | 1000 | Simulation time (seconds) |
Table 4.
State representations.
| Notation | Value | State |
|---|---|---|
| p1 | P0c0 | S(0,0) |
| p2 | P1c0 | S(1,0) |
| p3 | P2c0 | S(2,0) |
| p4 | P3c0 | S(3,0) |
| p5 | P0c1 | S(0,1) |
| p6 | P0c2 | S(0,2) |
| p7 | P0c3 | S(0,3) |
| p8 | P1c1 | S(1,1) |
| p9 | P1c2 | S(1,2) |
| p10 | P2c1 | S(2,1) |
Table 5.
The adaptivity of CHANAL in normal cases.
| Group # | λ(m) | rb(m) | rb(h) | scr(h) | scr(m) |
|---|---|---|---|---|---|
| 1 | 5 | 6 | 94 | 100 | 100 |
| 2 | 10 | 12 | 88 | 100 | 100 |
| 3 | 15 | 18 | 82 | 100 | 100 |
| 4 | 20 | 24 | 76 | 100 | 100 |
| 5 | 25 | 30 | 70 | 100 | 100 |
Table 6.
The adaptivity of CHANAL in emergency cases.
| Group # | λ(m) | rb(m) | rb(h) | scr(h) | scr(m) |
|---|---|---|---|---|---|
| E1 | 5 | 6 | 94 | 100 | 100 |
| E2 | 15 | 18 | 82 | 100 | 100 |
| E3 | 30 | 30 | 70 | 100 | 100 |
| E4 | 50 | 48 | 52 | 100 | 96 |
| Worst-case | 75 | 72 | 28 | 56 | 96 |
Disclaimer/Publisher’s Note: The statements, opinions and data contained in all publications are solely those of the individual author(s) and contributor(s) and not of MDPI and/or the editor(s). MDPI and/or the editor(s) disclaim responsibility for any injury to people or property resulting from any ideas, methods, instructions or products referred to in the content. |
© 2024 by the authors. Licensee MDPI, Basel, Switzerland. This article is an open access article distributed under the terms and conditions of the Creative Commons Attribution (CC BY) license (http://creativecommons.org/licenses/by/4.0/).
Copyright: This open access article is published under a Creative Commons CC BY 4.0 license, which permit the free download, distribution, and reuse, provided that the author and preprint are cited in any reuse.


