

Submitted:
29 September 2024
Posted:
30 September 2024
You are already at the latest version
Abstract
This paper aims to propose a novel SOS traffic and study its impact over Machine-to-Machine (M2M) and Human-to-Human (H2H) traffic in Internet of Things environments specifically during disaster events. During such events (e.g., the spread COVID-19), SOS traffic, with its predicted exponential increase, will significantly influence all mobile networks. SOS traffic tends to cause many congestion overload problems that significantly affects the performance of M2M and H2H traffic. In our project, we developed a new Continuous-Time Markov Chains (CTMC) model to analyze and measure radio access performance in terms of massive SOS traffic that influences M2M and H2H traffic. Afterwards, we validate the proposed CTMC model through extensive Monte-Carlo simulations. By analyzing the traffic during an emergency case, we can spot a huge impact over the three traffic M2M, H2H, and SOS traffic. To solve the congestion problem while keeping the SOS traffic without any influence, we propose to grant the SOS traffic the highest priority over M2M and H2H traffic. However, by implementing this solution in different proposed scenarios, the system becomes able to serve all SOS requests, while only 20% of M2M and H2H traffic could be served in the worst-case scenario. Consequently, we can alleviate the expected shortage of SOS requests during critical events, which might save many humans and rescue them from being isolated.
Keywords:
M2M
; H2H
; IoT
; CTMC
; Markov chains
; Emergency
1. Introduction
The Internet of Thing (IoT) has revolutionized daily life by enabling Machine-to-Machine (M2M) communication, connecting devices to the Internet to exchange information without human intervention [1,2]. Unlike Human-to-Human (H2H) devices, M2M devices submit small data packets in IoT networks [3,4]. On one hand, Long Term Evolution Advanced (LTE-A) networks support H2H services like Voice over IP (VoIP), File Transfer Protocol (FTP) and video streaming. However, on the other hand, Low Power Wide Area Networks (LPWAN) was coined to provide low-energy, wide-range connectivity for IoT devices [5]. In fact, ABI research, which is a technology solution provider, project that the number of IoT devices that use LPWAN technology will significantly increase to reach 5.3 billion connected devices by 2030 [6]. Under the umbrella of 3rd Generation Partnership Project (3GPP), LPWAN technologies are categorized into non-3GPP technologies (e.g., Long Range (LoRa) and Sigfox) and 3GPP-based technologies (e.g., Long-Term Evolution for Machines (LTE-M) and Narrow Band Internet of Things (NB-IoT)) [7].
To coexist with LTE-A networks, 3GPP technologies introduced LTE-M and NB-IoT, with a limited bandwidth to accommodate with M2M requirements [8]. Non-3GPP technologies (like LoRa or SigFox) are vital for smart cities, supporting large-scale device connections [9,10,11]. In this context, NB-IoT networks and LTE-M networks were developed specifically for M2M communications to fulfil their requirements, such as: long battery life, low device cost, extended coverage, and support a large number of devices [12,13].
Before delving into the core of our contribution, we review some research that helped us to propose our contribution.
In [14], the authors addressed the challenge of integrating M2M and H2H communications in LTE networks. They proposed a delay-aware time-slotted resource allocation model with priority-based queuing, giving H2H users the highest priority. To prevent M2M traffic starvation, the model reallocates some resources to M2M without affecting H2H quality. Their simulation results showed that the model improves M2M resource efficiency and reduces waiting time while maintaining H2H service quality. Meanwhile, the researchers in [15] examined the impact of increased healthcare sensor (HCS) traffic during the COronaVIrus Disease of 2019 (COVID-19) pandemic on congested LTE networks, particularly focusing on the need to prioritize critical e-healthcare data during pandemics. They proposed three solutions to manage congestion and ensure Quality of Service (QoS) for HCS traffic: doubling bandwidth, integrating LTE-A and LTE-M networks, and request queuing. The conducted simulations to show that request queuing provided the best performance in ensuring HCS traffic was not compromised during the pandemic. In another paper [16], a smart healthcare monitoring system was developed using wireless sensors to collect patient data like heart rate and blood pressure. These sensors communicate with a monitoring station via 5G networks, enabling immediate treatment. The system also utilizes machine learning for better detection of critical conditions, reducing hospital visits and improving healthcare quality. In [17], the authors explored the integration of M2M communication into LTE-A networks using a Relay Node (RN) solution. They simulated a M2M scenario with both e-healthcare and logistic devices alongside normal LTE-A users using the Optimized Network Engineering Tool (OPNET) modeler. The results showed that LTE-A network performance improves when a RN is employed for multiplexing and aggregating M2M traffic, which typically involves infrequent transmission of small data amounts. In a previous project [18], we proposed the Adaptive eNodeB (A-eNB) to manage network overload in NB-IoT during emergency scenarios, ensuring H2H traffic is minimally affected. By dynamically reserving NB-IoT bandwidth, the system can increase M2M connections and reduce congestion. A Continuous-Time Markov Chain (CTMC) was used to enhance H2H/M2M coexistence, especially during disasters. Results showed that leasing 18 resource blocks for NB-IoT traffic achieved a 98% completion rate for M2M traffic during emergencies. In [19], the authors proposed a CTMC traffic model to address the dynamic QoS demands of IoT networks. The model helps optimize spectrum sharing by deriving optimal access probabilities for different service classes. A centralized scheduler with a service-prioritized queuing system is introduced, and the proposed scheme is compared with mixed critical scheduling and max-min methods. Simulation results showed improved spectrum utilization and reduced queuing delay, while maintaining fairness compared to max-min.
Based on the mentioned previous works, we are motivated to propose a novel SOS traffic to help improving rescue calls during emergencies.
The main contributions of this paper can be summarized as follows:
- Developing a CTMC model to characterize the H2H and M2M traffic mathematically.
- Using the CTMC model, analyzing and studying the massive number of IoT devices attempting to access a LTE network becomes achievable.
- Studying and evaluating the impact of SOS traffic on M2M and H2H traffic during a pandemic disease such as Coronavirus disease.
- To confirm our mathematical results, the CTMC solution is illustrated using extensive Mont-Carlo simulations for different scenarios.
The rest of the paper is organized as follows: In section 2, we introduce the SOS traffic. The third section explains our CTMC model. In section 4, we solve the linear system and we obtain mathematical results. In section 5, we develop a simulation model and we obtain empirical results. Finally, the conclusion and future work are provided in the last section.
2. SOS Traffic
Traditionally, M2M communication system consists of three domains:
- Physical or Device Domain: where devices capture events (e.g., temperature, heartbeat, blood pressure, etc.) and transmit data via different networks;
- Network Domain: which conveys the generated data from the device domain to the application domain (e.g., ZigBee, Bluetooth, Wi-Fi, LTE-M, NB-IoT, LoRa, SigFox, etc.);
- Application Domain: where the data is processed. M2M applications span areas such as security and public safety, e-health, intelligent transportation, and smart environments [7].
The three domains are shown in Figure 1.
M2M domains face many challenges such as access problems, burst traffic, resource efficiency, diverse data formats, and traffic prioritization, leading to congestion. Effective solutions are needed to manage growing M2M traffic across networks like LTE-A, LTE-M, and NB-IoT, ensuring they meet IoT standards and support M2M and H2H demands [20,21].
When an emergency incident occurs, M2M and H2H traffic are increasing exponentially, due to the number of devices and people connected at same time trying to dispatch critical information regarding their safety and rescue calls. For example, during the spread of COVID-19, the world health organization sounded the emergency alarm, which we consider as SOS traffic in our paper. COVID-19 main symptoms are coughs, fever, breathing difficulties. COVID-19 has been propagated via the direct contact of humans. Therefore, suspected or infected people should be kept physically isolated when needed but at the same time, they should be well wirelessly monitored. to reduce the percentage of infection. With M2M devices connected via a wireless telecommunication network, we can maintain the healthcare of suspected patients. Meanwhile, with H2H traffic (such as VoIP and video traffic), health authorities should be able to communicate, give instructions and help suspected patients. Since any infected patient requires both M2M and H2H traffic, we suggest a new traffic called SOS traffic, which contains both traffic one request of M2M traffic and one request from H2H traffic arriving simultaneously to the system. Consequently, in this paper, any communication involving a suspected critical case is treated as SOS traffic. Additionally, we propose a model of this new traffic based on CTMC to study and analyze its impact over the network, as explained in the next section.
3. CTMC Model
LTE-A network was initially designed for H2H services, but the rise of M2M has made it necessary to manage connected devices. Researchers estimate that by 2030, there will be around 3.2 billion unavoidable coexistences between M2M and H2H in a single LTE-A network [14]. This section focuses on analyzing the performance characteristics of SOS, H2H and M2M traffic in a LTE network and proposing a novel methodology based on CTMC. The CTMC prioritizes radio resource allocation, achieving a balance between all traffic for more efficient system performance.
After exploring different models, the Markov chain model is chosen as one of the best models to analyze telecommunication systems and optimize network performance.
3.1. Markov Chain
Markov chains are systems where elements transition between states over time following certain probabilities. These chains are used to model real-world processes [22]. In this work, Markov chains and queuing theory are applied to analyze and optimize network performance.
To study the SOS, H2H and M2M coexistence in LTE-A networks, CTMC is chosen due to the continuous arrival of requests and the need to analyze the QoS for all traffic types [20].
3.2. CTMC Model
The CTMC analytical model involves four steps:
- Defining states using Markov chains.
- Generating equilibrium equations.
- Solving the linear system and obtaining mathematical performance results.
- Developing a model to mimic SOS traffic functionality on M2M and H2H traffic.
3.2.1. Defining States Using Markov Chains
In the first step, we use the Markov chain to define the sequence of possible events for different applications (H2H, M2M, and SOS requests) by turning any possible incident into different states and probabilities that identify this incident.
Figure 2 illustrates the CTMC with 10 states, divided into four phases: Empty, Occupied, Full, and Queue phases.
By analyzing Figure 2, we can realize that the system falls into one of four phases:
- Empty phase: It contains only one state S(0,0) which represents the Empty state. This means that none of the resources is allocated because no requests have arrived yet.
- Occupied phase: S(1,0), S(0,1), S(1,1), S(2,0) and S(0,2) represent the five states of the occupied phase. The system falls into the occupied phase when several resource blocks are occupied only (but not all resource blocks). Additionally, the number of ongoing H2H and M2M requests is more than zero and less than the number of resources used in the network (C).
- Full phase: It includes four states: S(2,1), S(1,2), S(3,0), and S(0,3). The system reaches this phase when the three resource blocks are serving certain requests.
- Queue Phase: When the three resource blocks are busy and the system receives a new M2M or H2H request, the system moves to the queue phase.
It should be noted that in our previous work [3], the assumption of receiving one request M2M or one request H2H was attainable when we modeled and simulated the system. However, after reaching 52k devices connected simultaneously, the server reaches its full capacity since it could not afford this huge number of requests.
In this paper, we extend the model propose in our previous work in [3] with the assumption of receiving one or two requests of M2M/H2H traffic or two requests of different types (one M2M and one H2H) simultaneously in SOS traffic.
3.2.2. Generating the Equilibrium Equations
Since we have many notations in the following equations, we summarize them in Table 1:
We will generate the equilibrium equations, by considering new arrival events with an arrival rate “λ” and a service rate “μ”.
As explained in the previous paragraph, the system might be in one of the following four phases:
- Empty Phase represented by S(0,0), as shown in Figure 3.
The balance equation for the state S(0,0) can be written as follows:

- 2.
- Occupied Phase: It contains five states: S(1,0), S(0,1), S(1,1), S(2,0) and S(0,2).
In Figure 4, we only represent the transitions from and to the state S(1,0).
The balance equation for state S(1,0) can be written as follows:

- 3.
- Full Phase: It includes four states: S(2,1), S(1,2), S(3,0), and S(0,3).
The transitions from /to state S(1,2) is represented in Figure 5.
The balance equation for state S(1,2) can be written as follows:

- 4.
- Queue Phase: When the three resource blocks are busy and the system receives a new M2M or H2H request, the system moves to the “Queue Phase”. In this paper, to clarify the main idea of our modeling, we have put aside the queuing phase. Discussing the potential latency caused by the limitation of the queue and the excessive number of requests will be the most crucial challenge that we will tackle in our future work.
Similar to the way of generating the balance equations for the states: S(0,0), S(1,0) and S(1,2), we generate the remaining seven states. Therefore, we end up with ten balance equations that rules ten states:
- 1-
- Balance equation (1) for S(0,0) in the “Empty Phase”:

- 2-
- Balance equation (2) for S(1,0) in the “Occupied Phase”:

- 3-
- Balance equation(3) for S(0,1) in the “Occupied Phase”:

- 4-
- Balance equation(4) for S(2,0) in the “Occupied Phase”:

- 5-
- Balance equation(5) for S(0,2) in the “Occupied Phase”:

- 6-
- Balance equation(6) for S(1,1) in the “Occupied Phase”:

- 7-
- Balance equation(7) for S(1,2) in the “Full Phase”:

- 8-
- Balance equation(8) for S(2,1) in the “Full Phase”:

- 9-
- Balance equation(9) for S(0,3) in the “Full Phase”:

- 10-
- Balance equation(10) for S(3,0) in the “Full Phase”:

4. Solving the Linear System, Analytical Results and Discussions
Based on the above ten linear equations containing ten variables where (i,) denotes the number of ongoing services for H2H, M2M and SOS, we can build our linear system.
To recall, the system moves from one state to another, when a service is accomplished or a new request arrives (by increasing or decreasing i or j) with a steady-state probability (i,) that should respect the following two constraints:
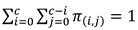
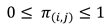
The ten equilibrium equations can be written in a linear form: AΠ= 0. Where the square matrix A represents the coefficients of a linear system, and Π represents the steady-state probability vector:


In the matrix A, we use the following notations:
- a =
- b =
- c =
- d =
- e = ()
- f = ()
Then, we can write equation (14) as follows:
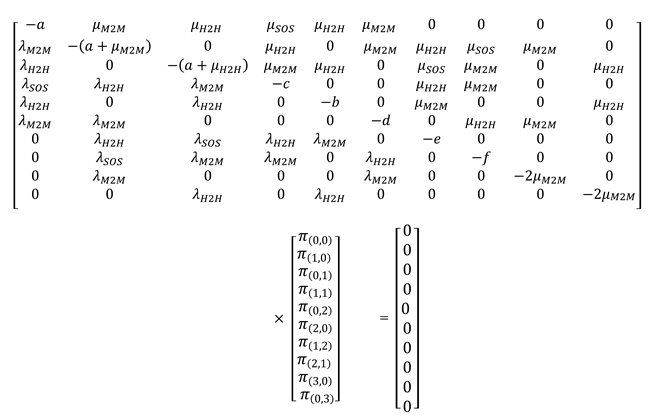 where A is a (10 × 10) matrix but not full-rank, consequently we cannot solve the linear system using this matrix. By replacing the first row of the matrix A by the coefficients of (11), we obtain the following modified system:
 where B is a full-rank 10 × 10 matrix and the linear system of (15) becomes:
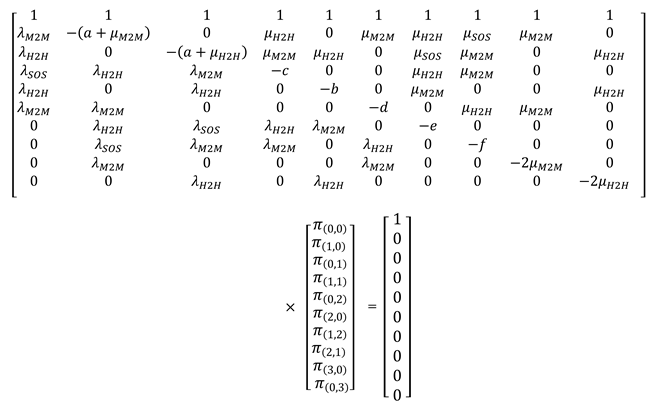
We present our developed model, which can generate H2H, M2M and SOS traffic with full flexibility to add queueing priority for any traffic to study the mutual impact of SOS traffic on H2H and M2M traffic.
In all scenarios, we consider a regular LTE-A network with a fixed number of resources (C = 3). As for the traffic, we are going to model three traffic: M2M, H2H, and SOS traffic. We characterize the three traffic with different average arrival rates λH2H, λM2M, λSOS and different service rates μH2H, μM2M, μSOS.
4.1. Normal-Cycle Scenario:
This scenario represents the normal-cycle (e.g., non-peak hours) in which there is no emergency case consequently no SOS traffic.
Assuming that the three traffic characteristics are:
- For H2H traffic: λH2H = 2 and μH2H = 2.
- For M2M traffic: λM2M = 1 and μM2M = 1.
- For SOS traffic: λSOS = 0 and μSOS = 0.
The mathematical results of the normal scenario are:
| = 3/19 = 16% |
| = 3/19 = 16% |
| = 3/38 = 8% |
| = 1/38 = 2% |
| = 3/19 = 16% |
| = 3/19 = 16% |
| = 3/38 = 8% |
| = 3/38 = 8% |
| = 3/38 = 8% |
| = 1/38 = 2% |
The mathematical results of the normal scenario are represented in Figure 6.
4.2. Dense-Area Scenario:
This scenario represents the dense-area (e.g., crowded city) cycle in which there is no emergency case consequently no SOS traffic.
Assuming that the three traffic characteristics are:
- For H2H traffic: λH2H = 2 and μH2H = 1.
- For M2M traffic: λM2M = 1 and μM2M = 1.
- For SOS traffic: λSOS = 0 and μSOS = 0.
The mathematical results of the Dense scenario are:
| = 1/13 = 7.6 % |
| = 1/13 = 7.6 % |
| = 1/26 = 3.85 % |
| = 1/78 = 1.2 % |
| = 2/13 = 15.3 % |
| = 2/13 = 15.3 % |
| = 1/13 = 7.6 % |
| = 2/13 = 15.3 % |
| = 2/13 = 15.3 % |
| = 4/39 = 10 % |
The mathematical results of the dense-area scenario are represented in Figure 7.
4.3. Worst-Case Scenario:
This scenario represents the worst-case cycle in which we have a huge traffic accompanied with SOS traffic.
Assuming that the three traffic characteristics are:
- For H2H traffic: λH2H = 2 and μH2H = 1.
- For M2M traffic: λM2M = 2 and μM2M = 1.
- For SOS traffic: λSOS = 2 and μSOS = 1.
The mathematical results of the worst-case scenario are:
| = 23/609 = 3.7 % |
| = 38/609 = 6.2 % |
| = 38/609 = 6.2 % |
| = 18/203 = 8.8 % |
| = 50/609 = 8.2 % |
| = 50/609 = 8.2 % |
| = 30/203 = 14.7 % |
| = 30/203 = 14.7 % |
| = 88/609 = 14.4 % |
| = 88/609 = 14.4 % |
The mathematical results of the worst-case scenario are represented in Figure 8.
In this section, we developped analytical results corresponding to different scenarios. In the coming section, we simulate these scenarios using Simulink simulator.
5. Simulink Model, Empirical Results and Discussions
We employ a user-friendly Matrix Laboratory (MATLAB) tool called Simulink. Simulink is used to design and test various models and time-based and multi-rate systems. It provides a more readable model representation through graphics, making simulations easier.
To recall, in emergencies (e.g., spread of a pandemic disease like COVID-19, Tsunami, terrorist attacks like September 11 attack, etc.), M2M and H2H communications significantly increase network traffic due to the simultaneous connection of numerous devices and people. This led to the development of the SOS traffic. In this paper, any communication involving a suspected critical case is treated as SOS traffic. We assume in this case receiving one M2M request and one H2H request simultaneously.
5.1. Model Parameters
We developed a model based on our previous work [9]. The system is modeled as an M/M/1 queue, where arrivals follow a Poisson process and service times follow an exponential distribution.
Our model consists of three types of traffic:
- M2M traffic: Which represents the only arrival of M2M communications (e.g., sensors and actuators) with an average arrival rate λM2M (i+1 or i+2) and a service rate μM2M (i-1 or i-2).
- H2H traffic: Which includes the arrival of H2H communications only (e.g., VoIP, File Transfer and Video traffic) with an average arrival rate λH2H (j+1 or j+2) and a service rate μH2H (j+1 or j+2).
- SOS traffic: Which involves both traffic one request of M2M traffic and one request from H2H traffic arriving simultaneously to the system with an average arrival rate λSOS (i+1 and j+1) and a service rate μH2H (i-1 and j-1).
- Assuming that H2H and M2M traffic have the same priority while SOS traffic has the highest priority.
- A priority queue type is used with an infinite capacity size.
- A single LTE network with a 5 MHz bandwidth; C = 25 Physical Resource Blocks (PRB); A PRB represents the minimal unit that can be scheduled for a user equipment to send or receive data [18].
- Simulation duration = 1000 Seconds.
To benchmark our model, we use two metric:
- Service Completion Rate (SCR): It gives the number of completed requests per time interval and it is based on the service rate and the average arrival requests for certain traffic [23]).
To calculate the SCR, we should apply the following equation:

- Server utilization (SU): This metric gives the probability of the system to be busy serving arrivals in terms of the number of utilized resource blocks in each state, compared to the total number of PRBs used in the network (C).
The server utilizations of the system is defined as follows:

5.2. Studying the Impact of M2M and SOS Traffics over H2H Traffic
To study the impact of M2M and SOS traffics over H2H traffic, we designed four scenarios:
5.2.1. Normal-Cycle Scenario:
This scenario represents a normal traffic during non-peak day hours or in rural areas.
The parameters for this scenario are:
- An arrival rate of M2M requests λM2M =10.
- Fixed H2H arrival rate are represented by λH2H = 5.
- An incremental arrival rate of SOS requests λSOS = 10.
While μM2M = 1, μH2H= 1 and μSOS = 1.
The results of the normal-cycle scenario are shown in Table 2.
When λM2M ≤ 10 and λSOS ≤ 10, the system is able to serve all M2M and H2H requests, because H2H arrivals, with λH2H = 5 and a service rate μH2H = 1, occupy an average of 5 resources from the 25 total resource and M2M arrivals with a service rate μM2M = 1 occupy 10 resources from the 25 total resources and (M2M and H2H) with a service rate μSOS = 1 occupy the 10 resources from the PRBs.
5.2.2. Dense-Area Scenario:
This scenario represents the heavy traffic during peak day hours or in the dense areas.
The parameters for this scenario are:
- An arrival rate of M2M requests λM2M =12
- Fixed H2H arrival rate are represented by λH2H = 5
- An incremental arrival rate of SOS requests λSOS = 12
While μM2M = 1, μH2H= 1 and μSOS = 1.
The results of the dense-area scenario are shown in Table 3.
5.2.3. Emergency-Case Scenario:
An emergency case scenario refers to an urgent situation that requires immediate action, such as a tsunami, a pandemic like COVID-19, or a terrorist attack.
The parameters for this scenario are:
- An arrival rate of M2M requests λM2M =16.
- Fixed H2H arrival rate are represented by λH2H = 5.
- An incremental arrival rate of SOS requests λSOS = 16.
While μM2M = 1, μH2H= 1 and μSOS = 1.
The results of the emergency-case scenario are shown in Table 4.
5.2.4. Worst-Case Scenario:
In this scenario, many M2M and H2H requests are synchronized in a way they form a huge traffic storm.
The parameters for this scenario are:
- An arrival rate of M2M requests λM2M =20.
- Fixed H2H arrival rate are represented by λH2H = 5.
- An incremental arrival rate of SOS requests λSOS = 20.
While μM2M = 1, μH2H= 1 and μSOS = 1.
The results of the worst-case scenario are shown in Table 5.
Figure 9 illustrates the degradation of SCR across various scenarios.
When 12 ≤ λM2M ≤ 16 and 12 ≤ λSOS ≤ 16 with a constant arrival rate λH2H = 5 a degradation on M2M, H2H service completion rates can be realized, because in our assumption, the total number of requests are more than available resources c = 25.At the peak (λM2M = 12 and λSOS = 12) , H2H requests are served (80%) , (80%) of M2M requests are served and SOS are served with a completion rate equal to 100% ,so we can conclude that 20% of the arrival rates of SOS were not served. When (λM2M = 16 and λSOS = 16) H2H requests are served (44%), (44%) of M2M and (100%) of SOS requests are served. When reaching the worst-case scenario, λM2M = λSOS = 20 and λH2H =5 a huge degradation in the arrival for M2M and H2H was detected.
5.3. Studying the Impact of H2H and SOS Traffic over M2M Traffic
To study the impact of H2H and SOS Traffic over M2M traffic, we designed four scenarios:
We consider a fixed arrival rate of M2M (λM2M =5) with an increasing arrival rate for both H2H and SOS.
- A fixed arrival rate of M2M requests λM2M = 5.
- An incremental H2H arrival rate are represented by 2 < λH2H < 20.
- An incremental arrival rate of SOS requests 2 < λSOS < 20.
While μM2M = 1, μH2H= 1 and μSOS = 1.
5.3.1. Normal-Cycle Scenario:
This scenario represents a normal traffic during non-peak day hours or in the rural areas.
The parameters for this scenario are:
- A fixed arrival rate of M2M requests λM2M = 5.
- H2H arrival rate are represented by λH2H = 10.
- SOS requests λSOS = 10.
While μM2M = 1, μH2H= 1 and μSOS = 1.
The results of the normal-cycle scenario are shown in Table 6.
When λH2H ≤ 10 and λSOS ≤ 10, the system is able to serve all M2M and H2H requests, because H2H arrivals, with λM2M= 5 and a service rate μM2M = 1, occupy an average of 5 resources from the 25 total resource and H2H arrivals with a service rate μH2H = 1 occupy 10 resources from the 25 total resources and SOS with a service rate μSOS = 1 occupy the 10 resources from the resources block.
5.3.2. Dense-Area Scenario:
This scenario represents the heavy traffic during peak day hours or in the dense areas.
The parameters for this scenario are:
- An arrival rate of M2M requests λM2M = 5.
- H2H arrival rate are represented by λH2H = 16.
- An incremental arrival rate of SOS requests λSOS = 16.
While μM2M = 1, μH2H= 1 and μSOS = 1.
The results of the dense-area scenario are shown in Table 7.
5.3.3. Emergency-Case Scenario:
An emergency case scenario refers to an urgent situation that requires immediate action, such as a tsunami, a pandemic like COVID-19, or a terrorist attack.
The parameters for this scenario are:
- An arrival rate of M2M requests λM2M = 5.
- H2H arrival rate are represented by λH2H = 16.
- An incremental arrival rate of SOS requests λSOS = 16.
While μM2M = 1, μH2H= 1 and μSOS = 1.
The results of the emergency-case scenario are shown in Table 8.
5.3.4. Worst-Case Scenario:
In this scenario, many M2M and H2H requests are synchronized in a way they form a huge traffic storm.
The parameters for this scenario are:
- An arrival rate of M2M requests λM2M = 5
- H2H arrival rate are represented by λH2H = 20
- An incremental arrival rate of SOS requests λSOS = 20
While μM2M = 1, μH2H= 1 and μSOS = 1.
The results of the worst-case scenario are shown in Table 9.
Figure 10. illustrates the degradation of SCR across various scenarios.
When 12 ≤ λH2H ≤ 16 and 12 ≤ λSOS ≤ 16 with a constant arrival rate λM2M=5 a degradation on M2M, H2H service completion rates can be realized, because in our assumption, the total number of requests are more than available resources c = 25.At the peak (λH2H = 12 and λSOS = 12), H2H requests are served (80%), (80%) of M2M requests are served and SOS are served with a completion rate equal to 100%, so we can conclude that 20% of the arrival rates of (M2M,H2H) were not served. When (λH2H = 16 and λSOS = 16) H2H requests are served (44%), (44%) of M2M and (100%) of SOS requests are served. When reaching the worst–case scenario, λH2H = λSOS = 20 and λM2M = 5 a huge degradation in the arrival for M2M and H2H was detected.
6. Conclusions
In this paper, we began to research LPWAN and LTE technologies while spotting on their challenges especially during disaster events. We show that a huge degradation over M2M and H2H traffic will cause many people to be endanger because of the lack of connectivity with rescue centers. Therefore, we propose a SOS traffic that bridge this critical gap. We create a CTMC to characterize H2H, M2M and SOS traffic. After applying many scenarios, we end-up with analytical results. Then, we simulated similar scenarios using Simulink while presenting many empirical results. In both mathematical and empirical results, we realized that H2H and M2M traffics were being affected badly by the increase number of SOS requests. To solve this problem, we applied the highest priority for SOS traffic over M2M and H2H traffic.
In the worst-case situation, only 20% of M2M and H2H traffic might be handled by using this approach, however, 100% of SOS traffic is served. As a result, we can prevent the anticipated shortage of SOS alerts during crucial events, saving many lives and preventing people from being abandoned.
In our future work, we tend to improve the QoS for H2H and M2M traffic while maintain the best quality for the SOS traffic by assigning appropriate priorities to all traffic. Additionally, we will add the functionality of a queue when the system reach its capacity.
Author Contributions
Conceptualization, A.H.E.F., S.C., and A.M.; methodology, A.H.E.F., S.C., and A.M.; software, A.H.E.F. and S.C.; validation, A.H.E.F., S.C., and A.M.; formal analysis, A.H.E.F., S.C., and A.M.; investigation, A.H.E.F., S.C., N.A.I, and A.M.; resources, A.H.E.F. and S.C.; data curation, A.H.E.F., S.C., N.A.I, and A.M.; writing—original draft preparation, A.H.E.F. and S.C.; writing—review and editing, A.H.E.F., S.C., N.A.I, A.M. and H.E.G.; visualization, A.H.E.F., S.C., N.A.I, and A.M.; supervision, A.M.; project administration, A.M.; funding acquisition, A.M. All authors have read and agreed to the published version of the manuscript.
Funding
This research received no external funding.
Data Availability Statement
Data are contained within the article.
Acknowledgments
The authors would like to thank Hussein Barakat from the Lebanese University (UL) for his great help in the planning, programming, and implementation of different scenarios.
Conflicts of Interest
The authors declare no conflicts of interest.
References
- R. Bajaj, M. Rao, and H. Agrawal, "Internet of Things (IoT) in the Smart Automotive Sector: A Review," in Proc. Int. Conf. on Internet of Things (IoT), 2018. Available: https://api.semanticscholar.org/CorpusID:212683182.
- Y. Mehmood, F. Ahmad, I. Yaqoob, A. Adnane, M. Imran, and S. Guizani, "Internet-of-Things-Based Smart Cities: Recent Advances and Challenges", IEEE Commun. Mag., vol. 55, no. 9, pp. 16–24, 2017. [CrossRef]
- H. El Fawal, M. Najem, A. Mansour, F. Le Roy, and D. Le Jeune, "CTMC modelling for H2H/M2M coexistence in LTE-A/LTE-M networks", J. Eng., vol. 2018, no. 12, pp. 1954–1962, Dec. 2018. [CrossRef]
- D. Aragao, D. Vieira, and M. F. de Castro, "A mechanism to control the congestion in machine-to-machine communication in LTE-A networks", in 2017 IEEE Symposium on Computers and Communications (ISCC), Heraklion, Greece, 2017, pp. 794–797. [CrossRef]
- J. Choi, "On the Adaptive Determination of the Number of Preambles in RACH for MTC," in IEEE Communications Letters, vol. 20, no. 7, pp. 1385-1388, July 2016. [CrossRef]
- Competition Remains Fierce in the Wireless IoT Connectivity Market as LPWA Networks Reach 5.3 Billion Connections in 2030, ABI Research, 31 May 2023. https://www.abiresearch.com/press/competition-remains-fierce-in-the-wireless-iot-connectivity-market-as-lpwa-networks-reach-53-billion-connections-in-2030/. Accessed: 13-Aug-2024.
- F. Ghavimi and H. -H. Chen, "M2M Communications in 3GPP LTE/LTE-A Networks: Architectures, Service Requirements, Challenges, and Applications", in IEEE Communications Surveys & Tutorials, vol. 17, no. 2, pp. 525-549, Second quarter 2015. [CrossRef]
- P. K. Verma, R. Verma, A. Prakash, A. Agrawal, K. Naik, R. Tripathi, M. Alsabaan, T. Khalifa, T. Abdelkader, and A. Abogharaf, "Machine-to-Machine (M2M) Communications: A Survey,"Journal of Network and Computer Applications", vol. 66, pp. 83-105, Mar. 2016. [CrossRef]
- H. El Fawal, Machine-to-machine communication congestion mechanism (Doctoral dissertation), August 2019.
- L. Tello Oquendo, V. Pla, I. Leyva-Mayorga, and L. Guijarro, "Efficient Random Access Channel Evaluation and Load Estimation in LTE-A with Massive MTC,"IEEE Transactions on Vehicular Technology", no. 99, pp. 1-1, Dec. 2018. [CrossRef]
- 3GPP - Release 13 analytical view version Sept. 9th (2015), Accessed: 12-Aug-2024. [Online]. Available: http://www.3gpp.org/release-13.
- S. A. El-Hameed and K. M. F. Elsayed, "A Q-learning approach for machine-type communication random access in LTE-Advanced," Telecommunication Systems, vol. 71, no. 4, pp. 559-573, Jul. 2019. [CrossRef]
- NOKIA, LTE evolution for IoT connectivity, (n.d.). Retrieved February 14, 2017, from http://resources.alcatel-lucent.com/asset/200178.
- S. A. AlQahtani, "Delay-Aware Resource Allocation for M2M Communications Over LTE-A Networks", Arab. J. Sci. Eng., vol. 44, no. 4, pp. 3639–3653, Apr. 2019. [CrossRef]
- Semhan, A. H. El Fawal, M. A. Uddin, A. Mansour, M. Najem, "The Impact of Healthcare Traffic over H2H and M2M Networks during the Spread Phase of a Pandemic Disease", Journal of Engineering Research, Dec. 2022. [CrossRef]
- S. Paramita, H. N. D. Bebartta, and P. Pattanayak, "IoT Based Healthcare Monitoring System Using 5G Communication and Machine Learning Models," in Health Informatics: A Computational Perspective in Healthcare, R. Patgiri, A. Biswas, and P. Roy, Eds., vol. 932, Singapore: Springer, 2021, pp. 193–206. [CrossRef]
- Ahmad, S. N. K. Marwat, Y. Zaki and C. Goerg, "Tailoring LTE-Advanced for M2M Communication using Wireless Inband Relay Node," WTC 2014; World Telecommunications Congress 2014, Berlin, Germany, 2014, pp. 1-3.
- H. EL Fawal, A. Mansour, M. Najem, F. L. Roy and D. Le Jeune, "CTMC Modeling for M2M/H2H Coexistence in a NB-IoT Adaptive eNodeB," 2018 IEEE International Conference on Internet of Things (iThings), Halifax, NS, Canada, 2018, pp. 1-8. [CrossRef]
- S. P. Eswaran and J. Bapat, "Service Centric Markov Based Spectrum Sharing for Internet of Things (IoT)," 2015 IEEE Region 10 Symposium, Ahmedabad, India, 2015, pp. 9-12. [CrossRef]
- N. I. Osman and E. B. Abbas, "Simulation and Modelling of LoRa and Sigfox Low Power Wide Area Network Technologies," 2018 International Conference on Computer, Control, Electrical, and Electronics Engineering (ICCCEEE), Khartoum, Sudan, 2019, pp. 1-5. [CrossRef]
- M. Centenaro, L. Vangelista, A. Zanella, and M. Zorzi, "Long-Range Communications in Unlicensed Bands: The Rising Stars in the IoT and Smart City Scenarios," IEEE Wireless Communications, vol. 23, no. 5, pp. 60–67, Oct. 2016. [CrossRef]
- N. I. Osman and E. B. Abbas, "Simulation and Modelling of LoRa and Sigfox Low Power Wide Area Network Technologies," 2018 International Conference on Computer, Control, Electrical, and Electronics Engineering (ICCCEEE), Khartoum, Sudan, 2018, pp. 1-5. [CrossRef]
- S. Alqahtani, “Performance analysis of cognitive-based radio resource allocation in multi-channel LTE-A networks with M2M/H2H coexistence,” IET Communications, 2017, vol. 11, no. 5, pp. 655–663.
Figure 1.
SOS Traffic in M2M Domains.
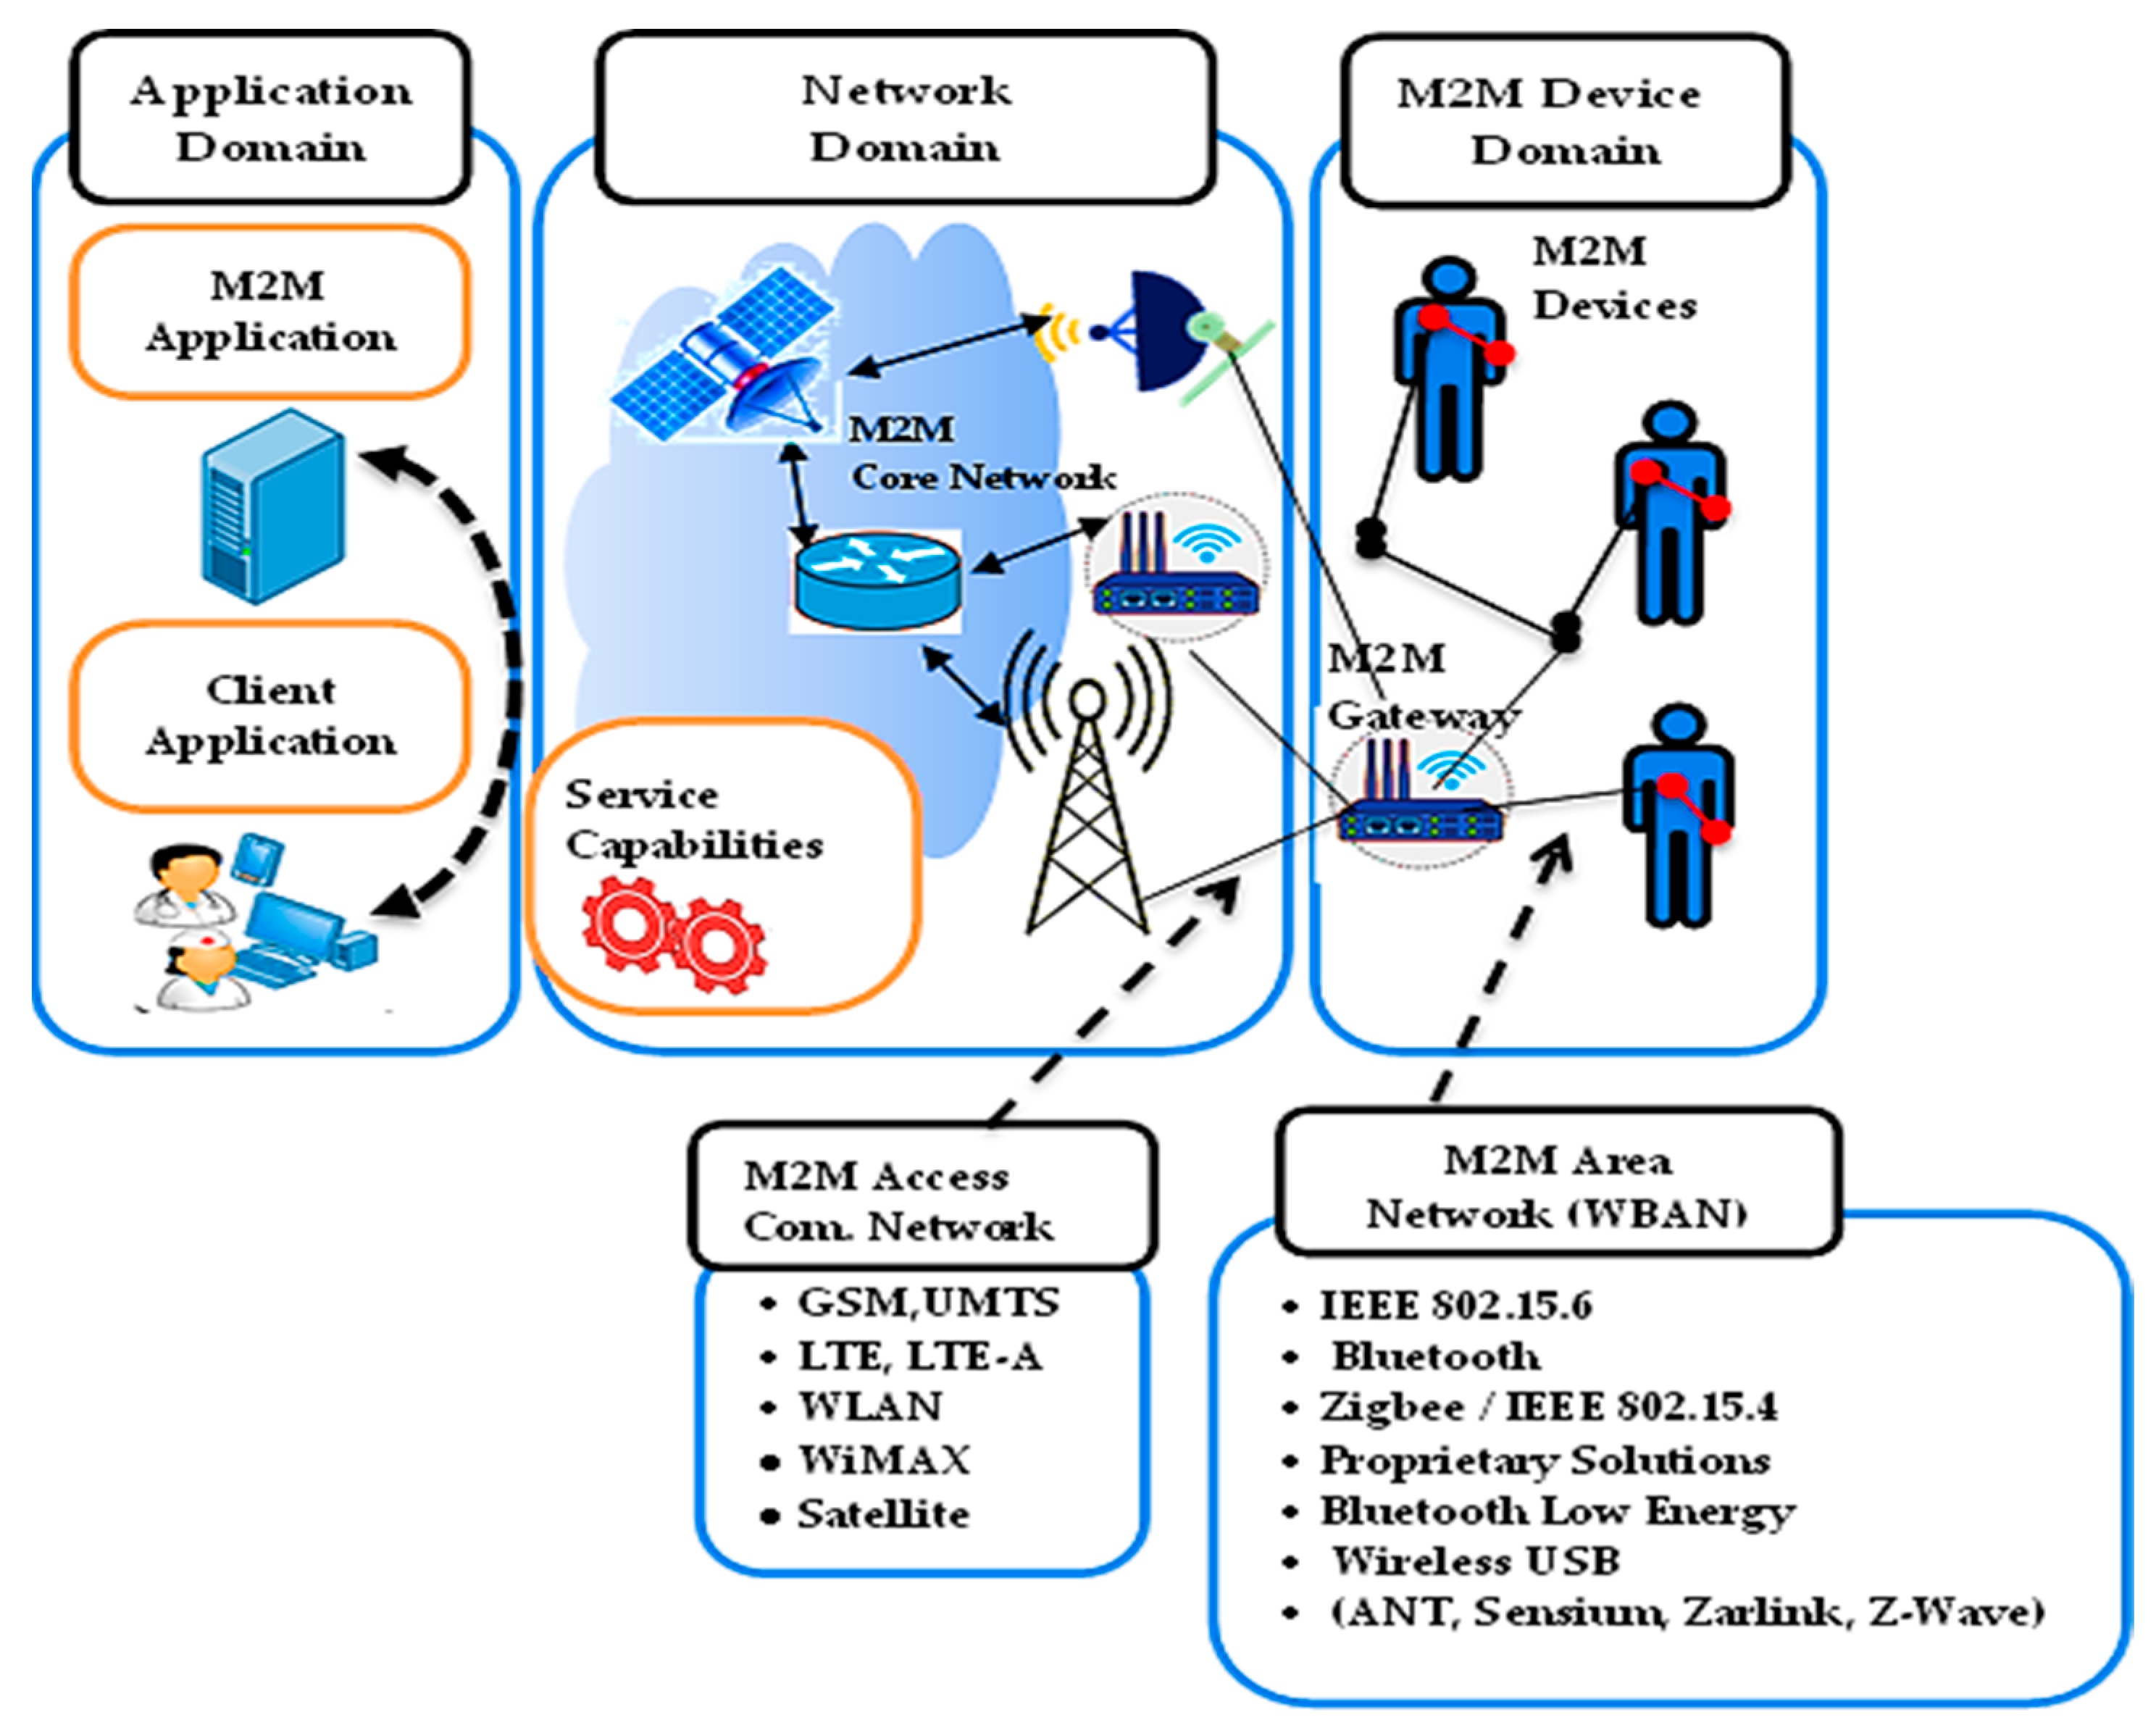
Figure 2.
CTMC model for C=3; Where “C” is the number of resource blocks available in the network; “S(i,j)” are the states in each phase, “i” represents the number of ongoing M2M services, and ”j” represents the number of ongoing H2H services.
Figure 2.
CTMC model for C=3; Where “C” is the number of resource blocks available in the network; “S(i,j)” are the states in each phase, “i” represents the number of ongoing M2M services, and ”j” represents the number of ongoing H2H services.
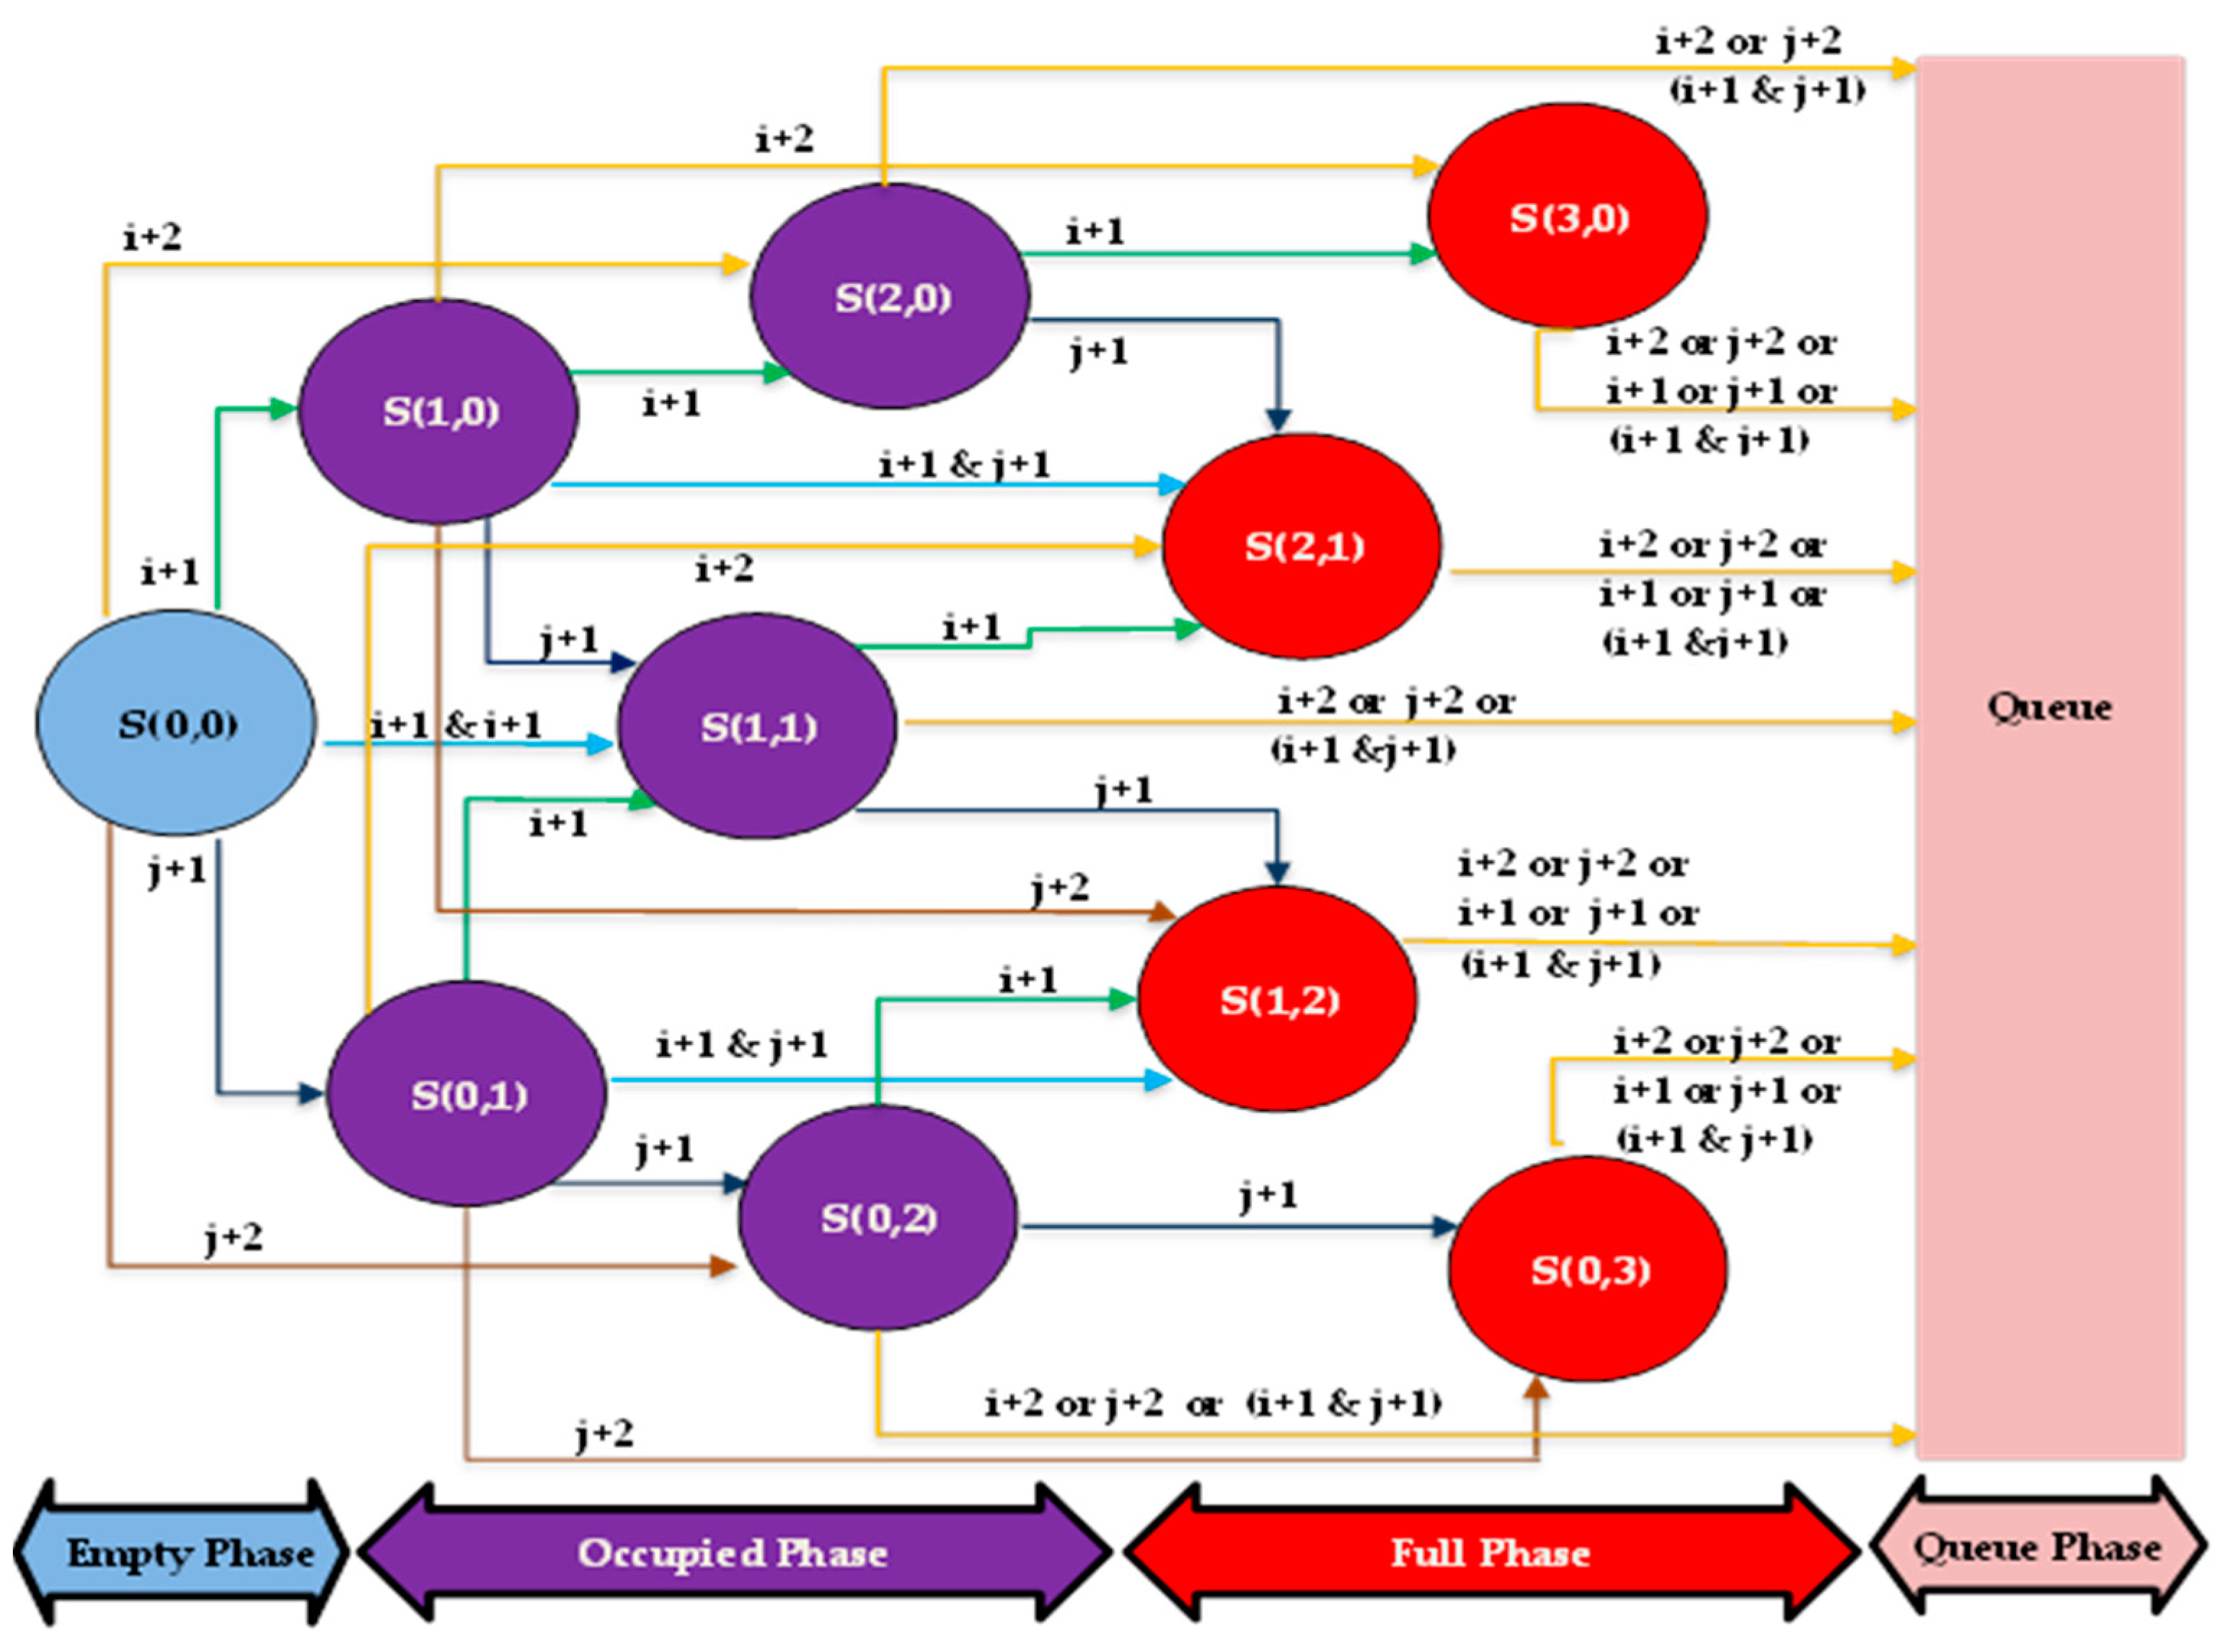
Figure 3.
Transitioning example from S(0,0) in the “Empty Phase” to different states in the “Occupied Phase”; “S(i,j)” represents different states; where “i” is the number of ongoing M2M services and “j” is the number of ongoing H2H services.
Figure 3.
Transitioning example from S(0,0) in the “Empty Phase” to different states in the “Occupied Phase”; “S(i,j)” represents different states; where “i” is the number of ongoing M2M services and “j” is the number of ongoing H2H services.
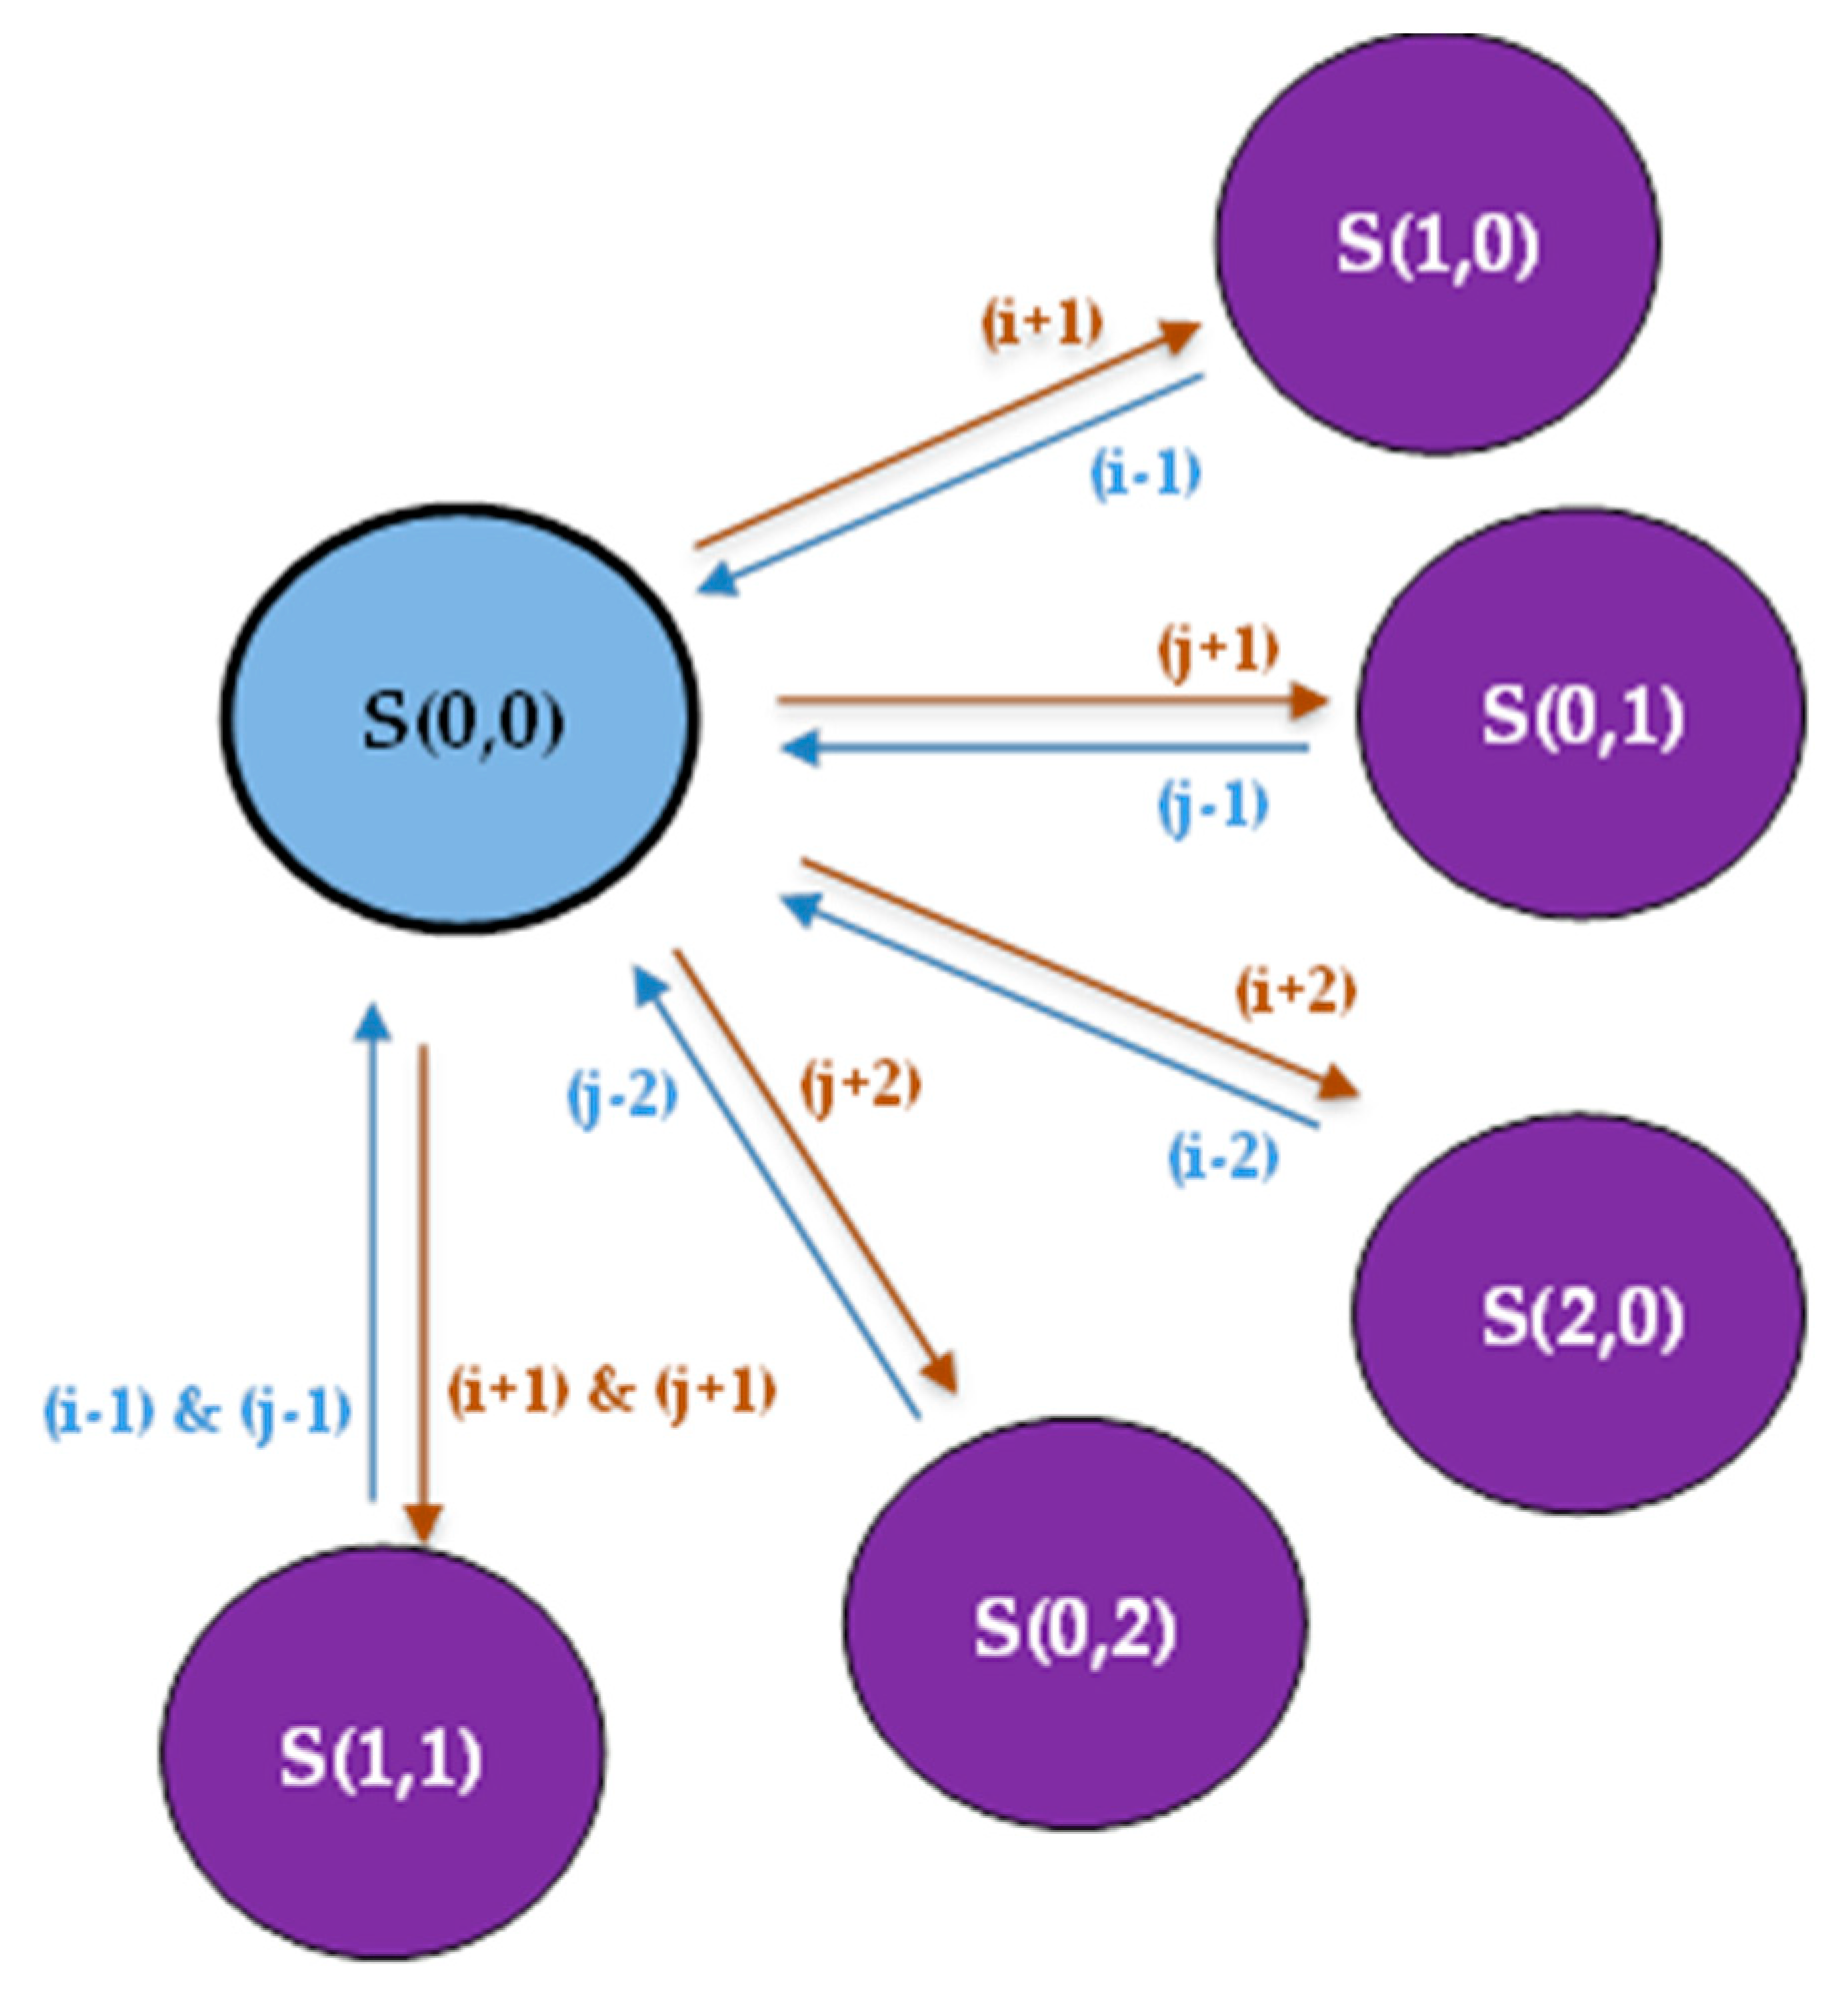
Figure 4.
Transitioning example from S(1,0) in the “Occupied Phase” to different states in the “Empty Phase” and the “Full Phase”; “S(i,j)” represents different states; where “i” is the number of ongoing M2M services and “j” is the number of ongoing H2H services.
Figure 4.
Transitioning example from S(1,0) in the “Occupied Phase” to different states in the “Empty Phase” and the “Full Phase”; “S(i,j)” represents different states; where “i” is the number of ongoing M2M services and “j” is the number of ongoing H2H services.
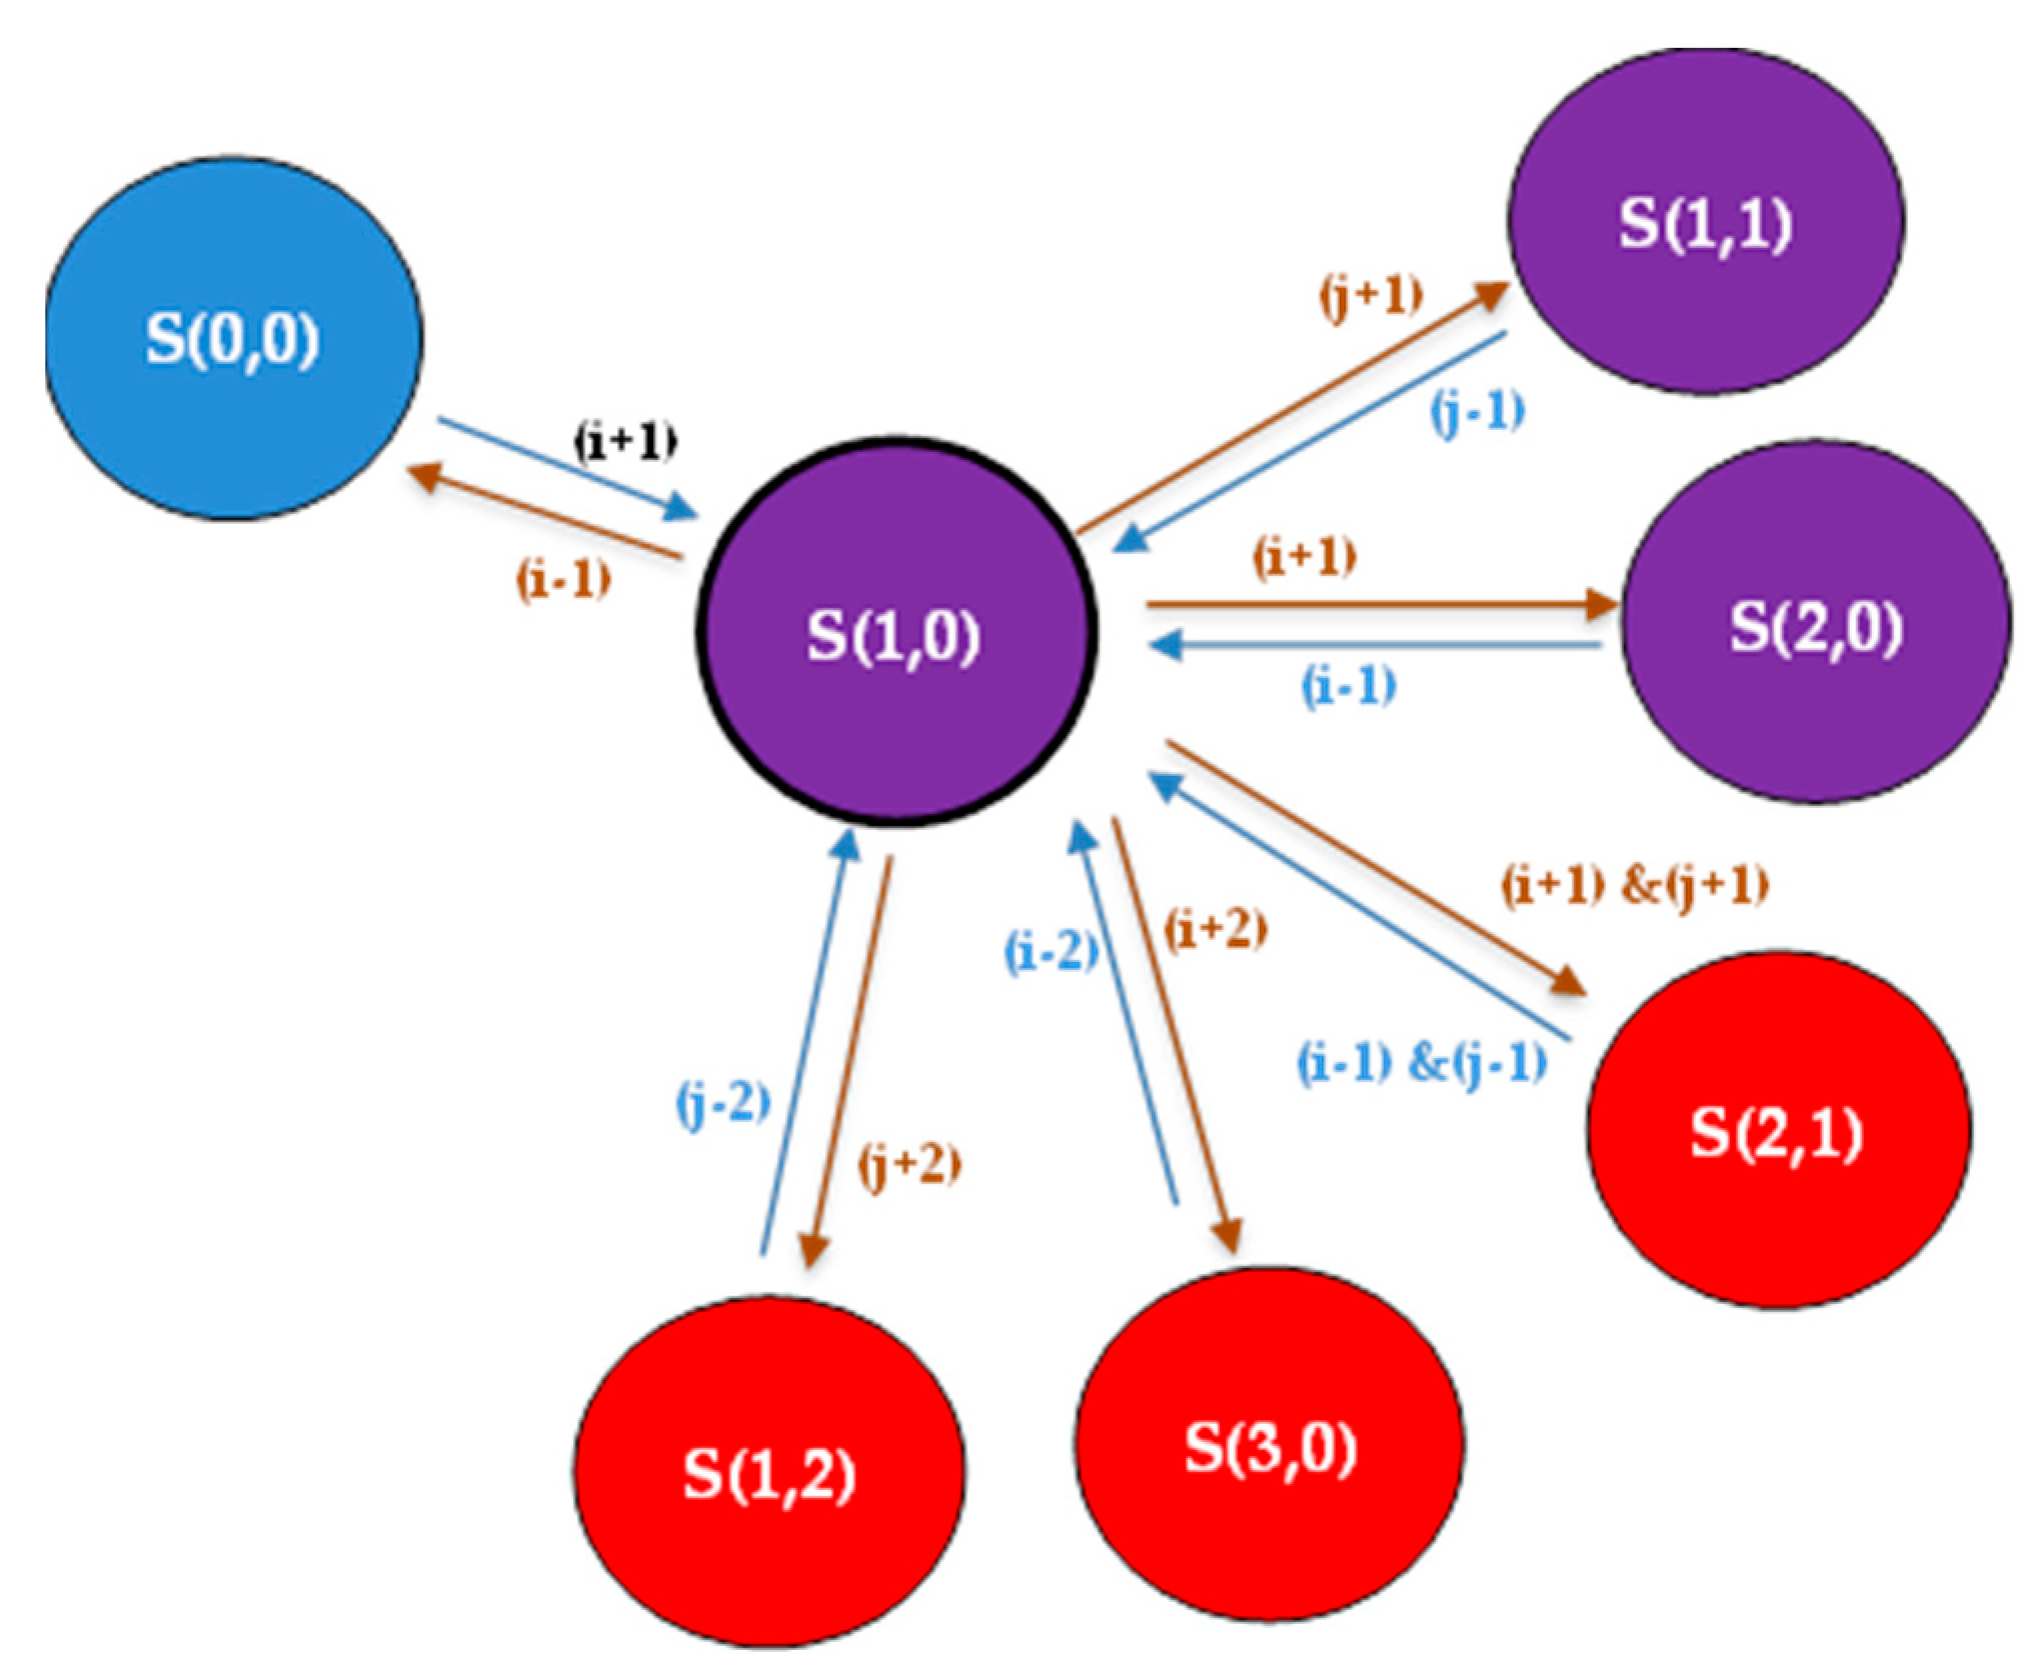
Figure 5.
Transitioning example from S(1,2) in the “Full Phase” to different states in the “Occupied Phase”; “S(i,j)” represents different states; where “i” is the number of ongoing M2M services and “j” is the number of ongoing H2H services.
Figure 5.
Transitioning example from S(1,2) in the “Full Phase” to different states in the “Occupied Phase”; “S(i,j)” represents different states; where “i” is the number of ongoing M2M services and “j” is the number of ongoing H2H services.
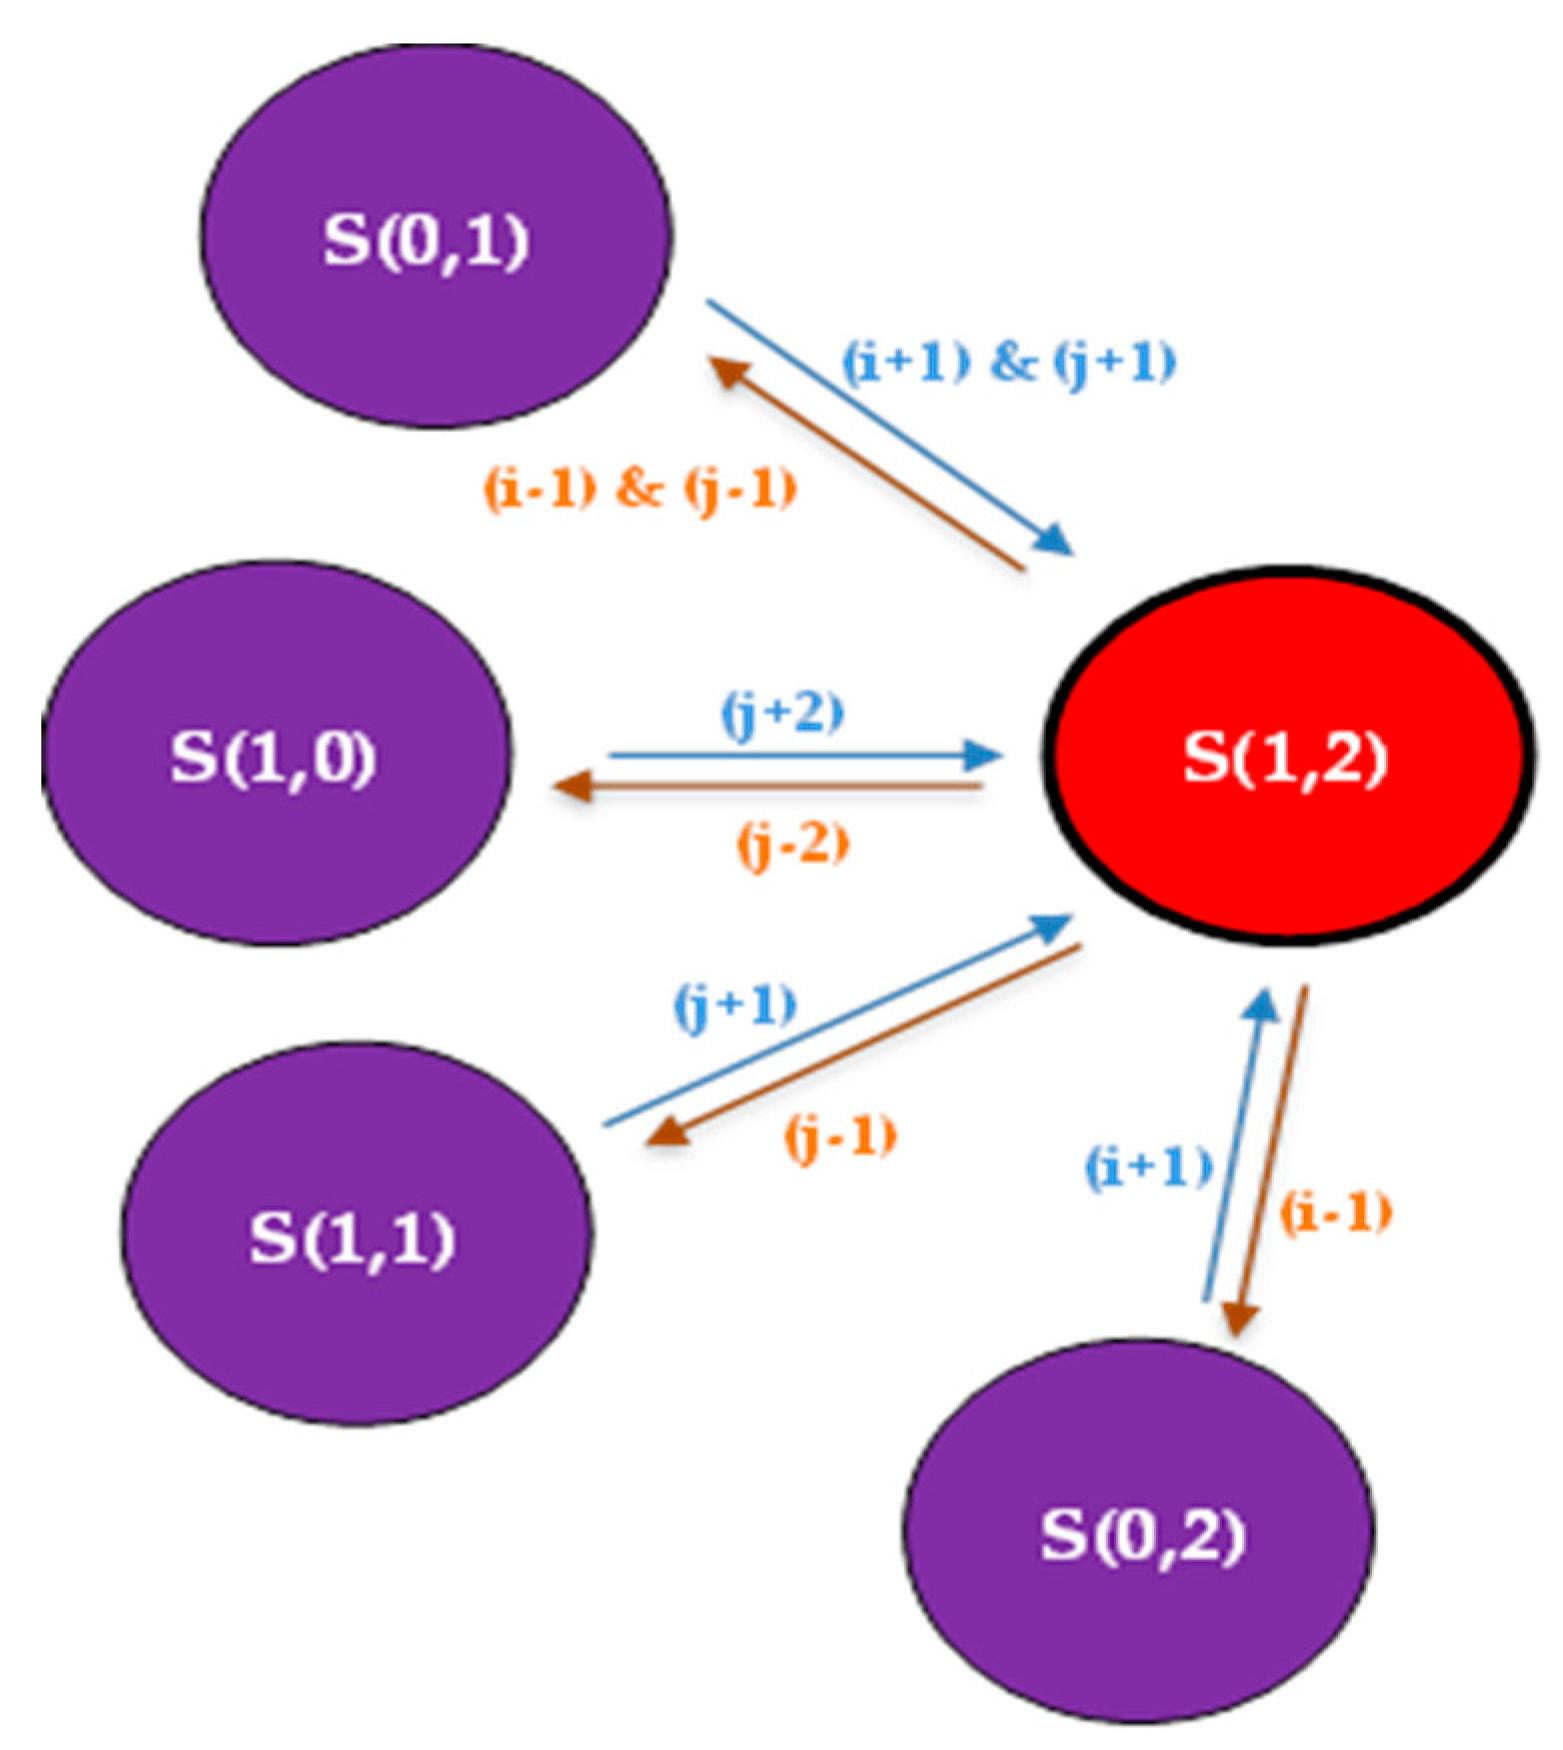
Figure 6.
Normal-cycle scenario results; where: S(0,0) represent the initial state, S(0,1) represents one H2H request only, S(0,2) is the state with two H2H requests, S(0,3) represents three H2H request. While S(1,0) represents one M2M request only, S(2,0) is the state with two M2M requests, S(3,0) represents three M2M requests. Moreover, S(1,1) is the state that contains one request M2M and one H2H, S(1,2) represents the arrival of one M2M request and two H2H requests, S(2,1) represents the arrival of two M2M requests and one H2H request.
Figure 6.
Normal-cycle scenario results; where: S(0,0) represent the initial state, S(0,1) represents one H2H request only, S(0,2) is the state with two H2H requests, S(0,3) represents three H2H request. While S(1,0) represents one M2M request only, S(2,0) is the state with two M2M requests, S(3,0) represents three M2M requests. Moreover, S(1,1) is the state that contains one request M2M and one H2H, S(1,2) represents the arrival of one M2M request and two H2H requests, S(2,1) represents the arrival of two M2M requests and one H2H request.
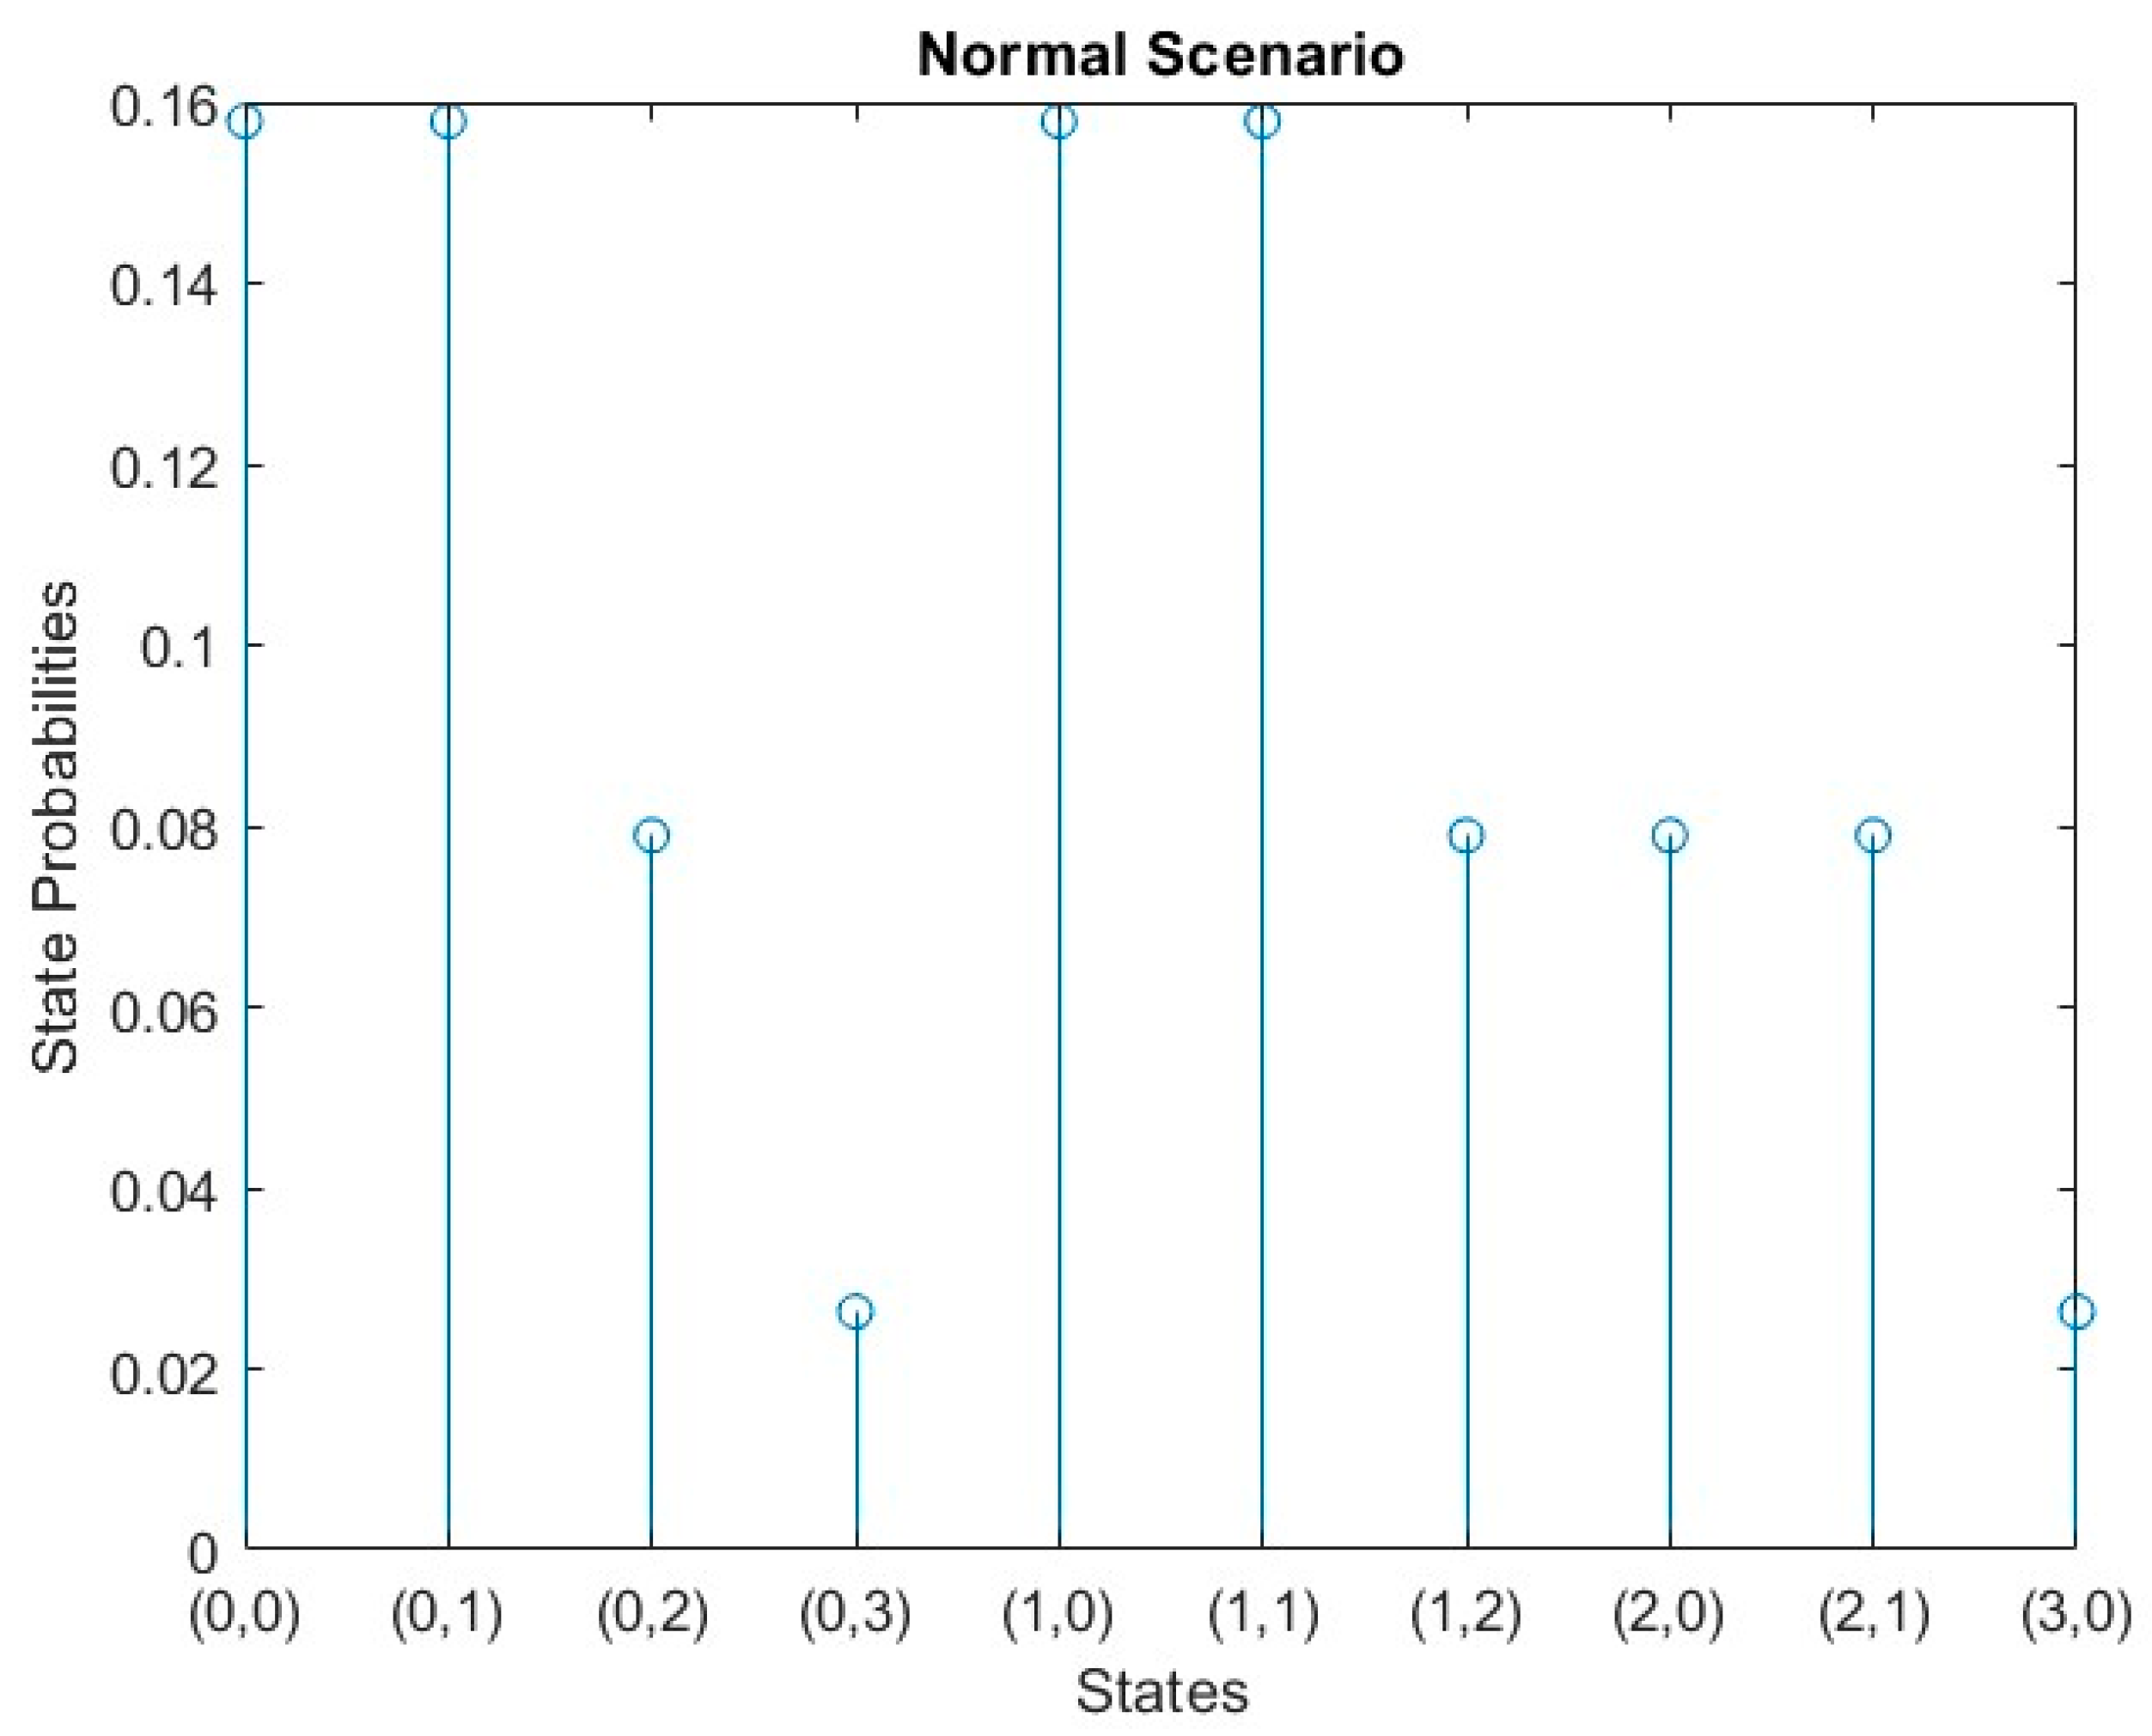
Figure 7.
Dense-area scenario results; where: S(0,0) represent the initial state, S(0,1) represents one H2H request only, S(0,2) is the state with two H2H requests, S(0,3) represents three H2H request. While S(1,0) represents one M2M request only, S(2,0) is the state with two M2M requests, S(3,0) represents three M2M requests. Moreover, S(1,1) is the state that contains one request M2M and one H2H, S(1,2) represents the arrival of one M2M request and two H2H requests, S(2,1) represents the arrival of two M2M requests and one H2H request.
Figure 7.
Dense-area scenario results; where: S(0,0) represent the initial state, S(0,1) represents one H2H request only, S(0,2) is the state with two H2H requests, S(0,3) represents three H2H request. While S(1,0) represents one M2M request only, S(2,0) is the state with two M2M requests, S(3,0) represents three M2M requests. Moreover, S(1,1) is the state that contains one request M2M and one H2H, S(1,2) represents the arrival of one M2M request and two H2H requests, S(2,1) represents the arrival of two M2M requests and one H2H request.
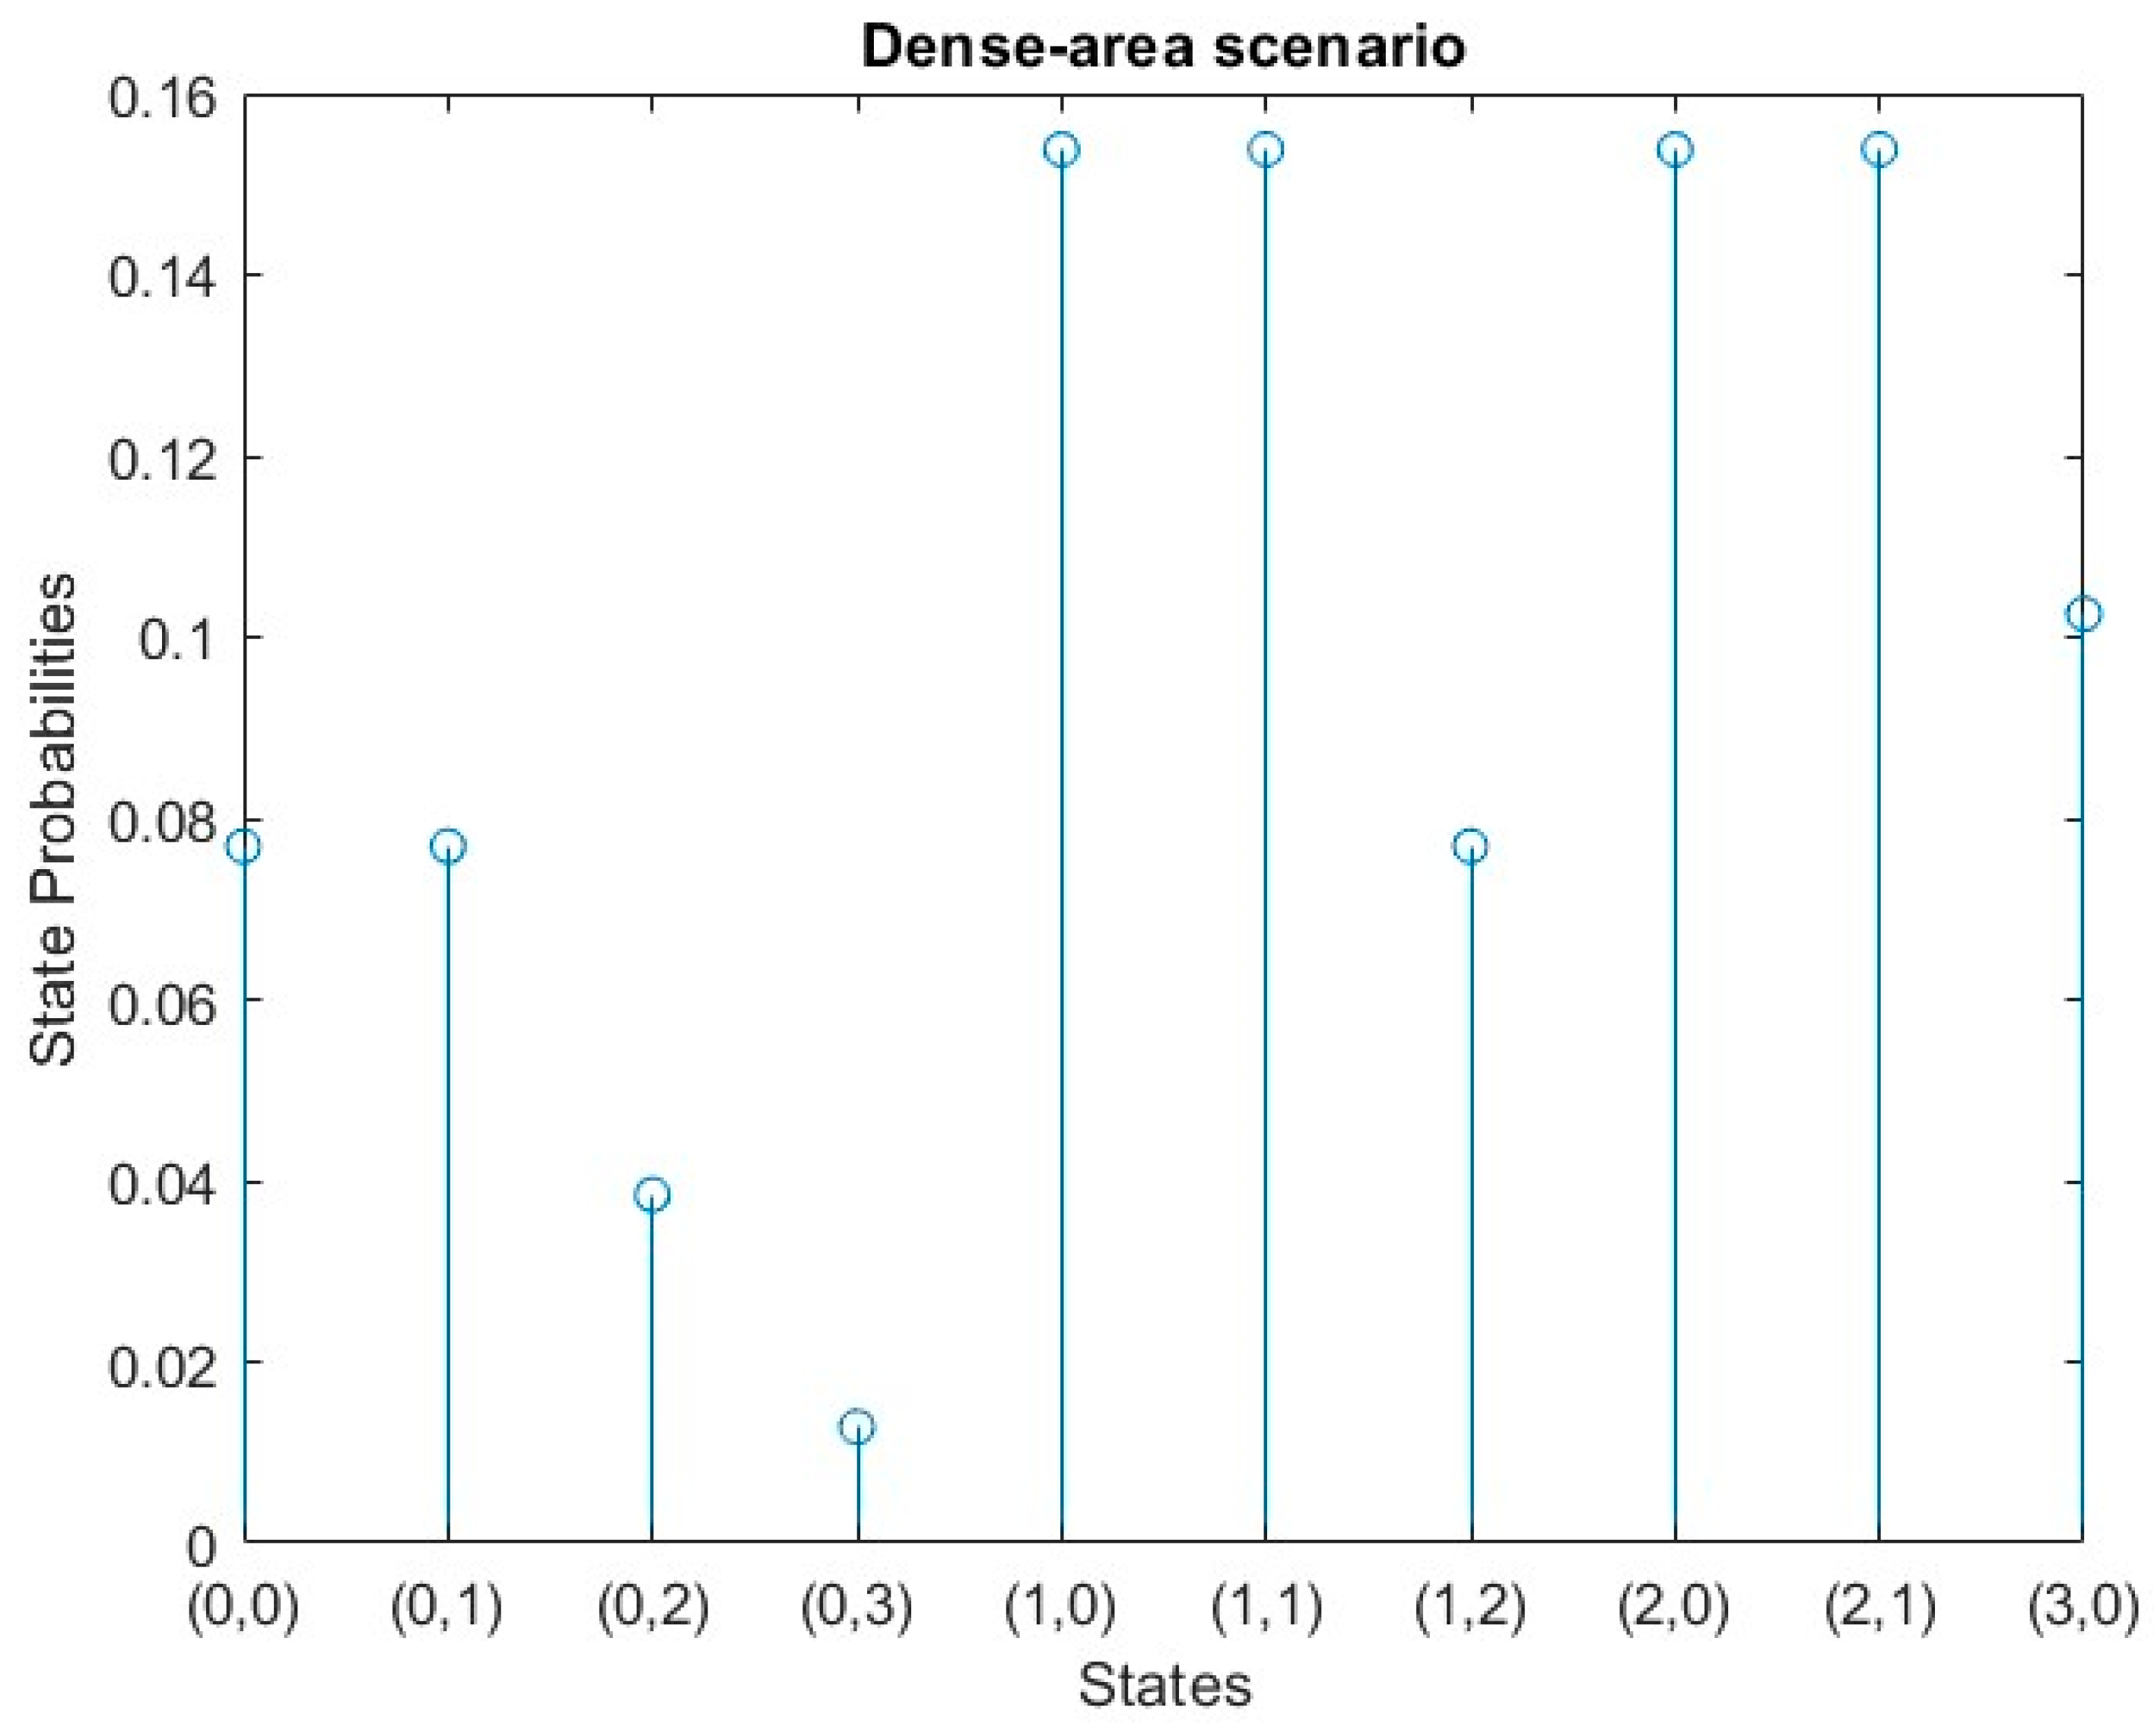
Figure 8.
Worst-case scenario results; where: S(0,0) represent the initial state, S(0,1) represents one H2H request only, S(0,2) is the state with two H2H requests, S(0,3) represents three H2H request. While S(1,0) represents one M2M request only, S(2,0) is the state with two M2M requests, S(3,0) represents three M2M requests. Moreover, S(1,1) is the state that contains one request M2M and one H2H, S(1,2) represents the arrival of one M2M request and two H2H requests, S(2,1) represents the arrival of two M2M requests and one H2H request.
Figure 8.
Worst-case scenario results; where: S(0,0) represent the initial state, S(0,1) represents one H2H request only, S(0,2) is the state with two H2H requests, S(0,3) represents three H2H request. While S(1,0) represents one M2M request only, S(2,0) is the state with two M2M requests, S(3,0) represents three M2M requests. Moreover, S(1,1) is the state that contains one request M2M and one H2H, S(1,2) represents the arrival of one M2M request and two H2H requests, S(2,1) represents the arrival of two M2M requests and one H2H request.
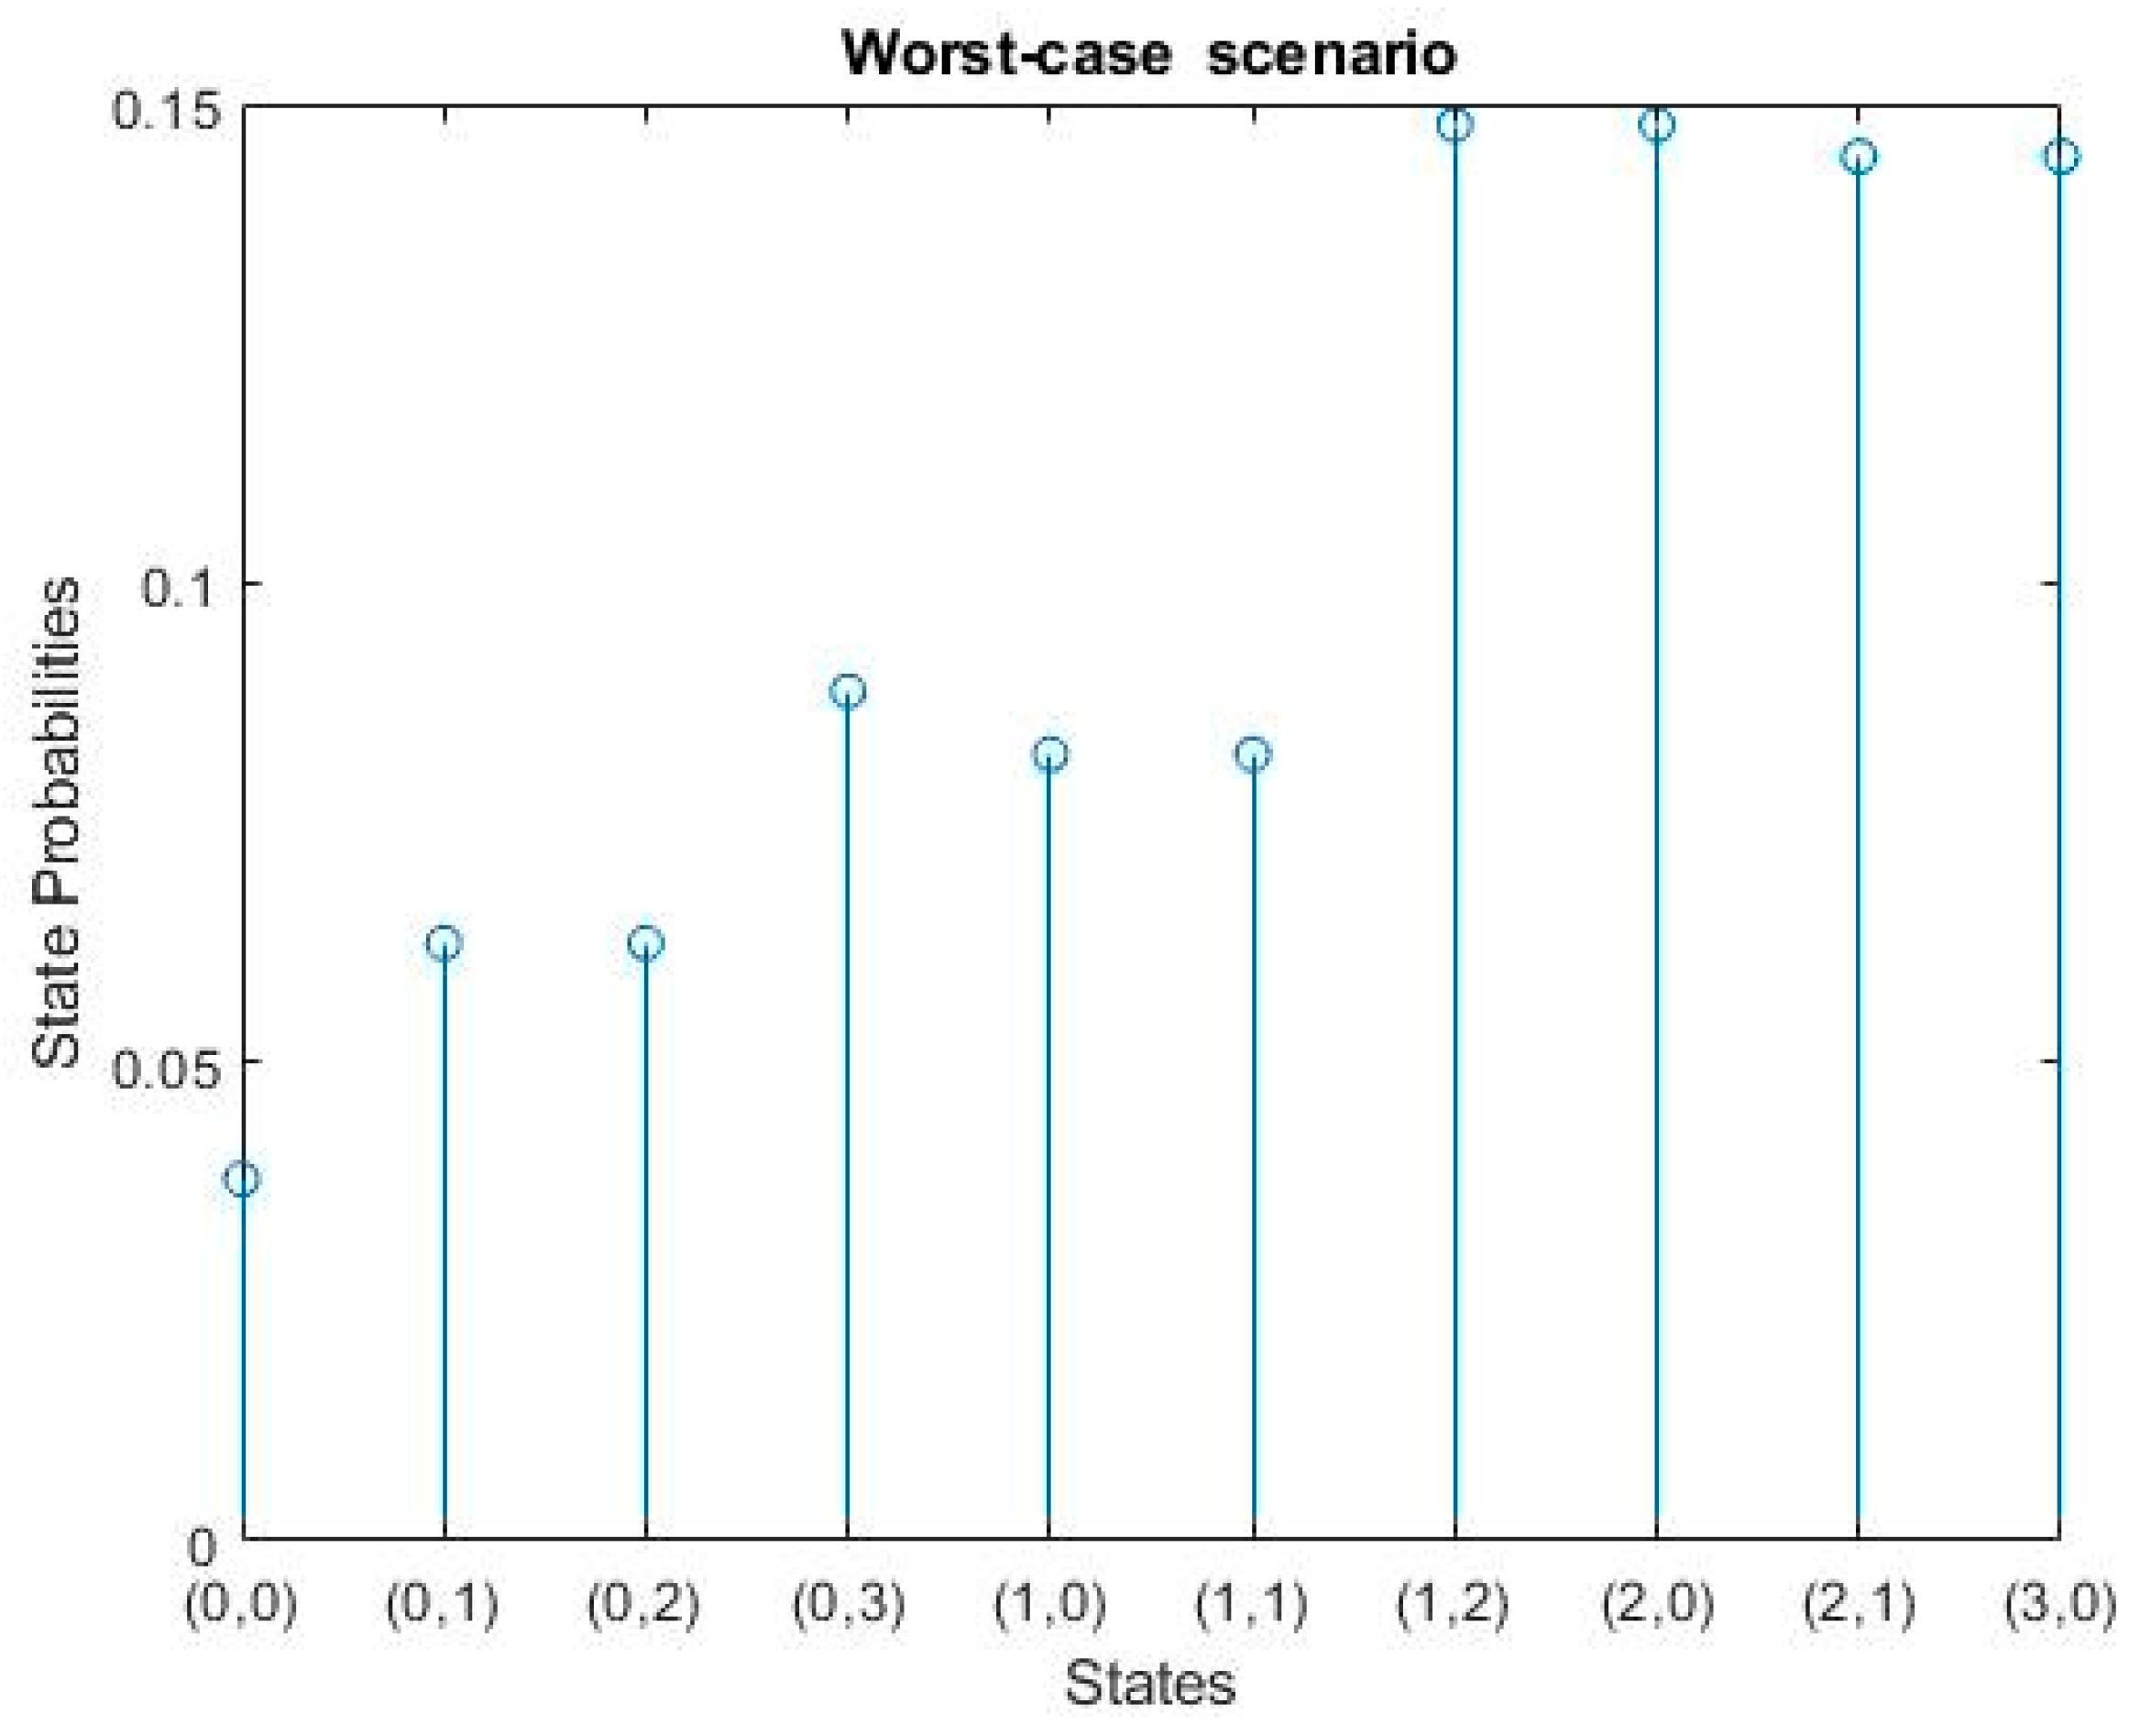
Figure 9.
The impact of M2M and SOS traffics over H2H traffic in different scenarios.
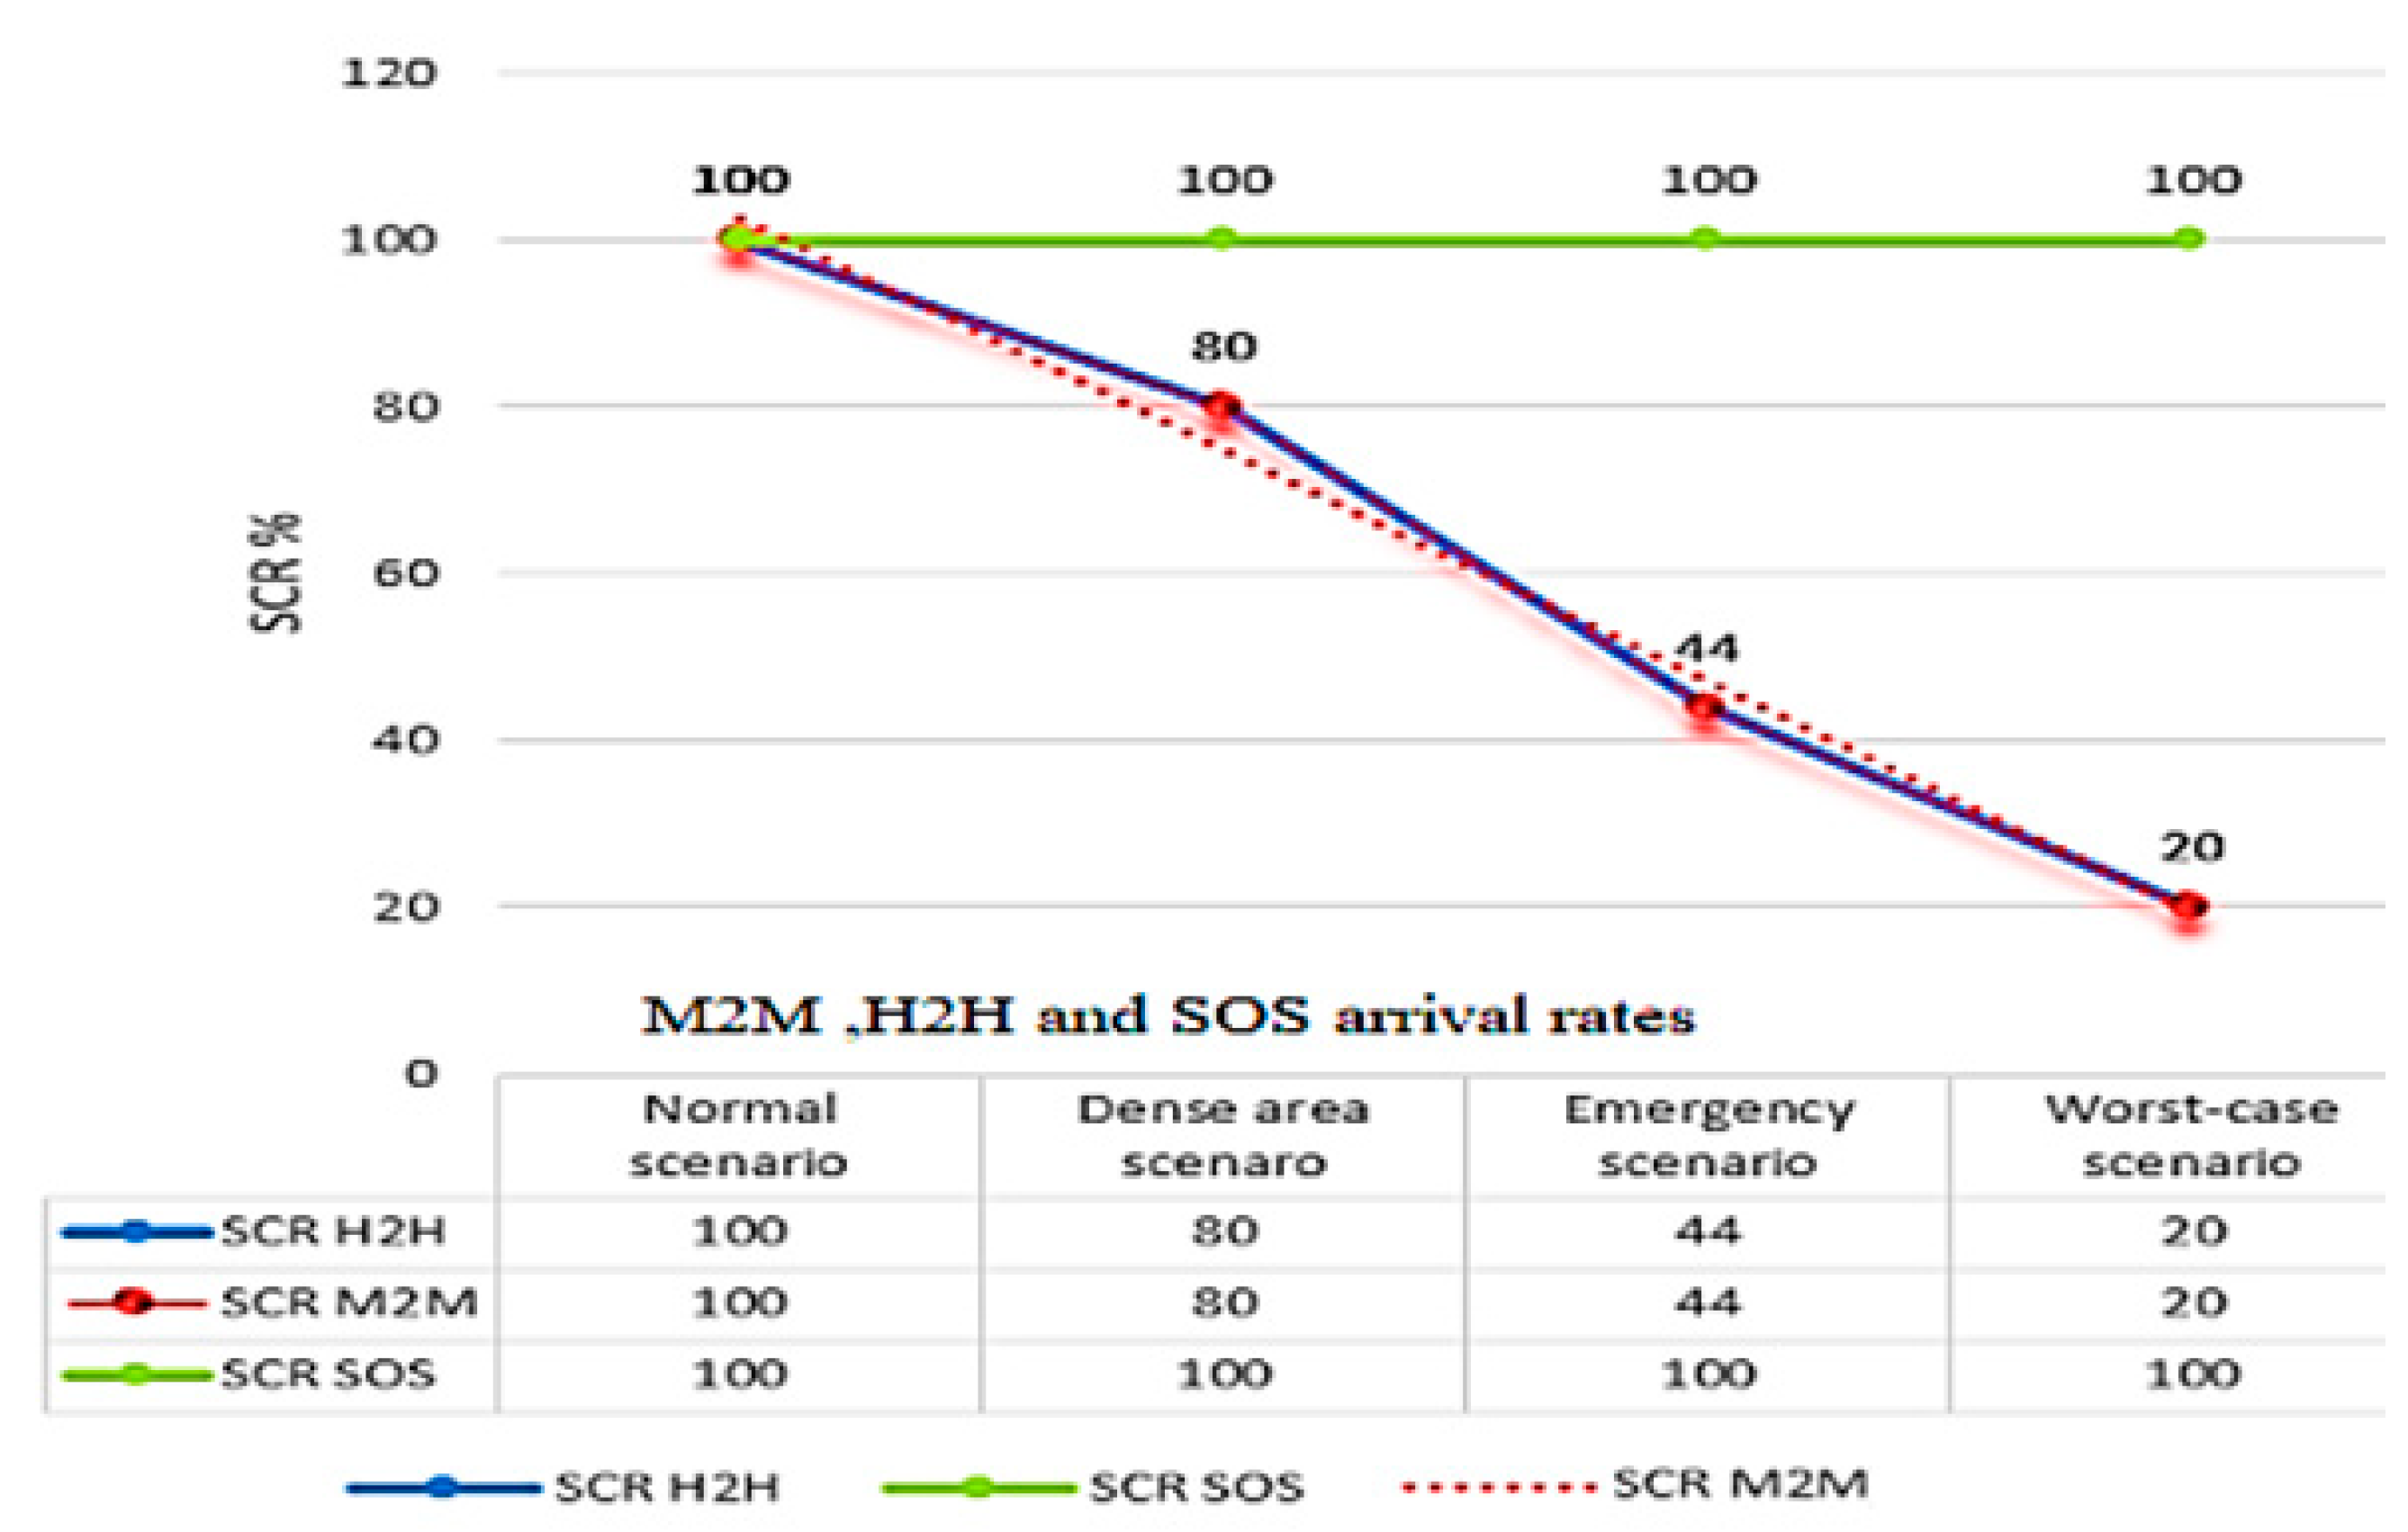
Figure 10.
The impact of H2H and SOS Traffic over M2M traffic in different scenarios.
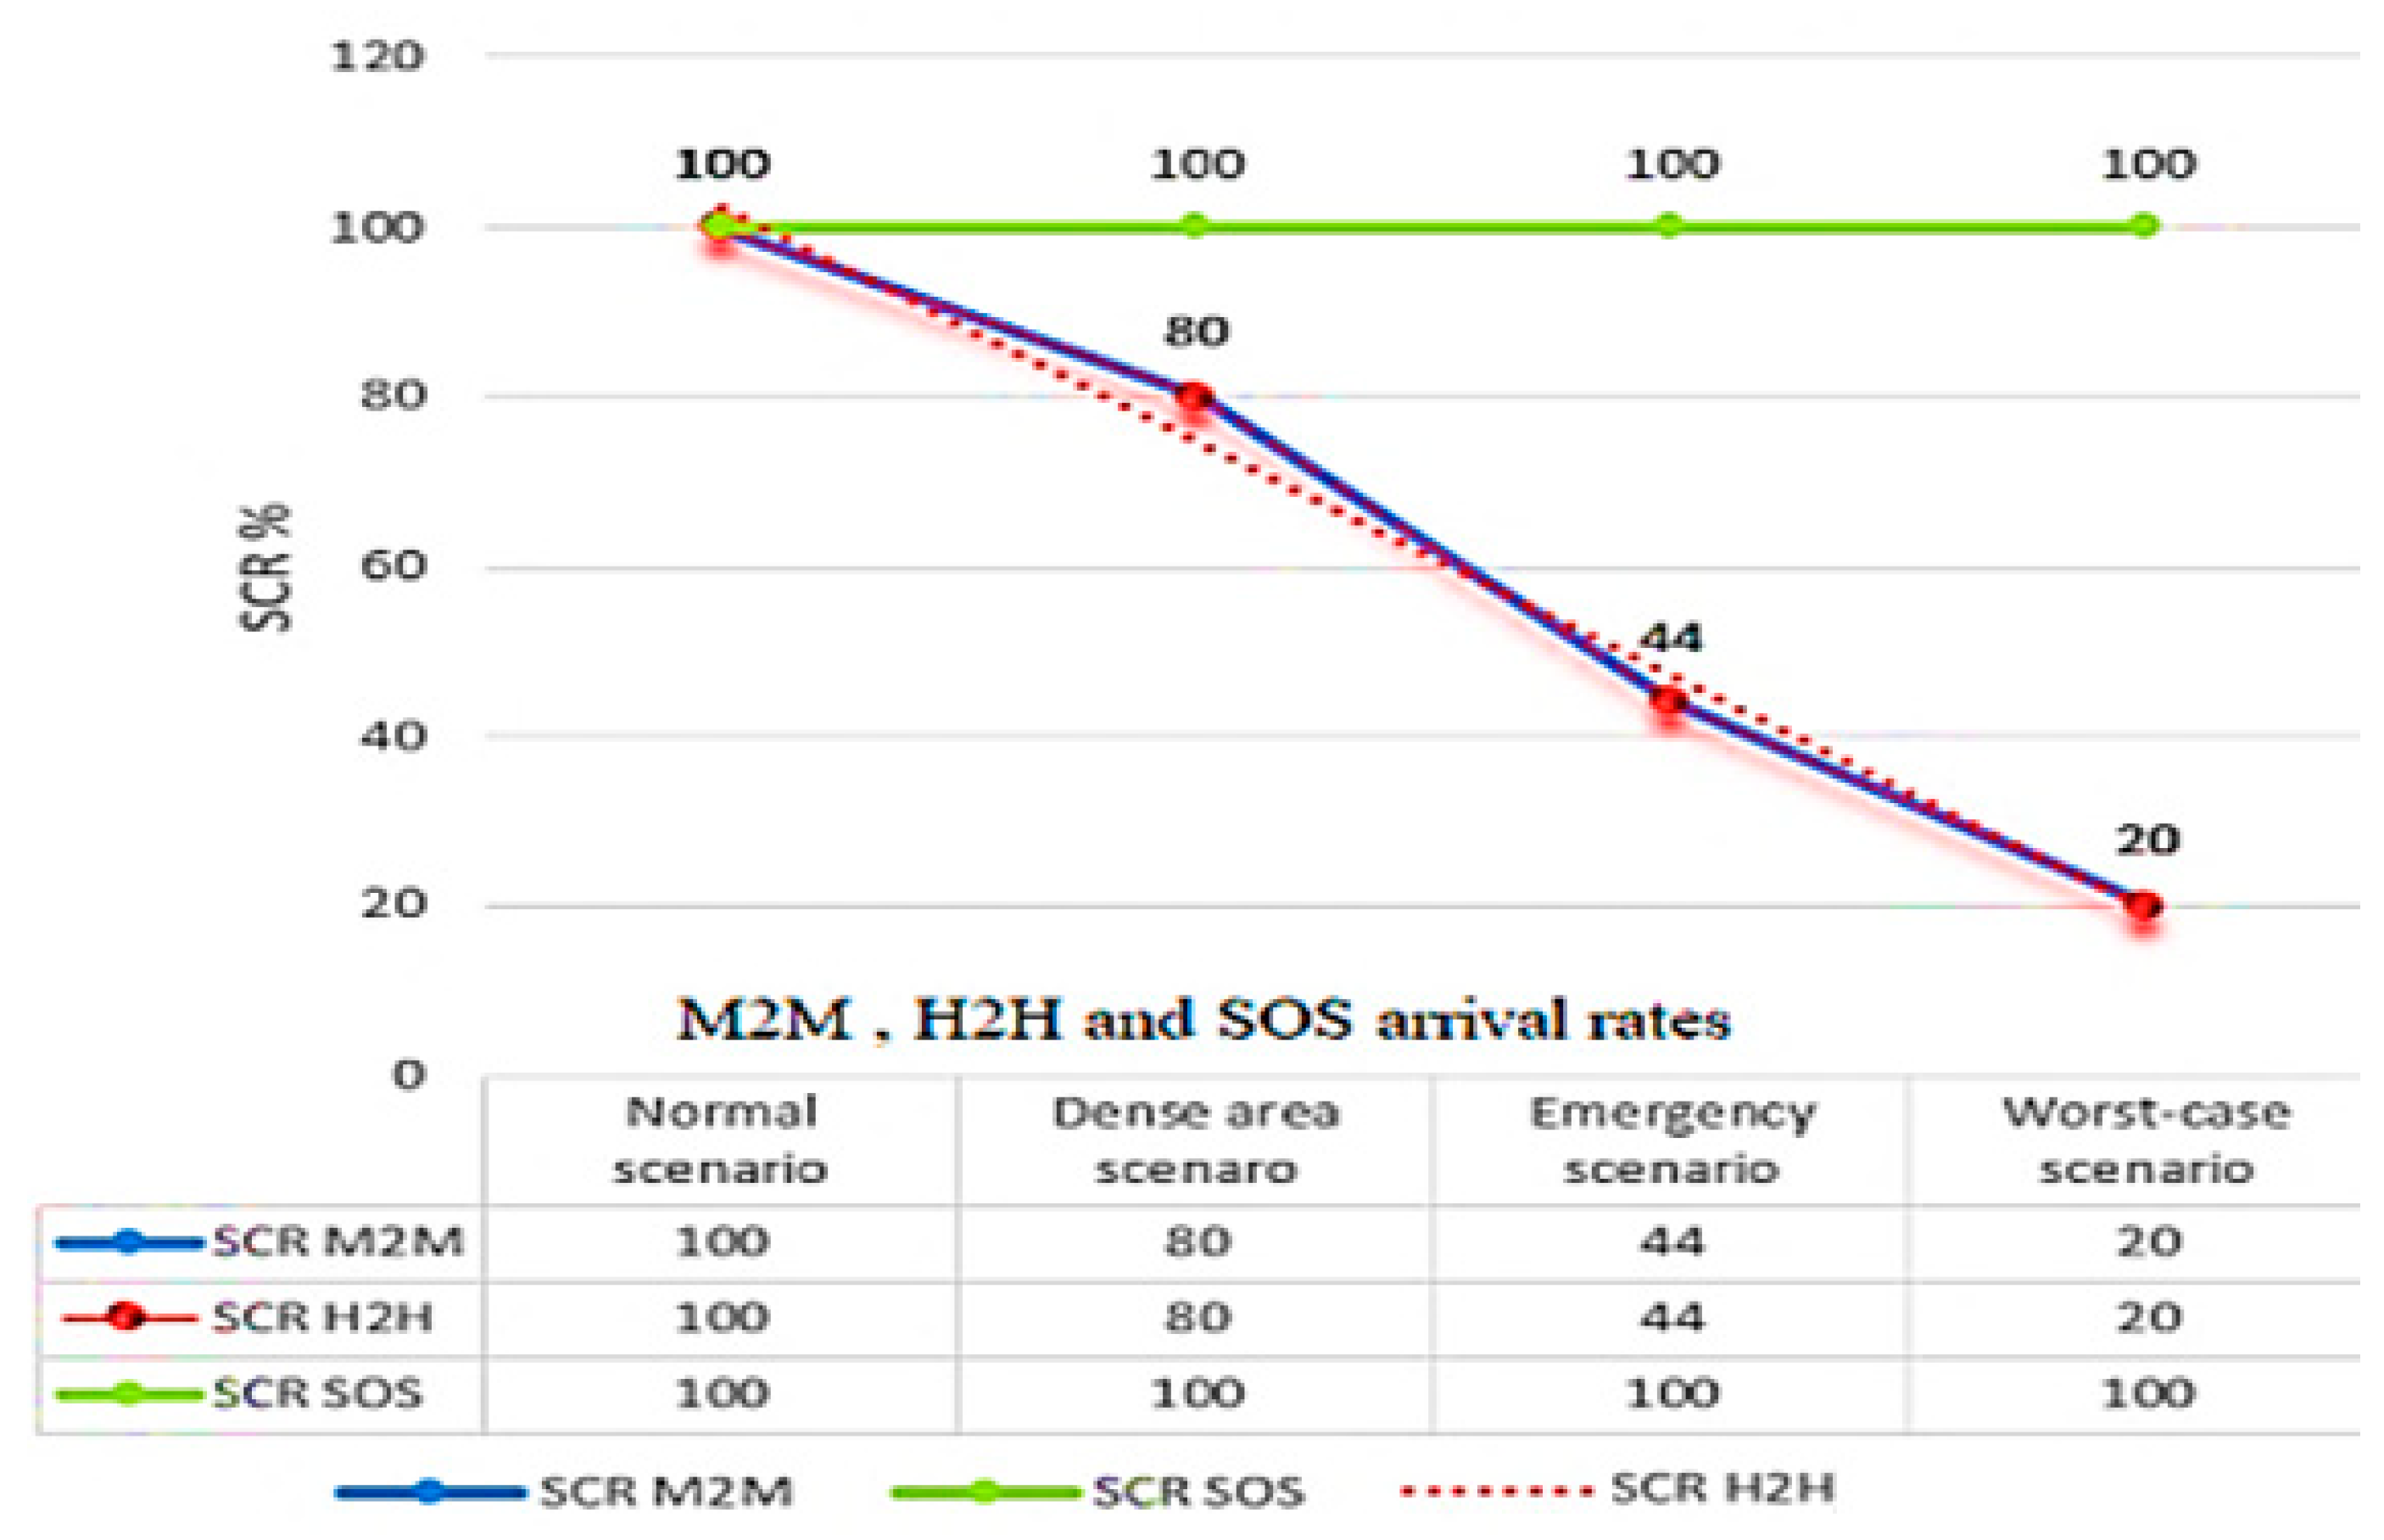

Table 1.
Symbols, notations, values, and descriptions.
| Symbol | Value | Description |
|---|---|---|
| C | 3 | Number of resource blocks available in the network |
| i | Number of ongoing M2M services | |
| j | Number of ongoing H2H services | |
| λM2M | +1 or +2 | M2M Average arrival rate |
| λH2H | +1 or +2 | H2H Average arrival rate |
| λSOS | +1 & +1 | One M2M request and one H2H request (i+1 & j+1) |
| μM2M | -1 or -2 | M2M service rate |
| μH2H | -1 or -2 | H2H service rate |
| μSOS | -1 & -1 | Completion of one M2M request and one H2H request (i-1 & j-1) |
| S(i,j) | The state with certain i&j requests | |
| π(i,j) | Steady-state probability | |
| п | Steady-state probability vector |
Table 2.
SCR of H2H, M2M, and SOS during the normal-cycle scenario.
| Traffic | Departed | Arrived | SCR |
|---|---|---|---|
| M2M | 10000 | 10000 | 100% |
| H2H | 5000 | 5000 | 100% |
| SOS | 10000 | 10000 | 100% |
Table 3.
SCR of H2H, SOS and M2M for the dense-area scenario.
| Traffic | Departed | Arrived | SCR |
|---|---|---|---|
| M2M | 12000 | 95000 | 80% |
| H2H | 5000 | 4000 | 80% |
| SOS | 12000 | 12000 | 100% |
Table 4.
SCR of H2H, SOS and M2M for the emergency-case scenario.
| Traffic | Departed | Arrived | SCR |
|---|---|---|---|
| M2M | 16000 | 68000 | 44% |
| H2H | 5000 | 22000 | 44% |
| SOS | 16000 | 16000 | 100% |
Table 5.
SCR of H2H, SOS and M2M for the worst case scenario.
| Traffic | Departed | Arrived | SCR |
|---|---|---|---|
| M2M | 20000 | 4000 | 20% |
| H2H | 5000 | 1000 | 20% |
| SOS | 20000 | 20000 | 100% |
Table 6.
SCR of H2H, SOS and M2M for the normal-cycle scenario.
| Traffic | Departed | Arrived | SCR |
|---|---|---|---|
| M2M | 5000 | 5000 | 100% |
| H2H | 10000 | 10000 | 100% |
| SOS | 10000 | 10000 | 100% |
Table 7.
SCR of H2H, SOS and M2M for the dense-area scenario.
| Traffic | Departed | Arrived | SCR |
|---|---|---|---|
| M2M | 5000 | 4000 | 80% |
| H2H | 12000 | 9500 | 80% |
| SOS | 12000 | 12000 | 100% |
Table 8.
SCR of H2H, SOS and M2M for the Emergency case scenario.
| Traffic | Departed | Arrived | SCR |
|---|---|---|---|
| M2M | 5000 | 2000 | 44% |
| H2H | 16000 | 7000 | 44% |
| SOS | 16000 | 16000 | 100% |
Table 9.
SCR of H2H, SOS and M2M for the Worst case scenario.
| Traffic | Departed | Arrived | SCR |
|---|---|---|---|
| M2M | 5000 | 1000 | 20% |
| H2H | 20000 | 4000 | 20% |
| SOS | 20000 | 20000 | 100% |
Disclaimer/Publisher’s Note: The statements, opinions and data contained in all publications are solely those of the individual author(s) and contributor(s) and not of MDPI and/or the editor(s). MDPI and/or the editor(s) disclaim responsibility for any injury to people or property resulting from any ideas, methods, instructions or products referred to in the content. |
© 2024 by the authors. Licensee MDPI, Basel, Switzerland. This article is an open access article distributed under the terms and conditions of the Creative Commons Attribution (CC BY) license (http://creativecommons.org/licenses/by/4.0/).
Copyright: This open access article is published under a Creative Commons CC BY 4.0 license, which permit the free download, distribution, and reuse, provided that the author and preprint are cited in any reuse.


