Submitted:
19 August 2024
Posted:
20 August 2024
You are already at the latest version
Abstract
The increasing frequency of urban flooding, driven by global climate change, poses significant threats to the safety and resilience of urban rail transit systems. This study systematically examines the cascading failure processes and resilience of these networks under flood conditions, with a specific focus on the Shanghai Metro. A comprehensive resilience evaluation model was developed by integrating geographic information, static network characteristics, and dynamic passenger flow indicators. This study employs an improved Coupled Map Lattice (CML) model to simulate cascading failures, considering the coupling effects of station centrality, geographic elevation, and passenger flow dynamics. Results indicate that stations with higher degree centrality are more likely to trigger rapid cascading failures across the network. However, incorporating dynamic passenger flow and geographic elevation data helps mitigate these effects, emphasizing the need for multi-dimensional resilience strategies. The findings provide valuable insights for urban transit management, offering a scientific foundation for developing targeted disaster response strategies to enhance network resilience against floods. This study advances the understanding of the vulnerability of urban rail transit systems and offers practical guidance for improving disaster preparedness in urban transportation infrastructure.
Keywords:
cascading failure
; urban rail transit
; resilience
; flood
; coupled map lattice (CML) model
1. Introduction
Urban rail transit systems are essential components of modern cities, facilitating the daily movement of millions of passengers. However, these systems are increasingly vulnerable to disruptions caused by extreme weather events, particularly urban flooding, which has become more frequent due to global climate change. The Sixth Assessment Report of the Intergovernmental Panel on Climate Change (IPCC) indicates that human activities have led to an unprecedented rate of climate warming, resulting in more intense precipitation events and elevated sea levels, especially in coastal cities [1].
Flooding poses significant risks to urban rail transit systems, especially those characterized by enclosed spaces, high passenger density, and extensive underground infrastructure. Historical incidents, such as the flooding of New York City's subway during Hurricane Sandy in 2012, which caused $359 million in damages, and the catastrophic flooding of the Zhengzhou Metro in 2021, which resulted in multiple fatalities, highlight the critical need for resilience in these networks [2]. These events demonstrate the potential for cascading failures, where the disruption of a single station can propagate throughout the entire network, leading to widespread service interruptions, economic losses, and threats to public safety.
Existing research on the resilience of transportation networks often focuses on static network indicators and risk assessments. Bo et al. developed a vulnerability assessment system for bus networks under heavy rain and flooding, incorporating both static network characteristics and dynamic passenger flow indicators [3]. Similarly, Wang et al. utilized the Fuzzy Analytic Hierarchy Process (FAHP) to construct specific indicators for assessing the flood risk of the Beijing Metro, integrating disaster environment factors, disaster-inducing factors, and the characteristics of disaster-bearing bodies [4]. Li et al. studied the transmission rules of disaster chains in urban rail transit, applying complex network theory to model the evolution of disasters triggered by floods [5].
Despite these contributions, there remains a significant gap in the literature regarding the dynamic interactions between geographic factors, network topology, and real-time passenger flow during flood events. Most existing studies do not simulate the actual impact of cascading failures within the network, nor do they consider the three-dimensional spatial characteristics of urban flooding and their effects on rail transit systems [6]. This lack of comprehensive analysis limits the ability to fully understand and mitigate the risks associated with urban flooding in rail transit networks.
This study addresses this gap by systematically analyzing the cascading failure mechanisms of urban rail transit systems under flood conditions, with a focus on the Shanghai Metro. By integrating geographic information systems (GIS), complex network theory, and dynamic passenger flow data, this research seeks to develop a robust framework for evaluating the resilience of rail transit networks. Specifically, the study incorporates three-dimensional geographic information and time-varying passenger flow dynamics to assess the impact of flooding on network resilience and to explore the variations in resilience under different scenarios.
The research findings are expected to provide critical insights into the vulnerability and resilience of urban rail transit systems in the face of extreme weather events. By offering a comprehensive analysis of cascading failure processes, this study aims to inform the development of more effective disaster response strategies and contribute to the enhancement of urban rail systems' capacity to withstand and recover from flood-induced disruptions.
2. Evaluation Indicators for the Resilience of Rail Transit Networks Under Flood Conditions
2.1. Rail Transit Network Characteristics
Among the various methods for constructing these networks, the Space L and Space P methods are commonly employed [7]. Given that this study emphasizes the spatial characteristics of rail transit networks within an urban geographic context, the Space L method is selected for network construction.
In the context of rail transit network resilience, degree centrality is a pivotal factor in determining the likelihood and impact of cascading failures [8]. Previous studies have examined the characteristics of the Shanghai rail transit network from a complex network perspective, confirming that the network exhibits small-world and scale-free properties. These characteristics render the network particularly susceptible to targeted attacks on nodes with a high degree centrality [9,10]. Further, cascading failures in the Chengdu Metro have been studied, showing that transfer stations, due to their central role and high passenger flow, experience greater failure scales and exert a more significant impact on the overall network when they are disrupted [11].
This study utilizes degree centrality as the primary network characteristic indicator for analyzing node importance. Figure 1 illustrates the impact on the network following the failure of stations with varying degrees of centrality. Station A, with a degree centrality of 5, functions as a crucial transfer point within the network, affecting five other stations when it fails. In contrast, Station B, with a lower degree centrality of 2, primarily connects to two other stations, and its failure has a correspondingly smaller impact.
2.2. Geographic Information of Stations
Existing studies on the resilience assessment of urban rail transit networks have largely focused on static network characteristics and two-dimensional analyses, lacking a comprehensive, multi-dimensional, and dynamic approach to network resilience [12]. The impact of urban flooding on rail transit systems is uniquely challenging, posing significant threats to the resilience of the entire network. Urban floods typically disperse according to the city's spatial layout, interacting with the three-dimensional (3D) network structure of roads and railways, thereby influencing the entire transit network [13]. This mode of impact differs significantly from those caused by deliberate sabotage or random failures. Flood-induced disruptions in rail transit are heavily influenced by geographic factors, where localized network interruptions can lead to widespread effects across areas indirectly affected by the flood.
Current research on transportation networks largely relies on two-dimensional (2D) complex networks using geographic coordinates, with a limited focus on 3D network topology and the dynamic effects of geographic elevation [14]. However, existing complex network-based frameworks for analyzing transportation under flood conditions are not well-suited to account for 3D disturbances and topologies. The inclusion of geographic elevation as a critical third dimension is essential for accurately assessing the impacts of floods on transit networks [6]. As illustrated in Figure 2, when stations A and B are damaged by flooding, the elevation of neighboring stations plays a significant role in influencing the cascading failure effect across the network.
2.3. Stations Dynamic Characteristics of Passenger Flow
In the study of cascading failures within urban rail transit networks, changes in passenger flow are considered critical indicators. Chen Feng et al. utilized Automatic Fare Collection (AFC) data from the Beijing Metro to construct an Origin-Destination (OD) matrix for passenger flow, applying an all-or-nothing assignment based on the shortest path. They assessed the reliability of the Beijing Metro network with and without passenger flow weighting, concluding that the network is more vulnerable when passenger flow is factored into the analysis [15]. Similarly, Liu Chaoyang et al. employed the Floyd algorithm to calculate the shortest path from the origin to the destination, assuming that when a node fails, its passenger flow automatically redirects to the nearest alternative path until no further nodes fail. Their model primarily addresses congestion failures caused by the failure of specific nodes [16].
Moreover, Huang Ailing et al. used the Coupled Map Lattice (CML) model, incorporating passenger flow as a weighted parameter, to construct a stability analysis model for the passenger flow-weighted complex network in 2014 and 2018, analyzing the stability evolution of the Beijing Metro network [17]. Zhu Yan et al. developed a passenger flow-weighted reliability evaluation index using AFC data from the Shanghai Metro and employed the Dijkstra shortest path algorithm to determine the passenger flow weight of network nodes. They built a dynamic model of the Shanghai rail transit network based on the CML model and conducted a comprehensive network reliability analysis [18]. However, these studies often consider passenger flow as a static weighting indicator for nodes, which does not fully capture the dynamic impacts of passenger flow fluctuations across the entire network due to station failures.
In the event of a real flood disaster, the failure of a rail transit station can lead to two primary scenarios: one where the station is closed and trains bypass the station, causing passengers to alight at the preceding or subsequent stations, and another where the train halts at the previous station and resumes service only after the affected station is cleared for safety. The likelihood of passengers continuing to search for the shortest path within the disrupted rail transit system is minimal. Therefore, this study constructs a dynamic matrix of station passenger volume based on time-varying AFC data, establishing dynamic weighting indicators for passenger flow. This approach is then utilized to calculate the cascading failure effects on the dynamic impact of network passenger capacity following station failures due to flood conditions.
3. Modeling and Analysis of Cascading Failures in Rail Transit Networks Based on CML
3.1. Coupled Map Lattice (CML)
Current research on cascading failures in networks primarily utilizes complex network models, load-capacity models, and coupled map lattice models [19]. The Coupled Map Lattice (CML) model discretizes time and space variables while keeping state variables continuous. It reflects the degree of chaos at nodes and the diffusion effects of cascading failure processes within the system, making it suitable for analyzing the spatiotemporal dynamics and patterns of networks [20]. This study employs the CML model to investigate cascading failures in rail transit networks.
In real-world scenarios, when a rail transit station is affected by flooding, the failure of the station could be caused by its geographic characteristics, changes in the overall network topology, or dynamic variations in passenger flow. Subsequently, both the network topology and the flow distribution within the entire rail transit system are affected, leading to the sequential failure of stations due to the combined effects of the "geographically weighted topological network" and the "dynamic passenger flow network." In essence, the "dynamic passenger flow network" is a result of the dynamic changes in passenger flow triggered by the failure of the topological network.
Therefore, considering the impact of dynamic passenger behavior on network resilience in reality, this study incorporates actual passenger flow data into the geographically weighted topological network of rail transit stations. By analyzing the behavior of cascading failures in the entire rail transit system under different coupling strengths of these two networks, this research has significant implications for improving the resilience of actual rail transit networks. The formula commonly used in CML for networks is as follows Equation 1:
In the formula, represents the CML state of node i at time t, ε is the coupling coefficient introduced for the unweighted topological network, denotes the degree of node i, which refers to the number of other nodes directly connected to it. is the element in the adjacency matrix corresponding to the i row and j column, and is a nonlinear mapping function, which can be physically interpreted as the evolution of node i’s capacity or operational constraints, with a value range between (0,1).
This study uses the enhanced coupled map lattice model proposed by Huang Ailing et al. [17] and Yi Shen et al. [21], as shown in Equation 2.
is the coupling coefficient introduced for the unweighted topological network, is the deep coupling coefficient, and is the coupling coefficient for the weighted distribution of inflow and outflow at the stations, which respectively represent the differences in network coupling relations caused by the presence or absence of depth and the loading of flow.
indicate the connection status between node i and node j. If there is an edge connecting nodes i and j, then==1 otherwise, ==0. is the degree of node i, i is the depth-normalized value of the node, represents the inflow strength at node i, represents the outflow strength at node i, represents the inflow strength at other nodes, and represents the outflow strength at other nodes. R represents the perturbation intensity.
3.2. Spatiotemporal State of Network Stations Under Different Conditions
The CML model describes the state of network nodes and their interactions. At each time step, the state of a particular node is influenced by its state at the previous time step and the states of surrounding nodes. Initially, at time t=0, each node is randomly assigned a value between 0 and 1. At the next time step t=1, a new state value is calculated according to Equation 1. Over time, the CML values of network nodes across all time steps are obtained. When the network is not disturbed, the node states remain within the range of 0 to 1. Taking Station 45 of the Shanghai rail transit as an example, its CML state without applying any disturbance R is shown in Figure 3.
When a node in the network is disturbed at a certain time t (R≥1), this node fails and is removed from the network at the next time step t+1. The neighboring nodes of this failed node are affected, potentially leading to their failure and causing the failure to propagate to adjacent nodes until no more nodes fail, at which point the cascading failure in the network stops. According to Equation 2, different coupling coefficients result in different states, affecting the speed and extent of the failure. Taking Station 45 as an example, with external disturbance R=1 applied at time step 27, the CML state under different combinations of coupling coefficients (Combination 1: ; Combination 2: , , ; Combination 3: , , , ) is shown in Figure 4.
When a node in the network is disturbed at a certain time t, it can trigger cascading failures throughout the network. The effect of cascading failures varies under different disturbances. Taking Station 45 as an example, with external disturbances R=1,2,3,4,5,6 applied at time step 27, and the coupling coefficients set to Combination 1: , the cascading failure effect on other nodes in the network is shown in Figure 5. As R increases, the number of failed nodes increases, and the failure speed accelerates. Due to the cascading failures in the network, the impact on passenger flow is illustrated in Figure 6, where the number of affected passengers increases with higher values of R.
3.3. Resilience Algorithm Process for Cascading Failures in Rail Transit Based on CML
The CML state values of network stations, the number of failed nodes, the geographically weighted topological network, and the stability of the dynamic passenger flow network at different time points during the cascading failure process can be obtained through the following algorithmic process:
Step 1: Determine the initial values by calculating the network centrality, geographic weighted intensity, and passenger flow weighted intensity of each station, and set the CML state values for all stations in the network.
Step 2: Select a specific time point and deliberately disturb the stations with the highest degree centrality, stations at lower geographic elevations, and stations historically affected by flooding to cause failure. Record the attribute values at the current time point.
Step 3: Assess the CML state values of all stations from the previous time point. If the state value ≥1, the station is considered failed and is removed from the network. Update the CML state values for the remaining network stations and record the attribute values at the current time point.
Step 4: Repeat Step 3 until the number of failed stations in the network no longer changes. The network reaches a new stable state, and the new attribute values are recorded.
Step 5: Repeat Steps 2 through 4, output the results for each time point, and record the corresponding statistical data.
4. Results Cascading Failure Process and Resilience Analysis of the Shanghai Rail Transit Network Under Flood Conditions
4.1. Data Source
Due to the varied sources of data, this study maximizes the use of data from the same time period.
Passenger Flow Data: Based on the Shanghai Metro AFC (Automatic Fare Collection) card data publicly available through the Shanghai Open Data Applications (SODA) competition, data from Tuesday, March 8, 2016, was used. After cleaning the data, a 15-minute interval was adopted, with 96 time steps recorded from 00:00 to 24:00 as the basis for time and passenger statistics.
Metro Station Data: By the end of 2016, the Shanghai Metro had 14 lines with a total of 326 stations.
Station Elevation Data: Elevation data for Shanghai Metro stations was obtained using the publicly available 50-meter DEM (Digital Elevation Model) data from the Geospatial Data Cloud. Only the gravitational influence on water flow direction was considered. The ArcGIS Hydrology Analysis module was used to generate a flow direction map and extract catchment basins. Combined with raster data of Shanghai Metro stations, the depth information of metro stations was extracted. For stations without catchment basin information, the DEM elevation data was directly used [22].
4.2. Analysis of Stepwise Weighted Resilience Changes During the Cascading Failure Process of the Rail Transit Network Under Flood Conditions
The initial values were determined by calculating the network centrality, geographic weighted height, and passenger flow weighted intensity for each station, and subsequently setting the CML state values across the entire network. In this study, three stations with the highest degree centrality, three stations at lower geographic elevations, and three stations with a history of flood damage were selected. The disturbances were introduced starting at 7:00 AM, corresponding to the 29th time step.
4.2.1. Stations with the Highest Degree Centrality
Stations with higher degree centrality values are more important within the network. In a metro network, stations with high degree values are often located in central areas of the network, while those with lower values are usually on the periphery. To study the impact of stations with different degree values on the cascading failure process of the network, three metro stations were selected: Shanghai Rail Transit Station 41 (degree centrality 7, depth 0.96), Station 19 (degree centrality 6, depth 0.96), and Station 45 (degree centrality 6, depth 0.93). Under different combinations of coupling coefficients (Combination 1: ; Combination 2: , , ; Combination 3: , , , ) the same disturbance R=4 was applied. The resulting network station failure process, the number of failures, and changes in passenger flow are shown in Figure 6, Figure 7 and Figure 8.
Stations with high degree centrality are often more important stations, and the overall network damage process varies with different coupling coefficients. Among the 41 stations, when the passenger flow coefficient is added (Combination 2), the entire network's damage rate increases. When both the passenger flow and depth coefficients are added (Combination 3), the network's damage rate slows down, and some stations remain undamaged at R=4 (Figure 6 a). However, from the perspective of passenger flow, if the damage begins at 7 a.m., after the morning peak, the passenger flow is significantly affected (Figure 6 b).
Among the 19 stations, when the passenger flow coefficient is added (Combination 2), the overall network damage rate decreases, and some nodes remain undamaged at R=4. When both the passenger flow and depth coefficients are added (Combination 3), the overall network damage is reduced, with only a dozen nodes being destroyed (Figure 7 a), and the affected passenger flow is minimal (Figure 7 b).
In the experiment with 45 stations, adding the passenger flow coefficient (Combination 2) slows down the network damage compared to when only degree centrality is considered, but the number of damaged stations increases (Figure 8 a). When both the passenger flow and depth coefficients are added (Combination 3), similar to the 19 stations, the overall network damage is reduced, with only a dozen stations being destroyed, and the impact on passenger flow is minimal (Figure 8 b).
4.2.2. Centrality Stations with Lower Geographical Positions
The lower the geographical elevation of a station, the more important it becomes to the network during flood disasters. To study the impact of stations at different depths on the network's cascading failure process, three subway stations in Shanghai's rail transit system were selected: Station 159 (degree centrality 4, depth 0.99), Station 164 (degree centrality 4, depth 0.99), and Station 189 (degree centrality 4, depth 0.99). The same disturbance, R=4, was applied under different coupling coefficient combinations, and the resulting network station damage process and reliability changes are shown in Figure 9, Figure 10 and Figure 11.
This study selected three stations with the same depth and degree centrality to conduct the same experiment, but the overall network damage process varied significantly among the three stations. For Station 159, when the passenger flow coefficient was added (Combination 2) and when both passenger flow and depth coefficients were added (Combination 3), the network damage rate remained the same as when only degree centrality was considered (Figure 9 a). The entire network's passenger flow would completely cease after the morning peak (Figure 9 b).
In the case of Station 164, adding the passenger flow coefficient (Combination 2) slowed down the network damage rate, and most stations remained undamaged at R=4. When both passenger flow and depth coefficients were added (Combination 3), the network damage was reduced, with only a dozen stations being destroyed (Figure 10 a), and the affected passenger flow was minimal (Figure 10 b).
In the experiment with Station 189, adding the passenger flow coefficient (Combination 2) resulted in the same network damage as when only degree centrality was considered (Figure 11 a). When both passenger flow and depth coefficients were added (Combination 3), similar to Station 164, the network damage was reduced, with only a dozen stations being destroyed, and the affected passenger flow was minimal (Figure 11 b).
4.2.3. Historical Flood-Prone Stations
Given the numerous conditions that can lead to flood disasters, this study focuses on stations that have experienced such events in the past. Three stations were selected for analysis: Shanghai Rail Transit Station 48, which experienced flooding in 2005 (degree centrality 4, depth 0.87); Station 104, which was suspended during a flood event in 2019 (degree centrality 4, depth 0.71); and Station 197, which experienced water ingress in 2021 (degree centrality 4, depth 0.98). The same disturbance, R=4, was applied under different combinations of coupling coefficients, and the resulting network station damage process and reliability changes are shown in Figure 12, Figure 13 and Figure 14.
This study examines three stations that have been affected by flood disasters at different times. Although these stations share the same degree centrality, they differ in depth, leading to significant variations in the overall network damage process. For Station 48, adding the passenger flow coefficient (Combination 2) slowed the overall network damage rate, and the number of damaged stations decreased. When both passenger flow and depth coefficients were added (Combination 3), most stations remained undamaged at R=4 (Figure 12 a), and the impact on passenger flow was minimal (Figure 12 b).
For Station 104, the overall network damage rate was similar to when only degree centrality was considered, regardless of whether the passenger flow coefficient (Combination 2) or both passenger flow and depth coefficients (Combination 3) were added (Figure 13 a). After the morning peak, the network was completely destroyed, rendering it unable to sustain any operational capacity (Figure 13 b).
In the experiment with Station 197, adding the passenger flow coefficient (Combination 2) slowed the network damage compared to when only degree centrality was considered, but the number of damaged stations increased. When both passenger flow and depth coefficients were added (Combination 3), the overall network damage decreased, with only a dozen stations being destroyed (Figure 14 a), and the impact on passenger flow was minimal (Figure 14 b).
In real cases, after Station 48 was flooded in 2005, the metro implemented measures such as speed restrictions, and related stations only implemented crowd control measures. In 2021, when a large amount of water flowed into Station 197 due to external construction, the operator's strategy was to close the station temporarily, conduct necessary operations, and reopen it within three hours. However, in the case of Station 104 during the 2019 flood, the strategy was to close the related stations one day in advance, which corresponds to the severity of cascading failure observed in this study.
4.2.4. Comparative Analysis
To better compare the cascading failure effects under the same coupling coefficients for different stations, this study conducted a cross-sectional comparison of 9 stations. Figure 28 shows the situation of station failures over time under Coupling Combination 1 for different stations. Figure 29 shows the situation under Coupling Combination 2, and Figure 30 shows the situation under Coupling Combination 3.
Figure 15 a illustrates the scenario where the coupling coefficient is only based on degree centrality. The selected stations all have relatively high degree centrality. According to studies, nodes with a higher degree centrality tend to lead to faster network failures and more station failures [11,18]. However, Figure 15 a shows that the stations where the network fails fastest are Station 19 and Station 48, with degree centrality values of 6 and 4, respectively. Meanwhile, Station 45, although initially failing quickly, has some stations that remain intact. Therefore, it can be concluded that degree centrality does influence the speed of cascading failures in the network, but the overall effect on the network's cascading failures can vary depending on the station's location.
Figure 15 b illustrates the combined effect of degree centrality and dynamic passenger flow coefficients. When passenger flow weighting is added, the network failure speed is faster than when only degree centrality is considered [18]. However, Figure 15 b shows that after adding the dynamic passenger flow coefficient, since the passenger flow in this study is a real dynamic flow that changes over time, and the assumption is that when a station fails, its passenger flow is considered lost and is no longer counted in the network, the impact of passenger flow diminishes as more stations fail. This results in fewer station failures (e.g., Stations 164, 19, and 48) and slower failure speeds compared to Figure 15 a. Thus, it can be concluded that, compared to other all-or-nothing passenger flow indicators, the presence of stations with low overall passenger flow or diminishing passenger flow during failures can slow down the overall cascading failure speed of the network.
Figure 15 c illustrates the combined effect of degree centrality, dynamic passenger flow coefficients, and station elevation coefficients. The results show that after adding the elevation coefficient, as more stations fail, the overall network failure speed slows down, and fewer stations are affected (e.g., Stations 19, 45, 164, 189, 48, and 197). However, there are also instances where the failure speed increases and more stations are affected (e.g., Stations 41, 159, and 104). Therefore, it can be concluded that adding the elevation coefficient generally weakens the speed and intensity of network failures, especially when there are stations with higher elevations. However, there may still be key stations that could affect the entire network. The overall cascading failure effects are summarized in Table 1.
Table 1: Characteristics of stations and cascading failure sequence.
Table 1 provides a detailed analysis of the characteristics of various stations within the urban rail transit network and their corresponding sequence of cascading failures under different coupling coefficient combinations (C1, C2, and C3). Here, C1 represents a combination that only considers degree centrality, C2 combines degree centrality with dynamic passenger flow coefficients, and C3 further incorporates station elevation coefficients.
Under these combinations, the stations exhibit different behaviors. Stations with higher degree centrality, such as Station 41, fail first under C1, significantly impacting passenger flow and the speed of cascading failures. However, when passenger flow and elevation factors are included, the station’s failure sequence and impact are somewhat mitigated, highlighting the importance of additional coefficients in alleviating network vulnerability.
In contrast, stations with lower degree centrality but lower geographic elevation, such as Stations 159 and 164, tend to fail early under any combination. However, when dynamic passenger flow and elevation coefficients are added, although these stations still fail relatively quickly, the overall cascading failure process of the network slows down, and the impact becomes more limited. This indicates that while degree centrality plays a crucial role in cascading failures, the geographic location and dynamic passenger flow changes of a station are also significant factors.
Moreover, the performance of Stations 48 and 104 is also noteworthy. Despite having lower degree centrality, they exhibit rapid cascading failure speeds under C1, particularly when considering the impact of historical flood events. However, as the dynamic passenger flow and elevation coefficients are introduced in C2 and C3, the failure speed and impact of these stations decrease, further demonstrating the effectiveness of multidimensional indicators in enhancing network resilience.
Overall, the data in the table reveal the significant impact of degree centrality, geographic elevation, and dynamic passenger flow on the overall resilience of the urban rail transit network. Through the analysis of cascading failures across different combinations, we can conclude that a single-dimensional assessment often falls short of fully reflecting a station’s impact on network stability. A comprehensive consideration of multidimensional factors is crucial for enhancing the disaster resilience of urban rail systems. These findings not only provide new perspectives for theoretical research but also offer scientific support for urban transportation managers in developing more effective disaster prevention strategies.
5. Conclusions
This study systematically investigates the cascading failure mechanisms and resilience of urban rail transit networks under flood conditions, with a specific focus on the Shanghai Metro. By integrating three-dimensional geographic information, static network characteristics, and dynamic passenger flow data, this research offers a comprehensive framework for evaluating the resilience of urban rail transit systems. The use of the improved CML model allows for a detailed simulation of cascading failure processes, providing new insights into the interplay between network topology, geographic factors, and passenger dynamics during flood events.
The findings of this study have significant practical implications for urban transit authorities and disaster management agencies. The identification of critical nodes within the rail network, which are highly susceptible to cascading failures, provides a basis for prioritizing infrastructure upgrades and targeted disaster preparedness efforts. The study's dynamic analysis of passenger flow under various flood scenarios offers actionable insights for optimizing evacuation routes and improving emergency response strategies. Moreover, the incorporation of geographic elevation as a resilience indicator highlights the importance of considering three-dimensional urban topography in the planning and management of urban rail systems. This approach can be utilized to enhance the robustness of rail networks in other flood-prone cities, making it a valuable tool for urban planners and transit operators worldwide.
Compared to previous studies that largely focus on static network characteristics and two-dimensional analyses, this research advances the field by integrating real-time data and three-dimensional geographic considerations. While earlier works have laid the groundwork for understanding urban transit vulnerability under extreme weather conditions, they often overlook the dynamic nature of passenger flow and the critical role of geographic factors in exacerbating cascading failures [3,4]. This study addresses these gaps by offering a more holistic and nuanced understanding of how urban rail networks behave under flood conditions, thereby contributing to a deeper theoretical and practical understanding of network resilience.
While this study provides a robust framework for analyzing the resilience of urban rail transit networks under flood conditions, several areas warrant further investigation. Future research could explore the integration of more sophisticated flood simulation models to account for variable flood intensities and durations. Additionally, incorporating real-time data analytics and machine learning algorithms could enhance the predictive capabilities of the model, allowing for real-time monitoring and adaptive response strategies during actual flood events. Expanding the study to include multi-modal transportation networks, such as buses and ferries, could also provide a more comprehensive view of urban mobility resilience under extreme weather conditions. Lastly, the development of region-specific resilience indicators could help tailor disaster response strategies to the unique geographic and infrastructural characteristics of different cities. Future research should further develop modeling methods that are consistent with actual network topologies and establish unified resilience assessment metrics under uncertain disturbance events, in order to enhance the recovery capabilities of urban rail transit systems [12].
This research makes several unique contributions to the field of urban transportation resilience. It is one of the first studies to fully integrate three-dimensional geographic data with dynamic passenger flow analysis, offering a more complete picture of how urban rail networks respond to flood events. The study's application of the improved CML model to simulate cascading failures under various network conditions provides a novel methodological approach that can be adapted to other contexts. By bridging the gap between theoretical modeling and practical applications, this research offers valuable insights that can inform both academic discourse and real-world disaster management practices.
Author Contributions
Conceptualization, D.L. and S.D.; methodology, D.L.; formal analysis, D.L. and Y.H.; data curation, S.D.; writing—original draft preparation, D.L.; writing—review and editing, D.L., Y.H. and F.Z.; supervision, S.D.; project administration, D.L.; funding acquisition, D.L. All authors have read and agreed to the published version of the manuscript.
Data Availability Statement
The data presented in this study are available from the corresponding author upon request.
Conflicts of Interest
The authors declare no conflict of interest.
References
- Fan, X.; Qin, Y.; Gao, X. Interpretation of the main conclusions and suggestions of IPCC AR6 working group Ⅰ report. Environmental Protection 2021, 49, 44–48. [Google Scholar]
- Watson, G.; Ahn, J.E. A systematic review: To increase transportation infrastructure resilience to flooding events. Applied Sciences 2022, 12, 12331. [Google Scholar] [CrossRef]
- Bo, K.; Yang, Z.; Lai, X.; Teng, J. Method for identifying the emergency points of urban transit networks in rainstorms with road waterlogging. Journal of Transportation Engineering and Information 2021, 20, 57–67. [Google Scholar] [CrossRef]
- Wang, G.; Liu, Y.; Hu, Z.; Zhang, G.; Liu, L.Y. Flood risk assessment of subway systems in metropolitan areas under land subsidence scenario: a case study of beijing. Remote Sensing 2021, 13, 1–33. [Google Scholar] [CrossRef]
- Li, H.; Ou-Yang, Z.; Jiang, J.; Yang, Q.; Liu, B.; Xi, Y. Urban rail transit disaster chain evolution network model and its risk analysis —taking subway flood as an example. Railway Standard Design 2020, 64, 153–157. [Google Scholar] [CrossRef]
- Wang, W.; Yang, S.; Stanley, H.E.; Gao, J. Local floods induce large-scale abrupt failures of road networks. Nature Communications 2019. [Google Scholar] [CrossRef] [PubMed]
- Zhang, D.; Yin, J.; Zhu, X.; Zhang, C. Network representation learning: A survey. IEEE transactions on Big Data 2018, 6, 3–28. [Google Scholar] [CrossRef]
- Yin, D.; Huang, W.; Shuai, B.; Liu, H.; Zhang, Y. Structural characteristics analysis and cascading failure impact analysis of urban rail transit network: From the perspective of multi-layer network. Reliability Engineering & System Safety 2022, 218, 108161. [CrossRef]
- Du, F.; Huang, H.; Zhang, D.; Zhang, F. Analysis of characteristics of complex network and robustness in Shanghai metro network. Engineering Journal of Wuhan University 2016, 049, 701–707. [Google Scholar] [CrossRef]
- Yang, J.; Zhu, D.; Zhao, R. Analysis on characteristics of urban rail transit network and robustness of cascading failure. Computer Engineering and Applications 2022, 58, 250–258. [Google Scholar] [CrossRef]
- Li, S.; Shuai, B.; Liu, Y. Cascading failure mechanism of urban rail transit network. China Transportation Review 2020, 42, 69-74+120.
- Hu, J.; Yang, M.; Zhen, Y. A review of resilience assessment and recovery strategies of urban rail transit networks. Sustainability 2024, 16, 6390. [Google Scholar] [CrossRef]
- Mabrouk, M.; Han, H.; Mahran, M.G.N.; Abdrabo, K.I.; Yousry, A. Revisiting urban resilience: a systematic review of multiple-scale urban form indicators in flood resilience assessment. Sustainability 2024, 16, 5076. [Google Scholar] [CrossRef]
- Nima; Dehmamy; Soodabeh; Milanlouei; Albert-László; Barabási. A structural transition in physical networks. Nature 2018. [CrossRef]
- Chen, F.; Hu, Y.; Li, X.; Chen, P. Cascading failures in weighted network of urban rail transit. Journal of Transportation Systems Engineering and Information Technology 2016, 16, 139–145. [Google Scholar] [CrossRef]
- Liu, Z.; Lu, Y.; Liu, B.; Li, Q.; Lu, W. Cascading Failure resistance of urban rail transit network. Journal of Transportation Systems Engineering and Information Technology 2018, 18, 82–87. [Google Scholar] [CrossRef]
- Huang, A.; Wu, X.; Guan, W.; Duan, M. Evolution of metro network stability based on weighted coupled map lattice. Journal of Transportation Systems Engineering and Information Technology 2021, 21, 140–149. [Google Scholar] [CrossRef]
- Zhu, Y.; Sun, J.; Wang, X. Reliability analysis of urban rail transit system network based on coupled map lattice model. Journal of University of Shanghai for Science and Technology 2021, 43, 93–101. [Google Scholar] [CrossRef]
- Ye, H.; Luo, X. Cascading failure analysis on shanghai metro networks: an improved coupled map lattices model based on graph attention networks. International Journal of Environmental Research and Public Health 2021, 19, 204. [Google Scholar] [CrossRef] [PubMed]
- Feng, S.; Wang, S.; Zhao, H. Cascading failure analysis of urban rail transit network based on coupled map lattice model. In CICTP 2020; 2020; pp. 2074-2084.
- Shen, Y.; Ren, G.; Ran, B. Cascading failure analysis and robustness optimization of metro networks based on coupled map lattices: a case study of Nanjing, China. Transportation 2019, 48, 537–553. [Google Scholar] [CrossRef]
- Li, P.; Xu, Z.; Zhao, G.; Zuo, B.; Wang, J.; Song, S. Simulation of urban rainstorm waterlogging process based on SWMM and LISFLOOD-FP models - Case study in Jinan City. South-to-North Water Transfers and Water Science & Technology 2021, 19, 1083-1092. [CrossRef]
Figure 1.
Impact on the network after the destruction of stations with varying degree centralities.
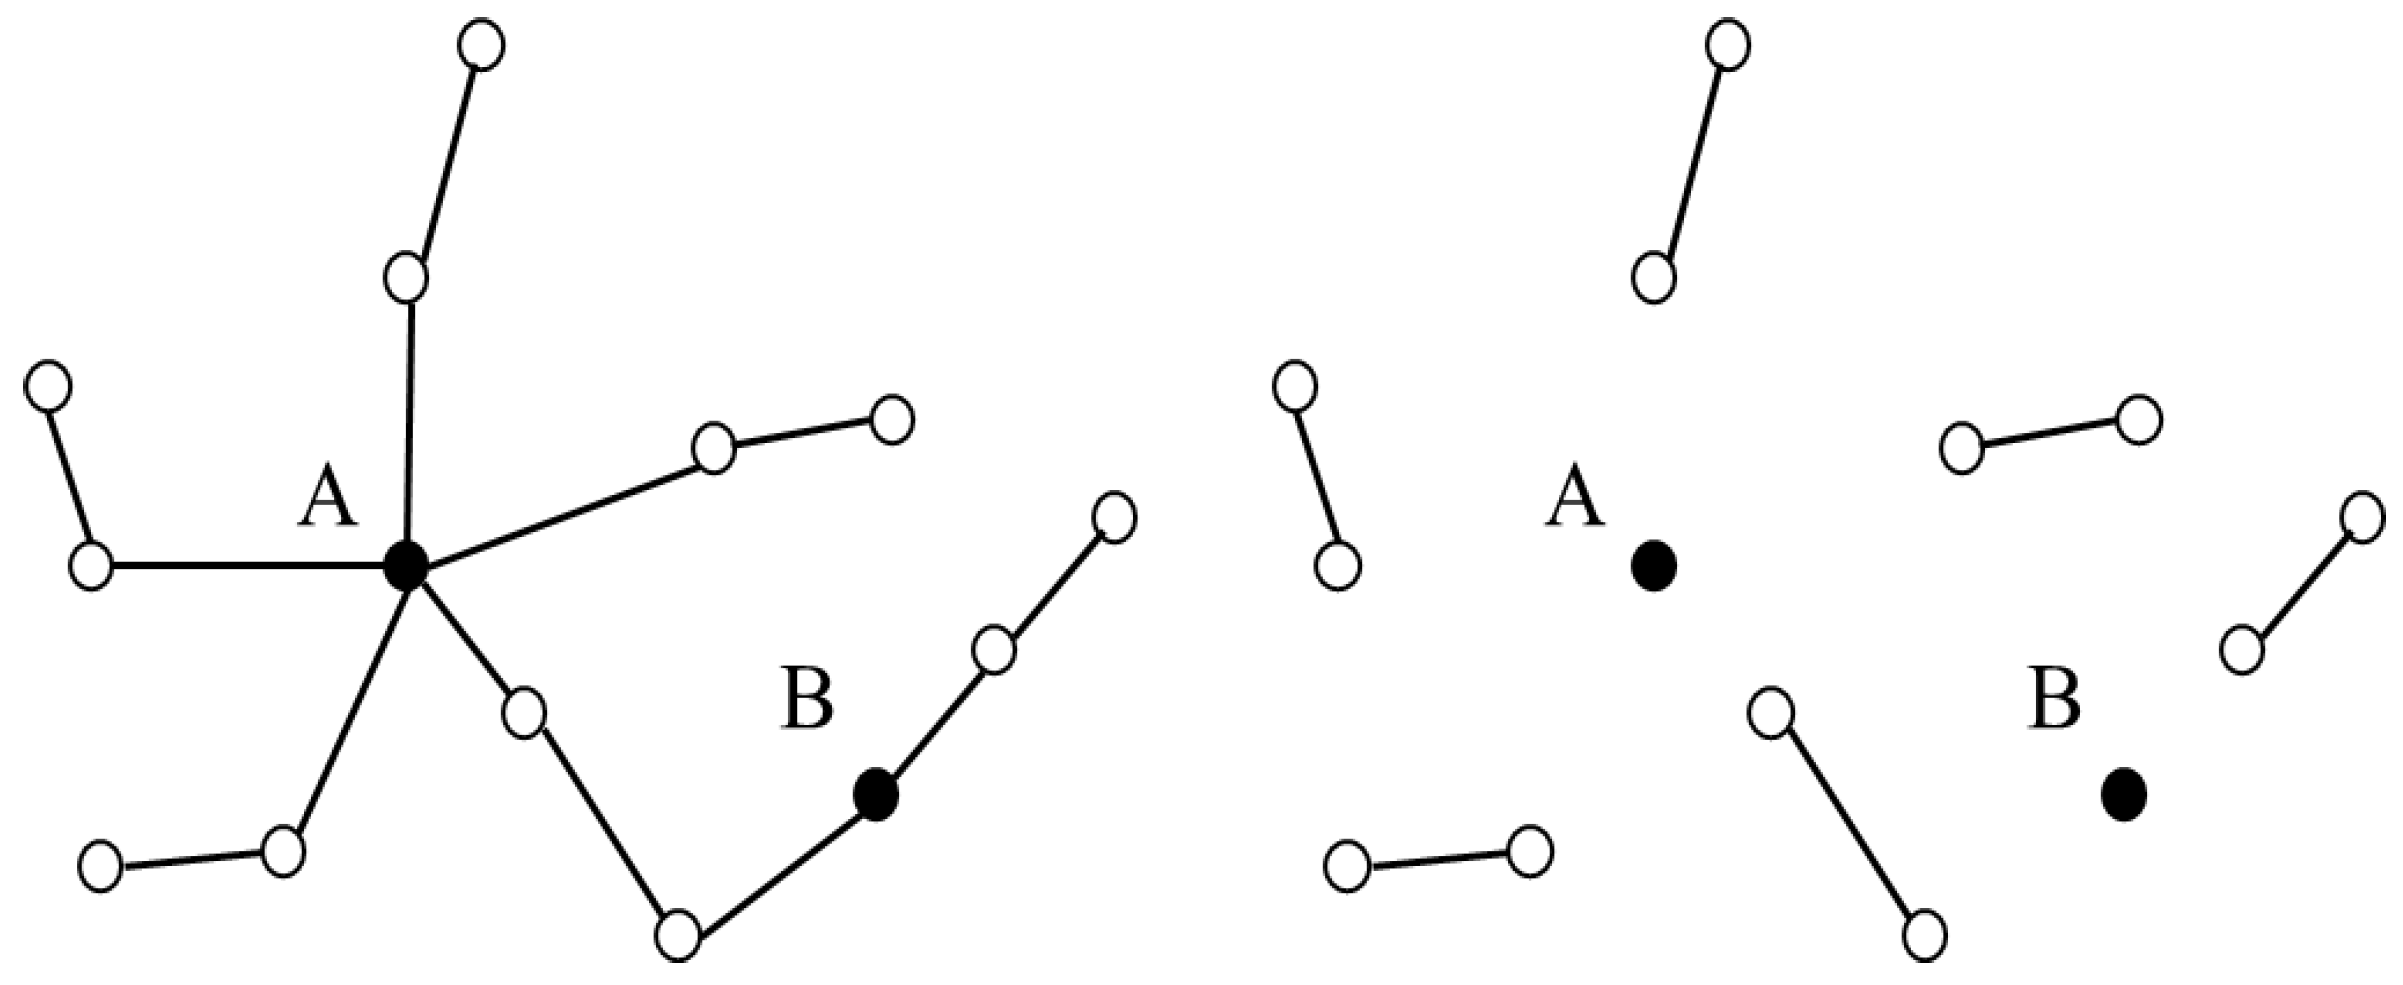
Figure 2.
Impact of stations at different elevations under flood conditions.
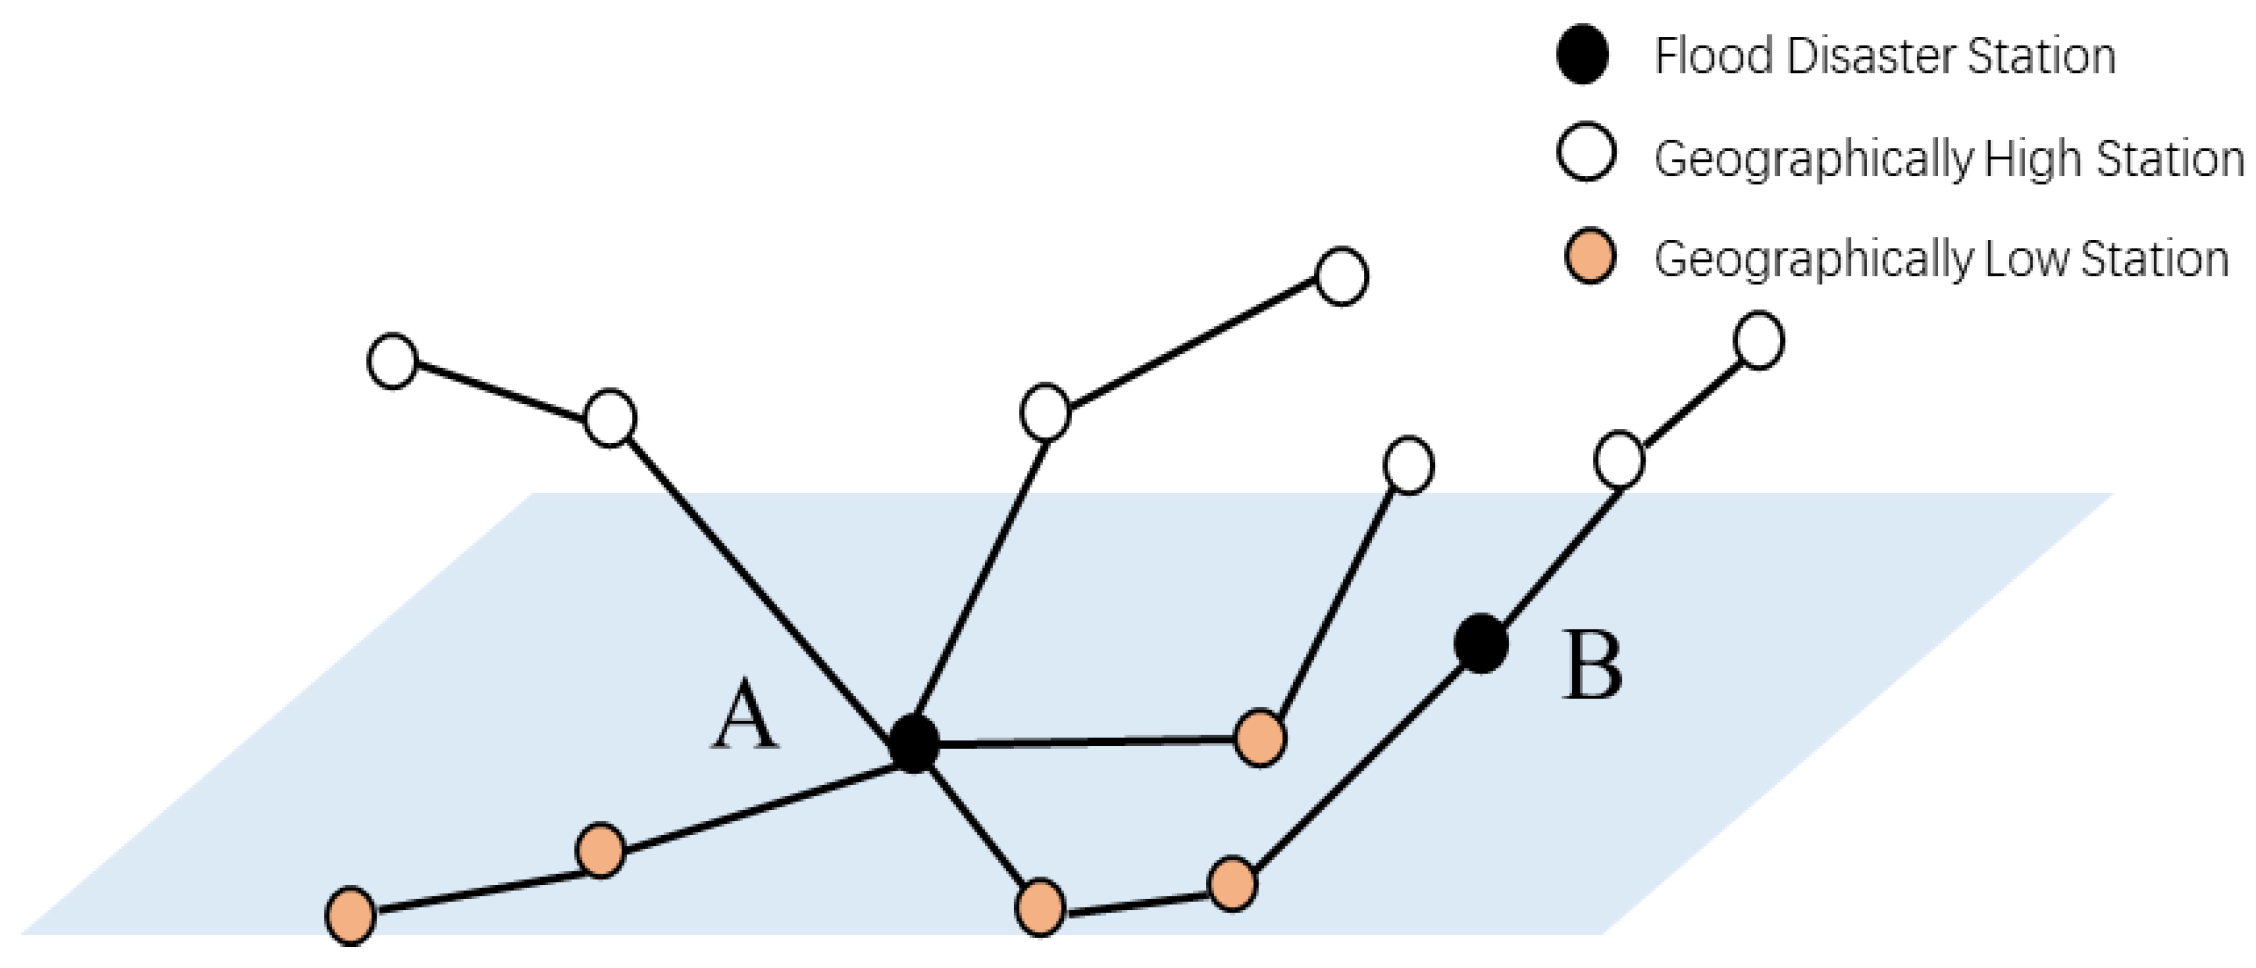
Figure 3.
CML state of station 45 (without disturbance).
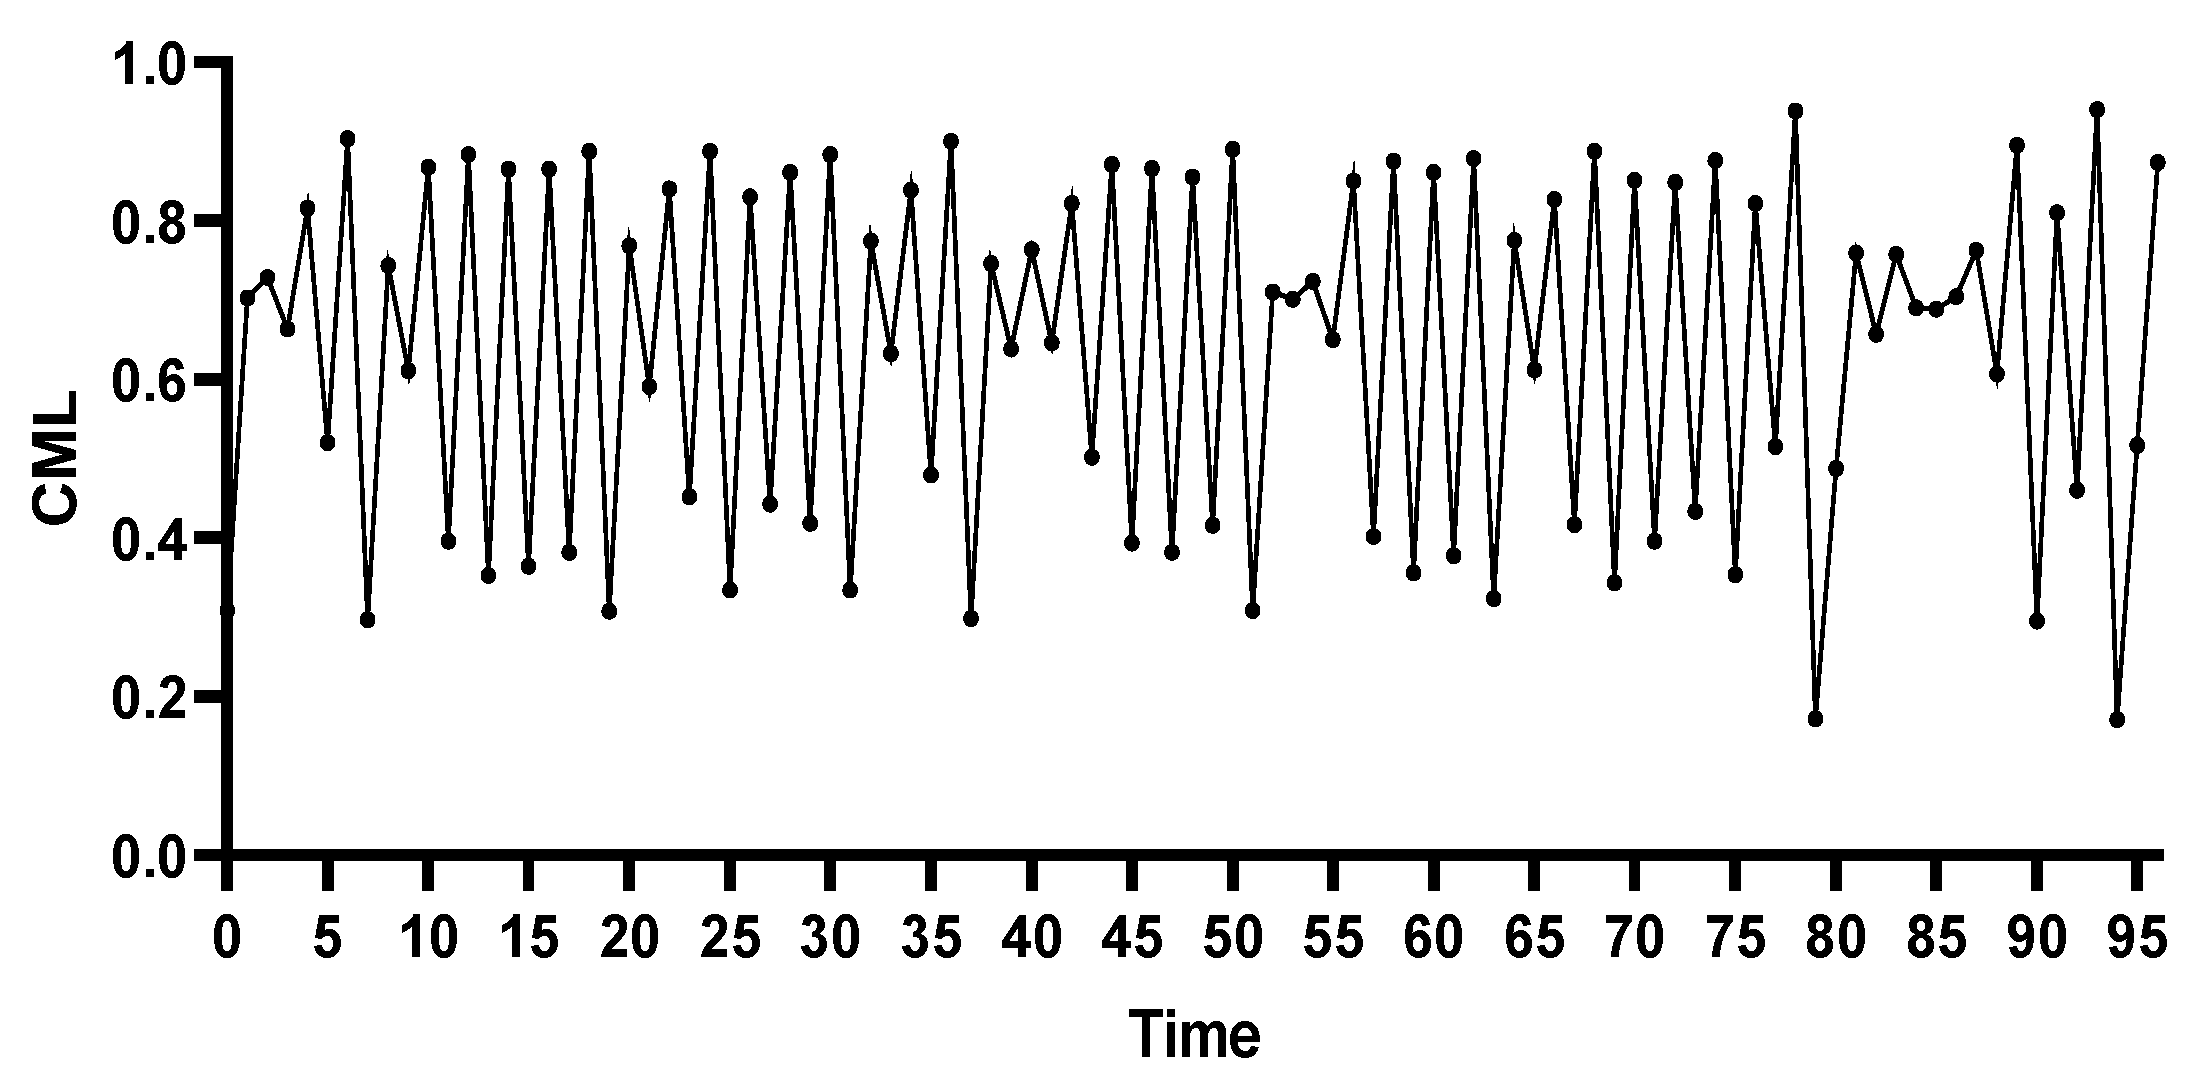
Figure 4.
CML state of station 45 under different coupling coefficients.
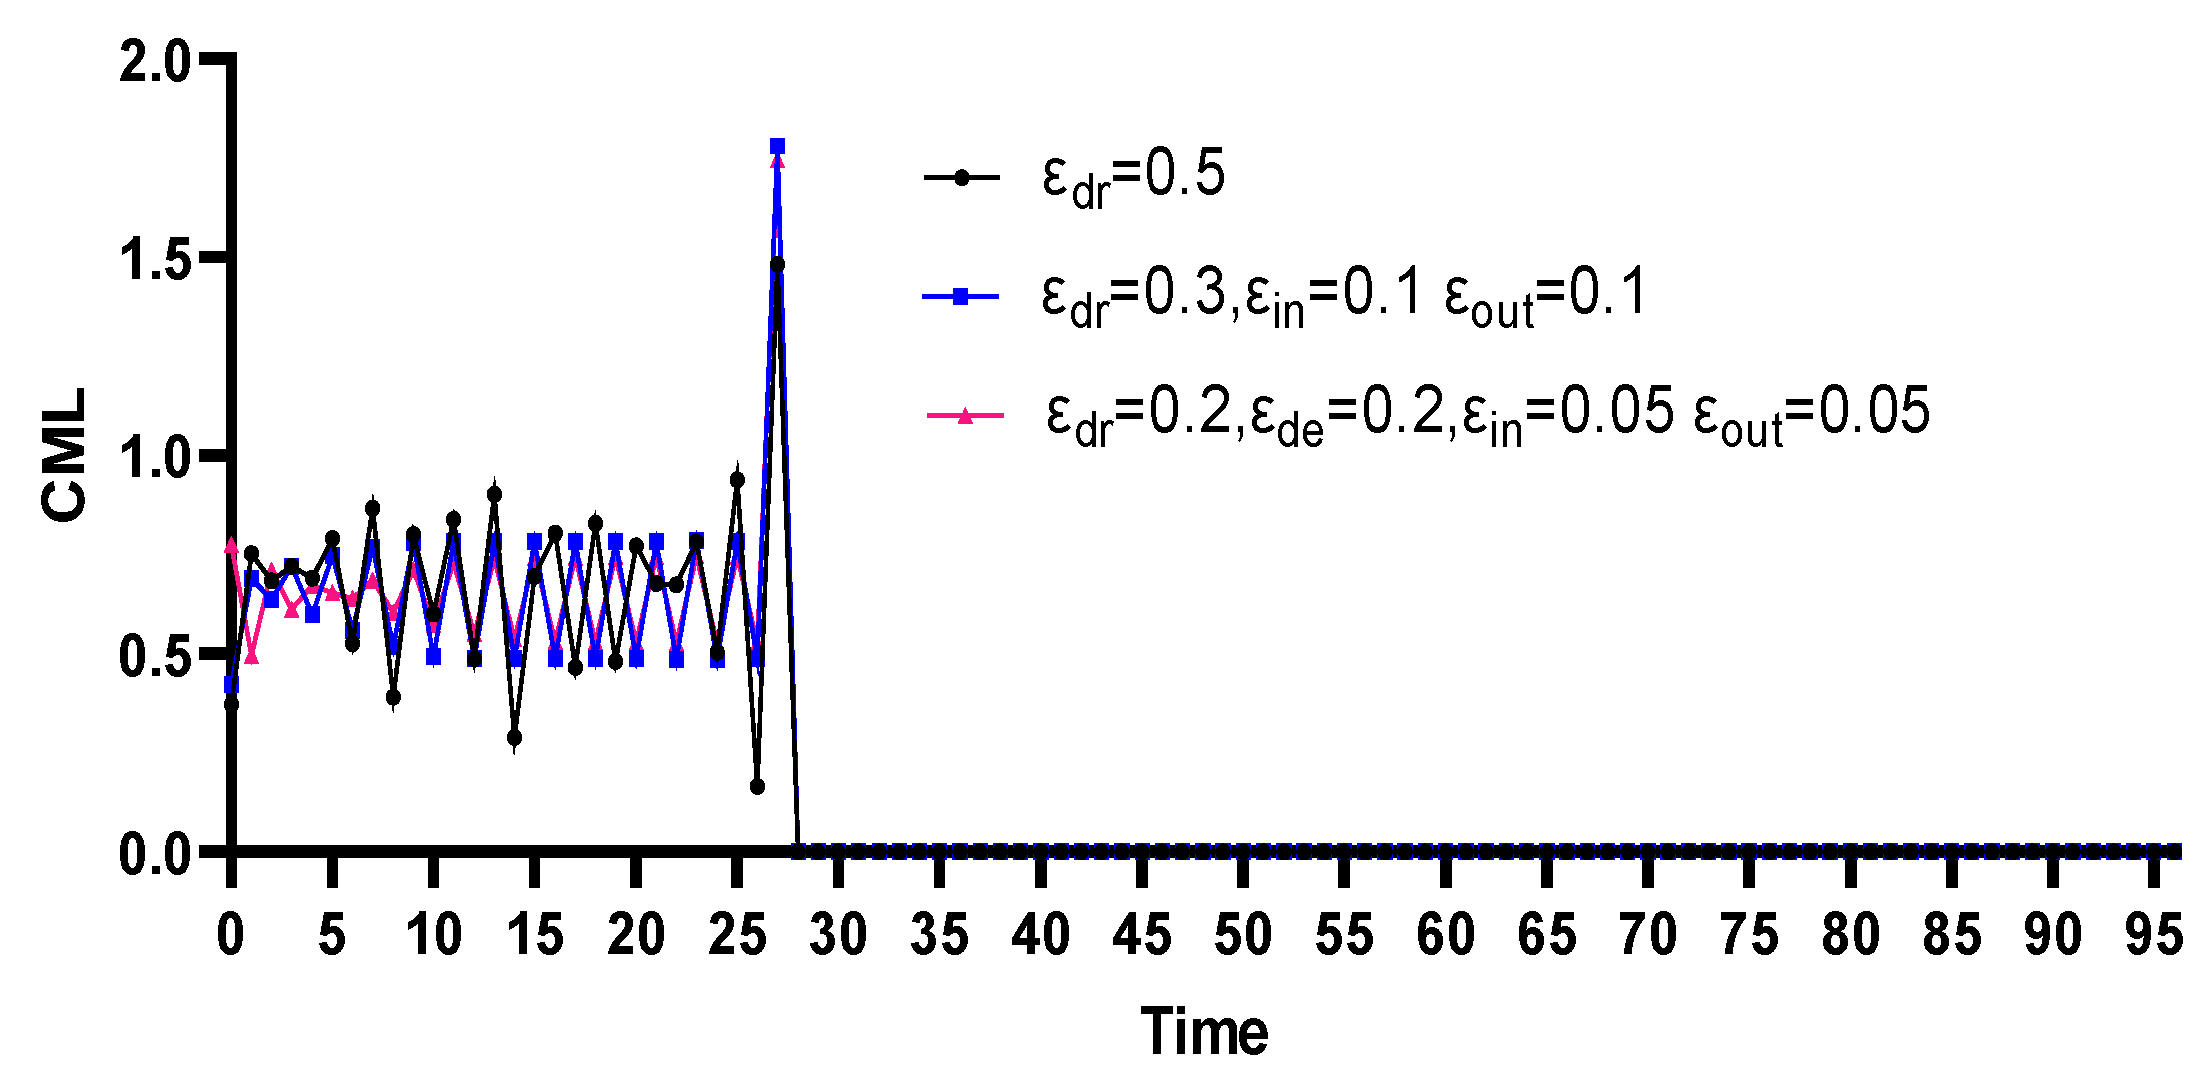
Figure 5.
(a) Condition of failed stations at station 45 under different disturbance;(b) Impact on passenger flow at station 45 under different disturbance.
Figure 5.
(a) Condition of failed stations at station 45 under different disturbance;(b) Impact on passenger flow at station 45 under different disturbance.
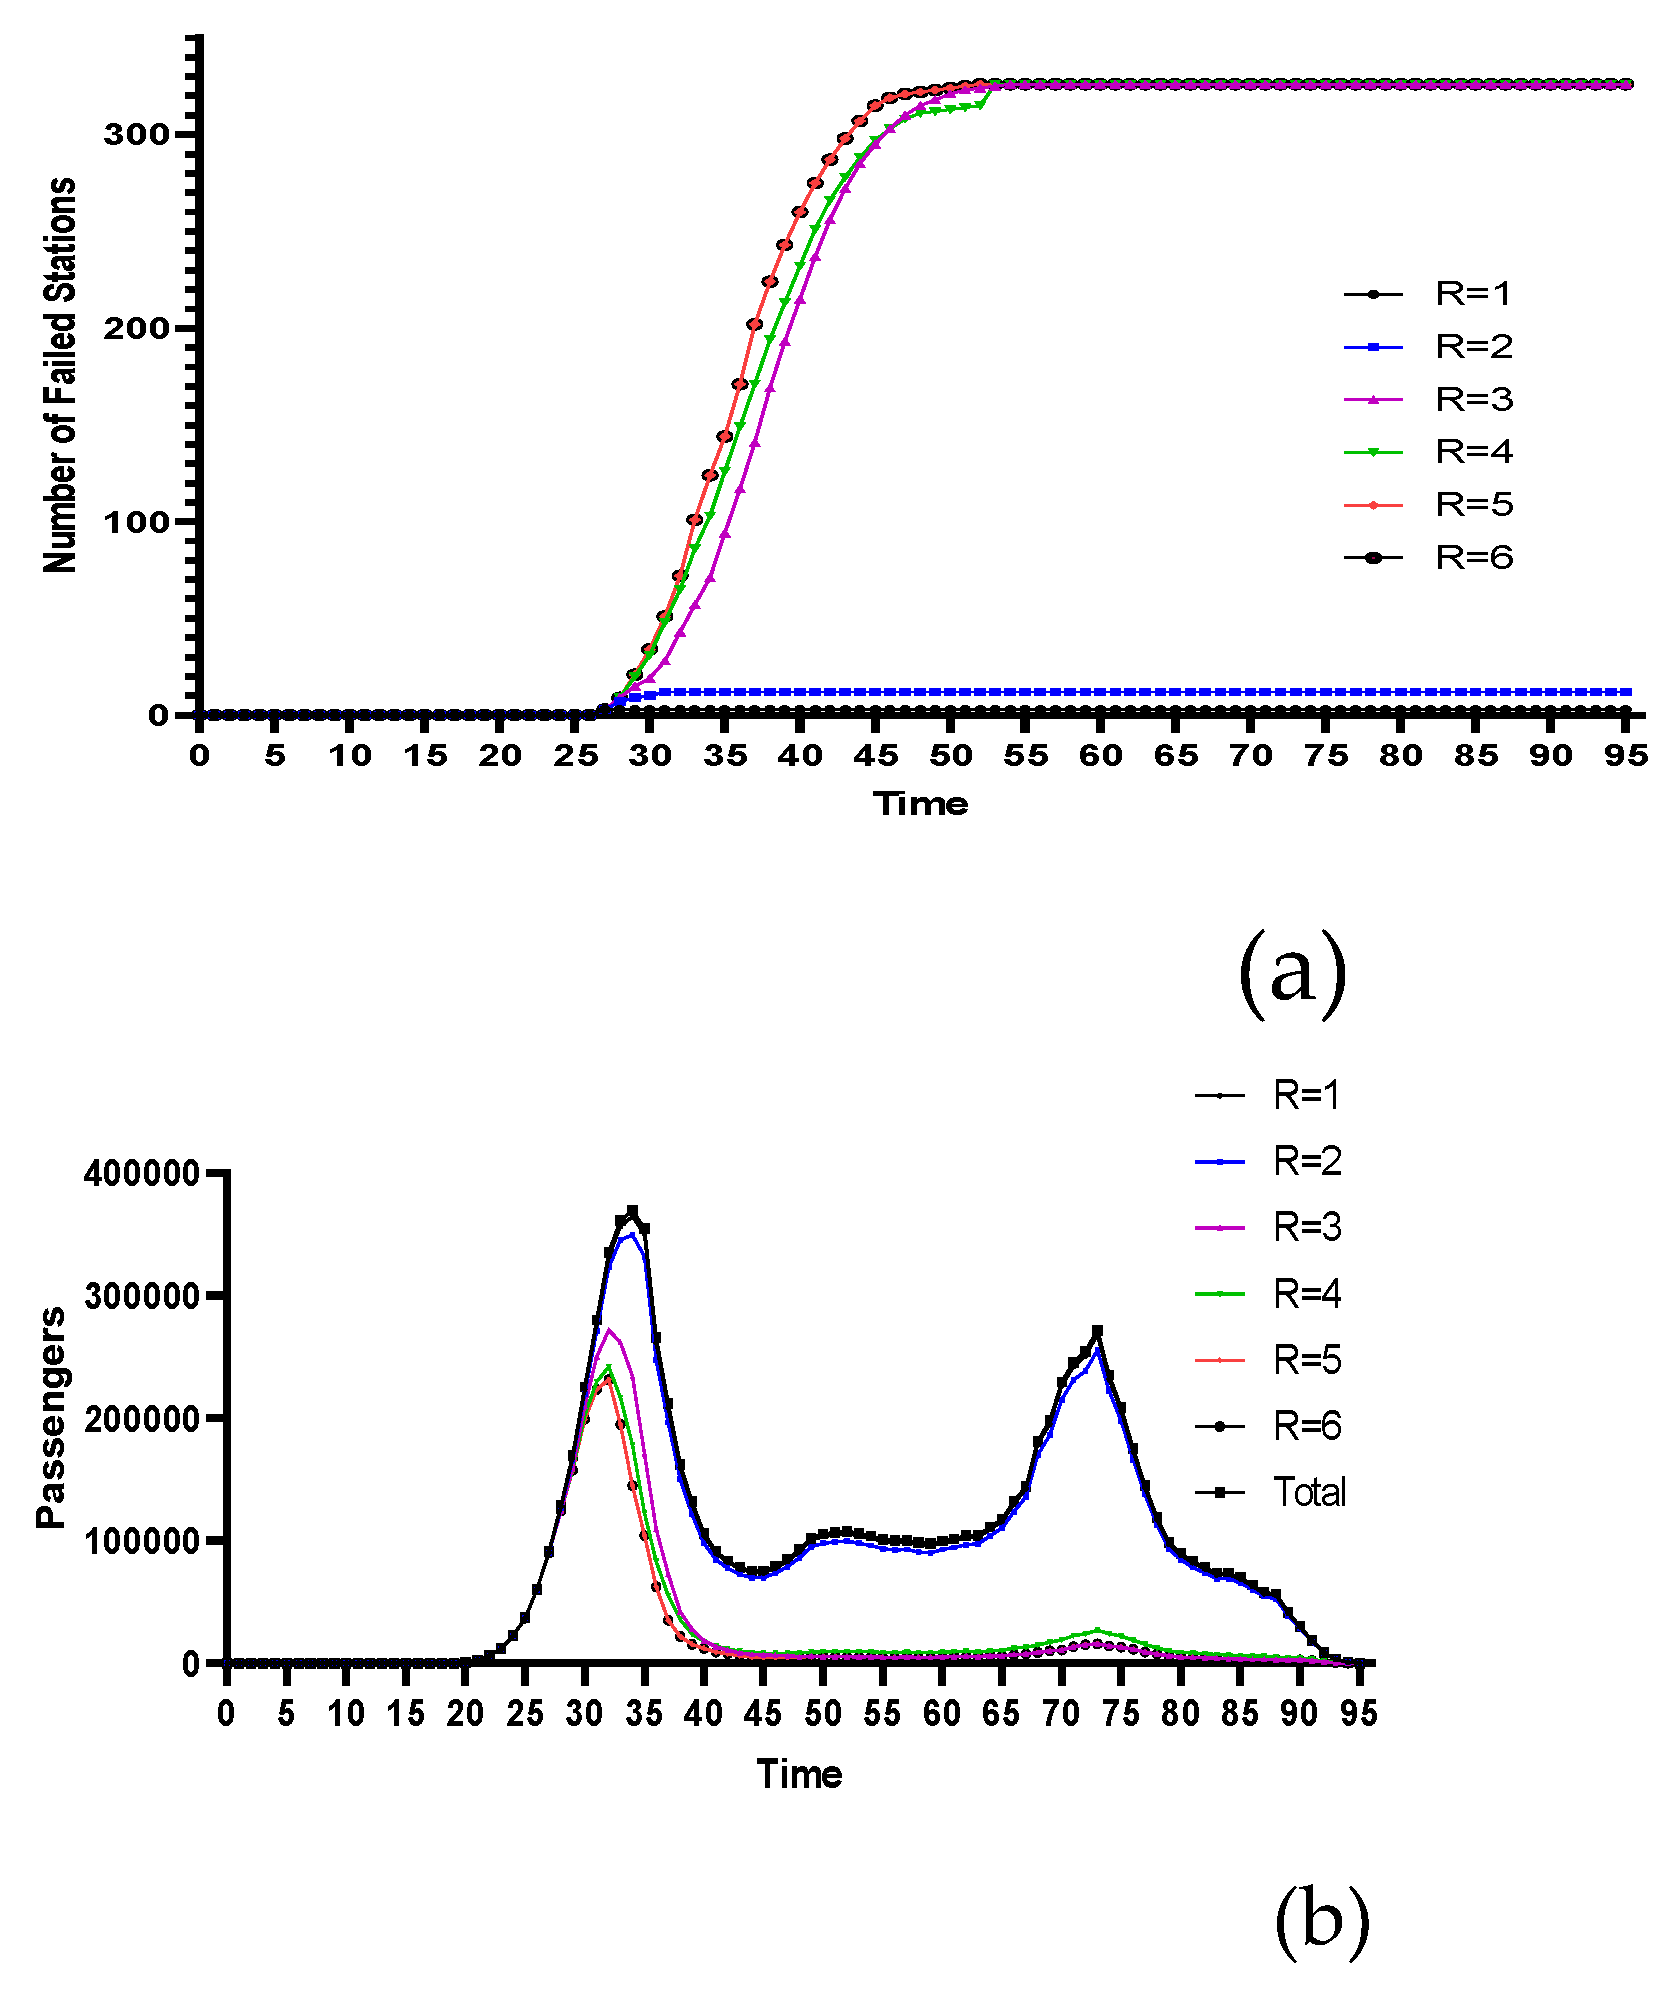
Figure 6.
(a) Cascading failure process under different coupling coefficients of Station 41; (b) Passenger flow changes under different coupling coefficients of Station 41.
Figure 6.
(a) Cascading failure process under different coupling coefficients of Station 41; (b) Passenger flow changes under different coupling coefficients of Station 41.
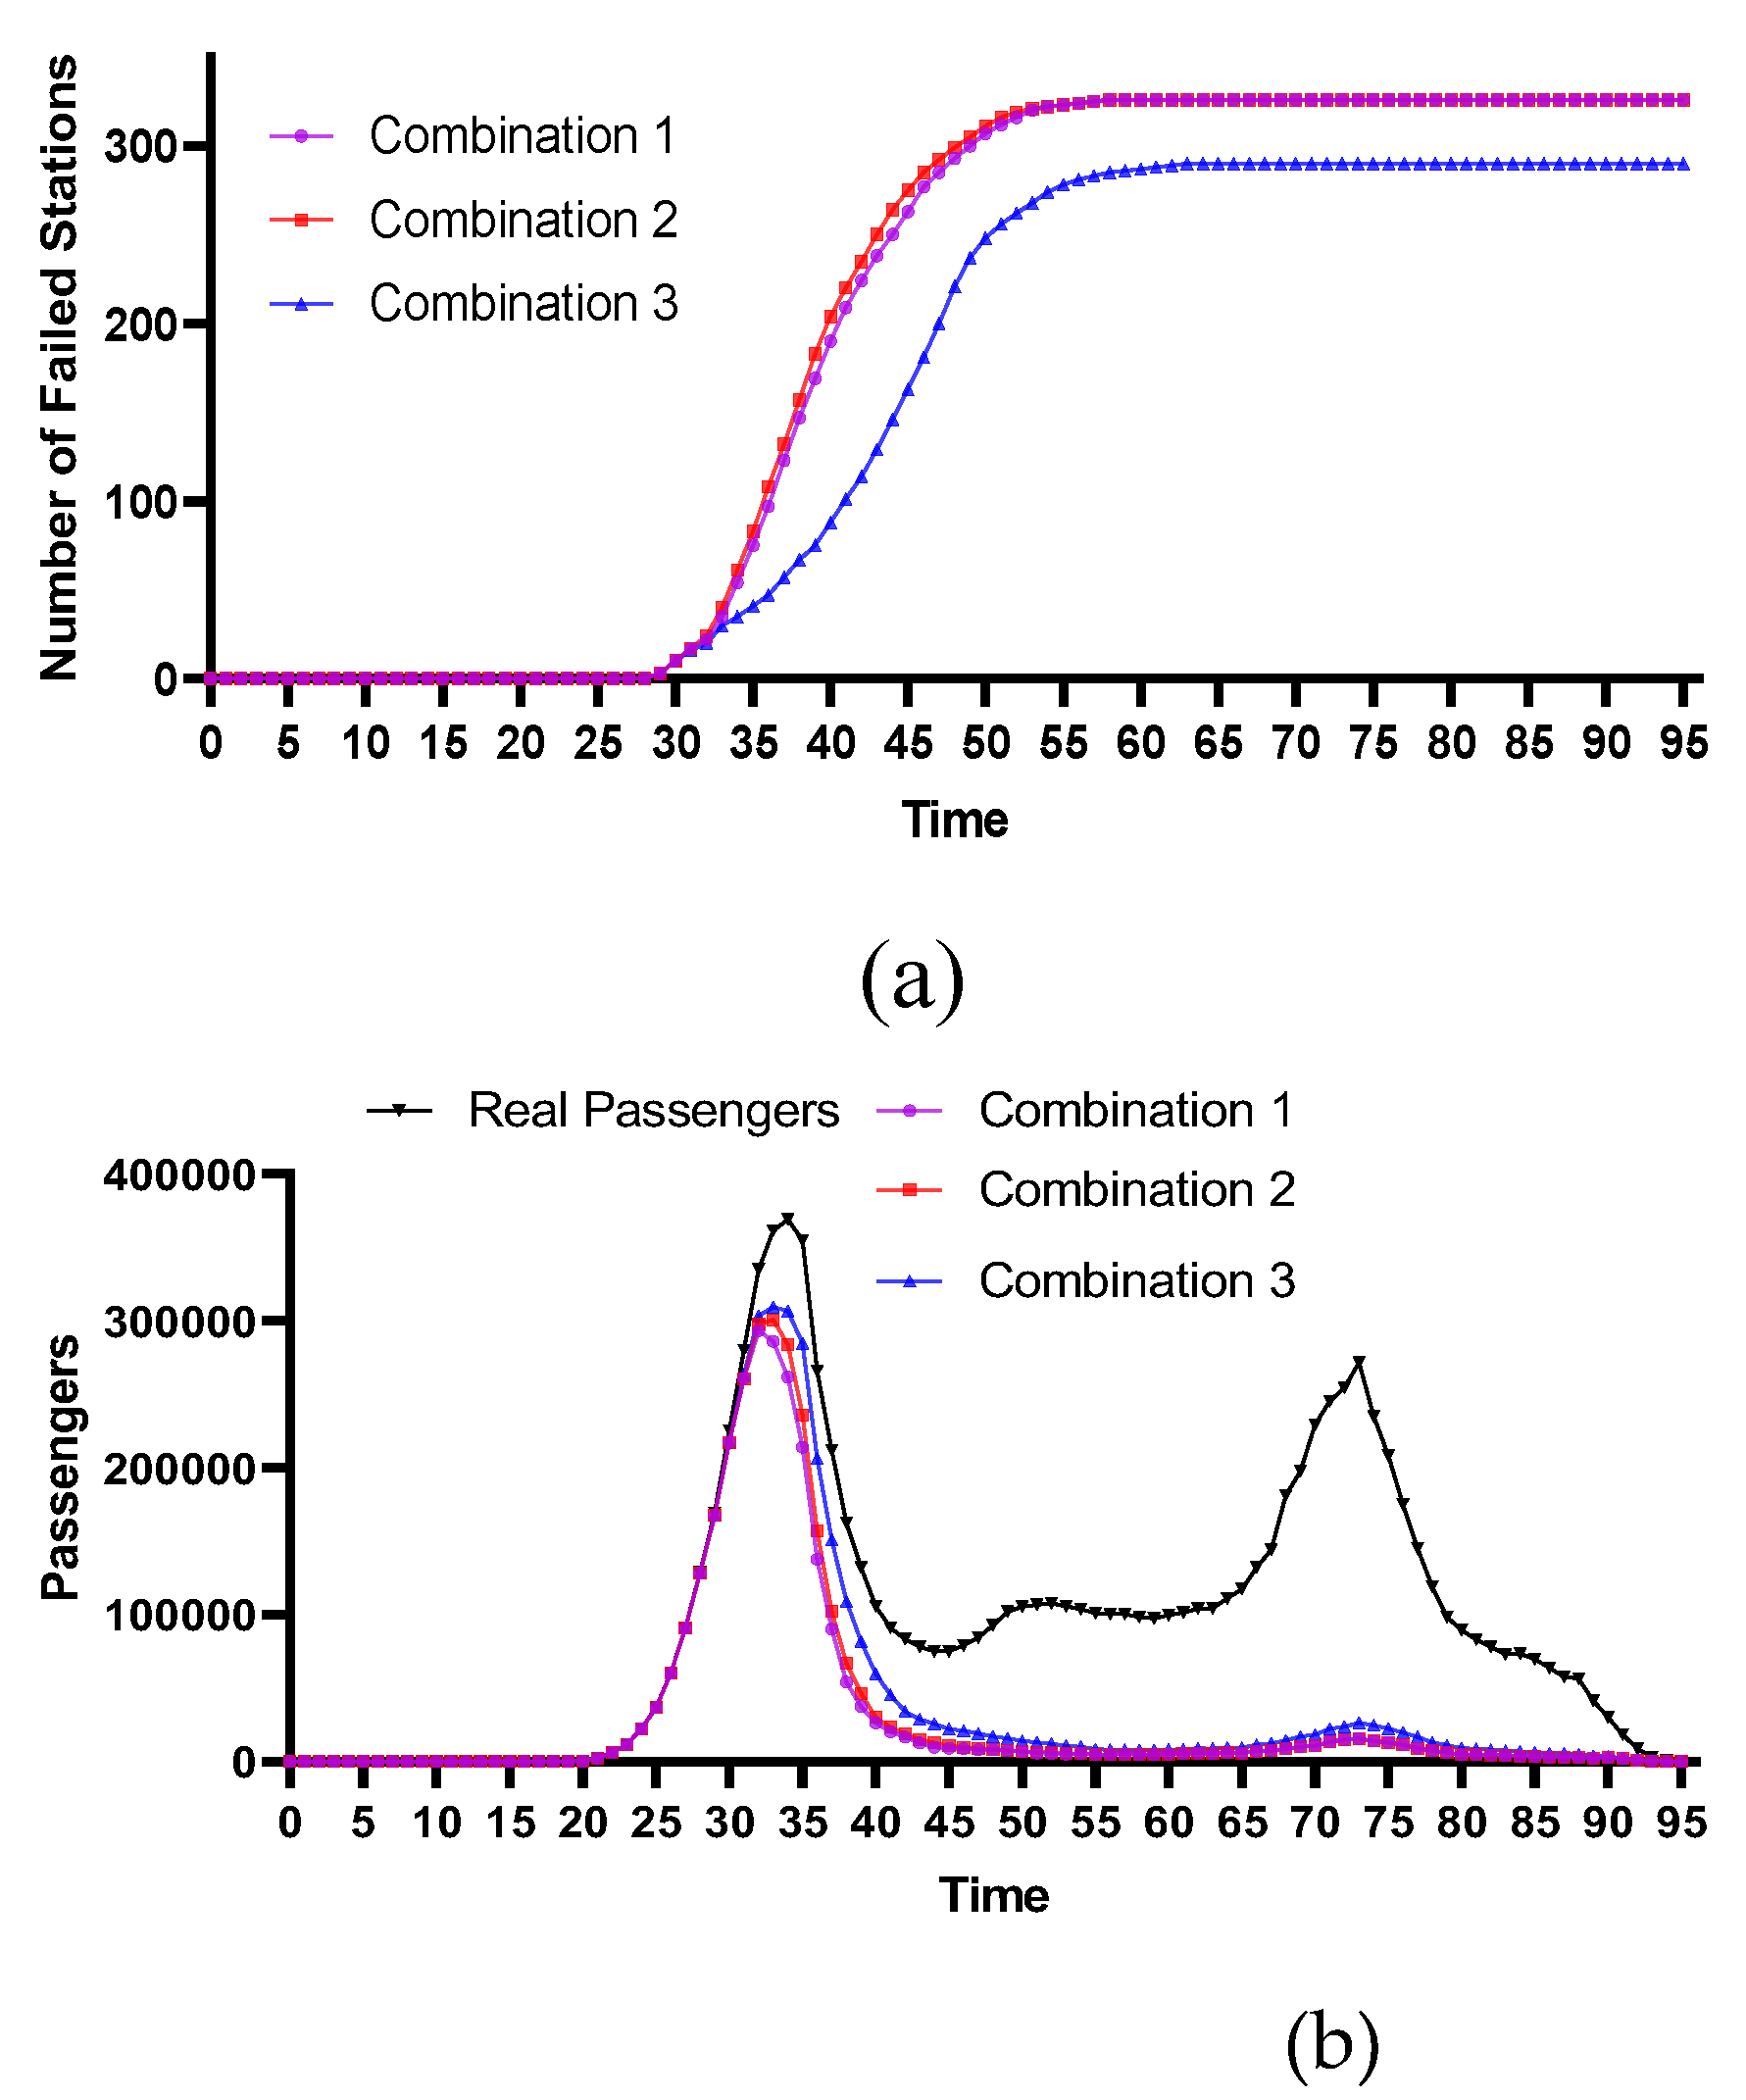
Figure 7.
(a) Cascading failure process under different coupling coefficients of Station 19; (b) Passenger flow changes under different coupling coefficients of Station 19.
Figure 7.
(a) Cascading failure process under different coupling coefficients of Station 19; (b) Passenger flow changes under different coupling coefficients of Station 19.
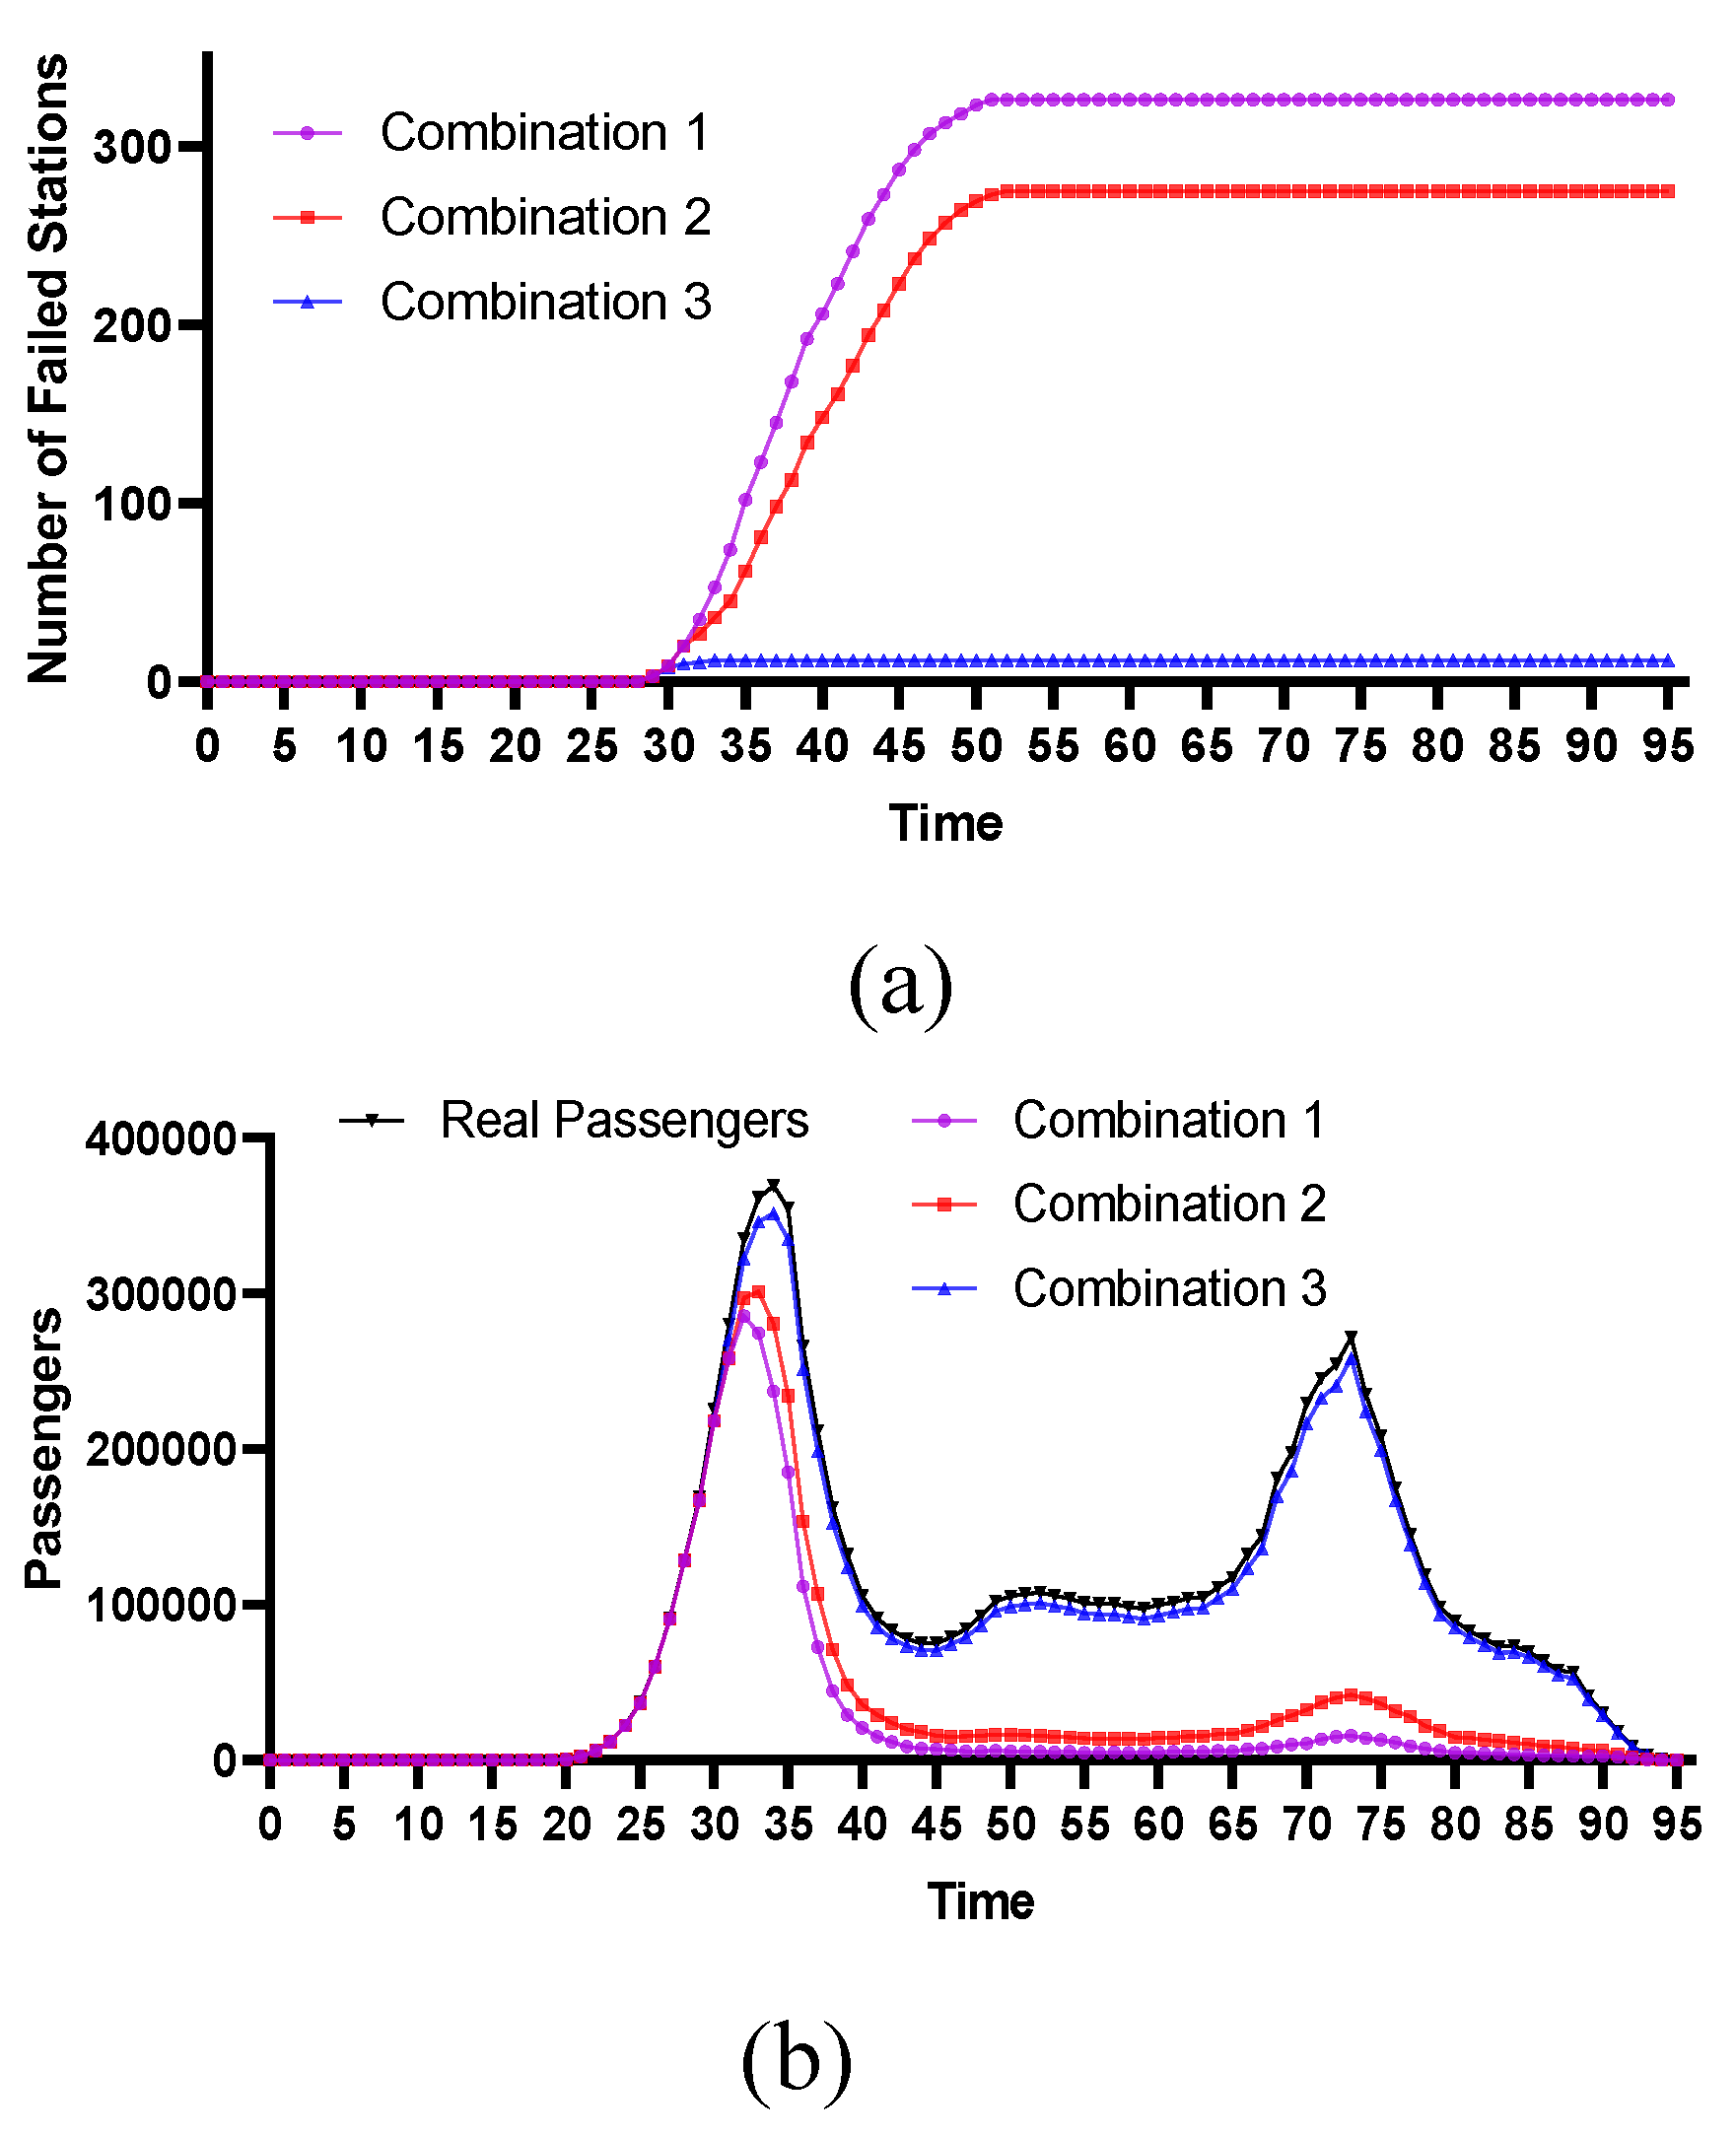
Figure 8.
(a) Cascading failure process under different coupling coefficients of Station 45; (b) Passenger flow changes under different coupling coefficients of Station 45.
Figure 8.
(a) Cascading failure process under different coupling coefficients of Station 45; (b) Passenger flow changes under different coupling coefficients of Station 45.
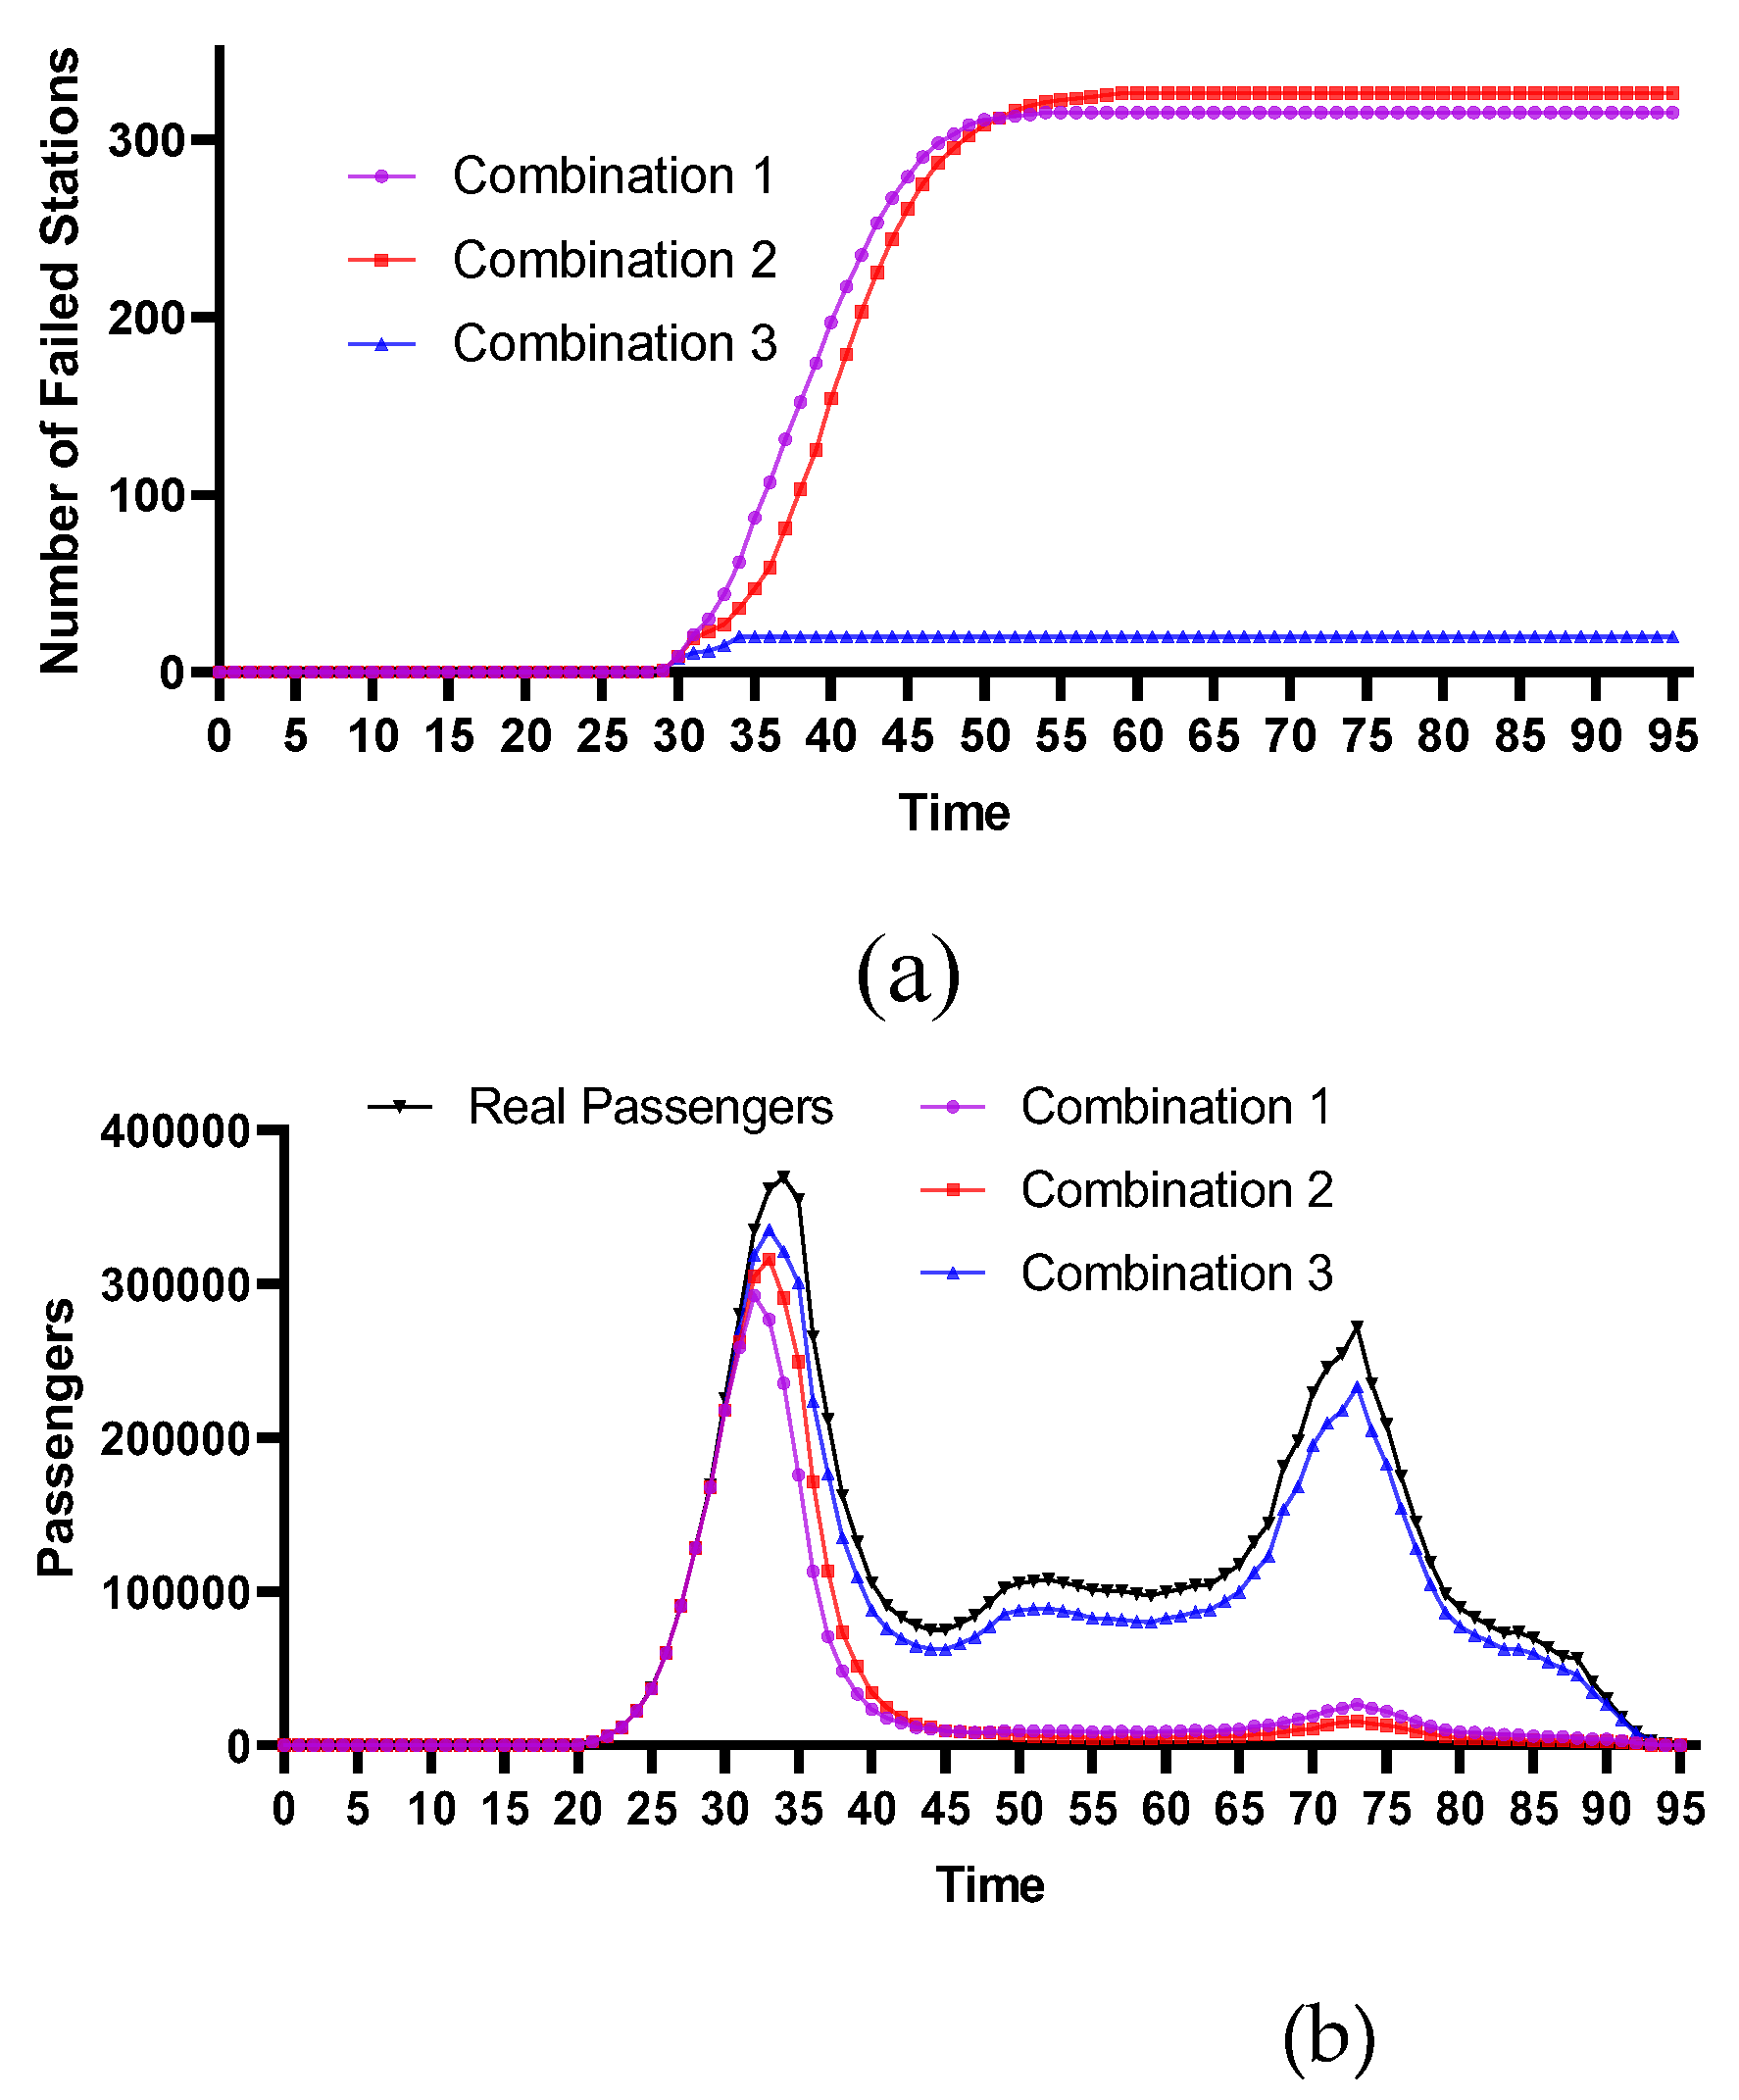
Figure 9.
(a) Cascading failure process under different coupling coefficients of Station 159; (b) Passenger flow changes under different coupling coefficients of Station 159.
Figure 9.
(a) Cascading failure process under different coupling coefficients of Station 159; (b) Passenger flow changes under different coupling coefficients of Station 159.
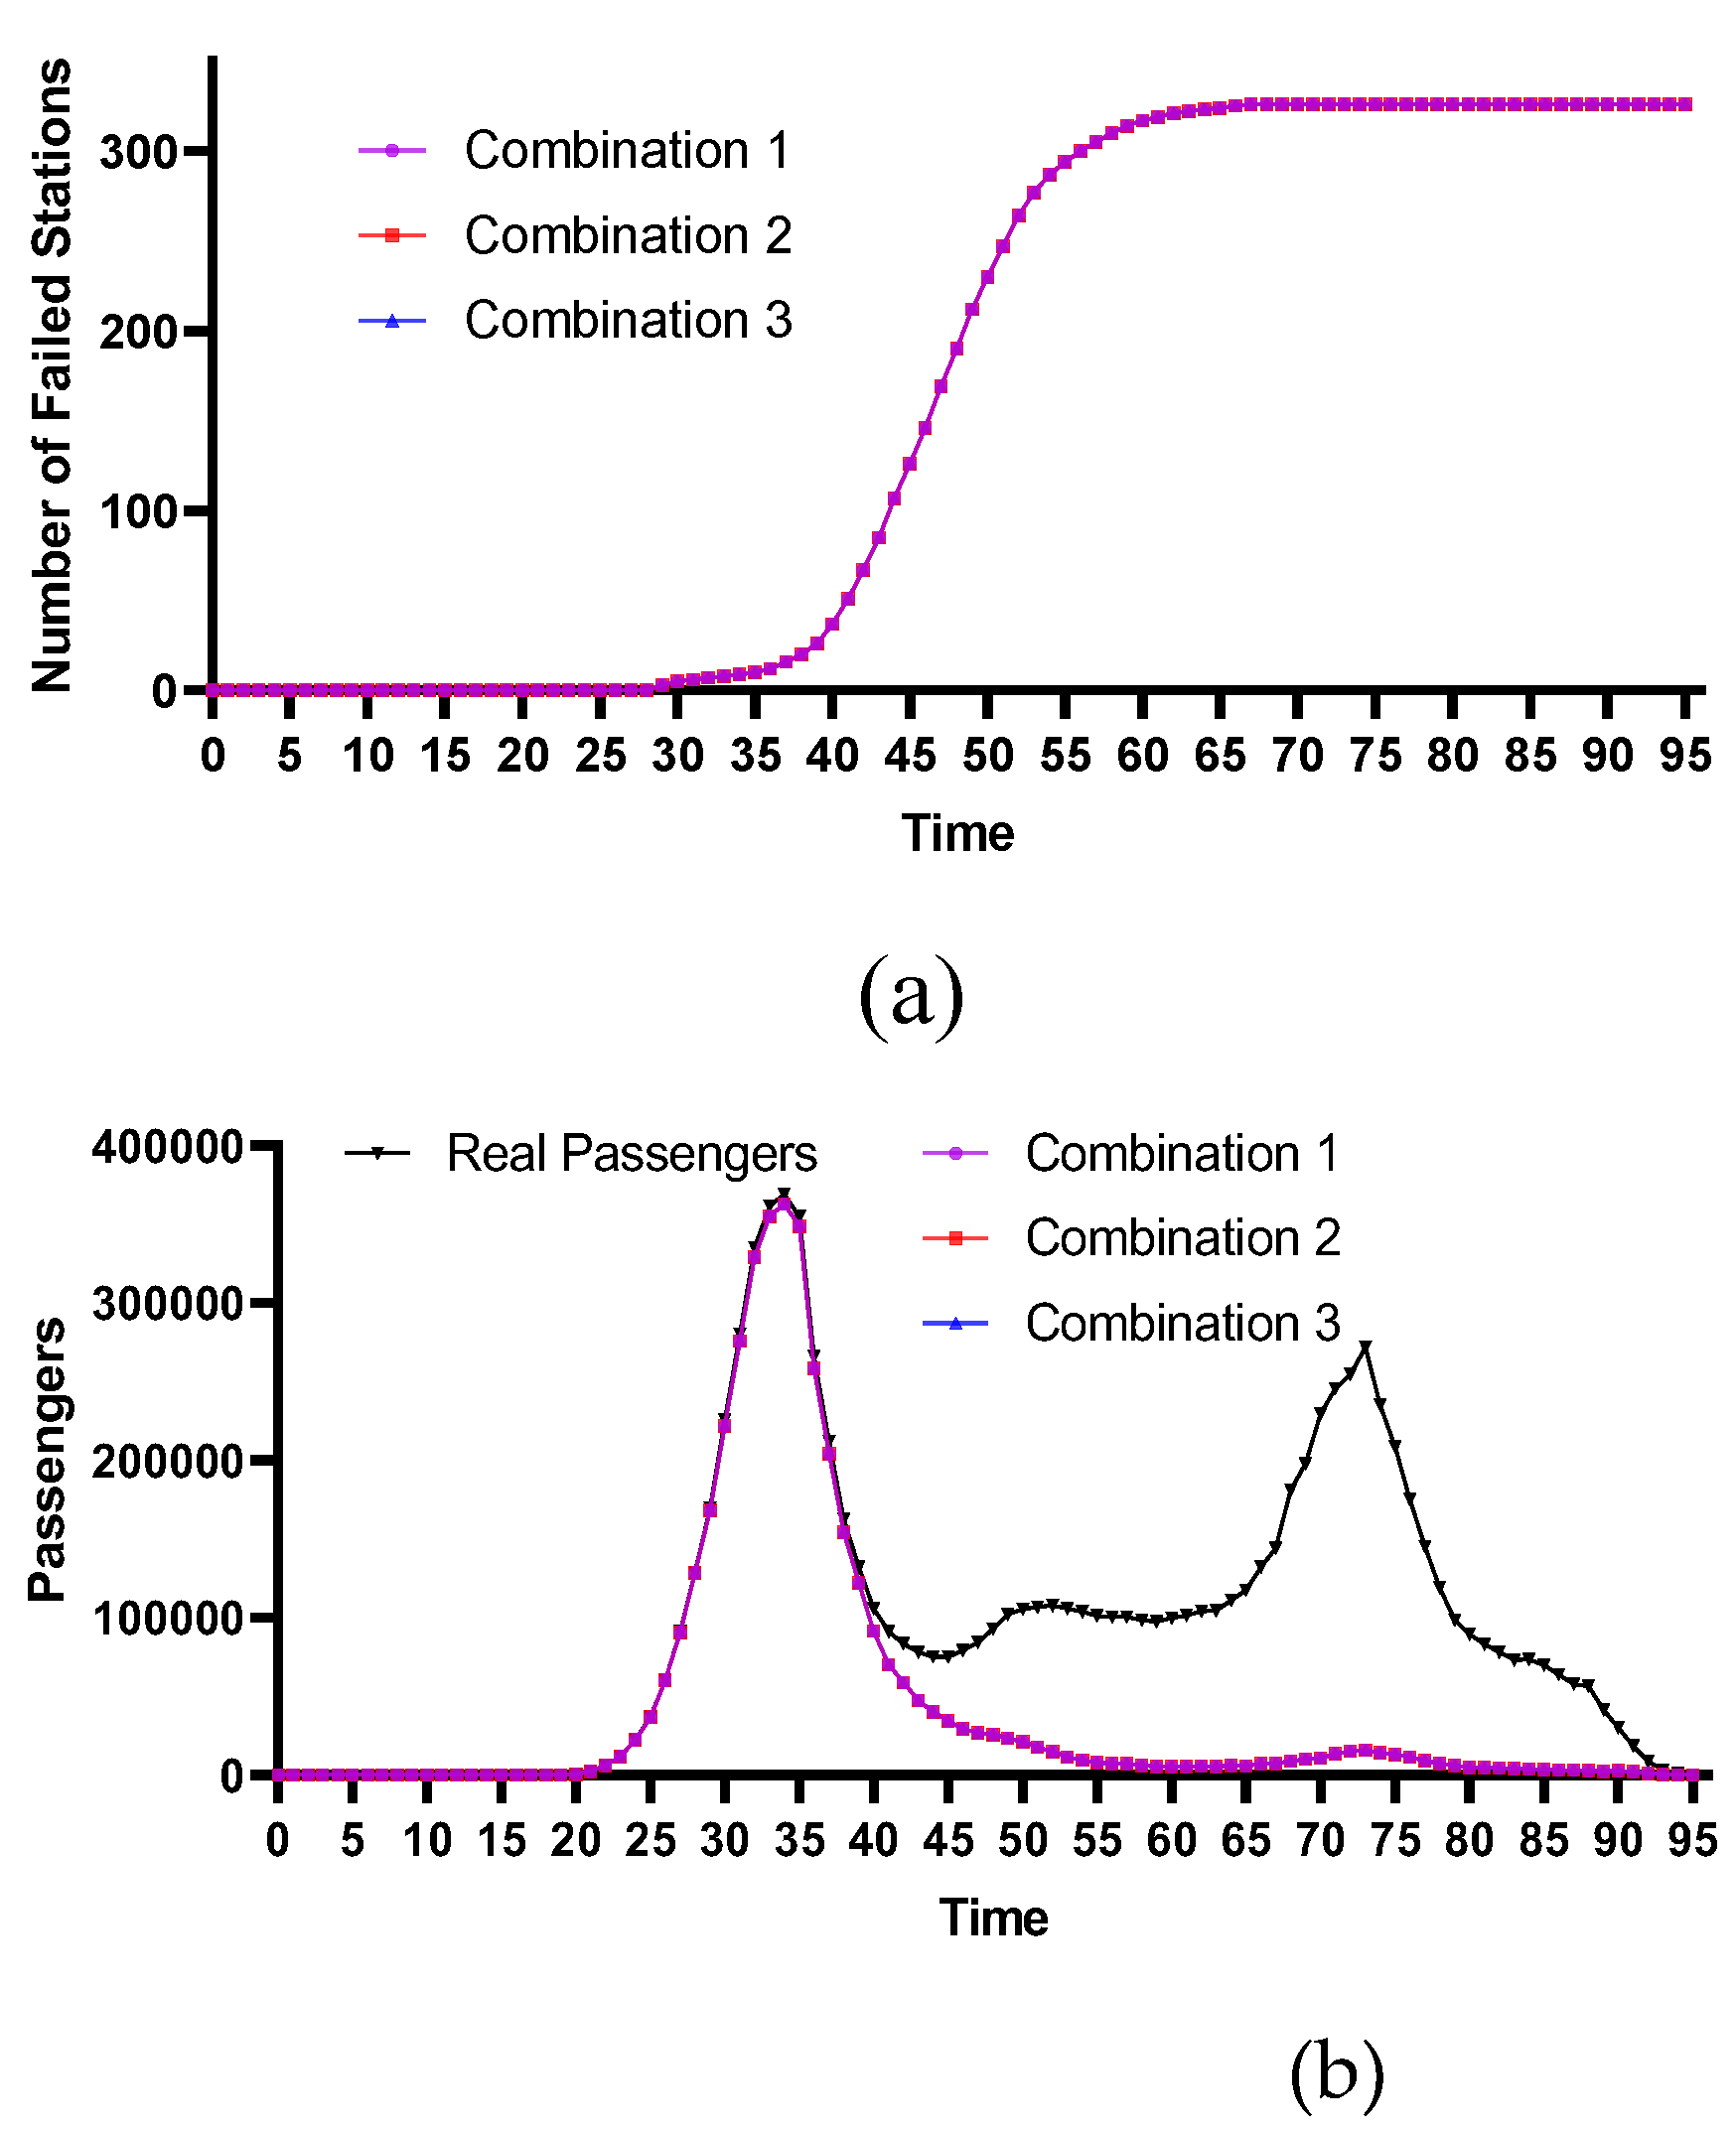
Figure 10.
(a) Cascading failure process under different coupling coefficients of Station 164; (b) Passenger flow changes under different coupling coefficients of Station 164.
Figure 10.
(a) Cascading failure process under different coupling coefficients of Station 164; (b) Passenger flow changes under different coupling coefficients of Station 164.
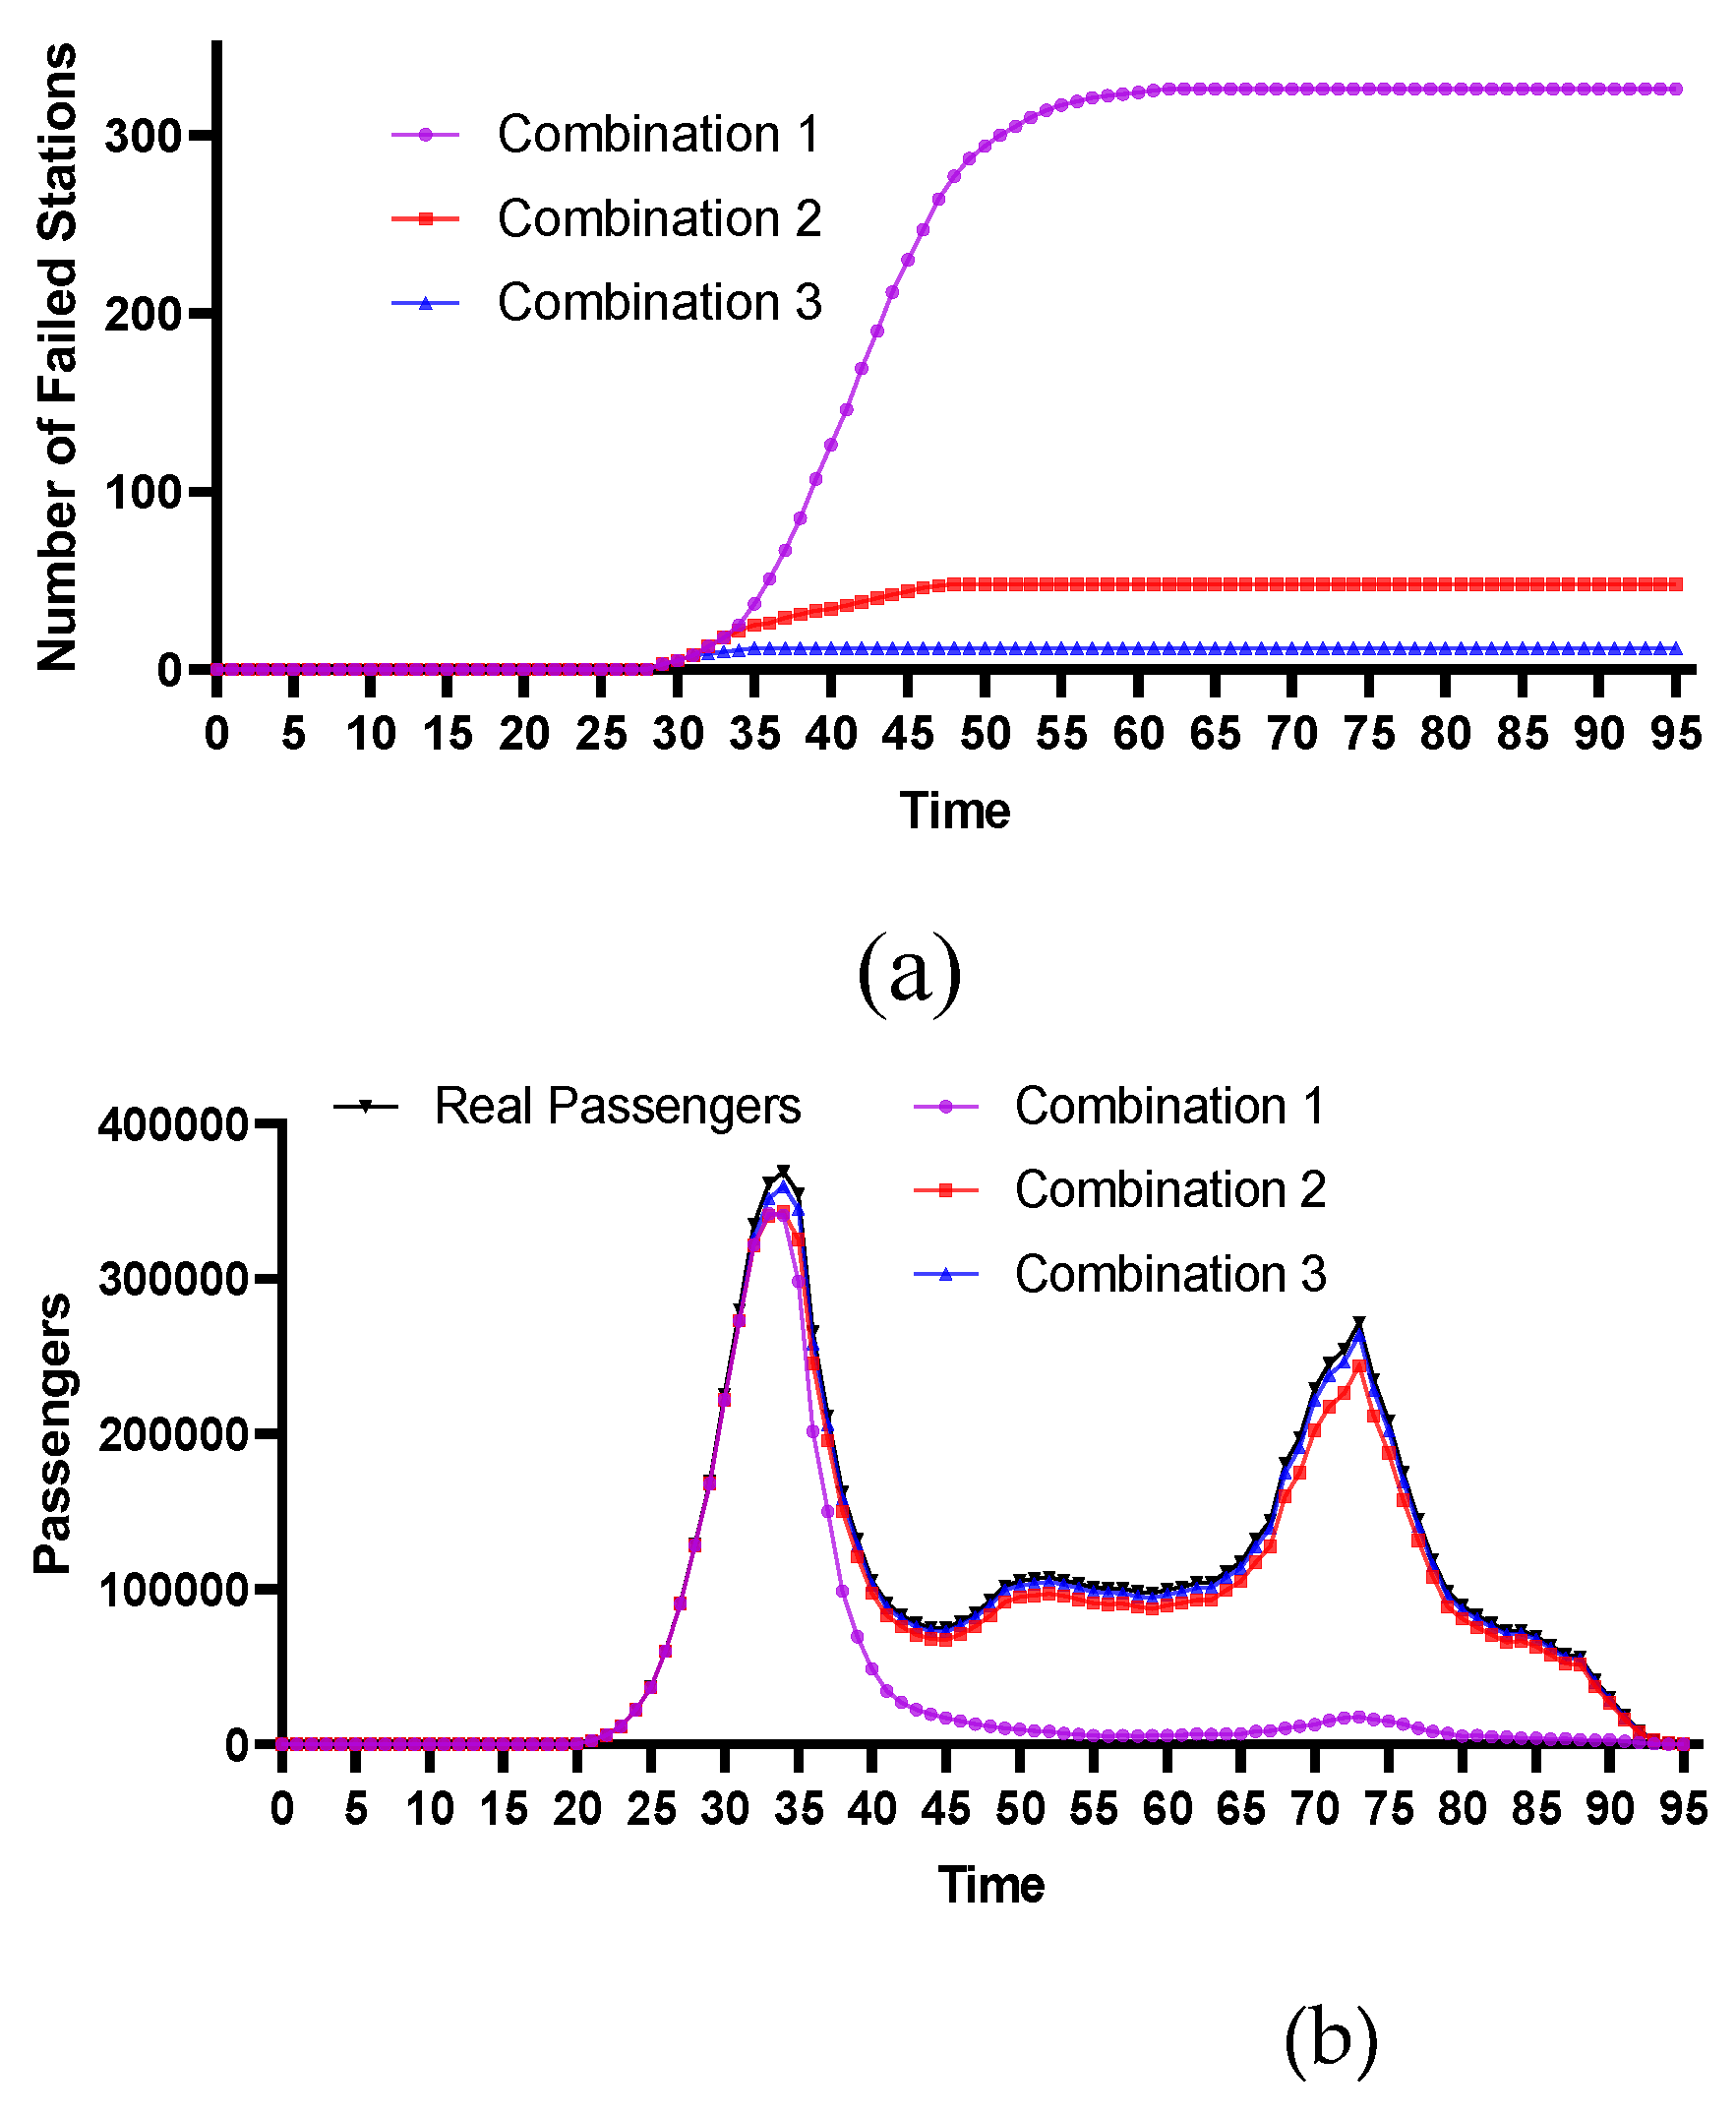
Figure 11.
(a) Cascading failure process under different coupling coefficients of Station 189; (b) Passenger flow changes under different coupling coefficients of Station 189.
Figure 11.
(a) Cascading failure process under different coupling coefficients of Station 189; (b) Passenger flow changes under different coupling coefficients of Station 189.
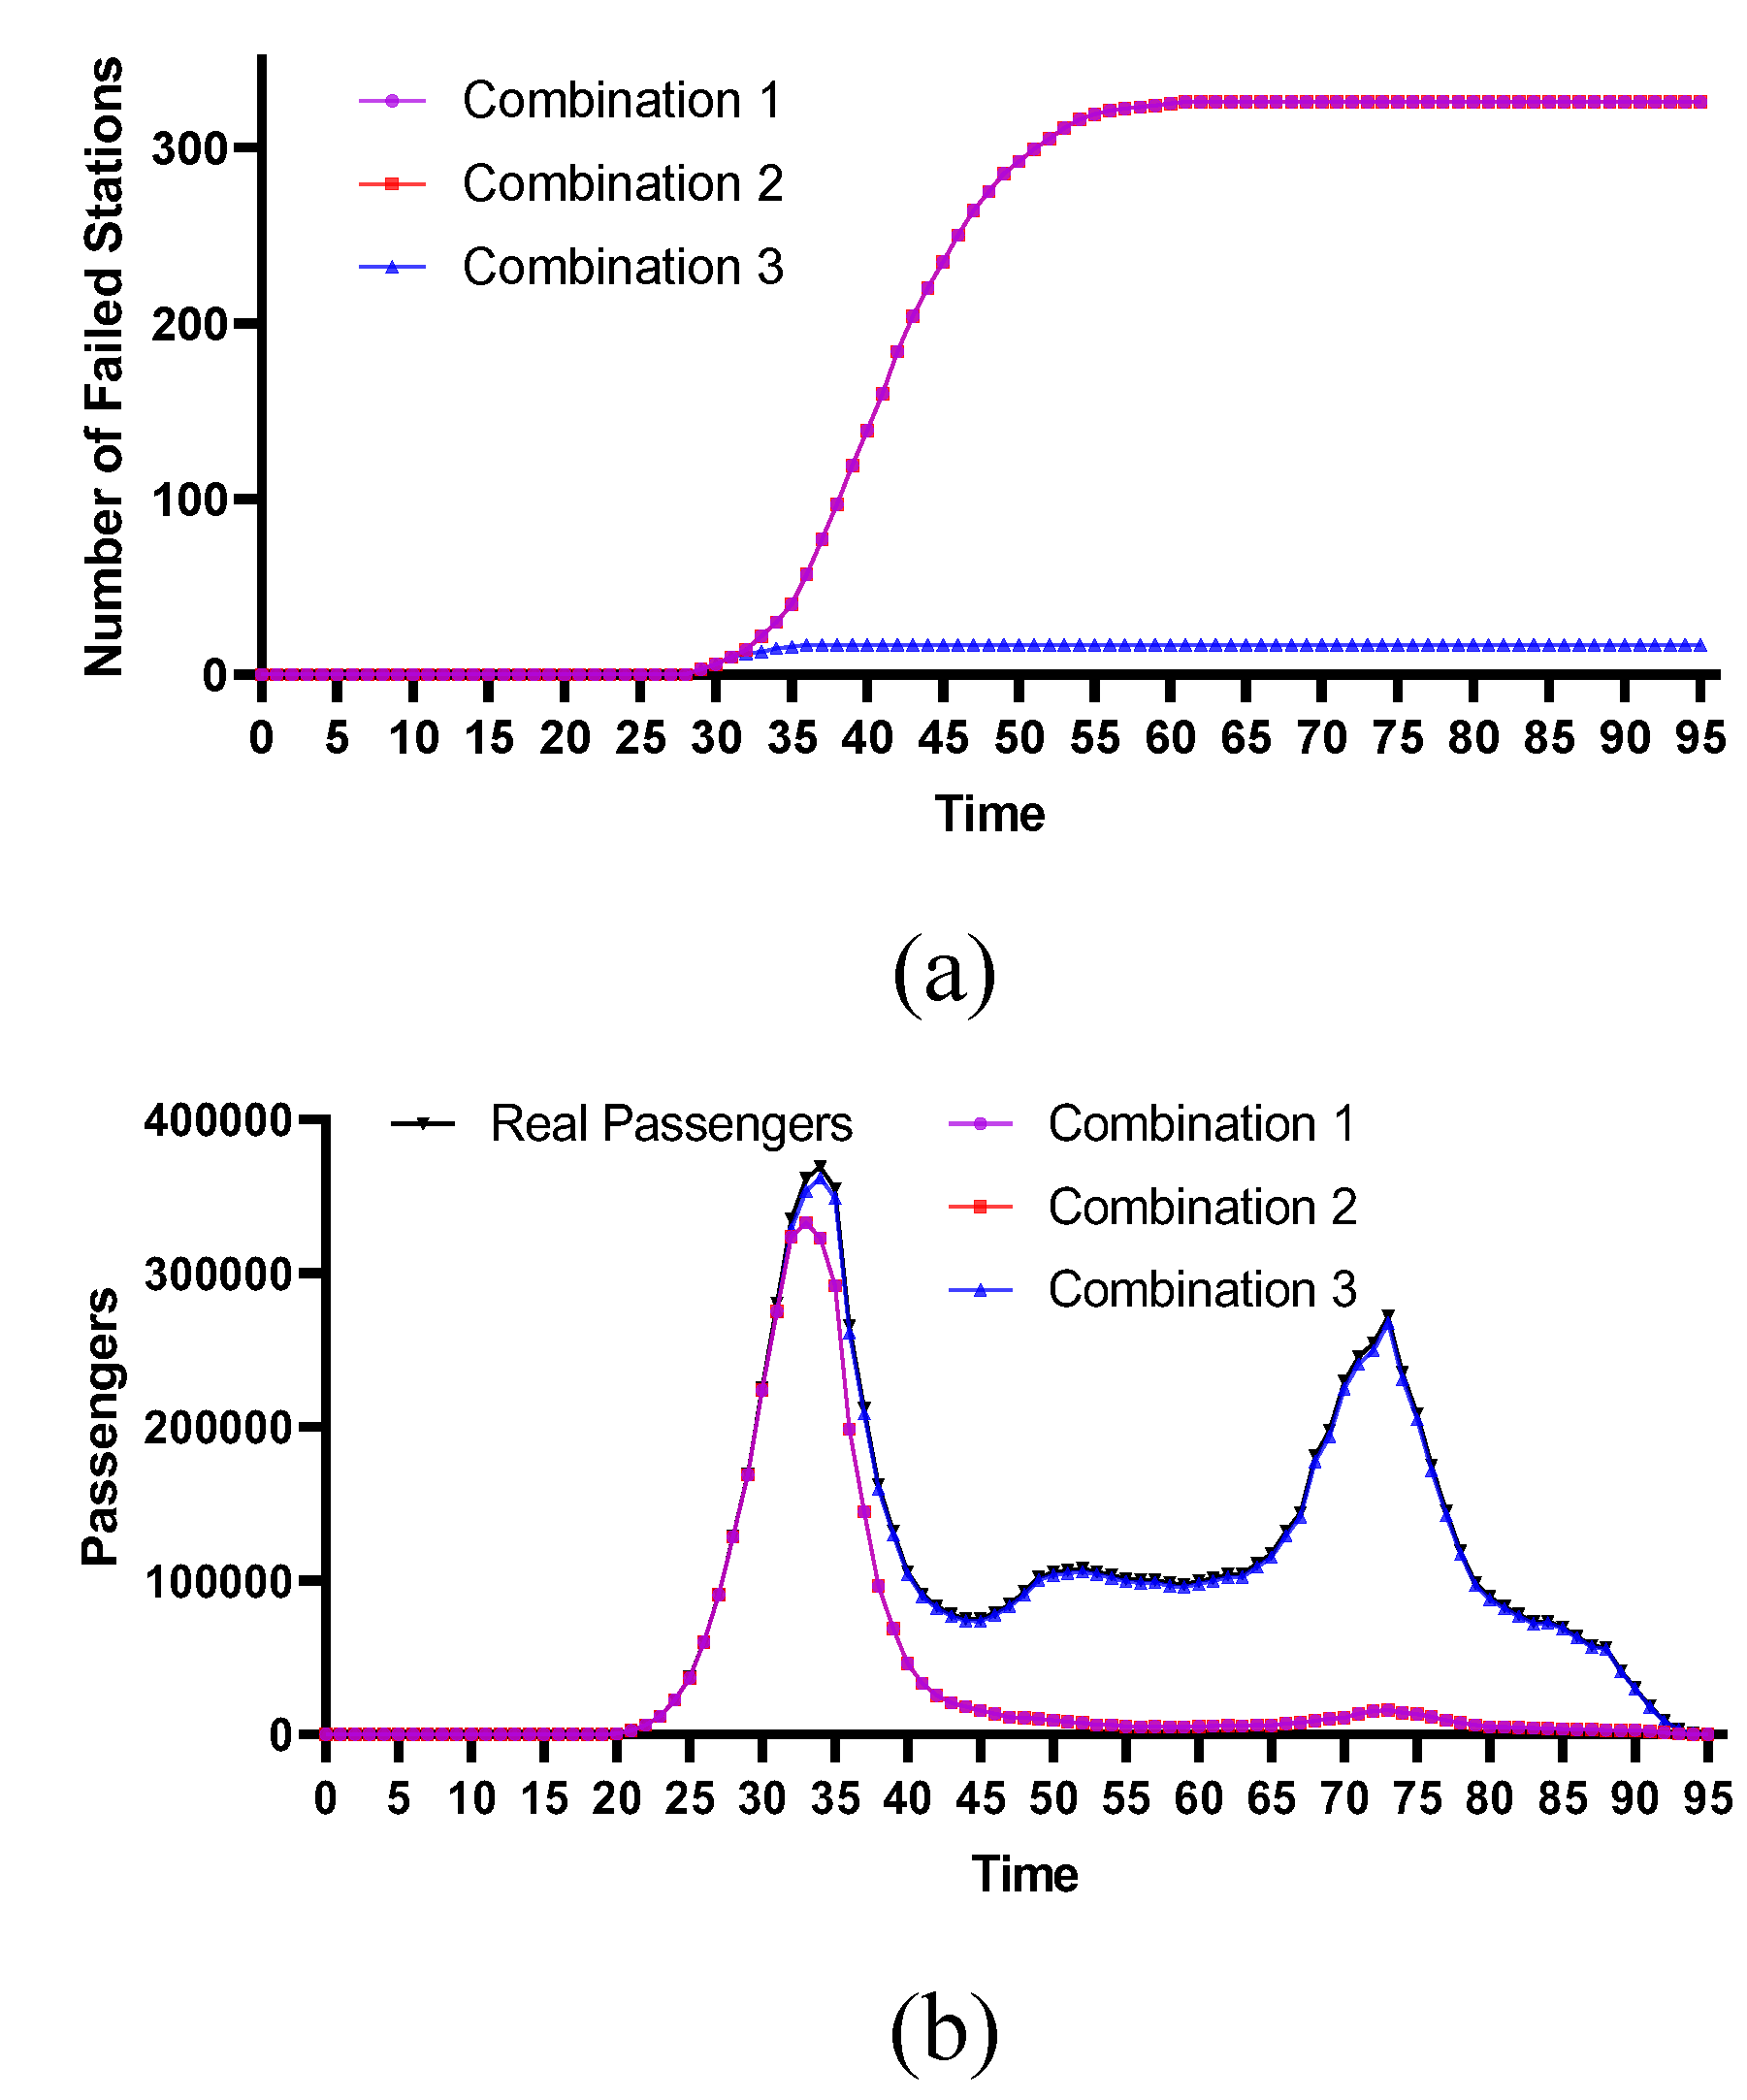
Figure 12.
(a) Cascading failure process under different coupling coefficients of Station 48; (b) Passenger flow changes under different coupling coefficients of Station 48.
Figure 12.
(a) Cascading failure process under different coupling coefficients of Station 48; (b) Passenger flow changes under different coupling coefficients of Station 48.
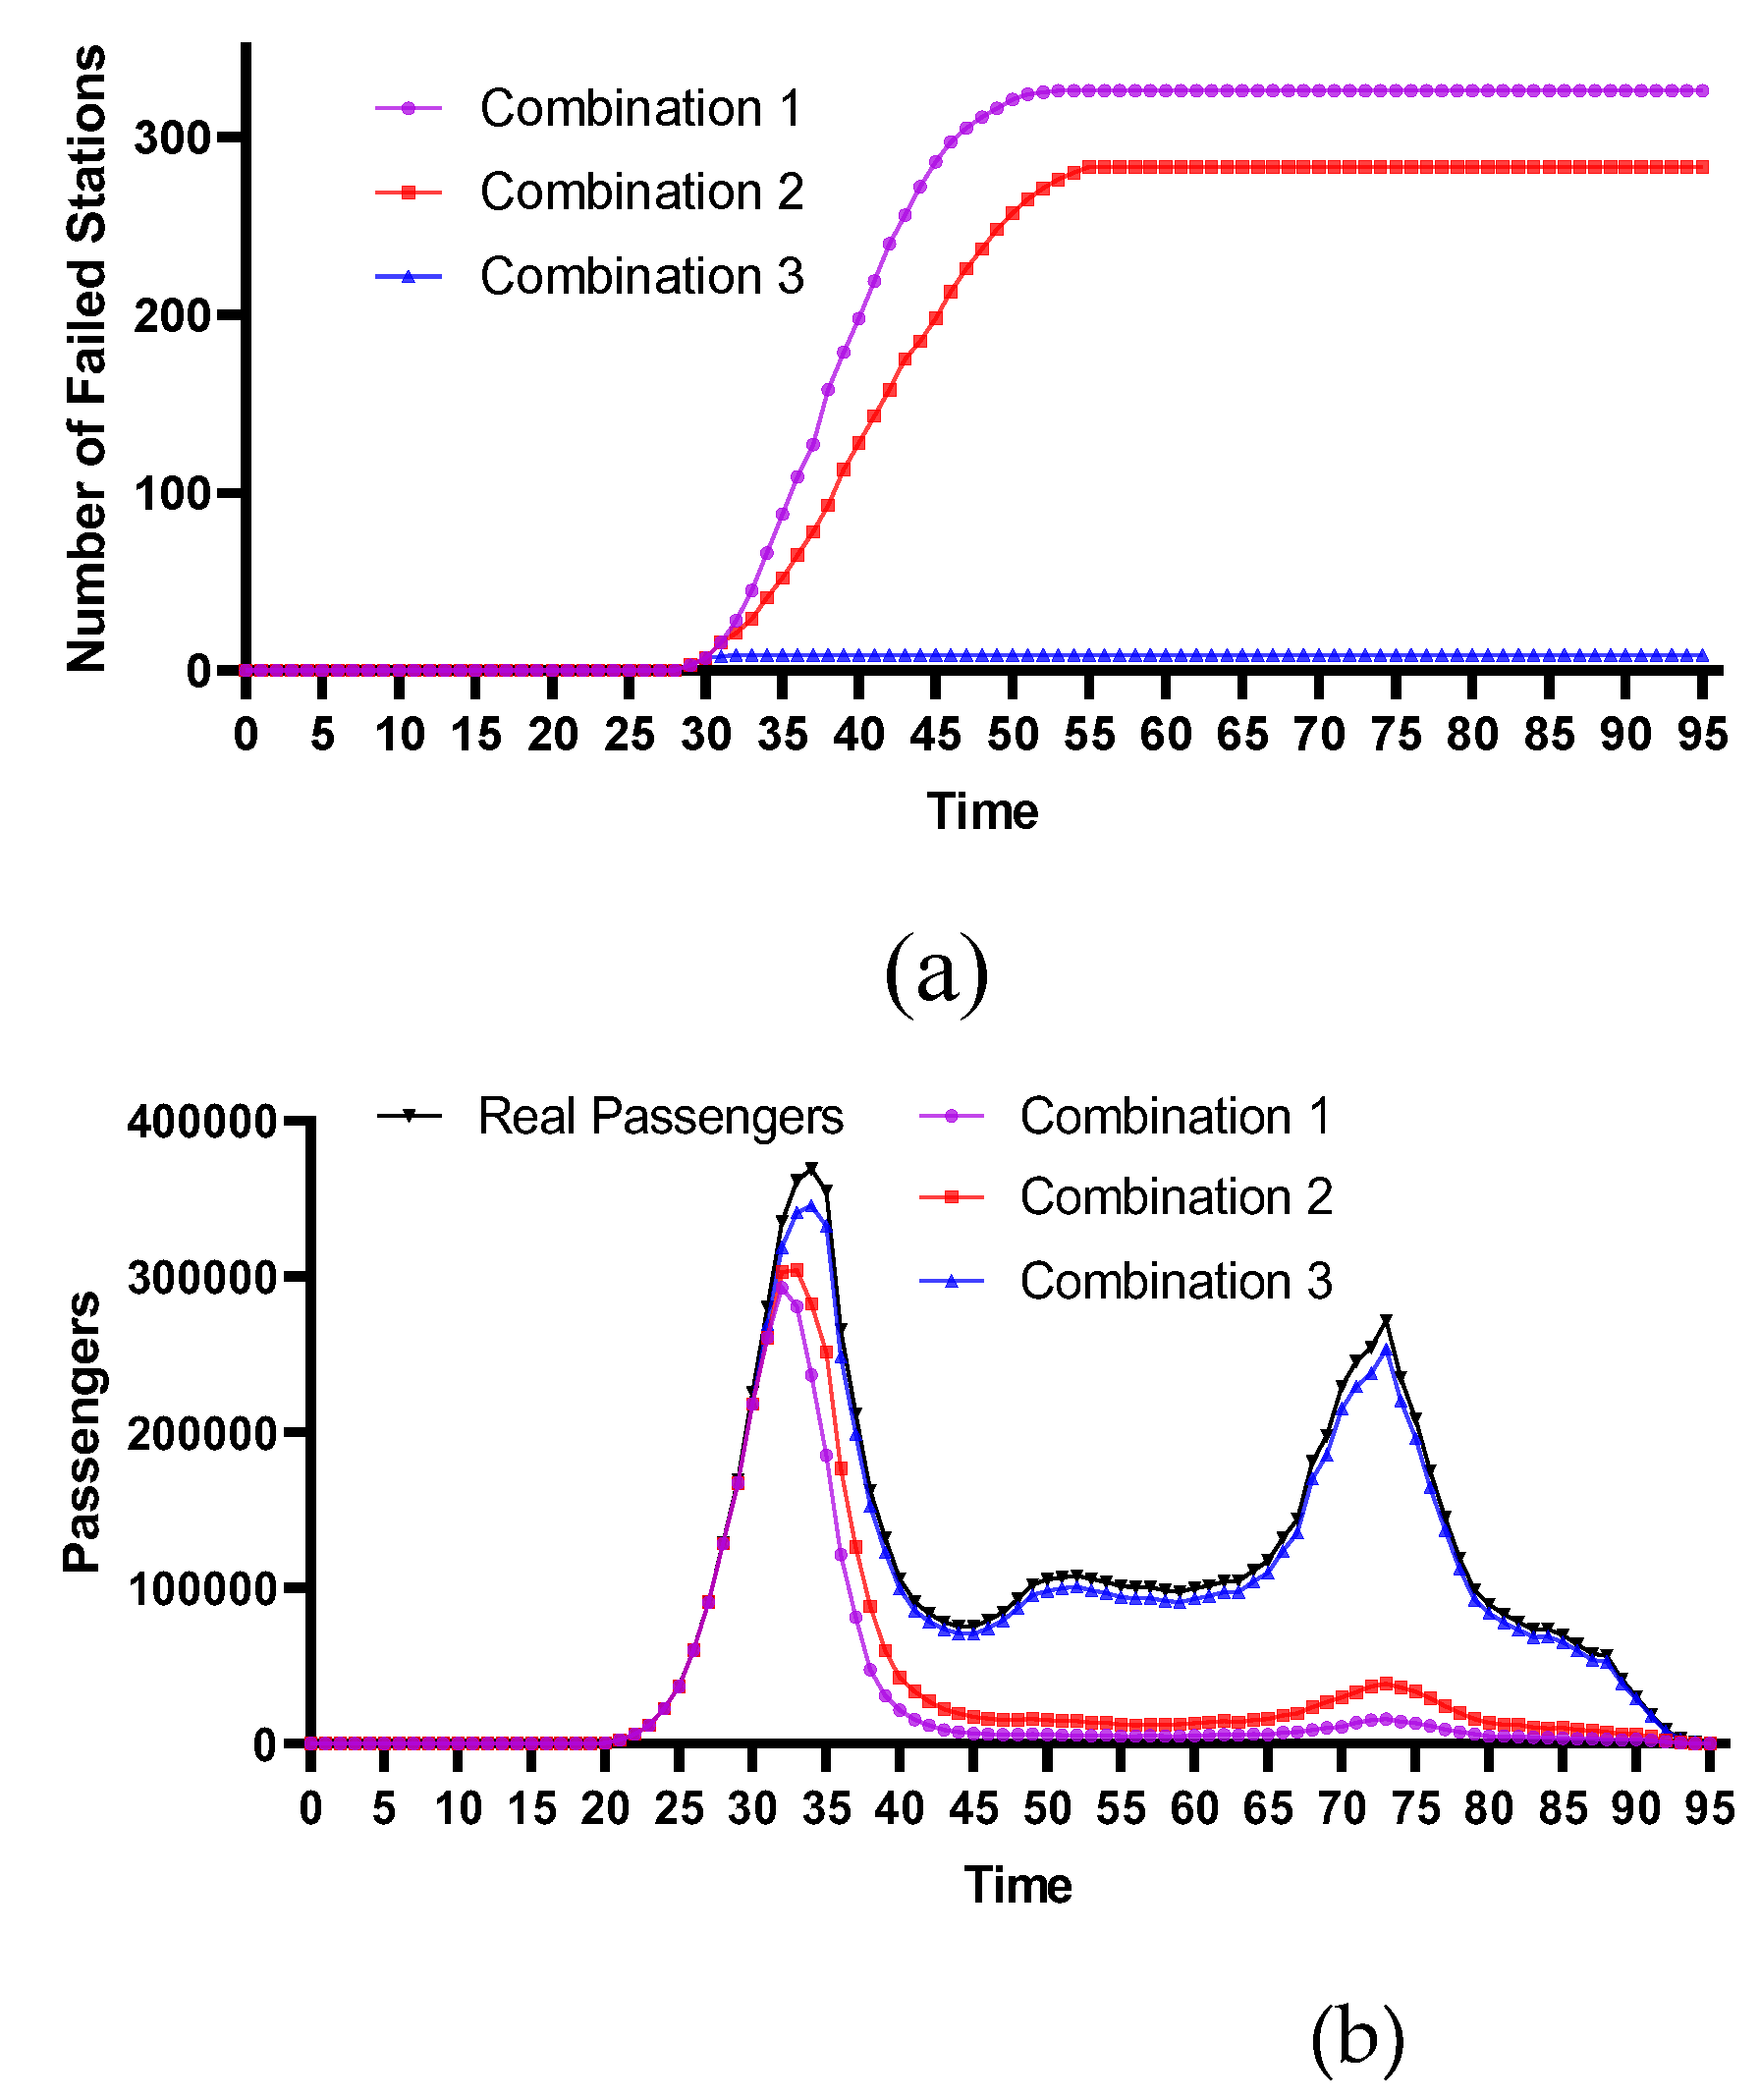
Figure 13.
(a) Cascading failure process under different coupling coefficients of Station 104; (b) Passenger flow changes under different coupling coefficients of Station 104.
Figure 13.
(a) Cascading failure process under different coupling coefficients of Station 104; (b) Passenger flow changes under different coupling coefficients of Station 104.

Figure 14.
(a) Cascading failure process under different coupling coefficients of Station 197; (b) Passenger flow changes under different coupling coefficients of Station 197.
Figure 14.
(a) Cascading failure process under different coupling coefficients of Station 197; (b) Passenger flow changes under different coupling coefficients of Station 197.
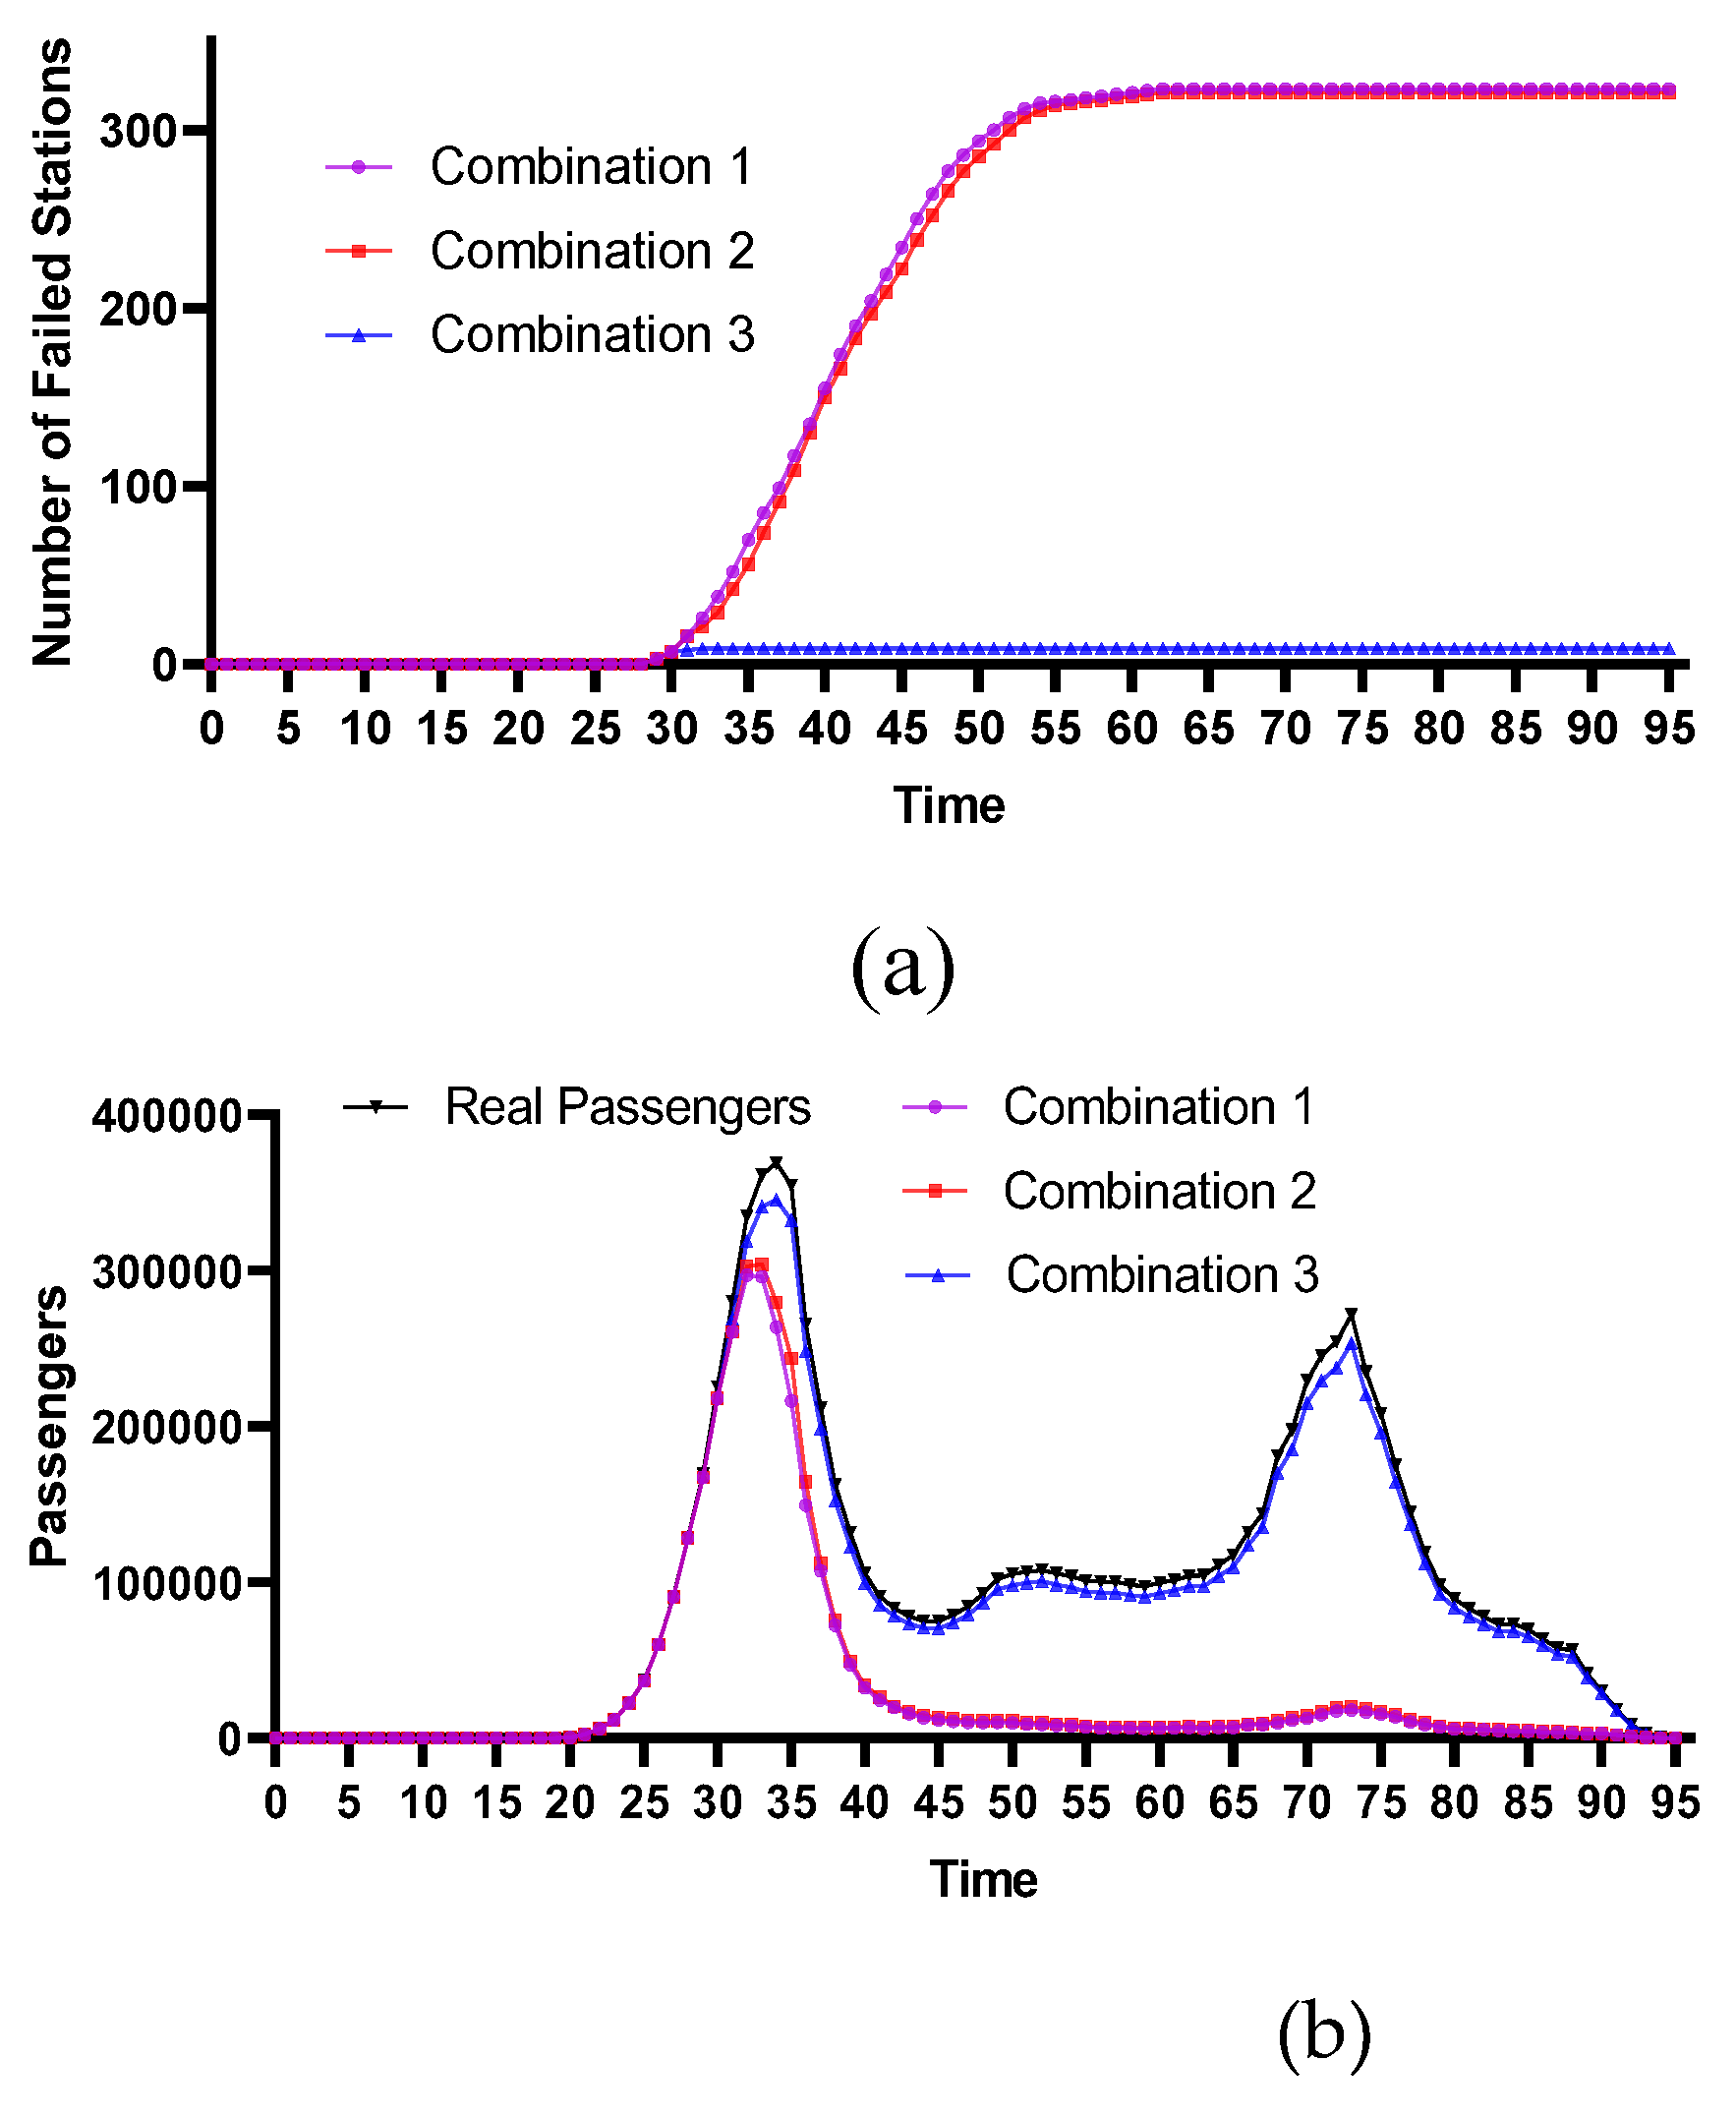
Figure 15.
Cascading failure process under (a)combination 1 (b)combination 2(c)combination 3after the failure of different stations.
Figure 15.
Cascading failure process under (a)combination 1 (b)combination 2(c)combination 3after the failure of different stations.


Table 1.
: Characteristics of stations and cascading failure sequence.
| Station Characteristics |
Order of Station Failures |
Order of Passenger Flow Impact |
Order of Cascading Failure Speed |
||||||||
|---|---|---|---|---|---|---|---|---|---|---|---|
| Station No. | Degree | Deep | C 1 | C 2 | C 3 | C 1 | C 2 | C 3 | C 1 | C 2 | C 3 |
| 41 | 7 | 0.96 | 1 | 1 | 3 | 1 | 1 | 3 | 4 | 1 | 3 |
| 19 | 6 | 0.96 | 1 | 4 | 6 | 1 | 4 | 6 | 1 | 5 | 6 |
| 45 | 6 | 0.93 | 3 | 1 | 4 | 3 | 1 | 4 | 3 | 2 | 4 |
| 159 | 4 | 0.99 | 1 | 1 | 1 | 1 | 1 | 1 | 8 | 7 | 1 |
| 164 | 4 | 0.99 | 1 | 5 | 6 | 1 | 5 | 6 | 7 | 9 | 6 |
| 189 | 4 | 0.99 | 1 | 1 | 5 | 1 | 1 | 5 | 6 | 3 | 7 |
| 48 | 4 | 0.87 | 1 | 3 | 7 | 1 | 3 | 7 | 2 | 7 | 8 |
| 104 | 4 | 0.71 | 1 | 1 | 2 | 1 | 1 | 2 | 9 | 8 | 2 |
| 197 | 4 | 0.98 | 2 | 2 | 7 | 2 | 2 | 7 | 5 | 4 | 8 |
Disclaimer/Publisher’s Note: The statements, opinions and data contained in all publications are solely those of the individual author(s) and contributor(s) and not of MDPI and/or the editor(s). MDPI and/or the editor(s) disclaim responsibility for any injury to people or property resulting from any ideas, methods, instructions or products referred to in the content. |
© 2024 by the authors. Licensee MDPI, Basel, Switzerland. This article is an open access article distributed under the terms and conditions of the Creative Commons Attribution (CC BY) license (http://creativecommons.org/licenses/by/4.0/).
Copyright: This open access article is published under a Creative Commons CC BY 4.0 license, which permit the free download, distribution, and reuse, provided that the author and preprint are cited in any reuse.


