
Submitted:
16 August 2024
Posted:
19 August 2024
You are already at the latest version
Abstract
The rapid urbanization process in recent decades has altered the carbon cycle and exacerbated the impact of climate change, prompting many cities to develop tree planting and green area preservation as mitigation and adaptation measures. While numerous studies have estimated the carbon stocks of urban trees in temperate and subtropical cities, data from tropical regions, including tropical botanic gardens, are scarce. This study aimed to quantify the aboveground biomass and carbon (AGB and AGC, respectively) stocks in trees at the Rio de Janeiro Botanical Garden arboretum, Rio de Janeiro, Brazil. Our survey included 6793 stems with a diameter at breast height (DBH) ≥ 10 cm. The total AGB was 8,047.24 Mg, representing 4,023.62 Mg of AGC. The AGB density was 207.4 Mg.ha-1 (AGC = 103.7 Mg.ha-1), which is slightly lower than the density stored in Brazil's main forest complexes: the Atlantic and Amazon forests, but much higher than in many cities worldwide. Our results suggest that, in addition to their global importance for plant conservation, tropical botanic gardens could function as significant carbon sinks within the urban matrix.
Keywords:
aboveground biomass
; tropical botanic gardens
; urban forests
; climate change mitigation
1. Introduction
The world is currently experiencing a climate crisis due to global warming caused by anthropogenic emissions of greenhouse gasses (GHG) [1]. Globally, the primary GHG, carbon dioxide, has been emitted mainly from the increased burning of fossil fuels since 1850 [2]. According to the IPCC Sixth Assessment Report [1], without a rapid reduction in global GHG emissions to achieve net-zero CO2 emissions by around 2050, followed by net-negative emissions by 2100, it will be nearly impossible to limit the global temperature increase to 1.5oC above pre-industrial levels by the end of this century. This limit was ideally defined by the Paris Agreement in 2015 [3], aiming to reduce the risks and impacts of climate change [4].
A significant portion of the Earth's carbon is stored as organic carbon in terrestrial ecosystems, including vegetation and soils, mainly in tropical forests, which are important sinks for this element [5]. Large amounts of carbon in these forests are stored in the aboveground biomass (AGB) of trees [6]. For instance, many studies have quantified AGB and/or aboveground carbon (AGC) stocks in neotropical forests [7,8], with emphasis on the Amazon forest [9,10]. These studies have contributed to assessing the potential of these ecosystems for mitigating climate change and have highlighted the risks of emissions from deforestation and global warming [11,12].
The rapid urbanization process in recent decades has significantly altered the carbon cycle and exacerbated the impact of climate change, prompting many cities to implement tree planting and green area preservation, as mitigation and adaptation measures [13]. In addition to sequestering and storing carbon, urban trees and forests (i.e., forest stands within urban areas) provide a range of environmental and social services, such as shading, temperature reduction, air quality improvement, rainwater runoff reduction, and noise abatement, among others [14,15,16]. These valuable services are specially provided by urban wooded areas. Botanic gardens, in particular way, serve an additional function, as sites dedicated to conserving living plant collections, often including many trees. While some studies have estimated the carbon stocks of urban trees in temperate and subtropical cities [16], data from tropical cities remain scarce [13,17], including tropical botanic gardens [18,19].
Urban trees tend to have different architecture than forest trees [16], due to the diverse environmental conditions they experience. Although competition for light and other resources with neighboring trees is reduced, urban environments impose a series of stressors, including pollution, limited growth space, and mechanical damage [13,20]. In botanic gardens, however, more favorable environmental conditions and silvicultural practices mitigate most of the stressors found in urban environments.
Botanic gardens have been recognized as strategic for global plant conservation, including ex situ conservation of endangered species, scientific research, horticultural development, plant reintroduction, display, education, and outreach [21,22,23]. However, they have yet been neglected as important carbon storage and sequestration sites [24]. According to the Botanic Gardens Conservation International, there are approximately 500 botanic gardens/arboreta in the tropics [25]. Although most of these tropical gardens have a landscaped area of less than 50 hectares, they likely play a crucial role in carbon sequestration in many tropical cities and, together with other urban trees and forests, help to mitigate the urban heat island effect [26].
Ferreira et al. [19] integrated tree structural attributes with UAV-borne hyperspectral and light detection and ranging (LiDAR) data to estimate the AGB in approximately 29 hectares of the Rio de Janeiro Botanical Garden arboretum, located in the city of Rio de Janeiro, Brazil, aiming to improve and optimize AGB estimations in urban forests. The authors estimated a total AGB of 5,627 Mg (megagrams; 1 Mg = 1,000 kg) and a density of 191.4 Mg.ha-1. In this study, we used tree structural attributes and allometric equations to estimate the AGB and AGC stored in the entire area of the arboretum and compared the results with those from urban trees and forests in different cities. Our primary objective was to highlight the potential of tropical botanic gardens in mitigating the effects of climate change at a local scale in urban environments.
2. Materials and Methods
The Rio de Janeiro Botanical Garden (Figure 1 and Figure 2), located in the southern part of the city of Rio de Janeiro, Brazil, was established in 1808, when the Portuguese royal family arrived in Brazil. Initially, it served as an acclimatization garden for spices from the East. The Lagoa Rodrigo de Freitas farm was expropriated for this purpose, and a gunpowder factory and foundry were also installed to supply the artillery [27]. Throughout its history, the Rio de Janeiro Botanical Garden arboretum has undergone numerous landscaping and scientific interventions, becoming one of the most important in Brazil. Several initiatives were undertaken to inventory and map the specimens cultivated in the arboretum, with a notable emphasis on the project 'Inventory and Identification of the Botanical and Historical Collections of the arboretum of the Rio de Janeiro Botanical Garden', initiated in 1999 [28]. Currently, the arboretum is divided into 41 sections, 215 beds, and 122 alleys, comprising 38.8 hectares [29]. This living collection comprises 6960 specimens, from 134 families and 1,420 species, with more than 60% native to Brazil. The collection stands out for its large number of tree specimens. In addition to the tree collection, the Rio de Janeiro Botanical Garden also contains an area of secondary remnants of the Atlantic Forest, which was not included in this study.
We conducted a survey of all trees, comprising gymnosperms and angiosperms (magnoliids, arborescent monocots [e.g., Arecaceae, Asparagaceae, Pandanaceae, and Strelitziaceae] and eudicots), with diameter at breast height (DBH; 1.3 m) ≥ 10 cm, between April 2021 and September 2022. Bamboos and lianas were excluded from the study. For each individual surveyed, we measured the DBH with a standard measuring tape and the total height (for arborescent monocots, Cycadaceae, and Zamiaceae, the height of the stem) was measured using a Bosch digital laser measure, model GLM 120 C. For individuals branching below 1.3 m, all stems with DBH ≥ 10 cm were measured. Occasionally, adjustments were made to the trunk diameter measurement point (e.g., trees with buttress roots), following the Brazilian Research Program on Biodiversity protocol [30].
We employed three different allometric models tailored to each taxonomic component under assessment (Table 1). Firstly, for gymnosperms (excluding Cycadaceae and Zamiaceae), magnoliids, and eudicots, we utilized the allometric model developed for large and small urban trees in Singapore [13]. Secondly, for palms, we applied the family-level model developed and recommended by Goodman et al. [31], which was also extended to other arborescent monocots, Cyacadaceae and Zamiaceae, due to their architectural similarities with palms. Thirdly, we used a model developed specifically for Ravenala madagascariensis Sonn. [32]. We converted AGB to AGC by multiplying 0.5 [13] and then adjusted by multiplying 3.67 to estimate the CO2 equivalent [33]. Considering that different authors present their results in terms of AGB or AGC, both quantities are presented in our study.
3. Results
Our database comprised 6,793 stems from 4,633 specimens registered in the collection, belonging to 830 taxa (including species, infraspecies, and hydrids) and 78 botanical families. Among the measured specimens, 218 did not have taxonomic identification even at the family level and were classified as indeterminate. The heights ranged from 1.3 to 44.4 m, with a mean of 13 m. The interval of DBH was 10.2 to 224.5 cm, with a mean of 34.3 cm (Table S1).
The total AGB stored in the trees at the Rio de Janeiro Botanical Garden arboretum was 8,047.24 Mg, representing 4,023.62 Mg of AGC and 14,766.69 Mg of CO2 equivalent. The mean amount (density) of AGB and AGC per unit area were 207.4 and 103.7 Mg.ha-1, respectively.
The AGB was not evenly distributed throughout the area, being concentrated mainly in the ‘Amazon Region’, which contained 2,365.89 Mg of AGB, accounting for 29.4% of the amount stored at the arboretum (Figure 2 and Figure 3). The ‘Amazon Region’ was idealized during the administration of Antônio Pacheco Leão (1915-1933), in an area with abundant water resources. During around 20 years the naturalist Adolpho Ducke collected tree species from the Brazilian and Peruvian Amazon and introduced them in this area of the arboretum. After a century, this important historical living collection now includes many large trees, such as Anacardium giganteum W.Hancock ex Engl., Bertholletia excelsa Bonpl., Calycophyllum spruceanum (Benth.) K.Schum., Carapa guianensis Aubl., Ceiba pentandra (L.) Gaertn., Hevea brasiliensis (Willd. ex A.Juss.) Müll.Arg., Parkia pendula (Willd.) Benth. ex Walp., Simarouba amara Aubl., Spachea lactescens (Ducke) R.F.Almeida & M.Pell., and Swietenia macrophylla King. Moreover, there are other smaller AGB hotspots scattered throughout the arboretum (Figure 3), where many large trees are concentrated (e.g., Cariniana estrellensis (Raddi) Kuntze, Dalbergia nigra (Vell.) Allemão ex Benth., Hymenaea spp., Lecythis pisonis Cambess., Parkia spp., Plathymenia reticulata Benth., and Virola surinamensis (Rol. ex Rottb.) Warb.).
The 530 specimens of Roystonea oleracea (Jacq.) O.F.Cook, popularly known as the Imperial Palm, and a prominent symbol of the Rio de Janeiro Botanical Garden, store 1,962.42 Mg of AGB. This species is concentrated along the two main alleys, which form an inverted ‘T’ as shown in Figure 3. The substantial amount of AGB along these alleys is related to the large size of many of the Imperial Palm specimens (height up to 42.3 m; diameter at breast height [DBH] up to 85.3 cm) and the close spacing between them (approximately 4.5 m; see also Figure 1).
A specimen of Samanea saman (Jacq.) Merr. has the highest measured AGB, totaling 39.32 Mg. Other trees also stand out for their significant amounts of AGB (Table 2). Although it is not possible to determine the precise age of these specimens, they are likely between 70 and 90 years old, or possibly even older. The palm family (Arecaceae) and the legume family (Leguminosae), the most representative families in terms of specimens and species in our arboretum collection, stored 2,399.41 and 1,430.75 Mg of AGB, 29.8 and 17.8% of the total stored in this area, respectively.
4. Discussion
The total amount of AGB estimated in this study for the entire area of the Rio de Janeiro Botanical Garden arboretum was greater than the amount estimated by Ferreira et al. [19] due to the different extents of both inventories (8,047.24 Mg in 38.8 hectares vs. 5,627 Mg in 29 hectares). In terms of CO2 equivalent, the amount stored was 14,766.69 Mg, which corresponds approximately to the annual emissions of a small Brazilian municipality with around 7,000 inhabitants [37].
Although AGB stocks are not uniformly distributed throughout the arboretum, the density value stored (207.4 Mg AGB.ha-1) is high and only slightly lower than the average values stored in mature areas of the Brazilian Atlantic Forest, which include different forest types (267 ± 85.8 Mg AGB.ha-1; trees with DBH ≥ 5 cm [38]), and in dense (299 Mg AGB.ha-1) and non-dense (266.6 Mg AGB.ha-1) forests in the Brazilian Amazon (trees with DBH ≥ 10 cm; [7]). The relatively high carbon density in the arboretum is probably related to the age of the collection (around 200 years old), management practices, and the high number of trees.
In urban environments, trees perform important environmental services, such as carbon storage [14]. However, the carbon density is much lower than in natural forested environments because space in cities is shared with various types of buildings (see below). Although there are differences related to the specific climatic conditions of each city, urbanization patterns, composition, and age structure of urban trees, methodological differences in assessment (e.g., scope of the sampled urban mosaic, sampling method, and tree inclusion criteria) make direct comparisons difficult [39]. Even so, it is possible to compare the order of magnitude of what is stored in some cities, in terms of carbon density, with the values found in the Rio de Janeiro Botanical Garden arboretum (Table 3). If we apply the factor of 1.26, used by Nowak et al. [15] and Velasco & Chen [13], to include what is stored in the roots of the arboretum's trees, our estimates of biomass and carbon rise to 261.3 and 130.7 Mg.ha-1, respectively. The values of carbon density from Nowak et al. [15], shown in Table 3, were calculated based on data of carbon storage per unit of tree cover and percent tree cover in the measured cities, and represent the lowest and highest values among 28 cities in the United States.
Table 3 shows that when carbon density is estimated for entire urban areas or neighborhoods, the values are low [13,15,41], mainly because trees share space with urban infrastructure (e.g., buildings, streets, and sidewalks). On the other hand, the carbon density in urban green spaces under temperate [40] or tropical climates [18], including the National Botanical Gardens, small forest fragments in monasteries, and urban coffee farms in Pyin Oo Lwin, Myanmar, is high and comparable to or even higher than the value found in the Rio de Janeiro Botanical Garden arboretum. The high carbon density estimated by Malage [42] comes from a small, well-preserved urban remnant of mixed Atlantic Forest (Araucaria forest) in the subtropical city of Curitiba, Southern Brazil. Conversely, Líndén et al. [39] estimated relatively low carbon density in urban constructed parks in Helsinki, Finland, under cold climate conditions, which was attributed to a low density of trees (around 150 trees/ha).
In recent years, tropical homegardens have been suggested as potential sites for conserving biodiversity and storing carbon [43]. In this context, Padmakumar et al. [44] and Lowe et al. [43] estimated carbon density in several urban homegardens (0.02-1 ha) in India and Sri Lanka, respectively (Table 3). The wide range of values reported by Lowe et al. [43] was mainly attributed to differences in tree density and species diversity.
The comparisons above indicate that trees in various urban green spaces can store significant amounts of carbon per unit area, suggesting their potential role in mitigating and adapting to urban-scale climate change. Our results underscored the importance of the Rio de Janeiro Botanical Garden arboretum in providing this ecosystem service, and we hope it will inspire new studies in other tropical botanic gardens and green spaces worldwide. Such research is essential for informing climate change and sustainable development policies in cities.
For instance, the city of Rio de Janeiro is privileged with its green spaces, which include two large forest remnants (Tijuca National Park and Pedra Branca State Park), several smaller protected areas, the Rio de Janeiro Botanical Garden, and numerous public squares. Additionally, many trees are planted along public roads and in private properties. According to preliminary data [45] and based on SMAC [46] and PCRJ [47], the city had approximately 34 million trees across its 120,033 hectares, averaging 283 trees per hectare and 5.5 trees per inhabitant. This estimate encompasses trees in various cover classes, such as native vegetation, reforestation, non-forest arboreal vegetation, and urban afforestation. Despite the uneven distribution of trees and green areas throughout the city of Rio de Janeiro [48], these numbers underscore the potential role of this tree cover in mitigating and adapting to climate change at a local scale.
On the other hand, while the carbon density of urban trees is relatively low on the scale of entire cities or neighborhoods, their total carbon stock can be significant globally. For instance, urban trees in the United States were estimated to store 643 million tons of carbon, about 3.2% of the total stored in trees across both forested and urban areas in that country [15]. In Europe, Liu et al. [49] estimated that trees outside forests (including urban, agricultural, and grassland areas) contributed to aboveground woody biomass. European forests stored 35.2 billion tons of biomass, whereas trees outside forests stored 800 million tons, with a ratio of 40:1. Urban trees stored a total of 220 million tons (34% of the amount stored outside forests) with an average biomass density of 5.6 (2.5 to 13.2) Mg.ha-1. Although the biomass stock of urban trees in Europe was lower compared to that of the continent's forests, in the Netherlands, urban areas accounted for 8.2% of the national biomass.
Supplementary Materials
The following supporting information can be downloaded at the website of this paper posted on Preprints.org, Table S1: Data set obtained from the study measuring the tree collection at the Rio de Janeiro Botanical Garden arboretum, Rio de Janeiro, Brazil. H = total height (m; for arborescent monocots, Cycadaceae, and Zamiaceae, the height of the stem); D = stem diameter (cm); AGB = aboveground biomass (kg); AGC = aboveground carbon (kg).
Author Contributions
Conceptualization, B.C.K. and M.F.S.; methodology, B.C.K.; field measurements, B.C.K., T.M.H.A., M.A.N.C., R.M.T., D.R.G., L.K.M., R.G.O., C.F.B.; data tabulation, B.C.K., L.S.J.D.; formal analysis, B.C.K. and M.F.S.; writing—original draft preparation, B.C.K.; writing—review and editing, T.M.H.A. M.A.N.C., D.R.G. and M.F.S.; project administration, B.C.K. and T.M.H.A. All authors have read and agreed to the published version of the manuscript
Funding
This research received no external funding.
Data Availability Statement
The data supporting the reported results can be found in Supplementary Table S1 at: www.mdpi.com/xxx/s1
Acknowledgments
The authors thank Alline Figueira de Paula, Amanda Pacheco dos Santos, Amanda Santos de Alencar, Ana Caroline Praxedes, Bruno Rezende Silva, Gabriel Cailleaux Damasceno, Isabel Cristina Restrepo Carvajal, Maria Tereza Rodrigues Costa and Thiago Favares Gonçalves for assisting in obtaining the field measurements; Jaquelini Luber for assisting in the data tabulation; Rafael da Silva Ribeiro for creating the figures and Leandro Freitas for his logistical support for the project.
Conflicts of Interest
The authors declare no conflicts of interest.
References
- IPCC—Intergovernmental Panel on Climate Change. Summary for policymakers. In Climate Change 2021: The Physical Science Basis. Contribution of Working Group I to the Sixth Assessment Report of the Intergovernmental Panel on Climate Change; Masson-Delmotte, V., Zhai, P., Pirani, A., Connors, S.L., Péan, C., Berger, S., Caud, N., Chen, Y., Goldfarb, L., Gomis, M.I., et al., Eds.; Cambridge University Press: Cambridge, United Kingdom and New York, NY, USA, 2021; pp. 3−32. [CrossRef]
- IPCC—Intergovernmental Panel on Climate Change. Climate Change 2014: Synthesis Report. Contribution of Working Groups I, II and III to the Fifth Assessment Report of the Intergovernmental Panel on Climate Change; Pachauri, R.K., Meyer, L.A., Eds.; IPCC: Geneva, Switzerland, 2014. [Google Scholar]
- United Nations. Paris Agreement. Available online: chromeextension://efaidnbmnnnibpcajpcglclefindmkaj/https://unfccc.int/sites/default/files/english_paris_agreement.pdf (accessed on 6 August 2024).
- IPCC—Intergovernmental Panel on Climate Change. Summary for policymakers. In Global Warming of 1.5°C. An IPCC Special Report on the Impacts of Global Warming of 1.5°C above Pre-industrial Levels and Related Global Greenhouse Gas Emission Pathways, in the Context of Strengthening the Global Response to the Threat of Climate Change, Sustainable Development, and Efforts to Eradicate Poverty; Masson-Delmotte, V., Zhai, P., Pörtner, H.-O., Roberts, D., Skea, J., Shukla, P.R., Pirani, A., Moufouma-Okia, W., Péan, C., Pidcock, R., et al., Eds.; Cambridge University Press: Cambridge, United Kingdom and New York, NY, USA, 2018. [Google Scholar] [CrossRef]
- Pan, Y.; Birdsey, R.A.; Phillips, O.L.; Jackson, R.B. The structure, distribution, and biomass of the world’s forests. Annu. Rev. Ecol. Evol. Syst. 2013, 44, 593–622. [Google Scholar] [CrossRef]
- Chave, J.; Réjou-Méchain, M.; Búrquez, A.; Chidumayo, E.; Colgan, M.S.; Delitti, W.B.C.; Duque, A.; Eid, T.; Fearnside, P.M.; Goodman, R.C.; et al. Improved allometric models to estimate the aboveground biomass of tropical trees. Global Change Biol. 2014, 20, 3177–3190. [Google Scholar] [CrossRef]
- Nogueira, E.M.; Fearnside, P.M.; Nelson, B.W.; Barbosa, R.I.; Keizer, E.W.H. Estimates of forest biomass in the Brazilian Amazon: New allometric equations and adjustments to biomass from wood-volume inventories. For. Ecol. Manag. 2008, 256, 1853–1867. [Google Scholar] [CrossRef]
- Vieira, S.A.; Alves, L.F.; Duarte-Neto, P.J.; Martins, S.C.; Veiga, L.G.; Scaranello, M.A.; Picollo, M.C.; Camargo, P.B.; Carmo, J.B.; Neto, E.S.; et al. Stocks of carbon and nitrogen and partitioning between above- and belowground pools in the Brazilian coastal Atlantic Forest elevation range. Ecol. Evol. 2011, 1, 421–434. [Google Scholar] [CrossRef] [PubMed]
- Mitchard, E.T.A.; Feldpausch, T.R.; Brienen, R.J.W.; Lopez-Gonzalez, G.; Monteagudo, A.; Baker, T.R.; Lewis, S.L.; Lloyd, J.; Quesada, C.A.; Gloor, M.; et al. Markedly divergent estimates of Amazon forest carbon density from ground plots and satellites. Global Ecol. Biogeogr. 2014, 23, 935–946. [Google Scholar] [CrossRef]
- Araujo, E.C.G.; Sanquetta, C.R.; Dalla Corte, A.P.; Pelissari, A.L.; Orso, G.A.; Silva, T.C. Global review and state-of-the-art of biomass and carbon stock in the Amazon. J. Environ. Manage. 2023, 331, 117251. [Google Scholar] [CrossRef]
- Gomes, V.H.F.; Vieira, I.C.G.; Salomão, R.P.; ter Steege, H. Amazonian tree species threatened by deforestation and climate change. Nat. Clim. Change 2019, 9, 547–553. [Google Scholar] [CrossRef]
- Gatti, L.V.; Basso, L.S.; Miller, J.B.; Gloor, M.; Gatti Domingues, L.; Cassol, H.L.G.; Tejada, G.; Aragão, L.E.O.C.; Nobre, C.; Peters, W.; et al. Amazonia as a carbon source linked to deforestation and climate change. Nature 2021, 595, 388–393. [Google Scholar] [CrossRef] [PubMed]
- Velasco, E.; Chen, K.W. Carbon storage estimation of tropical urban trees by an improved allometric model for aboveground biomass based on terrestrial laser scanning. Urban For. Urban Greening 2019, 44, 126387. [Google Scholar] [CrossRef]
- Roy, S.; Byrne, J.; Pickering, C. A systematic quantitative review of urban tree benefits, costs, and assessment methods across cities in different climatic zones. Urban For. Urban Greening 2012, 11, 351–363. [Google Scholar] [CrossRef]
- Nowak, D.J.; Greenfield, E.J.; Hoehn, R.E.; Lapoint, E. Carbon storage and sequestration by trees in urban and community areas of the United States. Environ. Pollut. 2013, 178, 229–236. [Google Scholar] [CrossRef]
- Ngo, K.M.; Lum, S. Aboveground biomass estimation of tropical street trees. J. Urban Ecol. 2018, 4, 1–6. [Google Scholar] [CrossRef]
- Zhao, D.; Cai, J.; Xu, Y.; Liu, Y.; Yao, M. Carbon sinks in urban public green spaces under carbon neutrality: A bibliometric analysis and systematic literature review. Urban For. Urban Greening 2023, 86, 128037. [Google Scholar] [CrossRef]
- Helen; Jarzebski, M. P.; Gasparatos, A. Land use change, carbon stocks and tree species diversity in green spaces of a secondary city in Myanmar, Pyin Oo Lwin. PLoS One 2019, 14, e0225331. [Google Scholar] [CrossRef]
- Ferreira, M.P.; Martins, G.B.; Almeida, T.M.H.; Ribeiro, R.S.; Veiga Júnior, V.F.; Paz, I.S.R.; Siqueira, M.F.; Kurtz, B.C. Estimating aboveground biomass of tropical urban forests with UAV-borne hyperspectral and LiDAR data. Urban For. Urban Greening 2024, 96, 128362. [Google Scholar] [CrossRef]
- McHale, M.R.; Burke, I.C.; Lefsky, M.A.; Peper, P.J.; McPherson, E.G. Urban forest biomass estimates: Is it important to use allometric relationships developed specifically for urban trees? Urban Ecosyst. 2009, 12, 95–113. [Google Scholar] [CrossRef]
- Heywood, V.H. The future of plant conservation and the role of botanic gardens. Plant Divers. 2017, 39, 309–313. [Google Scholar] [CrossRef]
- Westwood, M.; Cavender, N.; Meyer, A.; Smith, P. Botanic garden solutions to the plant extinction crisis. Plants People Planet 2021, 3, 22–32. [Google Scholar] [CrossRef]
- Catahan, N.; Hopwood, M.; Suraweera, P. Botanic garden tourism, social value, health, and well-being. J. Zool. Bot. Gard. 2024, 5, 187–199. [Google Scholar] [CrossRef]
- Gratani, L.; Catoni, R.; Tarquini, F. Carbon dioxide sequestration capability of the Botanical Garden of Rome: Environmental and economic benefits. Am. J. Plant Sci. 2019, 10, 1249–1260. [Google Scholar] [CrossRef]
- BGCI—Botanic Gardens Conservation International. The only global database of the world’s botanic gardens, with information on 3.571 institutions worldwide. Available online: https://gardensearch.bgci.org/ (accessed on 27 June 2024).
- Borelli, S.; Conigliaro, M.; Di Cagno, F. Urban Forests: A Global Perspective; FAO: Rome, Italy, 2023. [Google Scholar] [CrossRef]
- Bediaga, B.; Guedes-Bruni, R.R. Jardim Botânico do Rio de Janeiro: Dois séculos de história. In Guia de Árvores Notáveis: 200 Anos do Jardim Botânico do Rio de Janeiro; Ormindo, P., Ed.; Andrea Jakobsson Estúdio Editorial: Rio de Janeiro, Brazil, 2008; pp. 16–23. [Google Scholar]
- Coelho, M.A.N. O inventário da coleção. In Guia de Árvores Notáveis: 200 Anos do Jardim Botânico do Rio de Janeiro; Ormindo, P., Ed.; Andrea Jakobsson Estúdio Editorial: Rio de Janeiro, Brazil, 2008; pp. 24–31. [Google Scholar]
- Almeida, T.M.H.; Coelho, M.A.N.; Peixoto, A.L. Rio de Janeiro Botanical Garden: Biodiversity conservation in a tropical arboretum. J. Zool. Bot. Gard. 2024, 5, 378–394. [Google Scholar] [CrossRef]
- PPBio—Programa de Pesquisa em Biodiversidade. Instructions for surveying woody plants in RAPELD grids and modules. Available online: https://ppbio.inpa.gov.br/sites/default/files/Protocol_for_the_survey_vascular_plants_RAPELD_grids_modules_2.pdf (accessed on 7 August 2024).
- Goodman, R.C.; Phillips, O.L.; Torres, D.C.; Freitas, L.; Cortese, S.T.; Monteagudo, A.; Baker, T.R. Amazon palm biomass and allometry. For. Ecol. Manage. 2013, 310, 994–1004. [Google Scholar] [CrossRef]
- Randrianasolo, Z.H.; Razafimahatratra, A.R.; Razafinarivo, R.N.G.; Randrianary, T.; Rakotovololonalimanana, H.; Rajemison, A.H.; Mamitiana, A.; Andriamanalina, R.L.; Rakotosoa, A.; Ramananantoandro, T. Which allometric models are the most appropriate for estimating aboveground biomass in secondary forests of Madagascar with Ravenala madagascariensis? Sci. Afr. 2019, 6, e00147. [Google Scholar] [CrossRef]
- Aguaron, E.; McPherson, E.G. Comparison of methods for estimating carbon dioxide storage by Sacramento’s urban forest. In Carbon Sequestration in Urban Ecosystems; Lal, R., Augustin, B., Eds.; Springer: Dordrecht, Netherlands, 2012; pp. 43–71. [Google Scholar] [CrossRef]
- Chave, J.; Coomes, D.; Jansen, S.; Lewis, S.L.; Swenson, N.G.; Zanne, A.E. Towards a worldwide wood economics spectrum. Ecol. Lett. 2009, 12, 351–366. [Google Scholar] [CrossRef]
- Zanne, A.E.; Lopez-Gonzalez, G.; Coomes, D.A.; Ilic, J.; Jansen, S.; Lewis, S.L.; Miller, R.B.; Swenson, N.G.; Wiemann, M.C.; Chave, J. Global wood density database. Dryad, 2009. Available online: http://hdl.handle.net/10255/dryad.235 (accessed on 8 January 2023).
- Réjou-Méchain, M.; Tanguy, A.; Piponiot, C.; Chave, J.; Hérault, B. Biomass: an R package for estimating above-ground biomass and its uncertainty in tropical forests. Methods Ecol. Evol. 2017, 8, 1163–1167. [Google Scholar] [CrossRef]
- SEEG—Sistema de Estimativas de Emissões e Remoções de Gases de Efeito Estufa. Municípios 2022: Estatísticas. Observatório do Clima. Available online: https://public.tableau.com/app/profile/seeg2472/viz/SEEGMUNICPIOS2022Estatsticas/RANKINGGERAL (accessed on 15 July 2024).
- Fonsêca, N.C.; Cunha, J.S.A.; Albuquerque, E.R.G.M.; Lins-e-Silva, A.C.B. Carbon stock in aboveground biomass and necromass in the Atlantic Forest: An analysis of data published between 2000 and 2021. An. Acad. Bras. Cienc. 2024, 96, e20220761. [Google Scholar] [CrossRef] [PubMed]
- Lindén, L.; Riikonen, A.; Setälä, H.; Yli-Pelkonen, V. Quantifying carbon stocks in urban parks under cold climate conditions. Urban For. Urban Greening 2020, 49, 126633. [Google Scholar] [CrossRef]
- Davies, Z.G.; Edmondson, J.L.; Heinemeyer, A.; Leake, J.R.; Gaston, K.J. Mapping an urban ecosystem service: Quantifying above-ground carbon storage at a city-wide scale. J. Appl. Ecol. 2011, 48, 1125–1134. [Google Scholar] [CrossRef]
- Schreyer, J.; Tigges, J.; Lakes, T.; Churkina, G. Using airborne LiDAR and QuickBird data for modelling urban tree carbon storage and its distribution—a case study of Berlin. Remote Sens. 2014, 6, 10636–10655. [Google Scholar] [CrossRef]
- Malage, L. Bosque Urbano Reinhard Maack: Contribuição no Enfrentamento da Mudança Climática por Florestas Urbanas. Graduation Monograph, Universidade Federal do Paraná, Curitiba, 2023.
- Lowe, W.A.M.; Silva, G.L.L.P.; Pushpakumara, D.K.N.G. Homegardens as a modern carbon storage: Assessment of tree diversity and above-ground biomass of homegardens in Matale district, Sri Lanka. Urban For. Urban Greening 2022, 74, 127671. [Google Scholar] [CrossRef]
- Padmakumar, B.; Sreekanth, N.P.; Shanthiprabha, V.; Paul, J.; Sreedharan, K.; Augustine, T.; Jayasooryan, K.K.; Rameshan, M.; Arunbabu, V.; Mohan, M.; et al. Unveiling tree diversity and carbon density of homegarden in the Thodupuzha urban region of Kerala, India: A contribution towards urban sustainability. Trop. Ecol. 2021, 62, 508–524. [Google Scholar] [CrossRef]
- Pedreira, L.O.L. (Secretaria Municipal de Meio Ambiente, Rio de Janeiro, RJ, Brazil). Personal communication, 2024.
- SMAC—Secretaria Municipal de Meio Ambiente. Inventário da Cobertura Arbórea da Cidade do Rio de Janeiro; Prefeitura da Cidade do Rio de Janeiro: Rio de Janeiro, Brazil, 2015. [Google Scholar]
- PCRJ—Prefeitura da Cidade do Rio de Janeiro. Cobertura vegetal e uso da terra 2018. Available online: https://www.data.rio/datasets/c32974e0db954842b7af9a4816d7a821/explore (accessed on 4 January 2024).
- Pedreira, L.O.L.; Andrade, F.N.; Fico, B.V. Índices de Áreas Verdes do Município do Rio de Janeiro. Nota Técnica – No 37; Prefeitura da Cidade do Rio de Janeiro: Rio de Janeiro, Brazil, 2017. [Google Scholar]
- Liu, S.; Brandt, M.; Nord-Larsen, T.; Chave, J.; Reiner, F.; Lang, N.; Tong, X.; Ciais, P.; Igel, C.; Pascual, A.; et al. (2023). The overlooked contribution of trees outside forests to tree cover and woody biomass across Europe. Sci. Adv. 2023, 9, eadh4097. [Google Scholar] [CrossRef] [PubMed]
Figure 1.
Aerial photo of the Rio de Janeiro Botanical Garden, Rio de Janeiro, Brazil, showing the arboretum in lowland areas and the secondary remnants of the Atlantic Forest on the slopes. In the background, forest remnants of the Tijuca National Park are visible. Photo: Rafael da Silva Ribeiro.
Figure 1.
Aerial photo of the Rio de Janeiro Botanical Garden, Rio de Janeiro, Brazil, showing the arboretum in lowland areas and the secondary remnants of the Atlantic Forest on the slopes. In the background, forest remnants of the Tijuca National Park are visible. Photo: Rafael da Silva Ribeiro.
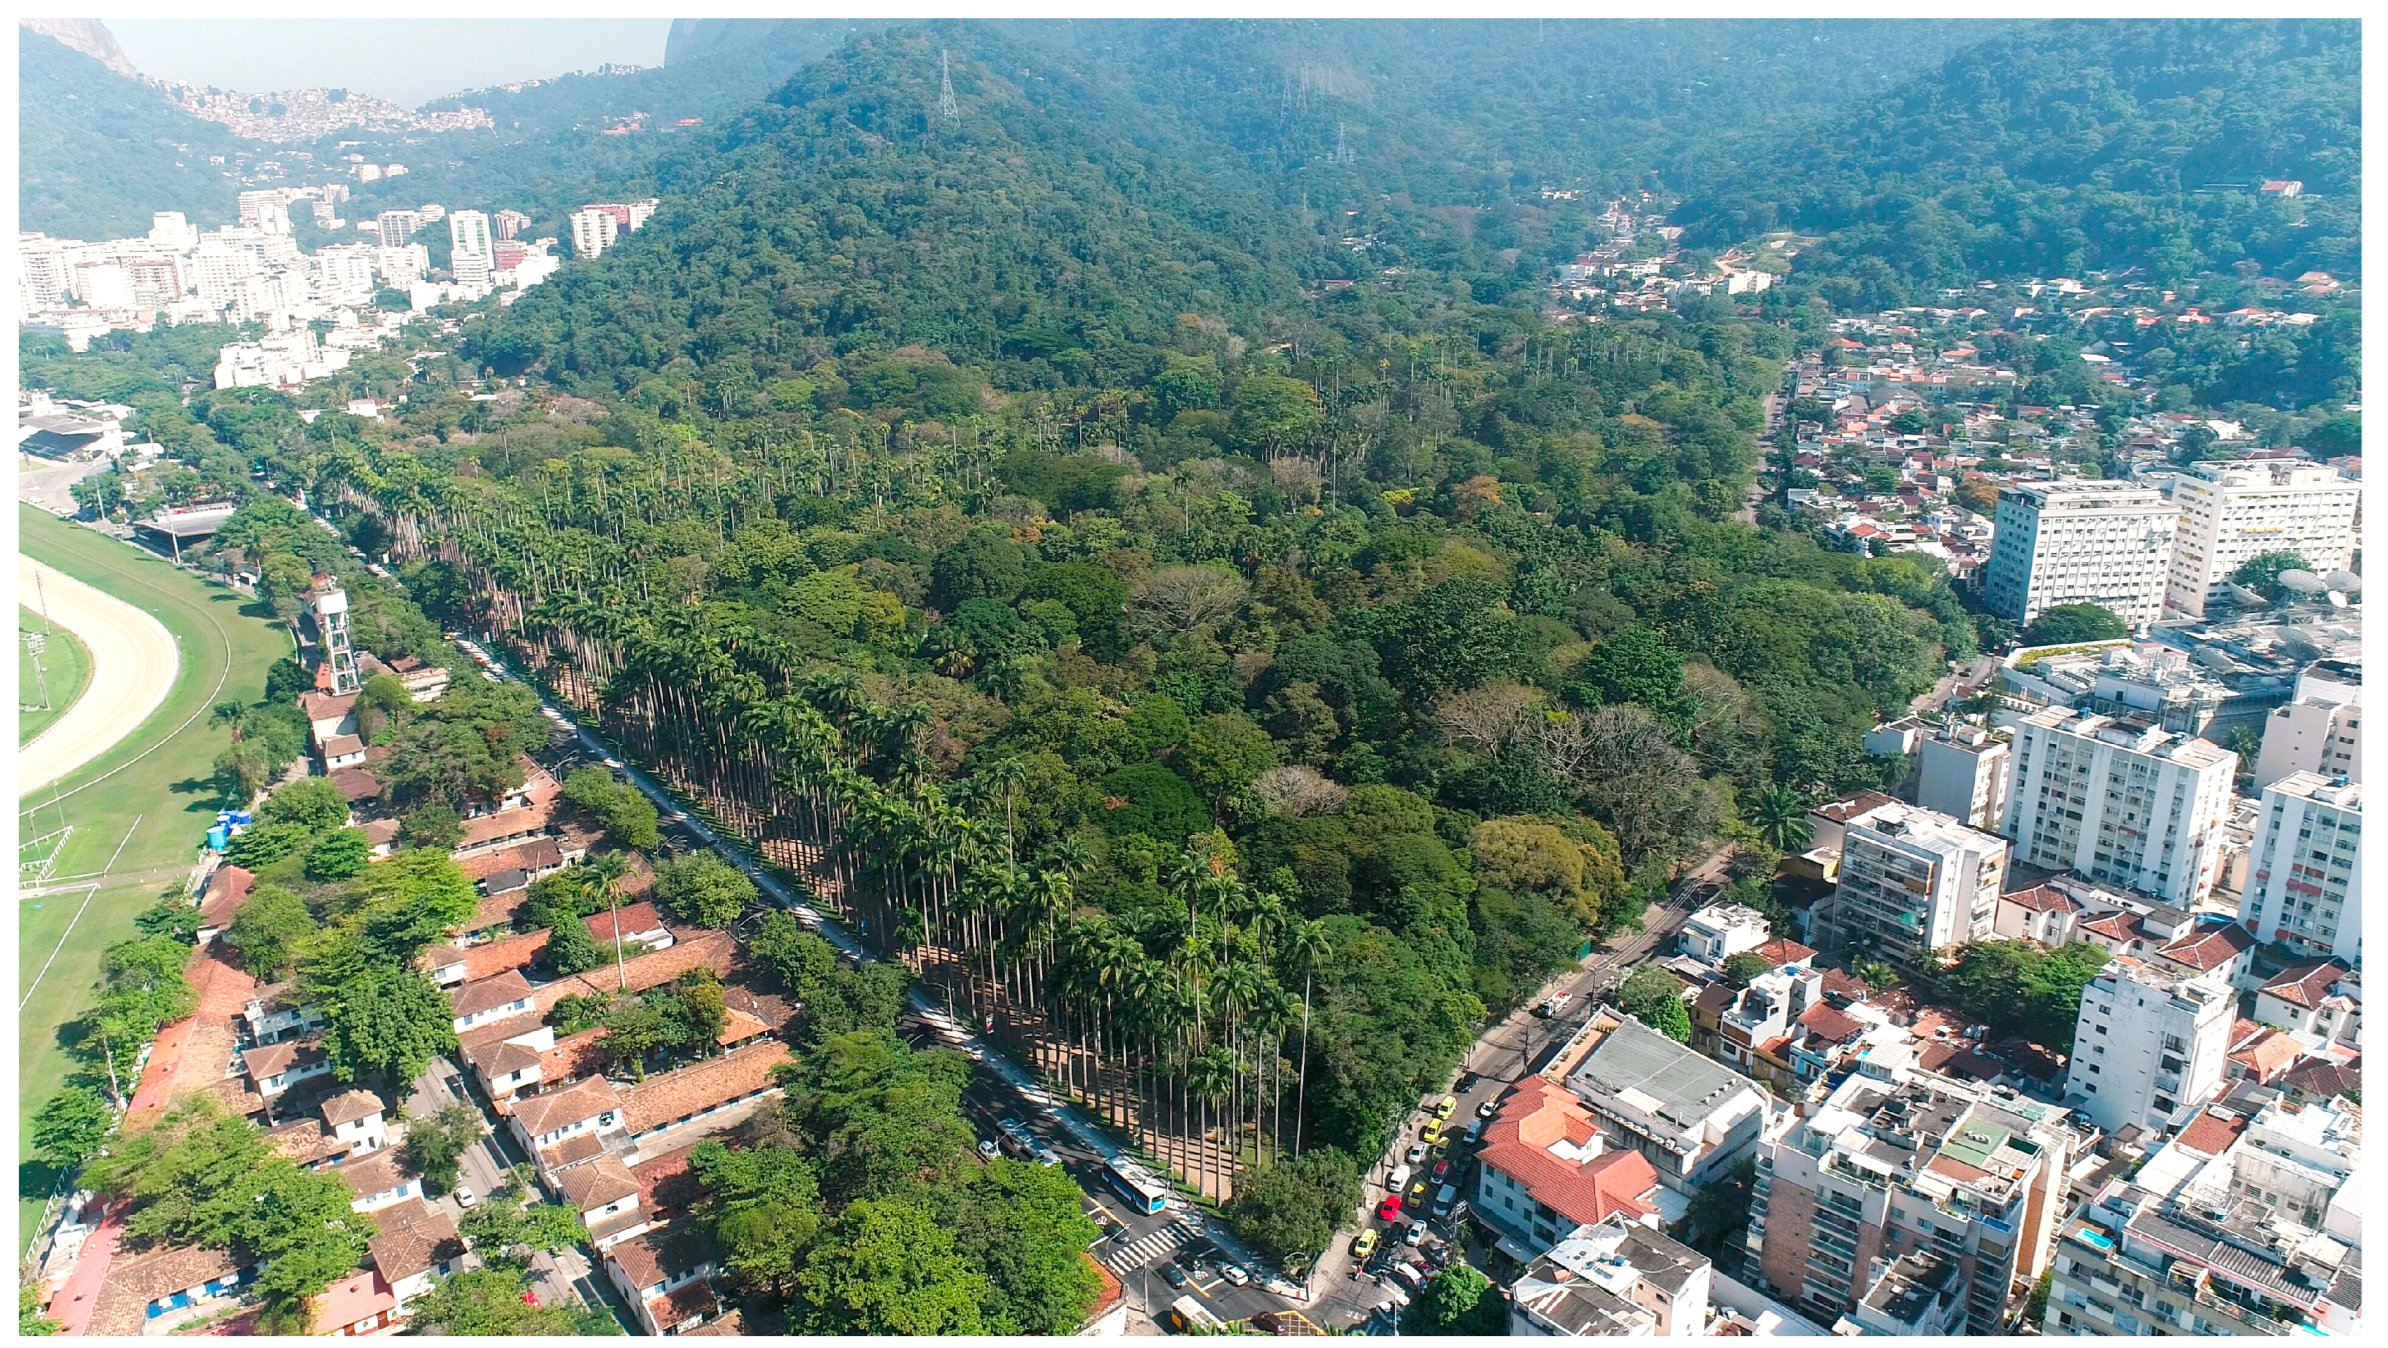
Figure 2.
Location of the Rio de Janeiro Botanical Garden (bottom right) and its arboretum (left), Rio de Janeiro, Brazil, illustrating the non-uniform distribution of trees in the arboretum. The ‘Amazonian Region’ forms a large triangular area on the right side of the arboretum.
Figure 2.
Location of the Rio de Janeiro Botanical Garden (bottom right) and its arboretum (left), Rio de Janeiro, Brazil, illustrating the non-uniform distribution of trees in the arboretum. The ‘Amazonian Region’ forms a large triangular area on the right side of the arboretum.
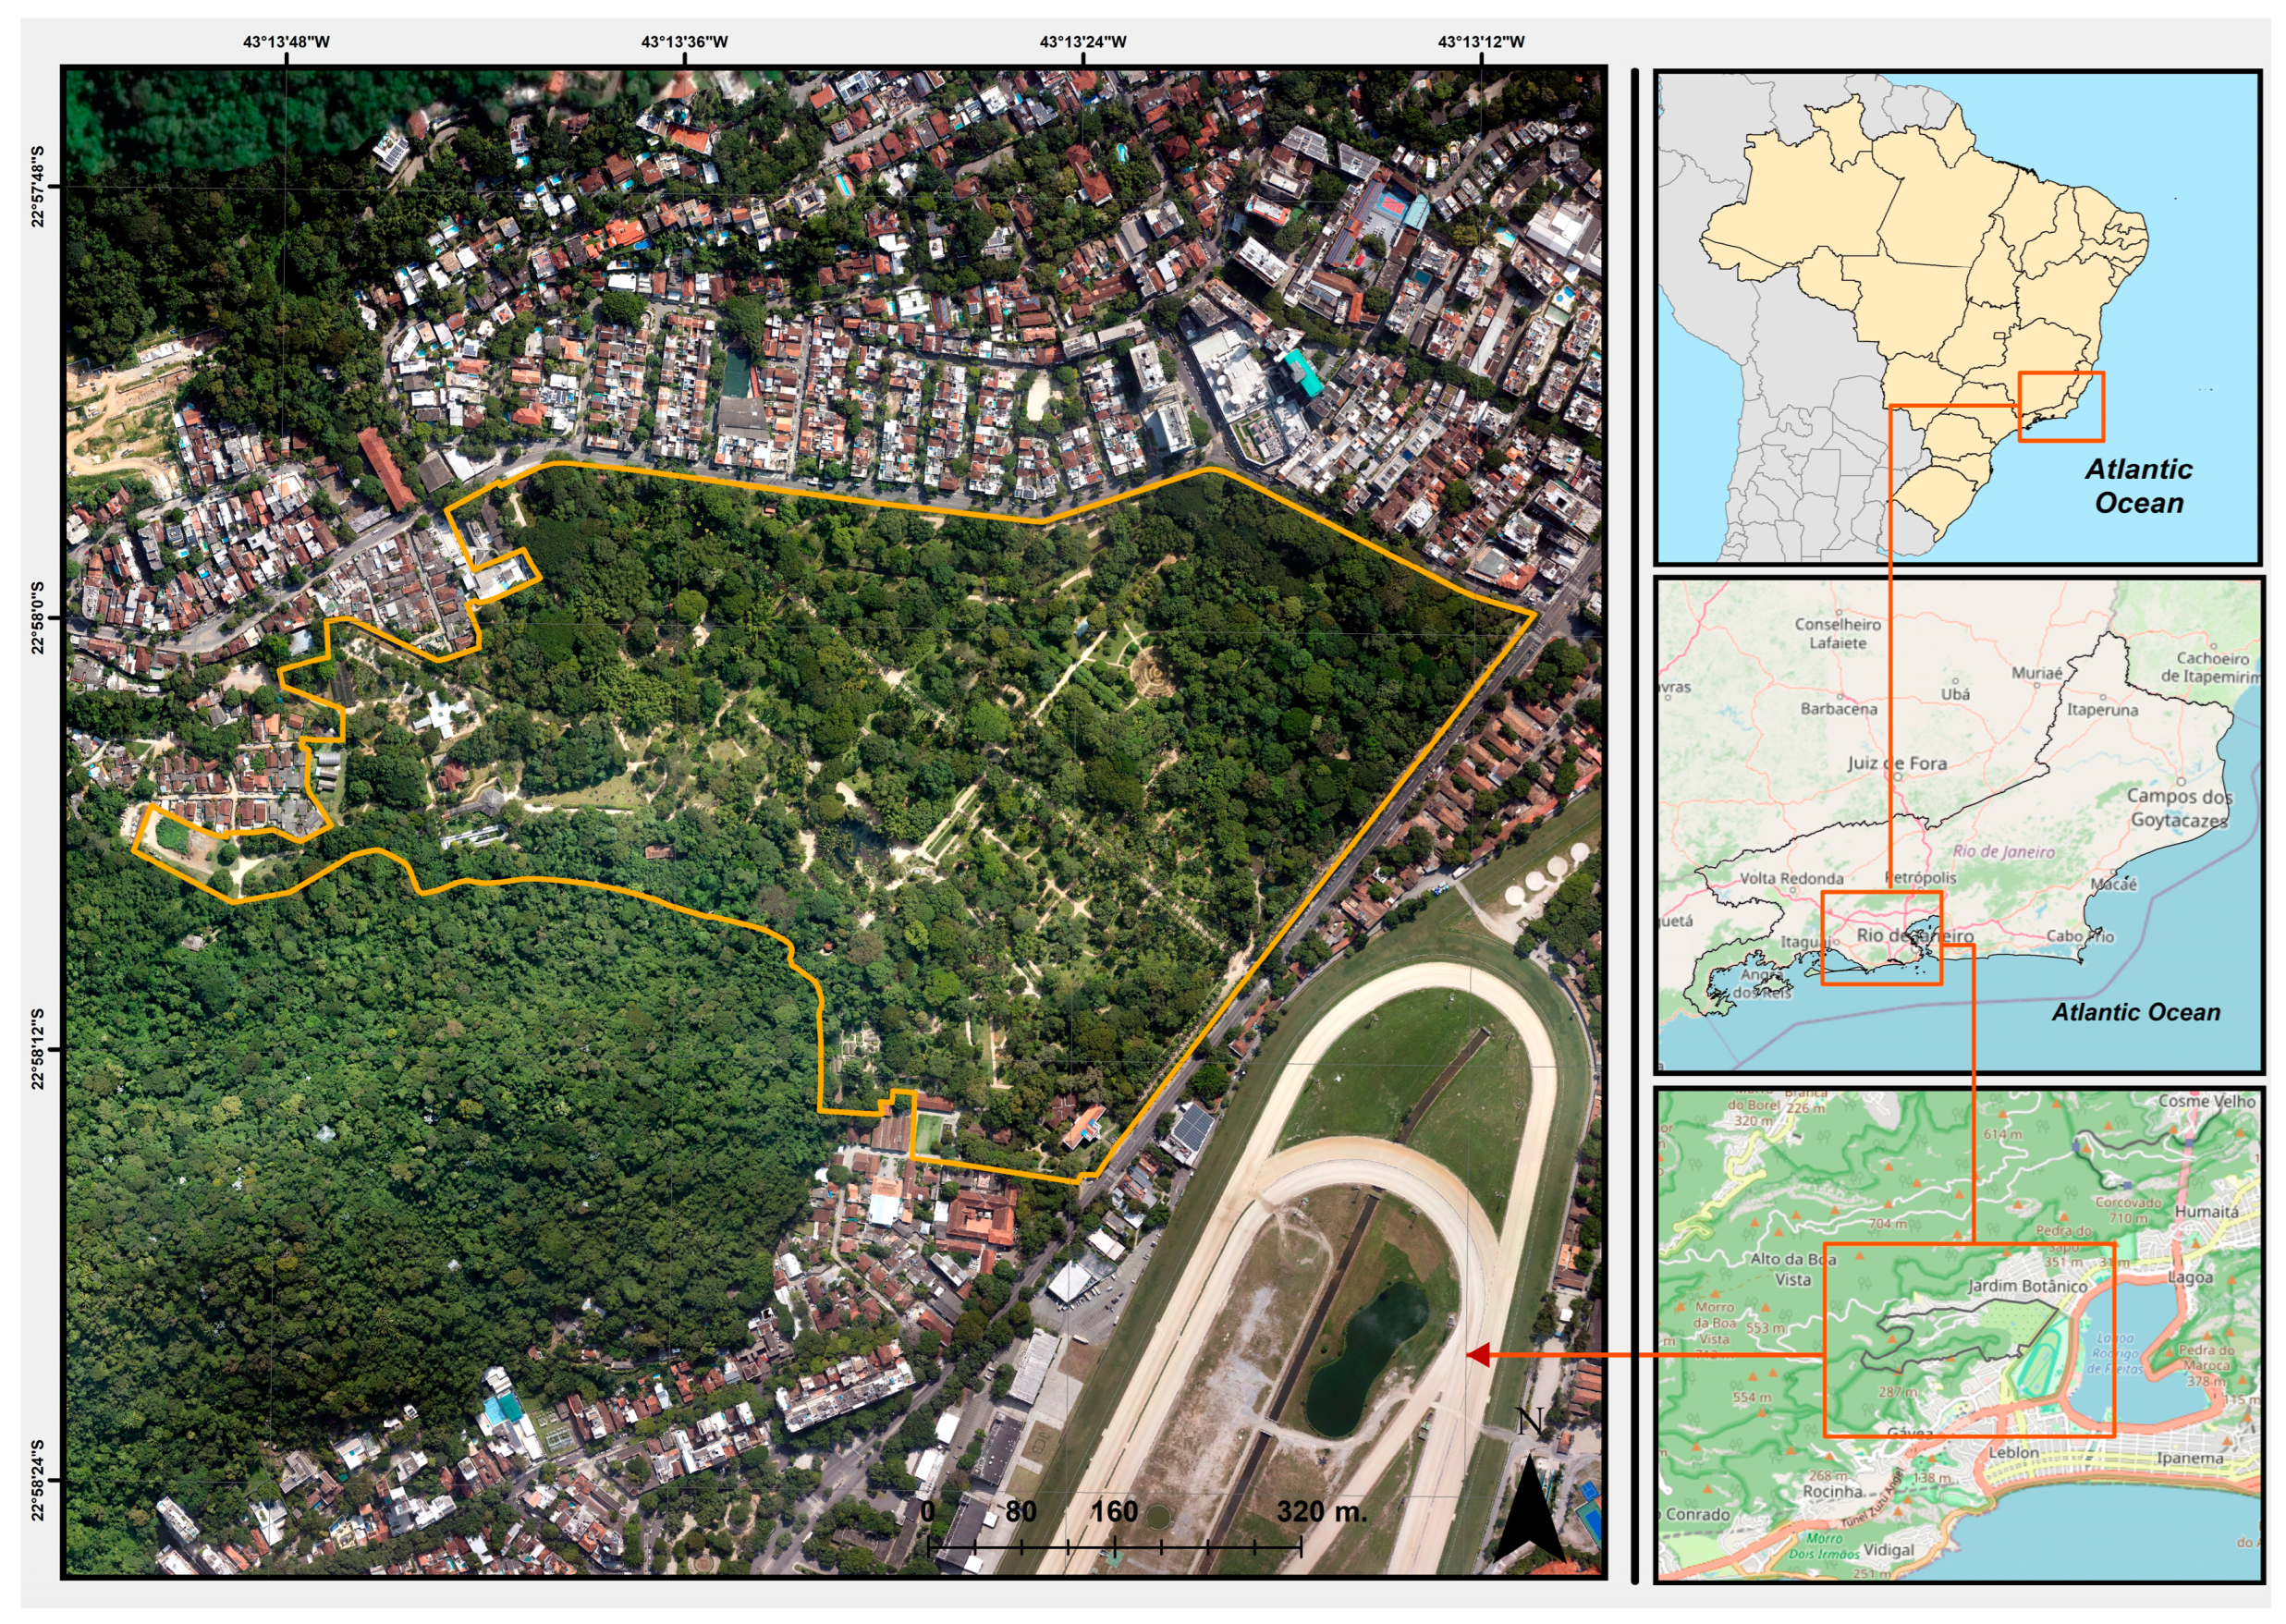
Figure 3.
Heat map of aboveground biomass (AGB) of trees with a diameter at breast height (DBH) ≥ 10 cm at the Rio de Janeiro Botanical Garden arboretum. The AGB is concentrated mainly in the ‘Amazonian Region’, which forms a large triangular area on the right side of the arboretum, and along the two alleys of Imperial Palms, which form an inverted ‘T’ in the figure (see also Figure 1).
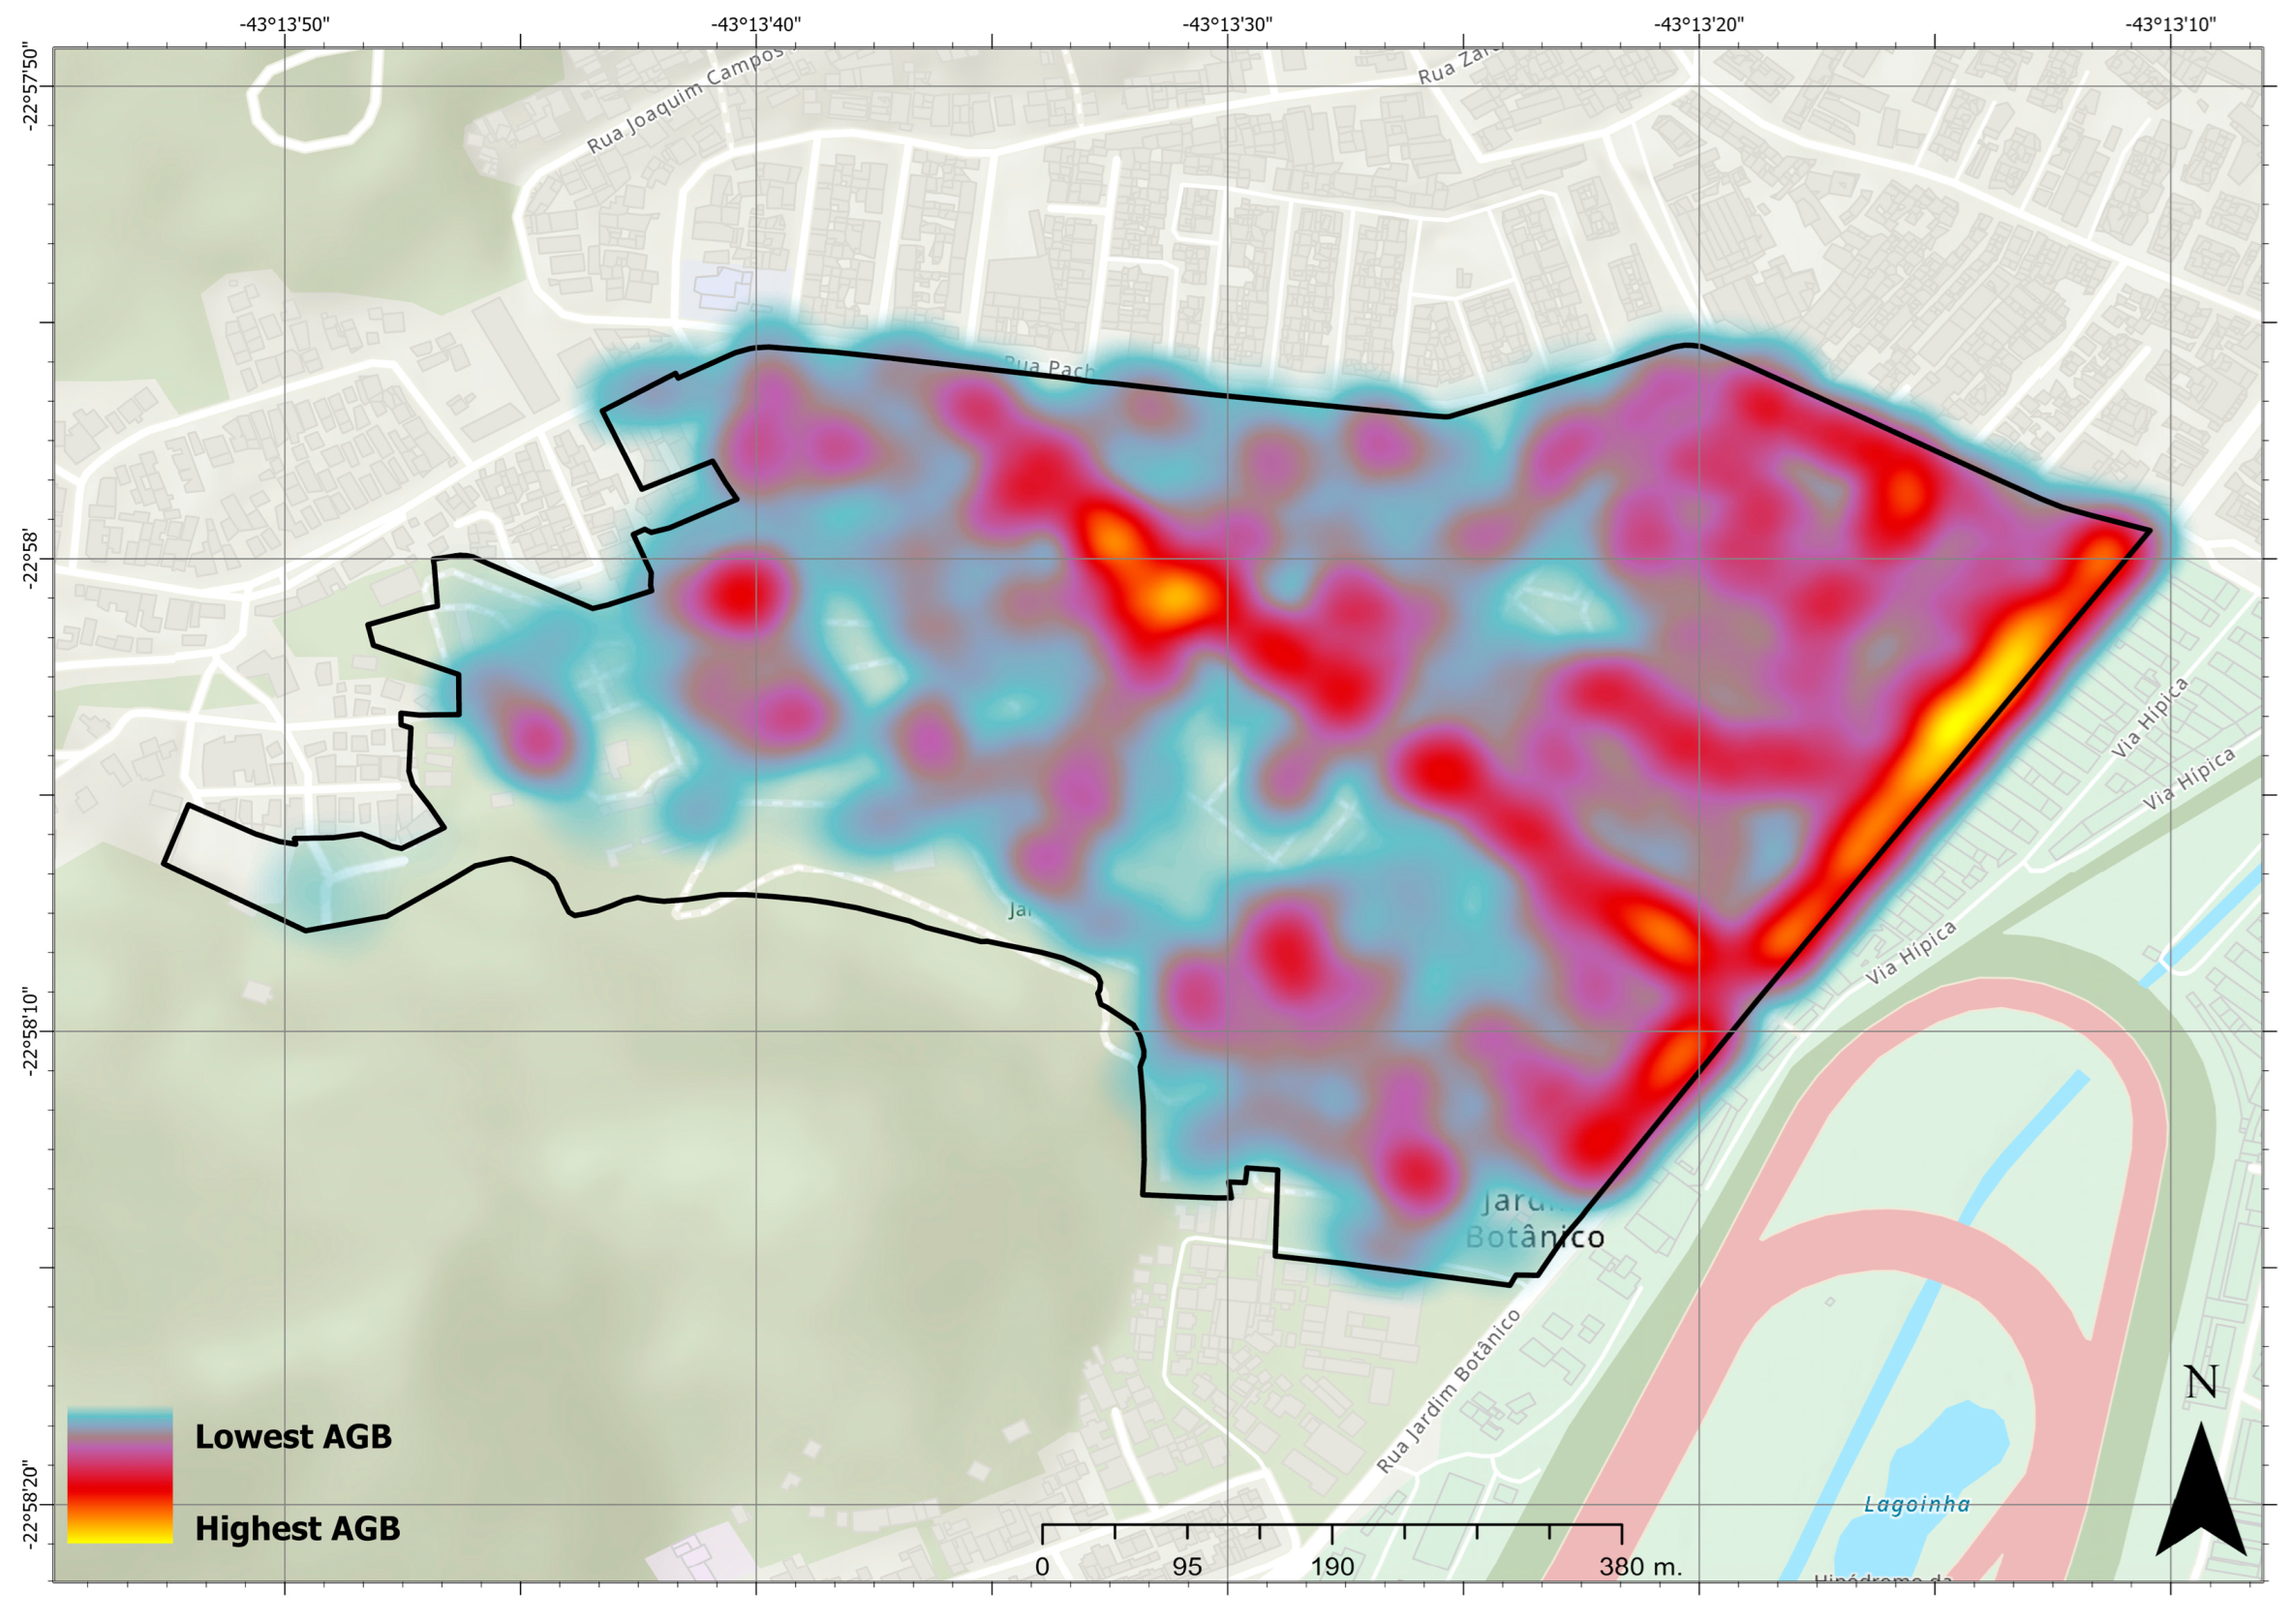

Table 1.
Allometric models used to estimate the aboveground biomass stocks in the trees at the Rio de Janeiro Botanical Garden arboretum, Rio de Janeiro, Brazil. AGB = aboveground biomass (dry mass, kg); H = height (m); p = wood density (g.cm-3); D = stem diameter (cm); dmf = dry mass fraction (dry mass/fresh mass).
| Taxonomic component | Allometric model | Reference |
|---|---|---|
| Gymnosperms (excluding Cycadaceae and Zamiaceae), magnoliids, and eudicots | AGB = 0.1054(HpD2)0.9417 | [13] |
| Palms, arborescent monocotyledons, Cycadaceae and Zamiaceae | AGB0.25 = 0.55512(dmfD2Hstem)0.25 | [31] |
| Ravenala madagascariensis | AGB = EXP(-4.996+5.654ln(H)-0.772(ln(H))2) | [32] |
Table 2.
Trees with the highest amounts of aboveground biomass at the Rio de Janeiro Botanical Garden arboretum, Rio de Janeiro, Brazil. H = height (m); D = stem diameter (cm); p = wood density (g.cm-3); AGB = aboveground biomass (Mg).
Table 2.
Trees with the highest amounts of aboveground biomass at the Rio de Janeiro Botanical Garden arboretum, Rio de Janeiro, Brazil. H = height (m); D = stem diameter (cm); p = wood density (g.cm-3); AGB = aboveground biomass (Mg).
| Family/species | H | D | p | AGB |
|---|---|---|---|---|
| LEGUMINOSAE Samanea saman (Jacq.) Merr. | 27.73 | 224.54 | 0.59 | 39.32 |
| MELIACEAE Khaya senegalensis A.Juss. | 44.35 | 150.56 | 0.63 | 30.47 |
| MELIACEAE Khaya senegalensis A.Juss. | 38.35 | 155.97 | 0.63 | 28.40 |
| MALVACEAE Ceiba pentandra (L.) Gaertn. | 39.63 | 219.00 | 0.31 | 28.21 |
| MYRTACEAE Eucalyptus globulus Labill. | 33.69 | 150.62 | 0.72 | 26.90 |
| MYRTACEAE Corymbia citriodora (Hook.) K.D.Hill. & L.A.S.Johnson | 36.37 | 125.10 | 0.80 | 22.57 |
| MALVACEAE Sterculia apetala (Jacq.) H.Karst. | 30.51 | 194.81 | 0.39 | 22.39 |
| LEGUMINOSAE Swartzia langsdorffii Raddi | 24.64 | 144.51 | 0.85 | 21.59 |
Table 3.
Carbon density in Mg.ha-1 in different cities around the world. AGC: aboveground carbon; BGC: belowground carbon; DBH: diameter at breast height.
Table 3.
Carbon density in Mg.ha-1 in different cities around the world. AGC: aboveground carbon; BGC: belowground carbon; DBH: diameter at breast height.
| City, country | Estimation extent | Vegetation component | Carbon density | Reference |
|---|---|---|---|---|
| Rio de Janeiro, Brazil | Rio de Janeiro Botanical Garden arboretum | AGC; trees (DBH ≥ 10 cm) | 103.7 | This study |
| Rio de Janeiro, Brazil | Rio de Janeiro Botanical Garden arboretum | AGC + BGC; trees (DBH ≥ 10 cm) | 130.7 | This study |
| Leicester, England | Urban area | AGC; herbs, shrubs, and trees | 31.6 | [40] |
| Leicester, England | Areas of tree cover on publicly owned/managed sites | AGC; herbs, shrubs, and trees | 288.6 | [40] |
| Berlin, Germany | Urban area (urban forests not included) | AGC; trees | 11.5 | [41] |
| Jersey City, USA | Urban area | AGC + BGC; trees (DBH ≥ 2.54 cm) | 5 | [15] |
| Morgantown, USA | Urban area | AGC + BGC; trees (DBH ≥ 2.54 cm) | 37.7 | [15] |
| Helsinki, Finland | Urban constructed parks | AGC; trees (DBH ≥ 2.5 cm) | 22 - 28 | [39] |
| Singapore | Telok Kurau neighborhood | AGC + BGC; woody trees | 7.3 | [13] |
| Pyin Oo Lwin, Myanmar | National Botanical Gardens | AGC + BGC; herbs, shrubs, and trees | 177.1 | [18] |
| Pyin Oo Lwin, Myanmar | Other urban green spaces | AGC + BGC; herbs, shrubs, and trees | 71.9 - 225.5 | [18] |
| Curitiba, Brazil | Urban forest | AGC + BGC; trees (DBH > 5 cm) | 102.3 | [42] |
| Matale District, Sri Lanka | Urban to rural homegardens | AGC; trees (DBH > 5 cm) | 0.8 - 139.4 | [43] |
| Thodupuza, India | Urban homegardens | AGC + BGC; trees (DBH ≥ 3 cm) | 28.2 - 39.5 | [44] |
Disclaimer/Publisher’s Note: The statements, opinions and data contained in all publications are solely those of the individual author(s) and contributor(s) and not of MDPI and/or the editor(s). MDPI and/or the editor(s) disclaim responsibility for any injury to people or property resulting from any ideas, methods, instructions or products referred to in the content. |
© 2024 by the authors. Licensee MDPI, Basel, Switzerland. This article is an open access article distributed under the terms and conditions of the Creative Commons Attribution (CC BY) license (http://creativecommons.org/licenses/by/4.0/).
Copyright: This open access article is published under a Creative Commons CC BY 4.0 license, which permit the free download, distribution, and reuse, provided that the author and preprint are cited in any reuse.


