
Submitted:
14 August 2024
Posted:
19 August 2024
You are already at the latest version
Abstract
In 2018, Iran witnessed approximately 21,000 fatalities resulting from road accidents, ranking it as the fifth leading cause of death across all age groups. These incidents carry substantial economic and social burden for the nation, claiming more than 5% of its GDP. Human behavior emerges as a significant contributing factor to high-risk driving offenses. It has been proposed that by influencing general deterrence, a rigorous defense can be established against such violations. Various theories posit that by reinforcing or diminishing influential factors, general deterrence perception can be molded, presenting a potential avenue for an effective deterrent against traffic infractions. This study examines deterrence perceptions prevailing among the public in Iran regarding the enforcement of traffic laws. Employing Structural Equation Modeling (SEM), we delve into the intricate relationships between variables, allowing for a comprehensive exploration of the factors influencing general deterrence. The study draws on the data derived from a survey comprising 548 questionnaires for modeling purposes. An innovative concept, private sector enforcement, is introduced and incorporated into the questioning and modeling process. The findings reveal that socioeconomic status (p-value<0.01), police enforcement (p-value<0.05), private sector enforcement (p-value<0.05), specific deterrence (p-value<0.01), and the use of technology (p-value<0.01) have direct and indirect impacts on the general deterrence perception of drivers.
Keywords:
General deterrence
; Specific deterrence
; Driving violations
; Traffic enforcement
; Private sector
; Structural Equation Modeling
1. Introduction
Safe use of roads and networks by various user groups is a crucial aspect of transportation. The World Health Organization's report reveals that in Iran, one person loses their life in a road accident every 31 minutes [1]. Furthermore, UNICEF highlights that traffic accidents impose a cost exceeding 5% of Iran's GDP on its economy [2]. Recognizing the substantial losses due to injuries and casualties, countries heavily invest in practical measures to prevent such incidents. Studies have demonstrated that reducing the number of traffic crashes by addressing traffic violations can efficiently lower transportation costs [3]. Several studies have highlighted the significant contribution of driving offenses to the rise in traffic accidents and disruptions [4,5,6,7]. In Iran, speeding and illegal parking are two prevalent traffic violations that not only compromise traffic safety but also lead to disruptions [8,9]. Notably, Özkan et al. demonstrated a positive correlation between speeding and the frequency of traffic accidents in Iran [10].
In order to reduce incidents, it is essential to identify their underlying causes. These causes are typically classified into four categories: 1-human, 2- environmental factors, 3- road condition, and 4- vehicle-related factors [11]. Among these categories, human factors are particularly significant and play a more prominent role compared to others when it comes to incidents [12,13,14]. The relationship between human behavior and attitude has long been a subject of inquiry. According to theories, attitudes strongly influence drivers' behavior [15]. For example, Palmer's study found that there is an inverse relationship between the likelihood of drivers committing speeding offenses and the increased probability of detection as well as monitoring of those violations [16]. Based on the deterrence theory, drivers take into account two factors when deciding whether to violate traffic laws: the probability of getting caught and the severity of the punishment [17]. As per this theory, if a driver perceives a high likelihood of their violation being detected or if the punishment for the violation is severe, they are less likely to engage in that violation. Understanding how drivers' attitudes influence their behavior can provide valuable insights for developing effective strategies to promote safe driving practices. When drivers perceive a lower risk of police enforcement, they are more likely to exceed the speed limit [18]. Driver attitudes have a significant impact on their behavior and adherence to traffic regulations as well as safety measures. Positive attitudes toward traffic enforcement and safe driving are closely linked to a reduced probability of engaging in driving violations. Conversely, negative attitudes can increase the tendency to risky behaviors and violations. Exploring the factors that influence drivers' attitudes toward enforcement can offer valuable insights into promoting safer driving practices [19]. While a few research have provided evidence linking attitude towards enforcement with engagement in risky driving behaviors, many aspects regarding drivers’ attitude and how we can influence it have remained unclear, especially in low- and middle-income countries.
Traffic violation detection and infringement process is a fundamental component of traffic law enforcement and is often categorized as a form of specific deterrence. Specific deterrence aims to deter individuals who have committed traffic offenses from repeating their infractions by imposing consequences such as fines or license suspensions. This targeted approach serves to discourage the offending individual from engaging in similar behavior in the future [20].
General deterrence, on the other hand, is a widely accepted theory in criminology which suggests that the threat of punishment can deter people from committing violations. It seeks to prevent potential offenders from committing traffic violations in the first place by establishing a broader understanding of the consequences and penalties associated with such actions [20,21]. The body of literature in this field consistently highlights an intriguing relationship between specific deterrence and general deterrence.
Studies have indicated that the penalties of specific deterrence measures, such as traffic violation detection and the imposition of penalties, can contribute to an overall enhancement of general deterrence within a given jurisdiction. As individuals observe the enforcement of consequences for traffic violations, they become more cognizant of the potential risks and repercussions associated with disregarding traffic laws. The primary objective of this research is to quantitatively assess the impact of additional variables on the construct of general deterrence, independently of the effects associated with specific deterrence. By comprehensively elucidating the array of factors that influence general deterrence, this study provides valuable insights for policymakers and authorities. These insights have the potential to enhance the efficacy of their efforts in optimizing the traffic safety environment. Such optimization can be achieved through the strategic implementation of campaigns aimed at deterring traffic violations thereby fostering a safer atmosphere on the roadways.
In this study, the variables that indicate the respondents' estimation of the probability of detecting their traffic offenses, such as speeding and parking violations, have been considered as general deterrence indicators. Meanwhile, the number of speeding and parking tickets issued to the respondents is considered specific deterrence indicators. Through structural equation modeling, this study delved into various factors, including police enforcement performance, respondents' attitudes on private sector involvement in traffic enforcement, demographic characteristics, attitudes regarding fine amounts, technology savviness, and the influence of specific deterrence on general deterrence. The goal of this research is to make valuable contributions towards evidence-based interventions and policy initiatives aimed at enhancing road safety. Understanding the factors that shape general deterrence can inform targeted educational campaigns, enforcement strategies, and policy interventions to promote safer driving practices.
The subsequent sections of this paper are structured as follows. Section 2 provides a comprehensive review of the existing literature and background related to the topic. Section 3 outlines the survey data utilized in this study. In Section 4, the employed methodology is presented. Section 5 presents a detailed discussion of the analysis results. Lastly, Section 6 concludes the paper and discusses the limitations of the study.
2. Literature Review
The deterrence theory posits that drivers' decisions to commit traffic violations are influenced by two crucial factors: the probability of detection and the associated penalties [17]. When drivers perceive a high likelihood of being caught or facing substantial fines, they are deterred from engaging in offenses. This theory draws on crime economics models, with Becker's foundational model [22], expressed through equation 1, being particularly influential.
: The expected utility of committing violation
: Possibility of detecting violation.
: The financial and psychological advantages of committing violation
: The financial value of the punishment and the fine.
Research has shown that there is a connection between the level of police enforcement and driving behavior. The presence or absence of traffic enforcement can significantly impact drivers' attitudes and behaviors on the road. A study conducted in Greece [23] revealed that an increase in police controls resulted in a reduction in incidents of driving under the influence of alcohol. The findings indicated a significant decline of approximately 50% in drunk driving violations, accompanied by a notable 10.2% rise in positive attitudes towards alcohol control.
General deterrence and specific deterrence are two concepts that are related to deterrence theory. General deterrence refers to the effect of the threat of legal punishment on the public at large, while specific deterrence refers to the impact of the actual legal punishment on those who are apprehended. Both concepts are grounded in individuals' perceptions regarding severity, certainty, and celerity of punishment [24,25].
Based on our thorough analysis, our investigation has indicated that within the general deterrence literature, there is a notable gap in understanding the factors influencing general deterrence. Specifically, the literature has primarily focused on the impact of specific deterrence on it. However, a comprehensive examination of the factors affecting general deterrence could significantly enhance the effectiveness of traffic law enforcement.
In this study, we have considered specific deterrence, respondents' attitudes towards traffic law enforcement mechanisms, and their demographic characteristics as potential contributing variables to general deterrence. Several studies have explored the impact of drivers' attitudes on their behavior, covering aspects such as safety attitudes, attitudes towards high-risk behaviors, risk acceptance while driving, and positive attitudes regarding traffic enforcement.
For instance, a study conducted in Serbia and Northern Kosovo compared the attitudes and behaviors of drivers in regions with and without traffic enforcement. The results indicated that the lack of enforcement had a significant influence on various driving behaviors [26]. Ulleberg et al. employed a questionnaire to investigate the causes of high-risk behavior among young drivers in Norway, with a sample size of 1932 participants [27]. The study focused on examining personality traits, social cognition, safety attitudes, legality, and enforcement. The study's conclusion highlighted a strong correlation between attitudes and high-risk behaviors among young drivers. It suggests that by specifically targeting the attitudes of young drivers, there is potential to significantly reduce casualties and high-risk behaviors associated with driving. In another study, Hilde Iversen and Torbjorn Rundmo demonstrated the influence of safety attitudes on high-risk behavior and risk acceptance during driving [28]. The study examined 16 propositions pertaining to safety attitudes and 24 propositions relating to drivers' behavior. The findings stressed the impact of attitudes on drivers' behavior. Further this research confirmed that attitudes retain a crucial role in defining high-risk behavior in driving, even when accounting for factors such as age and gender. Lund and Aaro aimed to propose an effective approach to preventing incidents by developing a model that incorporates attitudes, driving behaviors, living environment, and self-reported accident rates [29]. The model suggested that modifying attitudes serves as the initial step, as adjusting attitudes would subsequently lead to improved driving behavior and ultimately result in a reduction in incidents.
As reviewed, many variables have been investigated for understanding the driver’s attitudes in traffic studies. However, the drivers’ attitudes investigated in this study, which focuses on traffic law enforcement, differ from those in prior studies. Respondent’s attitude to traffic law enforcement mechanisms includes their response to some questions about traffic fine amounts, police enforcement performance, and private sector involvement in enforcement.
These variables were examined in a study by Khojastehpour et al. [30], with detailed explanations of their constructive indicators provided in the methodology section. In this study, SEM was employed to present the intricate relationships among drivers' attitudes, traffic law enforcement, specific deterrence, and general deterrence. Note that such investigations have been lacking in low- and middle-income countries, where traffic incidents present significant challenges. Accordingly, this research aims to address this gap, focusing on Iran, and thus, it contributes to the body of knowledge within the unique context of a low- and middle-income country, a contribution that is both novel and essential.
3. Data
3.1. Questionnaire Content
The questionnaire comprises five distinct sections, including general deterrence indicators, specific deterrence indicators, police enforcement performance, private sector involvement enforcement, demographic information, and use of technology. Within the framework of SEM, each of these sections represents a latent variable, which is assessed through the corresponding indicators. These indicators are the questions presented in the questionnaire. The latent variables are discussed in the following.
3.1.1. General Deterrence
The study utilized four indicators to gauge general deterrence, including:
- Percentage of speeding violations detected and enforced on urban roads
- Percentage of parking violations detected and enforced
- Percentage of active speed fixed cameras
- Percentage of speeding violations detected and enforced on rural roads
Note that the research primarily focused on two types of violations: speeding and parking. Respondents were provided with five options, each representing a percentage range of enforcement (20% increments): 1) ‘0–20%,’ 2) ‘20–40%,’ 3) ‘40–60%,’ 4) ‘60–80%,’ and 5) ‘80–100%.’ This question serves as a variable within the modeling framework, and the model will estimate the direct or indirect impact of all other variables on this variable.
3.1.2. Specific Deterrence
The number of driving tickets can be viewed as a deterrent factor for committing violations [31,32]. The model utilizes a latent variable in a formative manner, with its indicators being the number of speeding and parking violation tickets received within the past three years. The number of tickets ranges from 0 to 10.
3.1.3. Attitude toward Traffic Fine Amounts
There is a single-item variable representing the driver's opinion regarding the amount of fines. This variable employs a 3-point Likert scale, with a score of 1 indicating a ‘low’ amount, 2 ‘medium’, and 3 ‘high’.
3.1.4. Attitude toward Police Enforcement Performance
The questionnaire included three distinct questions aimed at assessing drivers' perceptions of police performance in law enforcement. These questions were utilized to form three latent variables within the modeling framework. 1- Speeding enforcement; This variable measures police's actions to prevent speeding violations, regardless of the manner of performing the actions. It was measured using three indicators on a 5-point Likert scale, in which 0 represents ‘no effect’, 1 ‘low effect’, 2 ‘moderate effect’, 3 ‘effective’ and 4 ‘very effective’. 2- Parking enforcement; it is the same as the previous one, but instead of speeding we asked about parking. 3- Police presence: The presence of law enforcement officers on roads and highways is widely recognized as a prominent factor influencing driver behavior [31]. This variable was included as a single item in the model and indirectly affects drivers' attitudes. It is represented as a binary variable, where 0 signifies ‘not enough’ and 1 indicates ‘enough’.
3.1.5. Private Sector Involvement in Enforcement
This section examines two distinct latent variables within the modeling framework. The first variable investigates respondents' experiences with privatization initiatives in Iran, specifically in the police and transportation services domains, over the past two decades. This includes the use of municipal disciplinary officers to address transit blockades, the presence of Police +10, a private sector entity offering police-related services [33], and the existence of ridesharing platforms like Snapp and Tapsi. Respondents rated their experiences on a 4-point Likert scale, indicating the effectiveness of these initiatives, ranging from 1 for ‘slightly effective’ to 4 for ‘very much effective’. Snapp and Tapsi are examples of taxi-hailing companies operating in Iran. They represent instances of transferring governmental authority in the transportation sector to the private sector. The second variable directly explores the willingness of drivers to use the private sector for enforcement. It is a single item incorporated into the model, represented in a binary format. 0 indicates unwillingness to utilize the private sector for enforcement, while 1 signifies willingness to employ the private sector.
3.1.6. Demographic
Many researchers have considered the demographic variable as one of the effective factors on the attitude and drivers' behavior [34,35,36,37,38]. This study incorporates the age and education variables, both independently and as single items in modeling. To evaluate the respondents' education level, five categories were utilized: ‘Grade 3 in high school and below,’ ‘High school diploma,’ ‘Bachelor’s degree,’ ‘Master's degree,’ and ‘Ph.D.’
3.1.7. Use of Technology
A question about the drivers' technological savviness was added toward the end of the questionnaire. In the modeling process, this variable is used as a single-item measure. For this question, there were five options., which were as follows: 1 ‘I am interested and actively use them,’ 2 ‘I am interested but lack the ability to use them,’ 3 ‘I use them only when necessary,’ 4 ‘I do not trust them and try to avoid them,’ and 5 ‘I am not interested in them and do not use them.’
The questionnaire included questions about the respondents' automobiles, driving experience, and typical driving purposes. In addition, socioeconomic data were also collected including marital status, gender, address, year of driver's license issuance, ownership of the vehicle driven, number of cars owned, and the number of family members.
3.2. Survey
A total of 50 paper-based questionnaires from various technical inspection facilities were gathered during the pilot phase in February 2020. To shorten the survey's duration and improve the response rate, some questions were eliminated once the responses were analyzed. The survey's initial phase was then conducted online to comply with the limitations put in place by the coronavirus epidemic. The survey link was shared on many websites and social media platforms. It was distributed using the ‘snowball’ method, which asked participants to share the link with their friends, family, and coworkers. Similar studies frequently use this snowball method to acquire data. [39]. In the main phase, data were collected nationwide over a period of 45 days, from March 20, 2020, to May 5, 2020, utilizing an online survey platform. Online survey platforms have been widely recognized as reliable methods for collecting data [40]. Specifically, 97.1% of respondents obtained the surveys via social media while 1.7% and 1.2% of the respondents said they received the questionnaire via news websites and other websites, respectively.
4. Methodology
SEM is a well-known methodology employed to investigate the relationships between cause and effect when latent variables are involved [41]. One common approach to conducting SEM is by applying covariance-based SEM (CB-SEM), which focuses on deriving the conceptual variance-covariance matrix without emphasizing explained variation [42]. Another technique within SEM is referred to as ‘partial least squares SEM’ (PLS-SEM), designed to identify the latent variables that contribute to the highest explained variance [41,43]. In this approach, rather than performing ordinary least squares (OLS) regression on the entire dataset, the algorithm adopts a different strategy. It divides the variables into smaller subsets composed of uncorrelated factors and applies OLS regression specifically to these subsets [44,45]. The application of CB-SEM for model estimation necessitates meeting specific assumptions, such as the normal distribution of data and a minimum number of observations [46]. However, as the normality assumption may not be assured in our particular context, utilizing variance-based PLS-SEM can result in a more accurate estimation of the proposed framework compared to CB-SEM [47]. Thus, PLS-SEM has been chosen and implemented in this study.
In this research, we assess the reliability and validity of the measurement model using various indicators, including factor loadings, Average Variance Extracted (AVE), Chronbach's alpha coefficient, Composite Reliability (CR), and Heterotrait-Monotrait ratio (HTMT) for discriminant validity. Higher correlations among indicators within a construct result in an increased Chronbach's alpha for that construct. [48]. Equation 2 indicates the calculation of Chronbach's alpha for a construct comprising k items (X1, X2, ..., Xk) [49].
Although composite reliability is like Cronbach's alpha, it measures the reliability for different loading factors within a construct. Equation 3 indicates the formulation of CR [50,51].
: Standarized loading factor for the ith indicator
: Variance of the error term for the ith indicator
: Number of indicators
Furthermore, AVE values provide an indication of the amount of explained variance [52,53]. The AVE can be calculated using Equation 4.
The HTMT is a criterion used to assess discriminant validity in the context of SEM. It is a statistical approach that compares the heterotrait-monomethod correlations (HTMC) with the monotrait-heteromethod correlations (MTHC) to evaluate the discriminant validity between constructs [41]. It is obtained by Equation 5.
HTMC represents the average correlation between constructs that share different traits (heterotrait correlations) but are measured using the same methods (monomethod correlations).
MTHC represents the average correlation between constructs that share the same trait (monotrait correlations) but are measured using different methods (heteromethod correlations).
5. Result
5.1. Descriptive Statistics
Out of the 548 participants, approximately 73% were men, while 27% were women. Regarding marital status, 54% of the participants were married and 46% were single. The age range of the respondents varied from 19 to 80 years, with a mean age of 36.6 and a standard deviation of 12.7. The largest age group among the participants was the youth group, below 40 years of age. The majority of participants reported driving for business purposes. Additionally, 84% of the survey participants possessed an academic degree, including BA/BS, MA/MS, and Ph.D. In terms of driving experience, on average, the participants had obtained their driver's licenses 15 years prior. Approximately 55% of the respondents stated that they drove their own vehicle, and, on average, the participants' households owned 1.5 vehicles. Table 1 reports all variables employed in the model along with their descriptive statistics, including average, standard deviation, range, and number, plus the indicators of each variable.
5.2. Path Coefficient, Outer Loading, and Outer Weight
The outcomes of the SEM are illustrated in Figure 1. Note that the model only incorporates significant relationships. Each path between the two latent variables is labeled with its respective path coefficient. Path coefficients, outer loads, outer weights, and their corresponding statistical significance are presented in Table 2 and Table 3 respectively. Path coefficients, represented by numbers on arrows, determine the strength and direction of relationships among different latent variables [54]. A higher absolute value of the path coefficient signifies a stronger relationship between the variables. Further, a positive value indicates a direct relationship, where an increase in one variable leads to a rise in the other, while a negative value indicates an inverse relationship, where an increase in one variable corresponds to a reduction in the other. The T-values assess the significance of relationships between variables. Significance is calculated at the error level of 0.05, wherein a T-value falls between -1.96 and 1.96. The outer load for single-item variables in Table 3 is set to one, while the T-value and significance level are not applicable for the outer load [55]. In addition, the strength of outer loads and weights can be evaluated based on their magnitude; less than 0.3 is considered weak, between 0.3 and 0.6 is regarded acceptable, and greater than 0.6 is considered appropriate [56,57].
5.3. Demographics
The ‘age’ exerts a direct and inverse effect on the dependent variable, implying that as drivers' age increases, their general deterrence perception weakens. On the other hand, the ‘education’ has a direct and positive impact on the experience with privatization and private sector enforcement, indicating that an increase in respondents' education level is associated with a greater willingness to utilize private enforcement. In addition, the education variable has a negative indirect effect on the general deterrence.
5.4. Private Sector Involvement in Enforcement
The private sector, represented by two variables, experience, and enforcement, has an inverse impact on the general deterrence. The ‘Experience with privatization’ has both direct and indirect effects, while ‘private sector enforcement’ directly influences general deterrence. Regarding interpretation, drivers with a negative attitude have a positive perception of the private sector's performance and show agreement with its involvement in enforcement. In other words, by utilizing the private sector in addition to the traffic police, drivers can develop a positive attitude toward enforcement.
5.5. Attitude toward Police Enforcement Performance
Among all variables, ‘speeding enforcement’ and ‘parking enforcement’ exhibited the most positive and direct influence, highlighting that investments in measures to prevent speeding and parking violations will have the most substantial impact on general deterrence. Conversely, the variable ‘police presence’ indirectly and inversely influenced attitudes, indicating that general deterrence perception is further weakened when the presence of traffic police on the roads is low.
5.6. Attitude toward Traffic Fine Amounts
The variable ‘amount of the fine’ exerts a direct influence on the dependent variable, thereby illuminating its impact on drivers' attitudes. This implies that variations in the fine amount lead to corresponding shifts in drivers' attitudes.
5.7. Specific Deterrence
The variable specific deterrence (i.e., fine experience in the last three years), assessed through two indicators, had a direct and positive effect on general deterrence, signifying that an increase in the number of tickets for offenders would lead to a more general deterrence perception.
5.8. Use of Technology
There was a reverse impact on the general deterrence with increasing interest in and adopting new technologies. This suggests that individuals who show more interest in and utilize new technologies may have a weaker general deterrence perception.
5.9. Measurement Model
5.9.1. Reflective Measurement Model
Cronbach's alpha and CR were used to measure the reliability of reflective measurement models, while AVE was employed to measure convergent validity. Table 4 shows the results.
Cronbach's alpha values of 0.6 to 0.7 are acceptable for exploratory studies, and 0.7 to 0.9 for advanced research. Table 4 displays two Cronbach's alpha values below 0.6, but all are statistically significant. In PLS-SEM, CR is more suitable for reliability, as Cronbach's alpha may underestimate internal consistency due to item count [55]. Thus, the CR criterion is given more consideration, and there are no issues concerning the reliability of the measurement models, given the coefficients above 0.7 and their statistical significance. To demonstrate convergent validity, the latent variables must account for a significant portion of each indicator's variance, ideally 50% or more [55]. The AVE for all four latent variables is higher than 50% and is statistically significant, meeting the criterion for convergent validity.
5.9.2. Formative Measurement Model
In the formative measurement model, high correlations between items (indicators) are not expected. The variance inflation factor (VIF) is used as a collinearity-dependence measure, defined as the inverse of tolerance. Table 6 indicates the VIF values for both latent variables. A VIF of 5 or greater suggests a potential collinearity issue [55]. However, in this case, both VIF values are less than 5, indicating no significant collinearity problem in the model.
5.10. Structural Model
The VIF is employed to assess collinearity within the structural model. Table 7 presents the VIF values for the variables in the structural model. All are below 5, demonstrating that there is no significant collinearity problem within the structural model. The coefficient of determination (R2) is the most commonly used measure to assess the performance of the structural model. In the study, the R2 for drivers' attitude is 0.336 (T-value=10.465) The analysis indicates that R2 is statistically significant (P-value<0.01).
6. Discussion and Conclusion
In this research, we attempted to identify factors affecting general deterrence perception of road users as a main factor contributing to the driving violations. Existing studies and reports underscore human behavior as a significant contributor to these violations. Drawing upon relevant theories in this domain, we sought to establish the link between drivers' general and specific deterrence perception. Through an extensive review of prior research, we ascertained that drivers’ specific deterrence perception acts as a precursor to their general deterrence perception. Recognizing the importance of studying drivers' general deterrence perception and the factors influencing them, by conducting a survey, collecting data, and using a structural model, we tried to quantitatively measure drivers' general deterrence perception and gain insights into the influential factors. The PLS-SEM framework provided robust validation for both the measurement model and the structural model, demonstrating their substantial consistency and significant explanatory capabilities.
Our findings demonstrated that specific deterrence in terms of strengthening enforcement measures, both in terms of quality and quantity, can significantly enhance drivers' general deterrence perception. This suggests that a proactive approach to preventing traffic violations through well-implemented enforcement methods can yield positive outcomes in shaping driver behaviors through enhancing their general deterrence perception.
Furthermore, ‘Attitude toward traffic fine amount’, revealed a direct and positive influence on general deterrence. The observation could make sense, since those who believe that the amount of fines is high and prefer it to be less, in a way, those who are less concerned about traffic safety, perceive a higher level of propaganda on traffic violation detection system as general deterrence.
Notably, the presence of police forces in road passages emerged as another significant factor affecting general deterrence. A low presence of law enforcement personnel was associated with more negative general deterrence, while an increased presence of police forces strengthened it and in turn would lead to a reduction in high-risk driving behaviors. Thus, a strategic deployment of police resources can be instrumental in promoting a safer and more compliant driving environment.
Another contribution of our study has been the use of the private sector, represented by two variables, ‘Experience with privatization’ and ‘private sector enforcement,’ in the modeling framework. Both of them exert an inverse impact on general deterrence. ‘Experience with privatization’ demonstrates both direct and indirect effects, while ‘private sector enforcement’ directly influences general deterrence. From this finding, it can be concluded that, those who do not consider the current state of the governmental system of traffic enforcement effective believe that the presence of private sector can be in an effective way to improve the detection and traffic infringement of violation and enhance general deterrence. This suggests that incorporating the private sector alongside the traffic police can result in the development of a more positive general deterrence and traffic safety.
The responsibility of dealing with traffic violations lies with the police force, and the efficacy of their measures directly affects the handling of traffic-related issues in any country. However, limitations in the operational capacity of the police can hinder their ability to effectively address traffic violations. Utilizing the private sector represents a viable approach to augmenting the operational capacity of the police. By involving the private sector in enforcement, the police can potentially improve their efficiency, reduce monopolies in police services, and boost their capacity to combat traffic violation within society.
Further, there has been a significant correlation between the use of new technologies, particularly those associated with mass communication, and drivers’ perception of general deterrence.
From this observation, it can be inferred that it is more difficult to launch a traffic law enforcement campaign among the people who are more familiar with technology, i.e. technology-savvy societies. This observation can be different depending on the culture of the study area. This topic can be considered in future cross-cultural studies.
Finally, the findings of this study hold significant implications for traffic authorities and policymakers. Understanding the factors influencing drivers' general deterrence perception can lead to informed decision-making and effective policy development. The research provides a foundation for reducing traffic violations. By implementing evidence-based approaches to enhancing drivers' general deterrence perception, we can work towards creating a more sustainable and efficient transportation system, ensuring a safer environment for all road users.
6.1. Limitations and Future Works
While this study provided valuable insights, it is essential to acknowledge certain limitations which may impact the generalizability and interpretation of the findings. To begin with, the sample used in the study may not fully represent the entire population of drivers, potentially leading to limited applicability to a broader driver demographic, which may affect the reliability of the results [59]. In addition, as the study adopted a cross-sectional design, it may not account for changes in drivers' general deterrence perception over time, nor could it establish causal relationships between variables. Further, participants' responses in surveys or questionnaires may be influenced by self-reporting bias, possibly impacting the accuracy of the data. Lastly, the findings may be context-specific and influenced by unique factors in the study's setting, limiting their applicability to different regions or countries. As future work, researchers could consider employing longitudinal designs to examine changes in drivers' attitudes over time and establish causality between variables.
Further, one limitation of using some single-item variables in the modeling process has been the potential for reduced reliability and validity. Single-item measures may not fully capture the complexity and variability of the underlying construct they aim to represent. As a result, the data obtained from single-item variables may be susceptible to measurement error and may not provide a comprehensive understanding of the construct of interest [60]. To enhance the accuracy and robustness of the findings, it is recommended to use multi-item scales or multiple indicators to measure latent constructs, allowing for a more thorough and precise assessment of the targeted variables. This would lead to more reliable results and stronger support for the conclusions drawn from the model.
Funding
This research received no external funding.
Data Availability Statement
The data presented in this study are available on request from the corresponding author. The data are not publicly available due to privacy restrictions.
Acknowledgments
Conceptualization, Mohammad Khojastehpour and Sina Sahebi; methodology, Mohammad Khojastehpour; validation, Sina Sahebi, Mohammad Khojastehpour and Mohammad SafariTaherkhani; formal analysis, Mohammad Khojastehpour and Sina Sahebi; resources, Mohammad Khojastehpour, Sina Sahebi and Mohammad SafariTaherkhani; data curation, Mohammad Khojastehpour and Sina Sahebi; and writing—review and editing, Mohammad Khojastehpour, Sina Sahebi, and Mohammad SafariTaherkhani. All authors have read and agreed to the published version of the manuscript.
Conflicts of Interest
The authors declare no conflicts of interest.
References
- WHO, W.H.O. , Global status report on road safety 2018. 2018.
- Iran, J.r.b.U.a.t.M.o.H.o. , injuries caused by traffic accidents in Iran and ways to prevent them. Media center, 2014.
- Lee, J.-Y., J.-H. Chung, and B. Son. Analysis of traffic accident size for Korean highway using structural equation models. Accident Analysis Prevention, 2008, 40, 1955–1963. [Google Scholar]
- Ayuso, M., M. Guillén, and M. Alcañiz. The impact of traffic violations on the estimated cost of traffic accidents with victims. Accident Analysis Prevention 2010, 42, 709–717. [Google Scholar]
- Mehdizadeh, M., A. Shariat-Mohaymany, and T. Nordfjaern. Nordfjaern, Accident involvement among Iranian lorry drivers: Direct and indirect effects of background variables and aberrant driving behaviour. Transportation research part F: traffic psychology behaviour, 2018, 58, 39–55. [Google Scholar]
- Cheng, A.S., T.C. Ng, and H.C. Lee. A comparison of the hazard perception ability of accident-involved and accident-free motorcycle riders. Accident Analysis Prevention, 2011, 43, 1464–1471. [Google Scholar]
- Gu, Y., et al. Predicting intersection crash frequency using connected vehicle data: A framework for geographical random forest. Accident Analysis & Prevention, 2023, 179, 106880. [Google Scholar]
- Moradi, A., et al. Exceeding the speed limit: prevalence and determinants in Iran. International journal of injury control safety promotion, 2013, 20, 307–312. [Google Scholar]
- Koohpayma, J., et al. , Spatial analysis of curb-park violations and their relationship with points of interest: A case study of Tehran, Iran. Sustainability, 2019, 11, 6336. [Google Scholar]
- Özkan, T., et al. Cross-cultural differences in driving behaviours: A comparison of six countries. Transportation research part F: traffic psychology behaviour, 2006, 9, 227–242. [Google Scholar]
- Lum, H. and J. Reagan. Interactive highway safety design model: accident predictive module. 1995, public roads magazine.
- Chandraratna, S., N. Stamatiadis, and A. Stromberg. Crash involvement of drivers with multiple crashes. Accident Analysis Prevention, 2006, 38, 532–541. [Google Scholar]
- Mohmmad Mehdi Oshanreh, D.M. , Daniel Malarkey, Evaluating the Effectiveness of Computer Vision Systems Mounted on Shared Electric Kick Scooters to Reduce Sidewalk Riding. 2023: Connected Cities for Smart Mobility toward Accessible and Resilient Transportation Center (C2SMART);University of Washington.
- Samani, A.R., S. Mishra, and K. Dey. Assessing the effect of long-automated driving operation, repeated take-over requests, and driver’s characteristics on commercial motor vehicle drivers’ driving behavior and reaction time in highly automated vehicles. Transportation research part F: traffic psychology and behaviour, 2022, 84, 239–261. [Google Scholar]
- Howarth, C.I. , The relationship between objective risk, subjective risk and behaviour. Ergonomics, 1988, 31, 527–535. [Google Scholar]
- Palmer, J. , Economic analyses of the deterrent effect of punishment: A review. Journal of Research in Crime Delinquency, 1977, 14, 4–21. [Google Scholar]
- Wegman, F. and C. Goldenbeld, Speed management: enforcement and new technologies. 2006.
- Tyler, T.R. , Why people obey the law. 2006: Princeton university press.
- Tan, C., et al. Modeling effects of driver safety attitudes on traffic violations in China using the theory of planned behavior. IATSS research, 2022, 46, 63–72. [Google Scholar]
- Tay, R. , General and specific deterrent effects of traffic enforcement: do we have to catch offenders to reduce crashes? Journal of Transport Economics and Policy (JTEP), 2005, 39, 209–224. [Google Scholar]
- Homel, R. , Policing and punishing the drinking driver: a study of general and specific deterrence. 2012: Springer Science & Business Media.
- Becker, G.S. , Crime and punishment: An economic approach. Journal of political economy, 1968, 76, 169–217. [Google Scholar]
- Yannis, G., E. Papadimitriou, and C. Antoniou. Impact of enforcement on traffic accidents and fatalities: A multivariate multilevel analysis. Safety Science, 2008, 46, 738–750. [Google Scholar]
- Tomlinson, K.D. , An examination of deterrence theory: Where do we stand. Fed. Probation, 2016, 80, 33. [Google Scholar]
- Stafford, M.C. and M. Warr. A reconceptualization of general and specific deterrence. Journal of research in crime delinquency, 1993, 30, 123–135. [Google Scholar]
- Stanojević, P.; Stanojević, P., D. Jovanović, and T. Lajunen. Influence of traffic enforcement on the attitudes and behavior of drivers. Accident Analysis Prevention, 2013, 52, 29–38. [Google Scholar] [PubMed]
- Ulleberg, P. and T. Rundmo. Personality, attitudes and risk perception as predictors of risky driving behaviour among young drivers. Safety science, 2003, 41, 427–443. [Google Scholar]
- Iversen, H. and T. Rundmo. Attitudes towards traffic safety, driving behaviour and accident involvement among the Norwegian public. Ergonomics, 2004, 47, 555–572. [Google Scholar]
- Lund, J. and L.E. Aarø. Accident prevention. Presentation of a model placing emphasis on human, structural and cultural factors. Safety science, 2004, 42, 271–324. [Google Scholar]
- Khojastehpour, M., S. Sahebi, and A. Samimi. Public acceptance of a crowdsourcing platform for traffic enforcement. Case studies on transport policy 2022, 10, 2012–2024. [Google Scholar]
- Corbett, C. , Driving and Traffic Offenses. 2015: Oxford University Press.
- Oleinik, A. Corruption on the road: A case study of Russian traffic police. IATSS research, 2016, 40, 19–25. [Google Scholar]
- Amini, R., et al. The relationship between sleep quality and road traffic crashes of urban drivers in Hamadan, Iran. Journal of injury violence research, 2020, 12, 47. [Google Scholar]
- Mizenko, A.J., et al. The relationship between age and driving attitudes and behaviors among older Americans. Injury epidemiology, 2015, 2, 1–10. [Google Scholar]
- Rusu, A., et al. Implicit attitudes towards risky driving: Development and validation of an affect misattribution procedure for speeding. Accident Analysis Prevention, 2017, 100, 15–22. [Google Scholar]
- Bachoo, S., A. Bhagwanjee, and K. Govender. Govender, The influence of anger, impulsivity, sensation seeking and driver attitudes on risky driving behaviour among post-graduate university students in Durban, South Africa. Accident Analysis Prevention, 2013, 55, 67–76. [Google Scholar]
- Patwary, A.L., et al. Investigating transportation safety in disadvantaged communities by integrating crash and environmental justice data. Accident Analysis & Prevention, 2024, 194, 107366. [Google Scholar]
- Armantalab, O., et al. An Investigation on Factors that Affect Seat Belt Violations. 2022.
- Zavareh, M.F., M. Mehdizadeh, and T. Nordfjærn. Nordfjærn, Demand for mitigating the risk of COVID-19 infection in public transport: The role of social trust and fatalistic beliefs. Transportation Research Part F: Traffic Psychology Behaviour, 2022, 84, 348–362. [Google Scholar]
- Rand, D.G., J.D. Greene, and M.A. Nowak. Spontaneous giving and calculated greed. Nature, 2012, 489, 427–430. [Google Scholar]
- Hair, J.F., C.M. Ringle, and M. Sarstedt. PLS-SEM: Indeed a silver bullet. Journal of Marketing theory Practice, 2011, 19, 139–152. [Google Scholar]
- Soltanpour, A., M. Mesbah, and M. Habibian. Customer satisfaction in urban rail: a study on transferability of structural equation models. Public Transport, 2020, 12, 123–146. [Google Scholar]
- Latifi, K., et al. Efficient customer relationship management systems for online retailing: The investigation of the influential factors. Journal of Management & Organization, 2023, 29, 763–798. [Google Scholar]
- Sahebi, S., et al. Assessing public perception of car automation in Iran: Acceptance and willingness to pay for adaptive cruise control. IATSS Research, 2024, 48, 200–208. [Google Scholar]
- Javadinasr, M., et al. Eliciting attitudinal factors affecting the continuance use of E-scooters: An empirical study in Chicago. Transportation research part F: traffic psychology and behaviour, 2022, 87, 87–101. [Google Scholar]
- Diamantopoulos, A. A. Siguaw, and J.A. Siguaw, Introducing LISREL: A guide for the uninitiated. 2000: Sage.
- Lohmöller, J.-B. , Latent variable path modeling with partial least squares. 2013: Springer Science & Business Media.
- Tavakol, M. and R. Dennick. Making sense of Cronbach's alpha. International journal of medical education, 2011, 2, 53. [Google Scholar]
- Cronbach, L.J. , Coefficient alpha and the internal structure of tests. psychometrika, 1951, 16, 297–334. [Google Scholar]
- Chin, W.W. , The partial least squares approach to structural equation modeling. Modern methods for business research, 1998, 295, 295–336. [Google Scholar]
- Fornell, C. and D.F. Larcker, Structural equation models with unobservable variables and measurement error: Algebra and statistics. 1981, Sage Publications Sage CA: Los Angeles, CA.
- Dakduk, S., Á. González, and A. Portalanza, Learn about structural equation modeling in smartPLS with data from the customer behavior in electronic commerce study in Ecuador (2017). 2019: SAGE Publications, Limited.
- Alarcón, D., J.A. Sánchez, and U. De Olavide. Assessing convergent and discriminant validity in the ADHD-R IV rating scale: User-written commands for Average Variance Extracted (AVE), Composite Reliability (CR), and Heterotrait-Monotrait ratio of correlations (HTMT). in Spanish STATA meeting. 2015.
- Hair Jr, J.F. , et al., An introduction to structural equation modeling. Partial least squares structural equation modeling using R: a workbook, 2021: 1-29.
- Hair Jr, J.F. , et al., A primer on partial least squares structural equation modeling (PLS-SEM). 2021: Sage publications.
- Foster, J.J., E. Barkus, and C. Yavorsky, Understanding and using advanced statistics: A practical guide for students. 2005: Sage.
- Kline, R.B. , Principles and practice of structural equation modeling. 2023: Guilford publications.
- Henseler, J., C.M. Ringle, and M. Sarstedt. A new criterion for assessing discriminant validity in variance-based structural equation modeling. Journal of the academy of marketing science, 2015, 43, 115–135. [Google Scholar]
- Mirjalili, R., H. Barati, and A. Yazici. Resilience Analysis of New York City Transportation Network After Snow Storms. Transportation research record, 2023, 2677, 694–707. [Google Scholar]
- Raubenheimer, J. An item selection procedure to maximize scale reliability and validity. SA Journal of Industrial Psychology, 2004, 30, 59–64. [Google Scholar]
Figure 1.
Final model with path coefficient.
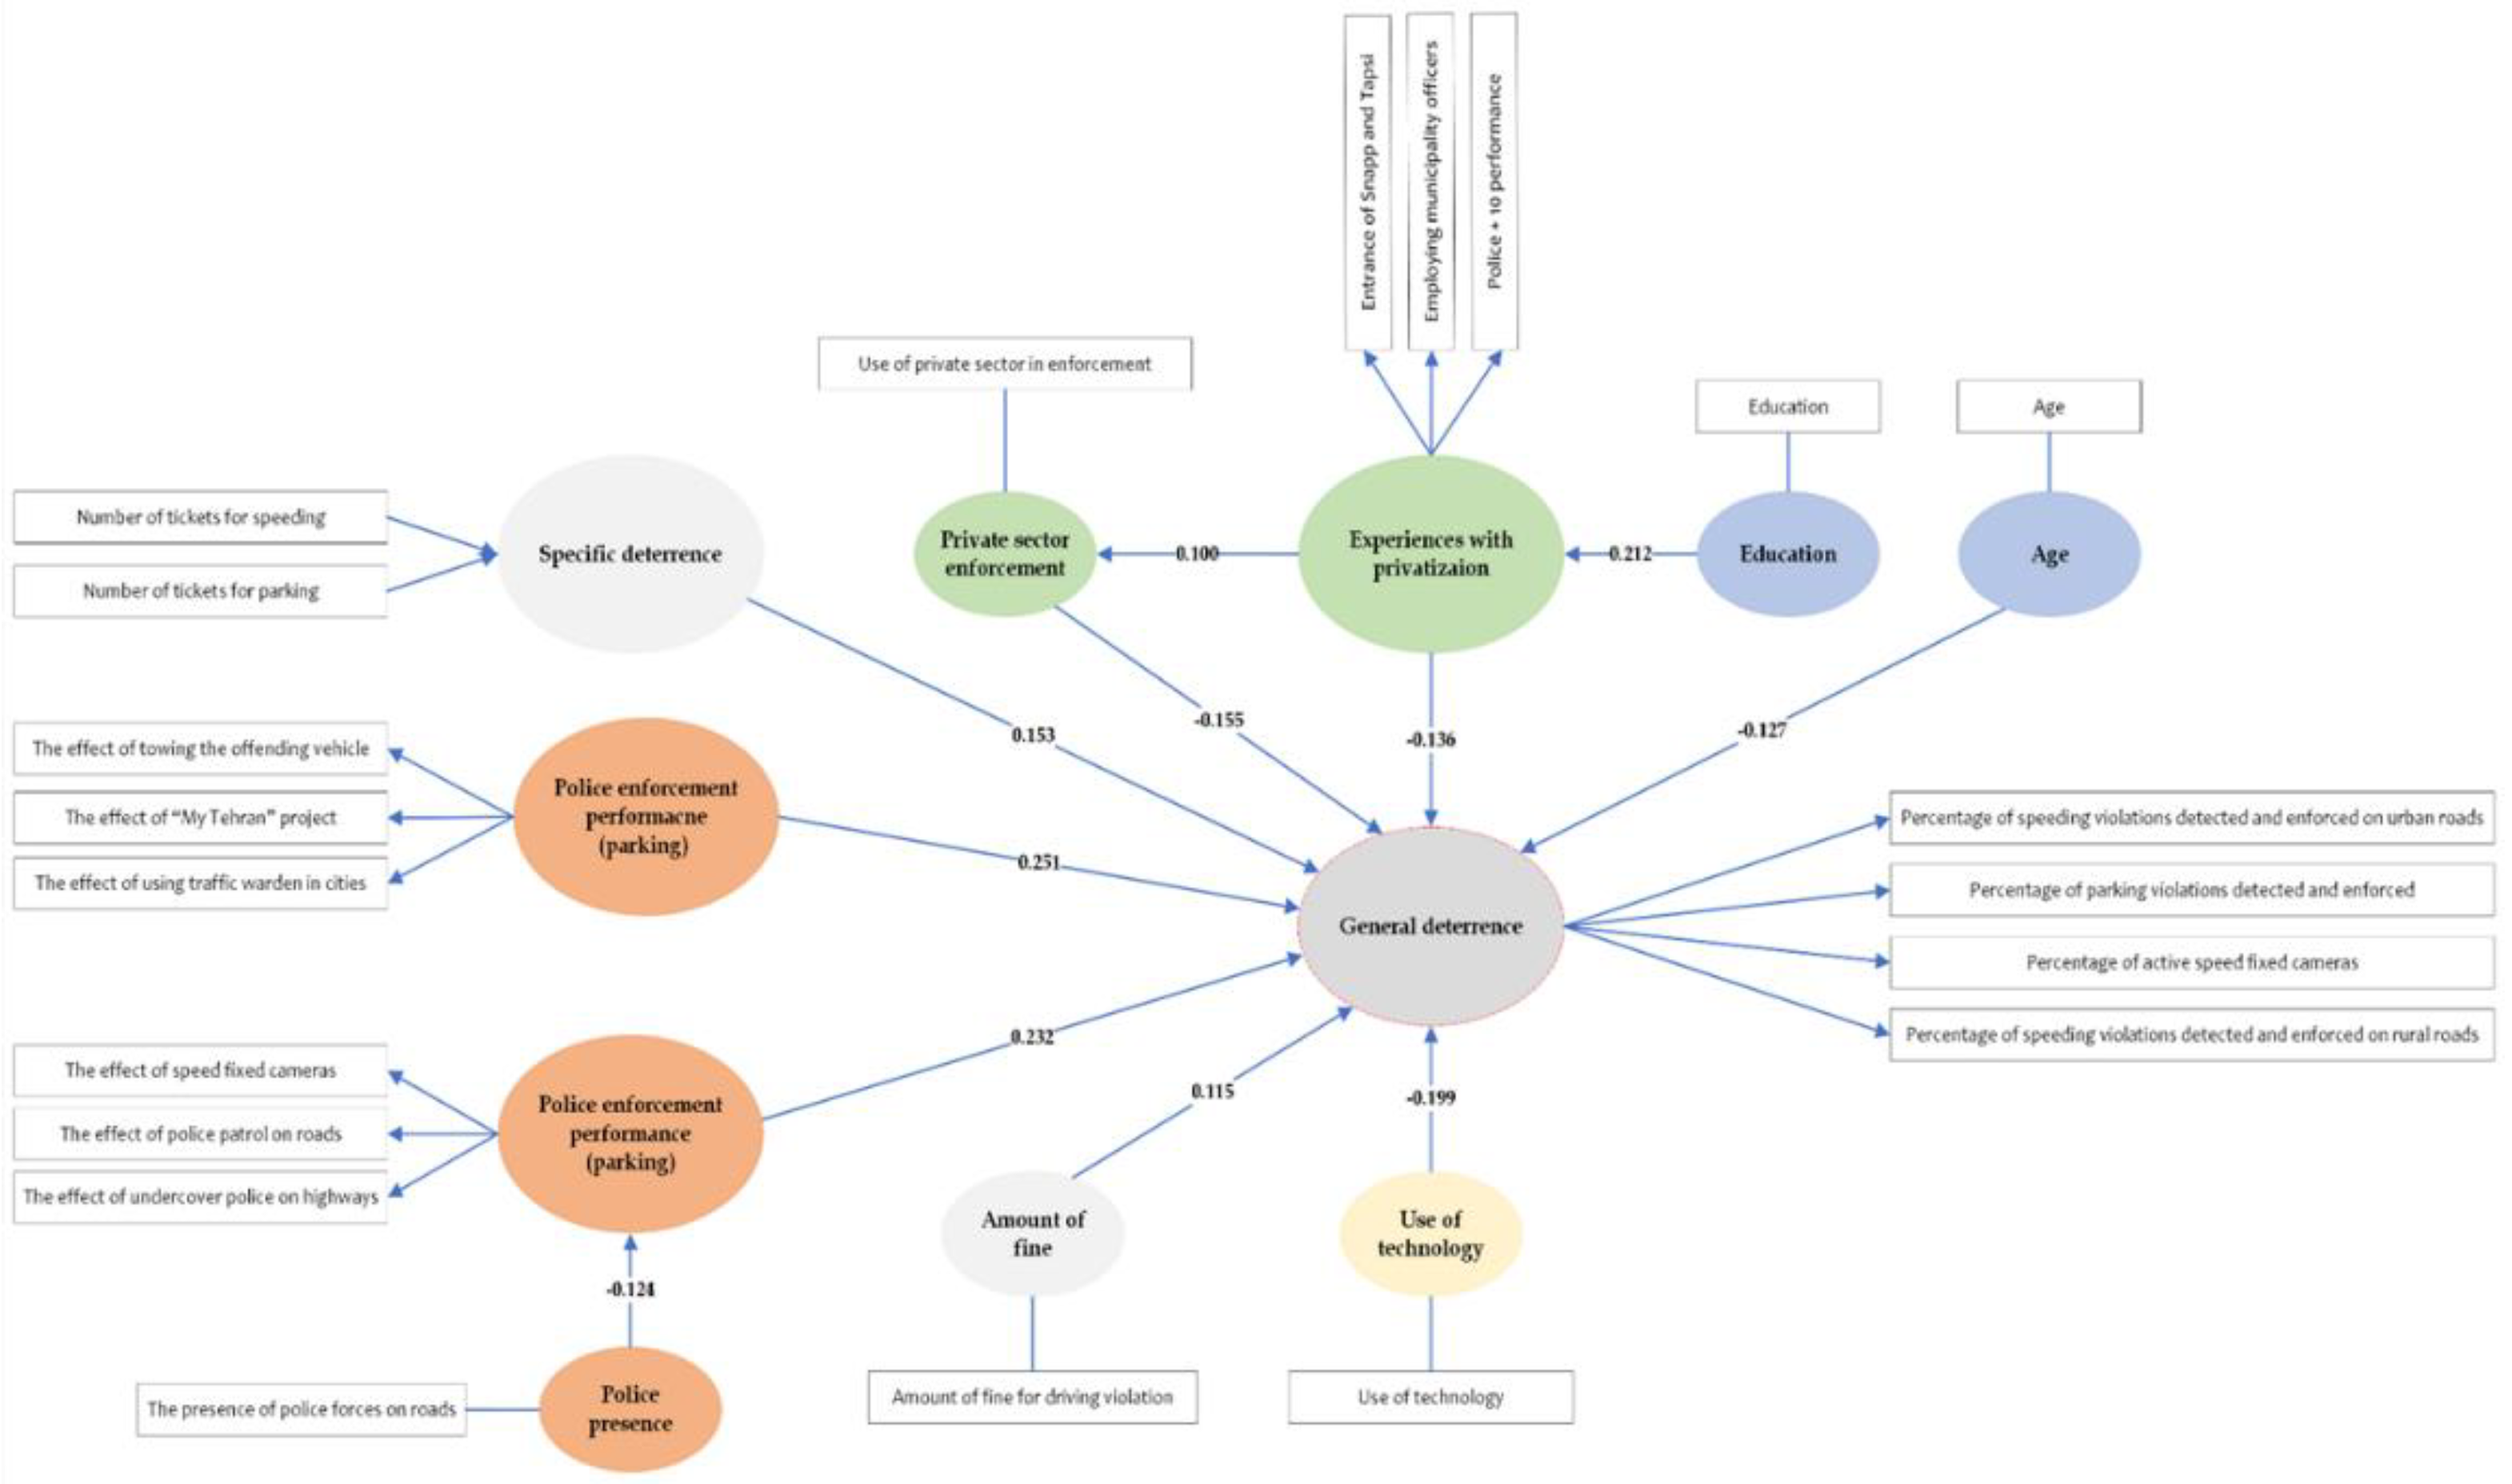

Table 1.
Descriptive statistics of model variables.
Variable
|
Mean | S.D. | Range | Num. of indicators |
|---|---|---|---|---|
| General deterrence | 4 | |||
|
2.43 | 1.20 | 1-5 | |
|
2.12 | 1.19 | 1-5 | |
|
2.98 | 1.18 | 1-5 | |
|
2.4 | 1.18 | 1-5 | |
| Police enforcement performance (speeding) | 3 | |||
|
2.92 | 0.89 | 0-4 | |
|
2.61 | 0.85 | 0-4 | |
|
2.34 | 0.94 | 0-4 | |
| Police enforcement performance (parking) | 3 | |||
|
2.38 | 0.96 | 0-4 | |
|
2.05 | 0.84 | 0-4 | |
|
1.9 | 0.85 | 0-4 | |
| Police enforcement performance (police presence) | 1 | |||
|
0.34 | 0.47 | 0 or 1 | |
| Specific deterrence | 2 | |||
|
2.29 | 1.33 | 0-10 | |
|
1.98 | 1.20 | 0-10 | |
| Attitude toward traffic fine amount | 1 | |||
|
1.91 | 0.64 | 1-3 | |
| Experiences with privatization | 3 | |||
|
2.79 | 1.07 | 0-4 | |
|
2.41 | 0.96 | 0-4 | |
|
2.71 | 0.87 | 0-4 | |
| Private sector enforcement | 1 | |||
|
0.196 | 0.397 | 0 or 1 | |
| Age | 1 | |||
|
36.6 | 12.7 | 19-80 | |
| Education | 1 | |||
|
3.52 | 0.93 | 1-5 | |
| Use of technology | 1 | |||
|
3.39 | 0.95 | 0-4 |
*The project was introduced in Iran in early 2019 as a pilot initiative. This program offers free parking on the side of the street for the initial half-hour. However, for extended parking durations, the car owner is subjected to exponentially increasing costs. To facilitate payment for parking, vehicle owners are required to register through the ‘My Tehran’ website or application.
Table 2.
Path coefficients between latent variables of the model.
| Path | Path Coefficient | T-Value |
|---|---|---|
| Age → General deterrence | -0.127** | 3.396 |
| Police enforcement performance (Speeding) → General deterrence | 0.232** | 6.215 |
| Police enforcement performance (Parking) → General deterrence | 0.251** | 6.145 |
| Specific deterrence → General deterrence | 0.153** | 4.064 |
| Experiences with privatization → General deterrence | -0.136** | 3.704 |
| Private sector enforcement → General deterrence | -0.155** | 4.261 |
| Attitude toward traffic fine amount → General deterrence | 0.115** | 3.239 |
| Use of technology → General deterrence | -0.199** | 5.424 |
| Police presence → Police enforcement performance (Speeding) | -0.124* | 2.854 |
| Education → Experiences with privatization | 0.212** | 4.804 |
| Experiences with privatization → Private sector enforcement | 0.100* | 2.158 |
* P<0.05, ** P<0.01.
Table 3.
Outer loads and outer weights.
Variable
|
Outer Loading | Outer Weight | T - Value |
|---|---|---|---|
| General deterrence | |||
|
0.805** | 44.794 | |
|
0.720** | 22.920 | |
|
0.701** | 23.384 | |
|
0.693** | 20.473 | |
| Police enforcement performance (Speeding) | |||
|
0.815** | 22.844 | |
|
0.835** | 32.182 | |
|
0.623** | 10.384 | |
| Police enforcement performance (Parking) | |||
|
0.697** | 9.960 | |
|
0.798** | 18.115 | |
|
0.650** | 8.822 | |
| Police enforcement performance (police presence) | |||
|
1 | ||
| Specific deterrence | 1 | ||
|
0.859** | 7.372 | |
|
0.510* | 2.530 | |
| Attitude toward traffic fine amount | |||
|
1 | ||
| Experiences with privatization | |||
|
0.543** | 4.120 | |
|
0.820** | 12.456 | |
|
0.740** | 6.106 | |
| Private sector enforcement | |||
|
1 | ||
| Age | |||
|
1 | ||
| Education | |||
|
1 | ||
| Use of technology | |||
|
1 |
* P<0.05, ** P<0.01.
Table 4.
Cronbach's alpha, CR and AVE to measure model reliability and validity.
| Latent Variable | Cronbach's Alpha | CR | AVE | T-Value |
|---|---|---|---|---|
| General deterrence | 0.708** | 33.116 | ||
| Police enforcement performance (Speeding) | 0.649** | 24.124 | ||
| Police enforcement performance (Parking) | 0.409** | 9.027 | ||
| Experiences with privatization | 0.419** | 9.569 | ||
| General deterrence | 0.821** | 75.860 | ||
| Police enforcement performance (Speeding) | 0.805** | 52.993 | ||
| Police enforcement performance (Parking) | 0.714** | 40.341 | ||
| Experiences with privatization | 0.717** | 25.567 | ||
| General deterrence | 0.535** | 29.714 | ||
| Police enforcement performance (Speeding) | 0.583** | 27.756 | ||
| Police enforcement performance (Parking) | 0.515** | 24.507 | ||
| Experiences with privatization | 0.505** | 21.684 |
** P<0.01.
Table 5.
HTMT ratio to evaluate the discriminant validity of measurement models.
| Latent Variable | (1) | (2) | (3) | (4) | (5) | (6) | (7) | (8) | (9) |
|---|---|---|---|---|---|---|---|---|---|
| (1) Use of technology | |||||||||
| (2) Private sector enforcement | 0.058 | ||||||||
| (3) Education | 0.03 | 0.12 | |||||||
| (4) Age | 0.15 | 0.04 | 0.21 | ||||||
| (5) Attitude toward traffic fine amount | 0.169 | 0.15 | 0.1 | 0.01 | |||||
| (6) General deterrence | 0.3 | 0.31 | 0.1 | 0.13 | 0.31 | ||||
| (7) Police enforcement performance (Speeding) | 0.05 | 0.11 | 0.06 | 0.09 | 0.08 | 0.449 | |||
| (8) Police enforcement performance (Parking) | 0.145 | 0.23 | 0.12 | 0.14 | 0.19 | 0.641 | 0.642 | ||
| (9) Police presence | 0.089 | 0.11 | 0.1 | 0.01 | 0.24 | 0.224 | 0.141 | 0.05 | |
| (10) Experience with privatization | 0.144 | 0.15 | 0.32 | 0.2 | 0.24 | 0.234 | 0.369 | 0.5 | 0.187 |
Table 6.
VIF for measuring the collinearity of indicators.
| Latent Variable | Indicator | VIF |
|---|---|---|
| Specific deterrence | Number of tickets for speeding | 1.010 |
| Number of tickets for parking | 1.000 |
Table 7.
VIF to measure the collinearity of structural model variables.
| Latent Variable | VIF | |||
|---|---|---|---|---|
| (2) | (6) | (7) | (10) | |
| (1) Use of technology | 1.072 | |||
| (2) Private sector enforcement | 1.057 | |||
| (3) Education | 1.000 | |||
| (4) Age | 1.059 | |||
| (5) Attitude toward traffic fine amount | 1.105 | |||
| (6) General deterrence | ||||
| (7) Police enforcement performance (Speeding) | 1.140 | |||
| (8) Police enforcement performance (Parking) | 1.168 | |||
| (9) Police presence | 1.000 | |||
| (10) Experience with privatization | 1.000 | 1.126 | ||
| (11) Specific deterrence | 1.033 | |||
Disclaimer/Publisher’s Note: The statements, opinions and data contained in all publications are solely those of the individual author(s) and contributor(s) and not of MDPI and/or the editor(s). MDPI and/or the editor(s) disclaim responsibility for any injury to people or property resulting from any ideas, methods, instructions or products referred to in the content. |
© 2024 by the authors. Licensee MDPI, Basel, Switzerland. This article is an open access article distributed under the terms and conditions of the Creative Commons Attribution (CC BY) license (http://creativecommons.org/licenses/by/4.0/).
Copyright: This open access article is published under a Creative Commons CC BY 4.0 license, which permit the free download, distribution, and reuse, provided that the author and preprint are cited in any reuse.


