Submitted:
15 August 2024
Posted:
16 August 2024
You are already at the latest version
Abstract
Lactococcus lactis is a potential bacterial cell factory to develop delivery systems for vaccines and therapeutic proteins. Large progress has been made in applications using engineered L. lactis against, e.g., inflammatory bowel disease and cervical cancer, but improvement of secretion and cell anchoring efficacy is still desirable. A double-labelling method based on biarsenical hairpin binding and nickel-polyhistidine affinity was used for visualization of protein trafficking and quantification of targeted proteins on the cell surface and in the cytoplasm. To investigate the importance of mature domain targeting signals (MTSs), we generated truncated constructs encoding 126, 66, and 26 amino acid residues from the N-terminus of the basic membrane protein A (BmpA) and fused those with the gene for the human papillomavirus serotype 16 (HPV16) E7 oncoprotein. Overexpression of fusion proteins was observed to come at a cost of cell proliferation. L. lactis cells produced and displayed the shortest fusion protein only with difficulty, suggesting that the entire absence of a homologous sequence containing MTSs significantly impedes export and surface anchoring of fusion proteins. With 40 amino acids following the signal peptide and containing one MTS, effective translocation was possible. Mutations of MTSs towards increased hydrophobicity resulted in an increase of secreted and surface-displayed fusion protein, suggesting the potential to design rationally improved constructs.
Keywords:
Lactococcus lactis
; secretory proteins
; signal peptide
; mature domains
; hydrophobic patches
; SecA
1. Introduction
Lactococcus lactis, a naturally safe microorganism for daily consumption in food, has been emerging as potential medical cell factories and drug delivery vehicle. Among the advantages for the utilisation of this bacterium in such applications are a simple energy metabolism, modest genome scale, various available expression systems, and limited complications (e.g. no lipopolysaccharide, only one housekeeping protease, etc.). Up to now, at least 100 recombinant proteins from various hosts have been efficiently produced in L. Lactis using merely the constitutive P170 expression system [1]. Mammalian-derived proteins were produced successfully, including bovine plasmin [2], bovine β-Lactoglobulin [3], murine interleukin-2 and interleukin-6 [4,5], etc,. Heterologous proteins from other prokaryotic species (e.g. Staphylococcus hyicus or Brucella abortus) comprise enzymes such as lipase [6], bacteriophage lysins [7], or immunogenicity factors such as Brucella abortus antigen L7/L12 [8]. The yield of these products was also optimized impressively, for instances, nuclease from S. aureus was overexpressed in L. lactis at yields of 2.5 g/L in batch fermentation [1].
The targeting of secretory proteins to translocons was believed for many years to be uniquely performed by signal peptides [9,10], but later revealed to be also influenced by targeting signals concealed in mature domains of preproteins [11,12,13]. These investigations explain the findings that in some cases, signal peptides are not able to facilitate secretion of heterologous proteins fused to them [13], and that some preproteins can be secreted in the absence of a signal peptide [12,14,15]. The important roles of the mature domains of secretory proteins were speculated to involve SecA lipid stimulation, SecA translocation [16], and ATPase activation [15,16] by a possible specific binding affinity with SecA [15]. Mature domain targeting signals (MTSs) is the term first used by Chatzi et. al. for these signal-peptide-independent targeting signals [11]. In E. coli, it was shown in vitro that these domains were able to function either independently [11,12,17] or complementarily with signal peptides for the trafficking of preproteins to membrane-bound translocons [15,17]. MTSs are identified as multiple hydrophobic patches of each protein sequence. The individual presence of single MTS, co-existence of several MTSs, the combination with or without native signal peptides, significantly affects binding affinity of preproteins with SecA – SecYEG in vitro [11]. The aim of this study is to examine the influence of MTSs in protein secretion efficiency in L. lactis, as the model organism for lactic acid bacteria. Here we introduced genetic modifications to physically alter the hydropathy profiles of several MTSs in silico and utilised in vivo techniques to evaluate secretion efficiency in L. lactis.
2. Results
2.1. Effects of Fusion Protein Overproduction on Cell Growth
L. lactis BmpA is classified to be a lipoprotein that is covalently attached to membrane lipids via a conserved cysteine after cleavage of the signal peptide [18]. The predicted cleavage site is between position 21 and 22, the conserved Cys residue is at position 22. We chose 26 amino acids for the shortest construct (BE3), comprising only the SP plus five amino acids including the Cys residue, to facilitate membrane attachment, followed by the heterologous fusion partner. Construct BE2 comprises additional 40 amino acids, and BE1 additional 100 residues. Growth of all the cell lines was similar in the pre-induction period but the growth of cells producing full-length homologous proteins surpassed that of cells carrying fusion constructs with the heterologous protein after the inducer nisin was introduced. Until three hours post-induction, exponential growth was observed in NpB cells, similar to the native NZ9000, which also reached the cell density peak between three and six hours. A slower increase was seen in cells carrying the shortest homologous domain, NpBE3. Very slow growth was observed in cells producing NpBE1 and NpBE2 (Figure 1). During three to nine hours post induction, the growth of NpBE3 gradually increased; however, that of NpBE1 and NpBE2 remained noticeably stunted until approximately 12 hours after induction, when a rapid population increase was observed. The overnight biomass production of NpBE1 and NpBE2 was about 17% higher than that of NpBE3, but roughly 26% lower than that of the strains carrying full-length BmpA (Figure 1). The observation was extended to 30 hours, but no significant change was recorded (not shown).
2.2. Localization of Fusion Proteins
Detection of full-length BmpA by immunodetection in the cellular extract, but not in the concentrated cultivation medium, was previously reported and confirmed by a fluorescence shift towards higher levels in flow cytometry assays and the observance of red fluorescence under the microscope [19]. For NpB cells, surface fluorescence increased over time, while the intracellular fluorescence was highest at three hours and significantly reduced in later time points. There were no differences in fluorescence level of stained and unstained negative controls (uninduced cells) at any time point. Among the three fusion constructs, only NpBE3 showed a temporal pattern similar to NpB for secretory/displayed protein (Ni-NTA-Atto 488-HisTag), however, the strength of the signals was considerably lower. At three and nine hours post induction, the average ReAsH-TC fluorescence of NpBE3 was 9 and 4.4 times weaker than those emitted by NpB, respectively. The other two strains, NpBE1 and NpBE2, displayed similar kinetics with a relatively high surface fluorescence intensity at three hours and a peak at nine hours, before declining steeply at 24 hours (Figure 2a).
We observed different patterns concerning intracellular signals of NpBE1, NpBE2 and NpBE3 cells at different time points. At three hours post induction, red fluorescence signals were plentiful and ubiquitous in the cytoplasm of NpBE1 and NpBE2 cells; however, they were not visually detected in samples cultivated for up to 24 hours. For NpBE3 cells, fluorescence signals were very weak at three hours but became more pronounced at 24 hours (Figure 2b). Histograms and fluorescence microscopy data are shown in Supplementary Figure 1.
2.3. Modification of Mature Domain Targeting Signals
Hydropathy plots of BmpA are displayed at three different spanning sizes of 19, nine and five residues. For all window sizes, the signal peptide of BmpA (residues 1-26) appears with hydrophobic peaks greater than the +1.6 threshold (Figure 3a). At window span 5, the hydrophobic profile showed that protein BE1 contains four hydrophobic patches H1-4, with H1 located within the signal peptide and H3 and H4 only separated by two amino acids Q111 and D112. The fusion protein BE2 contains the signal peptide of BmpA and the following 40 amino acids, encompassing the H1 and H2 patches. The shortest fusion protein BE3 contains only the signal peptide of BmpA and thus only hydrophobic patch H1 (Figure 3b).
Site-directed mutations were introduced in the truncated N-terminal domain of two fusion constructs BE1 and BE2 for hydropathy modification based on in silico evaluation. The details of each mutation are given in Figure 4.
Table 1 contains the calculation of molecular weight, theoretical isoelectric point (pI), instability index, aliphatic index, and grand average of hydropathicity (GRAVY) of all produced proteins, including the homologous protein BmpA, the heterologous protein E7, the fusion proteins BE1, BE2 and BE3, and all variants based on these. Almost all variants of BE1 backbone (BE1AB, BE1ABi, BE1ABv, BE1D, and BE1CD) share a theoretical pI of 6.43, two variants of BE2 backbone have a pI of 6.03 (Table 1). The instability index estimates protein stability in vitro, according to which proteins with an instability index lower than 40 are likely to be stable in test tubes [20]. Proteins based on the same backbones tended to share consistent stability. All variants modified from BE1 backbone were predicted to be stable (index 31.90 – 34.98). BE2 backbone variants displayed higher instability index (41.82 – 42.30) and the shortest fusion protein BE3 showed the highest index among all variants (45.99). All proteins had high relative occupancy of aliphatic side chains (all above 70), which implied high thermostability and high hydrophobicity [21].
The effects of the introduced amino acid changes on hydropathy predictions at focused hydrophobic patches are shown in Figure 5. BE1B shows increased hydrophobicity at H3-H4 due to the mutations Q111A and D112A; BE1AB has higher hydrophobicity at both H2 and H3-H4 due to mutations K39A, T44A, Q111A, and D112A; BE1ABi and BE1ABv possess additional modifications at H4 (T115I/S116I and T115V/S116V, respectively). In the variants with putatively reduced hydrophobicity, BE1D has a weakened stretch at H3 because of the mutations L102G/L103G; BE1CD has decreased hydrophobicity at both H2 and H3 due to the additional mutation V43G at H2. In fusion protein BE2, H2 is the only MTS, and the predicted profile of variant BE2A contained an increased hydrophobic patch due to mutations K39A and T44A, while BE2C exhibited more hydrophilicity due to mutation V43G.
The growth patterns of the cells producing modified fusion proteins shared high similarity with their parental strains NpBE1 and NpBE2 (Figure 6a). A notable delay in growth was observed during the early stages after nisin was added, which continued for approximately 9 hours before cell growth resumed. Chart 6b shows the tendency of surface expression over three collection time points. The expression of all NpBE1 and NpBE2 variants followed the trend of the parent strains (green and yellow lines, respectively). Strains producing the full-length wild-type protein NpB and the fusion construct NpBE3 showed an incline over time, with higher values for NpB than NpBE3 for surface display at all time points. All cell lines originating from NpBE1 showed higher levels of protein display at three and nine hours than the highest level of the homologous-protein producer, NpB cells.
Chart 6c highlights surface display quantitatively for a better comparison between the strains. NpBE1 variants showed proficient surface display at three and nine hours after induction. Two variants, NpBE1AB and NpBE1ABi showed more than 48% higher surface expression compared to their parent NpBE1. At three hours, NpBE1B showed highest surface fluorescence, followed by NpBE1AB and NpBE1D. At nine hours, the highest values were shown by NpBE1AB, followed by its variants NpBE1ABi, NpBE1ABv, and its parental strain NpBE1B. Intracellular ReAsH-TC fluorescence emitted by all strains was compared as well (Figure 6d). Lower intracellular signal was observed in NpBE1ABv at nine hours, while the surface fluorescence at the same time point was high. High cytoplasmic fluorescence was seen in several strains, including NpBE1CD, NpBE1ABi, NpBE1D, NpBE1B, and NpBE1. Compared to all its descendent modified strains, the original NpBE1 showed weaker surface display and abundant intracellular accumulation at both three and nine hours after induction. Data on the fluorescence shifts in flow cytometry and visual red fluorescence under microscopy are in the Supplementary material (Supplementary Figures 2 and 3)
3. Discussion
Overexpression of proteins, particularly heterologous proteins, has been shown to trigger a stress response in bacteria [24,25], leading to similar behavior as during osmotic or acidic pressures in stationary phase [26]. The observed growth behavior is consistent with a stress response in the cells overproducing heterologous proteins but not homologous proteins, as the reduced growth performance and delayed transition into exponential growth post induction was observed in all NpBE1 and NpBE2 variants, but not for NpB or the parent strain NZ9000, which does not overproduce any protein except for the selection marker for plasmid stabilization (Figure 1). Cells producing NpB3 were afflicted in a different manner, showing a steadier but slow growth pattern and a lower biomass yield after 24 hrs, suggesting even more pronounced complications due to the overproduction of a heterologous protein.
The efficiency of fusion protein production and display was strongly influenced by the length of the homologous fusion partner. BE3 only contained the signal peptide plus five amino acids including the conserved cysteine for membrane attachment (26 amino acids) of BmpA. Construct BE2 contains additional 40 amino acids, 66 in total, and BE1 additional 100 homologous residues for a total of 126 amino acids. Cells producing NpBE1 and NpBE2 cells exhibited two to three times higher fluorescence signals from surface-exposed proteins than those producing NpBE3 at three and nine hours post-induction (Figure 2), with a peak at nine hours post-induction. Cells harbouring the longer homologous sequence BE1 displayed 1.2 – 1.5 times higher surface protein levels at these time points, with a greater difference observed at three hours (Figure 2). These observations suggest that N-terminal homologous regions of 66 or more amino acids facilitate processing of the translated peptide chain by the cellular components towards translocation and attachment to the membrane. The retarded growth in this phase suggests that some level of stress response, such as an induced overproduction of secretion-associated chaperones, may be required for this, and that the re-routing of cellular resources for these processes causes a reduction of growth. The eventual onset of exponential growth after approximately 12 hours appears consistent with a relaxation of these efforts after the overproduced fusion proteins are cleared from the cytoplasm. Cells overproducing the NpBE3 construct exhibited a generally reduced growth, along with both low surface attachment and low intracellular accumulation at three and nine hours, with a small peak at 24 hrs. The absence of homologous regions (except for the homologous signal peptide) may result in sub-optimal interaction of the heterologous (viral) protein with cellular components (chaperones) responsible for the maintenance of fusion proteins in a translocation-competent unfolded state and for transport to the translocons. This could conceivably lead to an even higher level of unfolded-protein-response and a subsequent clearing of accumulated misfolded proteins from the cytoplasm by – presumably - degradation.
Chatzi et. al. revealed a correlation between translocation efficiency and the presence of hydrophobic patches, named MTSs, in E. coli [11]. These patches are thought to provide interfaces for interactions with cellular components such as secretion-associated chaperones. We have identified such hydrophobic patches (H1 located within the signal peptide, H2, H3 and H4) in the amino acid sequence of BmpA and looked to verify and improve their functionality by exchanging individual amino acids to adjust local hydrophobicity to higher or lower scores. Selected amino acids were substituted against alanine or glycine to minimize structural interference, since these two amino acids represent the simplest side-chain elements. Glycine is the smallest proteogenic amino acid, while alanine is an aliphatic amino acid with one methyl group as side chain, which is generally considered neutral to the functionality of proteins [27]. Even though the distance between alanine and glycine on hydrophobicity scales is not extreme, alanine is considered to be hydrophobic, while glycine is considered to be hydrophilic. The replacement of several hydrophilic residues in the original constructs by alanine was aimed to enhance the hydrophobicity of the corresponding MTSs, and the replacement by glycine was expected to render the potential MTSs more hydrophilic. The growth patterns of cells harbouring modified fusion proteins closely resembled those of their parental strains, NpBE1 and NpBE2 (Figure 6a). NpBE1 and all its descendant variants (NpBE1B, NpBE1AB, NpBE1ABi, NpBE1ABv, NpBE1D, NpBE1CD) exhibited comparable surface attachment of targeted proteins, which was generally higher than those of NpBE2 and its descendants (NpBE2A, NpBE2C) (Figure 6b and c), suggesting that the quantity of hydrophobic patches is an influential factor for export and attachment. The hydropathy profile of the patches also had some impact but to a smaller degree. Modifications to alanine (increasing hydrophobicity of the MTSs) did improve translocation, whereas modifications to glycine did not result in a poorer performance compared to their reference strains. For example, surface fluorescence level of NpBE2 and NpBE2C was almost the same, while as that of NpBE1D and NpBE1CD was actually better than the performance of NpBE1 (Figure 6c). Variants NpBE1ABi and NpBE1ABv, with the most significant hydrophobicity in H3 and H4, performed best in protein translocation onto the cell membrane. Between these two variants, NpBE1ABv showed less accumulation inside the cells, suggesting a more complete clearing from the cytoplasm by the translocation machinery (Figure 6d). Further investigations involving more extensive sequence changes and modifications of MTSs will contribute to a deeper understanding of the involved processes.
4. Materials and Methods
4.1. Chemicals and Media
All chemicals and media were of the highest available grade of purity and were obtained from Sigma-Aldrich (St. Louis, MO) except where indicated.
4.2. Strain Constructions
The plasmid vector pNZ8150:BmpA (containing the coding sequence for the basic membrane protein A with a polyhistidine and a tetracysteine tag) was described previously [19]. The sequences encoding three truncated N-terminal domains of BmpA (B126, B66, B26) were amplified from genomic DNA of L. lactis NZ9000 using PCR with suitable primer pairs (see Supplementary Table 1). The HPV16 E7 oncoprotein coding sequence extended with a GSG linker, hexa-histidine tag and tetra-cysteine tag at the C-terminus was synthesized by BioCat (Heidelberg, Germany). Overlapping recognition sites for the endonuclease BsaI were incorporated into both open ends of all sequences encoding BmpA fragments and the E7 oncoprotein to enable Golden Gate assembly with the pNZ8150 plasmid (MoBiTec, Göttingen, Germany). Sequences encoding each truncated BmpA fragment were separately mixed with the synthesized E7 gene and pNZ8150 plasmid DNA in one-pot reactions following the 24-Fragment Golden Gate Assembly protocol from New England Biolabs (Ipswich, MA). The multi-fragment ligations yielded in three hybrid fusion vectors, namely pNZ8150:BE1, pNZ8150:BE2 and pNZ8150:BE3, encoding the BmpA fragments of 126, 66, and 26 amino acids, respectively (Figure 7).
Site-directed mutagenesis was used to introduce point mutations into the fusion constructs. Plasmid pNZ8150:BE1 was used as the template for six variants, and plasmid pNZ8150:BE2 for two variants. For each variant, two primers facing in opposite directions and containing an overlap, were designed, with a mutation site containing 2 – 6 modified nucleotides on the forward primer (Supplementary Table 1). PCR reactions were done using Phusion® High-Fidelity PCR Master Mix with HF buffer (New England Biolabs) to generate linearized DNA fragments carrying the mutations. PCR products were separated by gel electrophoresis (TAE buffer, 0.8% agar m/v), extracted, and purified using the Monarch® DNA Gel Extraction Kit (New England Biolabs). 150 – 200 ng of purified linear PCR product were subjected to DpnI endonuclease digestion with Tango buffer (ThermoFisher Scientific, Waltham, MA) at 37°C for one hour, followed by inactivation at 80°C for 20 minutes. Golden Gate Assembly reactions or DpnI-digested PCR products generated with the mutagenesis primers were transformed into electroporation-competent E. coli JM101 using a MicroPulser Electroporator (Bio-Rad, Hercules, CA). The cells were mixed with 950 μL recovery media (0.5% (w/v) yeast extract, 2% (w/v) tryptone, 10 mM NaCl, 2.5 mM KCl, 20 mM MgSO4, 0.5% D-Glucose (w/v), pH 7.5), rested on ice, incubated at 37°C for 1 – 2 hours before being plated on LB media solid plates containing 1.5% m/v agar and 10 μg/ml chloramphenicol and incubated at 37°C overnight. Five to ten colonies were selected for colony PCR of the respective inserts. Two strains displaying correct PCR bands were inoculated in liquid LB media for plasmid isolation using the Monarch® Plasmid Miniprep Kit (New England Biolabs) and sent for Sanger sequencing (Microsynth, Balgach, CH). Pure plasmids with verified sequences were transformed into electro-competent L. lactis NZ9000 generated following the protocol [28]. A full list of the combinations of of L. lactis strains and plasmids is available in Supplementary Table 2.
4.3. Cultivation and Protein Production
E. coli strains as intermediate vector recipients were grown in LB medium in glass eprouvettes at 37°C and 200 rpm. Cultivation of L. lactis and induction for protein production was based on the supplier’s manual for the NICE® pNZ8150 expression system and followed the previously established conditions [19,29]. L. lactis NZ9000 cells (MoBiTec GmbH) were grown in M17 medium with 0.5% glucose (GM17) at 30°C without agitation. Except for wildtype strains, all media were supplemented with 10 μg/ml chloramphenicol. L. lactis cells were recovered from glycerol stock (1:100 inoculation) and grown overnight. For induction, the cells were diluted in fresh medium at a ratio of 1:20 and grown until the optical density at 600 nm wavelength (OD600) reached 0.5 – 0.6 (Lambda 35 UV/Vis Spectrometer, PerkinElmer, Waltham, MA), before 25 ng/ml nisin A from L. lactis (Sigma-Aldrich) was added. Cells were harvested at three, nine and 24 hours after induction and stored at 4°C for further experiments. Cell growth was evaluated based on OD600 values (mean of triplicates) at each time point. Negative controls, including uninduced samples and uninduced/induced wildtype strain were included.
4.4. Hydropathy Evaluation
The prediction of the hydropathic character of proteins was based on the Kyte-Doolittle hydrophobicity scale [30] using ProtScale (Expasy, Swiss Bioinformatics Institute), which evaluates hydrophilic and hydrophobic properties of a protein based on the hydropathy index of its compositions and presents them in the form of a plot displaying the average hydropathic evaluation along the amino acid sequence. For each amino acid position, the algorithm obtains a numerical mean of the hydropathy index of the surrounding amino acids within the customized window size. A midpoint line, which represents the middle value of the hydrophobic portion (upper part) and hydrophilic portion (lower part), is delineated. The choice of segment length (span/window setting) determines each residue’s value by averaging its surrounding residues within the window size [31]. Adjusting the window size based on protein physiology enhances prediction precision, with smaller sizes like 5-7 revealing hydrophilic regions and larger sizes like 19-21 highlighting transmembrane domains. For this study, a window size of 5 was selected after examining plots from 3 to 21, aiming to distinguish hydrophobic and hydrophilic segments and identify hydrophobic patches using 1.6 as transmembrane threshold.
4.5. Staining and Detection of Membrane-Anchored and Intracellular Proteins
The detection of membrane anchored proteins was based on the high-affinity interaction between poly-histidine tags with NTA-Atto 488 conjugated with nickel (Ni-NTA-Atto 488, Merck KGaA, Darmstadt, Germany) and performed as published previously [19]. In brief, each sample of 4 x 10⁹ cells were washed twice with 500 µL ice-cold PBS and stained with 2.5 μM Ni-NTA-Atto 488 in PBS for 1.5 hours on ice. The cell pellet was then washed three times with ice-cold PBS, finally dissolved in 100 μl ice-cold PBS and kept on ice until screening. Unstained samples and stained cells containing an empty vector were processed analogously as negative controls. Cells were loaded into a CytoFLEX S flow cytometer (Beckman Coulter, Brea, CA) and protein display was evaluated based on fluorescence emission (band-pass filter 488-525nm).
The process for staining, detection and visualization of intracellular proteins in L. lactis was described previously [19]. This process consists of (1) blocking of surface anchored tetra-cysteine tags using 5,5’-dithio-bis-(2-nitrobenzoic acid) (Ellman’s reagent, DTNB) and (2) staining of tetra-cysteine tagged proteins with the membrane-permeable biarsenical compound ReAsH-EDT2 (Cayman, Ann Arbor, MI). Each sample of 4 x 10⁹ cells was washed twice with PBS and incubated with 1 ml DTNB solution (4 mM DTNB, 50 mM sodium acetate) at 37°C for 45 minutes. The cells were washed twice with PBS before being treated with 500 ml 2,3-dimercaptopropanol (BAL) 650 μM in PBS for 30 minutes at 37°C before being washed twice with PBS and stained with 2.5 μM ReAsH-EDT2 in PBS for 30 minutes at 37°C. After staining, the cell pellet was washed two times with 500 μL BAL 250 μM in PBS before finally being dissolved in 100 μl PBS and stored at 4oC until further screening. Unstained samples, stained empty-vector cells and stained wildtype cells were processed analogously as negative controls. The samples were screened in a live-cell epi-fluorescence microscopy system (Leica DMI6000B), lamp EL6000, objective HCX PL APO 63x/1.40 oil with Leica N2.1 filter cube (BP 515-560; Leica Microsystems, Wetzlar, Germany).
4.6. Data Analysis
Data analysis was performed as described in [19]. In short, surface localized proteins were quantitatively evaluated given fluorescence intensity outputs from CytExpert 2.4 and calibrated median fluorescence intensity (CFI) was used for evaluation and graphic presentation. Histogram displays were exported using Floreada (https://floreada.io/). Visual presentations and calculation of intracellular protein quantity were performed using LAS X and Fiji. Calibrated average cell fluorescence (CACF) was used for evaluation and graphic displays.
Supplementary Materials
The following supporting information can be downloaded at: www.mdpi.com/xxx/s1, Supplementary Table 1: List of oligonucleotide primers used in strain constructions; Supplementary Table 2: List of all strains used in the study with harbored plasmids and encoded (fusion) proteins; Supplementary Figure 1: Histograms and fluorescence microscopy of cells producing fusion proteins; Supplementary Figure 2: Histograms of cells producing modified fusion proteins; Supplementary Figure 3: Intracellular fluorescence of cells producing modified fusion proteins.
Author Contributions
Conceptualization, C.P.; methodology, C.P. and M.N.H.; formal analysis, C.P. and M.N.H..; investigation, M.N.H..; resources, C.P.; data curation, M.N.H.; writing—original draft preparation, M.N.H.; writing—review and editing, C.P.; supervision, C.P. All authors have read and agreed to the published version of the manuscript.
Funding
This research received no external funding.
Data Availability Statement
Data and materials generated in this study are available from the corresponding author upon request.
Acknowledgments
The authors would like to express their great appreciation to the Austrian Agency for Education and Internationalization (OeAD) for the research scholarship (ASEA-UNINET Ernst-Mach Grant) for M.N.H., to the Core Facility Biomolecular and Cellular Analysis and the Core Facility Multiscale Imaging at BOKU University, especially to Dr. Monika Debreczeny, for technical support.
Conflicts of Interest
The authors declare no conflicts of interest.
References
- Jørgensen, C.M.; Vrang, A.; Madsen, S.M. Recombinant protein expression in Lactococcus lactis using the P170 expression system. FEMS Microbiol. Lett. 2014, 351, 170–178. [CrossRef] [PubMed]
- Arnau, J.; Hjerl-Hansen, E.; Israelsen, H. Heterologous gene expression of bovine plasmin in Lactococcus lactis. Applied microbiology and biotechnology 1997, 48, 331–338. [CrossRef] [PubMed]
- Chatel, J.-M.; Langella, P.; Adel-Patient, K.; Commissaire, J.; Wal, J.-M.; Corthier, G. Induction of mucosal immune response after intranasal or oral inoculation of mice with Lactococcus lactis producing bovine beta-lactoglobulin. Clinical Diagnostic Laboratory Immunology 2001, 8, 545–551. [CrossRef]
- Steidler, L.; Robinson, K.; Chamberlain, L.; Schofield, K.M.; Remaut, E.; Le Page, R.W.F.; Wells, J.M. Mucosal delivery of murine interleukin-2 (IL-2) and IL-6 by recombinant strains of Lactococcus lactis coexpressing antigen and cytokine. Infection and immunity 1998, 66, 3183–3189. [CrossRef]
- Steidler, L.; Wells, J.M.; Raeymaekers, A.; Vandekerckhove, J.; Fiers, W.; Remaut, E. Secretion of biologically active murine interleukin-2 by Lactococcus lactis subsp. lactis. Applied and environmental microbiology 1995, 61, 1627–1629. [CrossRef]
- Drouault, S.; Corthier, G.; Ehrlich, S.D.; Renault, P. Expression of the Staphylococcus hyicus lipase in Lactococcus lactis. Applied and environmental microbiology 2000, 66, 588–598. [CrossRef]
- Gaeng, S.; Scherer, S.; Neve, H.; Loessner, M.J. Gene cloning and expression and secretion of Listeria monocytogenes bacteriophage-lytic enzymes in Lactococcus lactis. Applied and environmental microbiology 2000, 66, 2951–2958. [CrossRef]
- Ribeiro, L.A.; Azevedo, V.; Le Loir, Y.; Oliveira, S.C.; Dieye, Y.; Piard, J.-C.; Gruss, A.; Langella, P. Production and targeting of the Brucella abortus antigen L7/L12 in Lactococcus lactis: a first step towards food-grade live vaccines against brucellosis. Applied and environmental microbiology 2002, 68, 910–916. [CrossRef]
- Blobel, G.; Dobberstein, B. Transfer of proteins across membranes. I. Presence of proteolytically processed and unprocessed nascent immunoglobulin light chains on membrane-bound ribosomes of murine myeloma. J. Cell Biol. 1975, 67, 835–851. [CrossRef]
- Hegde, R.S.; Bernstein, H.D. The surprising complexity of signal sequences. Trends in biochemical sciences 2006, 31, 563–571. [CrossRef] [PubMed]
- Chatzi, K.E.; Sardis, M.F.; Tsirigotaki, A.; Koukaki, M.; Šoštarić, N.; Konijnenberg, A.; Sobott, F.; Kalodimos, C.G.; Karamanou, S.; Economou, A. Preprotein mature domains contain translocase targeting signals that are essential for secretion. J. Cell Biol. 2017, 216, 1357–1369. [CrossRef]
- Derman, A.I.; Puziss, J.W.; Bassford Jr, P.J.; Beckwith, J. A signal sequence is not required for protein export in prlA mutants of Escherichia coli. The EMBO journal 1993, 12, 879–888. [CrossRef] [PubMed]
- Le Loir, Y.; Nouaille, S.; Commissaire, J.; Brétigny, L.; Gruss, A.; Langella, P. Signal peptide and propeptide optimization for heterologous protein secretion in Lactococcus lactis. Applied and environmental microbiology 2001, 67, 4119–4127. [CrossRef]
- Bieker, K.L.; Phillips, G.J.; Silhavy, T.J. The sec and prl genes of Escherichia coli. Journal of bioenergetics and biomembranes 1990, 22, 291–310. [CrossRef]
- Gouridis, G.; Karamanou, S.; Gelis, I.; Kalodimos, C.G.; Economou, A. Signal peptides are allosteric activators of the protein translocase. Nature 2009, 462, 363–367. [CrossRef] [PubMed]
- Lill, R.; Dowhan, W.; Wickner, W. The ATPase activity of SecA is regulated by acidic phospholipids, SecY, and the leader and mature domains of precursor proteins. Cell 1990, 60, 271–280. [CrossRef]
- Prinz, W.A.; Spiess, C.; Ehrmann, M.; Schierle, C.; Beckwith, J. Targeting of signal sequenceless proteins for export in Escherichia coli with altered protein translocase. The EMBO journal 1996, 15, 5209–5217. [CrossRef] [PubMed]
- Berlec, A.; Zadravec, P.; Jevnikar, Z.; Štrukelj, B. Identification of candidate carrier proteins for surface display on Lactococcus lactis by theoretical and experimental analyses of the surface proteome. Applied and environmental microbiology 2011, 77, 1292–1300. [CrossRef]
- Hoang, M.N.; Peterbauer, C. Double-Labeling Method for Visualization and Quantification of Membrane-Associated Proteins in Lactococcus lactis. Int. J. Mol. Sci. 2023, 24. [CrossRef]
- Guruprasad, K.; Reddy, B.B.; Pandit, M.W. Correlation between stability of a protein and its dipeptide composition: a novel approach for predicting in vivo stability of a protein from its primary sequence. Protein Engineering, Design and Selection 1990, 4, 155–161. [CrossRef]
- Panda, S.; Chandra, G. Physicochemical characterization and functional analysis of some snake venom toxin proteins and related non-toxin proteins of other chordates. Bioinformation 2012, 8, 891. [CrossRef] [PubMed]
- Magdeldin, S.; Yoshida, Y.; Li, H.; Maeda, Y.; Yokoyama, M.; Enany, S.; Zhang, Y.; Xu, B.; Fujinaka, H.; Yaoita, E.; et al. Murine colon proteome and characterization of the protein pathways. BioData Min. 2012, 5, 11. [CrossRef] [PubMed]
- Chang, K.Y.; Yang, J.-R. Analysis and prediction of highly effective antiviral peptides based on random forests. PLoS One 2013, 8, e70166. [CrossRef]
- Georgiou, G. Optimizing the production of recombinant proteins in microorganisms. AIChE J. 1988, 34, 1233–1248. [CrossRef]
- Goff, S.A.; Goldberg, A.L. Production of abnormal proteins in E. coli stimulates transcription of lon and other heat shock genes. Cell 1985, 41, 587–595. [CrossRef]
- Ron, E.Z. Bacterial Stress Response. In The Prokaryotes: Volume 2: Ecophysiology and Biochemistry; Dworkin, M., Falkow, S., Rosenberg, E., Schleifer, K.-H., Stackebrandt, E., Eds.; Springer New York: New York, NY, 2006; pp 1012–1027, ISBN 978-0-387-30742-8.
- Textbook of Biotechnology; Tata McGraw Hill Education, 2012, ISBN 9780071070072.
- Geertsma, E.R.; Poolman, B. High-throughput cloning and expression in recalcitrant bacteria. Nature methods 2007, 4, 705–707. [CrossRef]
- MoBiTec GmbH. NICE® Expression System for Lactococcus lactis. Available online: https://www.mobitec.com/media/mobitec/category-preview/vector-systems/pdf/3/NICE_Expression_System-Handbook.pdf.
- Kyte, J.; Doolittle, R.F. A simple method for displaying the hydropathic character of a protein. Journal of molecular biology 1982, 157, 105–132. [CrossRef] [PubMed]
- Deber, C.M.; Wang, C.; Liu, L.; Prior, A.S.; Agrawal, S.; Muskat, B.L.; Cuticchia, A.J. TM Finder: a prediction program for transmembrane protein segments using a combination of hydrophobicity and nonpolar phase helicity scales. Protein Science 2001, 10, 212–219. [CrossRef]
Figure 1.
Growth profile of L. lactis carrying homologous proteins and fusion proteins. Optical density (OD) at 600 nm wavelength was measured after three-, nine- and 24-hours post-induction. Dark grey lines: strains without genes encoding heterologous proteins (NZ9000, NpB). Other lines: strains producing heterologous proteins (NpBE1, NpBE2, NpBE3).
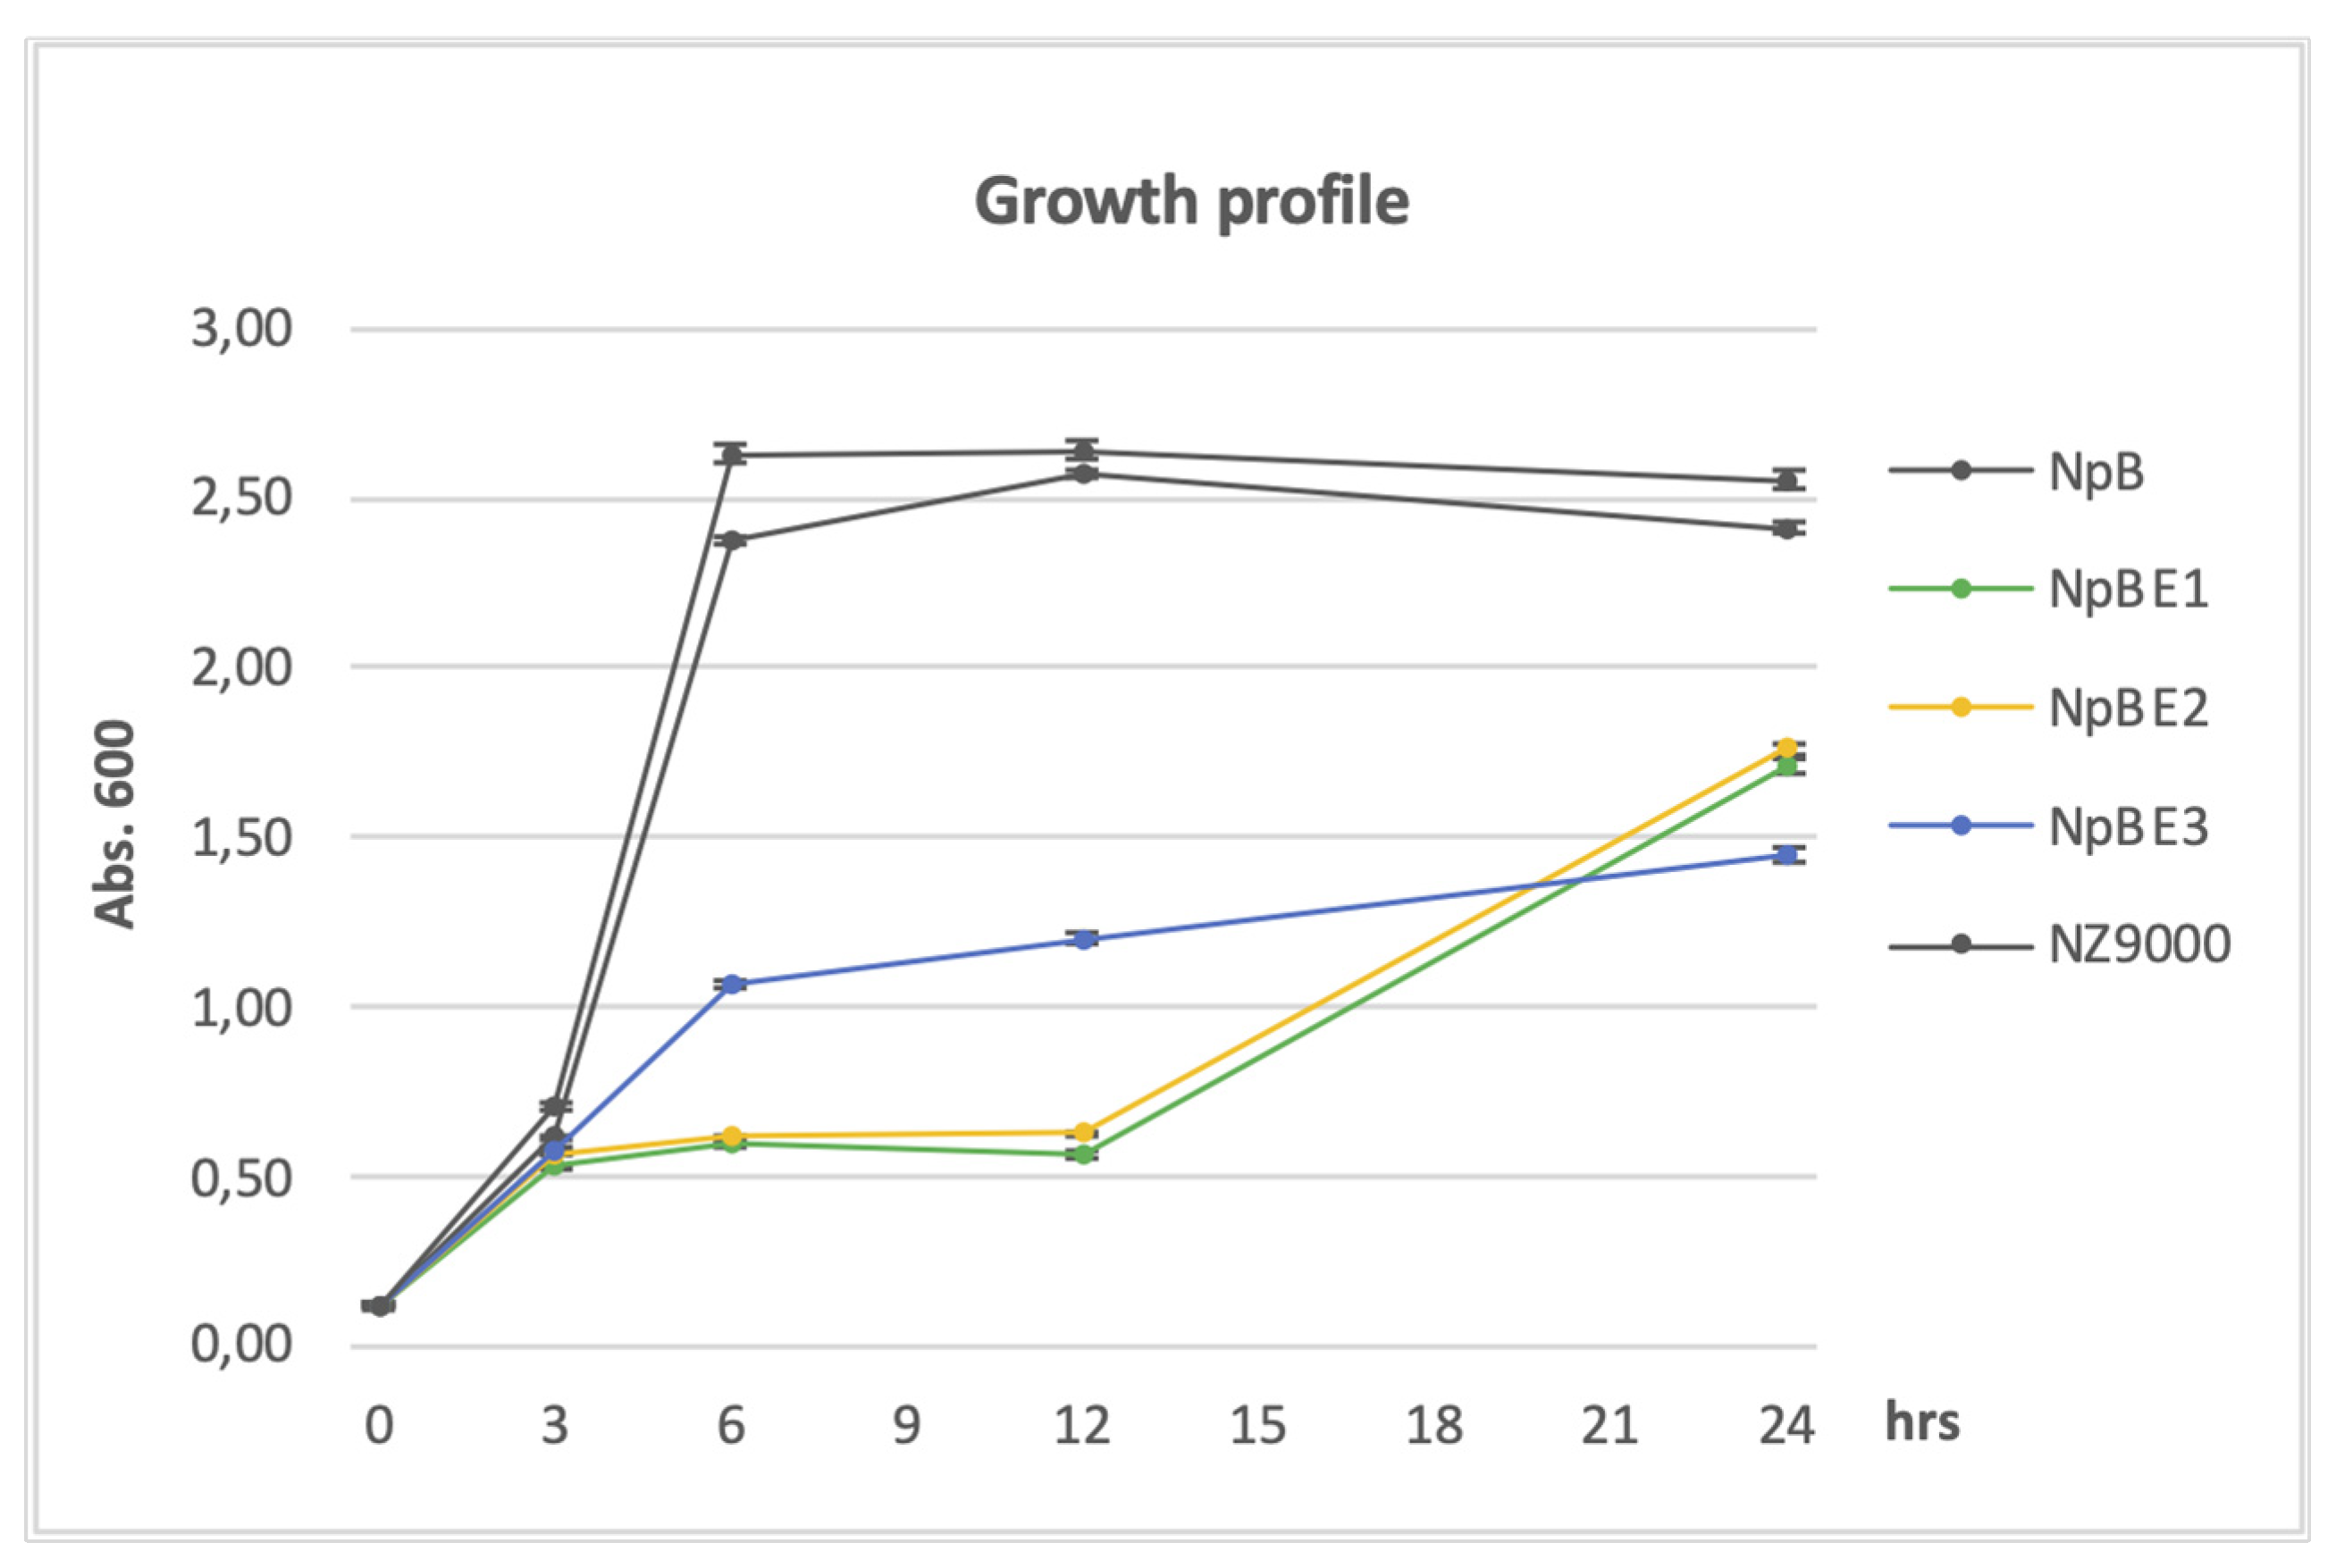
Figure 2.
Quantitative comparison on surface and intracellular fluorescence expression of L. lactis carrying homologous and fusion proteins over three time points (3, 9, 24 hours post induction). Colour of columns: blue – 3 hours, orange – 9 hours, grey – 24 hours. (a) Surface fluorescence, y-axis: corrected fluorescence intensity of Ni-NTA-Atto 488 (His-tag), (b) Intracellular fluorescence, y-axis: corrected average cell fluorescence of ReAsH (Tetra-cysteine tag).
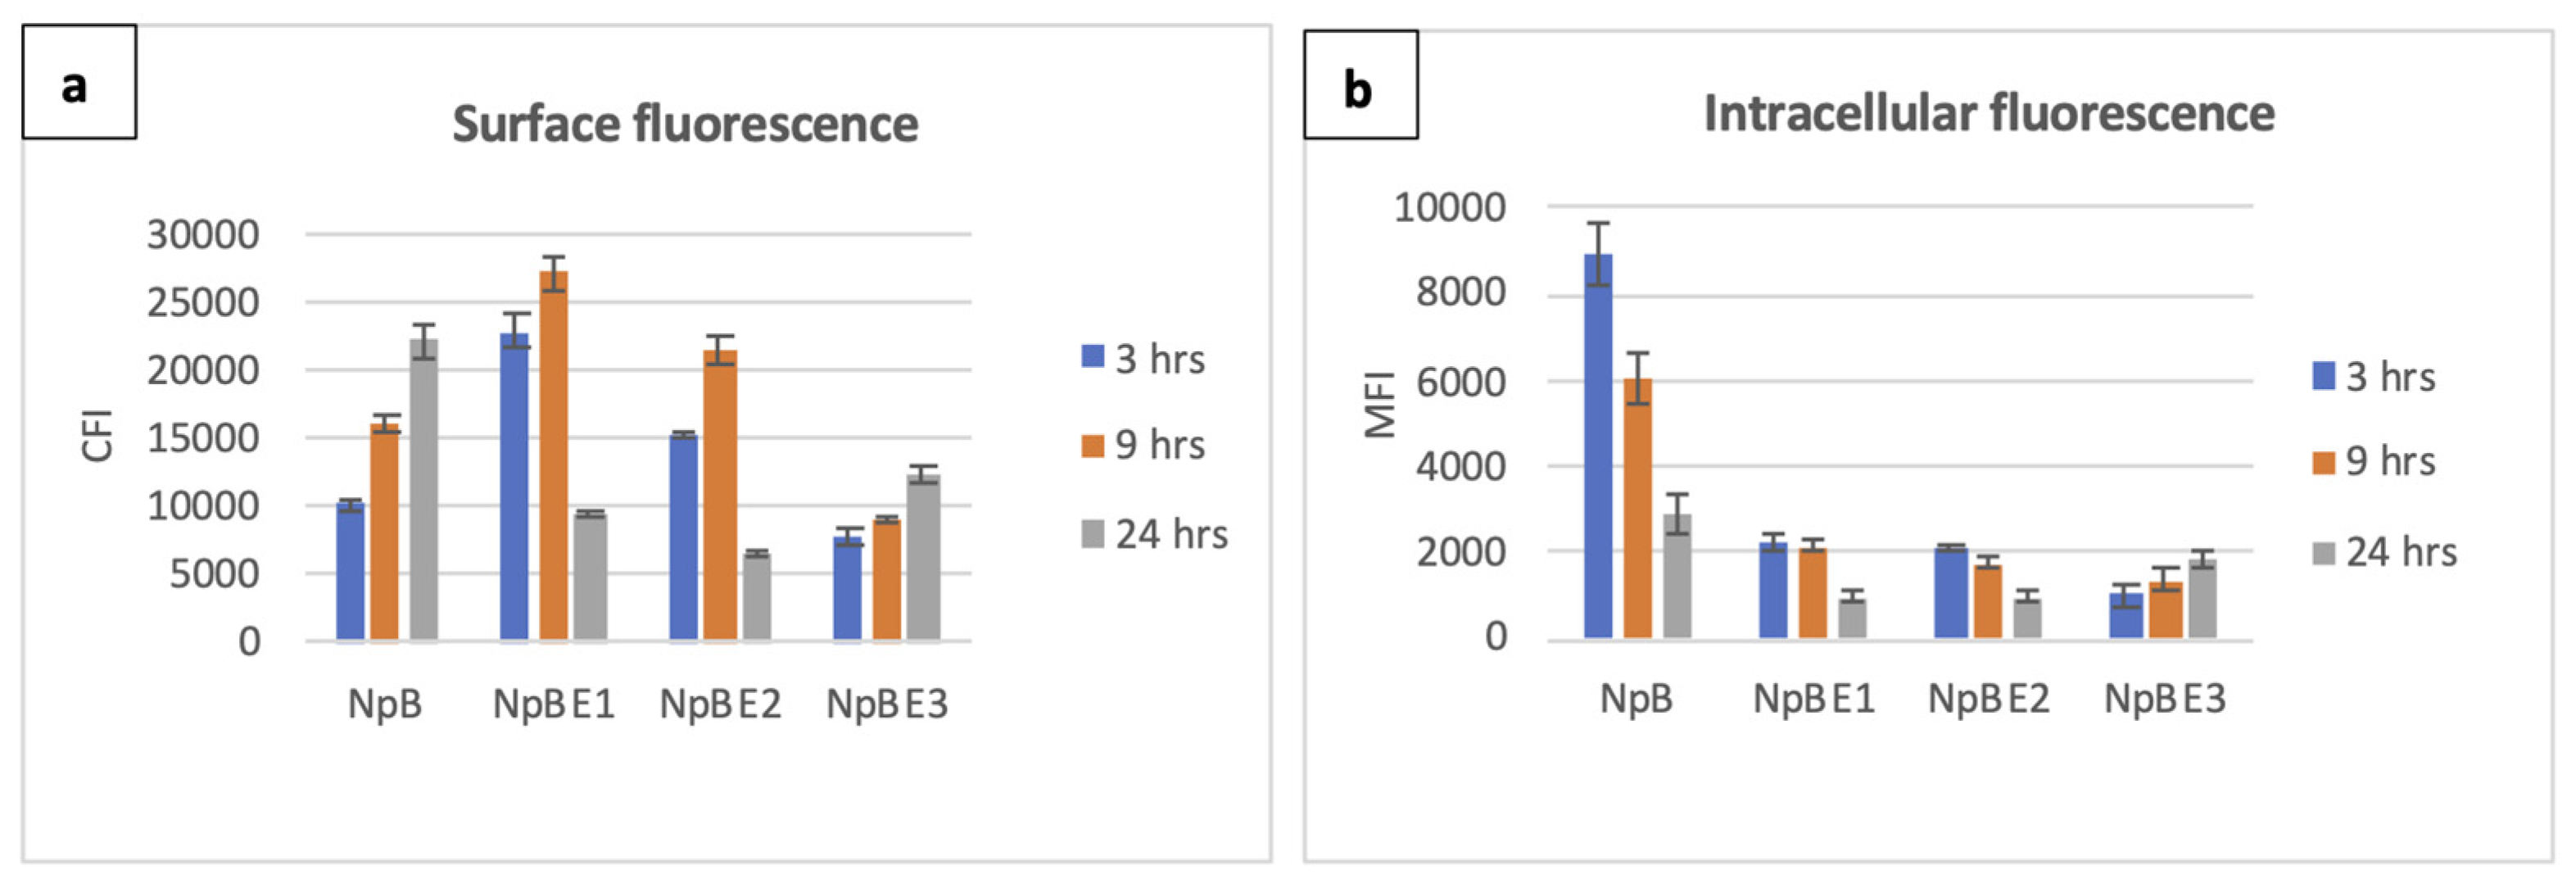
Figure 3.
Hydropathy plot of BmpA and fusion proteins. (a) BmpA conjugated C-terminally with hexa-histidine and tetra-cysteine tags, 366 amino acids in length. (b) BE1, BE2 and BE3 (126, 66 and 26 amino acids at from N-terminus of BmpA fused with HPV16 E7 and C-terminally tagged with hexa-histidine and tetra-cysteine), window size = 5. Red line: threshold +1.6. Graph was created by ProtScale Expasy.
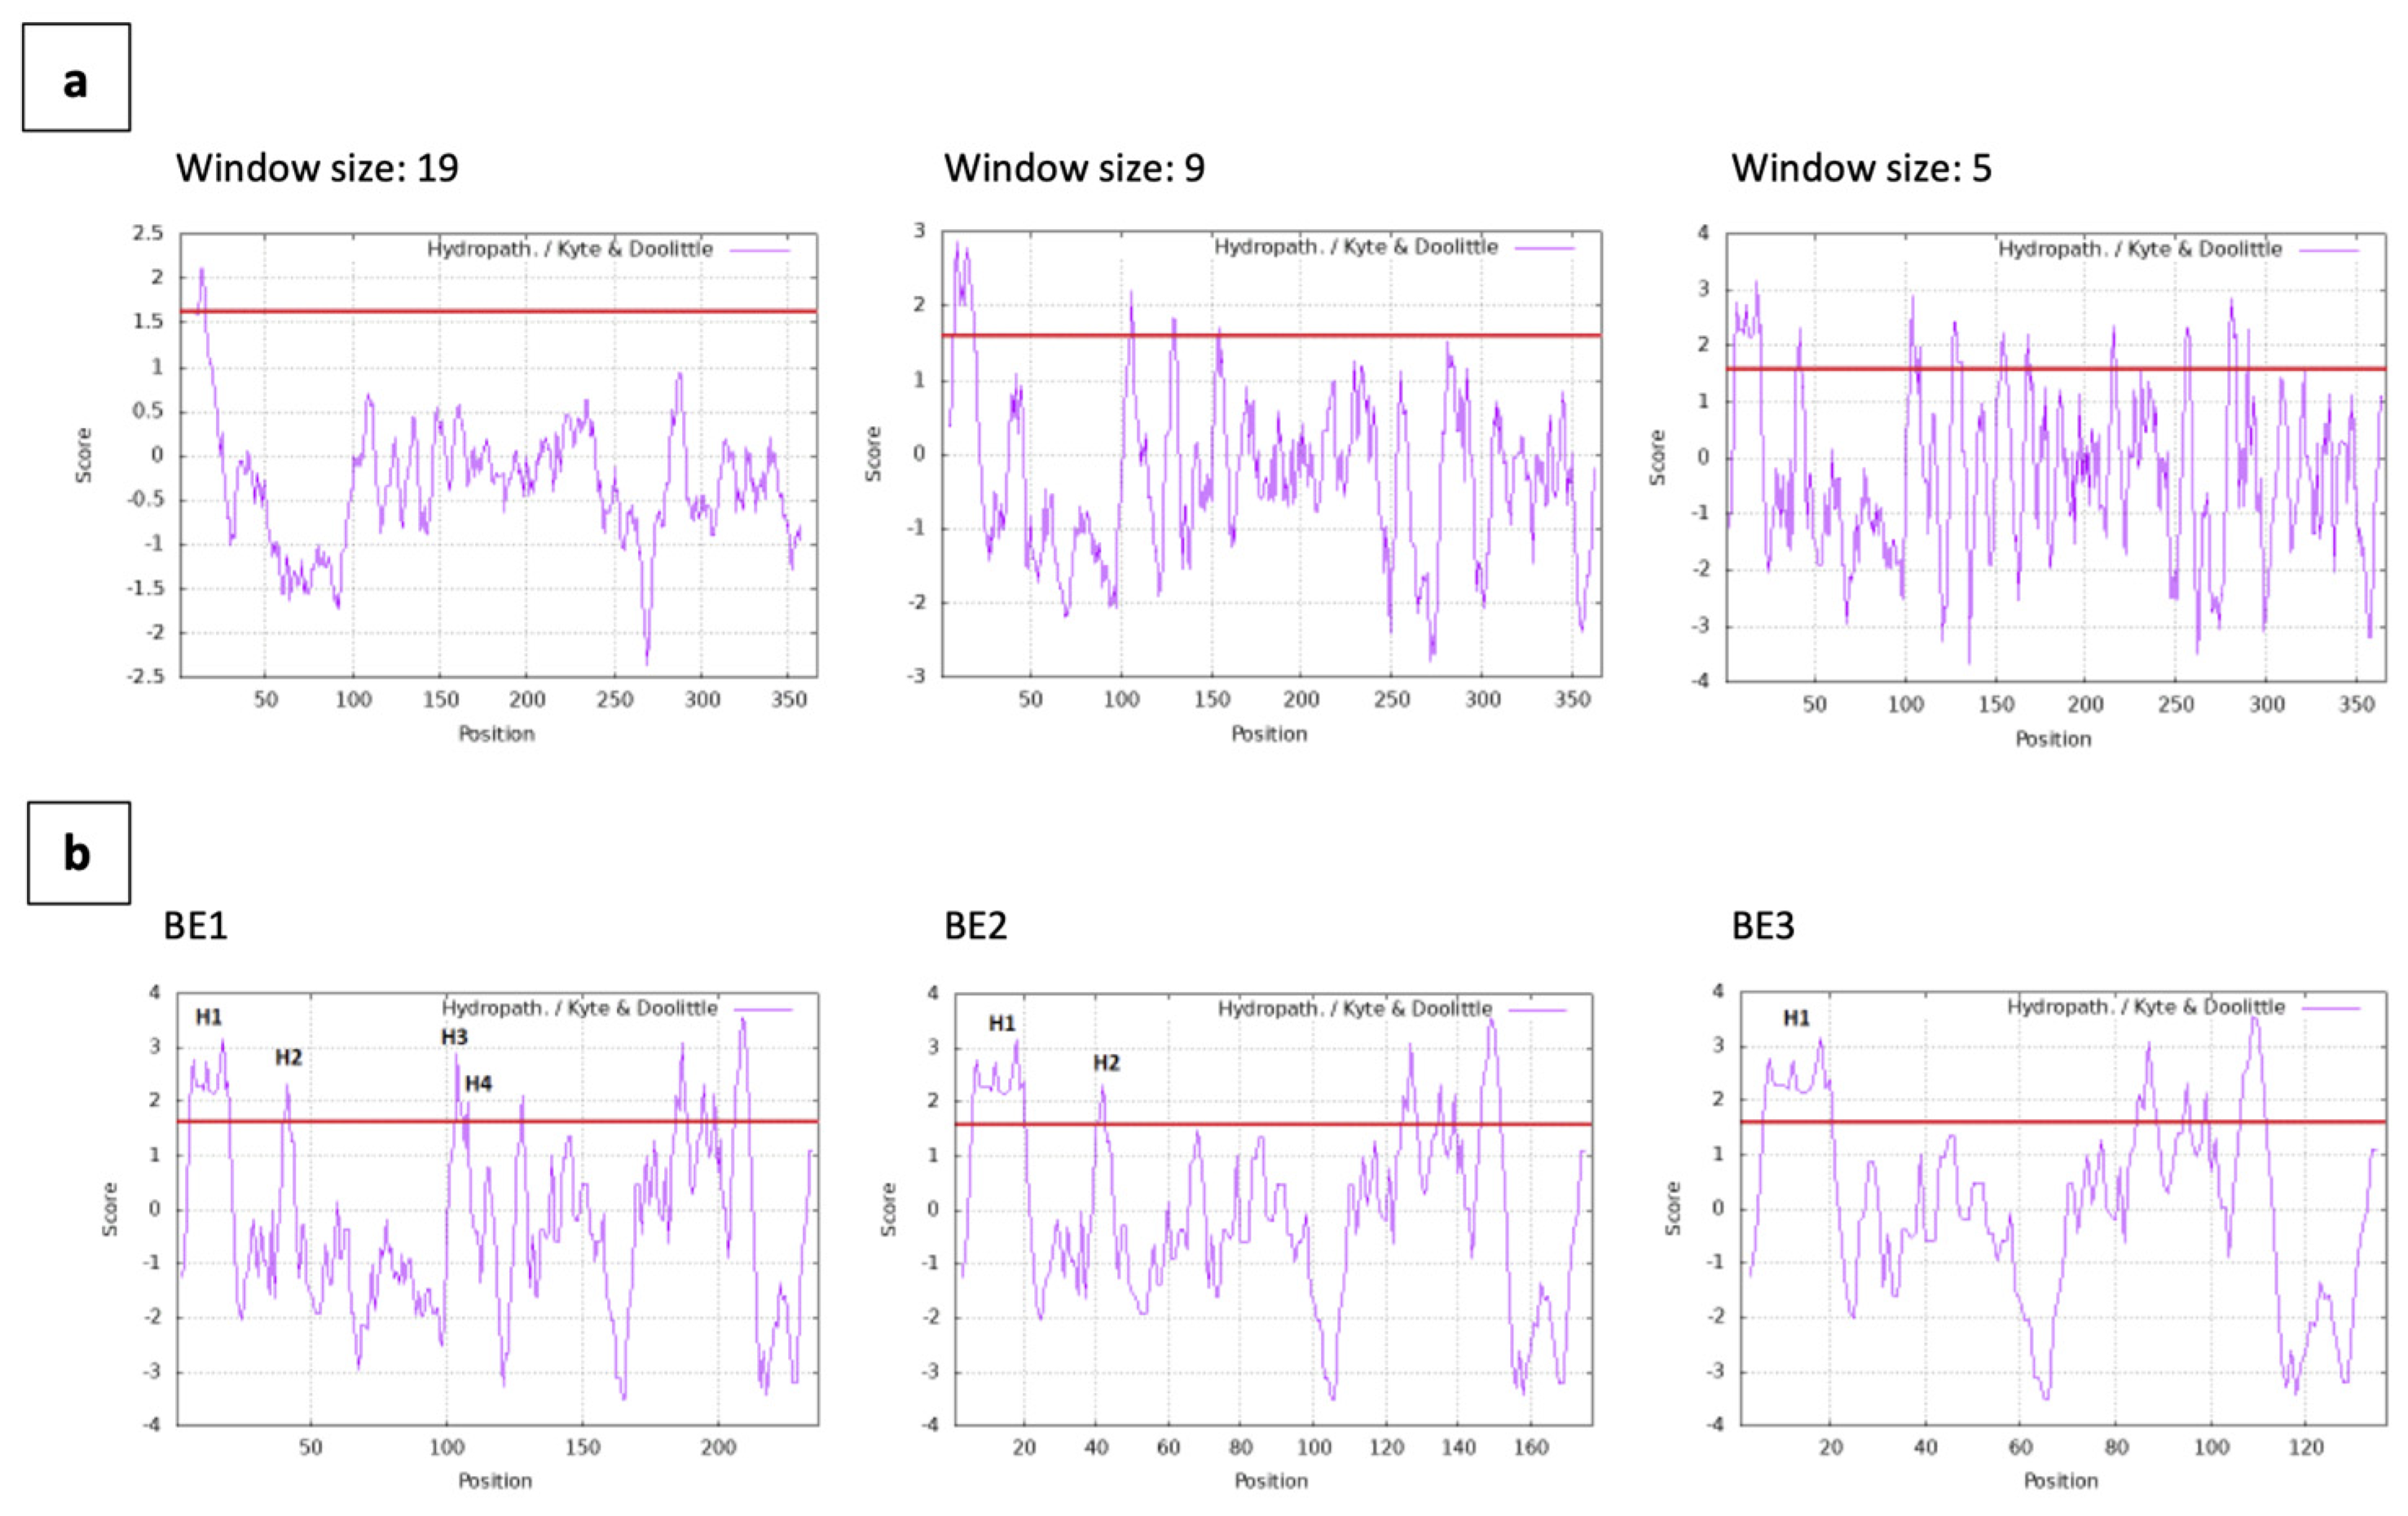
Figure 4.
Site-directed designation for mutations. (a) Sequence map of BE1 fusion construct. Hydrophobic patches (signal peptide - H1, H2, H3, H4) were identified by Kyte-Doolittle hydropathy evaluation and annotated accordingly. (b) List of mutations created using site-directed mutagenesis. The constructs with original amino acids replaced by alanine include A, B, AB. The constructs with original amino acids replaced by glycine include C, D, CD. The sequence of AB mutant was modified further to create two more hydrophobic changes at position 114-115: TS to II and TS to VV.
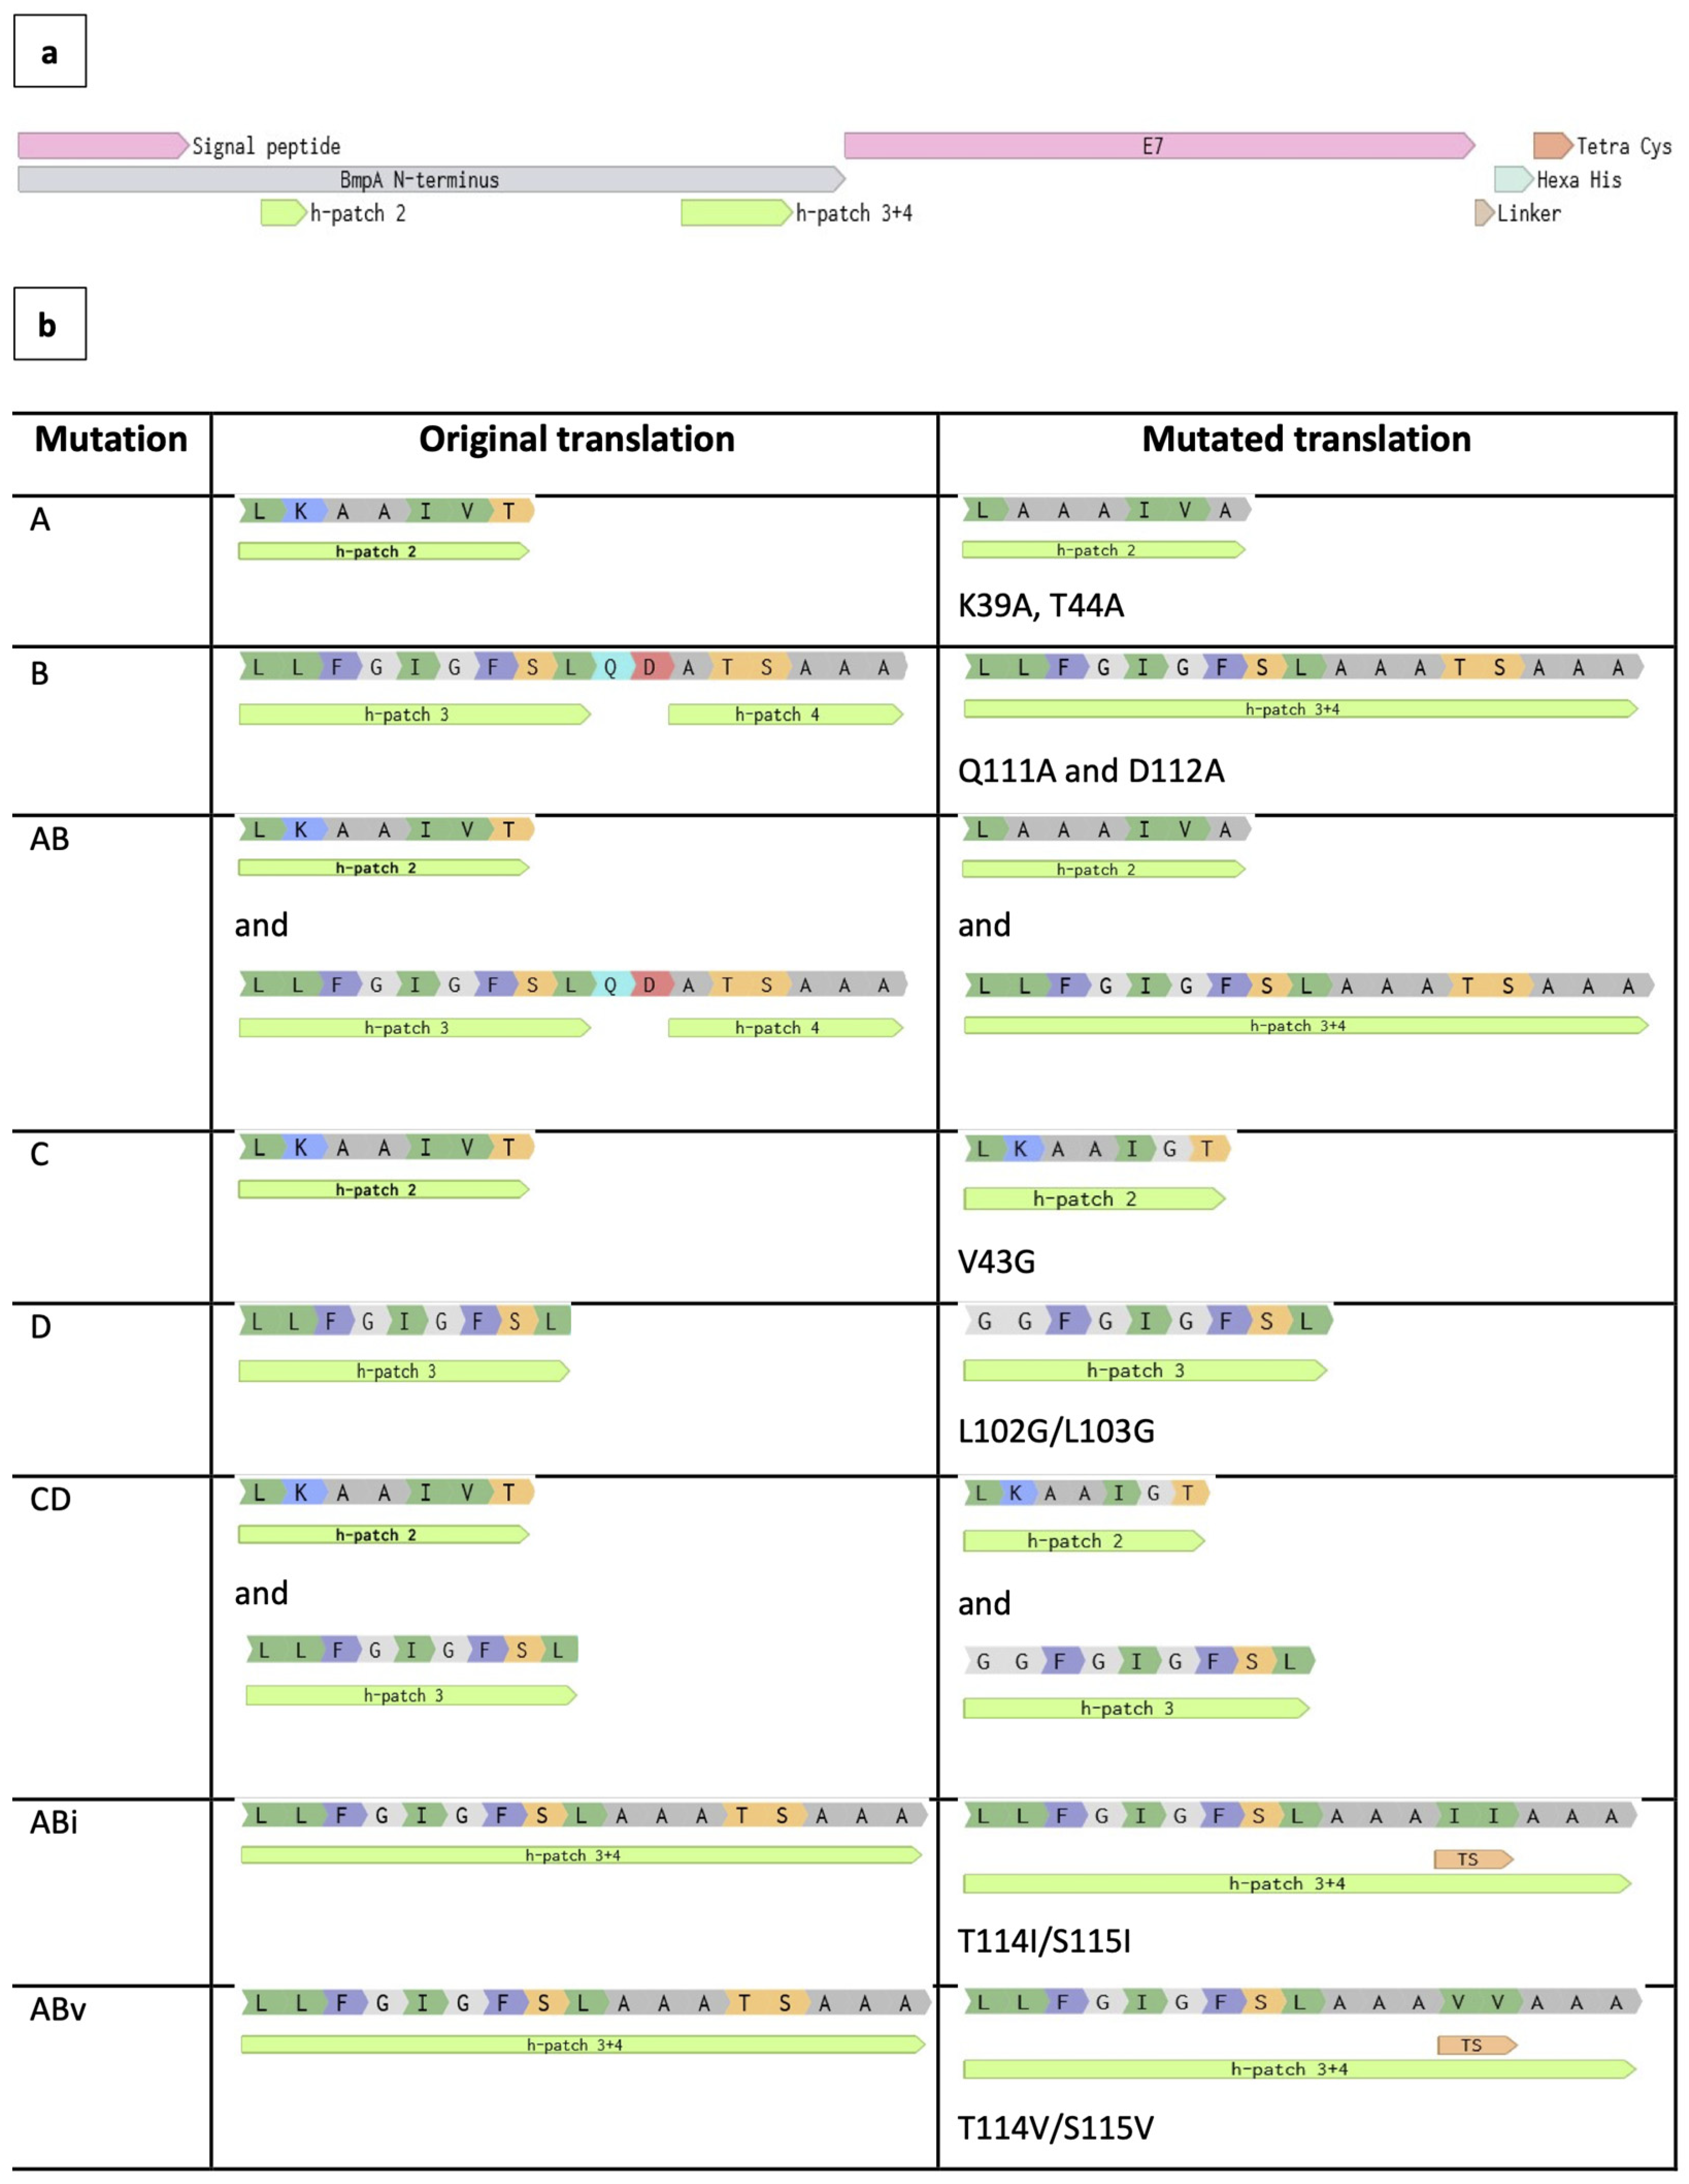
Figure 5.
Hydropathy plot of BE1-based variants. Replacements by alanine target the increase of hydrophobicity (BE1B, BE1AB, BE1ABi, BE1Abv; BE2A). Replacements by glycine target the decrease of hydrophobicity (BE1C, BE1CD; BE2C).
Figure 5.
Hydropathy plot of BE1-based variants. Replacements by alanine target the increase of hydrophobicity (BE1B, BE1AB, BE1ABi, BE1Abv; BE2A). Replacements by glycine target the decrease of hydrophobicity (BE1C, BE1CD; BE2C).
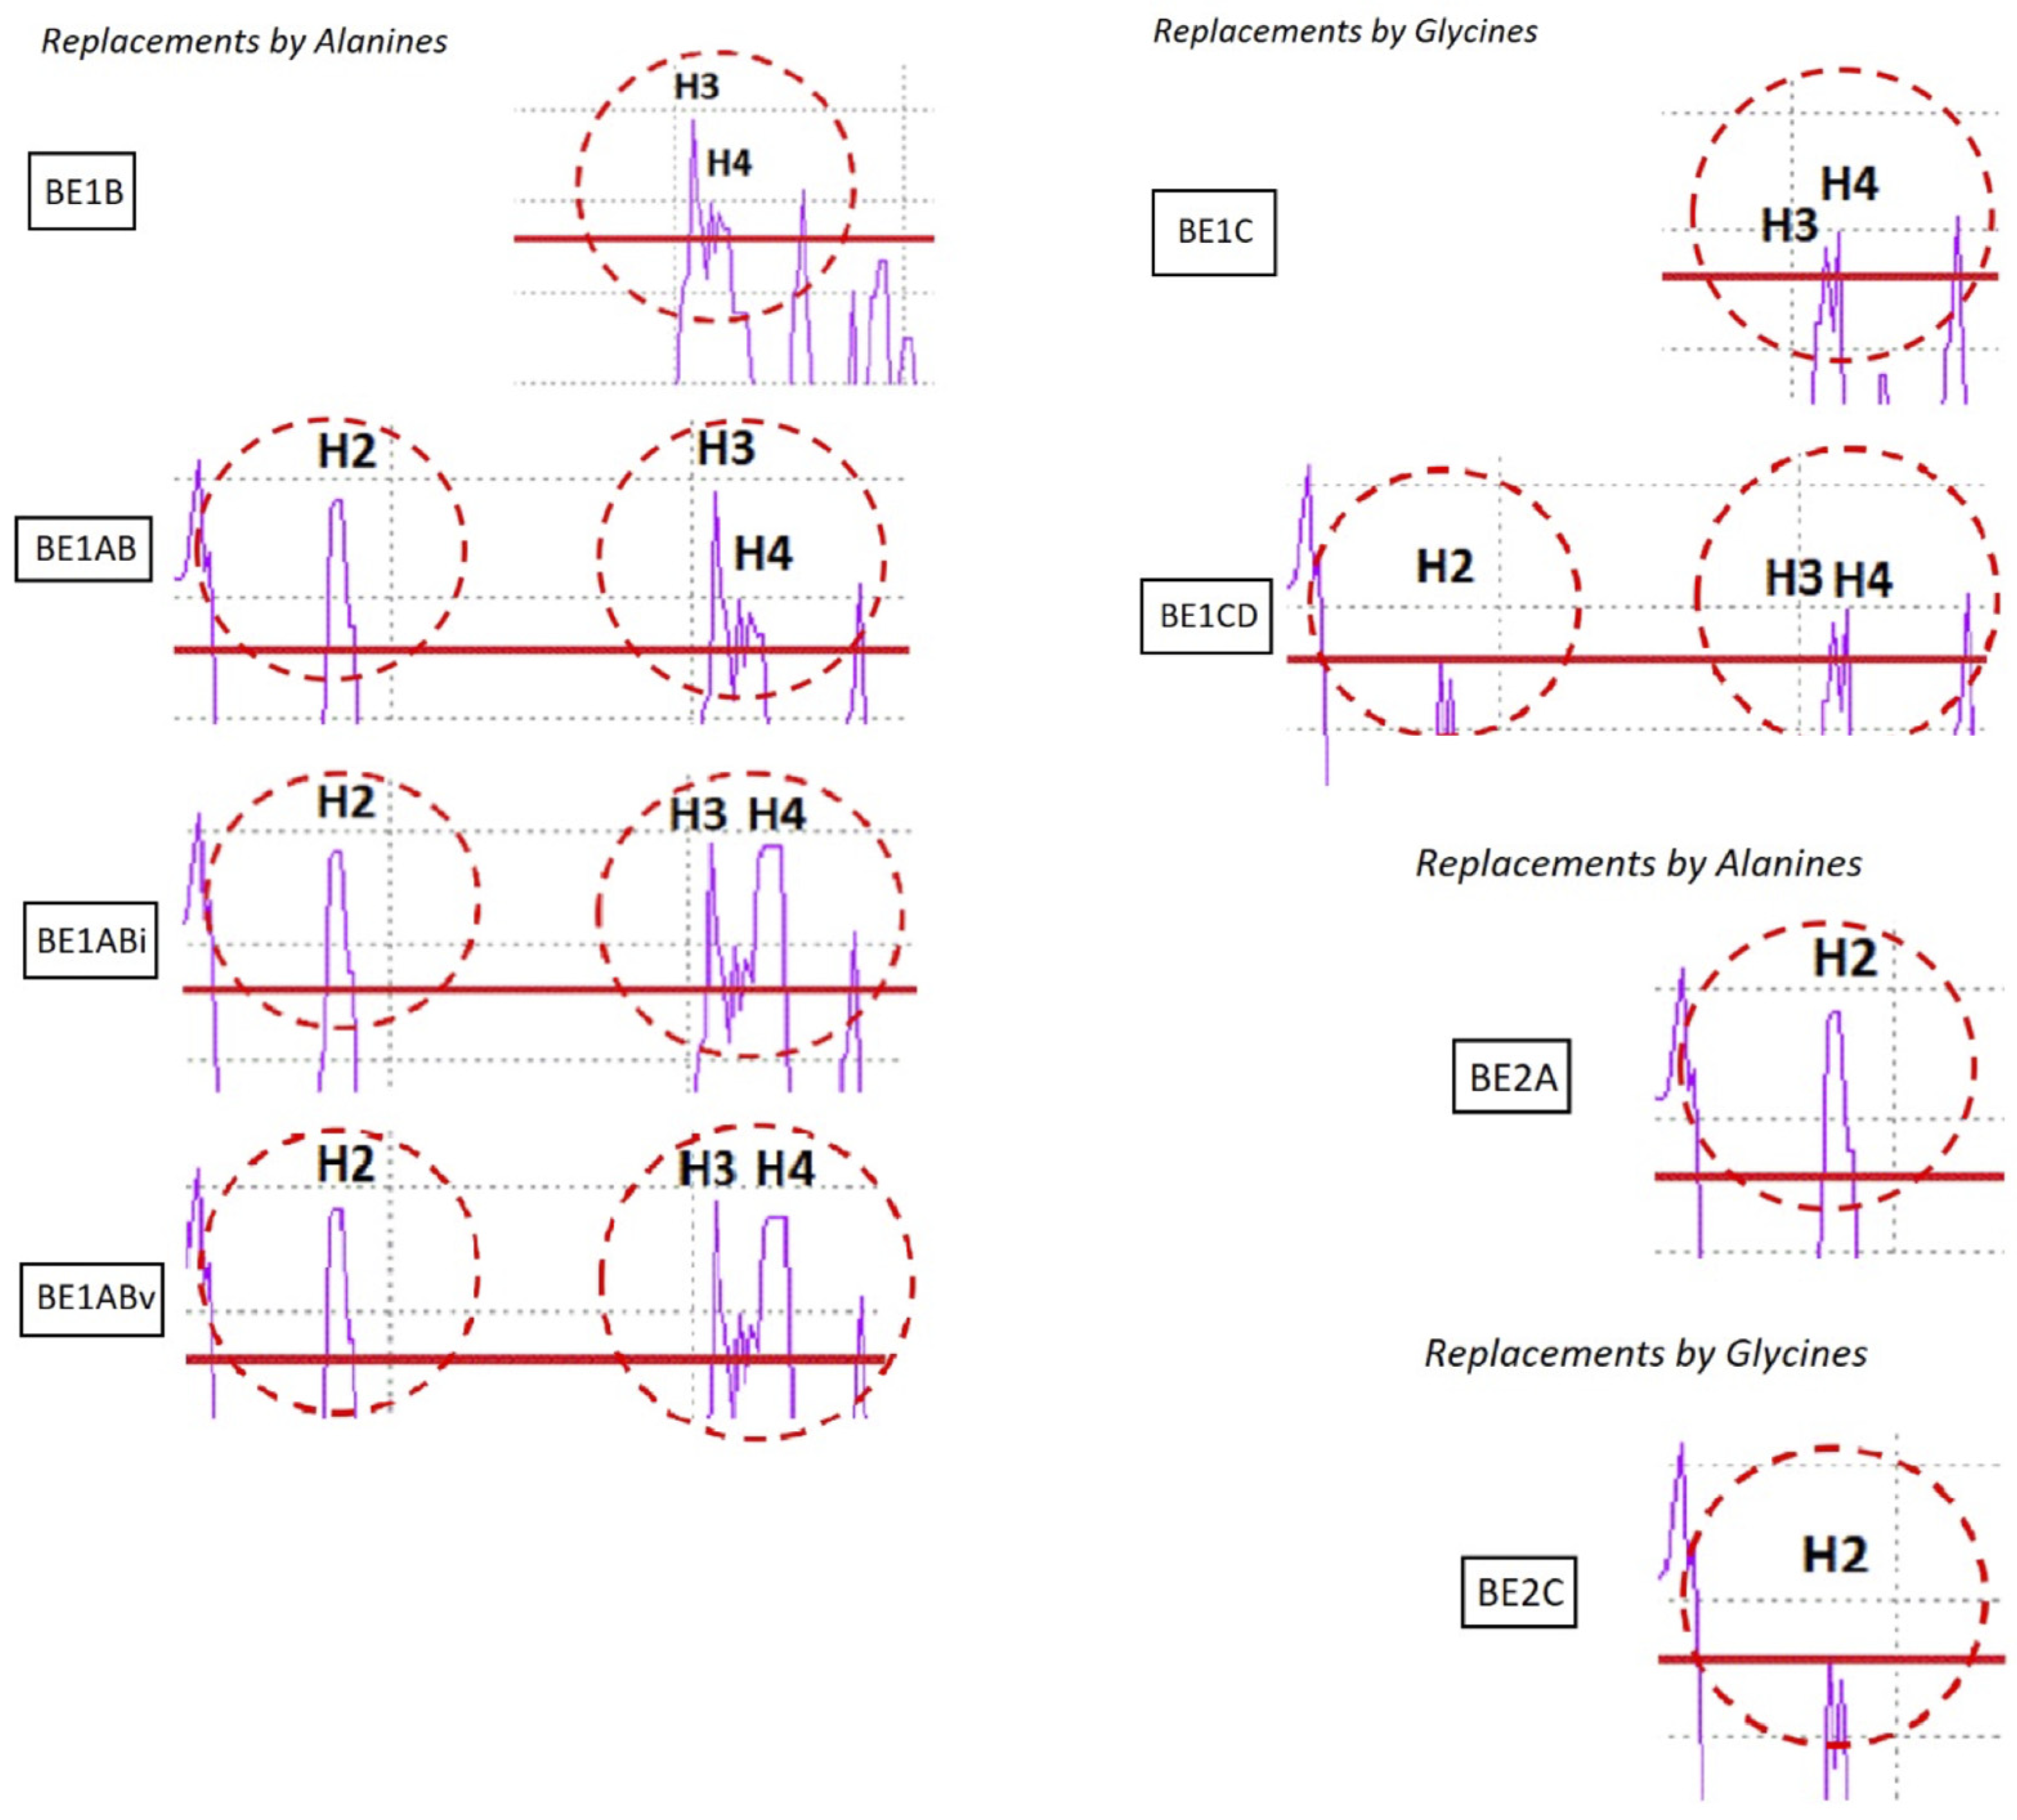
Figure 6.
Growth profile, quantitative comparison on surface and intracellular fluorescence protein expression in L. lactis. All modified fusion proteins expressed and displayed by L. lactis at three, nine and 24 hours are included. NpB is included in chart a and b for comparison, but not in chart c and d. (a) Growth profile of all strains. (b) Trend of surface expression by all strains: green lines – NpBE1 and variants, yellow lines – NpBE2 and variants, blue line – NpBE3, dark grey line – NpB. (c) Quantitative comparison of surface expression, and (d) Quantitative comparison of intracellular expression of all cell lines carrying modified fusion proteins: blue bar – three hours, orange bar – nine hours, light grey bar – 24 hours.
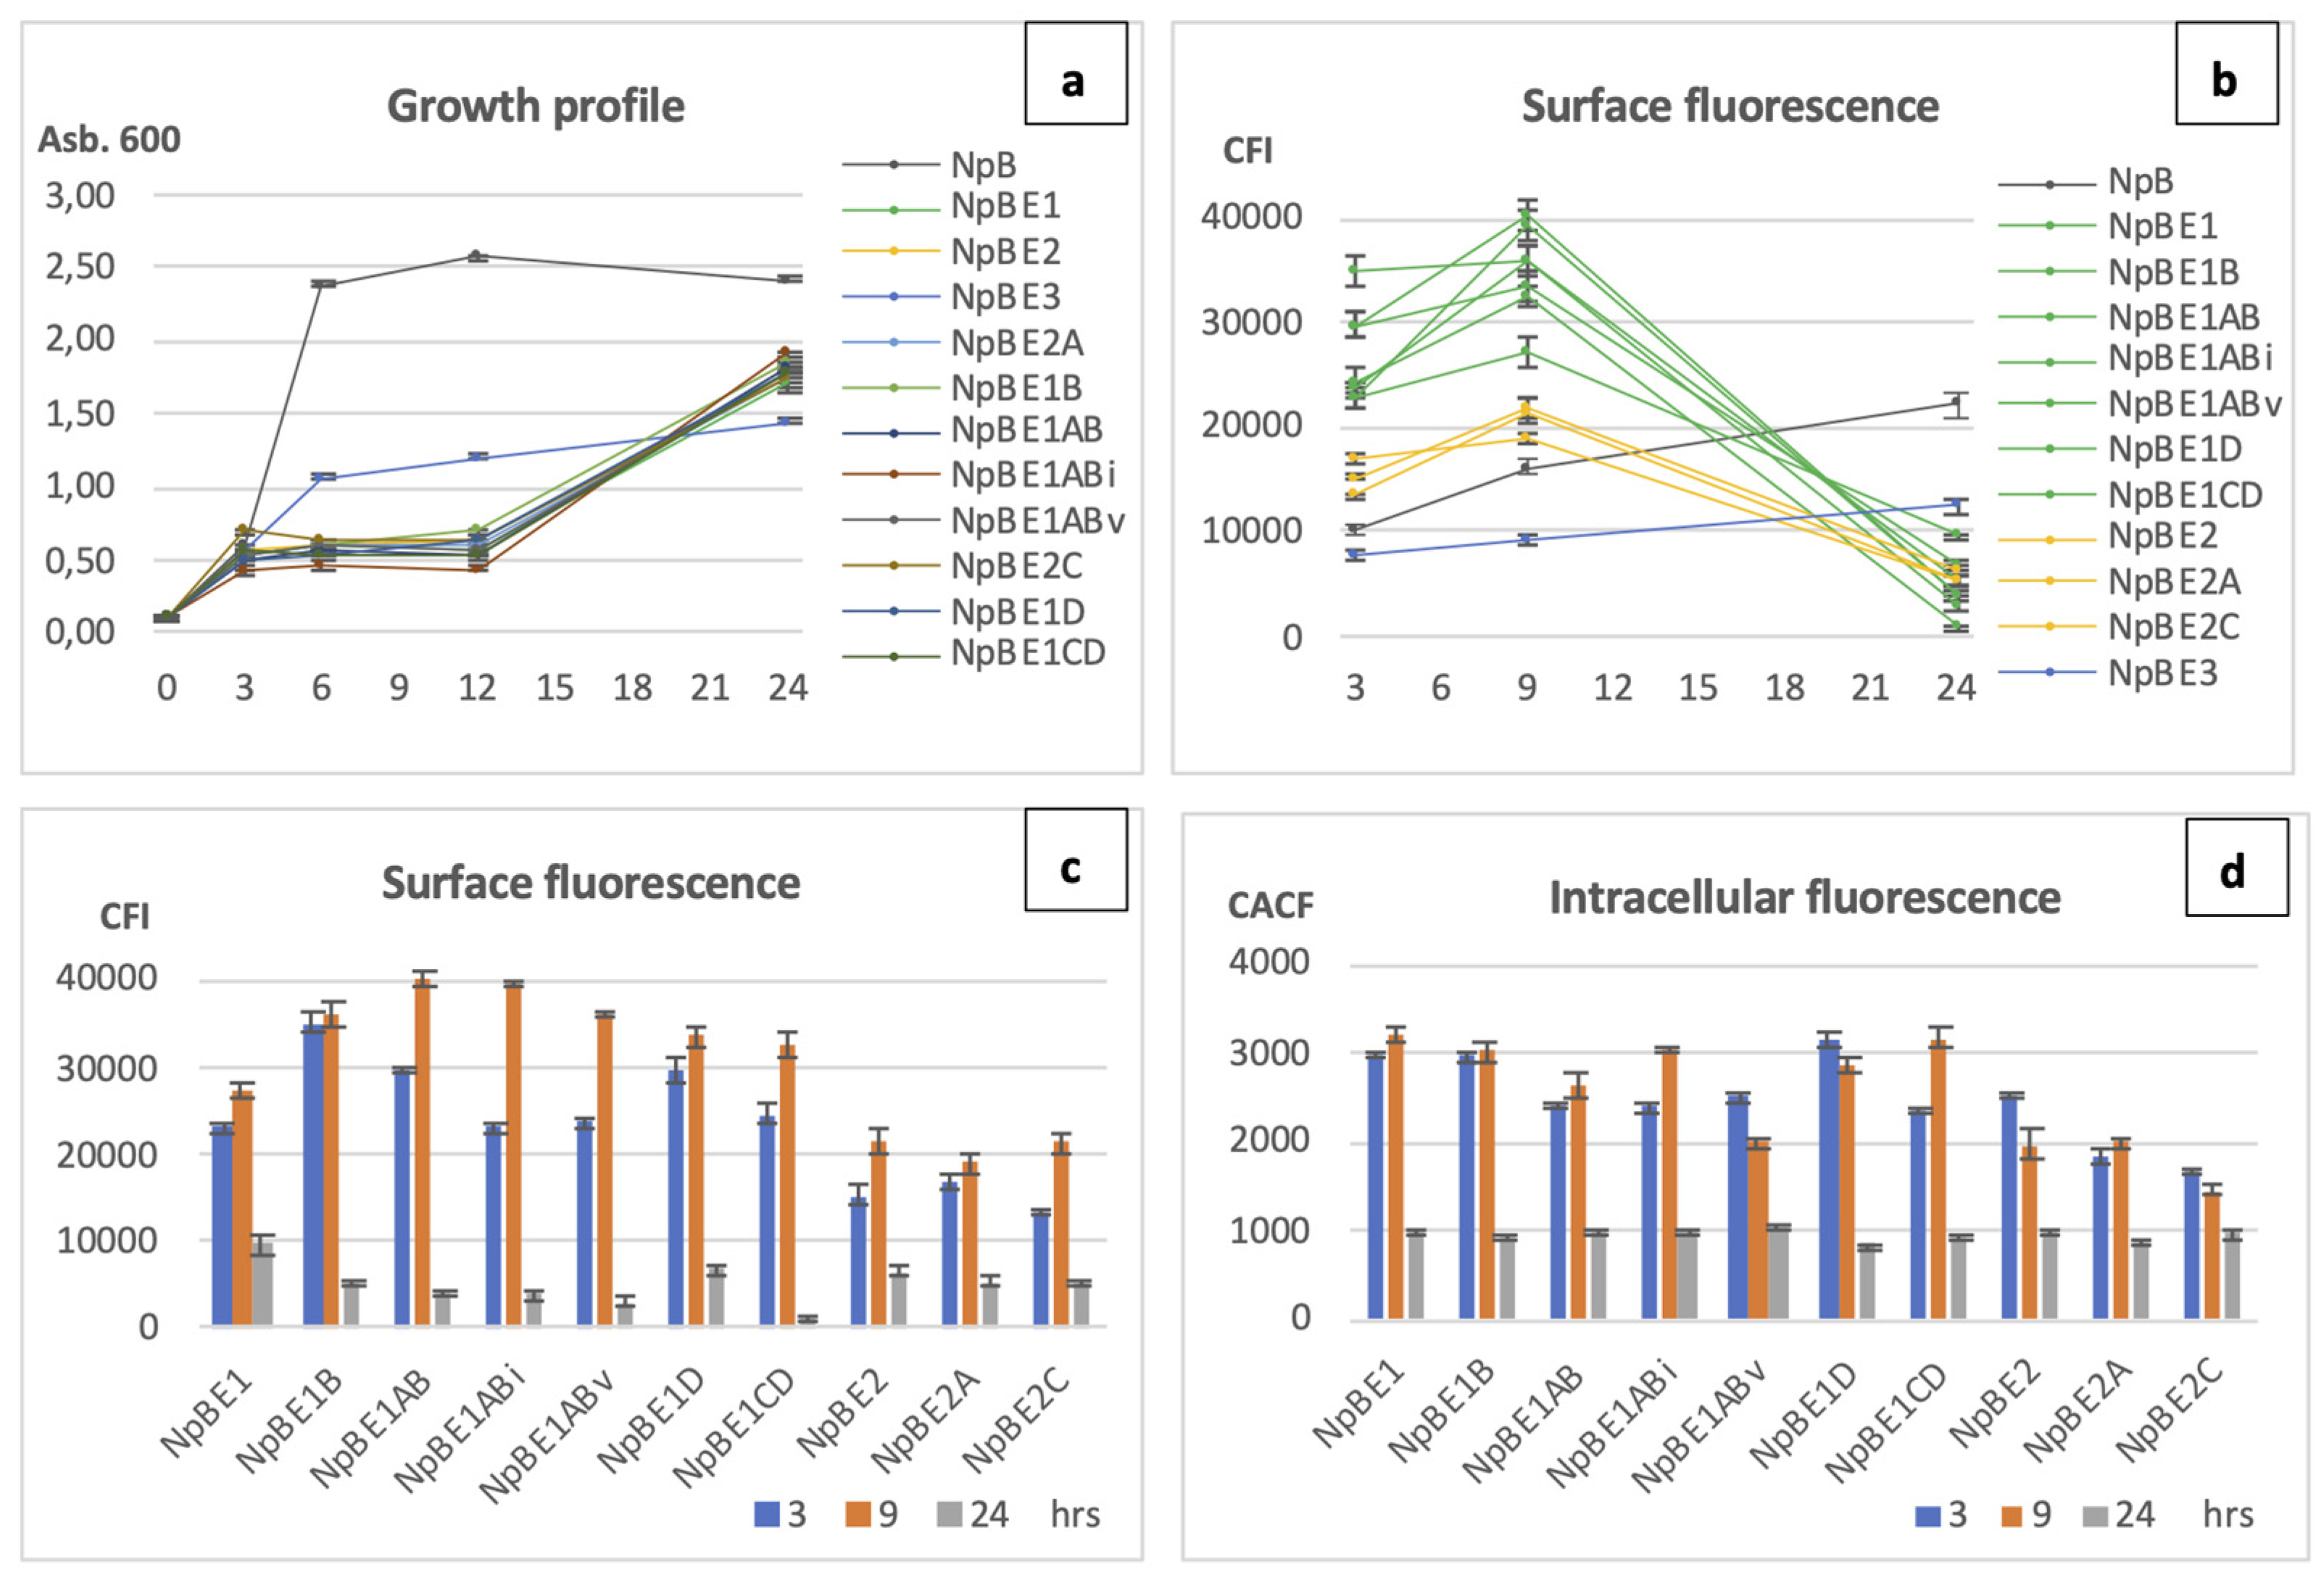
Figure 7.
Maps of plasmid constructs. (a) pNZ8150 with the gene for the membrane anchored protein BmpA. (b) pNZ8150 with the sequence encoding the first 126 N-terminal amino acids of BmpA fused with the gene for the heterologous oncoprotein E7 from HPV-16. (c) (d) truncated constructs of the insert from the plasmid in b, containing the first 66 N-terminal amino acids of BmpA, or only the first 26 amino acids (the signal peptide) of BmpA, and E7.
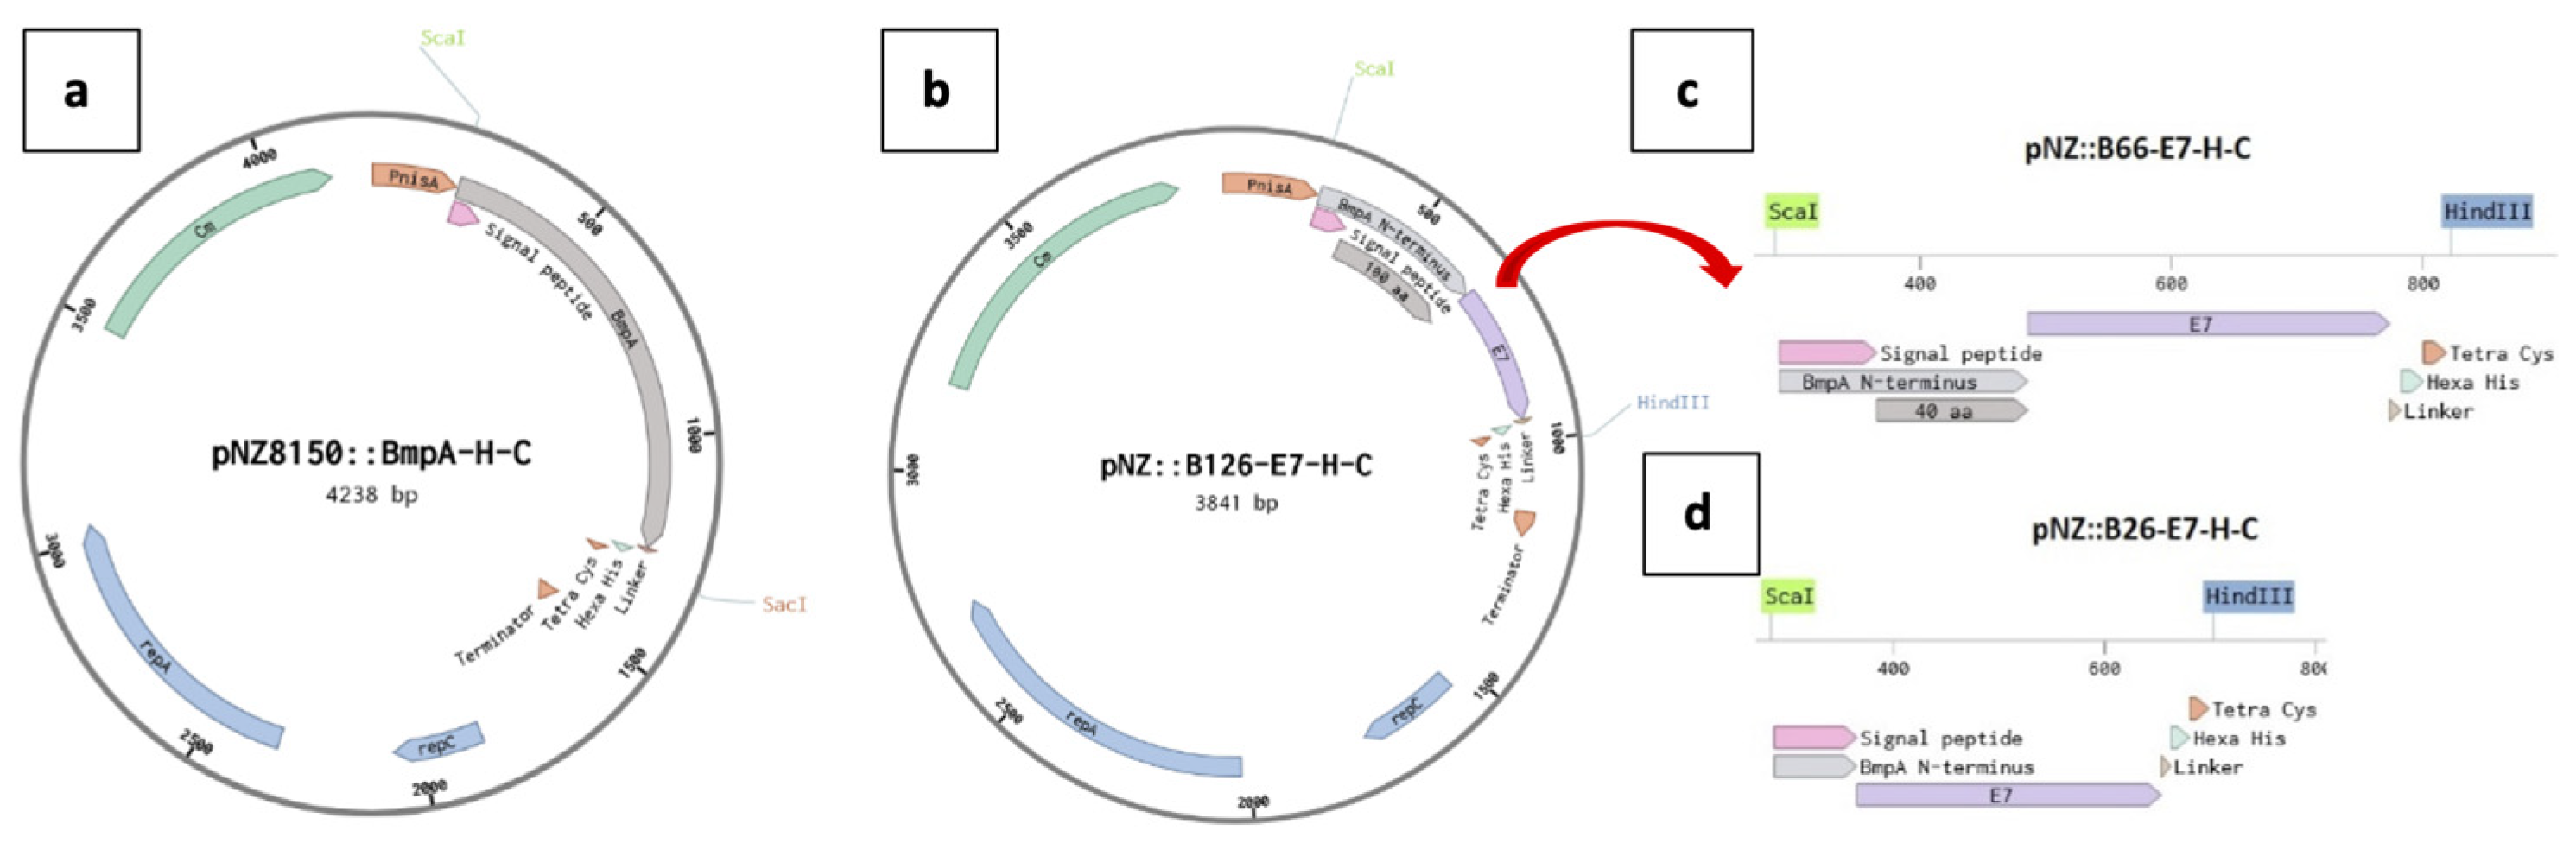

Table 1.
Computation of several physico-chemical parameters of proteins by ProtParam.
| Protein | AA | Mol. weight (Dalton) | Theor. pI (*) | Instability index (**) | Aliphatic index | GRAVY (***) |
| B | 366 | 38453 | 8.75 | 12.93 | 74.13 | -0.312 |
| E7 | 111 | 12219 | 5.31 | 47.53 | 83.42 | -0.132 |
| BE1 | 237 | 25595 | 6.43 | 34.10 | 74.56 | -0.297 |
| BE2 | 177 | 19018 | 6.03 | 41.82 | 85.42 | -0.076 |
| BE3 | 137 | 14868 | 6.02 | 45.99 | 91.82 | 0.055 |
| BE2A | 177 | 18931 | 5.85 | 42.30 | 86.55 | -0.030 |
| BE1B | 237 | 25494 | 6.69 | 31.91 | 75.40 | -0.252 |
| BE1AB | 237 | 25407 | 6.43 | 32.27 | 76.24 | -0.218 |
| BE1ABi | 237 | 25445 | 6.43 | 32.27 | 79.54 | -0.173 |
| BE1ABv | 237 | 25417 | 6.43 | 32.27 | 78.69 | -0.176 |
| BE2C | 177 | 18976 | 6.03 | 42.30 | 83.79 | -0.102 |
| BE1D | 237 | 25482 | 6.43 | 34.62 | 71.27 | -0.332 |
| BE1CD | 237 | 25441 | 6.43 | 34.98 | 70.04 | -0.352 |
(*) pI: Isoelectric point. Theoretical pI is based on primary sequence. At pI, the net charge of the proteins is zero. (**) Instability index: >40 is classified to be stable in test-tube condition. (***) GRAVY: Grand average of hydropathicity represents hydrophobicity value of a protein. It sums up Kyte-Doolittle’s hydropathy index of each amino acids and divides by peptide’s length. Positive GRAVY score determines that the protein is hydrophobic and vice versa [22,23].
Disclaimer/Publisher’s Note: The statements, opinions and data contained in all publications are solely those of the individual author(s) and contributor(s) and not of MDPI and/or the editor(s). MDPI and/or the editor(s) disclaim responsibility for any injury to people or property resulting from any ideas, methods, instructions or products referred to in the content. |
© 2024 by the authors. Licensee MDPI, Basel, Switzerland. This article is an open access article distributed under the terms and conditions of the Creative Commons Attribution (CC BY) license (http://creativecommons.org/licenses/by/4.0/).
Copyright: This open access article is published under a Creative Commons CC BY 4.0 license, which permit the free download, distribution, and reuse, provided that the author and preprint are cited in any reuse.


