
Submitted:
15 August 2024
Posted:
15 August 2024
You are already at the latest version
Abstract
With the significant annual increase in the market demand for biopesticides, the industrial production demand for predatory mites, which hold the largest market share among biopesticides, has also been rising.To achieve efficient and low energy consumption control of predatory mite breeding environmental parameters, accurate estimation of breeding environmental parameters is necessary. This paper collects and pre-processing hourly time-series data of temperature and humidity from industrial breeding environments. Time series prediction models such as SVR, LSTM, GRU, and LSTNet are applied to model and predict historical data of the breeding environment. Experiments validate that the LSTNet model is more suitable for such environmental modeling. To further improve prediction accuracy, the training data for the LSTNet model is enhanced using hierarchical clustering of time-series features. After augmentation, the root mean square error (RMSE) of temperature prediction decreased by 27.3%, and the RMSE of humidity prediction decreased by 32.8%, significantly improving the accuracy of multi-step predictions and providing substantial industrial application value.
Keywords:
time series clustering
; LSTNet
; greenhouse environmental parameter modeling
; temperature and humidity prediction
1. Introduction
With the vigorous promotion of green ecological agriculture, the market demand for biopesticides has significantly increased year by year. Among the various biopesticides that have been applied in the market in China, predatory mite-related products hold the largest market share. Therefore, the industrial production efficiency of predatory mites faces considerable challenges. In industrial-scale breeding and production activities of predatory mites, a large amount of energy is required to control environmental parameters such as temperature, humidity, and carbon dioxide concentration to adapt to the necessary conditions for mite development throughout their lifecycle. To achieve adaptive regulation of breeding environment parameters and solve the issue of uniform control within the breeding environment, precise modeling and prediction of these parameters are necessary.
Industrial-scale predatory mite breeding typically employs semi-enclosed greenhouse facilities. Many environmental variables, such as temperature and humidity, exhibit certain temporal sequences, correlations, periodicities, and seasonal patterns. Time series prediction models can be employed to model and predict breeding environment parameters, thereby enabling efficient and low-energy control of the industrial production environment parameters.
In recent years, researchers have proposed various time series methods for temperature and humidity prediction, including ARIMA, Support Vector Machines (SVM), Random Forests, and Artificial Neural Networks (ANN). These methods have been widely applied to temperature and humidity prediction in greenhouse environments. For example, Tsai et al. [1] used Random Forest combined with weather forecast data to predict soil temperature and moisture in greenhouses for 1 to 48 hours ahead. Chen et al[2]. combined ARIMA and Grey Prediction models to predict global average temperatures. Zeynoddin et al. [3] used a nonlinear elastic net to predict daily soil temperature. Choi et al. [4] proposed a model based on Multilayer Perceptrons (MLP) to predict air temperature and relative humidity for the next 10 to 120 minutes. Taki et al. [5] studied a model based on Radial Basis Function Networks to predict the temperature of air, soil, and plants.
Although these machine learning algorithms perform well in short-term predictions, their accuracy decreases in multi-step predictions. Traditional algorithms also face challenges when predicting multiple time points. To address this issue, researchers have started to use concepts from Recurrent Neural Networks (RNN) to incorporate time series data into their models to improve adaptability and performance. For example, Eraliev et al. [6] used an LSTM model to predict temperature, humidity, and CO2 in hydroponic greenhouses, showing good performance for short intervals but significant performance drops for longer intervals. Wu et al. [7] proposed a model based on deep spatial and temporal networks to predict the distribution and trend of temperature over regional scales for the next 3 to 6 hours. Guo et al. [8] effectively reduced temperature prediction errors by combining spatio-temporal attention with LSTM. Ahn et al. [9] compared the performance of Autoformer, LSTM, SegRNN, and DLlinear in predicting temperature, relative humidity, and CO2 concentration in greenhouse environments, with SegRNN showing superior performance. Wang and Chen[10] introduced the LSTNet model, which is based on spatio-temporal self-attention mechanisms and can adapt to different data patterns and prediction needs. However, the time series data of environmental parameters in predatory mite breeding environments exhibit various data variation patterns. Due to the unavoidable long lags in multi-step predictions, models often struggle to capture changes in data patterns, and single neural networks fail to achieve the required accuracy for practical applications.
To address these issues, this paper proposes an LSTNet model combined with hierarchical clustering of time series features to model and predict the breeding environment. This approach aims to improve the accuracy of environmental parameter predictions, providing decision-making support for low-carbon control of environmental parameters.
2. Data Acquisition and Pre-Processing
2.1. Data Acquisition
In this study, temperature and humidity data were collected from the predatory mite breeding industrial park operated by Yanxuan Biological Control Technology Co., Ltd., located in Minhou County, Fuzhou City, Fujian Province. Data collection was performed using temperature and humidity sensors, with five data collection points set up on the cultivation racks inside the breeding room, as shown in Figure 1. The accuracy of temperature and humidity collection was ±0.2°C and ±1% RH, respectively, with a time resolution of 1 hour. The data span from January 1, 2020, to December 31, 2022, with 80% of the data used for training, 10% for validation, and 10% for testing.
2.2. Data Processing
The raw data collected contains missing values and outliers, as shown in Figure 2. Firstly, the K-Nearest Neighbors (KNN) algorithm was used to remove outliers, employing the Euclidean distance as the distance metric. After removing the outliers, a Backpropagation (BP) neural network was used to fit the data and fill in the missing values, as shown in Figure 3. Additionally, to eliminate the impact of data dimensionality, the processed data was normalized.
2.3. Evaluating Indicator
The main focus of environmental parameter prediction in this study is on the temperature and humidity of the breeding environment. The Root Mean Square Error (RMSE) and Mean Absolute Error (MAE) are used to evaluate prediction errors, with RMSE being more sensitive to outliers. The correlation coefficient (r) indicates the degree of correlation between the predicted results and the actual values, effectively assessing the accuracy of the model. Therefore, RMSE, MAE, and r are selected as evaluation metrics to assess the predictive capability of the model. The formulas are as follows:
3. Time Series Prediction Methods
Time series prediction methods are used to forecast future values of data sequences that change over time. These methods mainly include classical statistical methods, machine learning methods, and deep learning methods. Classical statistical methods include the Autoregressive Integrated Moving Average (ARIMA), Seasonal ARIMA (SARIMA), and Exponential Smoothing (ETS). Machine learning methods include Support Vector Regression (SVR), Random Forest Regression, and Gradient Boosting Regression. Deep learning methods include Long Short-Term Memory (LSTM), Gated Recurrent Units (GRU), and one-dimensional Convolutional Neural Networks (1D-CNN).
In this paper, a Long-Short Term Time Series Network is employed to predict breeding environment parameters. The introduction of a multi-head attention mechanism enhances the ability to capture dependencies across different time steps. Additionally, temporal feature clustering is combined to improve the accuracy of multi-step predictions.
3.1. Long- and Short-Term Time Series Networks
LSTNet model is a fusion neural network model designed for time-series prediction, combining Convolutional Neural Network (CNN), Gated Recurrent Unit (GRU), and attention mechanisms. The model architecture comprises a CNN module, a recurrent module, a recurrent skip module, and a Highway module.
Figure 4.
LSTNet network architecture.
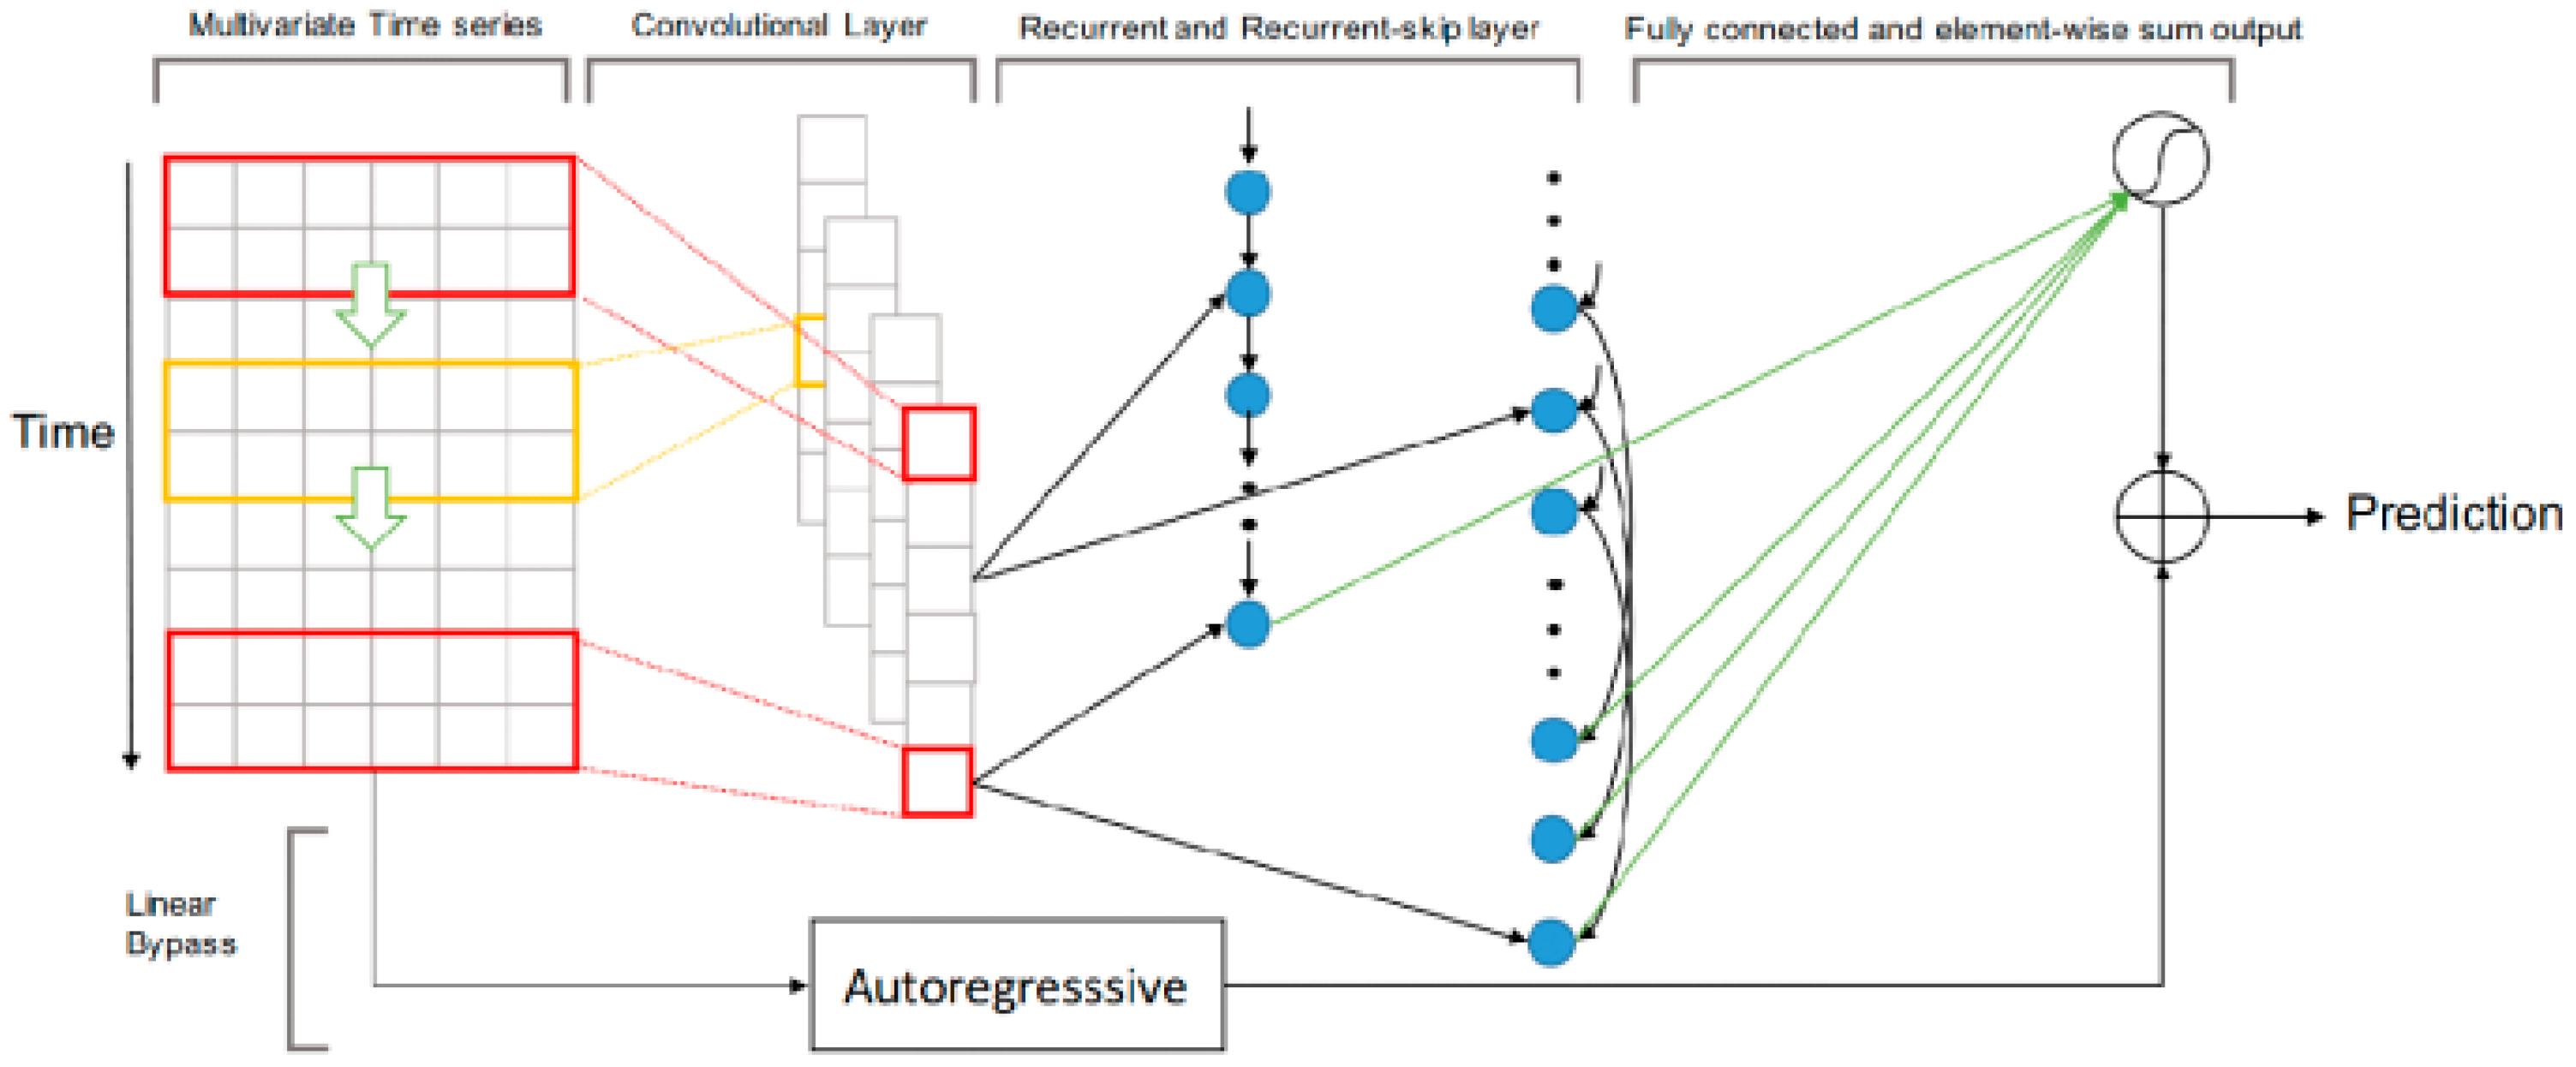
The convolutional module serves as the first layer in the LSTNet model, constituting a convolutional neural network without pooling layers [11]. Within the LSTNet model, the convolutional module plays a crucial role in extracting short-term patterns and local dependencies from time series data. Through convolutional operations, this module achieves the extraction of local features.
The recurrent module utilizes Gated Recurrent Units (GRU) to address the long-term dependency relationships within time series data. Leveraging the gate mechanisms of GRU, it selectively memorizes and forgets past information, facilitating the modeling of long-term dependency relationships in time series data.
The recurrent skip module aims to overcome the issue of gradient vanishing that traditional GRU and LSTM recurrent layers may encounter when dealing with very long-term dependency relationships. This module exploits the periodic patterns present in time series data and extends the temporal span of information flow through skip connections. The introduction of periodic information helps capture long-term dependency relationships in the data, thereby improving the optimization process of the model.
The highway module is employed to address the issue of input signal scale variations. It decomposes the final prediction into linear (AR model) and nonlinear components. This approach enables the LSTNet model to handle scale variations in real-world data more effectively, consequently enhancing prediction accuracy.
The LSTNet model excels at simultaneously capturing both long-term and short-term dependency relationships in time series data. Through the integration of convolutional layers, gated recurrent units, and attention mechanisms, the model effectively models local features, long-term dependency relationships, and importance in the data. This combination results in outstanding performance of the LSTNet model in time series prediction tasks, especially for complex nonlinear time series data [12].
3.2. Multi-Head Attention Mechanism
Multi-head attention is an extension of the self-attention mechanism. It enhances the model's ability to express and capture global information by computing multiple attention heads in parallel, with each head focusing on different aspects of the input sequence [13].
The multi-head attention mechanism performs linear transformations on the input sequence to obtain the queries (Q), keys (K), and values (V) for multiple attention heads. The linear transformations are as follows:
where is the input sequence, 、、 are the weight matrices for the i-th attention head, n is the number of attention heads.Each attention head independently computes dot product attention, which is to compute the dot product of the query and the key, scale it, apply softmax, and then weighted sum it:[14]
Concatenate the output of all headers together:
Perform a linear transformation on the concatenated result to get the final output:
In the LSTNet model, to fully leverage the skip-layer mechanism, it is necessary to set a reasonable skip connection parameter based on the periodicity of the time series. However, the multi-head attention mechanism can capture dependencies between different time steps in the input sequence in parallel. Each attention head focuses on different aspects of the input sequence. By introducing the multi-head attention mechanism into the LSTNet model, it is possible to capture both long-term and short-term dependencies without the need to set the skip parameter.
Furthermore, multi-head attention provides a dynamic weighting mechanism, enabling the model to flexibly select the most useful information for prediction. This enhances prediction accuracy by allowing the model to dynamically adjust and emphasize the most relevant aspects of the input data.
3.3. Temporal Feature Hierarchical Clustering (TSFHC)
Temporal feature hierarchical clustering is a method used for clustering time series data. This approach combines the concepts of temporal features and hierarchical clustering, aiming to group time series with similar data variation patterns into the same category [15].
The main idea of this method is to transform the time series data into feature vectors and then use a hierarchical clustering algorithm to cluster these feature vectors. Various techniques can be employed to extract multiple features of the time series during the transformation process, such as statistical features, frequency domain features, or time domain features. The similarity or distance between feature vectors is then calculated as a clustering metric. Using a hierarchical clustering algorithm, a dendrogram (a tree-like structure) is constructed, which ultimately divides the time series into different clusters. The clustering process is illustrated in Figure 5.
The time series with different data change patterns are divided into different data sets through a hierarchical clustering algorithm based on time series features, and the LSTNet model is trained separately using the data of each data set. Each LSTNet model obtained will have excellent prediction performance for the data with the corresponding data change pattern.
4. Temperature and Humidity Estimation Based on TSFHC-LSTNet
4.1. Comparison of Modeling and Prediction Effects of Commonly Used Models
In this study, SVR, LSTM, GRU, and LSTNet models were used to model and predict temperature and humidity parameters in the breeding environment of predatory mites. The models were programmed in Python and based on the PyTorch deep learning framework. Multiple evaluation metrics were used to compare model performance. The computer configuration was as follows: CPU: i5-13600KF; GPU: 4060Ti; Memory: 32GB; Environment: Python 3.11, PyTorch 2.1.0.
To compare the performance of the SVR, LSTM, GRU, and LSTNet models, experiments were set up to predict air temperature and humidity with prediction steps of 1, 3, 6, and 24. The prediction task in the experiments was defined as using hourly historical temperature and humidity data from the past three days to predict the temperature and humidity for the next 1, 3, 6, and 24 hours. The evaluation metrics for the prediction results of the four models and four steps for temperature and humidity are shown in Table 1, Table 2, Table 3, Table 4, Table 5 and Table 6.
As observed in Figure 6, the LSTNet model exhibits lower RMSE and MAE metrics for temperature and humidity predictions at 1, 3, 6, and 24 steps compared to other models. This indicates that the LSTNet model has the smallest error between the predicted and actual values in the temperature and humidity prediction tasks.
As shown in Figure 7 and Figure 8, to visually and accurately understand the prediction performance of each model, a sequence length of 168 was extracted from the test data, and the prediction results were plotted to compare the prediction results of the four models in the one-step temperature and humidity prediction task. Each curve in the figures represents the model's predicted values over time. By visually inspecting the charts, the degree of consistency between each model's predictions and the actual values can be observed.
The comparison charts provide a visual representation of the predicted and actual values for each model, allowing for a comprehensive evaluation of their predictive capabilities.
In the comparison charts of the one-step temperature and humidity prediction results for the four models, the LSTNet model performs the best, with minimal noticeable errors between the predicted and actual values. Additionally, it can be observed that the LSTNet model more accurately captures relevant details compared to other models, especially when there is a certain change in the actual data trend. The autoregressive component in the LSTNet model effectively captures the direction and scale of data changes, significantly improving prediction accuracy. In contrast, the errors of other models increase significantly when the data trend changes.
By comparing the performance of the four models in the prediction tasks at four different steps, it is evident that the LSTNet model is more suitable for modeling and predicting temperature and humidity data in the breeding environment of predatory mites. However, in multi-step prediction tasks, the LSTNet model exhibits larger prediction errors for time series containing multiple data patterns due to the lag effect of the input data. Considering the introduction of time series clustering methods can improve the model's adaptability to different data patterns.
4.2. Temperature and Humidity Estimation Based on TSFHC-LSTNet
In the time series of temperature and humidity in the breeding environment of predatory mites, there are multiple data variation patterns. In multi-step prediction tasks for temperature and humidity, when the data trend and amplitude, i.e., the data variation pattern, change, a single LSTNet model finds it difficult to identify the shift in data variation patterns based solely on the two variables of temperature and humidity. Instead, it maintains the original data variation pattern for predicting temperature and humidity, and the predicted results resemble the most recent cycle data in the input sequence, leading to significant prediction errors, as shown in Figure 9.
Note: Figure 10 shows the estimated temperature and humidity values for December 29, 2023 using hourly temperature and humidity data from December 21, 2023 to December 28, 2023.
In this study, feature vectors corresponding to short sequences were constructed by calculating the mean, variance, and fifth-order polynomial fitting coefficients of the temperature and humidity sequences. The mean and variance represent the level and dispersion degree of the sequence values, respectively, while the polynomial fitting coefficients can represent the trend and amplitude of data changes to a certain extent.
Since temporal feature hierarchical clustering can divide the dataset into multiple subsets according to different data variation patterns, this can result in a smaller amount of data in each subset, affecting the predictive performance of the LSTNet model. Therefore, a larger amount of data is required during clustering. Temporal feature hierarchical clustering was performed using temperature and humidity data from Fuzhou City from 2018 to 2023. Agglomerative hierarchical clustering was used, and based on the dendrogram of the clustering results, an appropriate threshold was selected to divide the data into eight clusters, constructing corresponding datasets.
The LSTNet model was then used to train on the data from these eight clusters, with each dataset divided into training, validation, and test sets in a ratio of 8:1:1. The results are shown in the table below.

Table 7.
TSFHC-LSTNet temperature estimation index.
| Cluster1 | Cluster2 | Cluster3 | Cluster4 | Cluster5 | Cluster6 | Cluster7 | Cluster8 | total | |
|---|---|---|---|---|---|---|---|---|---|
| RMSE | 1.00 | 0.89 | 1.57 | 1.74 | 1.68 | 2.17 | 2.11 | 2.10 | 1.60 |
| MAE | 0.79 | 0.67 | 1.29 | 1.42 | 1.33 | 1.73 | 1.62 | 1.68 | 1.20 |
| r | 0.9601 | 0.9179 | 0.8248 | 0.8883 | 0.7670 | 0.6745 | 0.9118 | 0.9327 | 0.9746 |
| R2 | 0.8565 | 0.8230 | 0.5230 | 0.7826 | 0.3921 | 0.1269 | 0.8006 | 0.8347 | 0.9469 |
Table 8.
TSFHC-LSTNet humidity estimation index.
| Cluster1 | Cluster2 | Cluster3 | Cluster4 | Cluster5 | Cluster6 | Cluster7 | Cluster8 | total | |
|---|---|---|---|---|---|---|---|---|---|
| RMSE | 4.20 | 5.06 | 3.49 | 4.13 | 4.53 | 5.73 | 5.32 | 4.26 | 4.51 |
| MAE | 3.19 | 3.91 | 2.65 | 3.16 | 3.18 | 4.46 | 4.07 | 3.18 | 3.37 |
| r | 0.9277 | 0.9259 | 0.8398 | 0.8937 | 0.9031 | 0.9542 | 0.9448 | 0.9538 | 0.9366 |
| R2 | 0.8312 | 0.8279 | 0.6548 | 0.7872 | 0.7780 | 0.9028 | 0.8858 | 0.9002 | 0.8639 |
To study the difference in model performance before and after data enhancement, the temperature and humidity time series from 2018 to 2023 were directly used as the dataset, with 2023 data serving as the test set. The LSTNet model was trained with a prediction step of 24 steps. The test set results for temperature prediction had an RMSE of 2.2 and an MAE of 1.58, while the humidity prediction results had an RMSE of 6.71 and an MAE of 4.9.
Compared to the single LSTNet model, the TSFHC-LSTNet model (Temporal Sequence Feature Hierarchical Clustering with LSTNet) showed significant improvement in prediction accuracy. The temperature prediction RMSE decreased by 27.3%, and the MAE decreased by 24.1%. Tshe humidity prediction RMSE decreased by 32.8%, and the MAE decreased by 31.2%. These results indicate a significant improvement in prediction accuracy after clustering and modeling.
Using the TSFHC-LSTNet model can significantly reduce the prediction errors caused by changes in data variation patterns. As shown in Figure 10, in the temperature prediction on December 29, 2023, the TSFHC-LSTNet model achieved an MAE of 1.81, which is a 39% reduction compared to the MAE of 2.97 from the single LSTNet model.
In situations where the data variation patterns change less, the TSFHC-LSTNet model still outperforms the LSTNet model. For example, as shown in Figure 11, the temperature prediction results on July 26, 2023, demonstrate that the TSFHC-LSTNet model achieved an MAE of 0.53, which is a 15.9% reduction compared to the MAE of 0.63 from the LSTNet model.
Similar to temperature prediction, as shown in Figure 12, the humidity prediction results on December 26, 2023, indicate that the single LSTNet model had a significant error, with an MAE of 8.56. In contrast, the TSFHC-LSTNet model achieved an MAE of 4.91, a reduction of 42.6% compared to the LSTNet model. As illustrated in Figure 13, the humidity prediction results on June 20, 2023, showed that the LSTNet model had a certain prediction error, with an MAE of 2.95, while the TSFHC-LSTNet model achieved an MAE of 1.59, a reduction of 46.1% compared to the LSTNet model.
In summary, using the LSTNet model based on temporal feature hierarchical clustering can significantly reduce the prediction errors in multi-step temperature and humidity prediction tasks compared to a single LSTNet model.
5. Energy Savings Estimation and Validation
Currently, industrial-scale predatory mite breeding facilities use a small closed-loop fixed parameter control method, integrating a single control room with independent third-party equipment. Due to the significant lag in breeding environment parameters, the system control tends to overshoot to ensure timely stability. This results in a narrower set range of breeding environment parameters compared to the actual adaptive range, ensuring the biological activity and adaptability throughout the lifecycle of the breeding process.
Accurate environmental temperature predictions can optimize the temperature control strategies in breeding environments, achieving energy consumption optimization for environmental parameter regulation. By predicting external temperature changes and adjusting indoor environment parameter settings accordingly, significant reductions in energy consumption of equipment such as air conditioners can be achieved. For example, using pre-cooling/pre-heating strategies, cooling/heating equipment can be turned on or off in advance or control parameters can be optimized during significant external temperature changes. Load distribution can be optimized by reasonably distributing cooling/heating loads based on predicted temperatures, reducing the increased energy consumption caused by frequent equipment starts and stops. The project team, after analyzing the existing equipment situation of the company and communicating with the company, chose to drive the corresponding equipment based on changes in predicted environmental parameters on the existing control system, achieving energy-saving by ensuring equipment operates only when necessary.
Theoretical Calculation:In production practice, due to the large time lag characteristic of environmental temperature, a certain control margin is usually reserved in the actual temperature control process. Taking the breeding of Amblyseius cucumeris as an example, its acceptable temperature range is 15℃-30℃, typically set to 18℃-27℃in actual temperature control. Using a temperature control strategy based on predicted environmental temperature values can improve temperature control accuracy, allowing the temperature control range to be set to 15.2℃-29.8℃, reducing equipment operating time and electrical energy consumption.
Taking a breeding room with a length, width and height of as an example, the reduced power consumption is estimated, as shown in Figure 14. The reduced power consumption includes the additional cooling capacity required to increase the temperature from 29.8℃ to 27℃, and the additional heating capacity required to increase the temperature from 15.2℃ to 18℃.
The additional cooling/heating capacity provided is approximately the heat energy of the heat exchange between the culture room and the outside world:
where is the room wall area, is the temperature difference, is the wall thermal conductivity, is the inner surface thermal resistance, is the outer surface thermal resistance, and is the wall material thermal resistance.
When the ambient temperature is greater than 29.8℃ or less than 15.2℃, is 2.8℃, . When the ambient temperature is between 27℃-29.8℃ or between 15.2℃-18℃, is 1.4℃, .
The efficiency of air conditioners is usually expressed in terms of Coefficient of Performance (COP). Assuming the COP of an air conditioner is 3.4, it means that for every 1 kWh of electricity consumed, 3.4 kWh of cooling capacity can be provided.
According to the temperature of Fuzhou in 2023, there are 642 hours with a temperature greater than 29.8℃, 935 hours with a temperature between 27℃ and 29.8℃, 2576 hours with a temperature less than 15.2℃, and 863 hours with a temperature between 15.2℃ and 18℃. Therefore, by adopting a temperature control strategy based on the estimated ambient temperature, a culture room can save 1561.989kWh of electricity throughout the year.
The project team conducted comparative experiments in two groups of adjacent breeding rooms from July 1, 2023 to July 15, 2023. The actual measurement of the breeding enterprise showed that the breeding room using the temperature control strategy combined with the estimated temperature consumed 72.3kWh of electricity, while the control breeding room consumed 138.3kWh of electricity, saving 66kWh of electricity, and the energy saving ratio was 47.7%. May be due to the fact that the influence of the airtightness of the breeding room on the heat exchange was not considered, which was 2.1kWh different from the theoretical calculation, basically verifying the carbon reduction effect.
6. Conclusions
This study used multiple time series prediction models to model and estimate the parameters of the predatory mite breeding environment. Among them, the LSTNet model outperformed other models in multiple evaluation indicators of multiple time step predictions in the predatory mite breeding environment parameter prediction task, and its short-term prediction was basically consistent with the actual value. The RMSE, MAE and correlation coefficient of the temperature single-step prediction were 0.28℃, 0.2℃ and 99.8% respectively. The RMSE, MAE and correlation coefficient of the relative humidity single-step prediction were 2.08%, 1.28% and 99.29% respectively. The LSTNet model has a strong prediction ability in the short-term prediction task of the predatory mite breeding environment parameters.
This paper proposes an LSTNet model that combines hierarchical clustering with temporal features. The data set is enhanced through a hierarchical clustering algorithm based on temporal features. Data with similar data change patterns are concentrated in the same data set, which improves the multi-step estimation accuracy of the LSTNet model. In the 24-step estimation task, compared with the single LSTNet model, the RMSE of temperature estimation is reduced by 27.3%, MAE is reduced by 24.1%, and the RMSE of humidity estimation is reduced by 32.8%, MAE is reduced by 31.2%.
This study aims to estimate future aquaculture environment parameters based on historical data for the study of the regulation strategy of predatory mite aquaculture environment parameters. The adoption of a temperature control strategy for the aquaculture environment based on temperature estimation can effectively reduce energy consumption. In terms of temperature control alone, a culture room is expected to save 1562kWh of electricity per year.
Author Contributions
Conceptualization, Y.M.; Data curation, H.L.; methodology, H.L.; software, H.L.; validation, H.L., WJ.C. ; formal analysis, H.L.; investigation, H.L., Y.M.; resources, , Y.M.; writing—original draft preparation, H.L.; writing—review and editing, Y.M., H.L.; visualization, WJ.C; supervision, Y.M., W.C., Q.W.; project administration, Y.M., W.C., Q.W; funding acquisition, Y.M.,Q.W. . All authors have read and agreed to the published version of the manuscript.
Funding
This study is funded by the Fujian Provincial Department of Science and Technology, project number is KY030240, Research and application of complete sets of equipment for industrial cultivation of predatory mites in pollution-free agriculture
Conflicts of Interest
The authors declare no conflicts of interest.
References
- Tsai,Y.Z.,Hsu,K.S.Wu,H.Y. Lin,S.IL. Yu,H.L..Huang,K.T. Hu,M.C. Hsu,S.Y. Application of random forest and icon modelscombined with weather forecasts to predict soil temperature and water content in a greenhouse.Water 2020;12(4):1176. [CrossRef]
- Chen,X..Jiang, Z..Cheng,H. Zheng,H..Cai, D.,Feng,Y..A novel global average temperature prediction model——based on gm-arimacombination model. Earth Science Informatics 2024;17(1):853-866. [CrossRef]
- Zeynoddin,M. Ebtehaj,I., Bonakdari, H.. Development of a linear based stochastic model for daily soil temperature prediction:One stepforward to sustainable agriculture.Computers and Electronics in Agriculture 2020;176:105636. [CrossRef]
- Choi,H.,Moon, T..Jung.D., Son, J.Prediction of air temperature and relative humidity in greenhouse via a mulilayer perceptron usingenvironmental factors. protected hort plant fac 28:95-103. doi 2019;10. [CrossRef]
- Taki, M.,Mehdizadeh,S.A..Rohani,A., Rahnama,M., Rahmati-Joneidabad,M. Applied machine learning in greenhouse simulation; newapplication and analysis. Information processing in agriculture 2018;5(2):253-268. [CrossRef]
- Eraliev, O., Lee, C.H.. Performance analysis of time series deep learning models for climate prediction in indoor hydroponic greenhouses atdifferent time intervals. Plants 2023;12(12):2316. [CrossRef]
- Wu,S., Fu,F.,Wang,L.,Yang,M. Dong,S.,H,Y. Zhang, Q, Guo,R.Short-term regional temperature prediction based on deepspatial and temporal networks. Atmosphere 2022;13(12):1948. [CrossRef]
- Guo, Y.Zhang,S.. Yang, J ,Yu, G., Wang,Y.. Dual memory scale network for multi-step time series forecasting in thermal environmentof aquaculture facility: A case study of recirculating aquaculture water temperature. Expert Systems with Applications 2022;208:118218. [CrossRef]
- Ahn,J.Y.,Kim,Y.,Park,H., Park,S.H, Suh,H.K. Evaluating time-series prediction of temperature, relative humidity, and co2 in thegreenhouse with transformer-based and rnn-based models. Agronomy 2024;14(3):417. [CrossRef]
- Wang,D. Chen,C. Spatiotemporal self-attention-based Istnet for multivariate time series prediction. International Journal of lntelligentSystems 2023;2023(1):9523230.
- Lai,G.; Chang,W.C, Yang,Y., Liu,H. Modeling long-and short-term temporal patterns with deep neural networks. In: The 41stinternational ACM SIGIR conference on research & development in information retrieval.2018.p.95-104. [CrossRef]
- Liu, R..Chen, L..Hu W.,Huang, Q..Short-term load forecasting based on lstnet in power system. International Transactions on ElectricalEnergy Systems 2021;31(12):e13164. [CrossRef]
- Canizo, M., Triguero, I., Conde, A., & Onieva, E. (2019). Multi-head CNN–RNN for multi-time series anomaly detection: An industrial case study. Neurocomputing, 363, 246-260. [CrossRef]
- Vaswani, Ashish, et al. "Attention is all you need." Advances in neural information processing systems 30 (2017).
- Wang, X., Smith, K., & Hyndman, R. (2006). Characteristic-based clustering for time series data. Data mining and knowledge Discovery, 13, 335-364. [CrossRef]
Figure 1.
3D Simulation Diagram of the Breeding Room.
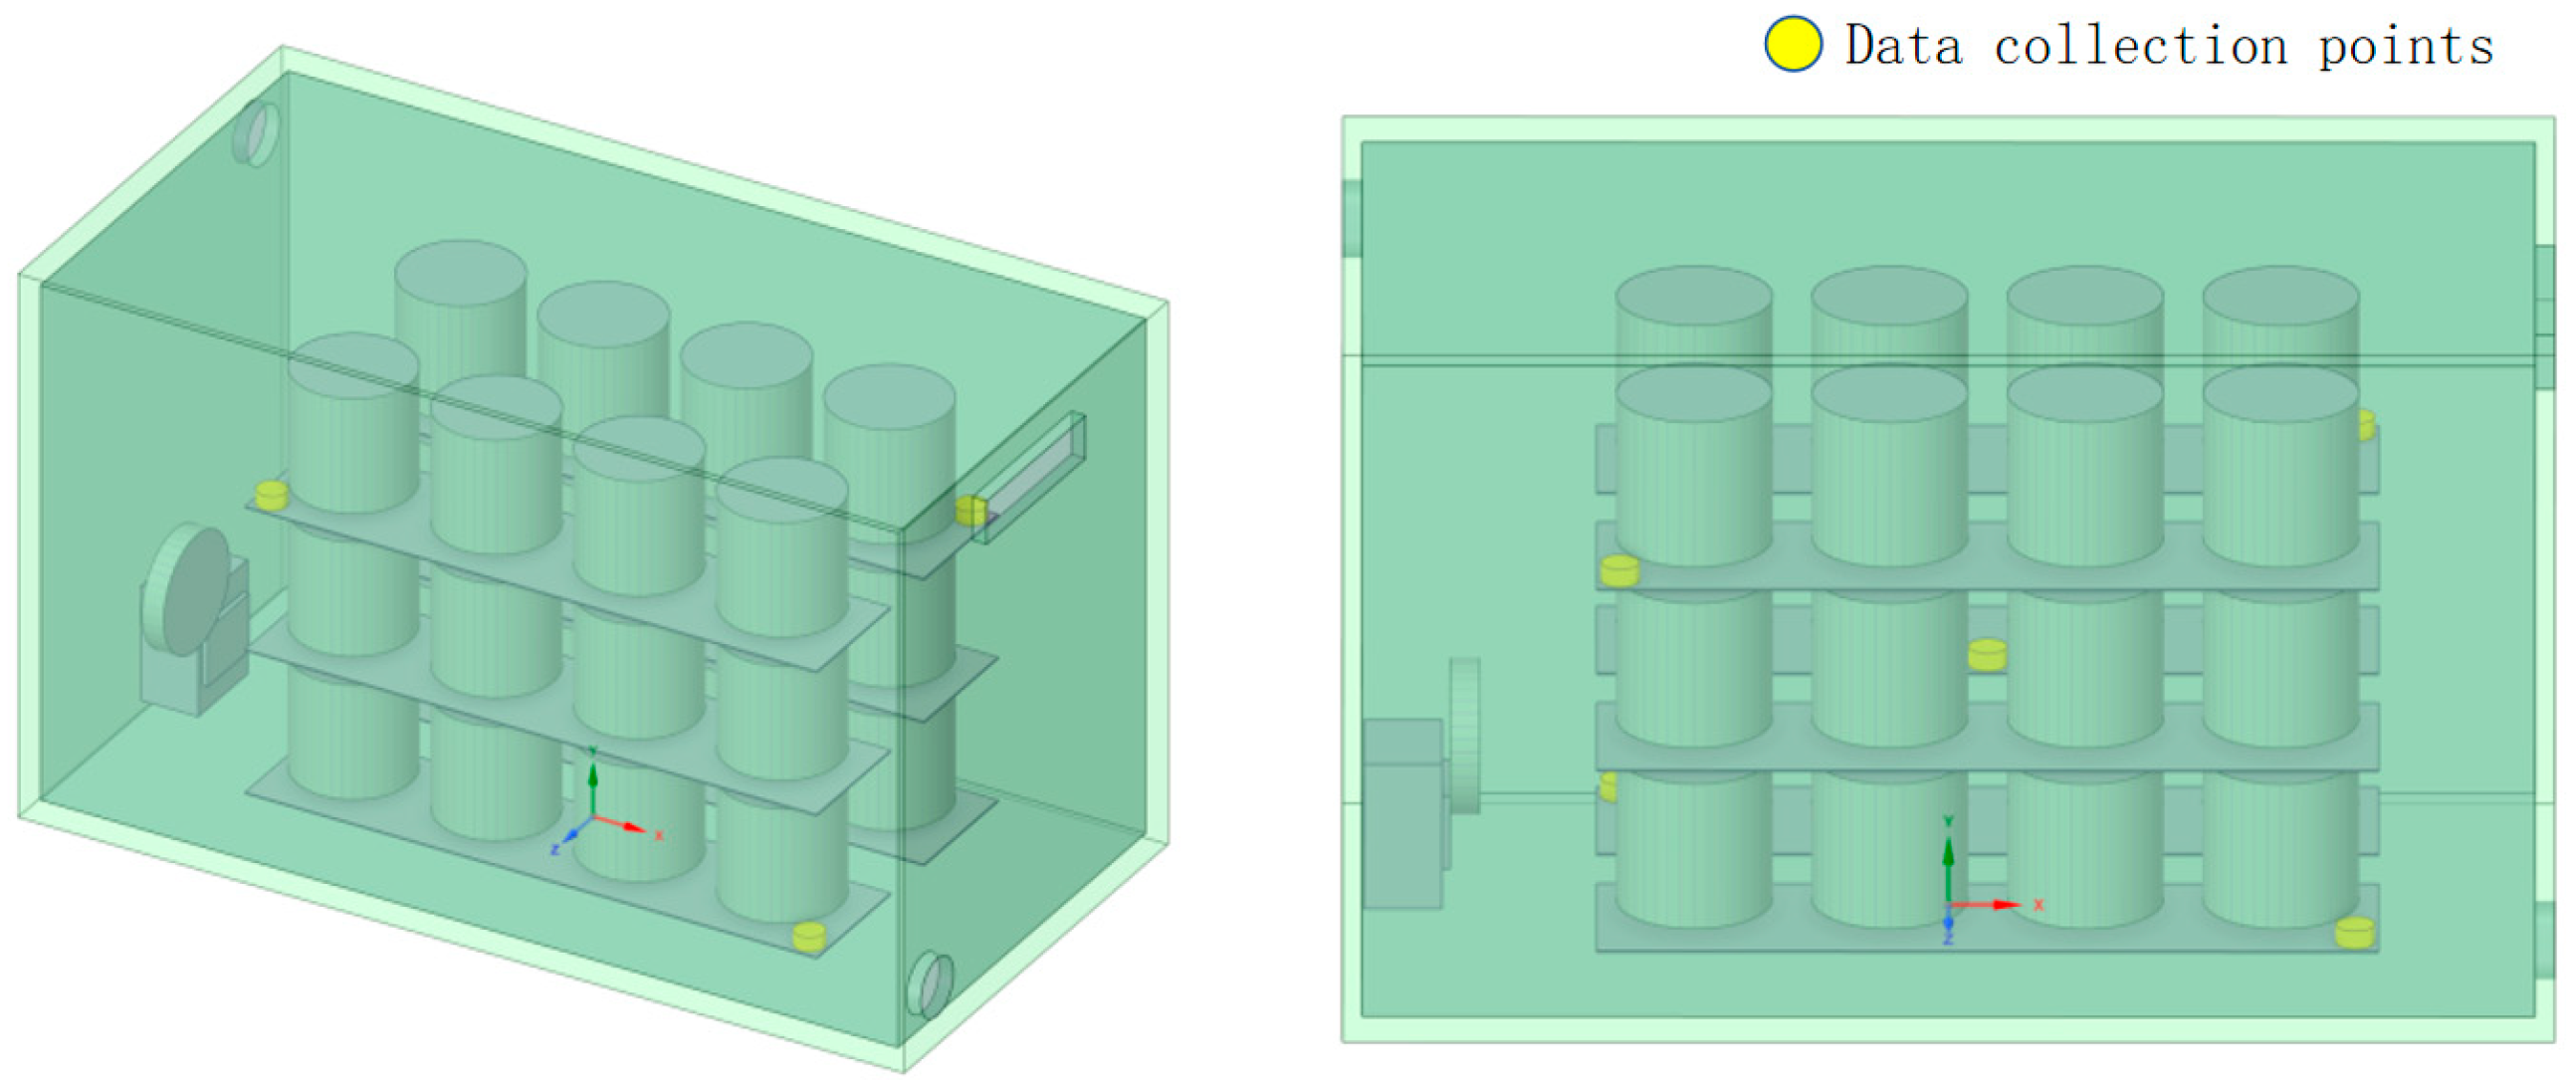
Figure 2.
Raw Data Chart.
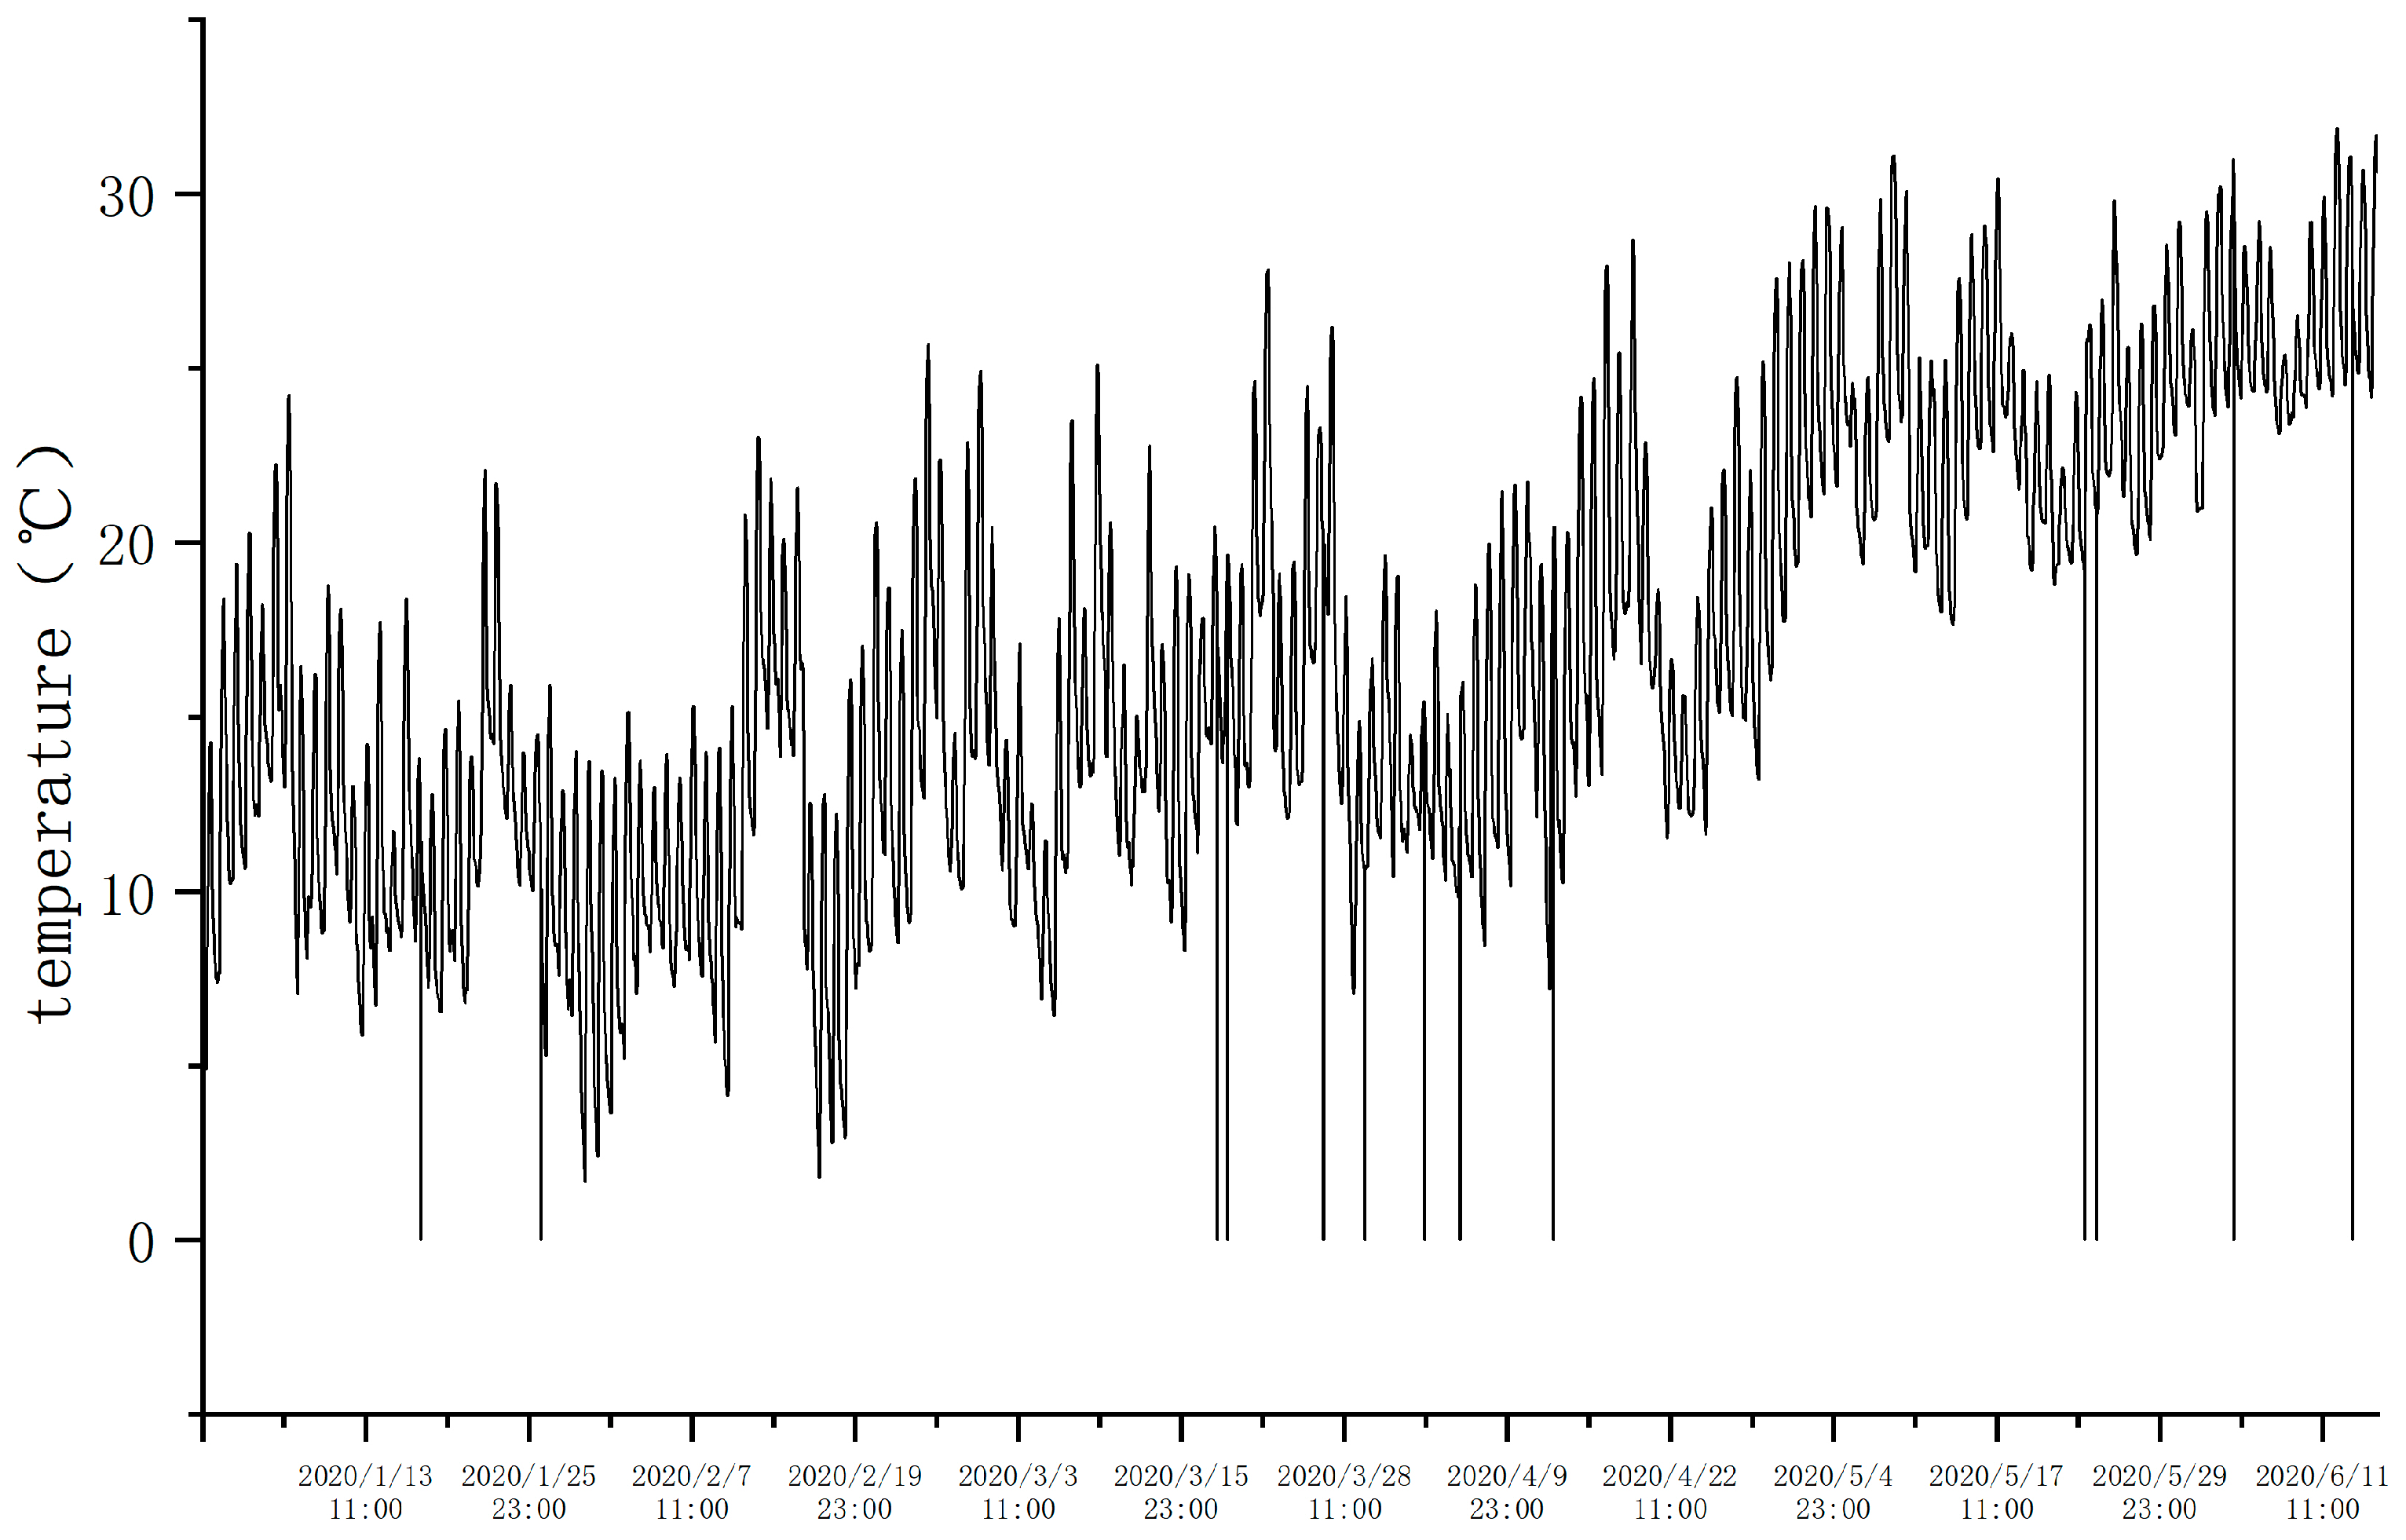
Figure 3.
Data After Outlier Removal and Missing Value Imputation.
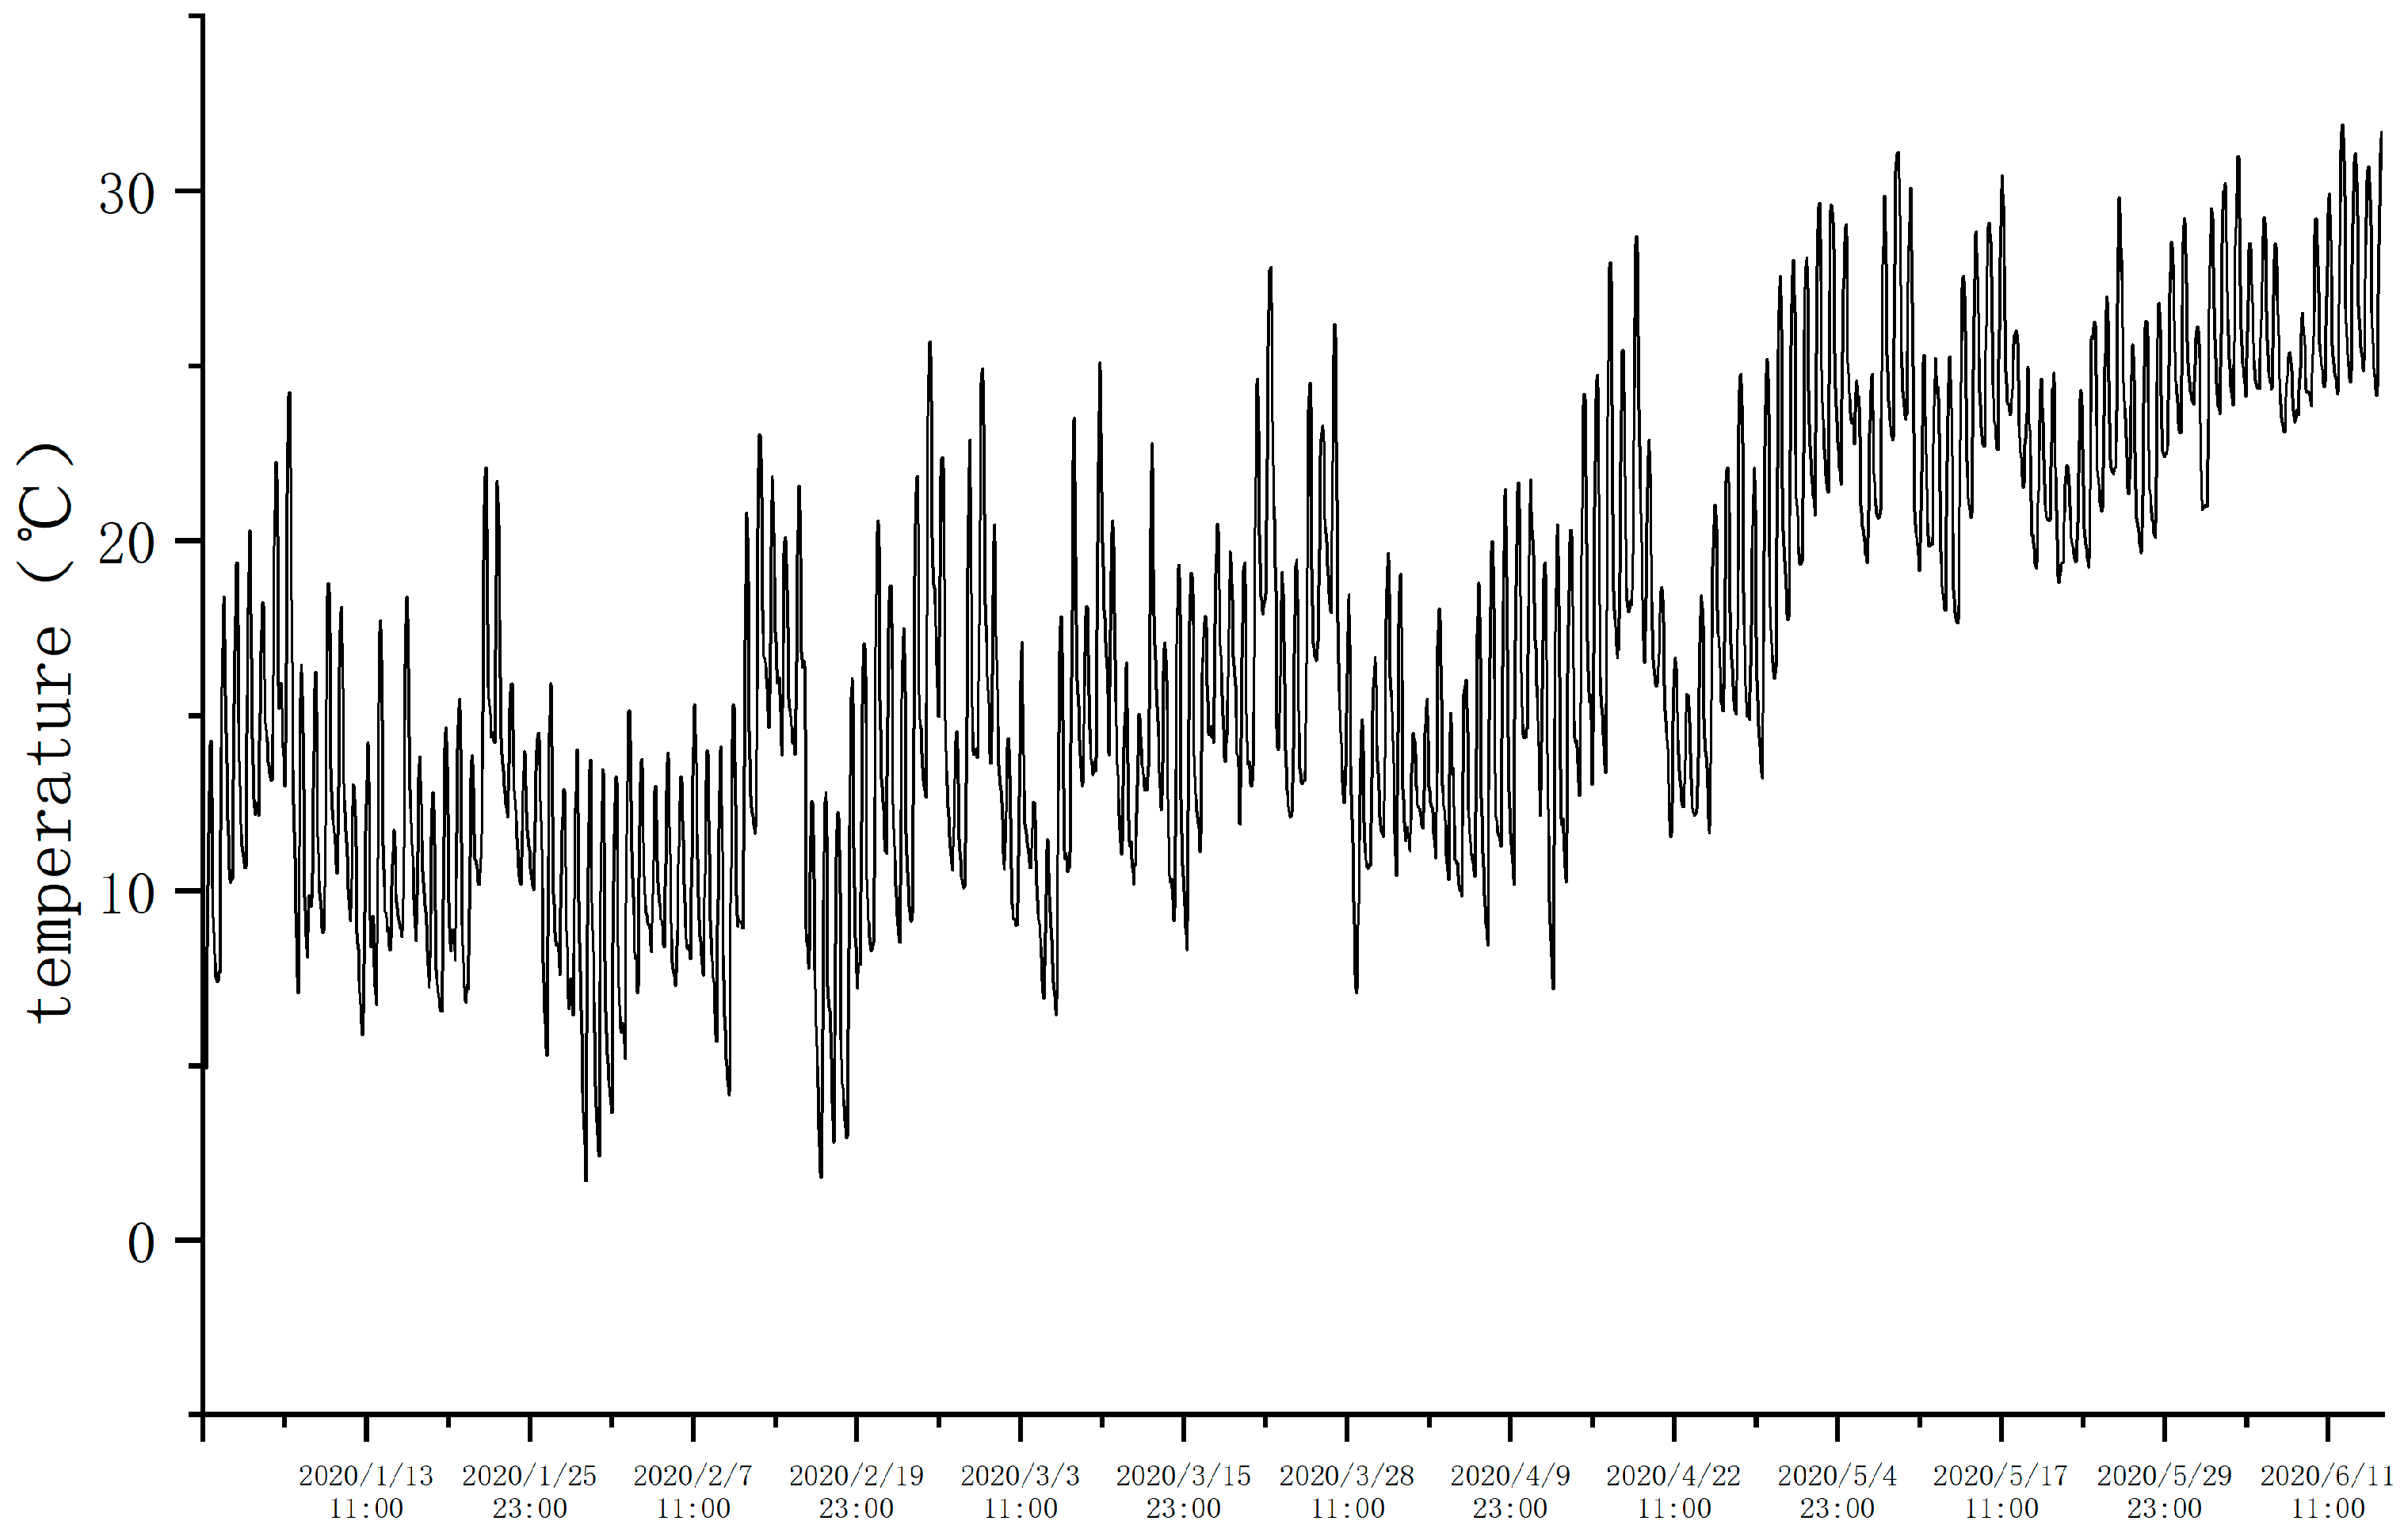
Figure 5.
Time series feature hierarchical clustering flowchart.
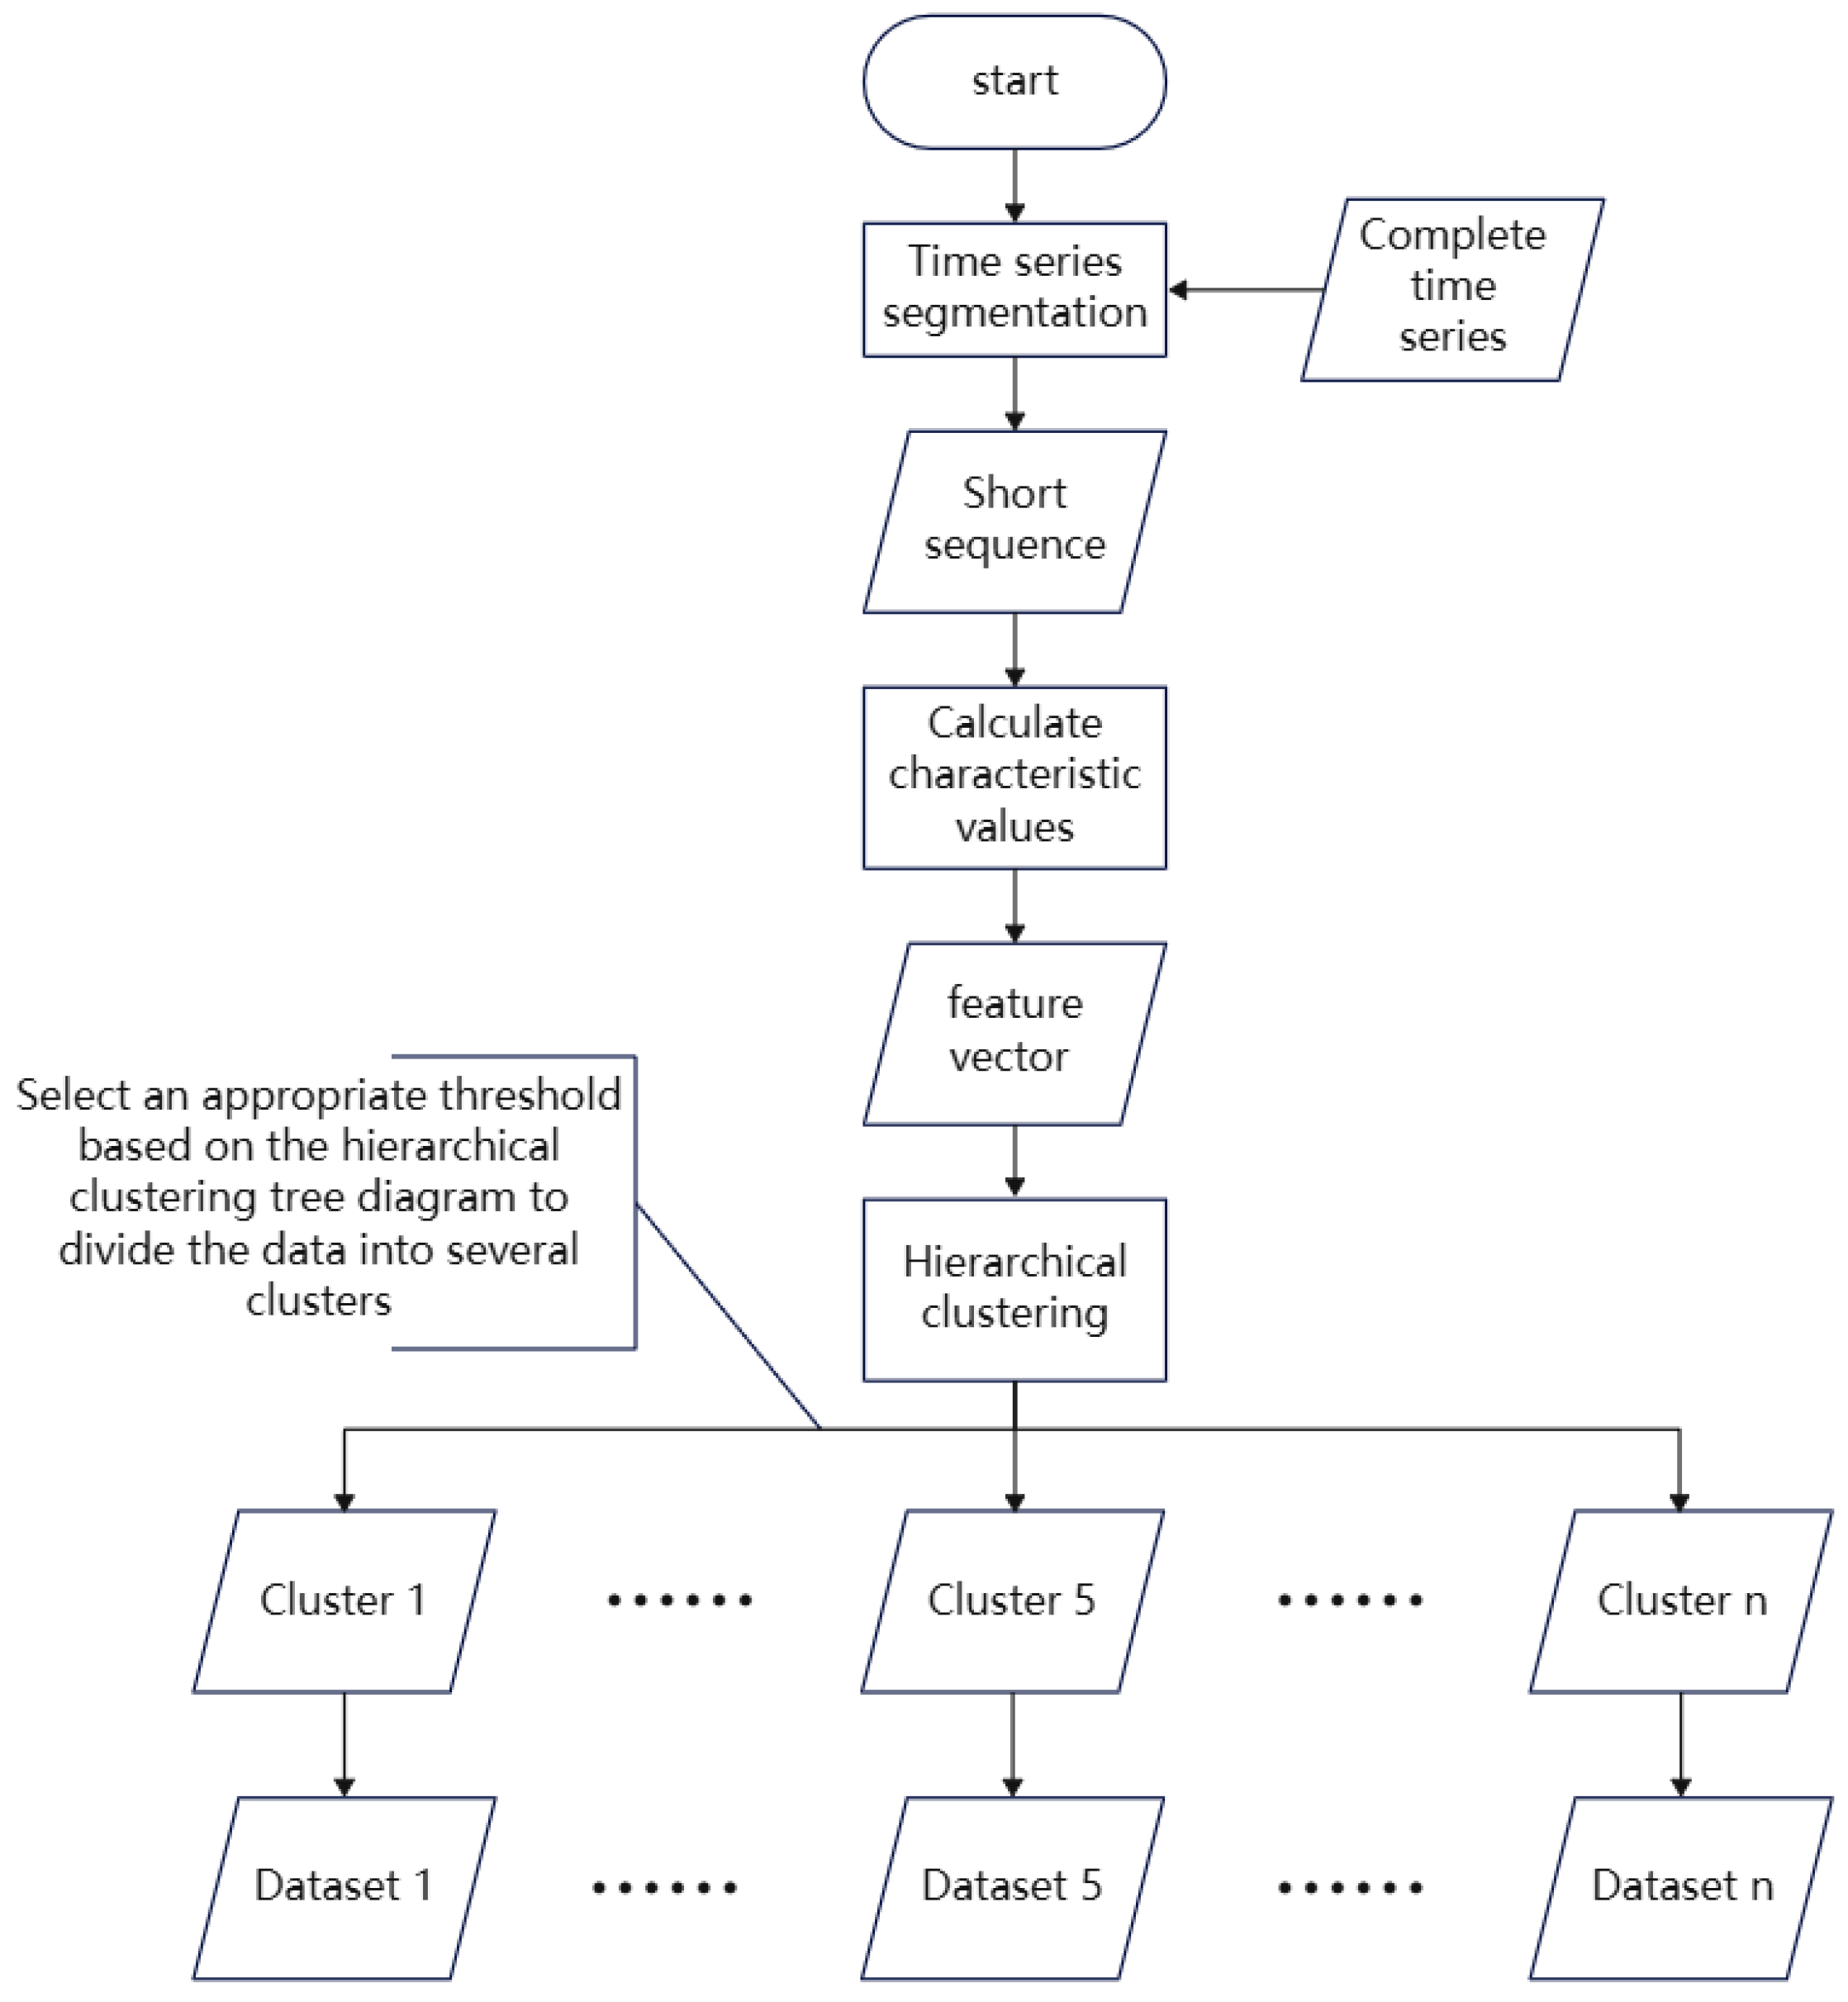
Figure 6.
Model error comparison bar chart.
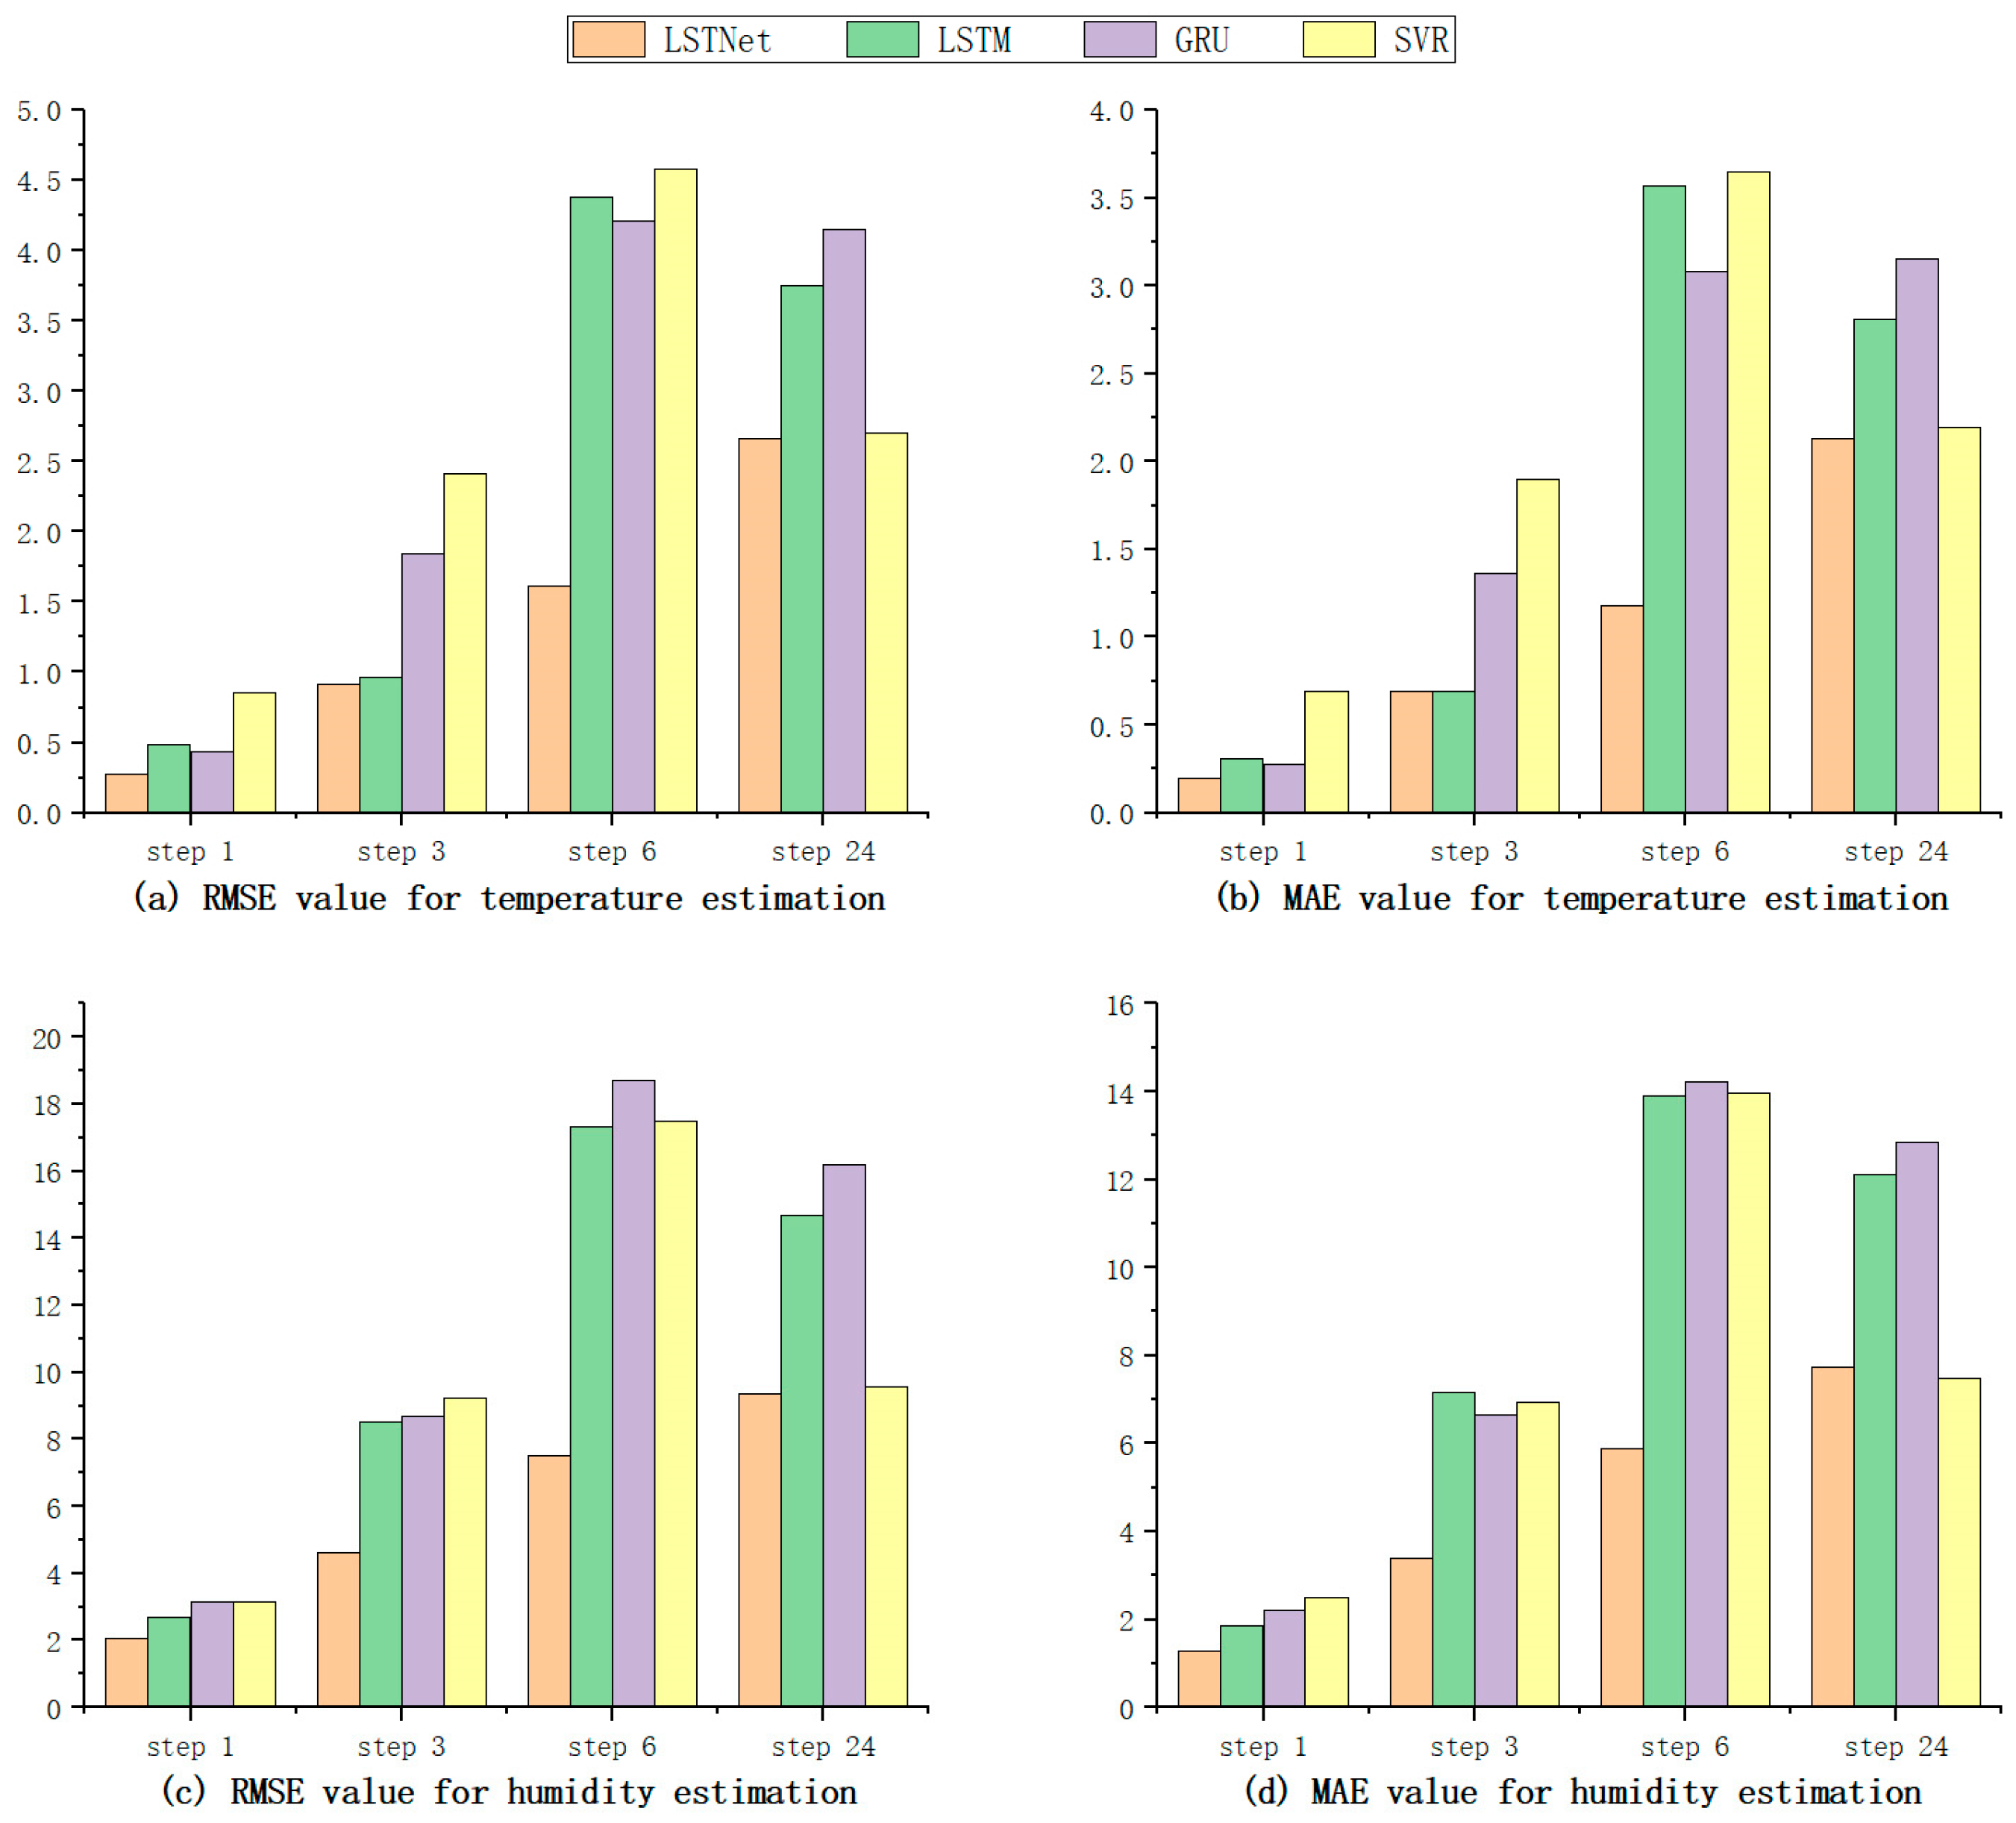
Figure 7.
Comparison chart of temperature single step estimation results.
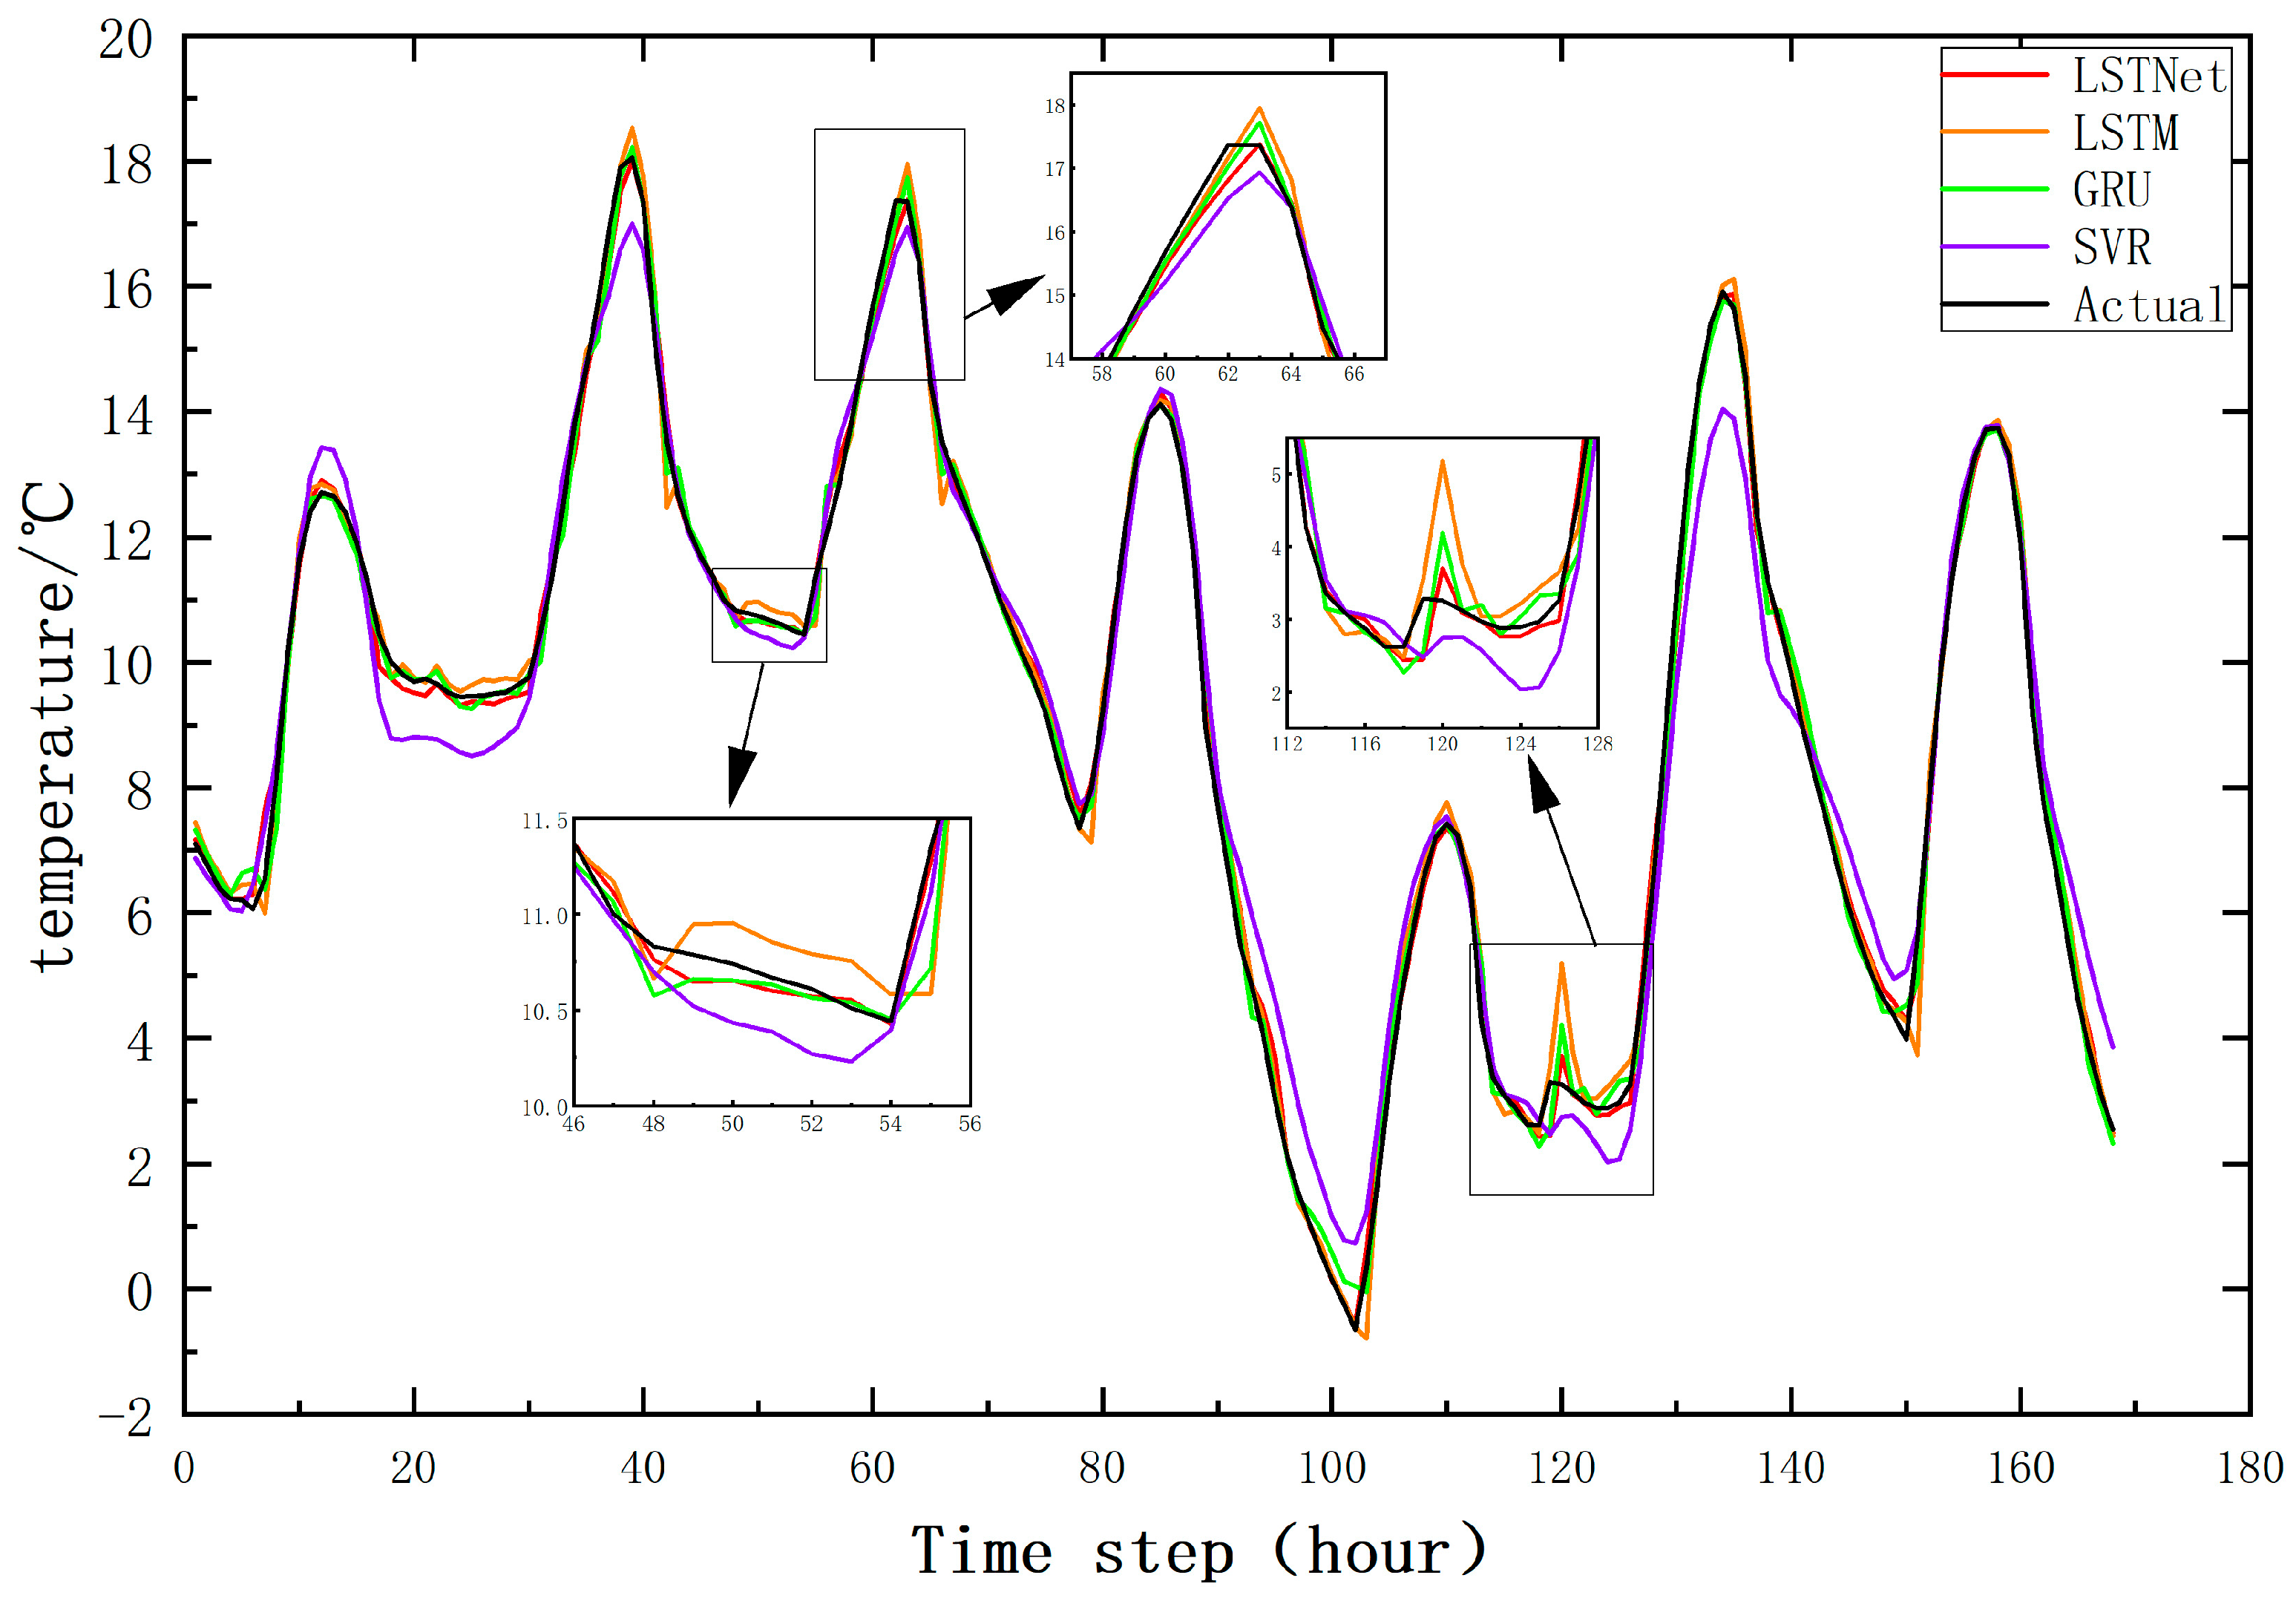
Figure 8.
Comparison chart of humidity single step estimation results.
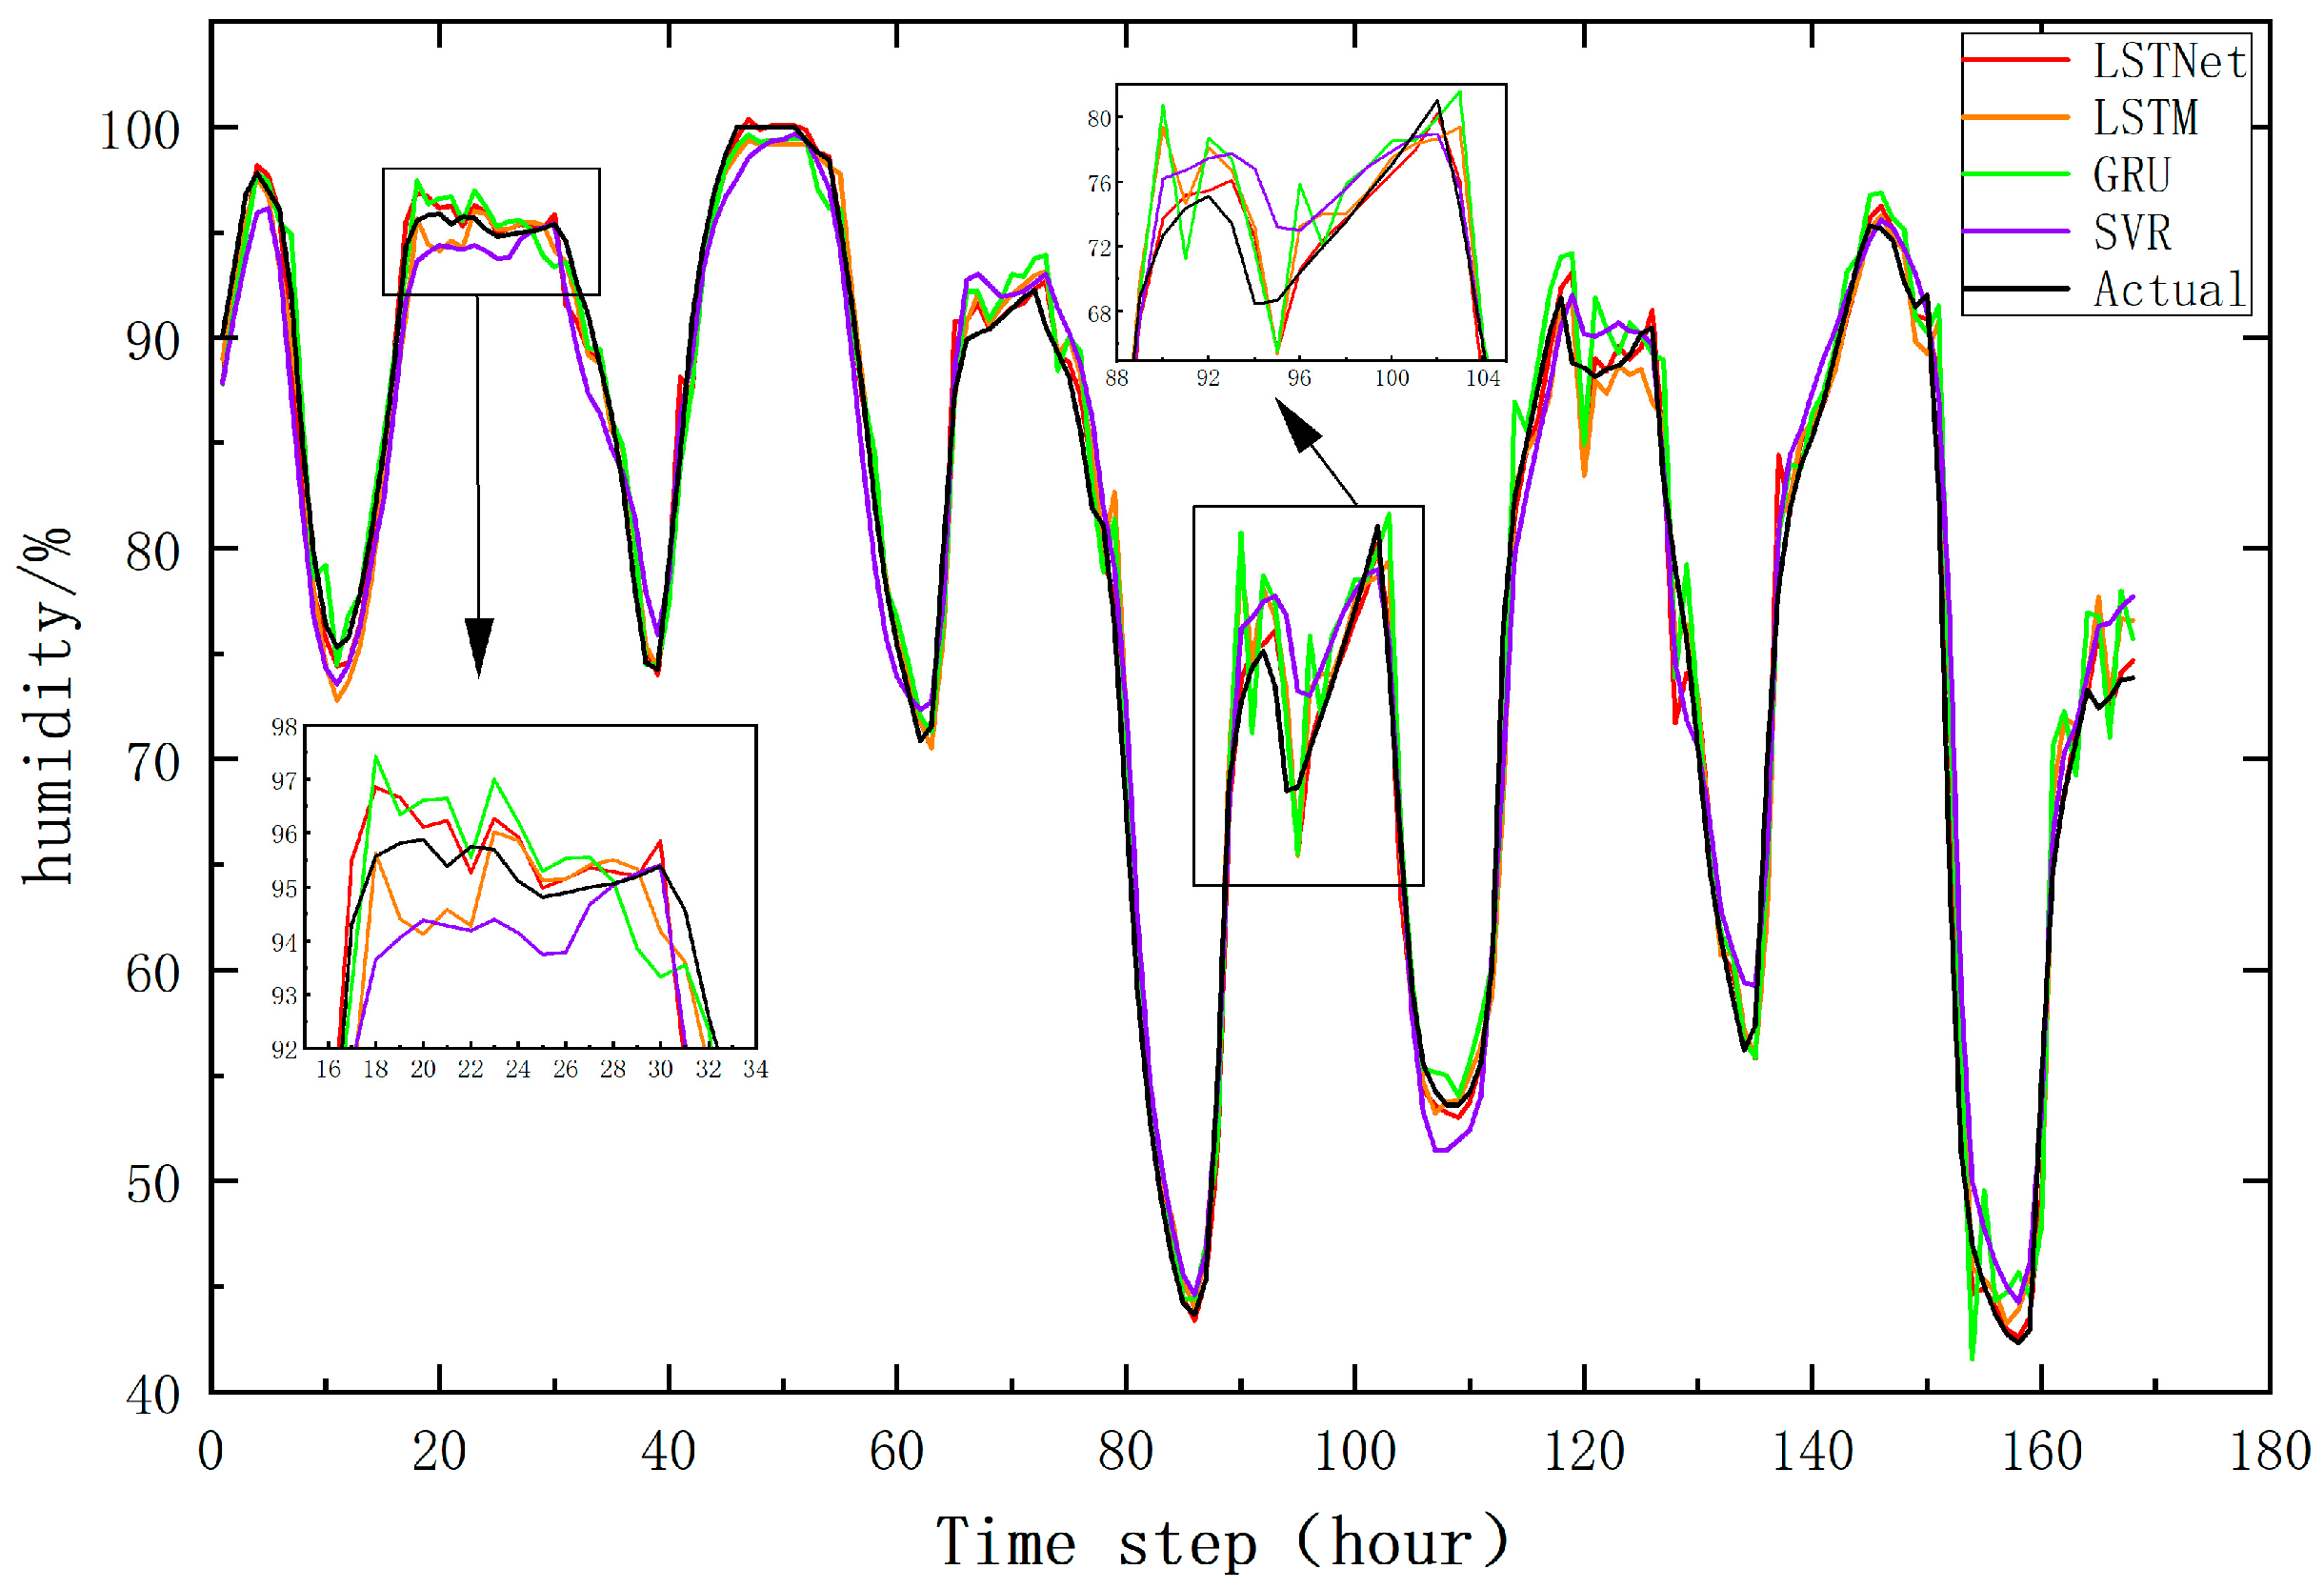
Figure 9.
Temperature estimate for December 29, 2023.
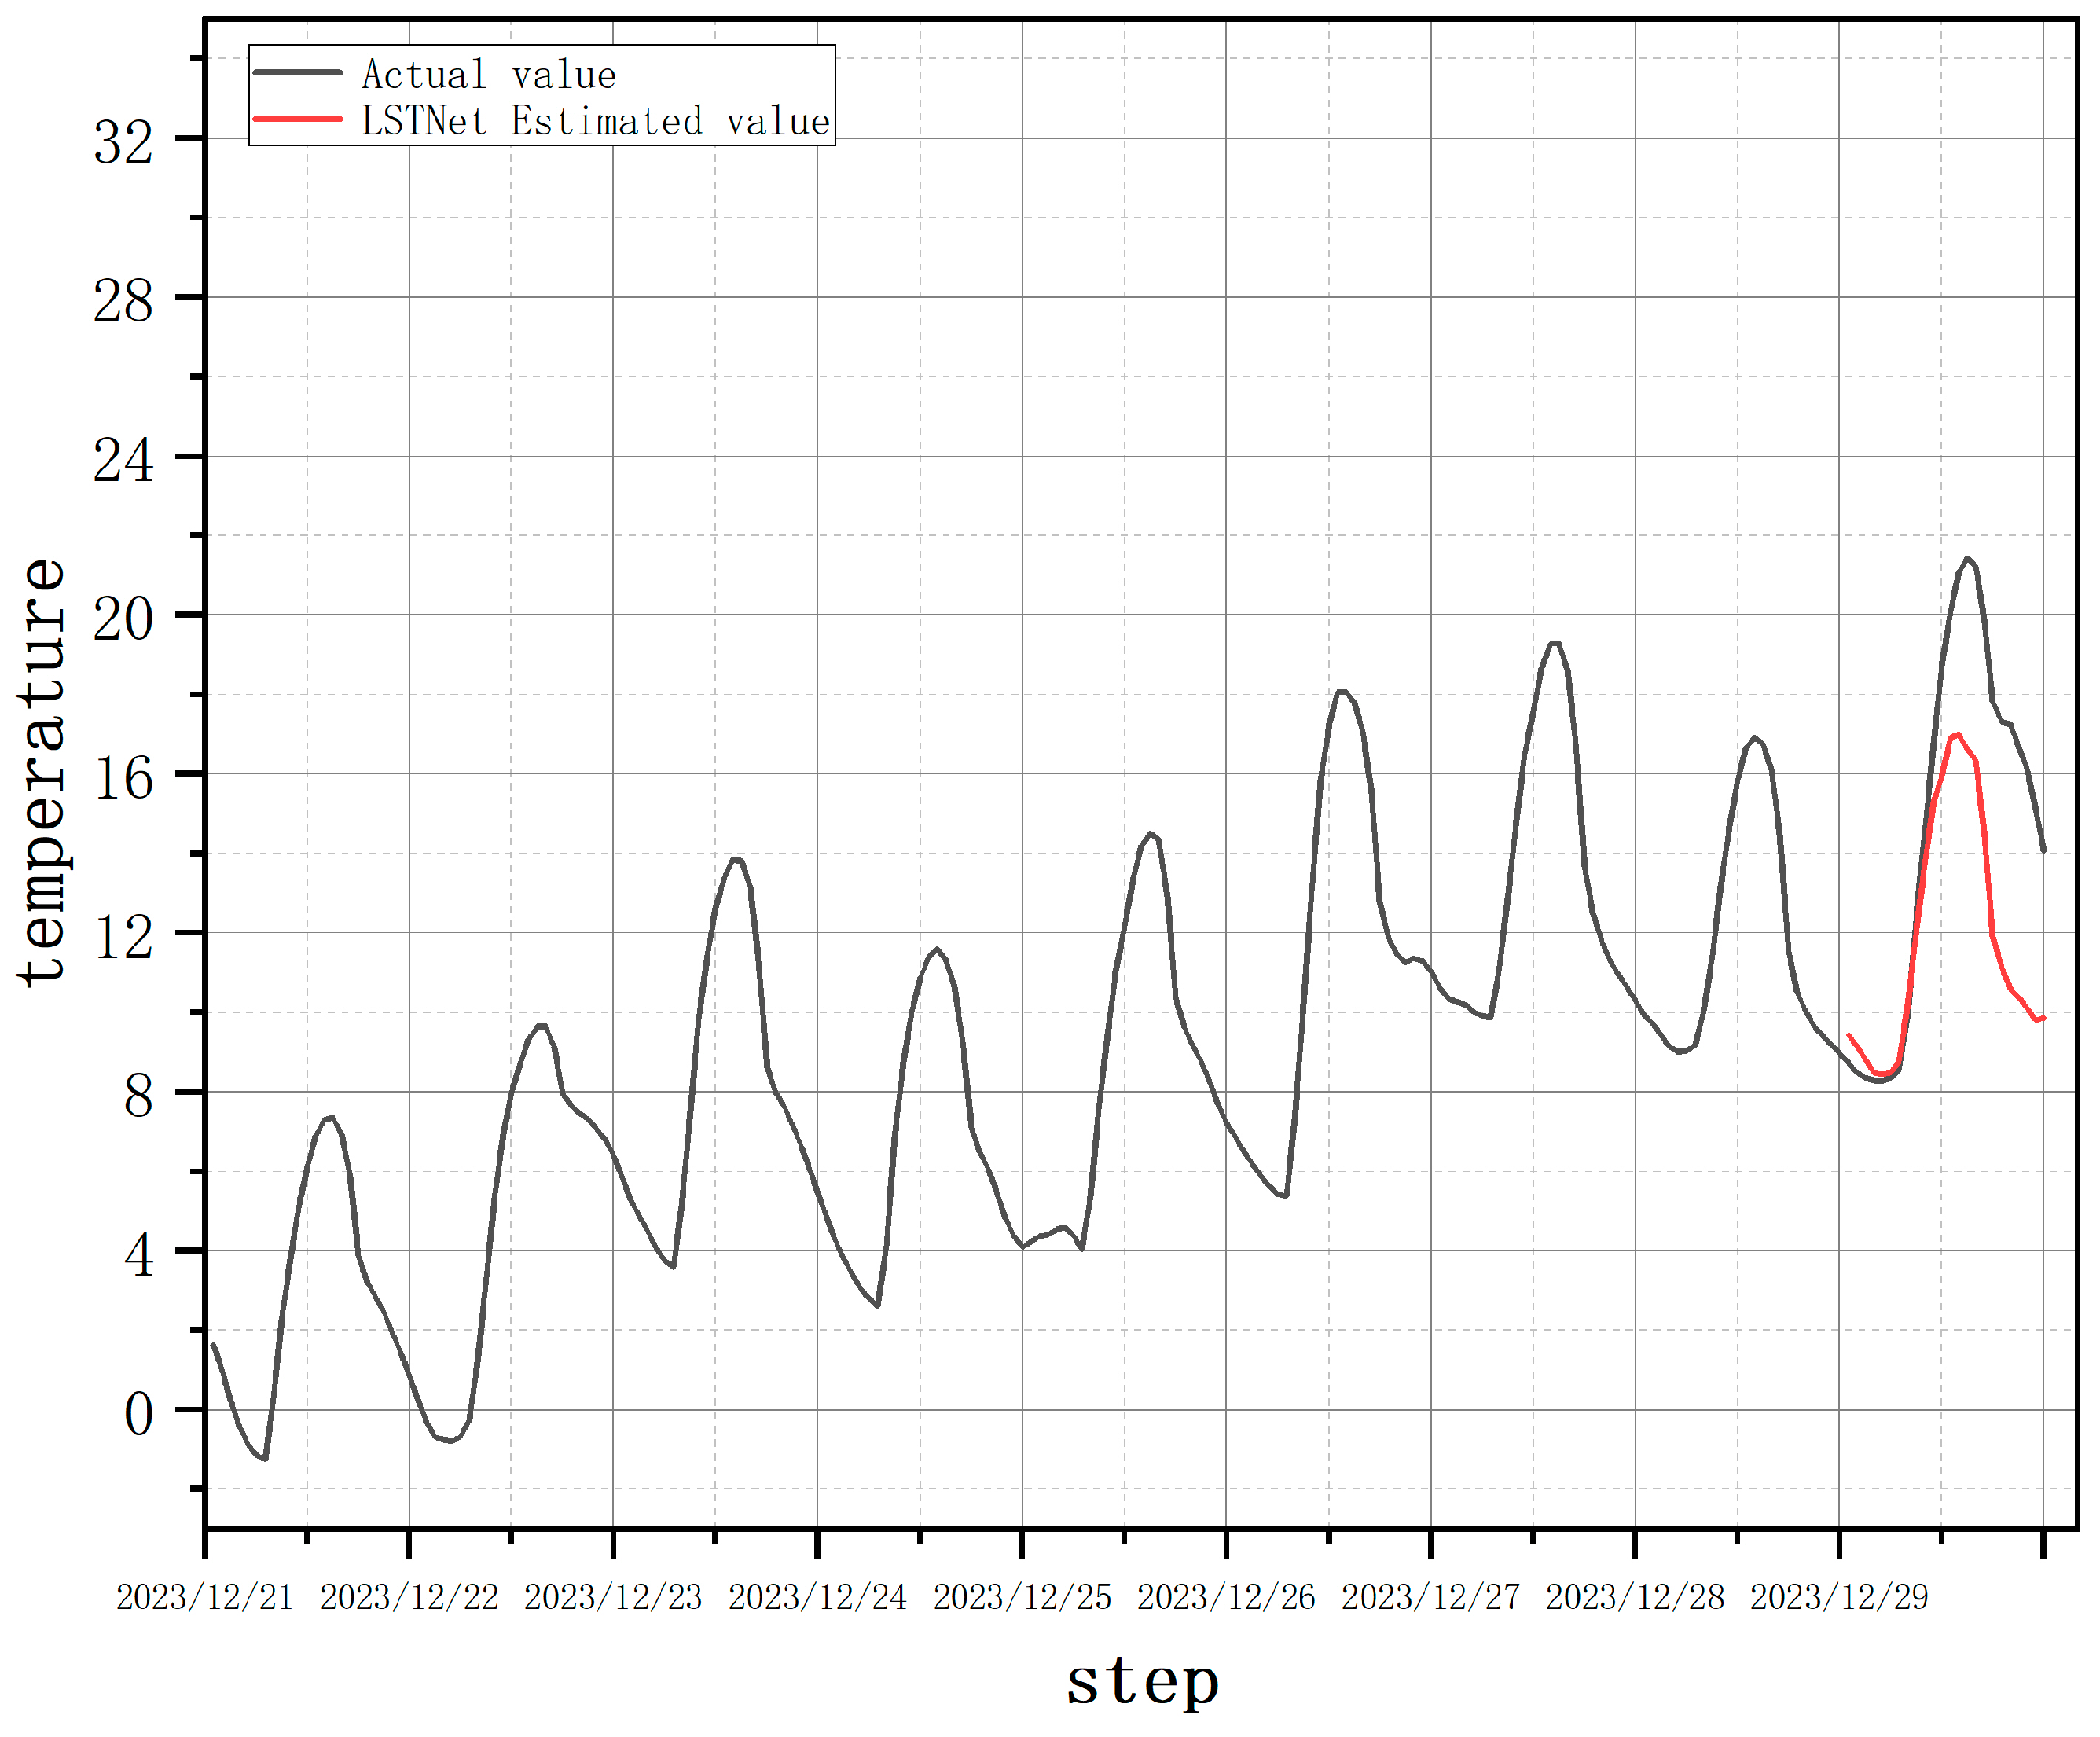
Figure 10.
Comparison of temperature estimation results for December 29, 2023 before and after data augmentation.
Figure 10.
Comparison of temperature estimation results for December 29, 2023 before and after data augmentation.
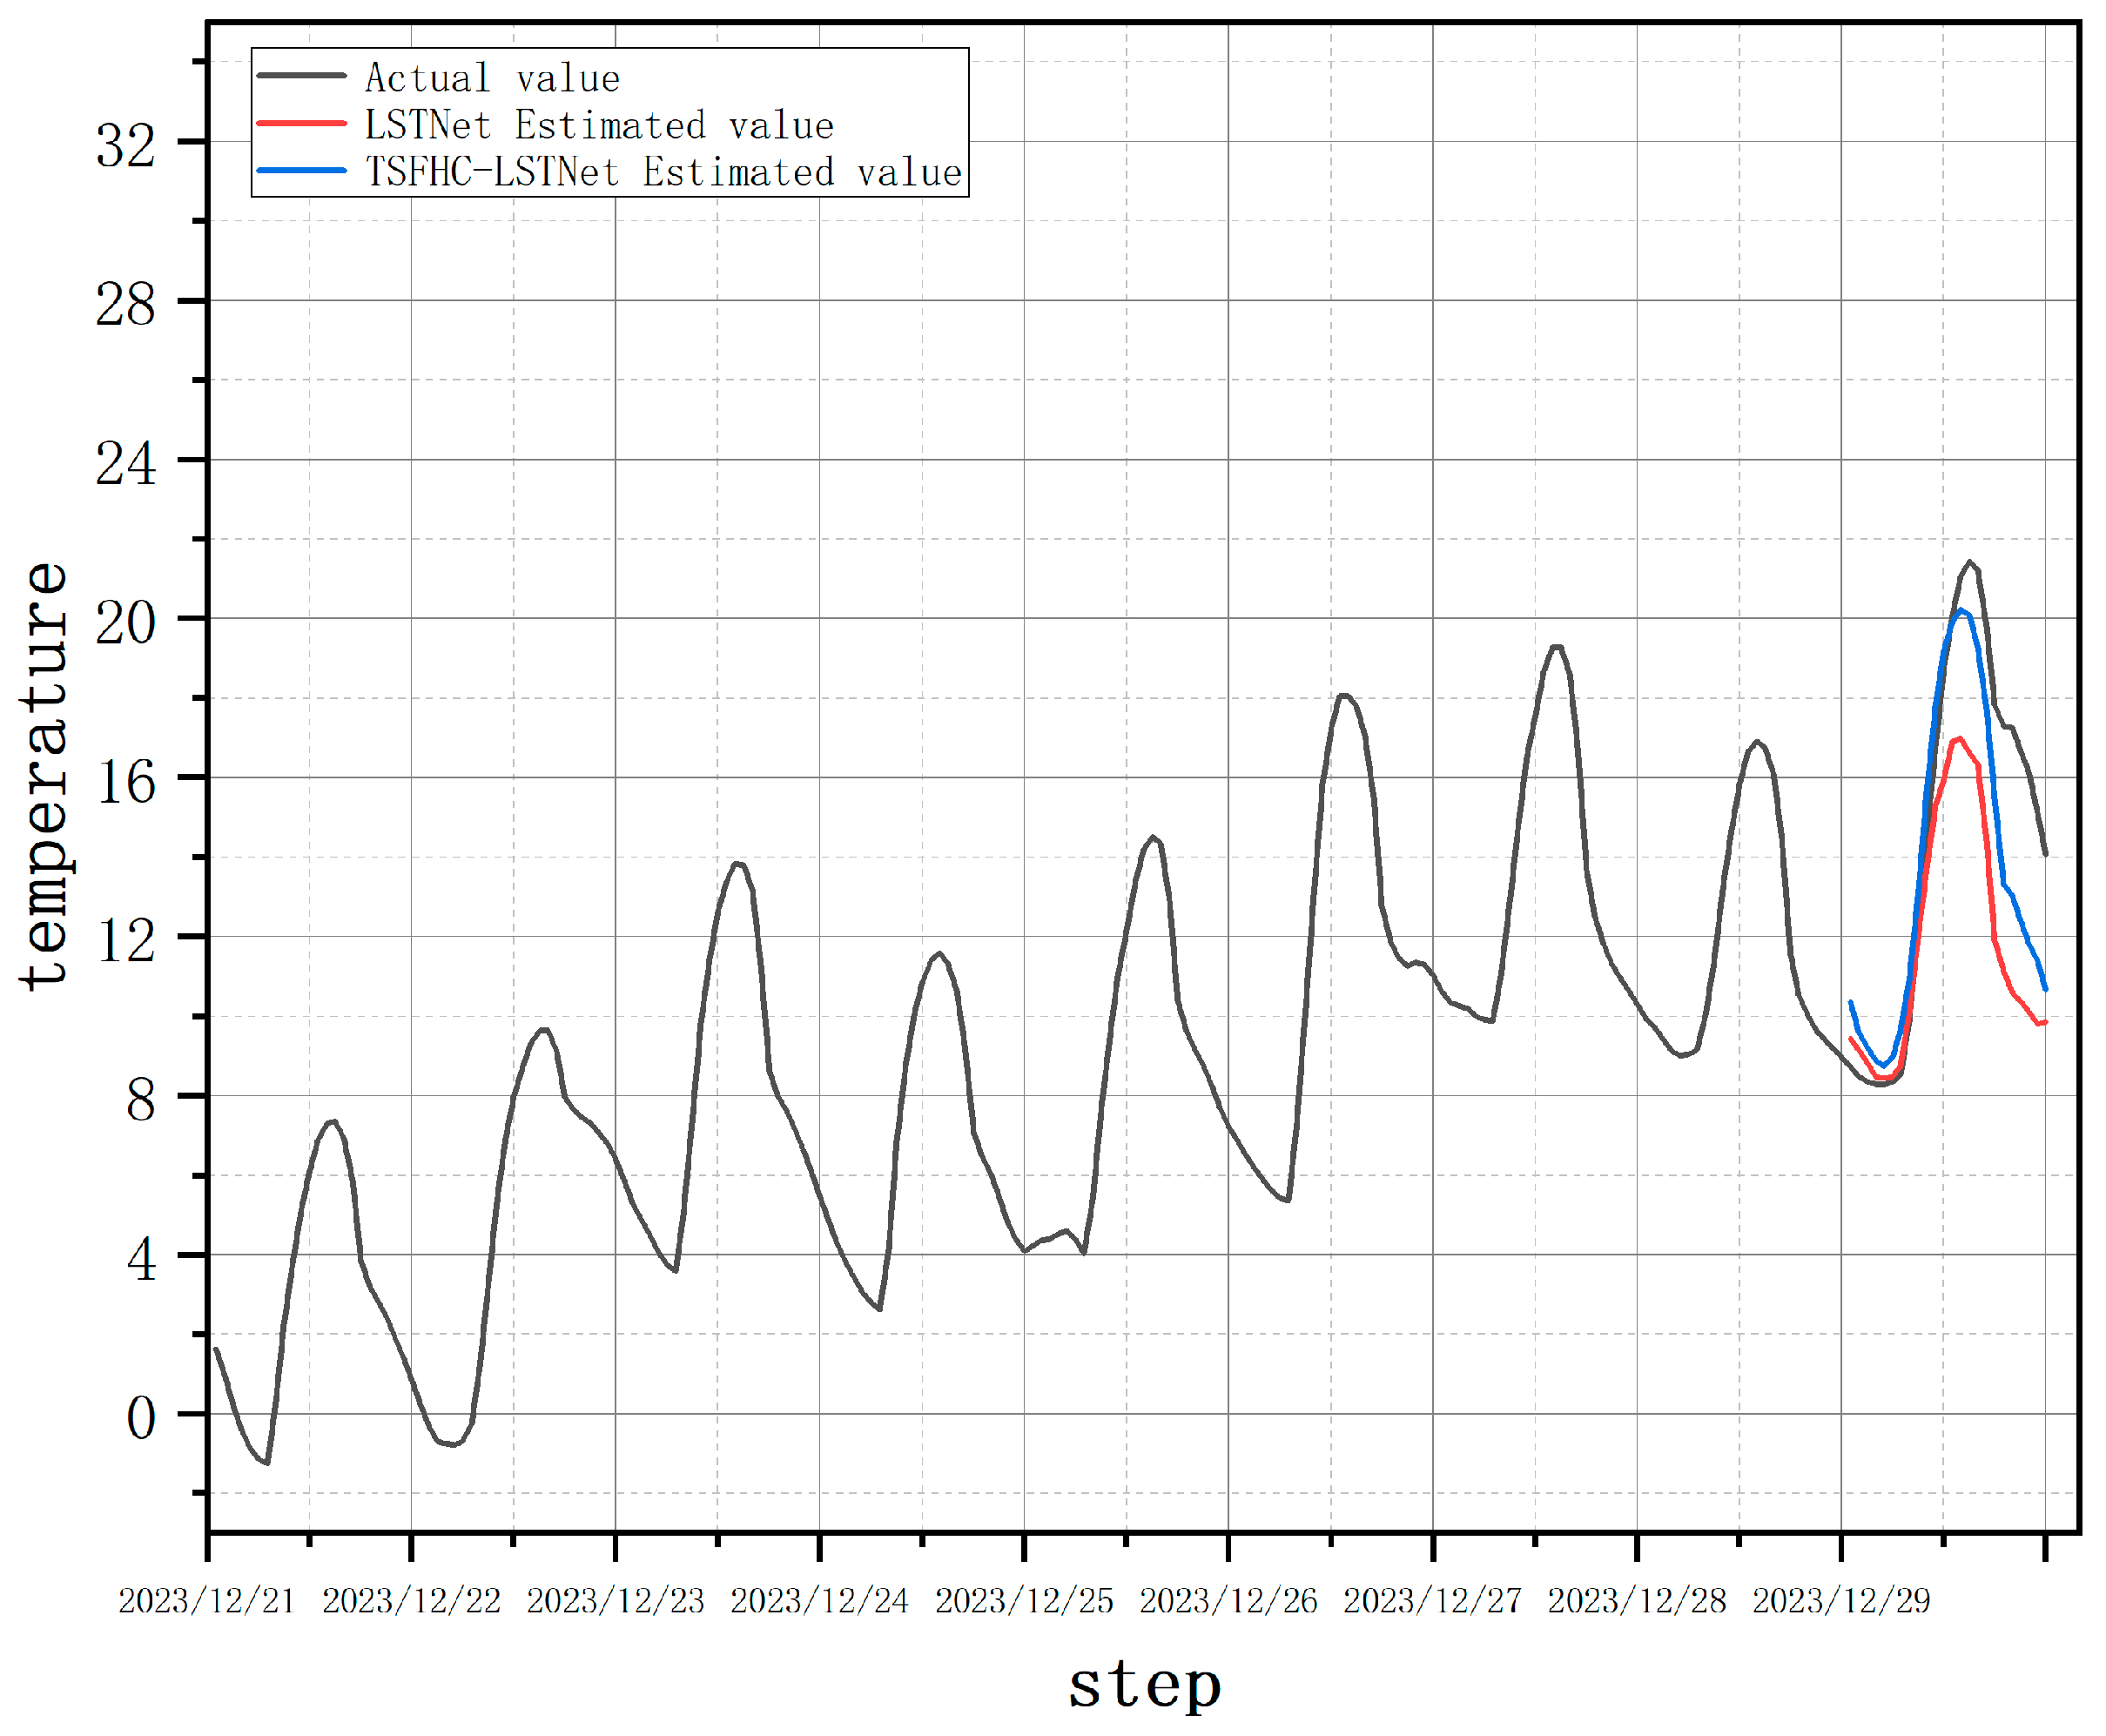
Figure 11.
Comparison of temperature estimation results before and after data augmentation on July 26, 2023.
Figure 11.
Comparison of temperature estimation results before and after data augmentation on July 26, 2023.
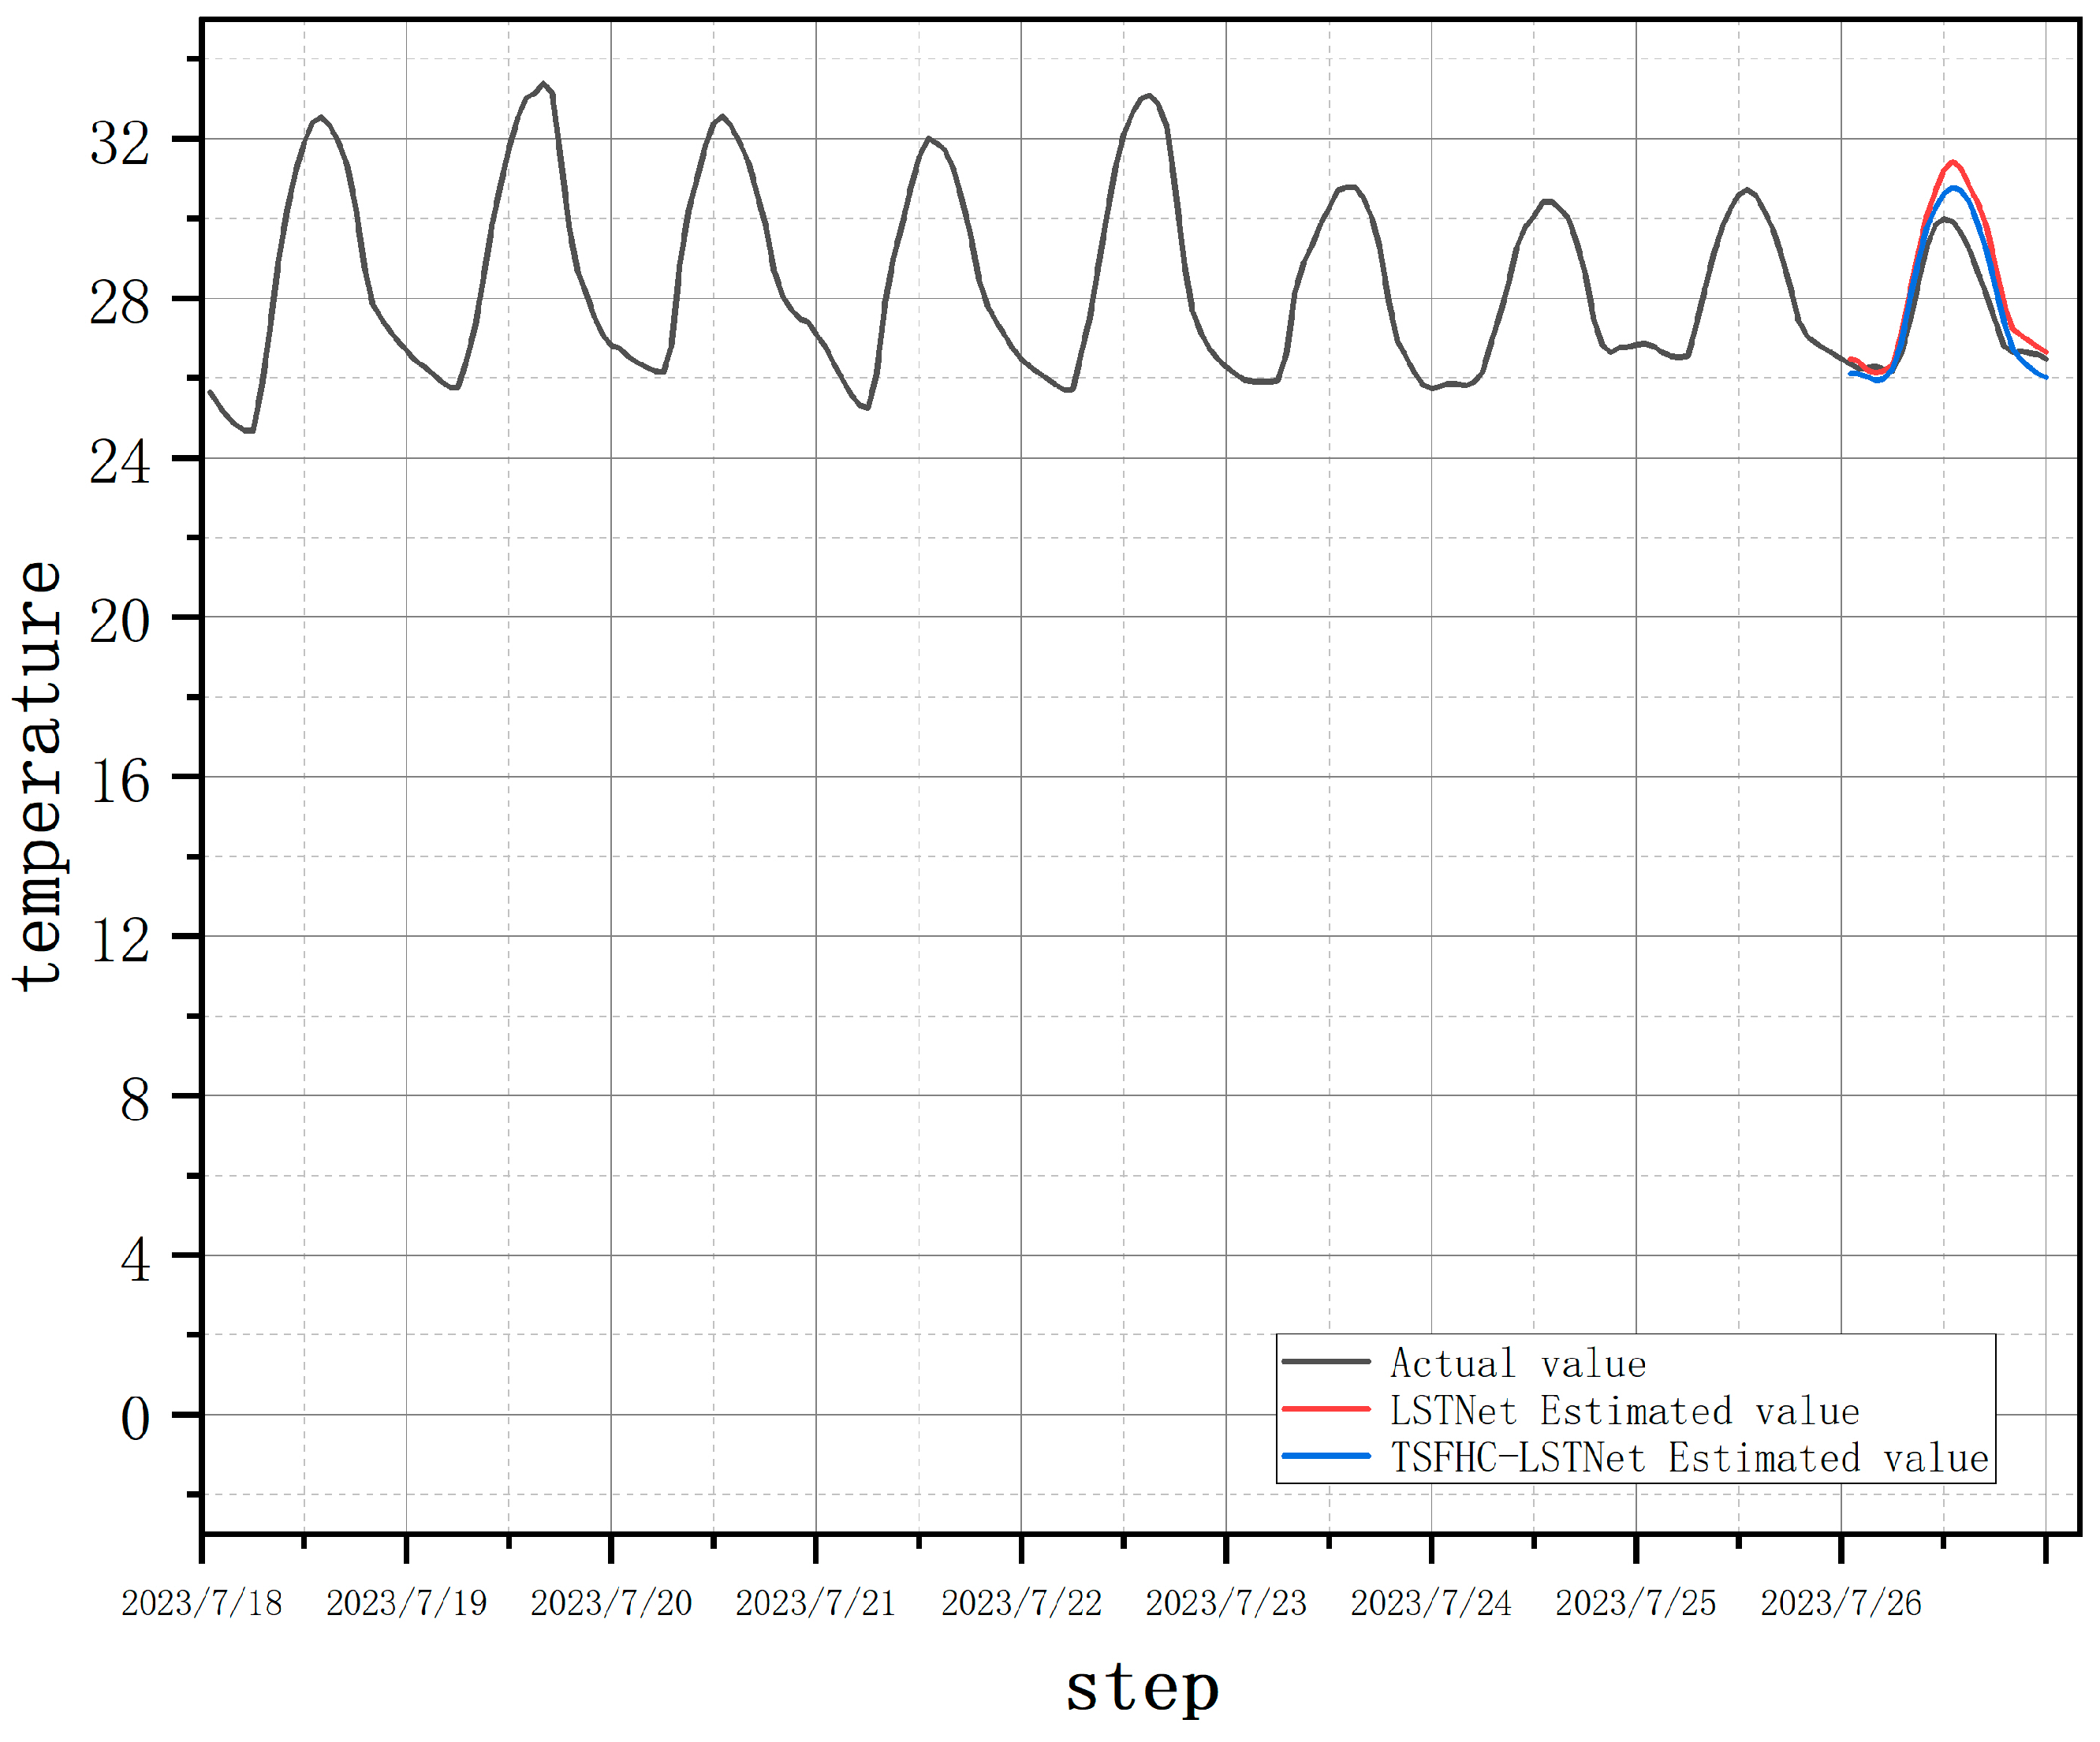
Figure 12.
Comparison of humidity estimation results before and after data augmentation on December 26, 2023.
Figure 12.
Comparison of humidity estimation results before and after data augmentation on December 26, 2023.
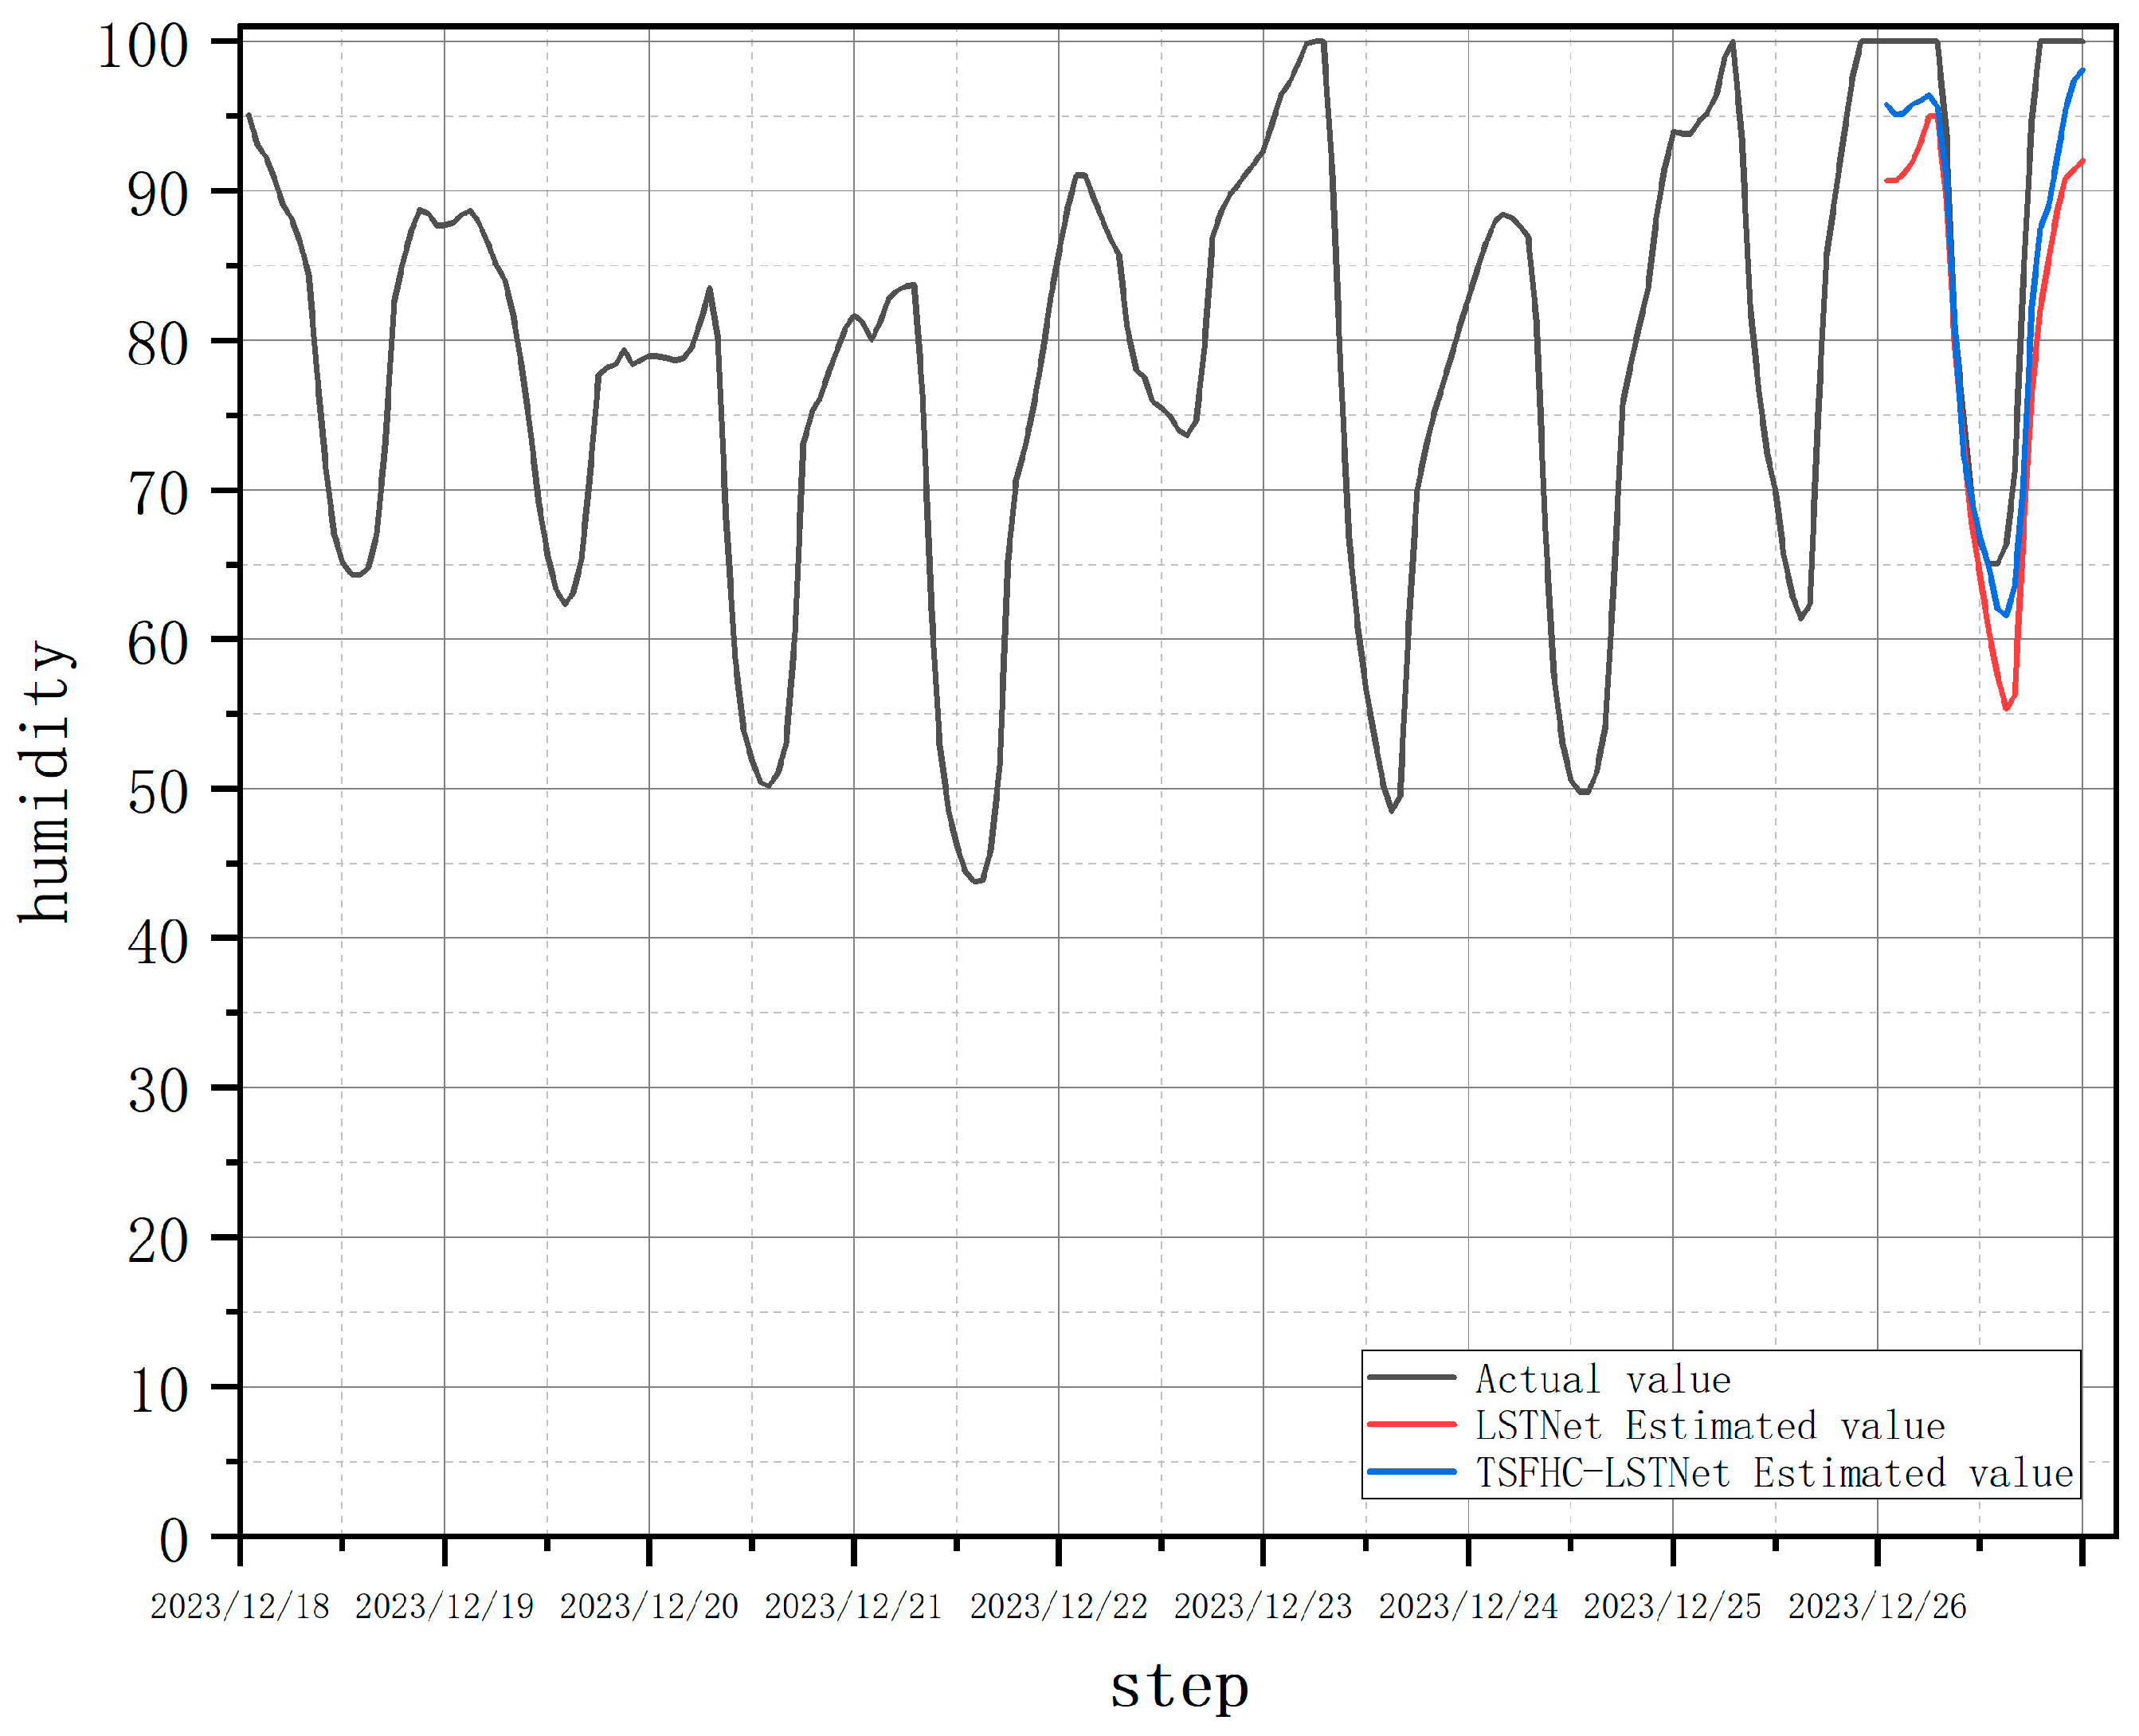
Figure 13.
Comparison of humidity estimation results before and after data augmentation on June 20, 2023.
Figure 13.
Comparison of humidity estimation results before and after data augmentation on June 20, 2023.
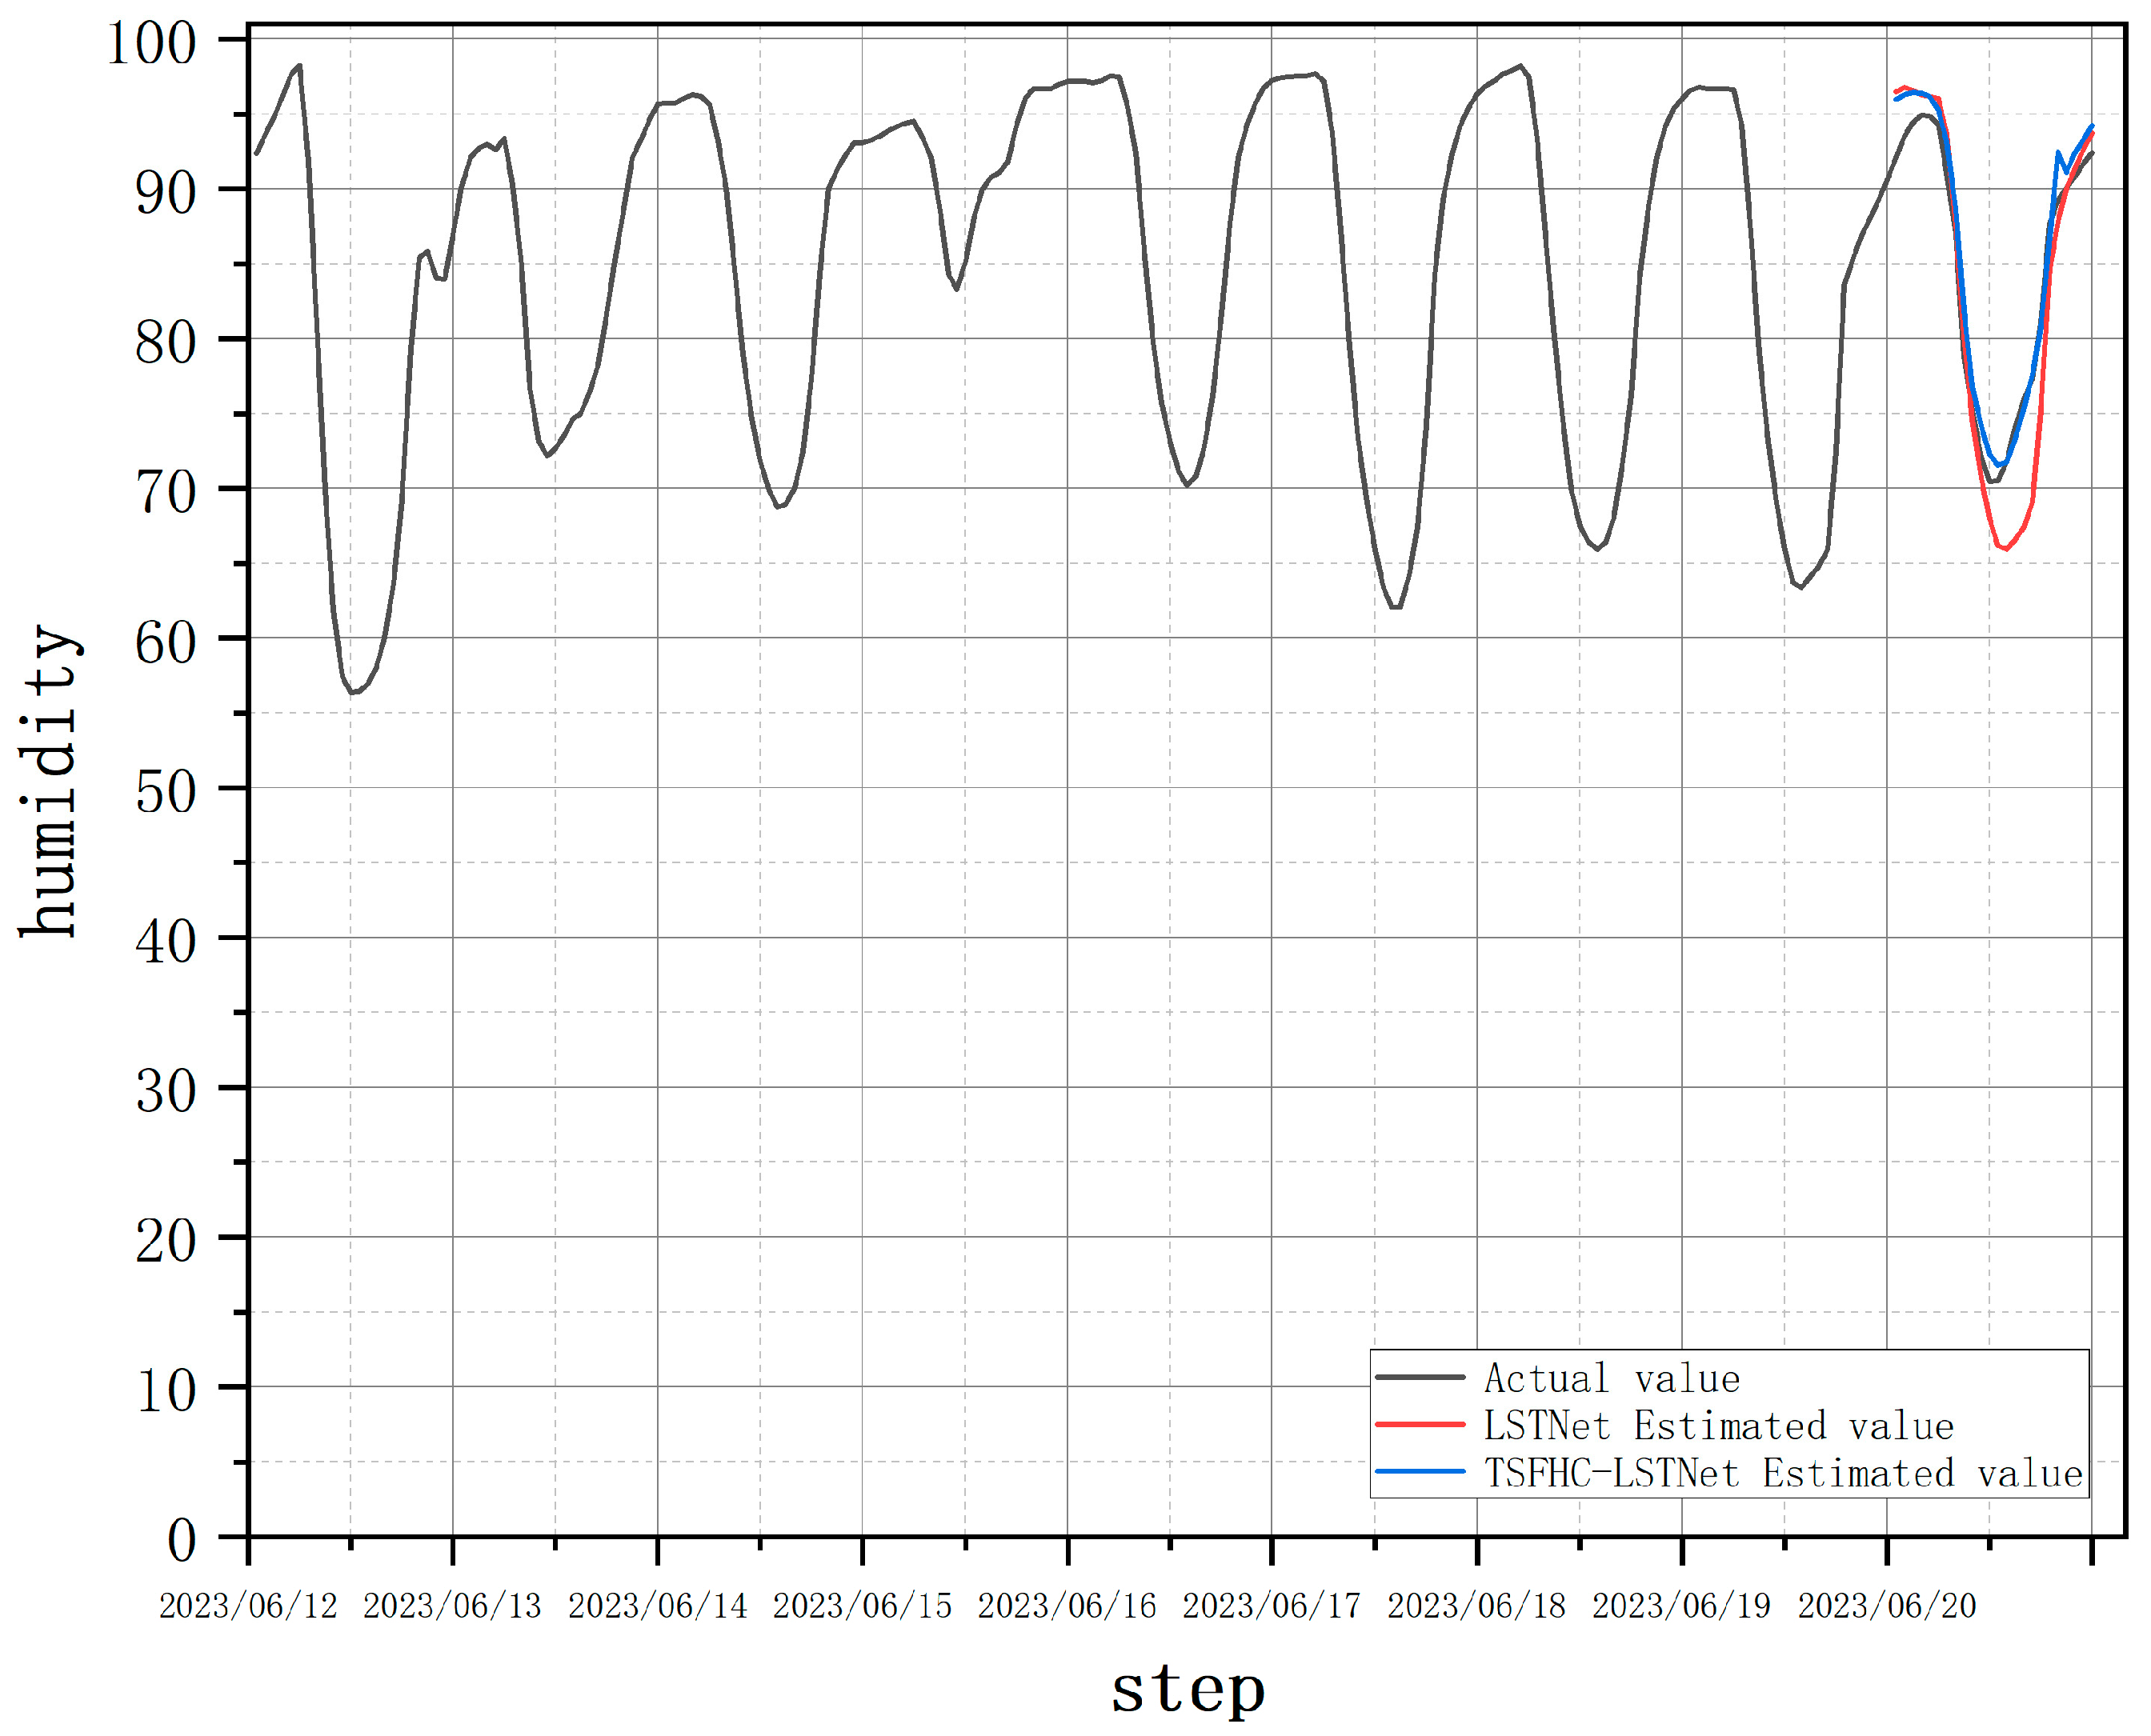
Figure 14.
Single-day temperature curve.
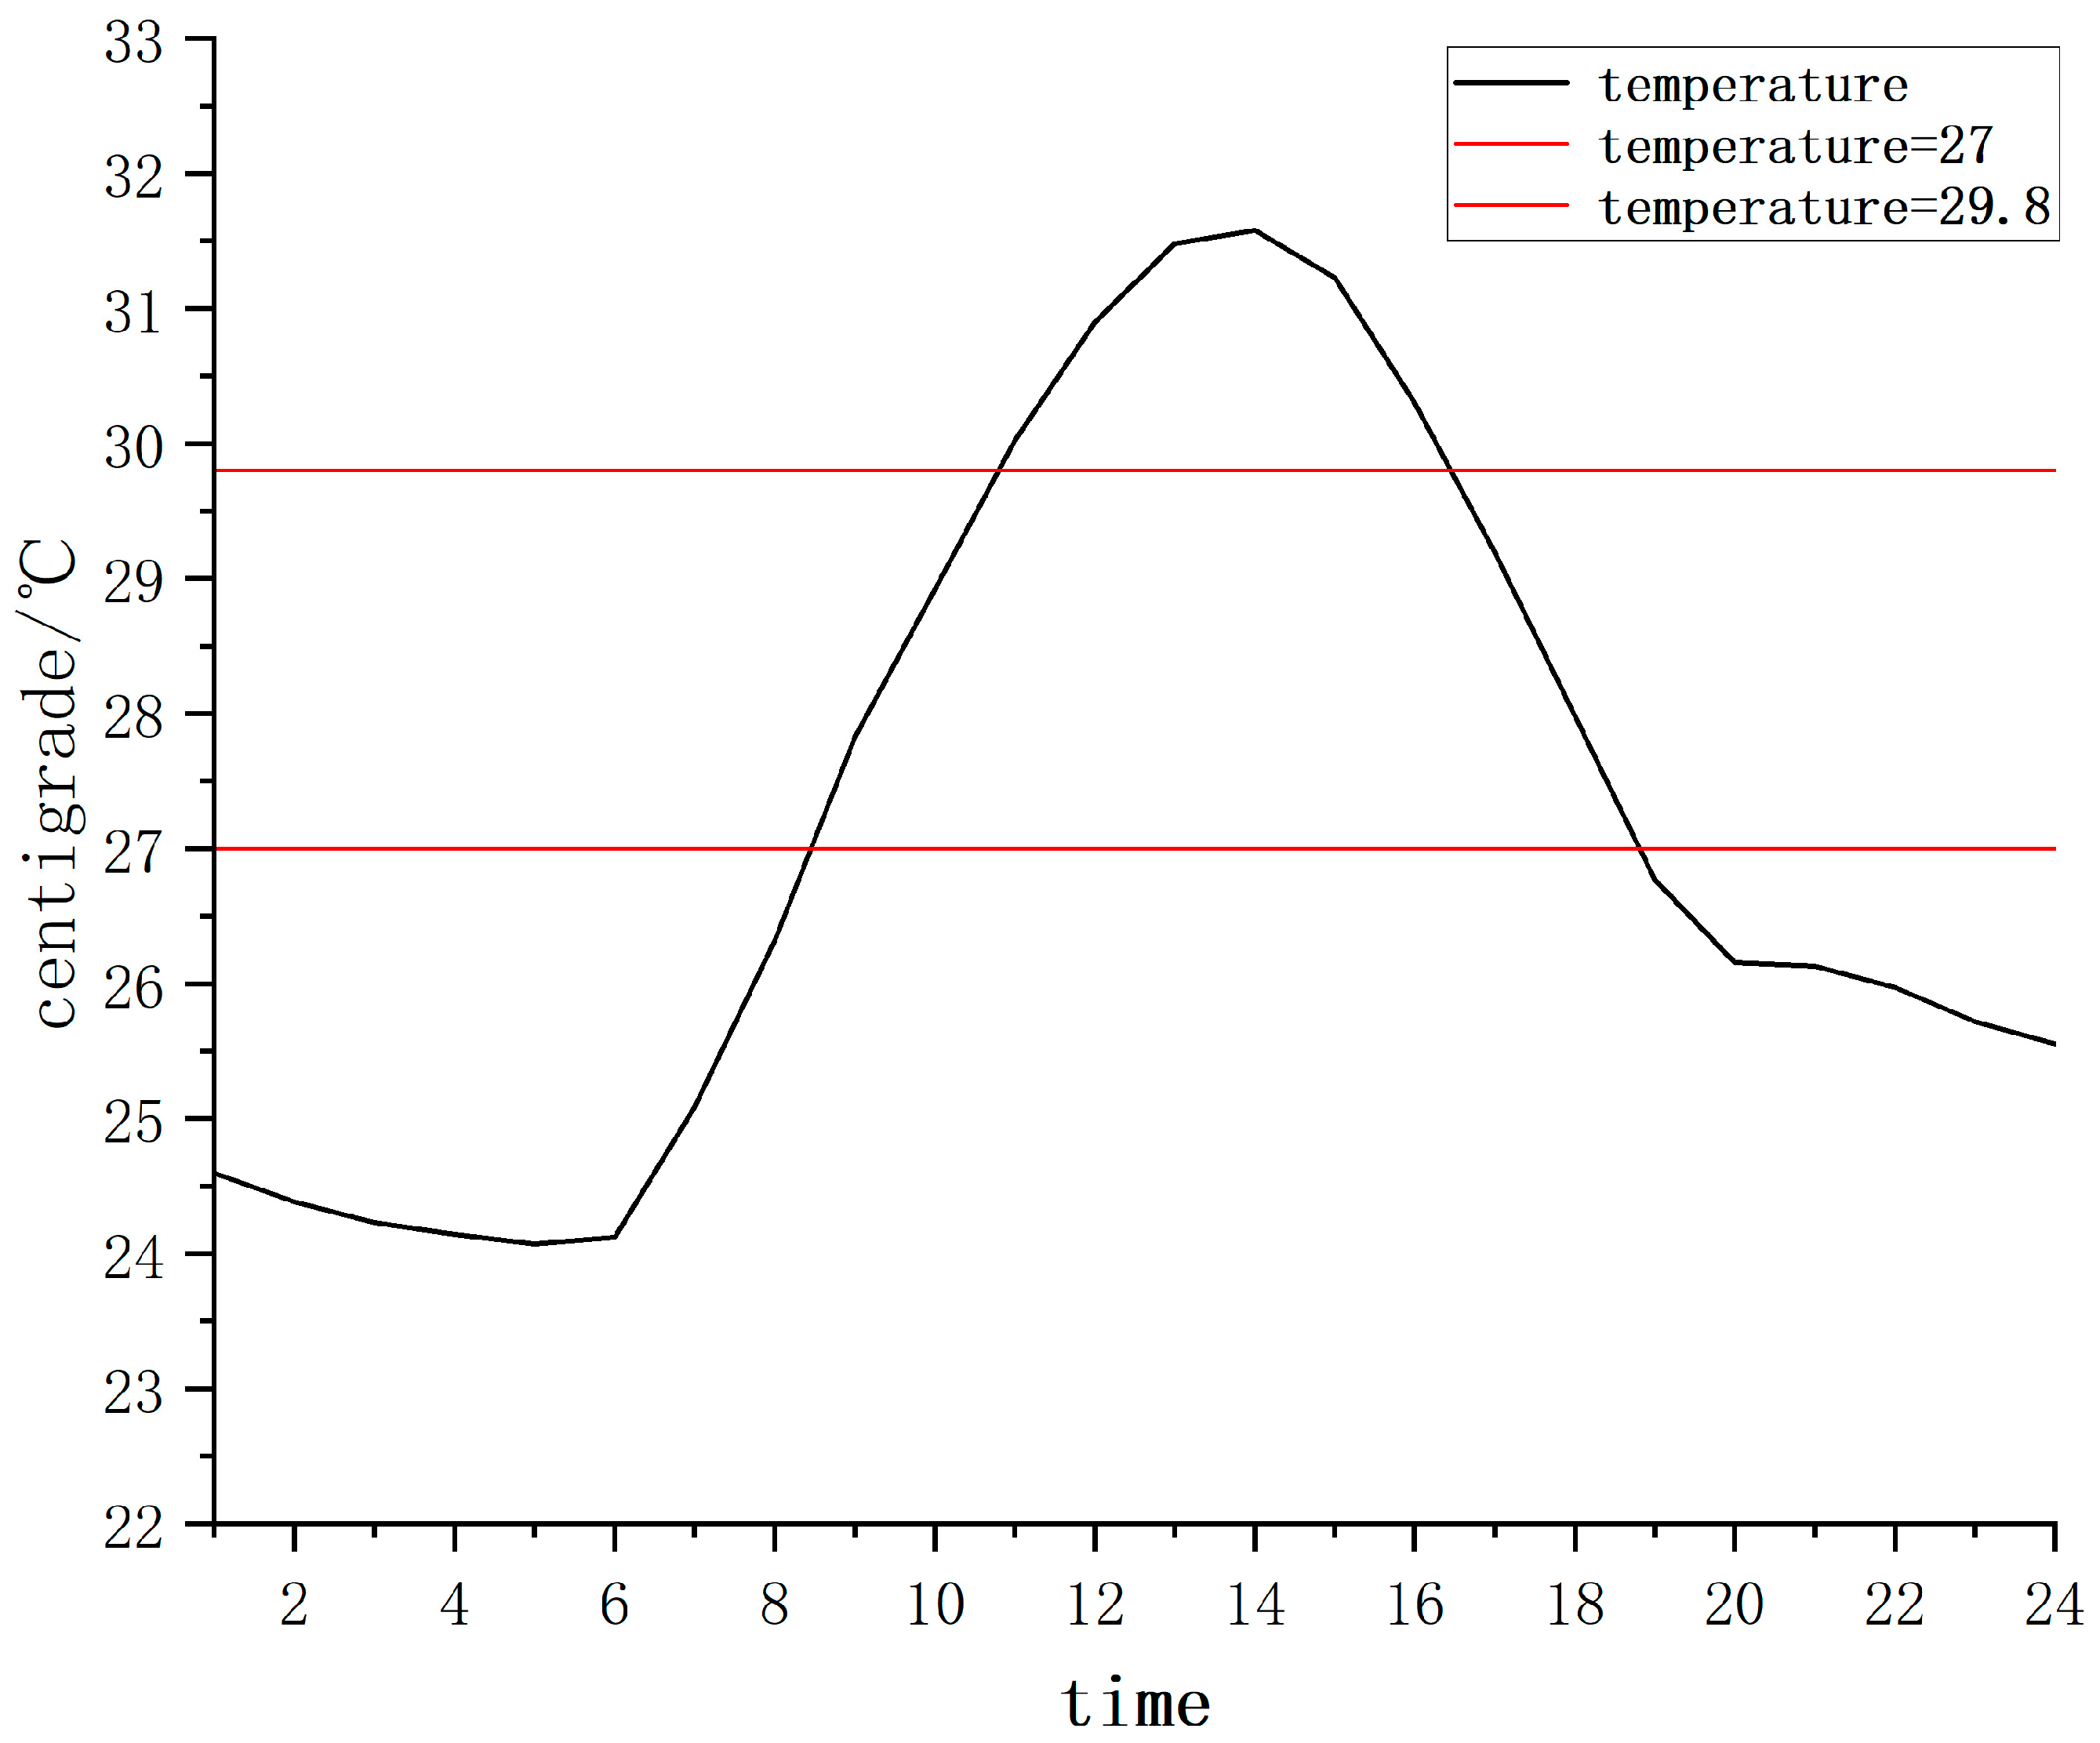
Table 1.
RMSE value for temperature estimation.
| 1 | 3 | 6 | 24 | |
|---|---|---|---|---|
| LSTNet | 0.28 | 0.92 | 1.61 | 2.66 |
| LSTM | 0.49 | 0.97 | 4.38 | 3.75 |
| GRU | 0.44 | 1.84 | 4.21 | 4.15 |
| SVR | 0.85 | 2.41 | 4.58 | 2.70 |
Table 2.
MAE value for temperature estimation.
| 1 | 3 | 6 | 24 | |
|---|---|---|---|---|
| LSTNet | 0.2 | 0.69 | 1.18 | 2.13 |
| LSTM | 0.31 | 0.69 | 3.57 | 2.81 |
| GRU | 0.28 | 1.36 | 3.08 | 3.15 |
| SVR | 0.6924 | 1.90 | 3.65 | 2.19 |
Table 3.
Correlation coefficient for temperature estimation.
| 1 | 3 | 6 | 24 | |
|---|---|---|---|---|
| LSTNet | 0.9980 | 0.9783 | 0.9338 | 0.8036 |
| LSTM | 0.9958 | 0.9768 | 0.5112 | 0.7539 |
| GRU | 0.9950 | 0.9371 | 0.5848 | 0.7356 |
| SVR | 0.9850 | 0.8417 | 0.3674 | 0.8077 |
Table 4.
RMSE value for humidity estimation.
| 1 | 3 | 6 | 24 | |
|---|---|---|---|---|
| LSTNet | 2.08 | 4.60 | 7.49 | 9.36 |
| LSTM | 2.69 | 8.53 | 17.32 | 14.67 |
| GRU | 3.17 | 8.69 | 18.73 | 16.19 |
| SVR | 3.1549 | 9.2174 | 17.4916 | 9.56 |
Table 5.
MAE value for humidity estimation.
| 1 | 3 | 6 | 24 | |
|---|---|---|---|---|
| LSTNet | 1.28 | 3.39 | 5.87 | 7.73 |
| LSTM | 1.85 | 7.15 | 13.92 | 12.12 |
| GRU | 2.2 | 6.65 | 14.21 | 12.84 |
| SVR | 2.48 | 6.92 | 13.98 | 7.49 |
Table 6.
Correlation coefficient for humidity estimation.
| 1 | 3 | 6 | 24 | |
|---|---|---|---|---|
| LSTNet | 0.9929 | 0.9647 | 0.9065 | 0.8451 |
| LSTM | 0.9881 | 0.8941 | 0.4659 | 0.5597 |
| GRU | 0.9848 | 0.9097 | 0.4496 | 0.6128 |
| SVR | 0.9841 | 0.8501 | 0.4272 | 0.8509 |
Disclaimer/Publisher’s Note: The statements, opinions and data contained in all publications are solely those of the individual author(s) and contributor(s) and not of MDPI and/or the editor(s). MDPI and/or the editor(s) disclaim responsibility for any injury to people or property resulting from any ideas, methods, instructions or products referred to in the content. |
© 2024 by the authors. Licensee MDPI, Basel, Switzerland. This article is an open access article distributed under the terms and conditions of the Creative Commons Attribution (CC BY) license (http://creativecommons.org/licenses/by/4.0/).
Copyright: This open access article is published under a Creative Commons CC BY 4.0 license, which permit the free download, distribution, and reuse, provided that the author and preprint are cited in any reuse.


