Submitted:
14 August 2024
Posted:
15 August 2024
You are already at the latest version
Abstract
Grain trade plays a pivotal role in international trade, serving not only as a primary component of the global agricultural market but also as a crucial factor in ensuring global food security and price stability. This study utilizes panel data from Russia, one of the largest players in the grain market, to investigate the determinants of cereal exports. The results of the gravity model estimation reveal a positive impact of demand factors, population differences, and the level of economic openness of importing countries, while distance and tariffs exert a negative influence on exports. The findings also indicate that Russia possesses significant untapped potential for cereal export growth, which has only increased in the context of geopolitical instability. The paper identifies regions with potential for export expansion and outlines the conditions necessary for realizing this potential. The results of this study contribute to the development of evidence-based policies aimed at enhancing the sustainability of regional export flows in global systems.
Keywords:
grain trade
; export sustainability
; gravity model
; trade flows
; Russian regions
; sustainable development
1. Introduction
Due to its strategic significance, grain occupies a leading position among exported and imported goods, shaping economic relationships between countries and continents. Major exporters, such as the United States, Brazil, Russia, Australia, India, and Canada, account for approximately half of the total global grain supply, valued at $164.1 trillion (2023), meeting the growing demand for grain crops in countries with production deficits, including many African and Asian states. Global trade routes and logistics chains, facilitating the transportation of grain, promote the integration of international markets, minimizing risks and smoothing price fluctuations caused by climatic and political factors.
Modern trade relationships between countries and individual regions not only support the food supply of resource-deficient partners but also strengthen economic ties, promoting sustainable development and cooperation on the global stage. Furthermore, the supply of grain crops from various countries and continents helps to smooth out price fluctuations and compensate for production deficits in importing countries. This contributes to market stabilization and reduces the risks of food shortages, providing the necessary resources for sustainable economic growth. The importance of grain trade extends to other aspects of the economy, including investments in agriculture, the development of transportation and logistics infrastructure, which in turn fosters economic resilience and progress on the international stage.
Russia holds a significant position in the international grain trade, being one of the world's largest exporters of wheat and other grain crops. Thanks to its vast agricultural resources, favorable climatic conditions in key production regions, and substantial state investments in the agrarian sector, Russia consistently increases its export volumes, supplying grain to countries in the Middle East, North Africa, Southeast Asia, and other regions of the world. The main Russian regions, such as the Krasnodar Territory, Rostov Region, and Altai Territory, are leading grain producers, making a significant contribution to the total volume of Russian production and exports. These regions ensure high yields due to fertile soils and advanced agricultural technologies, allowing Russia to stably occupy leading positions in the global grain market. Furthermore, the developed transportation infrastructure in these regions facilitates efficient logistics and rapid export of grain to international ports and global markets. The participation of these regions in international trade relations is critically important for maintaining the stability of global grain supplies, which contributes to strengthening food security and economic sustainability in importing countries. Thanks to their contribution, Russia is able to respond promptly to changes in demand and maintain competitiveness in the global agricultural market.
A comprehensive analysis of the international trade in cereals involves examining the interplay of various factors, including the impact of geopolitical instability, conflicts, and trade disputes on food supply sustainability [1,2]; the logistics of grain trade, encompassing transportation costs and infrastructure limitations; the development of logistical capabilities to enhance the competitiveness of export-oriented businesses [3,4]; trade policies, including tariffs and export restrictions [5]; the export potential of countries in the context of grain trade, influenced by factors such as economic development, geographical distance, and trade agreements [6]; and the sustainable development of rural regions and the efficiency of agricultural producers, which affect their participation in international grain trade relations [7].
A range of methodologies are employed to investigate the complex issues surrounding grain trade, including statistical analysis [8], econometric and analytical methods, as well as bespoke methodologies that incorporate cultural, social, and physical factors based on field research in various regions. These approaches involve conducting interviews with traders and farmers to gain a deeper understanding of the intricacies of grain markets, particularly in developing countries [9]. Additionally, comprehensive frameworks are used to assess the profitability of grain-producing structures, taking into account production, technological, organizational, managerial, and financial indicators [10]. Gravity modeling is also a valuable tool in examining the challenges of ensuring sustainable grain trade, as it enables the analysis of the impact of various factors, such as geographical distance, economic power of countries, and trade barriers, on the volume and stability of trade flows. The gravity model has been shown to possess significant empirical reliability and explanatory power in international trade research [11], as exemplified by a study on Kazakhstan's grain export potential, which highlighted the influence of economic development and geographical distance on trade [6].
In our study, gravity modeling has been chosen as the primary research methodology. Its application in the analysis of grain exports from Russia enables researchers to identify and quantitatively assess the impact of various factors on trade, such as demand from the importing country, economic openness, differences in economic and human potential, the presence of shared borders, access to the sea, participation in trade unions, and customs tariffs. Moreover, the model's ability to predict trade volumes and potential makes it suitable for analyzing future trends in grain exports and untapped markets [12].
The objective of this study is to develop and present a mechanism for enhancing the resilience of regional export flows in global systems, using the example of Russian grain exports. To achieve this goal, the research is structured around three key tasks. Firstly, a gravity model of Russian grain exports will be constructed and calculated to provide a comprehensive understanding of the current export dynamics. Secondly, an assessment of the trade potential for cereals will be conducted, focusing on countries with zero imports of Russian grains, in order to identify new potential markets. Finally, the most competitive Russian regions in the sphere of grain exports will be determined through the calculation of the Revealed Comparative Advantage (RCA) index, allowing for a nuanced analysis of regional strengths and weaknesses.
2. Literature Overview
2.1. Export-Led Growth and Regional Trade Flow Sustainability
The impact of exports on regional economic growth has garnered significant academic interest. Numerous studies based on empirical data from regions in various countries, such as Canada [13], China [14,15], the United States [16], France [17], Mexico [18], Croatia [19], and others, demonstrate that the expansion of export flows is a key driver of regional economic growth, primarily achieved through the stimulation of economies of scale in production. For instance, in the study [20], it is shown that the high level of socio-economic development in China’s eastern macro-region is largely attributable to the value and growth dynamics of exports—accounting for approximately 90% of China's total exports. This export growth is, in turn, facilitated by the region's advantageous coastal economic-geographical position, the availability of a skilled labor force due to rapid urbanization and industrialization, and preferential policies such as tariff reductions and export subsidies. Thus, China’s experience highlights the critical importance of both exports and the development of regional export potential through the support and advancement of export-oriented industries in ensuring regional economic growth.
Various mechanisms explaining the impact of exports on regional economic growth have been described in the scientific literature. For instance, the study by R. M. Leichenko highlights a bidirectional relationship between exports and regional economic growth: exports can stimulate growth through economies of scale and increased productivity, while strong local economic conditions can, in turn, promote export growth [21]. Researchers from South Africa, O. Pretorius et al., convincingly argue that in developing regions such as the Southern African Development Community (SADC), export dynamics and economic openness are crucial for economic resilience against external shocks, and a balanced policy approach focusing on industrialization and intra-regional trade is recommended to support economic resilience [22]. The example of Brazilian micro-regions demonstrates that exports contribute to economic growth due to productivity differences between export and non-export sectors, as well as the positive externalities generated by the export sector [23]. Russian authors A. A. Fedyunina et al. show that in Russian regions, both intensive (existing products and markets) and extensive (new products and markets) export margins positively influence economic growth, with more developed regions having diversified economic structures benefiting more from export activities [24]. The growth of U.S. exports is closely linked to economic growth abroad: a slowdown in growth in key regions such as Asia and Europe can reduce U.S. export growth, impacting overall economic growth [25]. In South Africa, export specialization, particularly in the mining and agricultural sectors, has proven more beneficial for local economic growth compared to diversification [26].
To achieve sustainability of regional export flows, it is essential to focus on diversifying industries and targeting market fundamentals of potential economies [27]. This can be achieved through the development and diversification of industries, taking into account the dynamics driving global and regional value chains, and facilitating regional linkages across different sectors [28]. Additionally, it is important to consider the potential markets for exports and to revisit regional and bilateral free trade agreements with a view to improving the trade balance and achieving sustainable economic development [29]. Furthermore, the long-term sustainability of regional export flows requires the recognition of the importance of regional industrial policy, which takes account of the dynamics driving global and regional value chains and facilitates regional linkages across all sectors [30]. Lastly, it is crucial to optimize the usage of available cross-border capacity for reserve procurement and to create state-of-art technologies to materialize market coupling platforms, which can facilitate the "unlocking" of resources for cross-border electricity flows and regional cooperation [31]. Thus, a comprehensive approach to implementing export policy is essential for ensuring sustainable regional economic growth and strengthening their positions in global markets.
2.2. Gravity Model and Its Modifications
In its most general form, the gravity model of trade is an empirical tool used to estimate the trade volume between two countries based on their economic size and the distance between them. It draws an analogy to Newton's law of gravity, where the trade volume is proportional to the economic mass (GDP) of the countries and inversely proportional to the distance between them [32].
Initially, the gravity model lacked strong theoretical foundations. However, over time, theoretical advancements have demonstrated that the model can be derived from various economic frameworks with different assumptions regarding preferences, technology, and market structure [33]. The model has been widely utilized for assessing the implications of trade policies and analyzing the effects of Free Trade Agreements on international trade [11].
The gravity model can incorporate various factors such as tariffs, free trade agreements, population size, and geographical distance to estimate trade flows. It is also employed to measure trade potential by analyzing data on specific trade commodities over time [34]. Numerous studies in the scientific literature have utilized the gravity model to evaluate the export potential of various goods, including dates [35], rice [36], and non-commodity trade flows such as migration [37], and foreign direct investment [38].
In recent years, the gravity model of trade has undergone significant theoretical and methodological advancements. Notably, there have been improvements in the estimation techniques employed for the gravity model. For instance, the Poisson pseudo maximum likelihood estimator has been utilized to address issues related to zero trade flows and heteroskedasticity [39]. Furthermore, augmented versions of the gravity model now incorporate social network analysis to better comprehend the dynamics of global trade networks and imbalances [40]. The model has also been adapted to include political and institutional variables, thereby enhancing its explanatory power regarding bilateral trade flows [41]. Additionally, the gravity model has been applied to new contexts, such as cross-border e-commerce, utilizing algorithms like PageRank to analyze trade patterns [42].
Despite its widespread application, the gravity model of trade is not without its limitations. Firstly, it is criticized for lacking a robust theoretical foundation [43]. A significant limitation of the model is its failure to account for potential substitutions between trade flows, which precludes an understanding of how changes in trade with one partner may impact trade with another [44]. Moreover, the model assumes that bilateral trade flows are independent, thereby ignoring network dependencies that are crucial for understanding the dynamics of international trade [45]. The exclusion of the concept of comparative advantage also restricts the model's usefulness for practical applications, such as identifying priority markets for trade promotion [46]. Furthermore, the estimation of the gravity model is confronted with several methodological complexities, including zero trade flows, heteroskedasticity, and endogeneity, which complicate its application and interpretation in econometric research [32].
Despite its limitations, the gravity model remains a widely employed tool in economic research on international trade. Its simplicity and ability to explain a substantial proportion of the variation in trade flows render it an indispensable instrument for analysts and policymakers.
3. Materials and Methods
Over the past three decades, the gravity model has remained the most authoritative tool for studying global trade, based on the application of the law of universal gravitation. The consideration of the level of economic strength and trade costs was first econometrically presented by Tinbergen (1962) [47]. In this model, the author identified only five variables that influence the level of international trade flows: the level of GDP of countries, the distance between them, the presence of a common border between countries, and the presence of a common regional trade agreement. Later, the model was theoretically justified on the basis of macroeconomic theory (Anderson, 1979 [48]; Anderson & Wincoop, 2003 [49]; Bergstrand, 1985 [50]), Ricardo's comparative advantage model (Eaton & Kortum, 2002 [51]), Heckscher-Ohlin's factor endowment theory (Deardorff, 1998 [52]), new trade theory (Helpman & Krugman, 1985 [53]), and new-new trade theory (Helpman, Melitz, & Rubinstein, 2008 [54]). The evolution of this justification from theory to theory is described in the works of Shumilov (2006) [55] and Vashkevich (2011) [56]. The method of integrating quantitative data became regression analysis, which in the late 20th century shifted from spatial data for one year (or averaged over several years) to panel data (a dataset for several years).
There are a significant number of modifications to the gravity model, the main differences between which are determined by the type, number of variables, degree of data mixing by countries and years (panel data - for several years and many countries in one dataset, or studying dynamics for one year or several years for one country), and the application of additive or multiplicative forms of the model. In general, groups of influencing factors are typically divided into traditional factors, "natural barriers” (or structural trade barriers), and "artificial barriers" (or policy-induced trade barriers).

Table 1.
Key Economic Indicators for Gravity Model Analysis: A Statistical Overview.
| Scale | Russian Federation Date Export (1000 USD) |
Russian Federation`s GDP per capita (USD) |
Russian federation`s GDP (Million USD) |
GDP of Importing Countries (Million USD) |
GDP per capita of Importing Countries (USD) | Distance, kilometer | Russian federation`s Population (Million) | Population of Importing Countries (Million) |
|---|---|---|---|---|---|---|---|---|
| Expijtср | GDP_Rus | GDPpartner | Dist | Pop_RUS | Pop_Partner | |||
| Average | 116779.83 | 10205.85 | 1482893.42 | 391021.81 | 5246.00 | 5150.9 | 144.09 | 79.93 |
| Max | 3358283.00 | 15941.45 | 2292470.08 | 17881783.39 | 53707.98 | 12666.63 |
145.45 | 1412.36 |
| Min | 0.01 | 5910.17 | 345470.49 | 1396.56 | 255.10 | 1644.86 | 142.74 | 2.40 |
| Standard deviation | 308078.55 | 3902.33 | 567907.56 |
1699256.49 | 7812.88 | 2715.49 | 0.95 | 220.39 |
Source: TradeMap.org; World Bank.com.
3.1. Traditional Factors
Traditional factors include gross domestic product (GDP), population size, and distance, which serve as aggregate indicators of economic scale and influence on international trade. GDP reflects the capacity and strength of an exporter to supply goods to external markets. Although specific industries are not accounted for, a stronger economy, all else being equal, is generally more capable of supplying a larger quantity of goods within a given sector. However, this is not always the case; for example, the supply of rare natural resources or high-tech products does not always depend on the size of the economy, which might instead effectively integrate into the international division of labor. For grain commodities, there is a particular specificity not only linked to the economic level but also to climatic conditions. A favorable climate is typically of paramount importance for the cultivation of grains and agricultural products in general. Therefore, the correlation between the GDP of the exporting and importing countries may be weaker in such cases.
The distance between countries, even without considering logistical routes, impedes trade. Transportation costs, which act as a hidden, implicit variable, are characterized by distance. However, transportation costs are influenced not only by geographical but also by economic distance. For instance, shipping goods to a distant country with favorable import tariffs may prove more cost-effective than shipping to a less distant country with unfavorable import tariffs.
3.2. Structural Trade Barriers
In the scientific literature, researchers have frequently supplemented and modified the gravity model by incorporating both geographic and economic differences.
The population size of both the exporter and importer characterizes the economic strength of the exporter and the demand volume of the importer. GDP per capita and the difference in this indicator between the exporting and importing countries reflect disparities in economic potential. GDP per capita allows for a partial comparison of the exporter and importer regarding the differences in living standards, with the assumption that a wealthier importer will import more.
The demand for products potentially indicates the total volume imported by a country from all countries, not just from Russia. The greater the imports, the higher the potential for expanding mutual trade.
Sharing a border with an importer should also be considered, as neighboring countries are often active trading partners [57]. However, in the case of grains, this may not have a significant impact due to the similar climatic conditions for growing grains. Although this thesis is supported by international statistics—Kazakhstan, along with Russia, ranks among the largest grain exporters—it requires further verification since Russia borders 18 countries.
Access to the sea theoretically positively affects trade and mitigates the impact of distance, as maritime routes are the least expensive and most common for long-distance deliveries.
3.3. Policy-Induced Trade Barriers
We hypothesized that customs tariffs may have a barrier function, serving as measures of state coercion. Higher customs tariffs decrease the attractiveness of a foreign market.
Partnerships within unions generally have a beneficial effect on trade and economic relations, creating favorable trading conditions through preferences and non-discriminatory measures. The article considered partnerships within BRICS+, the Shanghai Cooperation Organization (SCO), the Eurasian Economic Union (EAEU), and the Commonwealth of Independent States (CIS) [58].
3.4. Gravity Model
In its classical form, the gravity model with natural logarithms of traditional factors by J. Tinbergen [47] is expressed as follows:
where the export volume from country i to country j (Expij)depends on the GDP of the exporting country i (Yi), the GDP of the importing country j (Yj), and the distance between them, which reflects transportation costs (DISTi,j). Here, "ln" denotes the natural logarithm, and represents the random error term.
This model has undergone numerous modifications, as real-world situations are generally more complex. Researchers have identified dependencies of exports on various variables characterizing geographic and economic distances. This study will use a modified additive version of the model, derived from the multiplicative model through logarithm transformation, as follows (based on the modified J. Tinbergen model [47]):
General form:
In addition to the classical model with traditional factors by J. Tinbergen, a gravity model for international grain trade has been tested using groups of global trade indicators, comparisons, and binary variables:
where:
is the logarithm of the total demand for the product by the importer from all countries in period t;
is the distance between the exporter i and the importer j;
is the logarithm of the level of economic openness of the importer jj in period t;
is the logarithm of the difference between the GDP of the exporter i and the importer j in period t;
is the logarithm of the difference in population size between the exporter i and the importer j in period t;
is a binary variable that takes the value 1 if the exporter and importer share a border, and 0 otherwise;
is a binary variable that takes the value 1 if the importer has access to the sea, and 0 otherwise;
is a binary variable that takes the value 1 if the importer and exporter are members of BRICS+, SCO, EAEU, or CIS.
The level of economic openness is calculated as the ratio of the country's foreign trade turnover to GDP. A detailed description of the research variables and data sources is provided in Table 2.
This study involved 35 countries, which are the largest importers of Russian grain crops according to available data. The selection of these countries also considered the crucial factor of data stability. The research period covered over 20 years, from 2022 to 2023. To ensure the accuracy of the results, the endogenous indicator used was the arithmetic mean of annual direct data (from the Federal Customs Service of Russia) and mirror data (from importing countries). For the years 2022-2023, only mirror data from importing countries were used, as the Federal Customs Service did not provide the corresponding information.
A special classification of goods was applied when selecting target products [59]. Only goods falling under the HS 10 commodity group (Cereals) were selected.
To calculate regional competitiveness in grain exports using the RCA index, we used customs statistics data for the years 2013-2020, with the calculations based on their average values. In general, Balassa’s (1965) RCA competitive index can be represented by the following formula (4):
where is the relative competitive advantage of product i in country j in year t, is the total world export of product i in year t, represents the total volume of exports in country j in year t, and is the total volume of world exports in year t.
The RCA index is typically calculated to determine the comparative advantages of individual countries in specific products relative to global trade figures for these products. However, RCA is often applied to regional exports within a country, providing insights into the competitive strengths of various regions. For example, a study of the fishing sector in Bali, Indonesia, using the RCA index, showed that the region possesses significant comparative advantages in exporting tuna, little tuna, skipjack, and pearls, contributing substantially to the regional economy [60]. In our calculations, instead of using national export data, we used regional export data, and instead of global export values, we used national export data.
4. Results
4.1. Gravity Model of Russian Grain Exports
4.1.1. Panel Cross-Section Dependence Test
To obtain accurate model results, it is necessary to first conduct an analysis of cross-section dependence. This method has gained widespread use in recent years, as researchers have observed correlations resulting from the impact of global events, such as the 2008 financial crisis, or local side effects in regions or countries, as documented in various studies [61,62].
The preliminary step in estimating the gravity equation is the cross-section dependence test, which is conducted to determine whether the sample data are independent. If not, the results of gravity modeling can be considered biased and unreliable [63,64].
The CD test was conducted for time-dependent variables. For variables that are not time-dependent, the CD test cannot be applied.
The results of the CD test using the Im, Pesaran, and Shin W-stat method are presented in Table 3.
Based on the CD test using the Im, Pesaran, and Shin W-stat method, the null hypothesis (absence of cross-section dependence in the residuals) is rejected. This indicates that all panel time series provide strong evidence of cross-section dependence.
4.1.2. Gravity Results
After checking the cross-section variables, the regression results for gravity equations with various specifications are presented in the Table 4. To address issues of adequacy and multicollinearity, we constructed six models.
Model 1, based on Jan Tinbergen's classical variables, proved inadequate, explaining only about 30% of the factors affecting Russian grain exports. The Prob. values indicate the statistical significance of the regression model parameters at the 5% significance level.
Model 2, which includes not only the GDP of Russia and its trading partners but also tariffs, demand, and a set of binary coefficients representing geographical differences (such as shared borders and access to the sea), as well as potential preferences, demonstrated a significantly higher explanatory power. However, the binary factors were found to be unreliable, with significance levels falling below acceptable thresholds.
The model equation presented as the fifth in our study demonstrated the highest level of factor reliability and significance according to the R-squared value. This model accounts for demand, economic openness, differences in human capital, and distance.
Quality assessment indicators confirm the high quality of Model 5.
In Model 5, the regression standard error (S.E. of regression) is the smallest, indicating that the model fits the available dataset well. In this case, the observed values deviate from the regression line by an average of 0.0921 units. Thus, the S.E. of regression may be even more useful for forecasting than R2, as it provides insight into the accuracy of predictions in terms of measurement units.
The Root Mean Squared Error (RMSE) is one of the lowest, at 0.918, suggesting that this model approximates the actual data better than the others.
The Durbin-Watson statistic exceeds 1.6, indicating the absence of autocorrelation. Among the equations, the Akaike Information Criterion (AIC) and the Schwarz Information Criterion (SBC) yielded the lowest values. Additionally, the discrepancy between the data and the model estimates is minimized in Model 5, as evidenced by the lower Sum of Squared Residuals.
4.1.2. Analysis of Regression Results
According to the best-fitting model, the variables influencing grain exports between Russia and the 35 analyzed countries can be ranked by their impact as follows: Importer demand > distance between capitals (negative coefficient) > population differences > ad valorem tariff (negative coefficient) > degree of economic openness.
Based on the econometric analysis, the following conclusions can be drawn:
- Importer demand plays a crucial role in increasing grain exports (0.446). The coefficient for this explanatory variable indicates that for every 1% increase in the logarithm of grain demand by a trading partner, the volume of exports from Russia could increase by 0.144%. This underscores the significance of rising consumer demand in bilateral grain trade.
- Geographical distance is important but not decisive for bilateral grain trade (-0.185). The farther the country, the more complex and expensive the logistics. This can be critical for food products, which are essential for all population categories, including the poor. A 1% increase in the logarithm of distance results in a 0.185% decrease in the volume of grain exports from Russia.
- Differences in population size are significant for increasing export volumes. The positive sign of the variable indicates that the smaller the population of the importing country compared to Russia's population, the greater Russia's ability to meet the grain needs of the importing country. A population difference coefficient of 0.101 suggests that a 1% increase in the population gap between Russia and the importing country leads to a 0.101% increase in the logarithm of export volumes.
- The ad valorem tariff negatively impacts grain exports (-0.066). Tariffs serve as a tool for state regulation of domestic market prices. Higher tariffs reduce import volumes, as observed in the model. A 1% increase in the logarithm of ad valorem tariffs results in a 1% decrease in grain imports.
- The level of economic openness of the trading partner is quite significant, with a coefficient of 0.024. Economic openness reflects a country’s commitment to globalization and involvement in external relations. An open economy typically has mechanisms for establishing trade and economic relations with external partners. An increase of 1% in the economic openness variable results in a 0.024% increase in grain exports.
4.2. Trade Potential Estimations
The coefficients estimated from the gravity Model 5 are used to calculate the predicted exports of cereals, which are then compared to the actual exports to determine whether an export potential for Russian cereals exists. The calculations are based on the average values of the five indicators used in the model, derived from the period 2020-2023.
The list of countries includes cereal importers during the years 2020-2023. The cereals export potential of Russia with the 164 sample countries is presented in the Appendix A. In many cases, the calculated potential export volume of cereals from Russia significantly exceeded the domestic demand for these products. A summary table of potential cereal export markets for Russia is provided below.
Table 6.
Potential cereal export markets for Russia.
| Afghanistan, Albania, Algeria, Angola, Armenia, Australia, Austria, Azerbaijan, Bahrain, Belarus, Belgium, Benin, Brunei Darussalam, Bulgaria, Burkina Faso, Burundi, Cabo Verde, Cameroon, Canada, Central African Republic, Chile, Colombia, Congo, DR Congo, Côte d'Ivoire, Croatia, Cyprus, Czech Republic, Denmark, Djibouti, Dominican Republic, Ecuador, Egypt, Eritrea, Estonia, Ethiopia, Finland, France, Gabon, Gambia, Georgia, Germany, Ghana, Greece, Guatemala, Guinea, Haiti, , Hungary , Iran, Iraq, Ireland, Israel, Italy, Japan, Jordan, Kazakhstan, Kenya, Democratic People's Republic of Korea, Republic of Korea, Kuwait, Kyrgyzstan, Latvia, Lebanon, Liberia, Libya, State of, Lithuania, Madagascar, Malawi, Malaysia, Mali, Malta, Mauritania, Mexico, Moldova, Republic of, Mongolia, Montenegro, Morocco, Mozambique, Namibia, Nepal, Netherlands, Nicaragua, Norway, Oman, Palestine, Panama, Peru, Philippines, Poland, Portugal, Qatar, Romania, Rwanda, Saudi Arabia, Senegal, Serbia, Singapore, Slovenia, Somalia, South Africa, Spain, Sri Lanka, Sudan, Sweden, Switzerland, Syrian Arab Republic, Tajikistan, Tanzania, Thailand, Togo, Tunisia, Türkiye, Turkmenistan, Uganda, Ukraine, United Arab Emirates, United Kingdom, Uzbekistan, Venezuela, Bolivarian Republic of, Viet Nam, Yemen, Zimbabwe | Andorra, Argentina, Bermuda, Bhutan, Bolivia, Bosnia and Herzegovina, Botswana, Cambodia, Chad, Costa Rica, Cuba, Equatorial Guinea, Eswatini, Greenland, Grenada, Honduras, Hong Kong, China, Iceland, Jamaica, Lesotho, Luxembourg, North Macedonia, New Zealand, Niger, Papua New Guinea, Paraguay, Sierra Leone, Slovakia, South Sudan, Suriname, Uruguay, Zambia, | Bangladesh, Brazil, China, India, Indonesia, Nigeria, Pakistan, United States of America |
Source: developed by the authors.
To assess the export potential of cereals from Russia, we compared the values obtained from our calculations by substituting into the model 5 with the average annual values of actual cereal trade between Russia and foreign countries. This resulted in the identification of three groups of countries.
The first, and largest group, consists of countries to which Russia already exports cereals (the total list of cereal importers from Russia in 2023 comprised 102 countries), where the actual export value is significantly lower than the calculated potential . This group is quite diverse and includes most EU countries. Due to sanctions and reciprocal measures, the actual export value to these countries has been disproportionately low compared to the potential facilitated by geographic proximity and the "economic power" of European nations.
The second group includes countries with zero or near-zero current cereal exports; there are relatively few such countries.
The third group comprises countries where there is no potential to expand current export volumes, with 〖. This group includes only eight countries: Bangladesh, Brazil, China, India, Indonesia, Nigeria, Pakistan, and the United States of America.
The calculated export potential indicates that Russia could supply cereals to both countries with zero current exports and expand cereal exports to numerous countries across different continents, despite significant distances, tariff barriers, and disparities in population size and economic scale. However, several objective challenges hinder this potential: limited cereal production in certain regions of Russia, unstable domestic harvests, and logistical issues, especially in Siberia, where historically underdeveloped export infrastructure requires modernization. Additionally, the Russia-Ukraine conflict has disrupted traditional export routes and raised concerns about the stability of the agro-food system, negatively impacting export flows and contributing to rising global food prices. The use of tariff quotas by the Russian government to regulate cereal exports also adds complexity to the supply planning process.
4.3. The Most Competitive Russian Regions in Cereal Exports: RCA Estimations
As mentioned above, the largest grain-producing regions in Russia are the Krasnodar Territory, Rostov Oblast, and Altai Territory. However, the highest values of cereal exports from 2016 to 2020 were observed in the Rostov Oblast, Moscow, and the Krasnodar Territory, accounting for approximately 70% of Russia's total cereal exports in various years. The inclusion of a federal city and a highly urbanized region in this top three is due to the fact that customs statistics in Russia are collected based on the tax registration location of the sender/recipient company, rather than the location of the customs point through which the goods pass. Many large agribusinesses operating in the regions register their exported goods not in the region of production or consumption but at the headquarters, most often located in Moscow.
Figure 1 shows the structure of Russian cereal exports by region over the years, featuring the ten largest cereal exporters in Russia.
Between 2013 and 2020, significant regional shifts were observed in grain exports. The Rostov region solidified its position as the leading grain exporter, increasing its export share from 24.46% in 2013 to 40.67% in 2020. This growth may be attributed to the expansion of the agro-industrial sector in the region and improvements in grain export infrastructure.
The calculated RCA (Revealed Comparative Advantage) for Russian regions with grain exports from 2013 to 2020 is presented in Table 7.
In the most general terms, the interpretation of calculated RCA values employs a simple scale, where an RCA value greater than 1 indicates that a region has a comparative advantage in that product, while a value less than 1 suggests a comparative disadvantage [65]. Our calculations revealed that the majority of regions demonstrated comparative advantages in cereal exports during almost all periods (with exceptions for periods where no exports were recorded—these received zero values in Table 7). This is largely due to the fact that the regions listed in the table possess favorable climates and soil, large areas of land for cereal cultivation, and well-developed infrastructure such as ports, railways, and highways, allowing them to transport grain more efficiently and quickly to buyers in Asia and Africa. Additionally, these regions receive government support in the form of subsidies, loans, or other forms of assistance.
The main leaders in cereal exports during the analyzed period are Rostov Region, Krasnodar Krai, and Stavropol Krai, with an RCA exceeding 10 in most periods, except for Stavropol Krai, which is rapidly losing its comparative advantage due to the diversification of its export portfolio. Other Russian regions, such as Voronezh, Kaliningrad, Astrakhan, and Oryol, have RCA values exceeding the corresponding indicator calculated for the Russian Federation as a whole. Overall, the RCA values for Russia indicate that the country has a strong and growing comparative advantage in cereal exports. In recent years, grain has become a strategic export commodity for Russia, contributing significantly to the national economy and budget [66]. The government has implemented various mechanisms for regulating grain prices and supporting exports, further enhancing Russia's role in the global market. Moreover, active foreign economic policies and state support for exports have also played a crucial role in increasing Russian cereal exports, including efforts to expand market access and enhance export potential [67].
5. Discussion
The aim of this study is to develop a mechanism for enhancing the sustainability of a region within global systems. Additionally, the study examines the impact of various factors such as demand from importing countries, economic openness, differences in economic and human potential, the presence of shared borders, access to the sea, participation in trade unions, and customs tariffs on external grain trade. Russia was chosen as the research field due to its status as one of the largest producers and suppliers in the global grain market. Moreover, many Russian regions have actively increased agricultural production in recent years, including for external markets.
Positive effects on grain exports were demonstrated in Russian data for factors related to the openness of the importer’s economy, consistent with existing literature [50,52]. However, unlike previous studies [11], our results did not show a trade effect from existing trade agreements. We believe this is due to the nature of grain as an essential commodity. Regardless of trade preferences, countries in need of grain will be compelled to purchase it, taking into account their financial capabilities, as observed in African nations. The weak correlation between Russian grain exports and trade agreements may be explained by the fact that some key union partners, such as Kazakhstan, are also major grain exporters, while others, like Armenia and Kyrgyzstan, prefer to purchase processed grains (flour, packaged cereals), which are classified under different HS codes.
For similar reasons, the influence of borders was found to be weak, in contrast to earlier literature findings [36]. Unlike previous conclusions, our model did not show a direct influence of a country's GDP or GDP differences between countries. However, we believe that the importer's GDP indirectly influences trade, as it is considered in the indicator of the importer's economic openness.
We measured the influence of factors on grain exports more precisely, considering important characteristics for the state and exporters, such as potential demand, the level of economic openness, and tariff restrictions. These are the factors that regional exporters should primarily consider when choosing a country for grain supplies. Compared to earlier studies [34,37,39], we enhanced the verification of factors influencing trade flows. The predictive accuracy of the resulting model equation exceeds 90%, providing new empirical data for the development of trade-economic relations within global systems and offering a foundation for application in other countries and markets.
Typically, studies on mechanisms for enhancing the resilience of commodity flows are considered at the international level, overlooking the important element of regional foreign trade. A sustainable trade mechanism will not function fully without considering the potential of specific regions and territories that possess this potential. By including the RCA index calculation for regions, we expanded upon previous research [36] and identified promising regions for export activation. Predictive calculations based on the obtained gravity model allowed us to highlight countries with potential for export development, even those currently with zero exports. Thus, we developed a mechanism to enhance the resilience of export flows in the grain market, based on comparing the potential of global market countries with grain needs and the potential of the country's regions—producers of the product.
5.1. Policy Recommendations
Grain exports are crucial for ensuring global food security. Our article demonstrates that Russia has significant potential to expand production and substantially increase its contribution to global food security. Many Russian regions are already grain exporters and, given climate change, the current state of fertilizer production in the country, and the availability of fertile lands, can increase production volumes.
Demand is a decisive factor, as the need for grain worldwide continues to grow year after year. Among the countries with the greatest potential for expanding grain trade are prospective Russian trade partners in Asia and Africa, as well as some EU countries. The data obtained shows that the potential for expanding exports from Russia is far from exhausted. An increasing number of Russian regions have been ramping up grain production in recent years but face challenges with sales, and there is a growing shortage of skilled labor and rising costs of electricity and loans. The government needs to support agricultural production, including by preventing further increases in the key interest rate, as loans for working capital and modernization of the material and technical base are becoming too expensive.
Russian exporters also face logistical and cross-border payment problems due to sanctions. These problems require solutions not only from the Russian authorities but also from the interested international political and economic community. There is an urgent need to address all the problems and obstacles to grain exports from Russia to protect Russian exporters from the antagonism of certain countries.
6. Conclusions
This article explores a critical issue in trade-economic relations: ensuring the resilience of export flows. In constructing a mechanism to enhance export flow resilience, we assumed that such resilience can only be achieved through the broader involvement of regional producers.
This article presents the following conclusions, which are connected to policy recommendations:
Firstly, demand factors have the greatest leverage in increasing exports, followed by population differences, although this factor, while evident from an economic theory perspective, was previously not included in the model. The level of economic openness of the importing country contributes to enhancing export resilience, as it reflects the country’s experience in foreign trade and, indirectly, indicates the level of development of the country's foreign economic infrastructure. The magnitude of the ad valorem tariff can be a source of reduced export resilience since its increase leads to a synchronous decline in exports.
Secondly, based on the developed gravity model, a broad group of countries with potential for grain export growth was identified, along with conditions for expanding trade: increased grain production and the removal of logistical and sanction barriers. We did not limit the list of countries to only those that have not imposed or supported sanctions against Russia, as military conflicts eventually end, while the results of scientific research remain available to a wide audience of interested parties.
Thirdly, it was demonstrated that most Russian regions already possess competitive advantages for grain exports, and the number of such regions increased between 2013 and 2020. A group of promising regions was identified, which, with increased production, could expand their export volumes.
Thus, the elements of the mechanism for enhancing export flow resilience in Russian grain trade are presented, including a gravity model, an assessment of the importing country's potential, and the export potential of Russian regions. Our calculations indicate that using the proposed mechanism and implementing the policy measures outlined in the article will contribute to the growth of grain exports.
Author Contributions
Conceptualization, G.A.K., M.V.K., E.A.K. and M.S.G.; methodology, G.A.K., M.V.K.; formal analysis, G.A.K., M.V.K.; investigation, G.A.K, M.V.K.; writing—original draft preparation, G.A.K., M.V.K. E.A.K. and M.S.G.; writing—review and editing, G.A.K., M.V.K., E.A.K. and M.S.G. All authors have read and agreed to the published version of the manuscript.
Funding
The research was funded by of Ministry of Science and Higher Education of the Russian Federation, theme № 123101700401-0 (FSSR-2023-0003).
Institutional Review Board Statement
Not applicable.
Informed Consent Statement
Not applicable.
Data Availability Statement
The data supporting reported results are publicly available and can be found in the sites: TradeMap.org, UN Comtrade, WDI, World Bank, CEPII database, YandexMap, WTO, MID RF, Ru-Stat.su.
Acknowledgments
In this section, you can acknowledge any support given which is not covered by the author contribution or funding sections. This may include administrative and technical support, or donations in kind (e.g., materials used for experiments).
Conflicts of Interest
The authors declare no conflicts of interest.
Appendix A
Estimated and Actual Grain Export Potential from Russia
| Country | Expfact mln doll | Exppotential mln doll | Expfact | Expfact mln doll | Exppotential mln doll |
| Afghanistan | 10,638.0 | 323.8 | Kenya | 9,669.6 | 1,079.3 |
| Albania | 14,355.5 | 94.4 | Korea. Democratic People's Republic of | 11,986.3 | 43.5 |
| Algeria | 11,568.3 | 3,298.3 | Korea. Republic of | 11,699.5 | 5,227.4 |
| Andorra | 14,589.6 | 0.8 | Kuwait | 14,425.5 | 592.3 |
| Angola | 11,315.2 | 584.9 | Kyrgyzstan | 13,935.3 | 72.9 |
| Argentina | 9,967.2 | 48.7 | Latvia | 14,528.7 | 276.9 |
| Armenia | 14,361.5 | 106.7 | Lebanon | 14,203.5 | 372.4 |
| Australia | 12,086.2 | 266.2 | Lesotho | 14,384.0 | 48.0 |
| Austria | 14,038.5 | 791.8 | Liberia | 14,156.3 | 206.3 |
| Azerbaijan | 13,757.9 | 413.9 | Libya. State of | 14,127.9 | 485.7 |
| Bahrain | 14,500.4 | 121.2 | Lithuania | 14,379.1 | 153.9 |
| Bangladesh | -1,602.8 | 2,232.2 | Luxembourg | 14,561.5 | 70.6 |
| Belarus | 13,700.9 | 93.4 | Macedonia. North | 14,613.1 | 39.4 |
| Belgium | 14,653.6 | 2,770.6 | Madagascar | 14,732.8 | 310.5 |
| Benin | 13,535.3 | 608.5 | Malawi | 14,617.2 | 50.9 |
| Bermuda | 14,588.7 | 1.6 | Malaysia | 12,181.6 | 2,234.2 |
| Bhutan | 14,535.9 | 44.3 | Mali | 12,453.4 | 238.3 |
| Bolivia. Plurinational State of | 13,382.6 | 37.9 | Malta | 14,557.4 | 34.8 |
| Bosnia and Herzegovina | 14,330.2 | 142.9 | Mauritania | 14,241.2 | 266.7 |
| Botswana | 14,401.6 | 159.3 | Mexico | 5,086.2 | 7,479.9 |
| Brazil | -5,918.0 | 2,656.1 | Moldova. Republic of | 14,354.9 | 40.9 |
| Brunei Darussalam | 14,565.9 | 37.6 | Mongolia | 14,282.5 | 63.0 |
| Bulgaria | 13,988.8 | 151.6 | Montenegro | 14,538.2 | 11.5 |
| Burkina Faso | 12,417.7 | 188.3 | Morocco | 12,097.7 | 2,839.5 |
| Burundi | 13,326.7 | 38.6 | Mozambique | 11,588.7 | 628.0 |
| Cabo Verde | 14,566.7 | 41.5 | Namibia | 14,386.4 | 110.8 |
| Cambodia | 12,944.2 | 75.9 | Nepal | 11,781.1 | 531.4 |
| Cameroon | 12,070.3 | 583.2 | Netherlands | 14,569.9 | 3,937.1 |
| Canada | 11,334.6 | 1,483.4 | New Zealand | 14,205.7 | 295.1 |
| Central African Republic | 14,041.8 | 12.6 | Nicaragua | 14,015.0 | 264.7 |
| Chad | 12,835.4 | 8.1 | Niger | 12,187.0 | 432.3 |
| Chile | 13,316.9 | 1,555.6 | Nigeria | -6,186.8 | 2,323.7 |
| China | -12,0252.1 | 17,316.7 | Norway | 14,126.0 | 179.3 |
| Colombia | 10,562.3 | 2,646.2 | Oman | 14,438.8 | 684.5 |
| Congo | 14,056.0 | 129.4 | Pakistan | -8,594.9 | 933.4 |
| Congo. Democratic Republic of the | 4,841.9 | 213.7 | Palestine. State of | 14,635.2 | 89.4 |
| Costa Rica | 14,287.8 | 484.0 | Panama | 14,271.9 | 270.1 |
| Côte d'Ivoire | 12,224.6 | 988.5 | Papua New Guinea | 13,694.1 | 257.4 |
| Croatia | 14,254.4 | 120.3 | Paraguay | 13,952.0 | 88.2 |
| Cuba | 13,701.3 | 543.8 | Peru | 12,037.0 | 1,934.7 |
| Cyprus | 14,540.8 | 160.1 | Philippines | 4,621.9 | 3,624.3 |
| Czech Republic | 13,620.5 | 234.0 | Poland | 11,173.6 | 771.4 |
| Denmark | 14,109.7 | 243.2 | Portugal | 14,094.6 | 1,236.1 |
| Djibouti | 14,619.8 | 307.8 | Qatar | 14,435.9 | 257.5 |
| Dominican Republic | 13,750.6 | 638.2 | Romania | 13,036.2 | 834.1 |
| Ecuador | 13,052.7 | 597.1 | Rwanda | 13,292.4 | 164.4 |
| Egypt | 6,318.4 | 6,376.8 | Saudi Arabia | 12,761.7 | 4,115.3 |
| Equatorial Guinea | 14,605.0 | 23.0 | Senegal | 13,260.3 | 880.2 |
| Eritrea | 14,238.5 | 27.6 | Serbia | 13,937.7 | 54.5 |
| Estonia | 14,472.6 | 28.2 | Sierra Leone | 13,800.1 | 146.4 |
| Eswatini | 14,512.7 | 84.4 | Singapore | 14,179.0 | 353.5 |
| Ethiopia | 2,786.7 | 1,116.9 | Slovakia | 14,121.9 | 170.2 |
| Finland | 14,070.7 | 80.2 | Slovenia | 14,438.4 | 125.6 |
| France | 8,250.8 | 1,143.8 | Somalia | 12,953.8 | 246.5 |
| Gabon | 14,414.4 | 131.3 | South Africa | 9,086.3 | 1,153.6 |
| Gambia | 14,351.0 | 58.9 | South Sudan | 13,516.7 | 36.7 |
| Georgia | 14,269.4 | 112.4 | Spain | 12,052.3 | 5,107.8 |
| Germany | 7,937.7 | 4,017.5 | Sri Lanka | 12,574.5 | 469.1 |
| Ghana | 11,443.3 | 441.9 | Sudan | 10,153.8 | 520.3 |
| Greece | 13,793.5 | 582.8 | Suriname | 14,550.7 | 10.5 |
| Greenland | 14,589.7 | 0.8 | Sweden | 13,616.0 | 169.5 |
| Grenada | 14,586.8 | 5.5 | Switzerland | 13,883.7 | 383.8 |
| Guatemala | 13,194.2 | 764.0 | Syrian Arab Republic | 12,454.2 | 150.0 |
| Guinea | 13,394.7 | 411.3 | Tajikistan | 13,740.6 | 313.5 |
| Guinea-Bissau | 14,401.1 | 37.8 | Tanzania. United Republic of | 8,236.8 | 364.3 |
| Guyana | 14,530.9 | 40.8 | Thailand | 8,011.1 | 1,463.1 |
| Haiti | 13,594.9 | 367.5 | Togo | 13,748.8 | 84.2 |
| Honduras | 13,715.6 | 376.1 | Tunisia | 13,937.1 | 1,311.9 |
| Hong Kong. China | 13,963.5 | 270.8 | Türkiye | 8,069.2 | 4,493.4 |
| Hungary | 13,841.0 | 498.7 | Turkmenistan | 13,995.4 | 100.5 |
| Iceland | 14,587.5 | 27.3 | Uganda | 10,067.8 | 385.3 |
| India | -128,016.3 | 100.5 | Ukraine | 10,547.4 | 154.3 |
| Indonesia | -11,195.0 | 4,375.9 | United Arab Emirates | 14,224.2 | 1,297.6 |
| Iran. Islamic Republic of | 8,249.7 | 5,753.3 | United Kingdom | 8,687.0 | 2,052.3 |
| Iraq | 10,808.7 | 1,478.9 | United States of America | -17,692.8 | 3,003.7 |
| Ireland | 14,332.9 | 566.9 | Uruguay | 14,294.6 | 105.8 |
| Israel | 14,134.7 | 1,112.7 | Uzbekistan | 11,360.2 | 740.7 |
| Italy | 10,784.9 | 4,832.6 | Venezuela. Bolivarian Republic of | 12,045.8 | 731.0 |
| Jamaica | 14,402.0 | 209.2 | Viet Nam | 6,843.1 | 4,765.3 |
| Japan | 5,399.8 | 7,780.9 | Yemen | 13,205.7 | 1,356.7 |
| Jordan | 13,915.7 | 1,006.6 | Zambia | 11,246.8 | 47.1 |
| Kazakhstan | 12,774.2 | 303.5 | Zimbabwe | 13,142.5 | 404.7 |
References
- Wang, G.; Li, B.; Liu, X. Evolution of global grain trade network and supply risk assessment based on complex network. New Medit 2023. [CrossRef]
- Yin, Z.; Hu, J.; Zhang, J.; Zhou, X.; Li, L.; Wu, J. Temporal and spatial evolution of global major grain trade patterns. J Integr Agric 2024, 23(03), 1075. [CrossRef]
- Kibik, O.; Kovyrkina, O. The logistics component in the export activity management system of grain traders under global uncertainty. Development of management and governance methods in transport 2023, 2(83), pp. 107–117. [CrossRef]
- Çakır, F. S.; Zehir, S. Y.; Adıgüzel, Z. Examination of the effects of logistics capabilities and learning orientation on financial and growth performance and export performance in export-oriented companies. Uluslararası Yönetim İktisat ve İşletme Dergisi 2022, 18(4), pp. 1089-1109. [CrossRef]
- Fu, J.; Tong, G. The State of Grain Trade between China and Russia: Analysis of Growth Effect and Its Influencing Factors. Agriculture 2023, 13, 1407. [CrossRef]
- Wang, Y.; Huang, P.; Khan, Z. A.; Wei, F. Potential of Kazakhstan’s grain export trade. Ciência Rural 2021, 52(1), e20210199. [CrossRef]
- Novikov, Yu.; Baetova, D. Grain export as a factor of sustainable development of rural territories of the Omsk region. Food Processing Technology 2018, 48(3), pp. 50–57. [CrossRef]
- Khan, Y.; Taipov, T.; Kantarbayeva, S.; Khan, V. Kazakhstan: Transport and Logistical Risks in Grain Export. Valery, Kazakhstan: Transport and Logistical Risks in Grain Export (June 20, 2017). [CrossRef]
- Bryceson, D. F. Too Many Assumptions Researching Grain Markets in Tanzania. Inducing Food Insecurity: Perspectives on Food Policies in Eastern and Southern Africa 1994, 30, 145.
- Syzdykova, A.O.; Azretbergenova, G. Grain exports of the Republic of Kazakhstan. Problems of AgriMarket 2020, 4, pp. 63-69. [CrossRef]
- Kepaptsoglou, K.; Karlaftis, M. G.; Tsamboulas, D. The gravity model specification for modeling international trade flows and free trade agreement effects: a 10-year review of empirical studies. The open economics journal 2010, 3(1). [CrossRef]
- Yang, W. Evaluation of International Import and Export Complexity Based on Trade Gravity model. In International Conference on Data Science and Network Security (ICDSNS), Tiptur, India, 2023, pp. 1-7. [CrossRef]
- Anderson, M.A.; Smith, S.L.S. Canadian provinces in world trade: engagement and detachment. The Canadian Journal of Economics / Revue Canadienne d’Economique 1999, 32(1), pp. 22–38. [CrossRef]
- Melchior, A. Globalisation and the provinces of China: the role of domestic versus international trade integration. Journal of Chinese Economic and Business Studies 2010, 8(3), pp. 227-252. [CrossRef]
- He, C.; Ren, Z.; Zhu, S.; Hu, X. Temporary extra-regional linkages and export product and market diversification. Regional Studies 2023, 57(8), pp. 1578-1591. [CrossRef]
- Silva, J.A.; Leichenko, R. M. Regional income inequality and international trade. Economic Geography 2004, 80(3), pp. 261-286. [CrossRef]
- Maschke, A. Exporting unemployment? Assessing the impact of German import competition on regional manufacturing employment in France. Regional Studies 2024, 58(3), pp. 455-468. [CrossRef]
- Biles, J.J. Export-oriented industrialization and regional development: a case study of maquiladora production in Yucatán, Mexico. Regional studies 2004, 38(5), pp. 517-532. [CrossRef]
- Mance, D.; Debelić, B.; Vilke, S. Croatian Regional Export Value-Added Chains. Economies 2023, 11, 202. [CrossRef]
- Li, P.; Li, L.; Zhang, X. Regional Inequality of Firms’ Export Opportunity in China: Geographical Location and Economic Openness. Sustainability 2020, 12, 9. [CrossRef]
- Leichenko, R.M. Exports, employment, and production: A causal assessment of US states and regions. Economic Geography 2000, 76(4), pp. 303-325. [CrossRef]
- Pretorius, O.; Drewes, E.; van Aswegen, M.; Malan, G. A Policy Approach towards Achieving Regional Economic Resilience in Developing Countries: Evidence from the SADC. Sustainability 2021, 13, 2674. [CrossRef]
- Carmo, A.S.S.D.; Raiher, A.P.; Stege, A.L. O efeito das exportações no crescimento econômico das microrregiões brasileiras: uma análise espacial com dados em painel. Estudos Econômicos (São Paulo) 2017, 47(1), pp. 153-183. [CrossRef]
- Fedyunina, A.A.; Simachev, Yu.V.; Drapkin, I.M. Intensive and extensive margins of export: determinants of economic growth in Russian regions under sanctions. Ekonomika regiona / Economy of regions 2023, 19(3), pp. 884-897. [CrossRef]
- Nie, J.; Taylor, L. Economic growth in foreign regions and US export growth. Economic Review-Federal Reserve Bank of Kansas City 2013, pp. 31–63.
- Naudé, W.; Bosker, M.; Matthee, M. Export specialisation and local economic growth. World Economy 2010, 33(4), pp. 552–572. [CrossRef]
- Abbas, S.; Waheed, A. Pakistan’s potential export flow: The gravity model approach. The Journal of Developing Areas 2015, 49(4), pp. 367–378. [CrossRef]
- Black, A.; Edwards, L.; Ismail, F.’; Makundi, B.; Morris, M. Spreading the gains?: Prospects and policies for the development of regional value chains in Southern Africa. WIDER Working Paper 2019/48. Helsinki: UNU-WIDER. [CrossRef]
- Istaiteyeh, R.; Najem, F.; Saqfalhait, N. Exports- and Imports-Led Growth: Evidence from a Time Series Analysis, Case of Jordan. Economies 2023, 11, 135. [CrossRef]
- Black, A.; Edwards, L.; Ismail, F.; Makundi, B.; Morris, M. The role of regional value chains in fostering regional integration in Southern Africa. Development Southern Africa 2021, 38(1), pp. 39–56. [CrossRef]
- Vokony, I.; Sőrés, P.; Németh, B.; Hartmann, B. Market design for cross-border co-optimised energy-reserve allocation. In 21th International Conference on Renewable Energies and Power Quality (ICREPQ’23), Madrid, Spain, 24th to 26th May 2023. [CrossRef]
- Cont, W.; Barril, D.; Carbó, A. Electricity trade in South America: An analysis based on the gravity equation. Asociación Argentina de Economía Política 2021, 4456. [CrossRef]
- Baier, S.; Standaert, S. Gravity models and empirical trade. In Oxford research encyclopedia of economics and finance 2020. Retrieved 12 Aug. 2024, from https://oxfordre.com/economics/view/10.1093/acrefore/9780190625979.001.0001/acrefore-9780190625979-e-327.
- Sinaga, A.M.; Masyhuri, D.D.H.; Widodo, S. Employing gravity model to measure international trade potential. IOP Conference Series: Materials Science and Engineering 2019, 546(5), 052072. IOP Publishing. [CrossRef]
- Alamri, Y.A.; Alnafissa, M.A.; Kotb, A.; Alagsam, F.; Aldakhil, A.I.; Alfadil, I.E.; Al-Qunaibet, M.H.; Alaagib, S. Estimating the Expected Commercial Potential of Saudi Date Exports to Middle Eastern Countries Using the Gravity Model. Sustainability 2024, 16, 2552. [CrossRef]
- Irshad, M. S.; Xin, Q.; Arshad, H.; Aye, G. Competitiveness of Pakistani rice in international market and export potential with global world: A panel gravity approach. Cogent Economics & Finance 2018, 6(1). [CrossRef]
- Yu, X.; Qin, K.; Jia, T.; Zhou, Y.; Gao, X. Modeling the Interactive Patterns of International Migration Network through a Reverse Gravity Approach. Sustainability 2024, 16, 2502. [CrossRef]
- Groznykh, R.I.; Mariev, O.S. Impact of institutional factors on foreign direct investment inflows: Crosscountry analysis. Zhurnal Economicheskoj Teorii [Russian Journal of Economic Theory] 2019, 16(2), pp. 305–311. [CrossRef]
- Dadakas, D.; Ghazvini Kor, S.; Fargher, S. Examining the trade potential of the UAE using a gravity model and a Poisson pseudo maximum likelihood estimator. J Int Trade Econ Dev 2020, 29(5), pp. 619–646. [CrossRef]
- Coşkuner, Ç.; Sogah, R. Augmented Gravity Model of Trade with Social Network Analysis. Sustainability 2023, 15, 14085. [CrossRef]
- Ward, M.D.; Hoff, P.D. Persistent patterns of international commerce. J Peace Res 2007, 44(2), pp. 157–175. [CrossRef]
- Chen, J. Algorithm analysis of trade gravity model based on PageRank algorithm. In International Conference on Electronics and Devices, Computational Science (ICEDCS), Marseille, France, 2023, pp. 201-204. [CrossRef]
- Bikker, J.A. An international trade flow model with substitution: an extension of the gravity model. Kyklos 1987, 40(3), pp. 315–337. [CrossRef]
- Prastuti, G.; Permatasari, I.; Satmoko, A.S.A.; Imran, A. Detecting Cross-Border Transaction Patterns Using Machine Learning: The Case of Indonesia. Available at SSRN 4736381. [CrossRef]
- Ward, M.D.; Ahlquist, J.S.; Rozenas, A. Gravity's rainbow: A dynamic latent space model for the world trade network. Network Science 2013, 1(1), pp. 95–118. [CrossRef]
- Ciuriak, D.; Kinjo, S. Trade specialization in the gravity model of international trade. Trade policy research 2006, 2005, pp. 189–197.
- Tinbergen, J. Shaping the world economy: Suggestions for an international economic policy. NY: Twentieth Century Fund, 1962. 330 p.
- Anderson, J.E. A theoretical foundation for the gravity equation. Am Econ Rev 1979, 69(1), pp. 106-116. http://www.jstor.org/stable/1802501.
- Anderson, J.E.; Van Wincoop, E. Gravity with gravitas: A solution to the border puzzle. Am Econ Rev 2003, 93(1), pp. 170-192. [CrossRef]
- Bergstrand, J.H. The Gravity Equation in International Trade: Some Microeconomic Foundations and Empirical Evidence. Rev Econ Stat 1985, 67(3), pp. 474–481. [CrossRef]
- Eaton, J.; Kortum, S. Technology, geography, and trade. Econometrica 2002, 70(5), pp. 1741–1779. [CrossRef]
- Deardorff, A.V. Determinants of bilateral trade: does gravity work in a neoclassical world? National Bureau of Economic Research: Cambridge, MA, USA, 1998.
- Helpman, E.; Krugman, P. Market structure and foreign trade: Increasing returns, imperfect competition, and the international economy. MIT press, 1987.
- Helpman, E.; Melitz, M.; Rubinstein, Y. Estimating trade flows: Trading partners and trading volumes. Q J Econ 2008, 123(2), pp. 441–487. [CrossRef]
- Shumilov, A. Estimating gravity models of international trade: A survey of methods. HSE Economic Journal 2017, 21(2), pp. 224–250.
- Vashkevich, Y. Gravity model of international trade: assessing the effectiveness of integration in services sector. The scientific heritage 2021, 74(4), pp. 11-16. [CrossRef]
- Kaukin, A.; Idrisov, G. The gravity model of Russian foreign trade: case of a country with large area and long border. Econ Policy 2013, 4, pp. 133–154.
- Aksenov, G.; Li, R.; Abbas, Q.; Fambo, H.; Popkov, S.; Ponkratov, V.; Kosov, M.; Elyakova, I.; Vasiljeva, M. Development of Trade and Financial-Economical Relationships between China and Russia: A Study Based on the Trade Gravity Model. Sustainability 2023, 15, 6099. [CrossRef]
- Product nomenclature of the foreign economic activity of the Commonwealth of Independent States (ТН ВЭД СНГ) (based on the 6th edition of the Harmonized Commodity Description and Coding System). Available online: https://www.consultant.ru/document/cons_doc_LAW_133442/ (accessed on 12 August 2024).
- Putri, K.D.K.; Darmawan, D.P.; Arisena, G.M.K. Kontribusi sektor perikanan terhadap perekonomian provinsi bali. Jurnal Kebijakan Sosial Ekonomi Kelautan Dan Perikanan 2021, 11(1), pp. 41–50. [CrossRef]
- Eberhardt, M.; Teal, F. Aggregation versus heterogeneity in cross-country growth empirics. CSAE working paper series 2010-32, Centre for the study of African economies, University of Oxford.
- Moscone, F.; Tosetti, E. GMM estimation of spatial panels, MPRA Paper 16327, University Library of Munich, Germany, 2009. Available online: https://mpra.ub.uni-muenchen.de/id/eprint/16327 (accessed on 12 August 2024).
- Breusch, T.S.; Pagan, A.R. The Lagrange multiplier test and its applications to model specification in econometrics. Review of Econometric Studies 1980, 47(1), pp. 239–253. [CrossRef]
- Pesaran, M.H. General diagnostic tests for cross-sectional dependence in panels. Empir Econ 2021, 60(1), pp. 13–50. [CrossRef]
- Gnidchenko, A.; Salnikov, V. Trade intensity, net trade, and revealed comparative advantage. Higher School of Economics Research Paper 2021, WP BRP, 244. [CrossRef]
- Agapkin, A.M.; Makhotina, I.A. The state of the Russian grain market. International trade and trade policy 2021, 7(3). [CrossRef]
- Shchutskaya, A.V.; Ivanova, E.E. Exports of Russian cereals: analysis of the current state and development prospects. SHS Web of Conferences 2019, 62, 08006. [CrossRef]
Figure 1.
Ten largest cereal exporters in Russia. Source: developed by data Ru-Stat.su.
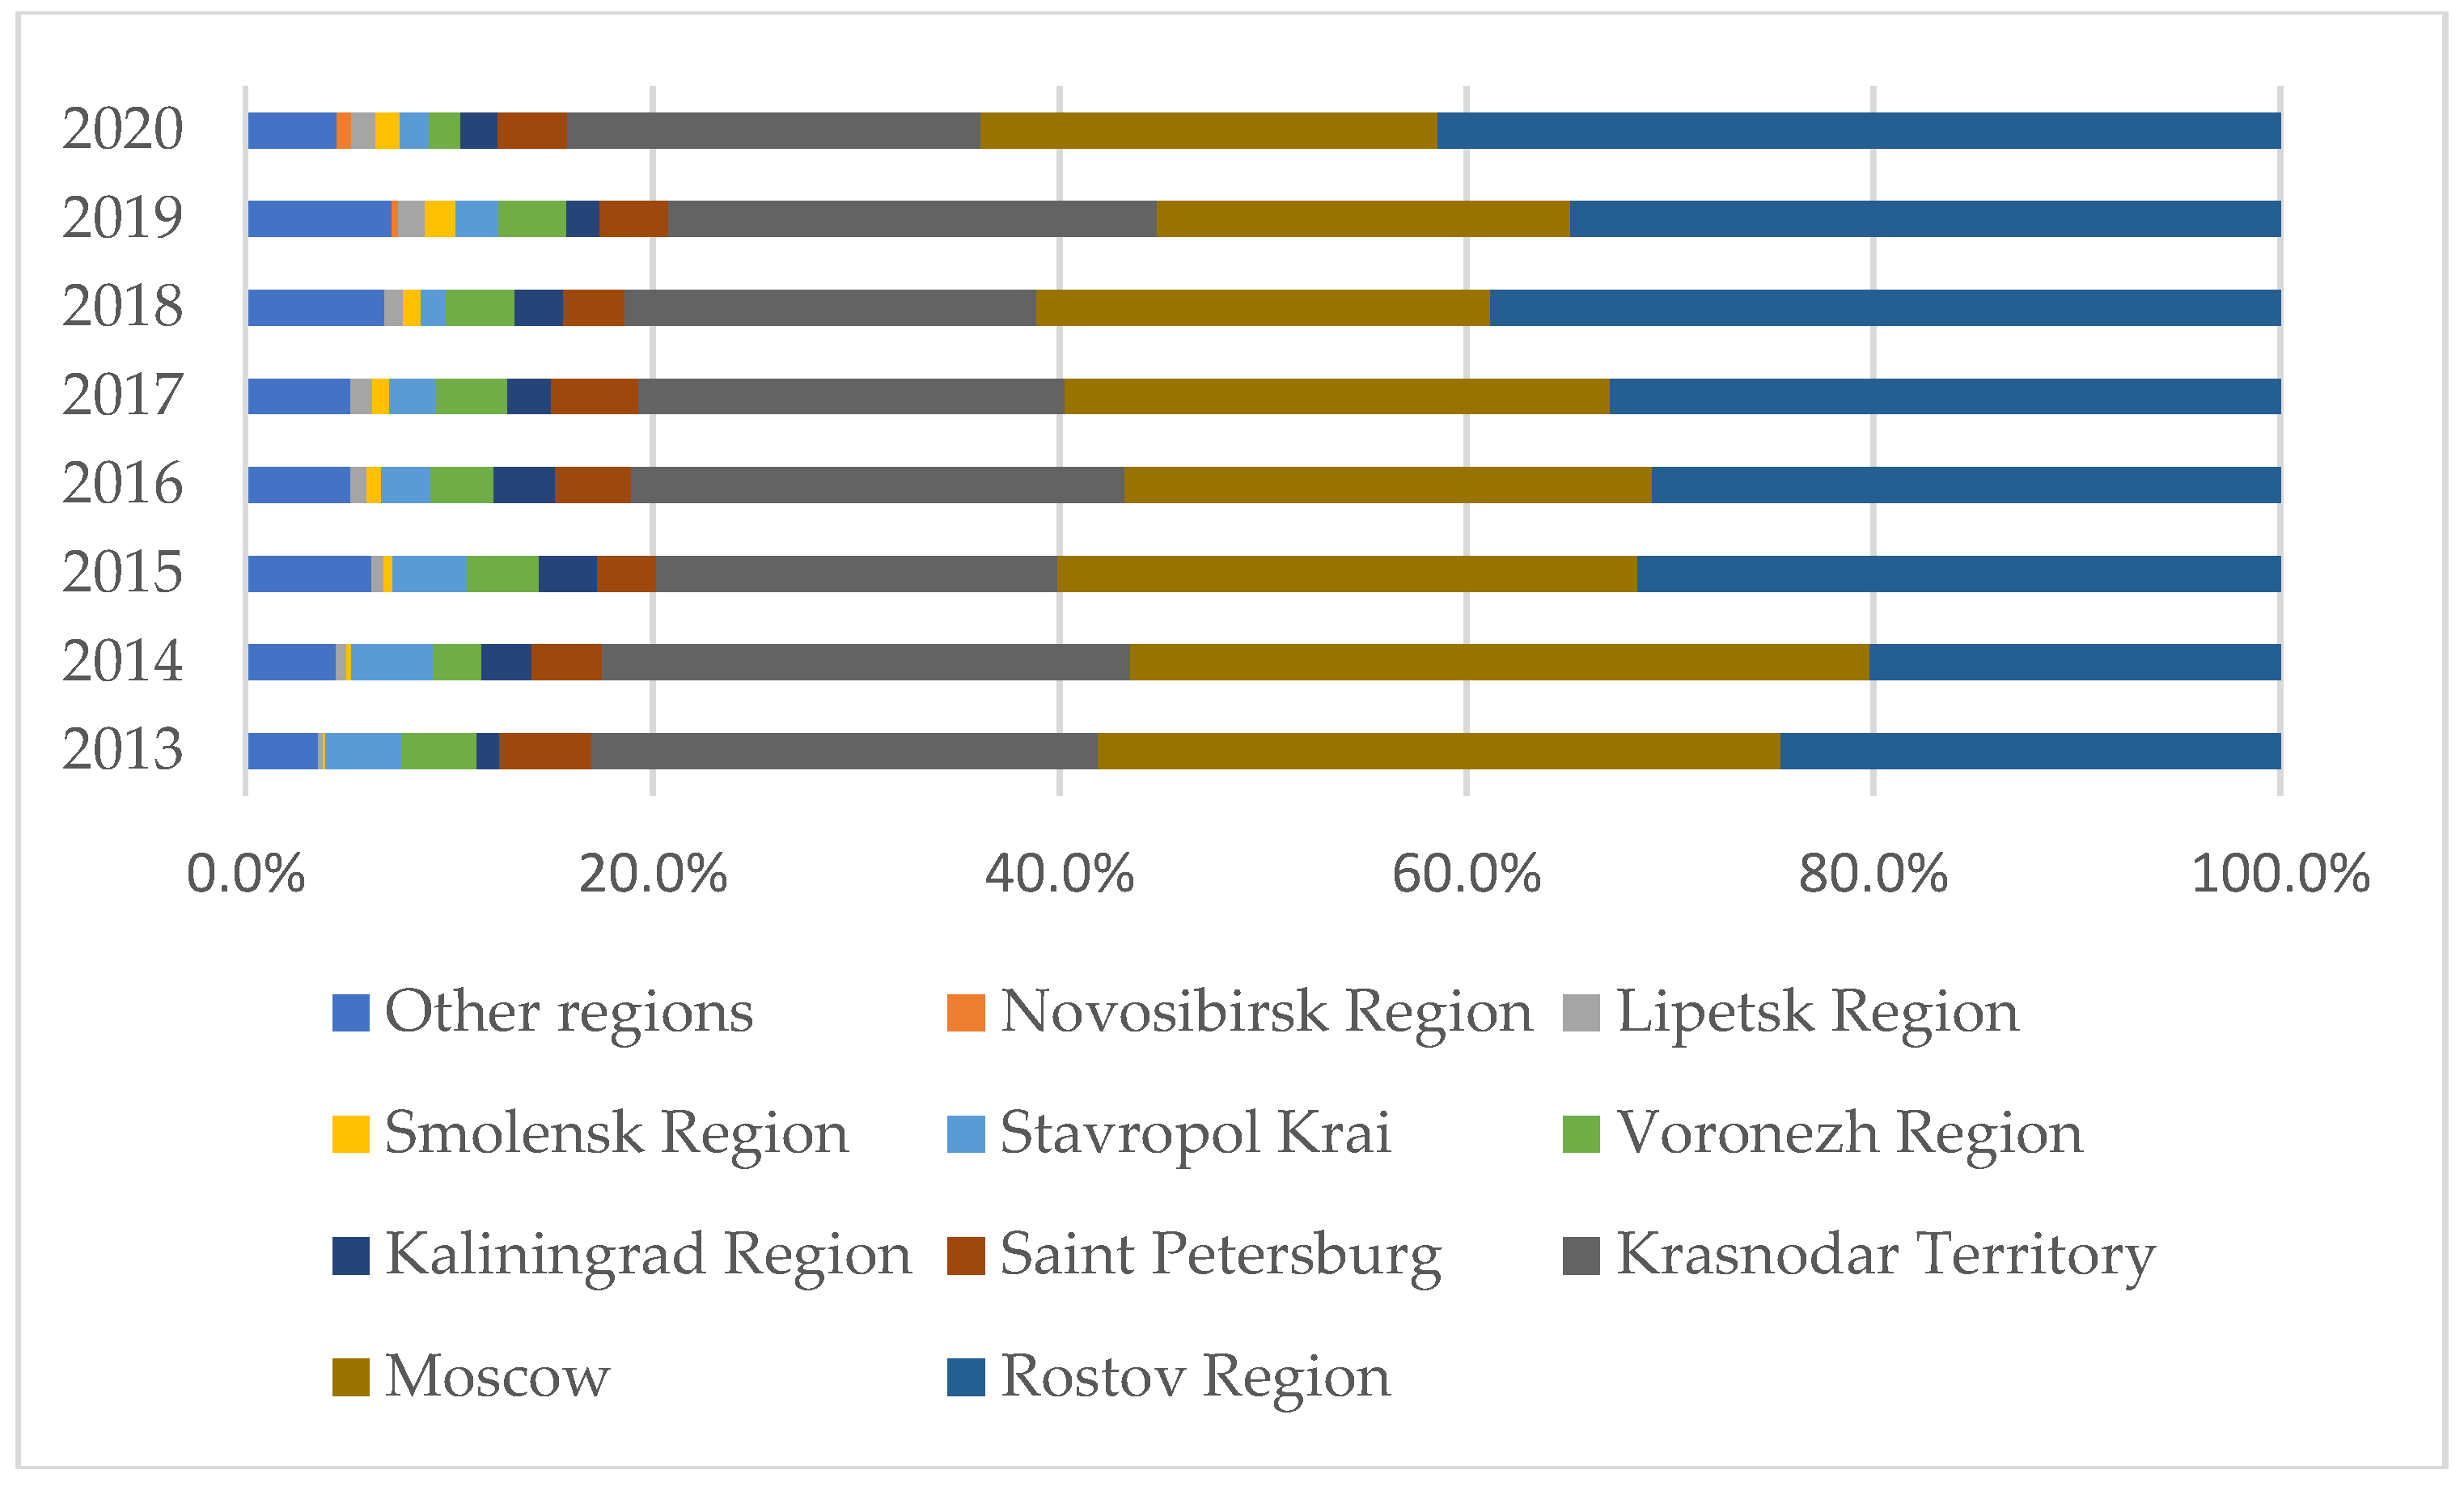
Table 2.
Description of research variables.
| Variable Name | Unit of Mesurement | Type | Expected Sign | Data Source |
|---|---|---|---|---|
| Endogenuous variable | ||||
| Expijt_av | US$ 1000 | Time-Variant | - | TradeMap.org, UN Comtrade |
| Traditional Factors | ||||
| GDP_RUS, GDP_Partner |
Current US$ | Time-Variant | Positive | WDI, World Bank |
| (DIST)ijt | Kilometres | Time-Invariant | Negative | CEPII database |
| Natural barriers | ||||
| Demand | US$ 1000 | Time-Variant | Positive | TradeMap.org, UN Comtrade |
| Open_Econ (The degree of openness of the economy) | % | Time-Variant | Positive | World Bank |
| GDP_distance | Per capita Current US$ | Time-Variant | Ambiguous | WDI, World Bank |
| REMOT | Kilometres *US$/US$ | Time-Variant | Negative | CEPII database, WDI, World Bank |
| SCALE (Population Distance) | Population, total | Time-Variant | Ambiguous | World Bank |
| Border | (1/0) | Time-Invariant | Positive | CEPII database, YandexMap |
| Sea | (1/0) | Time-Invariant | Positive | CEPII database, YandexMap |
| Artifical trade barriers | ||||
| Tariff_adv | % | Time-Variant | Negative | WTO |
| TPU (Trade and Political Unions) | (1/0) | Time-Variant | Positive | MID RF |
Source: developed by the authors.
Table 3.
Results of Unit Root Tests for the Variables Under Study.
| Variables | Method | Statistic | Prob. | Cross-Sections | Obs | Lag |
|---|---|---|---|---|---|---|
| lnExp_av | Im, Pesaran and Shin W-stat | -3.01172 | 0.0013 | 37 | 740 | 1 |
| lnGDP_RUS | -9.80152 | 0.0000 | 37 | 740 | 1 | |
| lnGDP_Partner | -5.74583 | 0.0000 | 37 | 740 | 1 | |
| lnREMOT | -1.83546 | 0.0332 | 37 | 740 | ||
| lnGDP_dist | -9.09617 | 0.0000 | 37 | 740 | 1 | |
| lnOpen_Econ | -11.5769 | 0.0000 | 37 | 740 | ||
| lnSCALE | -9.07452 | 0.0000 | 37 | 740 | 1 | |
| lnTariff_adv | -3.64509 | 0.0001 | 37 | 620 | ||
| lndem | -4.30717 | 0.0000 | 37 | 740 | 1 |
Source: developed by the authors.
Table 4.
Estimation Results of the Gravity Model Using the Least Squares Method on Panel Data.
| Пoказатели | Model 1 | Model 2 | Model 3 | Model 4 | Model 5 |
|---|---|---|---|---|---|
| Coefficient (Std. Error)/(Prob.) |
Coefficient (Std. Error)/ Prob. |
Coefficient (Std. Error)/ Prob. |
Coefficient (Std. Error)/ Prob. |
Coefficient (Std. Error)/ Prob. |
|
| lnGDP_RUS | 1.755 (0.176)/( 0.000) |
0.175 (0.070)/ 0.012 |
|||
| GDP_Partner | 0.283 (0.054)/ (0.000) |
0.086 (0.001)/ 0.001 |
|||
| Dist | -2.112 (0.164)/( 0.000) |
-0.173 (0.073)/ 0.018 |
-0.185 (0.072)/ 0.010 |
||
| REMOT | -0.302 (0.038)/ 0.390 |
||||
| GDP_dist | 0.039 (0.037)/ 0.302 |
||||
| Open_Econ | 0.022 (0.009)/ 0.023 |
0,025 (0.009)/ 0.009 |
0.024 (0.009)/ 0.011 |
||
| SCALE | 0.129 (0.042)/ 0.002 |
0.084 (0.023)/ 0.000 |
0.101 (0.024)/ 0.000 |
||
| Tariff_adv | -0.046 (0.016)/ 0.005 |
-0.083 (0.016)/ 0.000 |
-0.080 (0.016)/ 0.000 |
-0.066 (0.016)/ 0.000 |
|
| Dem | 0.0440 (0.006)/ 0.000 |
0.452 (0.05)/ 0.272 |
0.451 (0.05)/ 0.000 |
0.446 (0.006)/ 0.000 |
|
| Border | -0.130 (0.110)/0.236 |
-0.04 (0.111)/ 0.783 |
|||
| Sea | -0.263 (0.102)/ 0.010 |
-0.116 (0.105)/ 0.272 |
|||
| Trade and Political Unions | -0.139 (0.100)/ 0.169 |
-0.063 (0.100)/ 0.538 |
|||
| c | -33.997 (4.941) |
-4.194 (1.871)/ 0.025 |
-3.710 (1.515)/ 0.015 |
-1.924 (0.833)/ 0,021 |
-0.999 (0.905)/0.270 |
| R-squared | 0.289 | 0.905 | 0.905 | 0.904 | 0.905 |
| Adjusted R-sguared | 0.287 | 0.904 | 0.904 | 0.903 | 0.904 |
Source: developed by the authors.
Table 5.
Quality assessment indicators of the model.
| Indicator | Model 1 | Model 2 | Model 3 | Model 4 | Model 5 |
|---|---|---|---|---|---|
| S.E. of regression | 2.512 | 0.923 | 0.924 | 0.924 | 0.0921 |
| F-statistic | 110.12 | 955.820 | 848.099 | 1904.172 | 1535.126 |
| Prob(F-statistic) | 0.000 | 0.000 | 0.000 | 0.000 | 0.000 |
| Root MSE | 2.506 | 0.918 | 0.918 | 0.922 | 0.918 |
| Mean dependent var | 4.286 | 4.286 | 4.286 | 4.286 | 4.286 |
| S.D. dependent var | 2.975 | 2.975 | 2.975 | 2.975 | 2.975 |
| Akaike info criterion | 4.685 | 2.689 | 2.692 | 2.687 | 2.681 |
| Schwarz criterion | 4.708 | 2.741 | 2.749 | 2.716 | 2.716 |
| Sum squared resid | 5117.502 | 686.756 | 687.096 | 692.283 | 686.707 |
| Durbin−Watson stat | 0.670 | 1.607 | 1.640 | 1.624 | 1.620 |
Source: developed by the authors.
Table 7.
RCA for Russian Regions and Their Grain Export.
| Russian Subject | 2013 | 2014 | 2015 | 2016 | 2017 | 2018 | 2019 | 2020 |
|---|---|---|---|---|---|---|---|---|
| Rostov Region | 22.22 | 20.96 | 22.02 | 15.62 | 16.83 | 18.70 | 17.04 | 15.65 |
| Moscow | 0.77 | 0.78 | 0.64 | 0.62 | 0.63 | 0.49 | 0.45 | 0.55 |
| Krasnodar Territory | 16.59 | 12.51 | 10.54 | 12.20 | 10.45 | 10.46 | 13.10 | 11.93 |
| Saint Petersburg | 1.07 | 0.77 | 0.62 | 0.67 | 0.69 | 0.50 | 0.49 | 0.54 |
| Voronezh Region | 12.18 | 7.50 | 8.74 | 7.59 | 9.32 | 9.40 | 11.00 | 4.81 |
| Stavropol Territory | 17.60 | 17.46 | 12.76 | 8.22 | 8.05 | 4.97 | 7.16 | 4.43 |
| Kaliningrad Region | 3.88 | 3.24 | 3.48 | 7.04 | 5.89 | 5.18 | 4.34 | 3.57 |
| Astrakhan Region | 6.46 | 5.79 | 14.39 | 11.47 | 5.67 | 6.85 | 18.84 | 0.00 |
| Lipetsk Region | 0.27 | 0.57 | 0.61 | 0.73 | 0.89 | 0.73 | 1.41 | 1.23 |
| Smolensk Region | 0.42 | 1.06 | 1.64 | 2.08 | 2.58 | 3.12 | 5.29 | 4.02 |
| Volgograd Region | 1.31 | 1.45 | 2.42 | 1.28 | 1.83 | 0.81 | 1.25 | 0.74 |
| Saratov Region | 0.42 | 1.03 | 0.57 | 1.22 | 1.52 | 1.56 | 2.13 | 1.52 |
| Oryol Region | 5.48 | 13.56 | 10.66 | 10.28 | 5.72 | 8.43 | 7.31 | 3.91 |
| Orenburg Region | 0.42 | 0.28 | 0.57 | 0.37 | 0.63 | 1.04 | 0.00 | 0.64 |
| Omsk Region | 0.00 | 1.08 | 1.10 | 0.00 | 0.00 | 0.00 | 2.20 | 2.76 |
| Tambov Region | 0.00 | 0.00 | 0.00 | 0.00 | 6.36 | 14.79 | 10.75 | 3.23 |
| Kursk Region | 0.00 | 1.04 | 1.99 | 1.69 | 1.65 | 4.63 | 0.00 | 1.19 |
| North Ossetia – Alania | 0.00 | 0.00 | 16.16 | 13.22 | 0.00 | 15.84 | 20.77 | 13.96 |
| Primorsky Territory | 0.10 | 0.00 | 0.00 | 0.32 | 0.25 | 0.00 | 0.47 | 0.62 |
| Samara Region | 0.00 | 0.04 | 0.23 | 0.00 | 0.00 | 0.46 | 0.00 | 0.00 |
| Buryatia | 0.25 | 0.00 | 0.00 | 0.00 | 0.00 | 0.00 | 0.00 | 0.00 |
| Chelyabinsk Region | 0.08 | 0.00 | 0.00 | 0.00 | 0.00 | 0.00 | 0.00 | 0.00 |
| Ulyanovsk Region | 1.36 | 0.00 | 0.00 | 0.00 | 1.23 | 0.00 | 0.00 | 0.00 |
| Altai Territory | 0.76 | 1.37 | 0.00 | 0.00 | 0.00 | 0.00 | 2.40 | 1.33 |
| Bashkortostan | 0.06 | 0.00 | 0.00 | 0.00 | 0.00 | 0.35 | 0.00 | 0.00 |
| Moscow Region | 0.00 | 0.10 | 0.18 | 0.16 | 0.29 | 0.00 | 0.00 | 0.00 |
| Belgorod Region | 0.00 | 0.50 | 0.00 | 0.00 | 0.00 | 0.00 | 0.00 | 0.00 |
| Ryazan Region | 0.00 | 0.00 | 3.18 | 2.26 | 0.00 | 0.00 | 0.00 | 0.00 |
| Krasnoyarsk Territory | 0.00 | 0.00 | 0.00 | 0.28 | 0.00 | 0.00 | 0.00 | 0.00 |
| Sverdlovsk Region | 0.00 | 0.00 | 0.00 | 0.00 | 0.09 | 0.00 | 0.00 | 0.00 |
| Omsk Region | 0.00 | 0.00 | 0.00 | 0.00 | 0.00 | 2.53 | 0.00 | 0.00 |
| Bryansk Region | 0.00 | 0.00 | 0.00 | 0.00 | 0.00 | 0.00 | 3.49 | 0.00 |
| Novosibirsk Region | 0.00 | 0.00 | 0.00 | 0.00 | 0.00 | 0.00 | 0.44 | 0.78 |
| Chelyabinsk Region | 0.08 | 0.00 | 0.00 | 0.00 | 0.00 | 0.00 | 0.00 | 0.00 |
| Russian Federation | 1.37 | 2.23 | 2.62 | 3.24 | 3.56 | 4.01 | 3.18 | 4.07 |
Source: developed by the authors.
Disclaimer/Publisher’s Note: The statements, opinions and data contained in all publications are solely those of the individual author(s) and contributor(s) and not of MDPI and/or the editor(s). MDPI and/or the editor(s) disclaim responsibility for any injury to people or property resulting from any ideas, methods, instructions or products referred to in the content. |
© 2024 by the authors. Licensee MDPI, Basel, Switzerland. This article is an open access article distributed under the terms and conditions of the Creative Commons Attribution (CC BY) license (http://creativecommons.org/licenses/by/4.0/).
Copyright: This open access article is published under a Creative Commons CC BY 4.0 license, which permit the free download, distribution, and reuse, provided that the author and preprint are cited in any reuse.


