

Submitted:
14 May 2024
Posted:
14 May 2024
You are already at the latest version
Abstract
The Southern European countries of Spain and Portugal both show a high degree of export spe-cialization in agri-food products compared to the EU-27 as a whole. This sector plays a funda-mental role in their economies, determining the management of natural resources, with the food and beverage industry being the most important manufacturing activity in both countries. Drawing on evidence obtained from Eurostat's database on foreign trade, this study analyzes whether the geographical concentration of agri-food exports from the Iberian Peninsula coun-tries to the EU-27 increases between 2008 and 2022, or, conversely, if there is a process of spatial diversification in favor of non-EU markets. Expansion towards new trading partners, as indicat-ed by estimated concentration indices, is significant in Spain but does not occur in Portugal. However, in both economies, the regional market with European partners, characterized by strong competition and low development expectations, remains decisive in the evolution of their exports in the short and medium term. Consequently, institutions and companies in this sector must adopt a more dynamic approach and implement measures that allow for increased sales orientation towards higher growth markets, thus enhancing the global competitiveness of the national agri-food sector.
Keywords:
Exports
; Agriculture
; Agri-food
; Panel data
; Spain
; Portugal
1. Introduction
The Southern European countries of Spain and Portugal, which joined the EEC in 1986, both show a high degree of export specialization in the agri-food sector compared to the EU-27 as a whole. In 2022, exports of agri-food products from Spain to foreign markets amounted to €69.83 billion, representing 9.93% of the total EU-27 agri-food exports, while Spain’s share in the total volume of exports from the EU amounted to 5.79%, and its share in EU GDP was estimated at 8.46%. Similarly, Portugal accounts for a 1.44% share in EU-27 agri-food exports, 1.15% in total merchandise exports, and its GDP share is 1.52%. As in other areas of the developed world, the agri-food sector in Spain and Portugal plays a crucial role in the economy of these two countries, determining the management of natural resources, with the food and beverage industry being the most important manufacturing industry.
Since 2008, the extra EU-27 export activity of the agri-food sector in the Iberian Peninsula has been conditioned by the restrictive practices imposed by various national economies, especially those of the G-20 [1,2,3,4,5], with complex effects on trade flows [6,7,8]. It has also been affected by the trade agreements that the EU-27 signed with third countries, in force or provisionally applied between 2008 and 2022, of which there have been more than 50 according to [9]. Figure 1 shows the average tariffs applied in 2008 and 2022 to agricultural [10] and non-agricultural products by the United States and China, two of the main non-EU destination countries for EU-27 exports of these types of goods in 2022, and the second and third largest importers of such products globally, according to the World Trade Organization (WTO). Additionally, it presents the number of non-tariff trade restrictive measures applied by these countries in 2008 and 2021 to agri-food and non-agri-food products from the EU-27. The data show, firstly, the higher tariff burdens on agri-food goods at both the beginning and the end of the period. Secondly, it is the new non-tariff barriers (anti-dumping, countervailing duties, sanitary and phytosanitary measures, technical barriers to trade, quantitative restrictions, safeguards, special safeguards, tariff quotas, export subsidies) that underlie the neo-protectionist process characterizing international trade in 2022, as reflected in the data on the United States and China. Lastly, significant differences are observed between these two countries in their trade policy: whereas the North American economy imposes many and varied non-tariff barriers on agri-food imports, the Asian economy presents higher tariff rates but makes comparatively less use of the new non-tariff barriers.
The aim of this study is, firstly, to conduct a comparative analysis of the evolution of Spain and Portugal's agri-food product sales in the international market between 2008 and 2022; by so doing, we can gain a better understanding of these export dynamics within the EU and globally, during a period marked by an increase in restrictive trade practices and the consolidation of the European integration process. Secondly, it seeks to determine whether this evolution has been conditioned by the development of competitive advantages that have enabled diversification in exported products and their destinations. According to various authors ([12,13,14,15,16], the quality of growth in international market sales depends on the ability to export a greater variety of products to more countries. The third aim of this study is to identify which products and markets have contributed the most to the increase in these countries’ export revenues, detecting similarities and differences between the two cases. Finally, using a gravity model, it investigates the macroeconomic variables that have determined the agri-food exports of Spain and Portugal.
Based on the arguments presented, the following research questions are proposed:
- Have the exports of agri-food products from Spain and Portugal registered a higher growth rate than the EU-27 as a whole, consolidating the export specialization of these two countries?
- Has there been a process of diversification in the type of agri-food products exported by Spain and Portugal between 2008 and 2022, boosting their competitiveness?
- Which products have contributed most to the growth of agri-food exports from the two economies of the Iberian Peninsula between 2008 and 2022?
- Has there been a process of regionalization of the agri-food product exports from Spain and Portugal in favor of the EU-27, or, on the contrary, are these countries increasing their sales in more distant markets, outside of Europe, in an effort to increase their participation in the global market?
- Does the size of the destination market, per capita GDP, or distance from the importing country explain the recent evolution of agri-food exports from Spain and Portugal?
To address the last of the questions posed, a gravity model is employed. This model has traditionally been used in the empirical literature to analyze trade flows between countries. [17] first introduced the traditional gravity model to explain bilateral trade flows in the absence of discriminatory trade barriers. Reflecting Newton's law of gravity, the model includes explanatory variables, among which are the demand from the im-porting country, and the cost of transportation, with the latter introducing the effect of distance between trading partners [18]. The flow of trade is expected to be positively related to the size of the market and the consumption of the countries, but inversely linked to the distance between trading countries. Subsequent empirical studies have introduced additional variables that complement the simpler gravity model, allowing for the analysis of the influence of artificial barriers to international trade [19,20,21].
Previous research has analyzed the effects of economic integration processes on agri-food product trade flows ([22,23,24,25,26,27,28,29,30,31,32,33,34]. Specifically for Spain, [35] use the gravity model to show that there is a significant process of trade creation and diversion in favor of integrated partners, which promotes export growth. On the other hand, [36] argue that Spanish food industry exports have benefited from Spain's accession to the EU, especially after the transitional period and the dismantling of tariff barriers, which has contributed to the transformation of the industry to comply with the quality standards demanded by consumers and international markets. This study aims to complement the findings of previous research by analyzing whether the geographical concentration of agri-food exports in the integrated area intensifies over time; or, conversely, whether there is a spatial diversification process supported by the development of competitive advantages by national companies, allowing for an increase in the variety of products sold and in export destinations, reinforcing the global competitiveness of the national agri-food sector. This research contributes to the scientific literature on the effects of economic integration processes on agri-food product exports of partner countries in an integration process. Furthermore, the conclusions provided can guide potential measures to boost the competitiveness of this sector.
Following this introduction, the rest of the paper is structured in four sections. The second section presents the data and methodology used in the research. The third section presents the results, which are then discussed in the fourth section. Finally, the fifth section details the main conclusions.
2. Materials and Methods
2.1. Materials
The empirical study that underpins this article is longitudinal and uses secondary information on foreign trade flows provided by Eurostat, the statistical office of the European Commission. It should be acknowledged that trade statistics may be susceptible to errors and discrepancies, and the data available in Eurostat are no exception. The analysis period, 2008-2022, was chosen to capture the slowdown in trade flows following the 2008 financial crisis and the widespread implementation of trade restrictive practices from that year onwards, as indicated by [37,38], while 2022 was the last year with available information at the time the analysis was conducted.
The exported products are identified using the classification of the Harmonized Commodity Description and Coding System (HS) of the World Customs Organization, revision 2007. In this classification, products are grouped into 21 sections, which include 97 chapters, subdivided into tariff headings (four digits) and subheadings (six digits), allowing for the identification of 5,000 different products. For example, at the six-digit level, it is possible to distinguish between "Fresh or chilled pig carcasses and half-carcasses" (020311) and "Hams, shoulders, and cuts thereof, with bone-in, fresh or chilled" (020312), which should be grouped for the purposes of this analysis. Specifically, the agri-food products that are the focus of this analysis are included in sections I to IV: I. "Live animals; animal products" (chapters 1 to 5); II. "Vegetable products" (chapters 6 to 14); III. "Animal or vegetable fats and oils and their cleavage products; edible fats; animal or vegetable waxes" (chapter 15); and IV. "Prepared foodstuffs, beverages, spirits, and vinegar; tobacco and tobacco substitutes..." (chapters 17 to 24), in accordance with [39]. In this study, a four-digit disaggregation level is used, yielding a total of 202 different categories. In the disaggregation by product types and markets, a minimum threshold of €400,000 (established limit for the exporter/importer of the EU-27 to make the Intrastat declaration for intra-community trade [40]) has been applied. Other studies of a country's overall trade flows have used the two-digit ISIC classification level [16] or the three-digit ISIC classification level [23], meaning this research is based on a higher level of disaggregation.
The figures on exports and GDP of EU countries are expressed in constant € to avoid erroneous conclusions due to the inflation recorded between 2008 and 2022, especially during the last two years as a result of the effect of the Ukraine War on agri-food product prices in EU countries [41]. The figures on each country’s agri-food product exports are deflated using the deflator of agri-food products provided by [42]. To deflate the value of total exports and GDP of EU-27 countries, the GDP deflator of each country is used, as indicated by FAOSTAT. Other sources of information used include [9,43,44,45].
2.2. Descriptive Statistics and Indices
To address the first four questions posed in the introduction, descriptive statistics are used, and different indices are estimated.
The analysis of the comparative advantages of Spain and Portugal in agri-food products utilizes the concept of "revealed" comparative advantage introduced by [46,47,48]. Under this concept, the relative importance of Spain's or Portugal's exports of agri-food products is compared with the share of such exports in the total agri-food exports of the EU-27. The formula employed is as follows:
Where:
Xi,j,t: Exports of product i from country j in year t
Xjt: Total exports of country j in year t
Xi,UE-27: Exports of product i in the EU-27 as a whole in year t
XUE-27,t: Total exports of the EU-27 as a whole in year t
i: agri-food products exported
j: Spain, Portugal
t: year
A value for RCA equal to or greater than 1 indicates that the sector has comparative advantages in the export of this type of goods, whereas if RCA takes values lower than 1, it indicates comparative disadvantages, as indicated by the lower relative weight of agri-food product exports. RCA is calculated for the years 2008 and 2022.
According to [46], the relative trade balance compares the value of exports and imports of a particular sector. It is calculated on the assumption that exports express a country's trade advantages, while imports reveal deficiencies or limitations. The indicator for the relative trade balance is as follows:
Where:
X: Exports
M: Imports
i: type of product
j: country (Spain, Portugal)
The index ranges between 1 and -1. A value of 1 indicates that there are only exports, and the trade advantage is maximum; a value of -1 indicates that there are only imports, and the trade dependency is maximum.
To determine the degree of concentration of agri-food exports, the Hirschman index [49] is calculated. For country j, this index is defined as follows, where i represents the type of agri-food product exported:
This index compares effective concentration with an evenly distributed composition of products (or export markets), where a higher index indicates a greater concentration of exports. In the case of absolute concentration, the index would be equal to 1, and conversely, in the most diversified case, it would be close to 0 [50].
The degree of similarity between exports from the two countries is quantified using the [51], defined as:
Where:
i: agri-food product exported
Esp: Spain
Port: Portugal
A value equal to 100 would indicate an identical sectoral composition of agri-food exports from Spain and Portugal, meaning they are competing in international markets. Conversely, an index close to 0 would indicate total divergence in products.
To assess the differential effect that exports to a destination country (j) have on the total amount of sales in the international market of the agri-food sector of Spain and Portugal (i), the shift-share method is utilized, based on [52]. This method allows the decomposition into several parts (shares) of the variations or changes (shifts) registered in an economic indicator referring to a destination (or a set of destinations) integrated in a reference economic unit, according to the following expression:
Where:
Xij0: Export of agri-food products from country i to j in year 0
Xijt: Export of agri-food products from country i to j in year t
i: Spain, Portugal
j: Destination country (or aggregate set of countries) of exports
SE (Sector Effect): variation in agri-food exports from a country (i) to a destination (j) if its growth rate were equivalent to the average of the entire agri-food sector of the exporting country i (ri).
DE (Destination Effect): variation in agri-food exports from country i to country j based on the specific characteristics of each destination market. Countries with a positive DE present opportunities for exportation, whereas those with a negative DE experience a lower-than-average sectoral dynamics.
The identity (1) expressed in terms of growth rates would be as follows:
2.3. Panel Data Analysis
To examine the possible association between agri-food exports from Spain and Portugal and the demand for such goods from countries within or outside the EU, the following equation is calculated:
EXPit = αit + α1GDPit + α2GDPpcit - α3Distit + α4EUit + α5Agit + αeit
Where:
EXPit: Logarithm of the exports of agri-food products from country i to country j at time t.
GDPit: Logarithm of the GDP of importing country i.
GDPpcit: Logarithm of GDP per capita of exporting countries.
Distit: Distance from the capital of country i to the capital of country j.
EUit: Dummy variable indicating whether country i belongs to the EU at time t.
Agit: Dummy variable indicating whether there is an association agreement between country i and the EU at time t.
α: Estimated coefficients: These coefficients complete the relationship along with a constant, capturing other exogenous effects not included, and the error term, eit.
Panel data analysis is used to capture the influence of unmeasured variables that may explain variation between countries. The countries considered for the analysis are those that account for more than 0.05% of its total agri-food exports in 2022, amounting to 74 countries. Variables are presented in logarithms, and a sequence of econometric models is formulated until the optimum model is identified. Table 1 provides the definitions of the variables.
A panel data approach is appropriate due to the inclusion of time periods and the likely presence of unobserved individual effects. The use of this technique has multiple advantages, such as the fact that it reduces collinearity between variables, enables the construction of more complex models, eliminates or reduces bias in results when aggregating information, and identifies and evaluates effects not detected by cross-sectional or time-series analysis [53]. However, drawbacks include problems with design and data collection, cross-sectional dependence and short time series. Stata software was used for the analysis.
3. Results
3.1. Growth of Agri-Food Product Exports from Spain and Portugal
Between 2008 and 2022, a rising trend is observed the sales of agri-food products from Spain and Portugal outside their national borders, with a steady increase in value from the year 2010, confirming the export specialization of this sector and its competitiveness in international markets. However, the data in Figure 2 show the larger size of this sector in Spain: in 2022, the total exports of agri-food products from Spain are eight times greater than those from Portugal.
In Table 2, the growth of agri-food exports of the EU-27 countries in 2008 and 2022 is compared. Several observations can be made from the data. Firstly, all countries except for Germany and Hungary increase the value of their sales during the analyzed period. There are 19 cases (Bulgaria, Czechia, Greece, Spain, Croatia, Italy, Cyprus, Latvia, Lithuania, Malta, the Netherlands, Austria, Poland, Portugal, Romania, Slovenia, Slovakia, Finland, Sweden) in which the increase in the activity of the agri-food sector in international markets is double the increase in the overall national productive activity, quantified by GDP. Particularly noteworthy are Croatia and Romania with an average annual growth rate of 9.20% and 8.29%, respectively, which manage to more than triple the value of their sales in international markets.
Spain and Portugal record an average annual variation rate in their agri-food exports of 6.51% and 5.12% at constant prices, respectively, doubling the value of their sales in international markets over the analyzed period and consolidating their export specialization in products that are typical of these two Southern European economies. However, there are significant differences between these two countries. Firstly, in terms of relative importance in the context of the EU-27, Spain registers a sales volume of €28,438.87 million in 2008 and is responsible for 8.48% of the total products exported by the EU-27, a percentage that rises by more than five percentage points in 2022. In comparison, Portugal reports a value of €4,216.81 million in exports in 2008, accounting for 1.26% of the total EU-27, and a bit less than 2% in 2022. Secondly, compared to the significant comparative advantage that Spain presents in its agri-food foreign trade flows, which are consolidated at the end of the period, Portugal records a negative trade balance in both 2008 and 2022, although the data show a greater increase in sales than in purchases. In 2022, the value of Spain’s agri-food product sales in the international market exceeds its imports by 25%. Therefore, although the agri-food sectors of both Spain and Portugal have strengthened their export specialization, taking advantage of comparative and competitive advantages, it is the Spanish sector that presents a better comparative position, generating net export revenues of €1,307.6 million in 2022 and contributing very positively to the country's trade balance. In light of these findings, we now carry out a more detailed analysis of the products and markets that explain this evolution in both Spain and Portugal.
3.2. Exported Products
In this section, we evaluate the diversity of exported products defined at the four-digit level of the SA-2007, applying a threshold of €400,000 to identify an export product as "new". Based on the information in Table 3, we can assert that both Portugal and Spain—but particularly Spain—place a wide variety of agri-food goods in international markets, a trend that is confirmed when comparing the data from 2022 with those from 2008. The values of the Hirschman concentration index in 2008 and 2022 demonstrate the high diversification by type of agri-food product exports of both countries, but especially Spain. Out of a total of 186 different categories of agri-food goods exported by Spanish companies in 2022, 178 were already sold at the beginning of the period, with export revenue from new products amounting to €48.07 million, accounting for 0.06% of the total. In Portugal, 162 types of products were exported in 2022, 11.72% more than in 2008, with the share of new products in total export revenue being only 0.46%.
From the analyzed data, it can be inferred that it is not new products that explain the recent evolution of exports from these two economies: quite the contrary, it may be due to a consolidation of their commercial activity in traditional markets or, conversely, in new markets (this will be clarified in the following section).
Table 4 presents the shares of the top 10 categories of agri-food goods exported by Spain and Portugal in 2008, at both the beginning and end of the period, along with the differential effect (DE) of each one. Analyzing these figures reveals some interesting characteristics. Firstly, in both countries, wine of fresh grapes (HS code 2204) and olive oil and its fractions (HS code 1509) stand out as the main contributors to export revenue, with the two categories combined accounting for an estimated 10.59% in the case of Spain and 18.54% for Portugal in 2022. Moreover, in both countries, the activity in the international markets of the olive oil subsector far exceeds that of the wine subsector during this period. Specifically, in Portugal, exports of HS code 1509 in 2022 rise to a share of 9.25%, contributing very positively to the increase in export revenue for the entire sector. The Spanish olive oil subsector more than doubles the value of its sales during these years (127.41%), although it presents a negative differential effect compared to the overall sector.
In Spain, there is a notable change in the sale of fresh pork meat, which more than triples, registering a share of 8.65% of the total in 2022. On the contrary, a traditional exporting sector such as fresh fruits and vegetables (comprising products under HS codes 0805, 0702, 0809, 0810) records a decline in its share, despite the increase in exports of HS code 0810, which includes strawberries and berries, and 0709, which groups various products such as eggplants, spinach, and mushrooms. Also losing prominence are products of HS codes 2005 (other prepared or preserved vegetables) and 0303 (frozen fish).
In the export dynamics of the main products exported from Portugal, the positive variation observed in certain processed foods contrasts with the decline in sales of traditional goods such as grape wine (HS code 2204), which accounts for 9.29% of the total in 2022, milk and cream (HS code 0401), cane or beet sugar and chemically pure sucrose (HS code 1701), or malt beer (HS code 2203). Among the agro-industries that increase their international sales are olive oil (HS code 1509)—which nearly triples its share; bakery, pastry, or biscuit products (HS code 1905); and prepared or preserved tomatoes (HS code 2002).
The data provided in this research reveal that, overall, there have been no major changes in the export structure of the agri-food sectors of Spain and Portugal between 2008 and 2022. Both sectors have traditionally been quite diversified, with a wide portfolio of products sold. However, certain shifts are observed. In Spain, the relative importance of fruits and vegetables and grape wine has declined in favor of certain subsectors, such as olive oil and pork meat. In Portugal, it is olive oil, bakery and biscuit products, and prepared or preserved tomatoes that offer a positive differential, in contrast to the negative values recorded for the rest of the goods considered in Table 4. Overall, the changes that have occurred have led to an increase in the similarity index of the export structure of agri-food products of the two countries during these years, rising from a value of 51.64% in 2008 to 58.04% in 2022.
3.3. Export Markets
According to various authors [14,15,16] the strengthening and consolidation of the internationalization process of a national economy is manifested in its ability to export to a greater number of countries. In this section, we analyze whether there has been an increase in the number of destination markets to which the agri-food sectors of Spain and Portugal have sent their exports between 2008 and 2022. The data presented in Table 4 confirm a significant increase in the number of trading partners, at first glance indicating a greater geographical diversification in the destination of sales made outside national borders. It is worth noting that, for the purposes of this study, a country must receive exports of more than €400,000 to be considered a new destination. In 2022, the geographic concentration index for Spain registers a value of 0.26, with 175 countries receiving exports from Spanish companies. The 25 new countries receive 0.10% of Spain's total exports in 2022. However, Portugal shows a higher concentration coefficient, reaching 0.43 in 2008 and 0.42 in 2022. In this case, although the absolute number of destination markets has grown by 51 to reach a total of 132 markets, a few EU-27 partners account for almost three-fifths of its exports abroad (see Table 5).
The data in Table 6 show the distribution of agri-food product exports from Spain and Portugal in 2008 and 2022 among the EU-27 countries and non-EU-27 countries, presenting all those that had a share greater than 1% at the beginning of the period. It also presents the differential effect by country. An analysis of the data reveals several noteworthy aspects. Firstly, both countries show a notable dependence on the European market. However, whereas an increasing prominence of EU-27 economies is observed for Portugal, the share of this bloc of 27 European partners as a destination for exports from Spain declines, with a negative differential effect of -0.25. The data represented in Figure 3 confirm a continued process of diversification in Spanish exports outside the EU-27. On the other hand, the process of regionalization and concentration in favor of EU partners is consolidated in Portugal from 2017 onwards.
Secondly, there are significant differences in the differentials shown by various countries as importers of agri-food products from Spain and Portugal. For Spanish products, a positive differential due to the boost in sales is observed primarily from a majority of countries that joined the EU after 2004, such as Slovakia, Slovenia, Romania, Poland, Hungary, Croatia, Estonia, Czechia, and Bulgaria), more distant Asian markets (China, South Korea, Japan, and the Philippines), the United States, and Morocco. In contrast, a negative differential is recorded for traditional EU-27 markets (France, Germany, the Netherlands, Portugal Luxembourg, Greece, Denmark, or Belgium); and beyond the EU, for the United Kingdom, due to changes in trade policy following its departure from the EU in February 2020, and Russia, due to the sanctions imposed by the EU-27 following the start of the Ukraine War in 2022.
In 2022, 70.20% of Portugal’s exports were concentrated in the EU-27 market, with its main trading partners being Spain (39.05%), France (9.36%), Italy (6.57%), the Netherlands (3.96%), and Germany (3.42%). In contrast, the new partners have relatively small shares. Outside this trade bloc, a negative differential effect can be observed for Angola, which reduces its share to 2.93% in 2022, the United Kingdom, and Canada, contrasting with the increase in exports to Brazil, the United States, and Switzerland.
3.4. Panel Data
Table 7 shows the results of the estimations using the Pooled Cross-Sectional and Time Series Estimation model (PCSE) for Spain and Portugal. The model is estimated using data from 74 countries, with a total of 1,110 observations, for the period 2008 to 2021. The optimum model is chosen by testing a number of econometric models to identify the best one. First, we estimate the model with pooled data, comparing it with the random effects model. To decide which is better, the Breusch Pagan Lagrangian Multiplier Test is performed, which rejects the hypothesis that there is no variation across countries. Accordingly, the random effects model is chosen. Then, the estimation is carried out with fixed effects, with the Hausman test being conducted to compare the fixed and random effects models, as a result of which the fixed effects model is chosen. The other tests applied are the Wooldridge test (to control for autocorrelation or first-order serial correlation), the modified Wald test (for groupwise heteroscedasticity) and the Breusch-Pagan test for cross-sectional independence (for contemporaneous heteroscedasticity). The absence of autocorrelation and heteroscedasticity is thus confirmed; however, the Breusch-Pagan test for cross-sectional independence shows that the correlation matrix of residuals is singular, meaning it is not possible to use this test. Consequently, the Pesaran test for cross-sectional independence has been used, with the results indicating that it is necessary to correct the contemporaneous correlation. To solve all these problems, the PCSE model is applied, since it is the recommended option for fixed effects [54].
The exports of agricultural products from Spain, the variable capturing demand in the destination country, membership in the EU, and having a trade agreement are all significant at 5%. The variables distance and the size of the target market, approximated by the population, are also significant at 5%, showing a negative relationship with the exported volume. Therefore, the expected relationship is not confirmed in all cases.
4. Discussion
The years following the 2008 financial crisis witnessed slow growth in international trade flows, with an uneven impact by product type and countries. Trade barriers imposed by national economies were one of the elements that can explain this evolution [55,56]. In this context, the exports of agri-food products from Spain and Portugal increased in real terms by 141.71% and 101.32%, respectively, between 2008 and 2022. This confirms the export specialization of their agri-food sectors, particularly in the case of the Spanish economy, that moves to position itself as the second country in the EU-27 that exports the most agri-food products, ahead of Germany and France, of the total agri-food products sold in international markets by EU-27 countries in 2022. These results confirm the adaptability and resilience that characterize the agri-food sector of Spain and Portugal, as stated by [57] for the case of Spain and [58] for Portugal.
The Southern European countries under study place a wide variety of agri-food products in international markets, with Spain exporting 186 categories of products and Portugal 161 (in 2022). Moreover, none of the product categories considered accounts for more than 10% of the total revenues in the agri-food trade balance of these two countries in 2022. According to [59], collaboration among small-sized companies has fostered the internationalization of the Spanish agri-food sector, contributing to an increase in the variety of goods sold in international markets. There is also a process of differentiation and sophistication in the type of goods sold by the agri-food sector, as observed in Italy [60], contributing to the increase in exports of organic products [61] and certified quality products [62]. Overall, a shift in favor of quality can be seen in their export structure, as argued by [63] for the agri-food sector and by [15] for the whole export sector of a national economy. The diversification of the portfolio of goods sold abroad positively contributes to sustained growth in productive activity and, consequently, in the national economy as a whole [13].
Between 2008 and 2022, there has also been a process of diversification in destination markets, with Spain exporting its products to 175 countries and Portugal to 132. That said, the exports of agri-food products from these two countries remain heavily dependent on geographically close markets, with relative size, as confirmed by the results of the gravity model estimated for Spain and Portugal. In the case of the Spanish economy, in line with previous research [23,35], exports are positively related to the per capita GDP of the trading partner, being a member of the EU-27, or to a lesser extent, having a trade agreement. In 2022, four EU-27 members (Germany, France, Portugal and the Netherlands) and the United Kingdom accounted for 47.63% of the total exports from Spain. That same year, Portugal directed 39.05% of its total exports to its eastern neighbor. Given this situation, the agri-food sectors of the Iberian countries are highly dependent on the evolution of the EU market. However, the European market for agri-food products is facing particularly unfavorable conditions due to several factors. Firstly, due to the sluggish demand dynamics, attributed to the low population growth rate [64] and the aging population, which negatively influence food consumption [65]. Secondly, due to the high competition both from partner countries [34] and neighboring economies in the north and south of the Mediterranean [63,66,67,68,69], and even more distant African countries [70] or Asian economies [71]. The conditions of the European agri-food market negatively affect the evolution of export revenues from Spain and Portugal, hindering their companies’ business outside the domestic market.
In the case of Spain, it is the more distant markets and particularly those that are not part of the European integration process that have contributed the most to export growth, in line with the arguments put forward by [72]. Two components can be identified in this dynamic: on the one hand, countries with which the EU-27 maintains trade agreements, such as Japan and Morocco, and on the other hand, markets of significant size, among which the United States and China stand out. The latter two countries show a positive differential in their purchases, despite the restrictions imposed in recent years by their governments on agri-food imports and the need to adapt products to local regulations [26]. The evolution of Spanish exports coincides with the recent trajectory of agri-food product sales from Poland outside national borders [73,74,75]. The spatial diversification of Spanish exports reflects the consolidation of the sector's internationalization process, in which it has managed to overcome entry barriers in target markets [76], coping with transaction and coordination costs by being present in a greater variety of countries [77], and taking advantage of economies of experience, as argued by [78].
5. Conclusions
Based on the quantitative information provided by different databases from international institutions such as Eurostat and the World Bank and CEPII, this study analyzes the recent evolution of agri-food exports from Spain and Portugal, two Southern European countries that have traditionally shown productive specialization in this sector. The aim is to provide explanations for the dynamics in agri-food product exports by two EU-27 partner countries in a period of consolidation of European integration, identifying similarities and differences between the two countries.
The results of the study allow us to answer the questions raised in the introduction, confirming the agri-food specialization of both economies, the dynamics characterizing the recent evolution of these sectors, and the diversity of products they place in international markets year after year, which positively contributes to consolidating sector results. In both countries, the olive oil and wine subsectors continue to hold prominent positions, although the former is reinforced while the latter has declined.
At the spatial level, these two countries on the Iberian Peninsula continue to have a marked dependence on the EU-27 market, although the Spanish agri-food sector has managed to reduce it by focusing on new non-EU markets that are geographically more distant and have higher per capita income. In contrast, Portugal has reinforced its dependence on EU partners, particularly neighboring Spain. Overall, this situation influences the short- and medium-term evolution of exports from Spain and Portugal, requiring an appropriate marketing strategy that allows them to leverage their comparative advantages, boost their competitiveness, and take advantage of the import dynamics of third countries, even though this is associated with much greater risks than exporting to traditional markets.
Based on the uneven performance of agricultural product exports across different countries, it appears evident that those shaping the international customer structure of the sector are directly responsible for the evolution of their foreign sales. A sector that sends its products to destinations experiencing a marked increase in imports has significant opportunities for rapid growth in export revenues. Therefore, the selection of favorable scenarios of international expansion based on the possibilities offered by different countries is essential for the Spanish and Portuguese agri-food sectors, which must consolidate their competitive position in the world.
The study has some limitations, primarily stemming from the data aggregation process for the entire agri-food sector of Spain and Portugal when running the gravity models; although this allows for an analysis of their overall export activity, it does not account for particular aspects of different types of products, which should be addressed in further research. Secondly, the identified dynamics have been conditioned by trade restrictions resulting from the COVID pandemic, external climatic events (widespread floods and droughts), the effects of the Ukraine War, and the sanctions imposed by the EU on Russia and Belarus in 2022, negatively affecting exports from the two countries analyzed. Despite these limitations, this work opens the field for future research on the competitiveness of the agri-food sector in the Iberian Peninsula countries, which are part of the EU-27—a major agricultural trading power and net food exporter.
In this regard, it would be worth analyzing whether there are significant differences between goods exported to EU partners and those placed in geographically more distant markets, such as the United States or China. Likewise, it would be interesting to investigate bilateral trade in agri-food products between Spain and Portugal and delve into the sectoral and business factors that condition it, which may be influenced by the development of value chains at the level of the Iberian Peninsula. Another suggested future line of research is to examine the possible relationship between the recent evolution of imports of agri-food products from non-EU countries and exports of these products by Spain and Portugal, identifying similarities and differences, particularly in the case of fresh fruits and horticultural products.
Finally, regarding the implications of this study, the recent changes identified in the export structure of the Spanish and Portuguese agri-food sectors—which are responsible for a high percentage of revenues in the balance of payments of both countries—are of interest to institutional managers, who must develop policies and programs that help consolidate the geographical diversification of sector companies in international markets, a complicated strategy that must be undertaken within a complex geopolitical framework, such as the one characterizing the current global economy.
Author Contributions
“Conceptualization, E.M.P., M.Z.M. and L.G.V.; methodology, E.M.P., M.Z.M. and L.G.V.; validation, E.M.P., M.Z.M. and L.G.V.; formal analysis, E.M.P., M.Z.M. and L.G.V.; investigation, E.M.P., M.Z.M. and L.G.V.; resources, E.M.P., M.Z.M. and L.G.V.; data curation, E.M.P., M.Z.M. and L.G.V.; writing—original draft preparation, E.M.P., M.Z.M. and L.G.V.; writing—review and editing, E.M.P., M.Z.M. and L.G.V.; visualization, E.M.P., M.Z.M. and L.G.V.; supervision, E.M.P., M.Z.M. and L.G.V.; project administration, E.M.P., M.Z.M. and L.G.V. All authors have read and agreed to the published version of the manuscript.”
Funding
“This research received no external funding”.
Acknowledgments
The authors would like to thank CIDEHUS (Centro Interdisciplinar de História, Culturas e Sociedades) from Evora University (Portugal) for their contributions in the research results.
Conflicts of Interest
The authors declare no conflicts of interest.
References
- Santeramo, F.G.; Lamonaca, E. The role of non-tariff measures in the agri-food sector: positive or negative instruments for trade. In Positive Integration-EU and WTO Approaches Towards the" Trade and" Debate; Krämer-Hoppepp, R., Ed.; Springer: New York, USA, 2020; pp. 35–59. [Google Scholar]
- Gourdon, J.; Stone, S.; van Tongeren, F. Non-tariff measures in agriculture; OECD Food, Agriculture and Fisheries Papers: Paris, France, 2020. [Google Scholar]
- Fiankor, D.D.D.; Curzi, D.; Olper, A. Trade, price and quality upgrading effects of agri-food standards. European Review of Agricultural Economics 2020, 48, 835–877. [Google Scholar] [CrossRef]
- Evenett, S.J. The Global Trade Disorder, Centre for Economic Policy Research, London. 2024. Available online: https://www.globaltradealert.org/reports/24 (accessed on 2 April 2024).
- Ben Hassen, T.; El Bilali, H. Impacts of the Russia-Ukraine war on global food security: towards more sustainable and resilient food systems? Foods 2022, 11, 2301. [Google Scholar] [CrossRef]
- Beghin, J.C.; Maertens, M.; Swinnen, J. Nontariff measures and standards in trade and global value chains. Annual Review of Resource Economics 2015, 7, 425–450. [Google Scholar] [CrossRef]
- Thuong, N.T.T. The effect of Sanitary and Phytosanitary measures on Vietnam’s rice exports. EconomiA 2018, 19, 251–265. [Google Scholar] [CrossRef]
- Ronen, E. The trade-enhancing effects of non-tariff measures on virgin olive oil. International Journal of Food and Agricultural Economics 2017, 5, 9–26. [Google Scholar]
- European Comission Trade. Available online: https://policy.trade.ec.europa.eu/index_en?prefLang=es (accessed on 2 April 2024).
- WTO. Trade Profiles 2014. Available online: https://www.wto.org/english/res_e/publications_e/trade_profiles14_e.htm (accessed on 2 April 2024).
- WTO. Statistics. Available online: https://stats.wto.org/ (accessed on 2 April 2024).
- Hummels, D.; Klenow, P.J. The variety and quality of a nation's exports. American economic review 2005, 95, 704–723. [Google Scholar] [CrossRef]
- Hesse, H.; Export diversification and economic growth. Breaking into new markets: emerging lessons for export diversification. World Bank, The International Bank for Reconstruction and Development 2009, 55-80. Available online: https://documents1.worldbank.org/curated/ru/821641468323336000/pdf/481030PUB0Brea101Official0use0only1.pdf (accessed on 2 April 2024).
- Bacchetta, M.; Jansen, M.; Lennon, C.; Piermartini, R. Exposure to external shocks and the geographical diversification of exports. Breaking into new markets. Emerging lessons for export diversification; World Bank, 2009. [Google Scholar]
- Mejía, J.F. Export diversification and economic growth: An analysis of Colombia’s export competitiveness in the European Union’s market; Springer: Berlín, Germany, 2011. [Google Scholar]
- Dingemans, A.; Ross, C. Los acuerdos de libre comercio en América Latina desde 1990: una evaluación de la diversificación de exportaciones. Revista Cepal 2012, 108, 27–50. [Google Scholar] [CrossRef]
- Tinbergen, J.J. Shaping the World Economy: Suggestions for an International Economic Policy; Twentieth Century Fund: New York, USA, 1962. [Google Scholar]
- Anderson, J.E. A theoretical foundation for the gravity equation. Am. Econ. Rev. 1979, 69, 106–116. [Google Scholar]
- Carrere, C. Revisiting the effects of regional trade agreements on trade flows with proper specification of the gravity model. European economic review 2006, 50, 223–247. [Google Scholar] [CrossRef]
- Kepaptsoglou, K.; Karlaftis, M.G.; Tsamboulas, D. The gravity model specification for modeling international trade flows and free trade agreement effects: a 10-year review of empirical studies. The open economics journal 2010, 3. [Google Scholar] [CrossRef]
- Shahriar, S.; Qian, L.; Kea, S.; Abdullahi, N.M. The gravity model of trade: A theoretical perspective. Review of Innovation and Competitiveness: A Journal of Economic and Social Research 2019, 5, 21–42. [Google Scholar] [CrossRef]
- Serrano, R.; Pinilla, V. Changes in the structure of world trade in the agri-food industry: the impact of the home market effect and regional liberalization from a long-term perspective, 1963–2010. Agribusiness 2014, 30, 165–183. [Google Scholar] [CrossRef]
- Serrano, R.; Pinilla, V. The declining role of Latin America in global agricultural trade, 1963–2000. Journal of Latin American Studies 2016, 48, 115–146. [Google Scholar] [CrossRef]
- Ayuda, M.I.; Belloc, I.; Pinilla, V. Latin American agri-food exports, 1994–2019: a gravity model approach. Mathematics 2022, 10, 333. [Google Scholar] [CrossRef]
- Sarker, R.; Jayasinghe, S. Regional trade agreements and trade in agri-food products: evidence for the European Union from gravity modeling using disaggregated data. Agricultural Economics 2007, 37, 93–104. [Google Scholar] [CrossRef]
- Serrano, R.; Pinilla, V. Agricultural and food trade in European Union countries, 1963-2000: a gravity equation approach. Économies et Sociétés, Série Histoire économique quantitative 2011, 43, 191–219. [Google Scholar]
- Antimiani, A.; Carbone, A.; Costantini, V.; Henke, R. Agri-food exports in the enlarged European Union. Agric. Econ. Zemed. Ekon. 2012, 58, 354–366. [Google Scholar] [CrossRef]
- Torok, A.; Attila, J. Agri-food trade of the New Member States since the EU accession. Agric Econ. Czech. 2013, 59, 101–112. [Google Scholar] [CrossRef]
- Carraresi, L.; Banterle, A. Agri-food competitive performance in EU countries: A fifteen-year retrospective. International Food and Agribusiness Management Review 2015, 18, 37–62. [Google Scholar]
- Bojnec, Š.; Fertő, I. Agri-food export competitiveness in European Union countries. JCMS: Journal of Common Market Studies 2015, 53, 476–492. [Google Scholar] [CrossRef]
- Bojnec, Š.; Fertő, I. The duration of global agri-food export competitiveness. British Food Journal 2017, 119, 1378–1393. [Google Scholar] [CrossRef]
- Bojnec, S.; Fertő, I. Drivers of the duration of comparative advantage in the European Union’s agri-food exports. Agric. Econ. Zemed. Ekon. 2018, 64, 51–60. [Google Scholar] [CrossRef]
- Bojnec, Š.; Fertő, I. Agri-food comparative advantages in the European Union Countries by value chains before and after enlargement towards the east. Agraarteadus 2019, 30, 69–77. [Google Scholar]
- Bojnec, Š.; Čechura, L.; Fałkowski, J.; Fertő, I. Agri-food Exports from Central-and Eastern-European Member States of the European Union are Catching Up. EuroChoices 2021, 20, 11–19. [Google Scholar] [CrossRef]
- Sanz, F.; Gil, J.M. An assessment of the agricultural trade impact of Spain's integration into the EU. Canadian Journal of Agricultural Economics/Revue canadienne d'agroeconomie 2001, 49, 53–69. [Google Scholar] [CrossRef]
- Serrano, R.; García-Casarejos, N.; Gil-Pareja, S.; Llorca-Vivero, R.; Pinilla, V. The internationalisation of the Spanish food industry: the home market effect and European market integration. Spanish Journal of Agricultural Research 2015, 13. [Google Scholar] [CrossRef]
- World Trade Organization World tariff profiles 2023. Available online: https://www.wto.org/english/res_e/booksp_e/world_tariff_profiles23_e.pdf (accessed on 2 April 2024).
- Global Trade Alert. Independent monitoring of policies that affect world commerce. Available online: https://www.globaltradealert.org/ (accessed on 2 April 2024).
- Carraresi, L.; Banterle, A. Agri-food competitive performance in EU countries: A fifteen-year retrospective. International Food and Agribusiness Management Review 2015, 18, 37–62. [Google Scholar]
- Eurostat Database. Available online: https://ec.europa.eu/eurostat/data/database (accessed on 2 April 2024).
- Hamulczuk, M.; Pawlak, K.; Stefańczyk, J.; Gołębiewski, J. Agri-Food Supply and Retail Food Prices during the Russia–Ukraine Conflict’s Early Stage: Implications for Food Security. Agriculture 2023, 13, 2154. [Google Scholar] [CrossRef]
- FAOSTAT Data. Available online: https://www.fao.org/faostat/es/#data (accessed on 2 April 2024).
- World Bank. World Development Indicators. Available online: https://databank.worldbank.org/source/world-development-indicators (accessed on 2 April 2024).
- Eurostat Statistics. Available online: https://ec.europa.eu/eurostat/statistics-explained/index.php?title=Glossary:European_Union_(EU)/es (accessed on 2 April 2024).
- CEPII. Available online: http://www.cepii.fr/CEPII/fr/bdd_modele/bdd_modele_item.asp?id=8 (accessed on 2 April 2024).
- Balassa, B. Trade liberalisation and “revealed” comparative advantage. The Manchester School 1965, 33, 99–123. [Google Scholar] [CrossRef]
- Balassa, B. Revealed’comparative advantage revisited: An analysis of relative export shares of the industrial countries, 1953–1971. The Manchester School 1977, 45, 327–344. [Google Scholar] [CrossRef]
- Balassa, B.; Noland, M. Revealed Comparative Advantage in Japan and the United States. Journal of International Economic Integration 1989, 8–22. [Google Scholar] [CrossRef]
- Hirschman, A. The Paternity of an Index. American Economic Review 1964, 54, 761–762. [Google Scholar]
- Babones, S.; Farabee-Siers, R.M. Indices of trade partner concentration for 183 countries. Journal of World-Systems Research 2012, 266–277. [Google Scholar] [CrossRef]
- Finger, J.; Kreinin, M. A measure of ‘export similarity’ and its possible uses. The Economic Journal 1979, 89, 905–912. [Google Scholar] [CrossRef]
- Dunn, E.S. A statistical and analytical technique for regional analysis. Papers in Regional Science 1960, 6, 97–112. [Google Scholar] [CrossRef]
- Baltagi, B.H. Econometric analysis of panel data; John Wiley & Sons: New York, 2005. [Google Scholar]
- Andreb, H.J.; Golsch, K.; Schmidt, A.W. Applied panel data analysis for economic and social surveys; Springer Science & Business Media, 2013. [Google Scholar]
- Abiad, A.; Mishra, P.; Topalova, P. How does trade evolve in the aftermath of financial crises? IMF Economic Review 2014, 62, 213–247. [Google Scholar] [CrossRef]
- Constantinescu, C.; Mattoo, A.; Ruta, M. The global trade slowdown: cyclical or structural? The World Bank Economic Review 2020, 34, 121–142. [Google Scholar] [CrossRef]
- Crescimanno, M.; Galati, A.; Bal, T. The role of the economic crisis on the competitiveness of the agri-food sector in the main Mediterranean countries. Agric. Econ. – Czech 2014, 60, 49–64. [Google Scholar] [CrossRef]
- Oliveira, M.D.F.; Reis, P. Portuguese Agrifood Sector Resilience: An Analysis Using Structural Breaks Applied to International Trade. Agriculture 2023, 13, 1699. [Google Scholar] [CrossRef]
- Serrano, R.; Acero, I.; Fernandez-Olmos, M. Networks and export performance of agri-food firms: new evidence linking micro and macro determinants. Agric. Econ. – Czech 2016, 62, 459–470. [Google Scholar] [CrossRef]
- Carbone, A.; Henke, R. Recent trends in agri-food Made in Italy exports. Agricultural and Food Economics 2023, 11, 32. [Google Scholar] [CrossRef]
- Fuentes-García, F.J.; Cosano-Carrillo, A.B.; Sánchez-Cañizares, S. Exploratory analysis of foreign markets for Spanish organic wines. Ciencia e investigación agraria: revista latinoamericana de ciencias de la agricultura 2015, 42, 139–152. [Google Scholar] [CrossRef]
- García-Moral, A.; Moral-Pajares, E.; Gallego-Valero, L. The Spanish Olive Oil with Quality Differentiated by a Protected Designation of Origin. Agriculture 2023, 13, 2169. [Google Scholar] [CrossRef]
- Coretchi, B.; Gribincea, A. Analysis of the Agri-food Sector of the Republic of Moldova in the Equation Model of Growth and Development of the Foreign Economic Relations. Sci. Pap. Ser. Manag. Econ. Eng. Agric. Rural. Dev. 2013, 13, 75–82. [Google Scholar]
- European Commission. Report from the Commission to the European Parliament, The Council, The European Economic and Social Committee and the Committee of the Regions on the impact of demographic change, 2020. Available online: https://commission.europa.eu/document/download/37476c85-0553-4a2f-985d-fe4e49c6d8af_en?filename=commission-staff-working-document-impact-demographic-change-17june2020_en.pdf&prefLang=e (accessed on 2 April 2024).
- Norman, K.; Haß, U.; Pirlich, M. Desnutrición en adultos mayores: avances recientes y desafíos pendientes. Nutrientes 2021, 13, 2764. [Google Scholar] [CrossRef] [PubMed]
- Matkovski, B.; Koviljko, L.; Stanislav, Z. The foreign trade liberalization and export of agri-food products of Serbia. Agric. Econ. – Czech 2017, 63, 331–345. [Google Scholar] [CrossRef]
- Brkić, S.; Kastratović, R.; Salkica, M.A. Analysis of Intra-Industry Trade in Agri-Food Products Between Bosnia and Herzegovina and the European Union. South East European Journal of Economics and Business 2021, 16, 53–67. [Google Scholar] [CrossRef]
- Dong, J.; Gruda, N.; Li, X.; Cai, Z.; Zhang, L.; Duan, Z. Global vegetable supply towards sustainable food production and a healthy diet. Journal of Cleaner Production 2022, 369, 133212. [Google Scholar] [CrossRef]
- Mulazzani, L.; Malorgio, G. Market dynamics and commercial flows in the Mediterranean area: triangular effects among the EU, the MCPs and Italy in the fruit and vegetable sector. New Medit 2009, 8, 37–45. [Google Scholar]
- Abdullahi, N.M.; Aluko, O.A.; Huo, X. Determinants, efficiency and potential of agri-food exports from Nigeria to the EU: Evidence from the stochastic frontier gravity model. Agric. Econ. – Czech 2021, 67, 337–349. [Google Scholar] [CrossRef]
- Hong, J.; Gruda, N.S. The potential of introduction of Asian vegetables in Europe. Horticulturae 2020, 6, 38. [Google Scholar] [CrossRef]
- Anderson, K.; Norheim, H. From imperial to regional trade preferences: Its effect on Europe’s intra-and extra-regional trade. Review of World Economics 1993, 129, 78–102. [Google Scholar] [CrossRef]
- Bułkowska, M. Diversification of Polish agri-food trade. International Journal of Business and Technology 2017, 6, 1–6. [Google Scholar] [CrossRef]
- Pawlak, K. Competitiveness of the EU agri-food sector on the US market: worth reviving transatlantic trade? Agriculture 2021, 12, 23. [Google Scholar] [CrossRef]
- Pawlak, K.; Smutka, L. Does Poland’s agri-food industry gain comparative advantage in trade with non-EU countries? Evidence from the transatlantic market. Plos one 2022, 17. [Google Scholar] [CrossRef] [PubMed]
- Melitz, M.J. The impact of trade on intra-industry reallocations and aggregate industry productivity. Econometrica 2003, 71, 1695–1725. [Google Scholar] [CrossRef]
- Johanson, J.; Wiedersheim-Paul, F. The internationalization of the firm. Four Swedish cases. J Manage Stud 1975, 12, 305–323. [Google Scholar] [CrossRef]
- Serrano, R.; Fernández-Olmos, M.; Pinilla, V. Internationalization and performance in agri-food firms. Spanish Journal of Agricultural Research 2018, 16. [Google Scholar] [CrossRef]
Figure 1.
Trade restrictive measures. Source: [11].
Figure 1.
Trade restrictive measures. Source: [11].
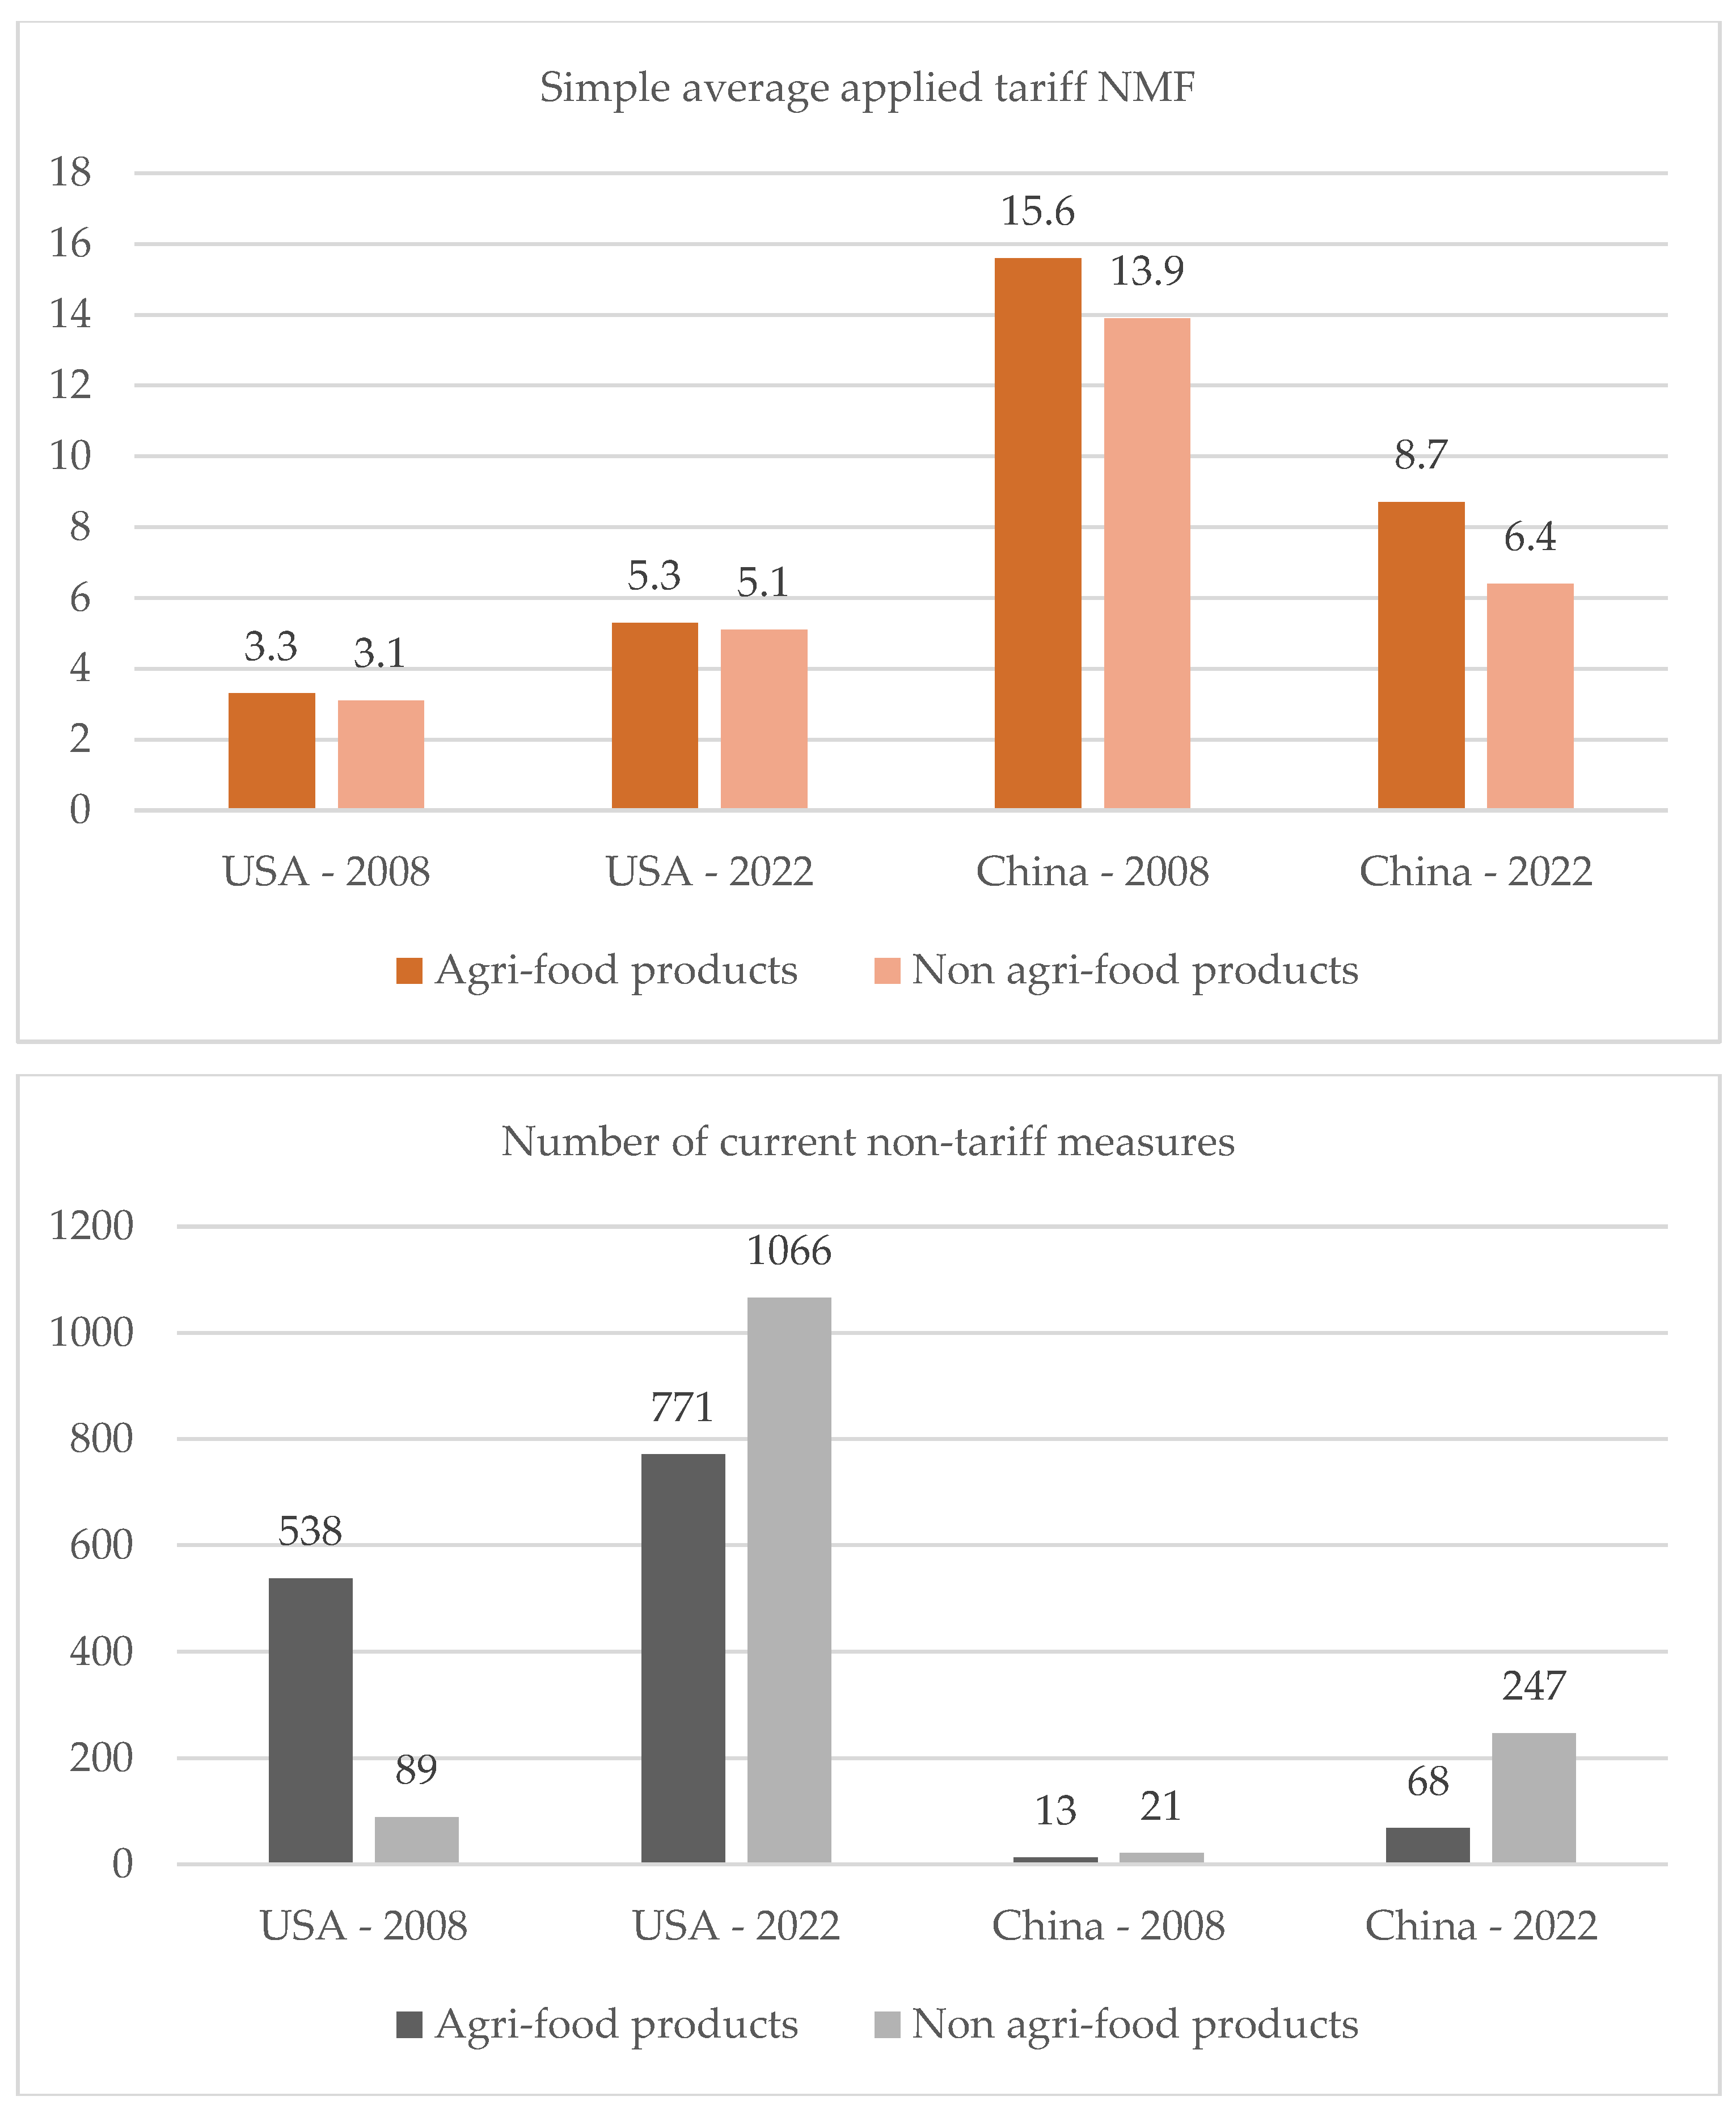
Figure 2.
Evolution of agri-food product exports from Spain, Portugal, and the EU-27 between 2008 and 2022 (in billions of € at constant prices). Source: [40].
Figure 2.
Evolution of agri-food product exports from Spain, Portugal, and the EU-27 between 2008 and 2022 (in billions of € at constant prices). Source: [40].
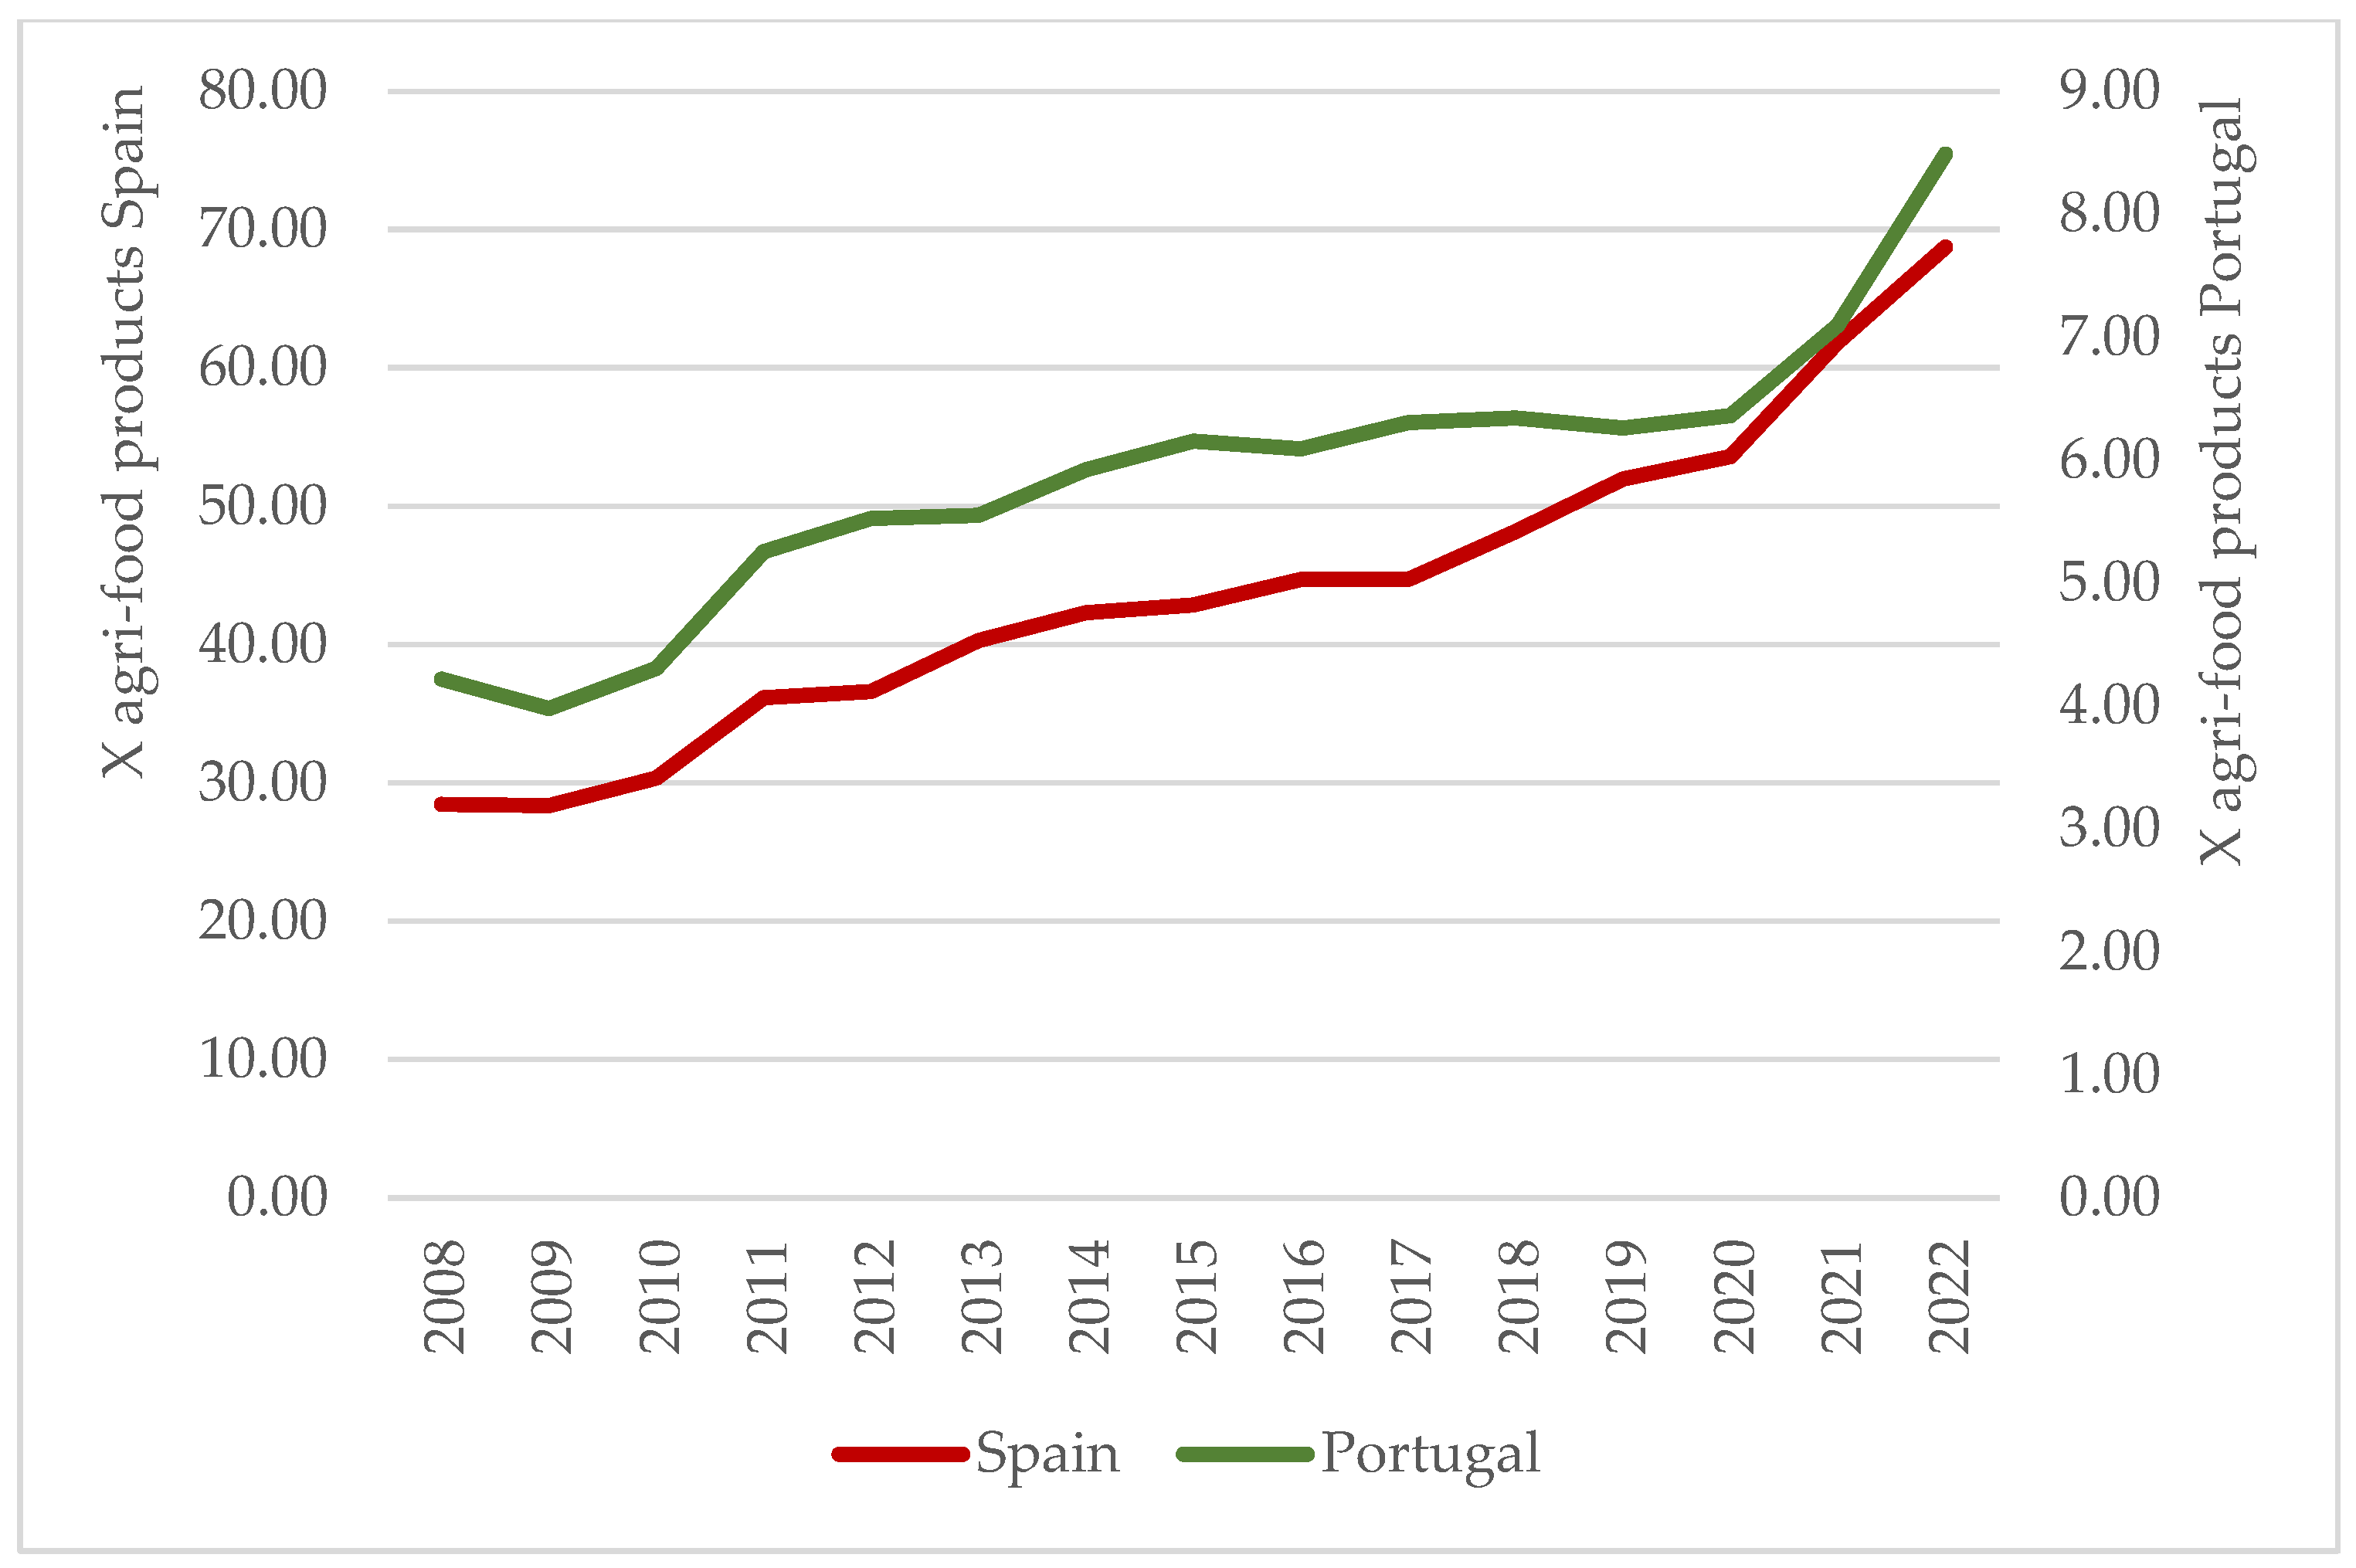
Figure 3.
Shares of EU-27 countries in the destination of agri-food product exports from Spain and Portugal between 2008 and 2022. Source: [40].
Figure 3.
Shares of EU-27 countries in the destination of agri-food product exports from Spain and Portugal between 2008 and 2022. Source: [40].
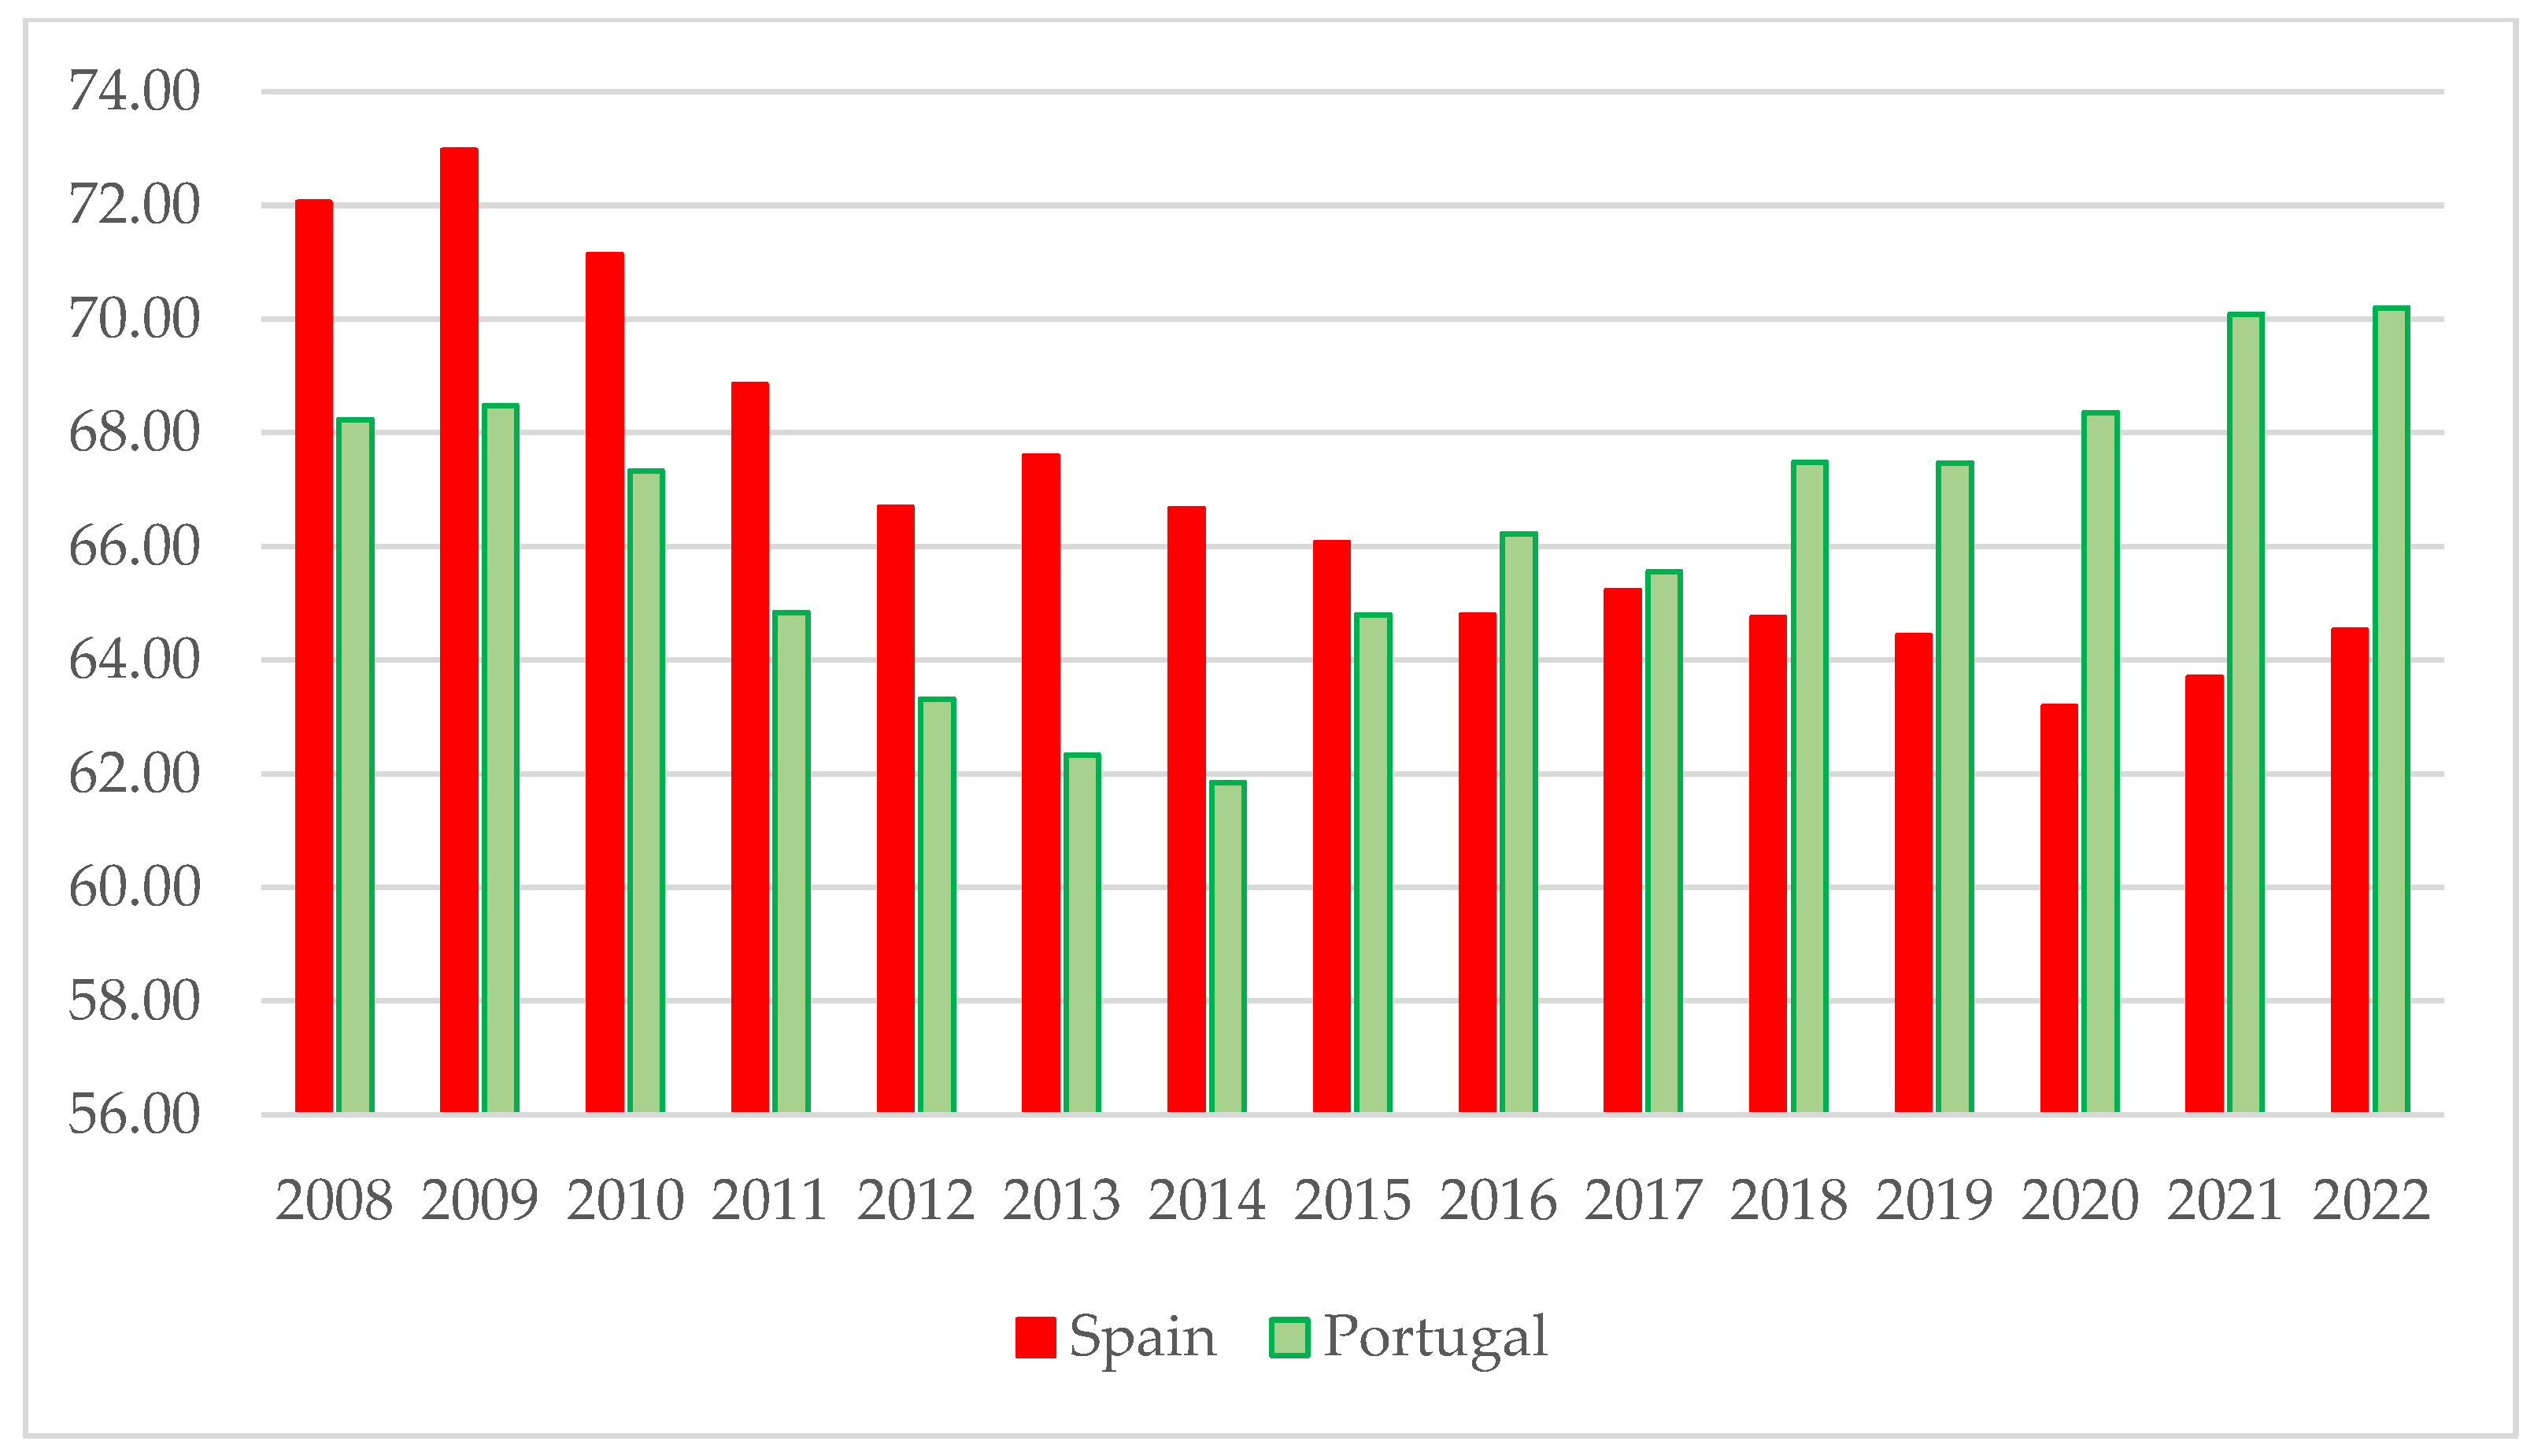

Table 1.
Definition of the variables.
| Variable | Definition | Source and unit |
|---|---|---|
| EXPit | Logarithm of the exports of agri-food products from country i to country j at time t in euros, at constant prices. | The value of agri-food product exports at current prices comes from [40]. |
| GDPit: | Logarithm of the GDP of importing country i, which approximates the size of the export market. | GDP data (constant 2015 US$) comes from [43]. |
| GDPpcit | The logarithm of GDP per capita of exporting countries is used as an indicator of demand. | GDP per capita is calculated by dividing GDP by population for each country [43]. |
| Distit | Distance in kilometers between the two main cities of the respective countries. | [45] |
| UEit | Dummy variable indicating whether country i belongs to the EU at time t. | [44] |
| Agrit | Dummy variable indicating whether there is an association agreement between country i and the EU at time t. | [9] |
Source: Own Elaboration.
Table 2.
Agri-food product exports in EU-27 countries, percentage distribution of agri-food product exports among EU-27 countries, Revealed Comparative Advantage (RCA), Net Export Index in 2008 and 2022, and cumulative average annual variation rate of exports and GDP between 2008 and 2022.
Table 2.
Agri-food product exports in EU-27 countries, percentage distribution of agri-food product exports among EU-27 countries, Revealed Comparative Advantage (RCA), Net Export Index in 2008 and 2022, and cumulative average annual variation rate of exports and GDP between 2008 and 2022.
| Agri-food EXP (Million €) | Distribution (%) | RCA | Net Export Index | EXP Variation rate | GDP variation rate | |||||
|---|---|---|---|---|---|---|---|---|---|---|
| 2008 | 2022 | 2008% | 2022% | 2008 | 2022 | 2008 | 2022 | 2008-2022 | 2008-2022 | |
| EU-27 | 335,305.90 | 472,107.00 | 100.00 | 100.00 | 0.01 | 0.04 | 2.47 | 0.91 | ||
| Belgium | 29,027.36 | 34,186.71 | 8.66 | 7.24 | 1.01 | 0.83 | 0.04 | 0.07 | 1.18 | 1.34 |
| Bulgaria | 1,935.13 | 5,583.34 | 0.58 | 1.18 | 1.41 | 2.37 | 0.04 | 0.11 | 7.86 | 1.81 |
| Czechia | 4,298.87 | 7,109.82 | 1.28 | 1.51 | 0.48 | 0.48 | -0.10 | -0.08 | 3.66 | 1.54 |
| Denmark | 15,078.15 | 16,688.04 | 4.50 | 3.53 | 2.11 | 1.92 | 0.20 | 0.13 | 0.73 | 1.48 |
| Germany | 52,916.81 | 39,251.01 | 15.78 | 8.31 | 0.60 | 0.37 | -0.10 | -0.12 | -2.11 | 1.03 |
| Estonia | 796.88 | 842.98 | 0.24 | 0.18 | 1.05 | 0.76 | -0.17 | -0.07 | 0.40 | 1.77 |
| Ireland | 8,146.35 | 8,756.62 | 2.43 | 1.85 | 1.06 | 0.57 | 0.16 | 0.18 | 0.52 | 6.14 |
| Greece | 4,257.34 | 9,169.61 | 1.27 | 1.94 | 2.23 | 2.01 | -0.25 | -0.05 | 5.63 | -1.59 |
| Spain | 28,437.87 | 68,738.17 | 8.48 | 14.56 | 1.65 | 2.23 | 0.02 | 0.11 | 6.51 | 0.47 |
| France | 49,851.77 | 53,419.63 | 14.87 | 11.32 | 1.32 | 1.20 | 0.10 | 0.06 | 0.49 | 0.86 |
| Croatia | 964.15 | 3,307.05 | 0.29 | 0.70 | 1.12 | 1.95 | -0.30 | -0.16 | 9.20 | 0.67 |
| Italy | 26,740.74 | 46,128.79 | 7.98 | 9.77 | 0.81 | 0.98 | -0.12 | 0.01 | 3.97 | 0.01 |
| Cyprus | 221.95 | 430.40 | 0.07 | 0.09 | 2.22 | 1.33 | -0.62 | -0.53 | 4.84 | 1.80 |
| Latvia | 1,174.60 | 2,487.03 | 0.35 | 0.53 | 1.89 | 1.71 | -0.13 | 0.02 | 5.50 | 0.86 |
| Lithuania | 2,577.73 | 3,708.78 | 0.77 | 0.79 | 1.78 | 1.47 | 0.04 | 0.13 | 2.63 | 2.01 |
| Luxembourg | 796.19 | 1,015.72 | 0.24 | 0.22 | 0.51 | 1.04 | -0.37 | -0.32 | 1.75 | 1.85 |
| Hungary | 5,801.29 | 3,930.15 | 1.73 | 0.83 | 0.87 | 0.57 | 0.20 | 0.15 | -2.74 | -1.23 |
| Malta | 173.80 | 382.82 | 0.05 | 0.08 | 0.82 | 1.95 | -0.49 | -0.39 | 5.80 | 5.07 |
| Netherlands | 65,936.19 | 98,384.51 | 19.66 | 20.84 | 1.69 | 1.50 | 0.22 | 0.17 | 2.90 | 1.26 |
| Austria | 8,581.47 | 12,466.36 | 2.56 | 2.64 | 0.77 | 0.92 | -0.03 | 0.00 | 2.70 | 1.00 |
| Poland | 11,639.09 | 23,438.44 | 3.47 | 4.96 | 1.12 | 1.13 | 0.06 | 0.19 | 5.13 | 1.41 |
| Portugal | 4,216.81 | 8,489.22 | 1.26 | 1.80 | 1.21 | 1.49 | -0.32 | -0.21 | 5.12 | 0.70 |
| Romania | 2,161.98 | 6,593.48 | 0.64 | 1.40 | 0.71 | 1.55 | -0.34 | -0.05 | 8.29 | 0.06 |
| Slovenia | 1,073.92 | 2,453.74 | 0.32 | 0.52 | 0.51 | 0.53 | -0.28 | -0.13 | 6.08 | 1.19 |
| Slovakia | 1,970.94 | 4,214.03 | 0.59 | 0.89 | 0.45 | 0.56 | -0.18 | -0.16 | 5.58 | 2.25 |
| Finland | 1,398.13 | 2,019.24 | 0.42 | 0.43 | 0.24 | 0.36 | -0.44 | -0.51 | 2.66 | 0.46 |
| Sweden | 5,130.38 | 8,911.31 | 1.53 | 1.89 | 0.46 | 0.71 | -0.31 | -0.24 | 4.02 | 1.23 |
Table 3.
Number of agricultural products exported defined at the four-digit level (SA-2007) by Spain and Portugal in 2008 and 2022, and concentration index (CI).
Table 3.
Number of agricultural products exported defined at the four-digit level (SA-2007) by Spain and Portugal in 2008 and 2022, and concentration index (CI).
| N. of exported products (2008) |
N. of new exported products (2022) |
N. of products not exported (2022) |
N. of exported products (2022) |
CI (2008) |
CI (2022) |
|
|---|---|---|---|---|---|---|
| Spain | 180 | 8 | 2 | 186 | 0.17 | 0.16 |
| Portugal | 145 | 18 | 2 | 161 | 0.20 | 0.18 |
Source: [40].
Table 4.
Shares of the top 10 agri-food products exported by Spain and Portugal in 2008 and 2022 and differential effect (de).
Table 4.
Shares of the top 10 agri-food products exported by Spain and Portugal in 2008 and 2022 and differential effect (de).
| Tariff code | Product | 2008 (%) |
2022 (%) |
de (%) |
|---|---|---|---|---|
| Spain | ||||
| 0805 | Citrus fruit, fresh or dried | 8.51 | 5.35 | -0.90 |
| 2204 | Wine of fresh grapes, including fortified wines; grape must other than that of heading 2009 | 6.85 | 4.51 | -0.82 |
| 1509 | Olive oil and its fractions, whether or not refined, but not chemically modified | 6.45 | 6.08 | -0.14 |
| 0203 | Meat of swine, fresh, chilled or frozen | 5.82 | 8.65 | 1.17 |
| 0709 | Other vegetables, fresh or chilled | 3.78 | 3.91 | 0.08 |
| 0702 | Tomatoes, fresh or chilled | 2.98 | 1.65 | -1.08 |
| 2005 | Other vegetables prepared or preserved otherwise than by vinegar or acetic acid, not frozen, other than products of heading 2006 | 2.54 | 1.84 | -0.67 |
| 0809 | Apricots, cherries, peaches (including nectarines), plums and sloes, fresh | 2.51 | 1.78 | -0.70 |
| 0810 | Other fruit, fresh | 2.17 | 2.99 | 0.91 |
| 0303 | Fish, frozen, excluding fish fillets and other fish meat of heading 0304 | 2.12 | 1.25 | -0.99 |
| Portugal | 46.51 | |||
| 2204 | Wine of fresh grapes, including fortified wines; grape must other than that of heading 2009 | 14.48 | 9.29 | -0.72 |
| 2402 | Cigars, cheroots, cigarrillos and cigarettes, of tobacco or of tobacco substitutes | 7.43 | 7.05 | -0.10 |
| 0401 | Milk and cream, not concentrated nor containing added sugar or other sweetening matter | 3.44 | 0.84 | -1.52 |
| 2203 | Beer made from malt | 3.43 | 1.51 | -1.13 |
| 1509 | Olive oil and its fractions, whether or not refined, but not chemically modified | 3.36 | 9.25 | 3.52 |
| 1701 | Cane or beet sugar and chemically pure sucrose, in solid form | 3.31 | 1.40 | -1.16 |
| 1604 | Prepared or preserved fish; caviar and caviar substitutes prepared from fish eggs | 2.99 | 2.79 | -0.14 |
| 2002 | Tomatoes prepared or preserved otherwise than by vinegar or acetic acid | 2.92 | 3.26 | 0.23 |
| 1905 | Bread, pastry, cakes, biscuits and other bakers’ wares, whether or not containing cocoa; communion wafers, empty cachets of a kind suitable for pharmaceutical use, sealing wafers, rice paper and similar products | 2.87 | 3.11 | 0.17 |
| 0302 | Fish, fresh or chilled, excluding fish fillets and other fish meat of heading 0304 | 2.26 | 1.61 | -0.58 |
Source: [40].
Table 5.
Number of destination countries to which Spain and Portugal export agri-food products in 2008 and 2022 and concentration index (CI) of agri-food product exports in 2008 and 2022.
Table 5.
Number of destination countries to which Spain and Portugal export agri-food products in 2008 and 2022 and concentration index (CI) of agri-food product exports in 2008 and 2022.
| N. of countries exported to in 2008 | N. of new countries exported to in 2022 | N. of countries not exported to in 2022 | Total number of countries exported to | CI (2008) |
CI (2022) |
|
|---|---|---|---|---|---|---|
| Spain | 158 | 22 | 5 | 175 | 0.31 | 0.26 |
| Portugal | 81 | 54 | 3 | 132 | 0.43 | 0.42 |
Source: [40].
Table 6.
Distribution by country of agri-food product exports from Spain and Portugal in 2008 and 2022 (in %) and country-specific differential effect (de).
Table 6.
Distribution by country of agri-food product exports from Spain and Portugal in 2008 and 2022 (in %) and country-specific differential effect (de).
| Spain | 2008 | 2022 | de | Portugal | 2008 | 2022 | de |
|---|---|---|---|---|---|---|---|
| EU-27 | 72.05 | 64.53 | -0.25 | EU-27 | 68.23 | 70.2 | 0.06 |
| Belgium | 2.51 | 2.35 | -0.16 | Belgium | 2.35 | 1.98 | -0.32 |
| Bulgaria | 0.18 | 0.33 | 1.95 | Bulgaria | 0.02 | 0.13 | 14.38 |
| Czechia | 0.85 | 1.07 | 0.65 | Czechia | 0.38 | 0.23 | -0.81 |
| Denmark | 1.06 | 0.94 | -0.28 | Denmark | 0.61 | 0.54 | -0.24 |
| Germany | 11.89 | 10.8 | -0.22 | Germany | 2.91 | 3.42 | 0.35 |
| Estonia | 0.1 | 0.11 | 0.17 | Estonia | 0.06 | 0.07 | 0.24 |
| Ireland | 0.46 | 0.56 | 0.55 | Ireland | 0.41 | 0.33 | -0.38 |
| Greece | 1.12 | 0.86 | -0.57 | Greece | 0.34 | 0.38 | 0.25 |
| France | 19.16 | 15.34 | -0.48 | Spain | 38.38 | 39.05 | 0.04 |
| Croatia | 0.19 | 0.31 | 1.46 | France | 9.4 | 9.36 | -0.01 |
| Italy | 11.81 | 9.8 | -0.41 | Croatia | 0.01 | 0.07 | 24.37 |
| Cyprus | 0.17 | 0.11 | -0.96 | Italy | 6.72 | 6.57 | -0.05 |
| Latvia | 0.15 | 0.19 | 0.64 | Cyprus | 0.09 | 0.08 | -0.25 |
| Lithuania | 0.27 | 0.22 | -0.37 | Latvia | 0.01 | 0.1 | 15.85 |
| Luxembourg | 0.09 | 0.06 | -0.75 | Lithuania | 0.04 | 0.07 | 1.62 |
| Hungary | 0.39 | 0.6 | 1.29 | Luxembourg | 0.68 | 0.59 | -0.26 |
| Malta | 0.11 | 0.11 | -0.06 | Hungary | 0.09 | 0.14 | 1.15 |
| Netherlands | 4.91 | 4.86 | -0.02 | Malta | 0.02 | 0.09 | 6.11 |
| Austria | 0.62 | 0.67 | 0.21 | Netherlands | 3.67 | 3.96 | 0.16 |
| Poland | 1.85 | 2.43 | 0.77 | Austria | 0.38 | 0.3 | -0.45 |
| Portugal | 11.93 | 10,00 | -0.39 | Poland | 0.57 | 1.54 | 3.45 |
| Romania | 0.4 | 0.82 | 2.57 | Romania | 0.17 | 0.19 | 0.28 |
| Slovenia | 0.14 | 0.16 | 0.21 | Slovenia | 0.01 | 0.06 | 7.18 |
| Slovakia | 0.2 | 0.35 | 1.67 | Slovakia | 0.01 | 0.09 | 14.81 |
| Finland | 0.41 | 0.38 | -0.18 | Finland | 0.34 | 0.26 | -0.48 |
| Sweden | 1.07 | 1.09 | 0.04 | Sweden | 0.57 | 0.63 | 0.19 |
| Rest of the world | 27.95 | 35.47 | 0.65 | Rest of the world | 31.77 | 29.8 | -0.12 |
| United Kingdom | 8.27 | 6.63 | -0.48 | Angola | 9.99 | 2.93 | -1.42 |
| United States of America | 2.88 | 4.47 | 1.34 | United Kingdom | 5.77 | 4.05 | -0.6 |
| Russia | 1.76 | 0.4 | -1.87 | Brazil | 3.65 | 5.03 | 0.76 |
| Switzerland | 1.24 | 1.1 | -0.26 | United States of A. | 1.96 | 2.69 | 0.75 |
| Japan | 1.16 | 1.93 | 1.62 | R. of Cape Verde | 1.27 | 1.1 | -0.28 |
| Morocco | 0.53 | 1.48 | 4.34 | Canada | 1.1 | 0.88 | -0.42 |
| China | 0.39 | 3.57 | 19.51 | Switzerland | 1.09 | 1.27 | 0.32 |
| South Korea | 0.29 | 1.37 | 9.13 | ||||
| Philippines | 0.14 | 1,00 | 14.70 |
Source: [40].
Table 7.
Panel data estimates.
| EXP | SPAIN (PCSE) | PORTUGAL (PCSE) | ||||
|---|---|---|---|---|---|---|
| Coef. | Z | P-value | Coef. | Z | P-value | |
| GDP | 0.55 | 17.97 | 0.000 | 0.42 | 9.65 | 0.000 |
| GDPpc | 0.22 | 3.69 | 0.000 | 0.12 | 1.61 | 0.108 |
| Dist | - 0.01 | - 8.07 | 0.000 | -0.01 | -8.29 | 0.000 |
| EU | 0.44 | 4.14 | 0.000 | 0.29 | 1.45 | 0.148 |
| Ag | 0.18 | 2.33 | 0.020 | -0.06 | -0.42 | 0.675 |
| Constant | - 4.14 | -4.63 | 0.000 | -2.03 | -1.89 | 0.059 |
| Observations | 1,110 | 1,106 | ||||
| N. of entities | 74 | 74 | ||||
|
Wald chi2 |
Wald chi2 (5) = 654.99 Prob>chi2 = 0.000 |
Wald chi2 (5) = 226.23 Prob>chi2 = 0.000 |
||||
|
Hausman test |
Chi2(4) = (b-B)'[(V_b-V_B)^(-1)](b-B) = 148.73 Prob>chi2 = 0.000 |
Chi2(4) = (b-B)'[(V_b-V_B)^(-1)](b-B) = 119.34 Prob>chi2 = 0.000 |
||||
Source: Own Elaboration.
Disclaimer/Publisher’s Note: The statements, opinions and data contained in all publications are solely those of the individual author(s) and contributor(s) and not of MDPI and/or the editor(s). MDPI and/or the editor(s) disclaim responsibility for any injury to people or property resulting from any ideas, methods, instructions or products referred to in the content. |
© 2024 by the authors. Licensee MDPI, Basel, Switzerland. This article is an open access article distributed under the terms and conditions of the Creative Commons Attribution (CC BY) license (http://creativecommons.org/licenses/by/4.0/).
Copyright: This open access article is published under a Creative Commons CC BY 4.0 license, which permit the free download, distribution, and reuse, provided that the author and preprint are cited in any reuse.


