
Submitted:
01 April 2025
Posted:
02 April 2025
You are already at the latest version
Abstract
Food security is a fundamental global challenge with significant regional implications, particularly in Eastern Europe. Romania and its neighboring countries—Bulgaria, Hungary, Serbia, Ukraine, and Moldova—face interconnected challenges related to food availability, access, stability, and utilization. This study assesses Romania’s food security in relation to its neighbors using FAO-defined indicators for each of these four pillars. The analysis is based on the latest FAO data. It applies two complementary analytical methods: comparative analysis, which evaluates Romania’s food security indicators in relation to average values in neighboring countries, and statistical significance testing, using One-sample t-tests and Wilcoxon signed-rank tests to determine whether the observed differences are statistically significant. The results indicate that Romania benefits from high food availability and a developed irrigation infrastructure but faces challenges related to severe food insecurity, economic disparities, and public health issues such as obesity. Despite a higher GDP per capita than its neighbors, food insecurity rates remain concerning, pointing to underlying socioeconomic inequalities. The findings highlight the need for targeted policies to reduce disparities, improve access to food for vulnerable populations, and promote sustainable food systems. The study highlights the urgent need for a coordinated regional approach to food security that integrates sustainable agricultural practices, economic resilience measures, and public health interventions to ensure long-term stability and equitable food access.
Keywords:
Sustainable food security
; agricultural sustainability
; food security pillars
; food security indicators
; regional food systems
; comparative and statistical analysis
; Romania and neighboring countries
1. Introduction
This research was originally presented at The 5th International Electronic Conference on Foods, where the abstract was published as part of the conference materials [1].
Food security remains one of the most pressing global challenges, with direct implications for regional stability, public health and sustainable economic development [2,3]. The complexity of food security is particularly evident in Eastern Europe, where Romania and neighboring countries – Bulgaria, Hungary, Serbia, Ukraine and Moldova – face a series of interconnected challenges related to availability, access, stability and use of food. In these regions, food security is not only a matter of production, but also of equitable distribution, adequate infrastructure and resilience in the face of climate change, economic disparities and political instability [4,5].
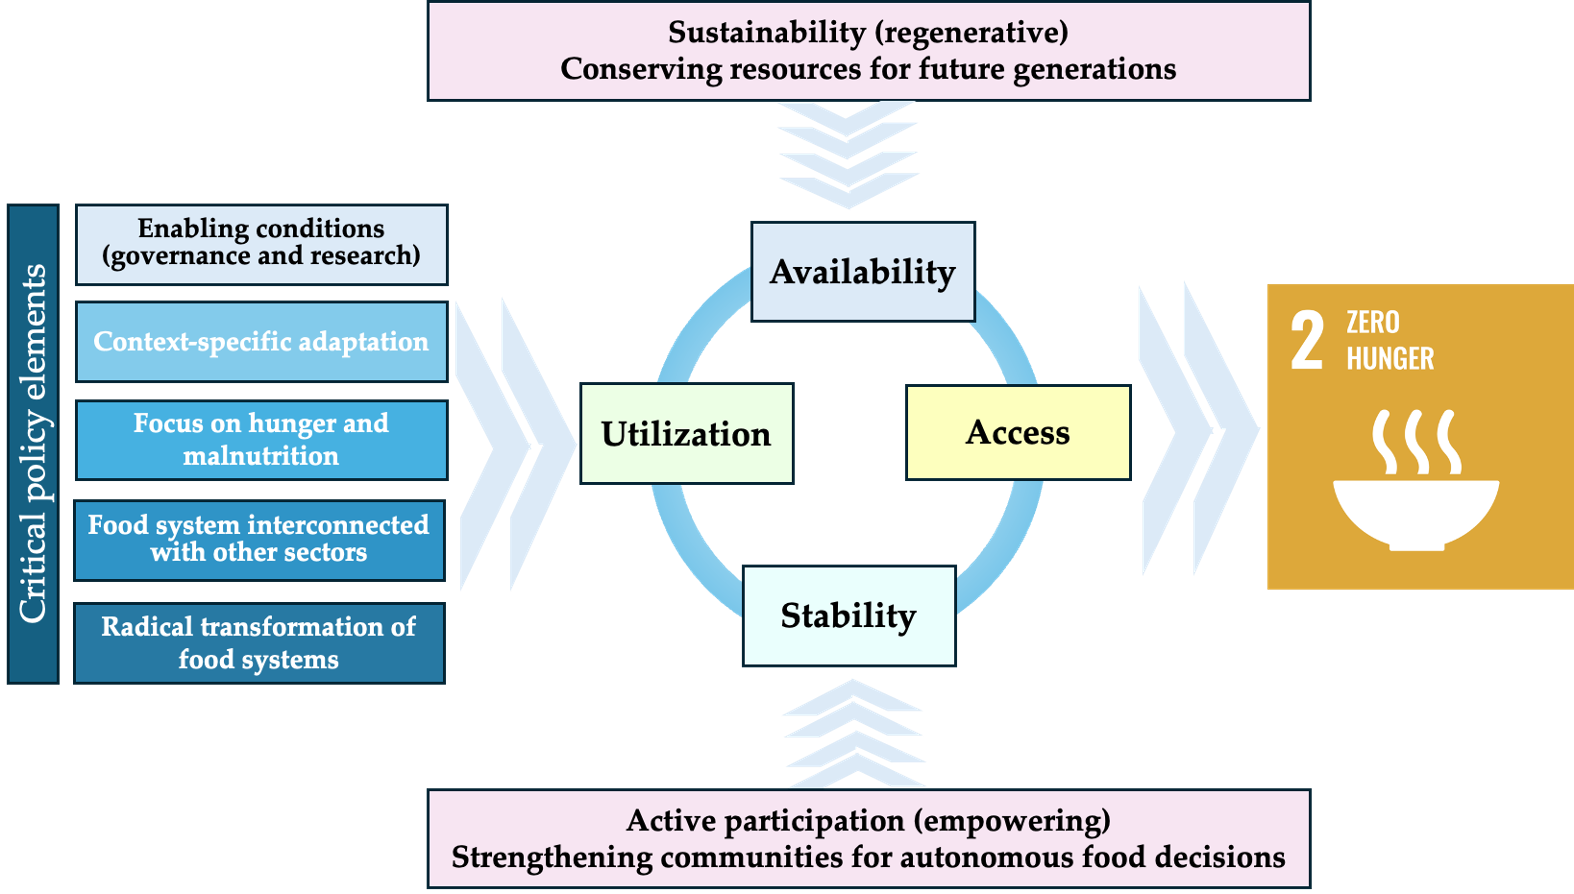
The definition of food security, based on the four fundamental pillars – availability, access, stability and utilization – provides a robust analytical framework for assessing the situation in each country. Availability refers to the presence of sufficient food supplies, ensured through domestic production, imports, and reserves. Access encompasses economic, physical, and social factors that determine individuals' ability to acquire food. Stability ensures continuous and reliable access to food, minimizing risks from climatic, economic, or geopolitical disruptions. Utilization relates to nutritional quality, food safety, and public health aspects that affect how food contributes to well-being. These dimensions, originally conceptualized by FAO, are fundamental for assessing national and regional food security trends and vulnerabilities [6].
The importance of food security is closely linked to the United Nations Sustainable Development Goals (SDGs), in particular SDG 2 – Zero Hunger, which aims to eradicate hunger and ensure universal access to safe, nutritious and sufficient food. In addition, food security intersects with several other SDGs, such as SDG 1 – No Poverty, which highlights the relationship between food insecurity and poverty; SDG 3 – Good Health and Well-being, which promotes adequate nutrition for the health of the population; SDG 12 – Responsible Consumption and Production, which emphasizes sustainable food systems; and SDG 13 – Climate Action, which emphasizes the impact of climate change on agricultural production and food system stability. Given these interdependencies, food security must be addressed through a holistic and interdisciplinary approach, taking into account economic, environmental and social factors to develop sustainable solutions [7].
A distinctive feature of Romania and neighboring countries is their shared historical past as former members of the communist bloc, which profoundly shaped their economic and agricultural structures characterized by severe food insecurity driven by centralized economic policies, food rationing and restricted access to basic commodities. The transition to a market economy has led to the diversification of agriculture and improved access to food, but regional inequalities and structural vulnerabilities persist. More than 35 years after the fall of communism, these historical legacies continue to influence food security in the post-communist era [8,9]. Understanding these long-term effects is crucial for designing sustainable policies that ensure equitable access to food and economic resilience in the region.
The ongoing conflict in Ukraine further exacerbates food security challenges in Eastern Europe. Ukraine, one of the world’s largest grain exporters, has faced major disruptions to supply chains, leading to significant increases in food prices and limited access to resources for import-dependent countries [10,11]. The regional impact of this conflict manifests itself in economic instability, forced population displacement and increased vulnerabilities in food systems. Romania and neighboring countries are directly affected by this dynamic, requiring adaptive measures to manage refugee flows and increase the resilience of the food system.
The studied region presents a diverse agricultural landscape, accompanied by substantial vulnerabilities. Romania, a key agricultural producer in Europe, struggles with regional disparities in resource distribution and lack of to rural markets. Bulgaria and Hungary, although relatively well developed in terms of infrastructure, face challenges in terms of rising food costs and dependence on imports. Ukraine, severely affected by war, faces significant difficulties in maintaining the stability of the food system. Meanwhile, Moldova and Serbia, with less developed economies, face high rates of food insecurity and rural-urban migration [12,13].
Despite the significance of these challenges, there is a noticeable gap in the scientific literature on a unified analysis of food security in this region. Although European or global studies exist, they often fail to capture the unique historical, economic and social characteristics of Eastern Europe. A comprehensive assessment that integrates Romania and neighboring countries in the same analytical framework is lacking, even if these countries share critical structural factors that influence food security. This absence of regional studies is a major limitation in formulating coordinated policies aimed at improving food security both at national and cross-border levels.
In addition, data fragmentation and inconsistent reporting across countries hinder an in-depth assessment of specific challenges. Many food security indicators remain underreported or inconsistently measured, complicating benchmarking of vulnerabilities and strengths across the region [14,15]. This study aims to fill this information gap by providing a comprehensive analysis based on FAO food security indicators, providing insights into both Romania’s food security status and its relative position compared to neighboring countries.
The findings of this study not only provide a new perspective on food security in Eastern Europe, but also highlight the need for future research to explore in more detail the interactions between economic, political and agricultural factors influencing food security in former planned economies.
This research aims to systematically assess food security in six countries, identifying specific challenges for each. Using an analytical framework based on the four pillars of food security, the study explores the impact of climate change, economic disparities and political instability on food resources. It also proposes resilience strategies focused on agricultural diversification, improved infrastructure, improved food safety regulations and climate adaptation policies.
By adopting this integrated approach, the study provides a solid basis for developing sustainable food systems capable of ensuring food security for the population of the region. Given the growing interdependence of economic, climate and geopolitical factors, this research contributes to the global discourse on sustainable food security solutions and highlights the importance of regional collaboration in addressing future challenges.
2. Materials and Methods
2.1. Data Sources
To substantiate the analysis of food security in Romania and neighboring countries, a comprehensive review of relevant scientific literature was carried out, using prestigious international databases, such as Web of Science, Scopus, PubMed and ScienceDirect, alongside grey literature sources (government reports, documents of international organizations and studies published by research institutes). The selection of papers was based on the use of specific keywords, including: "pillars of food security", "food security indicators", "sustainable food security", "agricultural sustainability", these being correlated with the regions of interest, namely Romania, Bulgaria, Hungary, Serbia, Ukraine and the Republic of Moldova. This approach allowed the identification of the most relevant publications on the factors influencing food security in this region, as well as highlighting the disparities and specific challenges in each country.
To complete the analysis of scientific literature and ensure an integrated perspective on the phenomenon, documents published by international bodies were consulted, including reports by the Food and Agricultural Organization of the United Nations (FAO), World Bank, European Commission, and World Food Programme. These sources provided up-to-date statistical indicators and essential information for understanding recent trends in food security and sustainable agriculture.
This documentation stage formed the basis for the selection of FAO indicators used in the analysis and contributed to defining the research methodology, providing a solid theoretical framework for interpreting the results and formulating public policy recommendations.
These indicators, grouped into suites linked to four fundamental pillars, constitute a comprehensive data set covering multiple dimensions of food security. The analysis therefore focuses on the four key pillars established by FAO: Pillar I - Availability, Pillar II - Access, Pillar III - Stability and Pillar IV - Utilization, using the suites of statistical indicators related to each pillar.
The study includes six countries: Romania and all neighboring countries, namely Bulgaria, Hungary, Serbia, Ukraine and Moldova. The calculation methods of all indicators are established by FAO. Data include the most recent reports available for each indicator, with reporting years varying depending on the availability of data collected by FAO [6]. Thus, we analyzed the external data from the second and third parties, respectively from FAO and taken over by FAO from the reporting countries (Table 1).
The difference in reporting years will be taken into account in the interpretation of the results and will be discussed as a limitation of the study in the Section 4. Discussion.
2.2. Methods
Two types of analysis were used to assess Romania’s food security in comparison to neighboring countries. The comparative analysis aims to identify differences between Romania and the regional average, offering a perspective on existing trends and disparities. The statistical analysis, by testing the significance of differences, determines whether these variations are statistically relevant. Combining the two approaches allows not only to describe the differences but also to validate them, contributing to a robust interpretation of the results.
2.2.1. Comparative Analysis
The comparative analysis of food security in Romania compared to Bulgaria, Hungary, Serbia, Ukraine, and Moldova involved calculation and comparison of indicator values for each pillar of food security. The aim of this analysis was to identify the main regional disparities and trends, highlighting both the strengths and vulnerabilities of each country.
The choice to compare Romania with the average of neighboring countries is methodologically based on several considerations:
- Regional relevance. Romania and neighboring countries have a similar historical, geographical and economic background, having in the past agricultural systems and planned economies during the communist period. The comparison with the regional average provides a clearer perspective on how Romania is positioned in this context.
- Reducing extreme variations. Some of these countries may have significantly different values for certain indicators (for example, Ukraine due to armed conflict or Moldova due to the size of the economy). Calculating the regional average allows for a more stable and balanced assessment.
- Generalization and public policies. The regional average provides a useful benchmark for policymakers, highlighting not only Romania's individual performance but also how it aligns with or deviates from overall regional trends.
The comparative analysis of food security in Romania in relation to Bulgaria, Hungary, Serbia, Ukraine, and Moldova involved calculation and comparison of the values of the indicators related to each pillar of food security.
The calculation of the regional average of each indicator was performed using the arithmetic average formula:
where:
– arithmetic average of the indicator;
– sum of the indicator values for each neighboring country;
n – total number of neighboring countries included in the analysis.
This analysis aims to identify the main disparities and trends in the region. The differences between Romania and the regional average of neighboring countries were examined to highlight both the vulnerabilities and strengths specific to each country. This method contributes to a more balanced interpretation of the data and facilitates the identification of common directions for improving food security at the regional level.
Not all countries analyzed reported all the indicators established by FAO, which generated certain limitations of the available information. Additionally, in some situations, reports were expressed as values such as "<2.5" without providing exact numerical values. Therefore, where incomplete data were recorded or "<2.5" type, were not included in the comparative analysis, to ensure the coherence of the presented conclusions.
2.2.2. Statistical Analysis by Testing the Significance of Differences
To test the statistical significance of the differences between Romania's food security indicators and the corresponding values for neighboring countries, two statistical methods were applied:
- One-sample t-test, used for indicators with normal distribution;
- The non-parametric Wilcoxon signed-rank test, used for indicators with non-normal distribution.
The null hypothesis assumed that the average/median value of an indicator in Romania does not differ significantly from the regional average. The significance threshold used was α = 0.05.
Boxplots were used to illustrate the distribution and variation of food security indicators in the analyzed countries. They indicate:
- minimum and maximum values;
- median (represented by a vertical line inside the box);
and
- average value (marked with the symbol ◊).
These visualizations make it easy to interpret the data distribution and identify any outliers or specific patterns.
Statistical analysis and visualizations were performed using SAS OnDemand for Academics, a cloud-based statistical software widely used in research and data analysis.
In the statistical analysis for the Pillar II – Access indicator suite, only four indicators were included, out of an initial set of eight indicators, due to data reporting limitations and methodological considerations.
The indicator Prevalence of undernourishment was not analyzed because, except for Ukraine, which reported a value of 5.8%, the other countries only recorded values below an unspecified threshold, reported as "<2.5%", making it impossible to apply statistical comparison tests. Similarly, the indicator Number of undernourished people was not included in the analysis because data are only available for Ukraine, while the other countries did not report this indicator.
In addition, the indicators Number of people with severe food insecurity and Number of people with moderate or severe food insecurity were not analyzed, because they reflect the same phenomena as Prevalence of severe food insecurity in the total population and Prevalence of moderate or severe food insecurity in the total population but expressed in absolute values. The use of these indicators would have introduced a distortion in the interpretation of the results since the total number of affected people depends both on the prevalence of the phenomenon and on the size of the population of each country. As the purpose of the analysis is to compare the level of food insecurity between countries, Prevalence provides a more relevant and fair measure, removing the influence of population variations. Therefore, it was decided to exclude the absolute number of people affected to maintain methodological coherence and comparability between countries.
Through this approach, the study provides a detailed analysis of food security in Romania and neighboring countries, using the most recent indicators reported by FAO. The rigorous selection of variables and the application of statistical methods allow the identification of significant differences between Romania and the average of neighboring countries, highlighting both the strengths and vulnerabilities specific of each pillar of food security. This methodology contributes to a better understanding of the factors influencing access, availability, stability, and use of food resources in the region and provides a solid basis for the formulation of policies and strategies aimed at reducing disparities and improving the sustainability of the food system.
3. Results
3.1. Results of Comparing the Value of the Pillars Indicators in Romania with the Average of Neighboring States
This section presents the descriptive differences between the indicators in Romania and the regional average without analyzing the statistical significance of these differences.
3.1.1. Availability – Comparative Analysis of the Values of Indicators Related to Food Availability
Food availability is a fundamental aspect of food security, reflecting a country’s ability to provide sufficient food for its entire population. This pillar depends on factors such as domestic agricultural production, food trade balance, storage and distribution infrastructure, and agricultural market stability. The analysis of food availability in Romania and neighboring countries is based on four key indicators: the adequacy of food energy supply, which measures whether the available resources satisfy the energy needs of the population; the share of dietary energy from cereals, roots and tubers, which reflects the structural dependence on these food categories; average protein supply, which provides a picture of access to essential protein sources; and the average supply of animal protein, an indicator of the dietary diversity and nutritional quality (Table 2).
For Average dietary energy supply adequacy, Romania registers a value around 14.8% higher than the average of neighboring states. This difference highlights an increased availability of food energy in Romania, reflecting both a high domestic production capacity and the possibility of significant imports to cover the population's demand. Although this high level is beneficial for preventing severe food insecurity, it may also indicate potential nutritional imbalances in cases of excessively energy-dense diets. Compared to neighboring countries, Ukraine has the lowest value for Average dietary energy supply adequacy, which can be attributed to the impact of the armed conflict on agricultural production and distribution chains.
For Share of dietary energy supply derived from cereals, roots and tubers, Romania is 2.1% below the average of neighboring countries. This suggests a more diversified diet than in other countries in the region, where cereals and tubers constitute the main source of dietary energy. However, the high percentage for this indicator shows a significant dependence on these products, which may expose Romania to risks associated with the volatility of international cereal prices or climate change affecting agricultural production.
For Average protein supply, Romania exceeds the regional average by 13%, indicating a higher availability of protein resources. This result reflects robust domestic agricultural production combined with strategic imports. However, it is important to note that differences in the levels of available protein may have implications for the quality of nutrition of the population in the region.
For Average protein supply of animal origin, Romania registers a value 19.4% above the average of neighboring countries. This indicator suggests a high share of animal products in the population's diet, which may provide nutritional benefits through supply of essential amino acids but may also raise concerns about the sustainability of food production and the environmental impact. Ukraine and Moldova, which have lowest values for this indicator, face economic and social challenges that limit access to these products (Figure 1).
These results highlight the fact that Romania benefits from a higher food availability than the average of neighboring countries, but it is important to address the vulnerabilities related to the relatively high dependence on cereals and the environmental impact of high consumption of animal products. Moldova and Ukraine and even Bulgaria remain the most vulnerable countries in the region in terms of food availability, registering the low values of Average protein supply and Average protein supply of animal origin, and this context underlines the need for regionally coordinated policies to reduce disparities and improve food security.
3.1.2. Access – Comparative Analysis of Values of Indicators Related to Food Accessibility
Food accessibility is a key factor in food security, influenced by economic, social and infrastructural aspects. Even if a country has enough food, its equitable distribution and the effective ability of the population to purchase food are crucial to ensuring food security. This section analyzes indicators related to accessibility in Romania and neighboring countries, including factors such as the density of railway lines, which can influence the availability and costs of food products by facilitating their transport and distribution, gross domestic product per capita, an indicator of economic power and the ability of households to purchase food, and the prevalence of undernourishment and food insecurity, which directly reflect the challenges for population's access to adequate nutrition.
In the analysis of indicators related to food accessibility, we did not include two indicators reported under Pillar II – Access, Prevalence of undernourishment and Number of people undernourished, due to limitations of available data. Reported values for Prevalence of undernourishment are lower than 2.5% (<2.5) for most countries, which does not allow a detailed comparative assessment between Romania and neighboring countries. Also, for the Number of people undernourished, data are available only for Ukraine, which doesn’t allow to include this indicator in a comprehensive regional analysis.
These limitations in data reporting can be explained by the fact that the prevalence of undernutrition in the region is relatively low, and reporting of more detailed values is not considered necessary by international monitoring bodies. However, these shortcomings highlight the importance of more detailed and consistent data reporting to facilitate more robust cross-country analyses and comparisons. Also, the inclusion of additional indicators that better reflect food accessibility for vulnerable groups could improve understanding of regional challenges (Table 3).
For Railway density, Romania registers a value 15.38% higher than the average of neighboring countries, reflecting a relatively more developed railway infrastructure that can facilitate food transport and faster access to agri-food markets. This situation gives Romania a competitive advantage in ensuring the population's access to food, especially in rural areas. However, higher density does not necessarily mean efficiency, and the impact of infrastructure quality must be considered.
For GDP per capita, Romania exceeds the regional average by 56.83%, which suggests a higher economic potential for ensuring access to food, by increasing the purchasing power of the population. However, this significant economic difference does not appear to be reflected in reduced food insecurity, indicating possible inequalities in income distribution or access to food.
For Prevalence of severe food insecurity in the total population, Romania has a value 80.20% higher than the average of neighboring countries. This result raises serious concerns about food accessibility for vulnerable categories of population and reflects the existence of systemic challenges such as poverty, unemployment or social exclusion.
For Prelevance of moderate or severe food insecurity in the total population, Romania has a value 3.05% lower than the regional average. This result can be interpreted as a relatively better performance in ensuring minimal access to food for the majority of the population, but does not eliminate the serious problems identified in the case of severe food insecurity.
For Number of people experiencing severe food insecurity, Romania has a value 118.75% higher than the average of neighboring countries, highlighting a major disparity in the capacity to provide food for the most vulnerable categories of people, even if the economic resources available at the national level are greater than in other countries in the region.
For Number of severely food insecure people, Romania exceeds the average of its neighbors by 12.43%, highlighting that the challenges of consistent and equitable access to food remain a significant problem. This situation requires targeted measures to reduce disparities and improve social inclusion (Figure 2).
Prevalence of severe food insecurity in the population and Prelavelnce of moderate or severe food insecurity in the population are analyzed both as a percentage of the population and as an absolute number of people affected to provide a comprehensive understanding of the problem. The percentage highlights the share of the affected population in the total population, allowing direct comparison between countries with different demographic sizes. On the other hand, the absolute number reflects the effective magnitude of the problem, providing essential information for allocating the resources needed for interventions. In the case of Romania, this approach shows that, although the situation may be better in percentage compared to other countries in the region, the absolute number of affected people is significantly higher. This dual perspective contributes to a clearer identification of vulnerable groups and to the prioritization of interventions to effectively reduce food insecurity.
3.1.3. Stability – Comparative Analysis of the Values of Indicators Related to Stability of Food Security
Food security stability is an essential element in ensuring constant access to sufficient and nutritious food resources. This pillar reflects the capacity of a food system to cope with external shocks, such as climate change, political instability or economic fluctuations, which may affect food availability. In this analysis, stability is assessed through relevant indicators, such as the percentage of arable land equipped for irrigation, the value of food imports relative to total exports, political stability, variability of food supply per capita and the degree of dependence on cereal imports (Table 4).
For Cereal import dependency ratio, Romania has a value 33.41% lower than the regional average. This suggests a higher degree of self-sufficiency in cereal production, which can be a strategic advantage in times of economic or geopolitical uncertainty.
For Percent of arable land equipped for irrigation, Romania exceeds the average of neighboring countries by 379.17%. This high percentage indicates a significant capacity to manage water resources for agriculture, which contributes to the stability of agricultural production, especially in variable climatic conditions.
For Value of food imports in total merchandise exports, Romania has a percentage 3.45% higher than the regional average. This suggests a relatively higher dependence on food imports, which may represent a vulnerability in the context of fluctuations in international markets.
Political stability and absence of violence/terrorism shows that Romania is 225% more stable than the average of neighboring states. This relative stability provides a favorable context for the development of the food sector and the maintenance of food security in the long-term.
For Per capita food supply variability, Romania registers a value 5.71% lower than the regional average. This denotes greater consistency in the supply of food resources, which contributes to the overall stability of the food system (Figure 3).
The results of the food security stability analysis indicate that Romania has a favorable position in terms of the percentage of arable land equipped for irrigation, but this advantage also highlights the need for a more efficient use of this infrastructure to increase agricultural production. At the same time, the low dependence on cereal imports and the relatively stable variability of food supply place Romania in a competitive position compared to its neighbors. However, persistent political instability in the region, particularly in Ukraine, represents a major threat to regional food security. This context highlights the importance of coordinated measures to support both Romania’s ability to maintain its food stability and the resilience of the entire region to external shocks.
3.1.4. Utilization – Comparative Analysis of Values of Indicators Related to Food Utilization
Utilization focuses on how food is consumed and used efficiently by the body, as well as its quality and safety. This pillar integrates indicators related to access to water and sanitation services, the nutritional status of the population, as well as public health issues related to obesity, anemia, or low birthweight. This analysis explores how Romania positions itself compared to the average of neighboring countries in terms of these indicators, identifying strengths, but also existing vulnerabilities, in order to highlight priorities for effective public policies and coordinated regional interventions.
For Percentage of population using safely managed drinking water services, Romania has a value 5.31% lower than the average of neighboring countries, highlighting the need for additional investments in safe drinking water infrastructure to ensure higher standards in this area. In contrast, for Percentage of population using at least basic drinking water services, Romania exceeds the average of its neighbors by 3.13%, which shows that access to basic services is relatively well developed, but there are significant gaps in safe water management.
For Percentage of population using safely managed sanitation services, Romania has a significantly higher value, 69.88% above the regional average, suggesting a higher level of access to safe sanitation services. However, for Percentage of population using at least basic sanitation services, Romania registers a deficit of 5.38% compared to the average of its neighbors, which indicates an unequal distribution of access to such services between urban and rural areas.

Table 5.
Values of Pillar IV - Utilization indicators [6].
Table 5.
Values of Pillar IV - Utilization indicators [6].
| Indicators of Pillar IV - Utilization | Percentage of population using safely managed drinking water services (%) | Percentage of population using at least basic drinking water services (%) | Percentage of population using safely managed sanitation services (%) | Percentage of population using at least basic sanitation services (%) | Percentage of children under 5 years affected by wasting (%) | Percentage of children under 5 years of age who are stunted (modeled estimates) (%) | Percentage of children under 5 years of age who are overweight (modeled estimates) (%) | Prevalence of obesity in the adult population (18 years and older) (%) | Prevalence of anemia among women of reproductive age (15-49 years) (%) | Prevalence of exclusive breastfeeding among infants 0-5 months of age (%) | Prevalence of low birth weight (%) |
|---|---|---|---|---|---|---|---|---|---|---|---|
| Bulgaria | 96 | 99 | 74.0 | 86.0 | - | 5.6 | 3.8 | 20.6 | 23.6 | - | 11.4 |
| Hungary | 99 | 99 | 88.0 | 98.0 | - | 31.7 | 19.7 | - | 8.3 | ||
| Moldavia | 75 | 92 | - | 85.0 | - | 3.9 | 2.9 | 23 | 26.1 | - | 6.5 |
| Romania | 82 | 99 | 88.0 | 88.0 | - | 7.7 | 4.5 | 34 | 22.7 | - | 8.8 |
| Serbia | 75 | 96 | 25.0 | 98.0 | 2.6 | 4.6 | 9.9 | 22.5 | 22.8 | 23.6 | 6.2 |
| Ukraine | 88 | 94 | 72.0 | 98.0 | - | 12.3 | 13.6 | 23.6 | 17.7 | - | 5.7 |
- unreported.
For Percentage of children under 5 years of age who are stunted, Romania exceeds the regional average by 45.83%, which highlights a significant problem related to children's nutrition and health. This aspect underlines the need for interventions to improve children’s nutritional status and reduce socio-economic inequalities. In contrast, for Percentage of children under 5 years of age who are overweight, Romania registers a value 25.50% lower than the average of its neighbors, which suggests a lower risk of childhood obesity, but raises questions about the overall nutritional balance.
Prevalence of obesity in the adult population (18 years and older) is for Romania 40.03% higher than the average of its neighbors, reflecting an alarming phenomenon of obesity among adults in Romania. This trend highlights the need to promote a healthy lifestyle and policies that support food education and physical activity. Also, for Prevalence of anemia among women of reproductive age (15-49 years), Romania exceeds the regional average by 3.28%, indicating a public health problem that requires increased attention through nutritional supplements and interventions in maternal health.
For Prevalence of low birthweight, Romania has a value 15.49% higher than the average of its neighbors, which highlights the need for proactive measures to monitor the health status of mathers and newborn, as well as improving access to quality prenatal care (Figure 4).
The results of the analysis indicate a mixed situation for Romania regarding Pillar IV – Utilization. While access to safe water and sanitation services is above the regional average, significant inequalities persist between urban and rural areas. Nutritional issues such as child undernutrition and the prevalence of obesity in adults highlight the need for strategic interventions, both nationally and regionally. These findings highlight the importance of an integrated approach that includes nutrition education, access to health services and the reduction of socio-economic inequalities.
The indicators Percentage of children under 5 years affected by wasting and Prevalence of exclusive breastfeeding among infants 0-5 months of age were not included in this analysis as reported data are only available for Serbia. The lack of uniform reporting for these indicators limits the possibility of a comparative assessment at the regional level. However, their inclusion in future analyses could provide important insights into the nutritional status of children in the region.
3.2. Testing the Statistical Significance of the Differences Between Romania and The average of Neighboring Countries
This section presents the statistical analysis of the differences between Romania and the regional average for each pillar of food security.
In the statistical analysis regarding the testing of the significance of the differences between Romania and the regional average, indicators presenting the same parameter in different expressions (for example, both in percentage form and in absolute numerical form) were not included. Their exclusion was determined by the fact that the results obtained would have been duplicated redundantly, providing similar information without adding additional value to the interpretation.
This methodological decision helps maintain the coherence and relevance of the analysis, avoiding unnecessary complications in data interpretation. Thus, the study focuses on indicators that provide an essential insight into the differences between Romania and the regional average, without repeating already implicit conclusions. This approach allows maximizing the impact of the analysis and the clarity of the presented results.
3.2.1. Availability – Statistical analysis – Determining the Significance of the Differences Observed in Food Availability Between Romania and the Average of Neighboring Countries
For Average dietary energy supply adequacy, there are significant differences (p=0.025) between the value of 146 in Romania and the average of 127.2 in neighboring countries. This result indicates that Romania benefits from a higher energy availability than the average of neighboring countries, which may reflect both a higher level of domestic production and a greater capacity to import and distribute food resources efficiently.
In the case of Share of dietary energy supply derived from cereals, roots and tubers, there are no significant differences (p=0.839) between the value of 37 in Romania and the average of 37.8 in neighboring countries. This suggests that the structure of the Romanian diet is aligned with that of the region in terms of caloric intake from basic sources such as cereals and root vegetables.
For Average protein supply), there is no significant difference (p=0.125) between the value of 109.3 in Romania and the average of 90.6 in neighboring countries. This lack of significant difference suggests that Romania and its neighboring countries have comparable levels of protein supply per capita, indicating a relatively balanced availability of protein resources in the region.
For Average supply of protein of animal origin, there are significant differences (p=0.026) between the value of 60.1 in Romania and the average of 50.34 in neighboring countries, which indicates Romania’s greater dependence on animal protein sources, an aspect that will be discussed in detail in the next section, considering implications for sustainability, environmental impact, and economic accessibility of these products (Figure 5).
These results highlight the fact that, although Romania enjoys higher food availability than the average of neighboring countries in terms of total dietary energy and animal protein, the dietary structure remains comparable to that of the region in terms of cereal and total protein consumption.
3.2.2. Access – Statistical Significance Testing – Applying Statistical Tests to Verify Whether Differences in Food Accessibility Are Statistically Relevant
For Rail line density, there are no significant differences (p=0.875) between the value of 4.5 for Romania and the average value of 3.8 in neighboring countries. Therefore, even if in Romania, the value of this indicator is slightly higher than the average of the data series formed by the same indicator for neighboring countries, the differences are not statistically significant. This result suggests that Romania's railway infrastructure is comparable to that of neighboring countries, without indicating a significant advantage or disadvantage in terms of accessibility of rail transport for food distribution.
For Gross domestic product per capita, there are significant differences (p=0.044) between the value of 39873 in Romania and the average of 25423 in neighboring countries. This difference confirms a relatively more favorable economic position of Romania compared to its neighbors, which can contribute to a higher access to food for the population. Given that GDP per capita is an essential indicator for the economic accessibility of food products, this result may have important implications on the ability of households in Romania to ensure their food needs compared to those in neighboring countries.
For Prevalence of severe food insecurity in the total population (%), the value of 7.1 in Romania differs significantly (p=0.005) from the 3.94 average value of this indicator in Romania's neighboring countries. This difference highlights an increased vulnerability to severe food insecurity, suggesting that a larger percentage of Romanian’s population faces acute difficulties in accessing food. This result requires special attention in the analyses of the socio-economic factors that contribute to this phenomenon and in the formulation of policies aimed at improving food accessibility.
For Prevalence of moderate or severe food insecurity in the total population, there are no significant differences (p=0.87) between the value of 19.1 in Romania and the average of 19.7 in neighboring countries. This result indicates that the level of moderate or severe food insecurity is comparable to that of neighboring countries, suggesting that the economic and social factors influencing this phenomenon are similar in the region (Figure 6).
These results show that, although Romania has a GDP per capita significantly higher than the average of neighboring countries, severe food insecurity is significantly more pronounced, which may indicate internal economic inequalities or other barriers affecting the distribution and accessibility of food in certain segments of the population.
3.2.3. Stability – Statistical Analysis – Assessing the Stability of Food Security Through Statistical Tests Applied to the Differences Between Romania and the Regional Average
In case of Cereal import dependency ratio, there are no significant differences (p=0.624) between the value of -81.8 corresponding to Romania and the average value of -122.8 in neighboring countries. This result suggests that Romania's dependence on cereal imports is comparable to that of neighboring countries, without indicating a statistically significant advantage or disadvantage. Although the value in Romania is higher, the statistical test does not confirm a clear difference in relation to the region.
For Percent of arable land equipped for irrigation, there are significant differences (p=0.004) between the value of 13.8 in Romania and the average value of 2.88 for neighboring countries. This result shows that Romania has a significantly larger irrigated area than its neighbors, which can provide a competitive advantage in the stability of agricultural production, especially in the context of climate change. This significant difference highlights the fact that Romania has invested more in irrigation infrastructure, although, compared to other European Union member states, the percentage of arable land equipped for irrigation remains low [16,17].
For Value of food imports in total merchandise exports (%), there are no significant differences (p=0.908) between the value of 12 in Romania and the average value of 11.6 in neighboring countries. This result suggests that Romania and its neighbors have a similar level of dependence on food imports, without statistically significant variations. The stability of this indicator could reflect similar economic models regarding the agri-food trade balance in the region.
Nor are there significant differences (p=0.120) for Political stability and absence of violence/terrorism (index) between the value of 0.5 in Romania and the average value of -0.4 for neighboring countries. This result suggests that Romania's political stability does not differ significantly from that of neighboring countries, although it should be emphasized that this indicator is influenced by external factors such as regional geopolitics and ongoing conflicts. For example, Ukraine is experiencing severe instability due to the armed conflict, which influences the regional average.
Also, for Per capita food supply variability (kcal/cap/day), there are no significant differences (p=0.728) between the value of 33 for Romania and the average value of 35 for neighboring countries. This result indicates that the variability of food supply per capita in Romania is like that of the region, suggesting that both Romania and neighboring countries face similar challenges in terms of the stability of food supply chains (Figure 7).
The results of the statistical significance tests for this pillar show that, although Romania has a significantly larger irrigated area, the other indicators of food stability do not differ significantly from the average of neighboring countries. This finding suggests that despite targeted investments in agricultural infrastructure, Romania and its neighbors face common challenges in ensuring food security stability.
3.2.4. Utilization – Statistical Analysis – Determining the Statistical Relevance of Differences Between Romania and the Regional Average
For Percentage of population using safely managed drinking water services, there are no significant differences (p=0.415) between the value of 0.82 in Romania and the average value of 86.6 for neighboring countries. This result suggests that access to safely managed drinking water in Romania is comparable to that of its neighbors, without indicating a significant advantage or disadvantage.
Also, for Percentage of population using at least basic drinking water services, there are no significant differences (p=0.095) between the value of 99 in Romania and the average value of 96 for neighboring countries. Although Romania has a slightly higher percentage of the population that has access to basic drinking water services, this advantage is not substantial enough to be considered statistically significant.
Nor are there significant differences (p=0.078) for Percentage of population using safely managed sanitation services between the value of 88 in Romania and the average value of 56.8 for neighboring countries. However, Romania has a much higher share of the population benefiting from safely managed sanitation services, suggesting a higher level of health infrastructure compared to most countries in the region.
Similarly, for Percentage of population using at least basic sanitation services, there are no significant differences (p=0.250) between the value of 88 in Romania and the average value of 93 for neighboring countries, indicating that Romania approaches the regional average in terms of access to basic health services, without registering statistically significant variations.
Compared to Percentage of children under 5 years of age who are stunted (modelled estimates), there are no significant differences (p=0.608) between the value of 7.7 in Romania and the average value of 6.6 for neighboring countries, suggesting that the prevalence of stunting in children under five is relatively similar in Romania and the rest of the region, reflecting comparable nutritional and health conditions. However, compared with Prevalence of obesity in the adult population (18 years and older), there are significant differences (p=0.007) between the value of 34 in Romania and the average value of 24.28 for neighboring countries, indicating a significantly higher prevalence of obesity in adults in Romania, which raises concerns about the impact of eating habits and lifestyle on public health.
Furthermore, for Prevalence of anemia among women of reproductive age (15-49 years), there are no significant differences (p=0.652) between the value of 22.7 in Romania and the average value of 21.98 for neighboring countries. This suggests that the prevalence of anemia in women of reproductive age is similar in Romania and the rest of the region, without significant statistical variations.
And for Prevalence of low birthweight (percent) indicator, there are no significant differences (p=0.32) between the value of 8.8 in Romania and the average value of 7.62 for neighboring countries, indicating that Romania is at a comparable level to its neighbors in terms of the incidence of low birthweight, which may reflect similar socioeconomic and maternal health factors across the region (Figure 8).
The results of the statistical significance tests for this pillar suggest that, although Romania has a significantly higher prevalence of obesity in adults, the other indicators do not differ significantly from the average of neighboring states. These conclusions will be analyzed in Section 4. Discussions, where their implications for public health and food security at the regional level will be discussed.
4. Discussion
Food security is a fundamental element of economic and social stability, with direct implications for population health and sustainable development. The objective of this study was to evaluate food security in Romania compared to the average of neighboring countries – Bulgaria, Hungary, Serbia, Ukraine, and Moldova – using the four pillars defined by FAO: availability, access, stability, and utilization. Through this approach, the analysis provides a broad perspective on Romania’s strengths and vulnerabilities in relation to neighboring countries, identifying significant disparities and issues that require strategic intervention.
This assessment, essential in context of current challenges generated by climate change, economic inequalities, and geopolitical instability, directly influences food security at global and regional levels. Comparing Romania with the average of neighboring countries not only highlights the specific characteristics of each country but also identifies common trends and possible directions for coordinated intervention.
By integrating rigorous statistical methods, the research contributes to a deeper understanding of the determinants of food security, providing a solid basis for formulating sustainable food policies aimed at ensuring equitable access to food and efficient use of available resources, given that the reduction of regional disparities is a strategic objective both at national and European level.
4.1. Comparative Analysis – Main Findings
Pillar I - Availability
The results of the comparative analysis indicate that Romania benefits from a high level of food supply compared to the average of neighboring countries. This situation reflects a solid agricultural capacity and diversified production, contributing to ensure a stable food supply. However, such increased availability has significant implications for both sustainability and population health.
One of the relevant aspects is diet diversity. Romania records a higher value for indicators Average dietary energy supply adequacy and Average protein supply, indicating a higher consumption of food and protein compared to the average of neighboring countries. In particular, the high level for indicator Average supply of protein of animal origin suggests a significant intake of animal products in the diet. This can be nutritionally beneficial, but it also raises concerns about the ecological impact of food production. Livestock farming involves intense consumption of natural resources, high emissions of greenhouse gases and soil degradation. Thus, although Romania has an advantage in terms of food availability, careful management of the sustainability of the food system is necessary [18,19].
Another important aspect is addiction to certain food categories. Although Romania has a superior food energy supply, a significant part of it, included in indicator Share of dietary energy supply derived from cereals, roots, and tubers, makes it vulnerable to production fluctuations caused by climate change, drought or other extreme phenomena. This dependence indicates a pressing need to diversify supply sources and adopt more resilient agricultural practices that reduce the risks associated with climatic and economic variations.
In conclusion, the increased availability of food in Romania represents a clear advantage compared to the average of neighboring states, but this situation also imposes a series of challenges related to sustainability, resource management and maintaining the nutritional balance of the population. Agricultural and food policies must address these issues to ensure not only sufficient food production, but also a sustainable and resilient food system.
Pillar II: Access
The comparative analysis of food accessibility in Romania and the average of neighboring countries reveal a strong contrast between economic performance and the level of food insecurity. Romania is significantly above the average of neighboring countries in terms of Gross domestic product per capita, PPP, which could suggest a greater economic capacity of the population to access food. The data show, however, that this economic advantage does not translate into a proportional reduction in food insecurity, Romania registering a significantly higher Prevalence of severe food insecurity in the total population than the average of neighboring countries. This discrepancy indicates that GDP per capita is not always a sufficient indicator to assess real access to food.
A possible explanation for this situation is the unequal distribution of income and social disparities in Romania. Although average per capita income is higher, there are significant segments of the population that face high food costs, low wages, and limited access to the resources needed for adequate nutrition. In this context, vulnerable groups – such as people in rural areas, low-wage workers, and certain disadvantaged categories – are more exposed to risk of food insecurity.
Another relevant aspect is the difference between severe and moderate or severe food insecurity. While the indicator Prevalence of moderate or severe food insecurity in the total population does not show significant differences between Romania and the average of neighboring countries, the level of Prevalence of severe food insecurity in the total population is alarmingly high. This suggests that although a large segment of the population has relatively stable access to food, there is a sizable group that suffers from extreme food insecurity, with major impacts on their health and well-being.
Also a determining factor in food accessibility is infrastructure and connectivity. Romania records a slightly higher value for indicator Rail lines density, but the difference with the average of neighboring countries is not significant. This suggests that although there is a transport network that facilitates food distribution, it is not sufficiently well developed to reduce regional inequalities in access to agri-food markets and fresh food.
Romania is therefore faced with a paradoxical situation: a higher GDP per capita is not reflected in improved access to food for the entire population [12,20]. Economic inequalities, high food costs and infrastructural limitations contribute to maintaining high levels of severe food insecurity [19]. These results highlight the need for policies that aimed not only at economic growth, but also at reducing social and regional disparities, ensuring equitable access to food for all categories of the population.
Pillar III - Stability
Romania presents a relatively high level of food security stability compared to the average of neighboring countries, but this stability is influenced by agricultural, economic and geopolitical factors that can amplify or diminish long-term risks.
One of the most notable advantages of Romania is arable land equipped for irrigation, quantified by indicator Percent of arable land equipped for irrigation. Romania significantly exceeds the average of neighboring countries, which indicates a better-developed agricultural capacity and a greater potential for resilience to climate variability. This characteristic is essential for maintaining stable agricultural production, especially in the context of climate change, which is having an increasing impact on agriculture in Eastern Europe [17,22].
Despite this agricultural advantage, Romania faces economic vulnerabilities related to dependence on food imports [23]. Although the differences for indicator Value of food imports in total merchandise exports are not statistically significant, the fact that this indicator is slightly higher than the average of neighboring countries suggests a moderate dependence on imports for certain product categories. This can become a problem in situations of economic or geopolitical crisis, when price fluctuations and supply chain disruptions could affect the availability of essential food products [24].
Another critical aspect is political stability, measured by Political stability and absence of violence/terrorism. Romania has higher score than the average of its neighboring countries, but this difference is not statistically significant. Although Romania benefits from a more stable political environment compared to countries such as Ukraine or Moldova, risks related to economic instability, social tensions and regional geopolitical influences can affect food security in the long term [25,26].
Regarding the variability of food supply, Per capita food supply variability shows that Romania has a relatively similar fluctuation to the average of neighboring countries. This indicates that, although there is a relatively stable agricultural production, Romania is not completely insulated from the volatility of international agri-food markets and possible economic crises.
Conversely, dependence on cereal imports, measured by Cereal import dependency ratio, is significantly lower in Romania than the average of neighboring countries. This aspect indicates an important advantage in ensuring long-term food security, reducing vulnerability to fluctuations in international cereal prices and possible trade restrictions imposed in crisis situations.
Pillar IV - Utilization
The comparative analysis indicated significant differences in the use of food resources and their impact on public health in Romania, compared to the average of neighboring countries. One of the most alarming aspects identified is Prevalence of obesity in the adult population (18 years and older), where Romania registers a significantly higher value than the average of its neighbors. This trend can be explained by dietary changes in last decades, characterized by an increased consumption of processed foods and products with high caloric density, corroborated with an increasingly sedentary lifestyle [4,9]. This situation draws attention to the need for more effective prevention strategies and nutritional policies, which promote a balanced diet and an active lifestyle.
For Percentage of population using safely managed drinking water services, Romania has a lower value than the average of neighboring countries, which may raise concerns about the safety of drinking water and its impact on public health. Access to quality water is essential not only for hydration but also for food hygiene, preventing the transmission of waterborne diseases and reducing the risks associated with malnutrition. However, Romania is above the average of neighboring countries for Percentage of population using at least basic drinking water services, which indicates relatively good access to minimally safe water sources, but with the need to improve their quality management.
At the same time, Percentage of children under 5 years of age who are stunted is higher in Romania than the average of neighboring countries, suggesting possible nutritional deficiencies in the first years of life, which can have negative effects on cognitive and physical development in the long term. This may indicate socio-economic disparities or problems of access to a balanced diet in certain vulnerable categories of the population. In contrast, Percentage of children under 5 years of age who are overweight is lower in Romania than the average of neighboring countries, which could signal a different distribution of nutritional risks between the analyzed countries.
For Prevalence of anemia among women of reproductive age (15-49 years), Romania records values like the average of neighboring countries, which suggests that this aspect remains a regional challenge and requires common intervention strategies to reduce iron deficiencies and improve health of mother and child.
Thus, Romania presents a series of challenges and advantages in the field of food use and safety, and public policies must aim both at combating obesity and malnutrition, as well as improving water quality and access to health services to ensure sustainable and nutritionally balanced food security.
4.2. Results of Statistical Significance Testing
Testing the significance of the differences between Romania and the average of neighboring countries provided a clear perspective on the main aspects that differentiate food security in Romania from the region. Within each analyzed pillar, certain indicators showed significant differences, emphasizing both Romania’s specific advantages and vulnerabilities in relation to its neighbors.
One of the most relevant results was observed for Average dietary energy supply adequacy, where Romania recorded a value significantly higher compared to the average of neighboring countries (p=0.025). This fact confirms a high availability of food in Romania, which suggests that the country has a higher food production and supply capacity towards its neighbors. However, this oversupply must also be analyzed from the perspective of its impact on the sustainability and efficiency of the food system because excessive or inefficient consumption of resources can generate risks of food loss and waste.
For Gross domestic product per capita, statistical tests indicated a significant difference (p=0.044), confirming that Romania has a higher GDP per capita compared to the average of neighboring countries. However, this economic advantage is not reflected in improved access to food for all social categories, given that the indicator is significantly higher in Romania (p=0.005) than in the neighboring countries. This discrepancy suggests that social and economic inequalities play an important role in food accessibility, emphasizing the need for policies to support vulnerable groups and measures to reduce social exclusion in food supply.
Another important result of the analysis was observed in the percentage of arable land equipped for irrigation, where Romania presented a significant positive difference (p=0.004) compared to the average of neighboring countries.
This indicates an important agricultural advantage, with Romania having a greater capacity to irrigate arable land, contributing to a more productive agriculture and less vulnerable to extreme weather conditions. However, this advantage must be maintained and consolidated through continued investments in irrigation infrastructure and modern agricultural technologies to increase the resilience of the agricultural system to climate change.
For Prevalence of obesity in the adult population (18 years and older), Romania has a significantly higher value (p=0.007) compared to the average of neighboring countries. This result indicates an increased risk of metabolic disorders and diseases associated with an unhealthy lifestyle, emphasizing the importance of nutrition education programs and promotion of a healthy lifestyle. Without effective interventions, this trend could lead to an increase in the costs of the public health system and a decrease in the quality of life of the adult population.
The results of the statistical significance test indicate deep-rooted structural factors influencing Romania’s food security. On the one hand, there are clear advantages such as high food availability and superior agricultural infrastructure, but on the other hand, economic inequalities and unequal access to resources continue to affect a significant part of the population. Thus, future policies must focus on balancing these differences through measures to support vulnerable groups, improve access to healthy food and increase the sustainability of the agri-food system.
4.3. Study Limitations and Shortcomings
A limitation of this study is related to the availability and consistency of data. Certain indicators were not included in the analysis due to the lack of systematic reporting in all countries analyzed. For example, the indicator Prevalence of undernourishment (%) was only reported with a generic value of "<2.5%" for most countries, which made it impossible to include it in the comparative analysis or test for statistical significance. Similarly, People undernourished indicator was not analyzed because data for this parameter were only available for Ukraine, and the lack of values for the other countries would have led to an incomplete and inconclusive analysis. These limitations highlight the importance of improving data collection and reporting methods internationally so that future studies can include a wider range of indicators and provide a more detailed picture of food security in the region.
An important methodological aspect of this study is the difference between the reporting years of the Food Security Indicators, determined by the variable availability of data provided by FAO. This temporal discrepancy constitutes a limitation of the analysis, as the values reported for certain countries correspond to different periods, which may influence direct comparisons between Romania and the average of neighboring countries.
This problem is frequently encountered in food security studies, where the frequency of data collection and updating of indicators varies depending on national reporting policies and the capacity of institutions to provide statistical information [27,28,29,30]. For example, some key indicators, such as Prevalence of food insecurity or Cereal import dependency ratio, are collected and published at different time intervals, which may affect the accuracy of regional trends compared in this study.
To minimize the impact of this limitation, the analysis was constructed to use the most recent data available for each indicator, ensuring the most accurate representation of the current reality. Therefore, the interpretation of the results must be done in the context of this variability of reporting years, considering that some observed differences may reflect both distinct economic and social realities and different moments of data collection.
In this context, future studies could benefit from more homogeneous data and more frequent collection of indicators, which would contribute to greater precision in the assessment of food security at the regional level.
Thus, this research highlights the need to harmonize the data reporting process within the analyzed countries, so that food security policies are based on comparable, updated and relevant information for strategic decisions in the agri-food sector [31,32,33].
From a methodological point of view, the current study focused on comparing the average values of neighboring countries with those of Romania without considering the internal distribution of these indicators within each country. In future studies, a more detailed analysis at the subnational level, both in Romania and neighboring countries, could highlight significant regional disparities and allow the formulation of more targeted public policies. Also, the use of econometric models investigating the causal relationships between various socio-economic factors and food security could bring additional insights into the mechanisms that influence these disparities [34].
Despite these limitations, the study offers a clear and well-founded perspective on food security in Romania and the region, contributing to a better understanding of the specific strengths and vulnerabilities of this geopolitical and economic context.
4.5. Policy Implications and Recommendations
The results of this study highlight the need for coordinated public policies at regional level, aimed at reducing the disparities between Romania and neighboring countries in terms of food security. Based on the four analyzed pillars– availability, accessibility, stability, and utilization – some specific recommendations can be formulated, aimed at contributing to improving food security in a sustainable and equitable way (Figure 9).
Regarding food availability, the data indicate that Romania benefits from a high level of food energy and protein supply, but this advantage should be supported by measures to diversify agricultural production and reduce the environmental impact of high consumption of animal products. Public policies should encourage sustainable agricultural technologies, agroecological practices and the development of food processing infrastructure, thus reducing food waste and ensuring a more equitable distribution of resources [14,36].
In terms of food accessibility, the study highlighted a major discrepancy between Romania’s high level of GDP per capita and alarming rates of severe food insecurity. This situation suggests that economic factors are not the only determinants of food access, and that social inequalities and income distribution must also be considered. In this regard, governments should implement support programs for vulnerable groups, subsidies for basic foods, and policies that improve access to markets and rural infrastructure.
For food security stability, Romania has advantages in terms of agricultural infrastructure, but geopolitical and economic vulnerabilities in the region can negatively influence food security in long term. It is recommended to increase the resilience of agriculture by investing in irrigation, diversifying import and export sources, as well as strengthening regional partnerships to avoid excessive dependence on certain markets [15,36]. Food security and crisis management measures should also be strengthened so that states can respond effectively to economic or climate shocks.
Regarding food use, the high level of obesity and other public health problems in Romania, compared to the average of neighboring countries, highlights the need for policies on nutrition education and promotion of a healthy lifestyle. Awareness campaigns on balanced nutrition, regulation of the nutritional content of processed products and improved access to public health services can help combat these problems [37,38,39,40]. Also, the expansion of drinking water networks and sanitation infrastructure in rural areas could reduce the risks of malnutrition and disease, thus contributing to the overall improvement in the use of food resources.
To reduce disparities and improve food security in region, an integrated approach combining economic, social, and environmental interventions is essential [41,42,43]. Cooperation between countries in the region, supporting food security research and developing national and cross-border adaptation strategies to climate change and economic crises could strengthen the resilience of food systems in Eastern Europe [44].
Therefore, public policies must focus not only on increasing food production but also on ensuring equitable access, maintaining stability, and promoting sustainable use of food resources. This multidimensional approach is essential to combat severe food insecurity and ensure a sustainable and resilient food system across the region.
5. Conclusions
This research provided a detailed analysis of food security in Romania, compared to the average of neighboring countries, using the four pillars defined by FAO: Availability, Access, Stability and Utilization. The results obtained highlight both Romania's strengths and vulnerabilities that require specific interventions.
For Pillar I - Availability, Romania stands out for its superior food supply, with high level of the indicators Average dietary energy supply adequacy (%) and Average supply of protein of animal origin (g/cap/day). This reflects the country's agricultural production capacity and the accessibility of protein sources. However, the dependence on cereals, roots, and tubers as a primary source of energy carries risks in the context of climate change and agricultural market volatility.
For Pillar II - Access, the contrast between the indicator Gross domestic product per capita, PPP and the high level of the indicator Prevalence of severe food insecurity in the total population (%) suggests the existence of economic inequalities and social barriers in access to food. Romania, although economically better positioned than the average of its neighbors, has an alarmingly high proportion of the population affected by severe food insecurity, which indicates the need for public policies aimed at reducing social disparities.
For Pillar II - Stability, Romania has a significant advantage in the larger irrigated area, which contributes to the stability of agricultural production. However, geopolitical factors such as instability in Ukraine and relatively high dependence on agri-food imports may influence long-term food security.
For Pillar IV - Utilization, Romania faces significant challenges in the field of public health, reflected by the high level of obesity in adults and anemia in women of reproductive age. Although access to sanitation and water services is higher than in other neighboring countries, inequalities between urban and rural areas persist, which requires additional measures to improve basic infrastructure.
The results of the statistical significance tests confirm that Romania presents significant differences compared to the average of neighboring countries for food energy supply, GDP per capita, prevalence of severe food insecurity, and prevalence of obesity in adults. These factors emphasize the need for intervention measures aimed at reducing inequalities, improving equitable access to food, and promoting sustainable policies in the agri-food sector [45,46,47].
It can be concluded that Romania benefits from solid food availability and high economic potential, but disparities in food accessibility and public health challenges require integrated policies. The present study provides a bases for developing effective strategies aimed at reducing food insecurity and promoting sustainability in the region.
The results of this study highlight the interdependence between food security and multiple SDGs, underscoring the need for integrated approaches to improve equitable access to food and reduce regional disparities. Although SDG 2 – Zero Hunger is the central objective of any food security analysis, this research demonstrates that progress towards this goal cannot be achieved in isolation, but requires coordinated economic, social and environmental action [48,49,50].
SDG 1 – No Poverty is closely linked to Pillar II – Access, as the high level of Romania's GDP per capita does not automatically translate into a reduction in food insecurity. Internal economic disparities contribute to the phenomenon of "food poverty", where access to adequate food is not guaranteed for all segments of the population, even in the context of a more developed economy than that of its neighbors. Addressing food insecurity requires integrated poverty reduction and social inclusion measures so that economic resources are distributed equitably [7,51].
At the same time, SDG 3 – Good Health and Well-Being is directly influenced by Pillar IV - Utilization, as the study highlights alarming rates of obesity and anemia in women of childbearing age, problems that affect public health in the long term. An unbalanced diet and barriers to access to adequate nutrition have major implications for the quality of life and the sustainability of health systems [51]. In this sense, interventions aimed at promoting a balanced diet and nutritional education become essential for the prevention of diseases associated with malnutrition, both undernutrition and overnutrition [15,51].
Also, SDG 6 – Clean Water and Sanitation plays a fundamental role in ensuring good Pillar IV - Utilization, and this study confirms that, although Romania has relatively good access to drinking water sources and sanitation services, there are still notable disparities between urban and rural areas. Investments in water and sanitation infrastructure are essential not only for food security, but also for reducing the risks of diseases caused by drinking contaminated water or poor hygiene [7,51].
In addition, SDG 12 – Responsible Consumption and Production is closely related to Pillar I - Availability, given that the food consumption model influences both the sustainability of the agri-food system and the ecological impact of agricultural production. Romania, through the high level of supply of food energy and protein, must direct its policies towards a more balanced consumption, reducing food waste and adopting sustainable agricultural practices.
Finally, SDG 13 – Climate Action is essential for the stability of food systems, especially in the context of regional vulnerabilities generated by climate change. The results of this study indicate a significant dependence on staple crops, which can amplify risks in the face of extreme events such as droughts or floods. Robust food security depends on the adaptation of agricultural systems to climate change and the development of policies that support the economic and ecological resilience of the region [7,51].
Thus, food security cannot be approached as an isolated challenge but must be understood as an integrative element in broader sustainable development strategies [52]. Romania and neighboring countries need coordinated policies that address not only the immediate aspects of food access and availability but also the structural factors that influence long-term stability and efficient use of resources. Only through a multidimensional approach, which includes economic development, environmental protection, and social equity, can a sustainable future for regional food security be ensured.
Author Contributions
Conceptualization, T.I.T. and I.M.B.; methodology, T.I.T. and I.M.B.; software, R.C.; validation, T.I.T. and I.M.B.; formal analysis, G.F. and J.V.T.; investigation, T.I.T. and I.M.B.; resources, T.I.T. and I.M.B.; data curation, R.C. and N.M.S.; writing—original draft preparation, T.I.T. and I.M.B.; writing—review and editing, T.I.T. and I.M.B.; visualization, G.F., J.V.T and N.M.S.; supervision, T.I.T. and I.M.B.; project administration, T.I.T. and I.M.B.; funding acquisition, T.I.T., G.F. and J.V.T. All authors have read and agreed to the published version of the manuscript.
Funding
The APC was funded by University of Agronomic Sciences and Veterinary Medicine of Bucharest (USAMVB), Romania.
Data Availability Statement
Data were obtained from the Food and Agricultural Organization of the United Nations (FAO) and are available on the Suite of Food Security Indicators page https://www.fao.org/faostat/en/#data/FS (Accessed on 1st September 2024 and 10 January 2025). Metadata regarding the suites of indicators is available at https://www.fao.org/faostat/en/#data/FS/metadata. The software used for statistical analysis One-sample t-tests and Wilcoxon signed-rank tests is available at https://my.sas.com.
Conflicts of Interest
The authors declare no conflict of interest.
References
- Trasca, T.; Balan, I.; Mateoc-Sirb, N. Sustainable Food Security in Romania and Neighboring Countries: Trends, Challenges, and Solutions. In Proceedings of the 5th International Electronic Conference on Foods, 28–30 October 2024; MDPI: Basel, Switzerland https://sciforum.net/paper/view/19601. [Google Scholar]
- FAO; IFAD; UNICEF; WFP; WHO. The State of Food Security and Nutrition in the World 2024. Financing to End Hunger, Food Insecurity and Malnutrition in All Its Forms; FAO, IFAD, UNICEF, WFP, WHO: Rome, Italy, 2024; https://openknowledge.fao.org/handle/20.500.14283/cd1254en. [Google Scholar] [CrossRef]
- The four pillars of food security. Food Security Cluster Handbook. 2023. Available online: https://handbook.fscluster.org/docs/231-the-four-pillars-of-food-security (accessed on 9 February 2025).
- Trasca, T.I.; Ocnean, M.; Gherman, R.; Lile, R.A.; Balan, I.M.; Brad, I.; Tulcan, C.; Firu Negoescu, G.A. Synergy between the Waste of Natural Resources and Food Waste Related to Meat Consumption in Romania. Agriculture 2024, 14, 644. [Google Scholar] [CrossRef]
- Balan, I.M.; Gherman, E.D.; Gherman, R.; Brad, I.; Pascalau, R.; Popescu, G.; Trasca, T.I. Sustainable nutrition for increased food security related to Romanian consumers’ behavior. Nutrients 2022, 14, 4892. [Google Scholar] [CrossRef] [PubMed]
- FAO. Suite of Food Security Indicators. Available online: https://www.10.org/faostat/en/#data/FS (accessed on 5 January 2025).
- United Nations. Department of Economic and Social Affairs Sustainable Development. The 17 Goals. Available online: https://sdgs.un.org/goals (accessed on 5 February 2025).
- Alexandri, C.; Luca, L.; Leonte, M.J. Providing Food Security in Romania. Challenges and Financing. Agricultural Economics and Rural Development 2023, 20, 101–122. [Google Scholar] [CrossRef]
- Balan, I.M.; Trasca, T.I. Reducing Agricultural Land Use Through Plant-Based Diets: A Case Study of Romania. Nutrients 2025, 17, 175. [Google Scholar] [CrossRef]
- Babych, M.; Kovalenko, A. Food Security Indicators In Ukraine: Current State And Trends Of Development. Baltic Journal of Economic Studies 2018, 4, 8–15. [Google Scholar] [CrossRef]
- Kovács, E.K.; Bachórz, A.; Bunzl, N.; Mincyte, D.; Parasecoli, F.; Piras, S.; Varga, M. The war in Ukraine and food security in Eastern Europe. Gastronomica 2022, 22, 1–7. [Google Scholar] [CrossRef]
- Gencia, A.D.; Balan, I.M. Reevaluating Economic Drivers of Household Food Waste: Insights, Tools, and Implications Based on European GDP Correlations. Sustainability 2024, 16, 7181. [Google Scholar] [CrossRef]
- Mateoc Sirb, N.; Otiman, P.I.; Mateoc, T.; Salasan, C.; Balan, I.M. Balance of Red Meat in Romania—Achievements and Perspectives. In From Management of Crisis to Management in a Time of Crisis. In Proceedings of the 5th Review of Management and Economic Engineering International Management Conference, Cluj Napoca, Romania, 2016; pp. 388–394, https://www.webofscience.com/wos/woscc/full-record/WOS:000385997200048. [Google Scholar]
- European Commsion. EU Actions to Enhance Global Food Security. N.d. Available online: https://commission.europa.eu/strategy-and-policy/priorities-2019-2024/stronger-europe-world/eu-actions-enhance-global-food-security_en (accessed on 5 February 2025).
- World Food Programme. Food Security Analysis. N.d. Available online: https://www.wfp.org/food-security-analysis (accessed on 5 February 2025).
- Petroman, C.; Balan, I.M.; Petroman, I.; Orboi, M.D.; Banes, A.; Trifu, C.; Marin, D. National grading of quality of beef and veal carcasses in Romania according to “EUROP” system. J. Food Agric. Environ. 2009, 7, 173–174. [Google Scholar]
- Istudor, N.; Ion, R.A.; Sponte, M.; Petrescu, I.E. Food Security in Romania—A Modern Approach for Developing Sustainable Agriculture. Sustainability 2014, 6, 8796–8807. [Google Scholar] [CrossRef]
- Stef, D.S.; Rivis, A.; Trasca, T.I.; Pop, M.; Heghedus-Mindru, G.; Stef, L.; Marcu, A. The enrichment of bread with algae species. Sc. Papers-Series D-Animal Sc 2022, 65, 558–563. [Google Scholar]
- Stef, D.S.; Gergen, I.; Trasca, T.I.; Rivis, A.; Stef, L.; Cristina, R.T.; Druga, M.; Pet, I. Assessing the influence of various factors in antioxidant activity of medicinal herbs. Rom Biot Letters 2017, 22, 12842–12846. [Google Scholar]
- Stanciu, S. Food Security in Romania. SEA–Practical Application of Science 2015, 3, 83–92, https://www.ceeol.com/search/article-detail?id=740609. [Google Scholar]
- Salasan, C.; Balan, I.M. Suitability of a Quality Management Approach within the Public Agricultural Advisory Services. Qual.-Access Success 2014, 15, 81–84, https://www.researchgate.net/publication/295468455_Suitability_of_a_quality_management_approach_within_the_public_agricultural_advisory_services. [Google Scholar]
- Petroman, I.; Caliopi Untaru, R.; Petroman, C.; Orboi, M.D.; Banes, A.; Marin, D.; Balan, I.; Negrut, V. The influence of differentiated feeding during the early gestation status on sows prolificacy and stillborns. J. Food Agric. Environ. 2011, 9, 223–224. [Google Scholar]
- Balan, I.M.; Gherman, E.D.; Brad, I.; Gherman, R.; Horablaga, A.; Trasca, T.I. Metabolic Food Waste as Food Insecurity Factor—Causes and Preventions. Foods 2022, 11, 2179. [Google Scholar] [CrossRef]
- Trasca, T.I.; Groza, I.; Rinovetz, A.; Rivis, A.; Radoi, B.P. The study of the behaviour of polyetetrafluorethylene dies for pasta extrusion comparative with bronze dies. Rev Mat Plast 2007, 44, 307–309. [Google Scholar]
- Chirescu, A.D.; Closca, A. Food security: past, present and future. The case of Romania. Rev Rom de Statistică 2023, Supl. 95. https://www.revistadestatistica.ro/supliment/wp-content/uploads/2023/04/5en_rrss_03_2023_ro.pdf. [Google Scholar]
- Popescu, G. Sustainability of food safety and security in Romania. Challenges for the future national strategic plan. Competitiveness of Agro-Food and Environmental Economy 2019, 8–16. [Google Scholar] [CrossRef]
- World Bank Food Security Update | World Bank Solutions to Food Insecurity. N.d. Available online: https://www.worldbank.org/en/topic/agriculture/brief/food-security-update?cid=ECR_GA_worldbank_EN_EXTP_search&s_kwcid=AL!18468!3!704632427690!b!!g!!food%20insecurity&gad_source=1 (accessed on 5 February 2025).
- FAO; IFAD; UNICEF; WFP; WHO. The State of Food Security and Nutrition in the World 2021. Transforming food systems for food security, improved nutrition and affordable healthy diets for all. FAO, IFAD, UNICEF, WFP, WHO. 2021; https://books.google.ro/books?hl=ro&lr=&id=CnE5EAAAQBAJ&oi=fnd&pg=PR6&dq=food+security+indicators+Eastern+Europe&ots=cbyFg7JDDm&sig=XT2i5Dv0pEi_96eG7fcufO7R7dw&redir_esc=y#v=onepage&q=food%20security%20indicators%20Eastern%20Europe&f=false. [Google Scholar]
- FAO; IFAD; UNICEF; WFP; WHO. The State of Food Security and Nutrition in the World 2022. Repurposing food and agricultural policies to make health diets more affordable. FAO, IFAD, UNICEF, WFP, WHO. 2022; https://ngfrepository.org.ng:8443/bitstream/123456789/5358/1/cc0640en.pdf. [Google Scholar]
- Groza, I.; Trasca, T.I.; Rivis, A.; Radoi, B. Mathematical Model for Determining the Volume of Abrasive Susceptible of Levitation. Rev Chimie 2009, 60, 1347–1349. [Google Scholar]
- Santeramo, F.G. On the Composite Indicators for Food Security: Decisions Matter! Food Rev Internat 2014, 31, 63–73. [Google Scholar] [CrossRef]
- Headey, D.; Ecker, O. Rethinking the measurement of food security: from first principles to best practice. Food Sec 2013, 5, 327–343. [Google Scholar] [CrossRef]
- Poudel, D.; Munisamy, G. Exploring the disparity in global food security indicators. Global Food Security 2021, 29, 100549. [Google Scholar] [CrossRef]
- HLPE. Food security and nutrition: building a global narrative towards 2030. A report by the High Level Panel of Experts on Food Security and Nutrition of the Committee on World Food Security, Rome. 2020. Available online: https://openknowledge.fao.org/server/api/core/bitstreams/8357b6eb-8010-4254-814a-1493faaf4a93/content (accessed on 3 February 2025).
- Manikas, I.; Ali, B.M.; Sundarakani, B. A systematic literature review of indicators measuring food security. Agric & Food Secur 2023, 12, 10. [Google Scholar] [CrossRef]
- Nicholson, C.F.; Stephens, E.C.; Kopainsky, B.; Jones, A.D.; Parsons, D.; Garrett, J. Food security outcomes in agricultural systems models: Current status and recommended improvements. Agricultural Systems 2021, 188, 103028. [Google Scholar] [CrossRef]
- Mostova, A.; Hutorov, A. Food security in the countries of Central and Eastern Europe: State and strategic directions of provision. Ekonomika APK 2023, 30, 20–29. [Google Scholar] [CrossRef]
- Leroy, J.L.; Ruel, M.; Frongillo, E.A.; Harris, J.; Ballard, T.J. Measuring the food access dimension of food security: a critical review and mapping of indicators. Food and nutrition bulletin 2015, 36, 167–195. [Google Scholar] [CrossRef]
- Trasca, T.I.; Groza, I.; Rinovetz, A.; Rivis, A.; Radoi, B.P. The study of the behaviour of polyetetrafluorethylene dies for pasta extrusion comparative with bronze dies. Rev. mat plast 2007, 44, 307–309. [Google Scholar]
- Rinovetz, A.; Rinovetz, Z.A.; Mateescu, C.; Trasca, T.I.; Jianu, C.; Jianu, I. Rheological characterisation of the fractions separated from pork lards through dry fractionation. Journ Food Agr Env 2011, 9, 47–52. [Google Scholar]
- Hoddinott, J.F.; Yohannes, Y. Dietary diversity as a food security indicator. FCND Discussion Paper 136, 2022; https://hdl.handle.net/10568/155730. [Google Scholar]
- Rumyk, I. Modeling the impact of economic indicators on food security. Ec Fin Manag Rev 2021, 4–13. [Google Scholar] [CrossRef]
- Dubanych, O.; Vavřina, J.; Polák, J. Development of financial performance of food retailers as an attribute behind the increase of food insecurity in selected Central and Eastern European countries. Investm Manag Financ Innov 2023, 20, 416–433. [Google Scholar] [CrossRef]
- Allee, A.; Lynd, L.R.; Vaze, V. Cross-national analysis of food security drivers: comparing results based on the Food Insecurity Experience Scale and Global Food Security Index. Food Sec. 2021, 13, 1245–1261. [Google Scholar] [CrossRef]
- Guha-Khasnobis, B.; Acharya, S.S.; Davis, B. (Eds.) Food security: Indicators, measurement, and the impact of trade openness; OUP: Oxford, 2007; https://books.google.ro/books?hl=ro&lr=&id=2QxREAAAQBAJ&oi=fnd&pg=PR9&dq=food+security+indicators&ots=7WAGV2u9dz&sig=SeA9T0dv78DewJ1xgffEohWg-kw&redir_esc=y#v=onepage&q=food%20security%20indicators&f=false. [Google Scholar]
- Toma, I.; Redman, M.; Czekaj, M.; Tyran, E.; Grivins, M.; Sumane, S. Small-scale farming and food security–policy perspectives from Central and Eastern Europe. Global Food Security 2021, 29, 100504. [Google Scholar] [CrossRef]
- Tomasevic, I.; Kovačević, D.B.; Jambrak, A.R.; Szendrő, K.; Dalle Zotte, A.; Prodanov, M.; Djekic, I. Validation of novel food safety climate components and assessment of their indicators in Central and Eastern European food industry. Food control 2020, 117, 107357. [Google Scholar] [CrossRef]
- Dudek, H.; Myszkowska-Ryciak, J. Food Insecurity in Central-Eastern Europe: Does Gender Matter? Sustainability 2022, 14, 5435. [Google Scholar] [CrossRef]
- Transforming Our World: The 2030 Agenda for Sustainable Development. Available online: https://www.un.org/sustainabledevelopment/sustainable-development-goals (accessed on 5 February 2025).
- United Nations. Final List of Proposed Sustainable Development Goal Indicators. Available online: https://sustainabledevelopment.un.org/content/documents/11803Official-List-of-Proposed-SDG-Indicators.pdf (accessed on 5 February 2025).
- Kuiper, M.; Cui, H.D. Using food loss reduction to reach food security and environmental objectives–A search for promising leverage points. Food Policy 2021, 98, 101915. [Google Scholar] [CrossRef]
- Campi, M.; Dueñas, M.; Fagiolo, G. Specialization in food production affects global food security and food systems sustainability. World Development 2021, 141, 105411. [Google Scholar] [CrossRef]
Figure 1.
Comparison of Pillar I - Availability indicators.
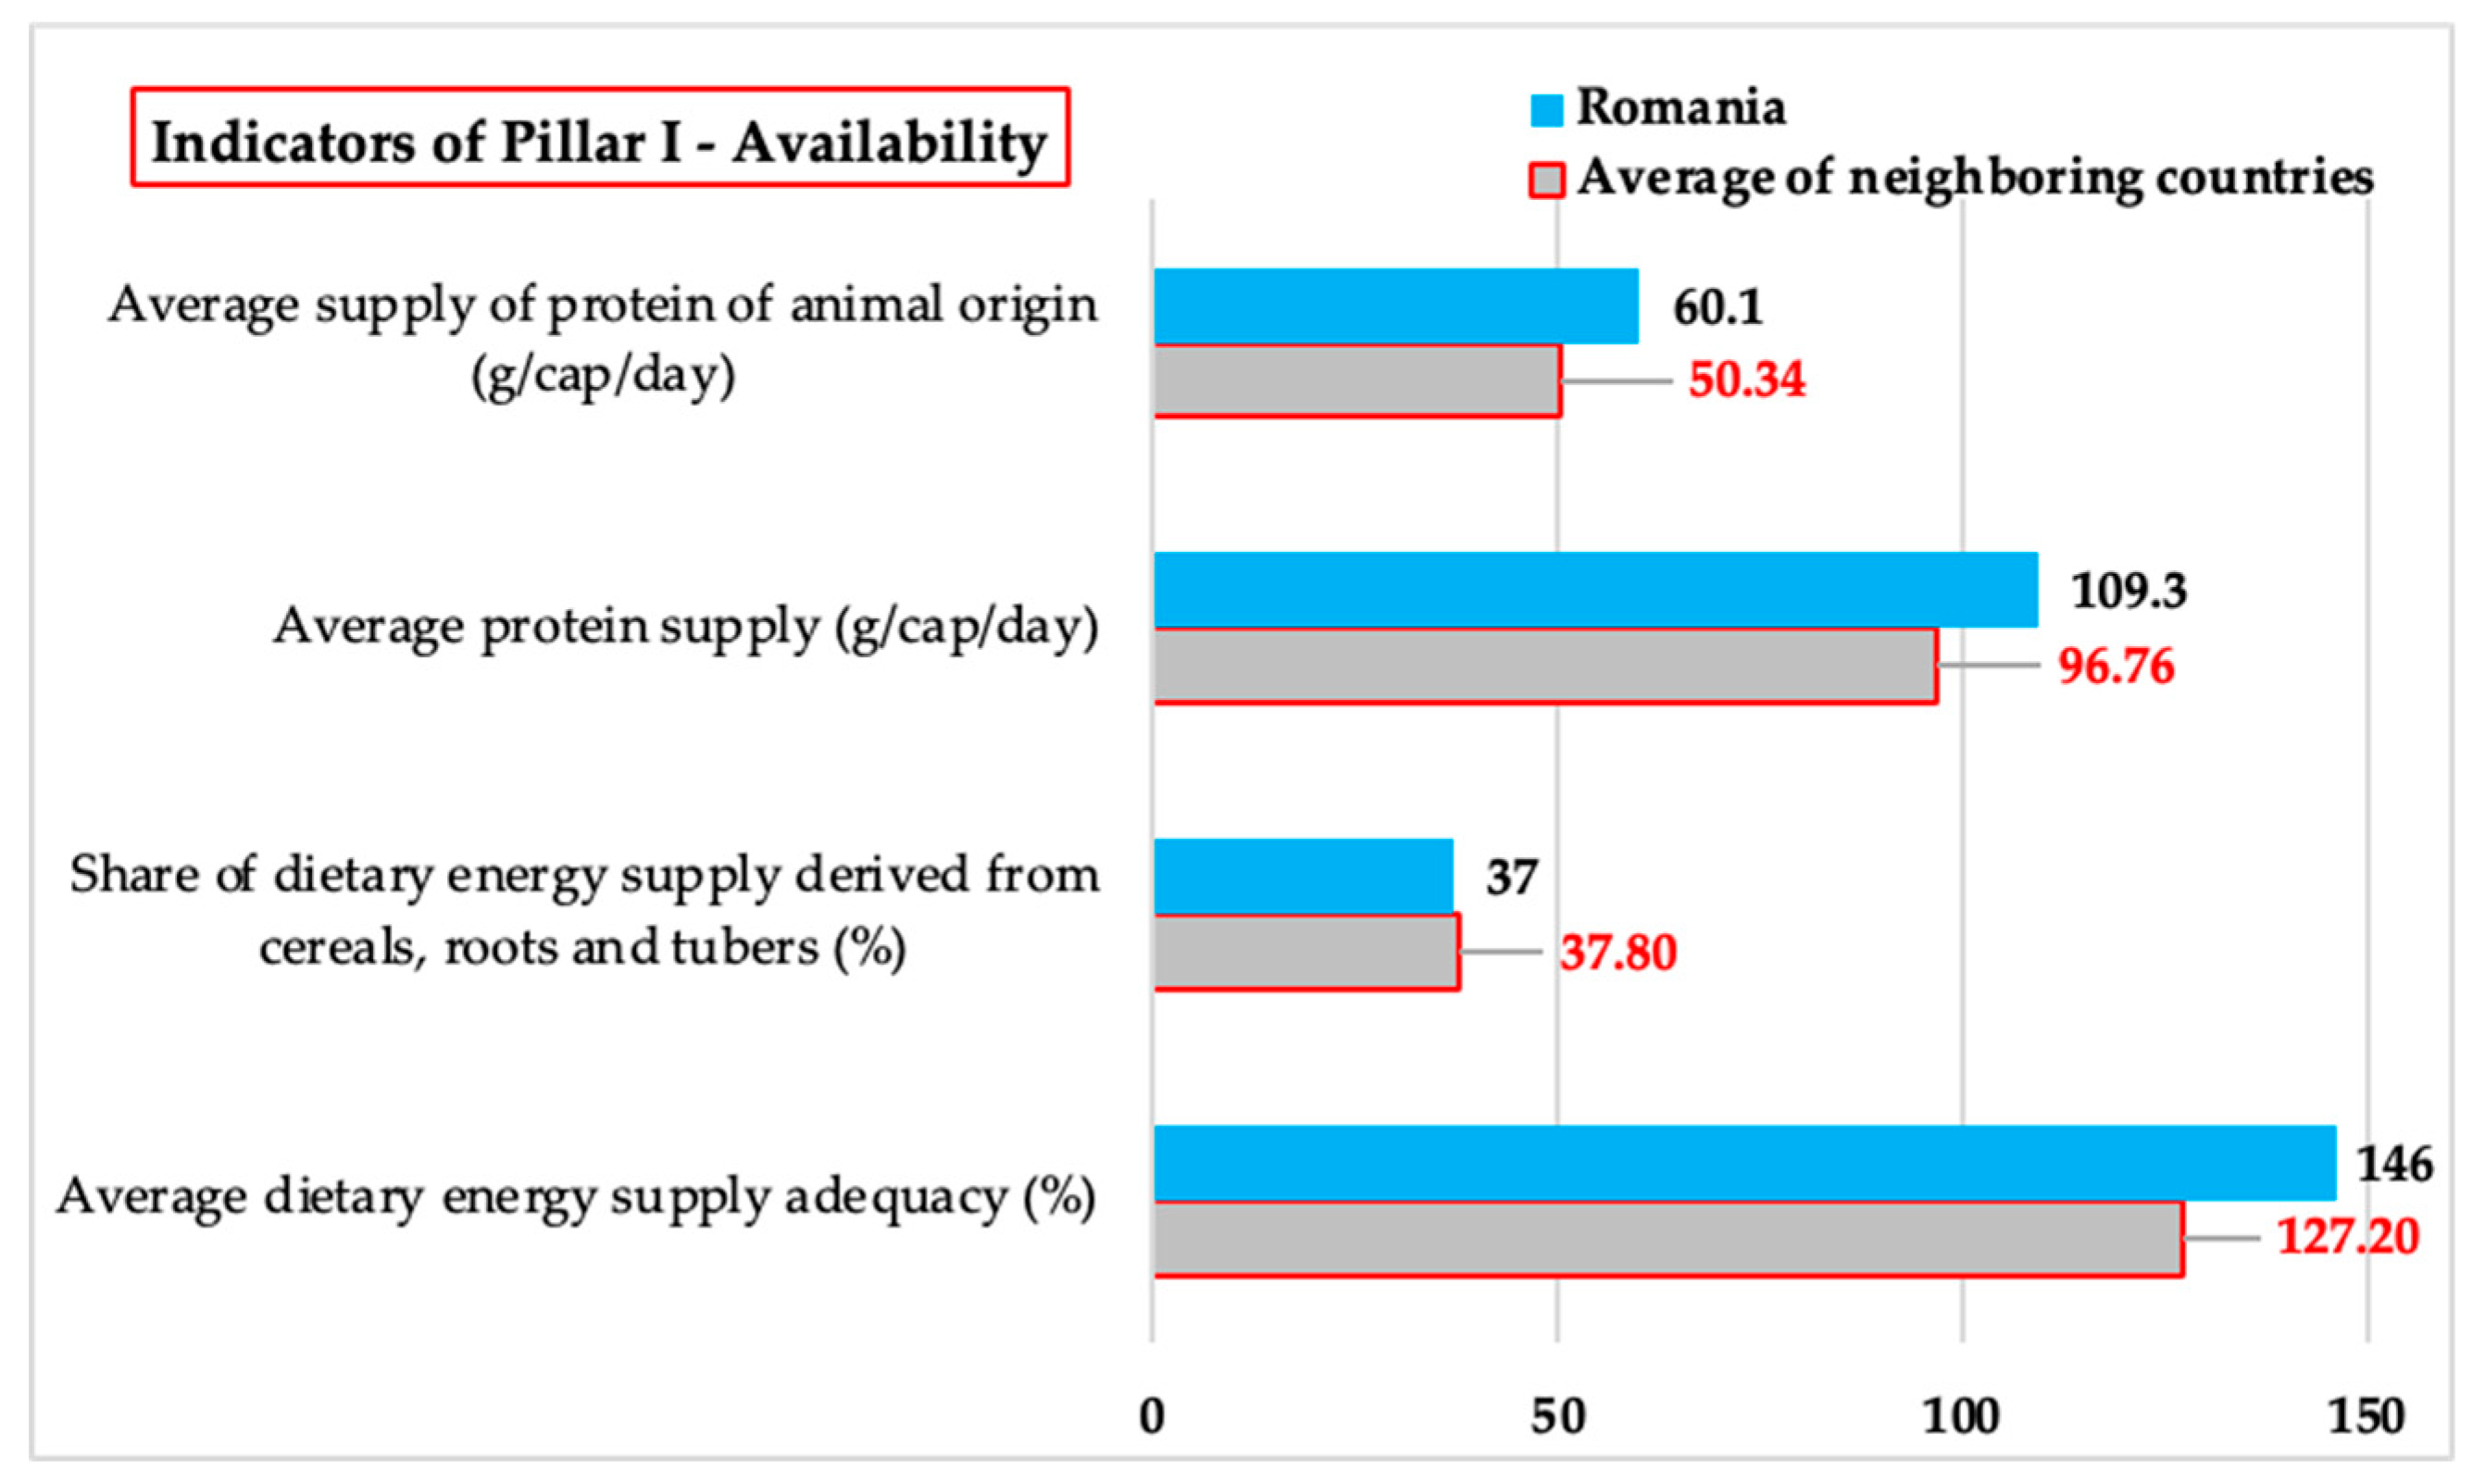
Figure 2.
Comparison of Pillar II – Access indicators.
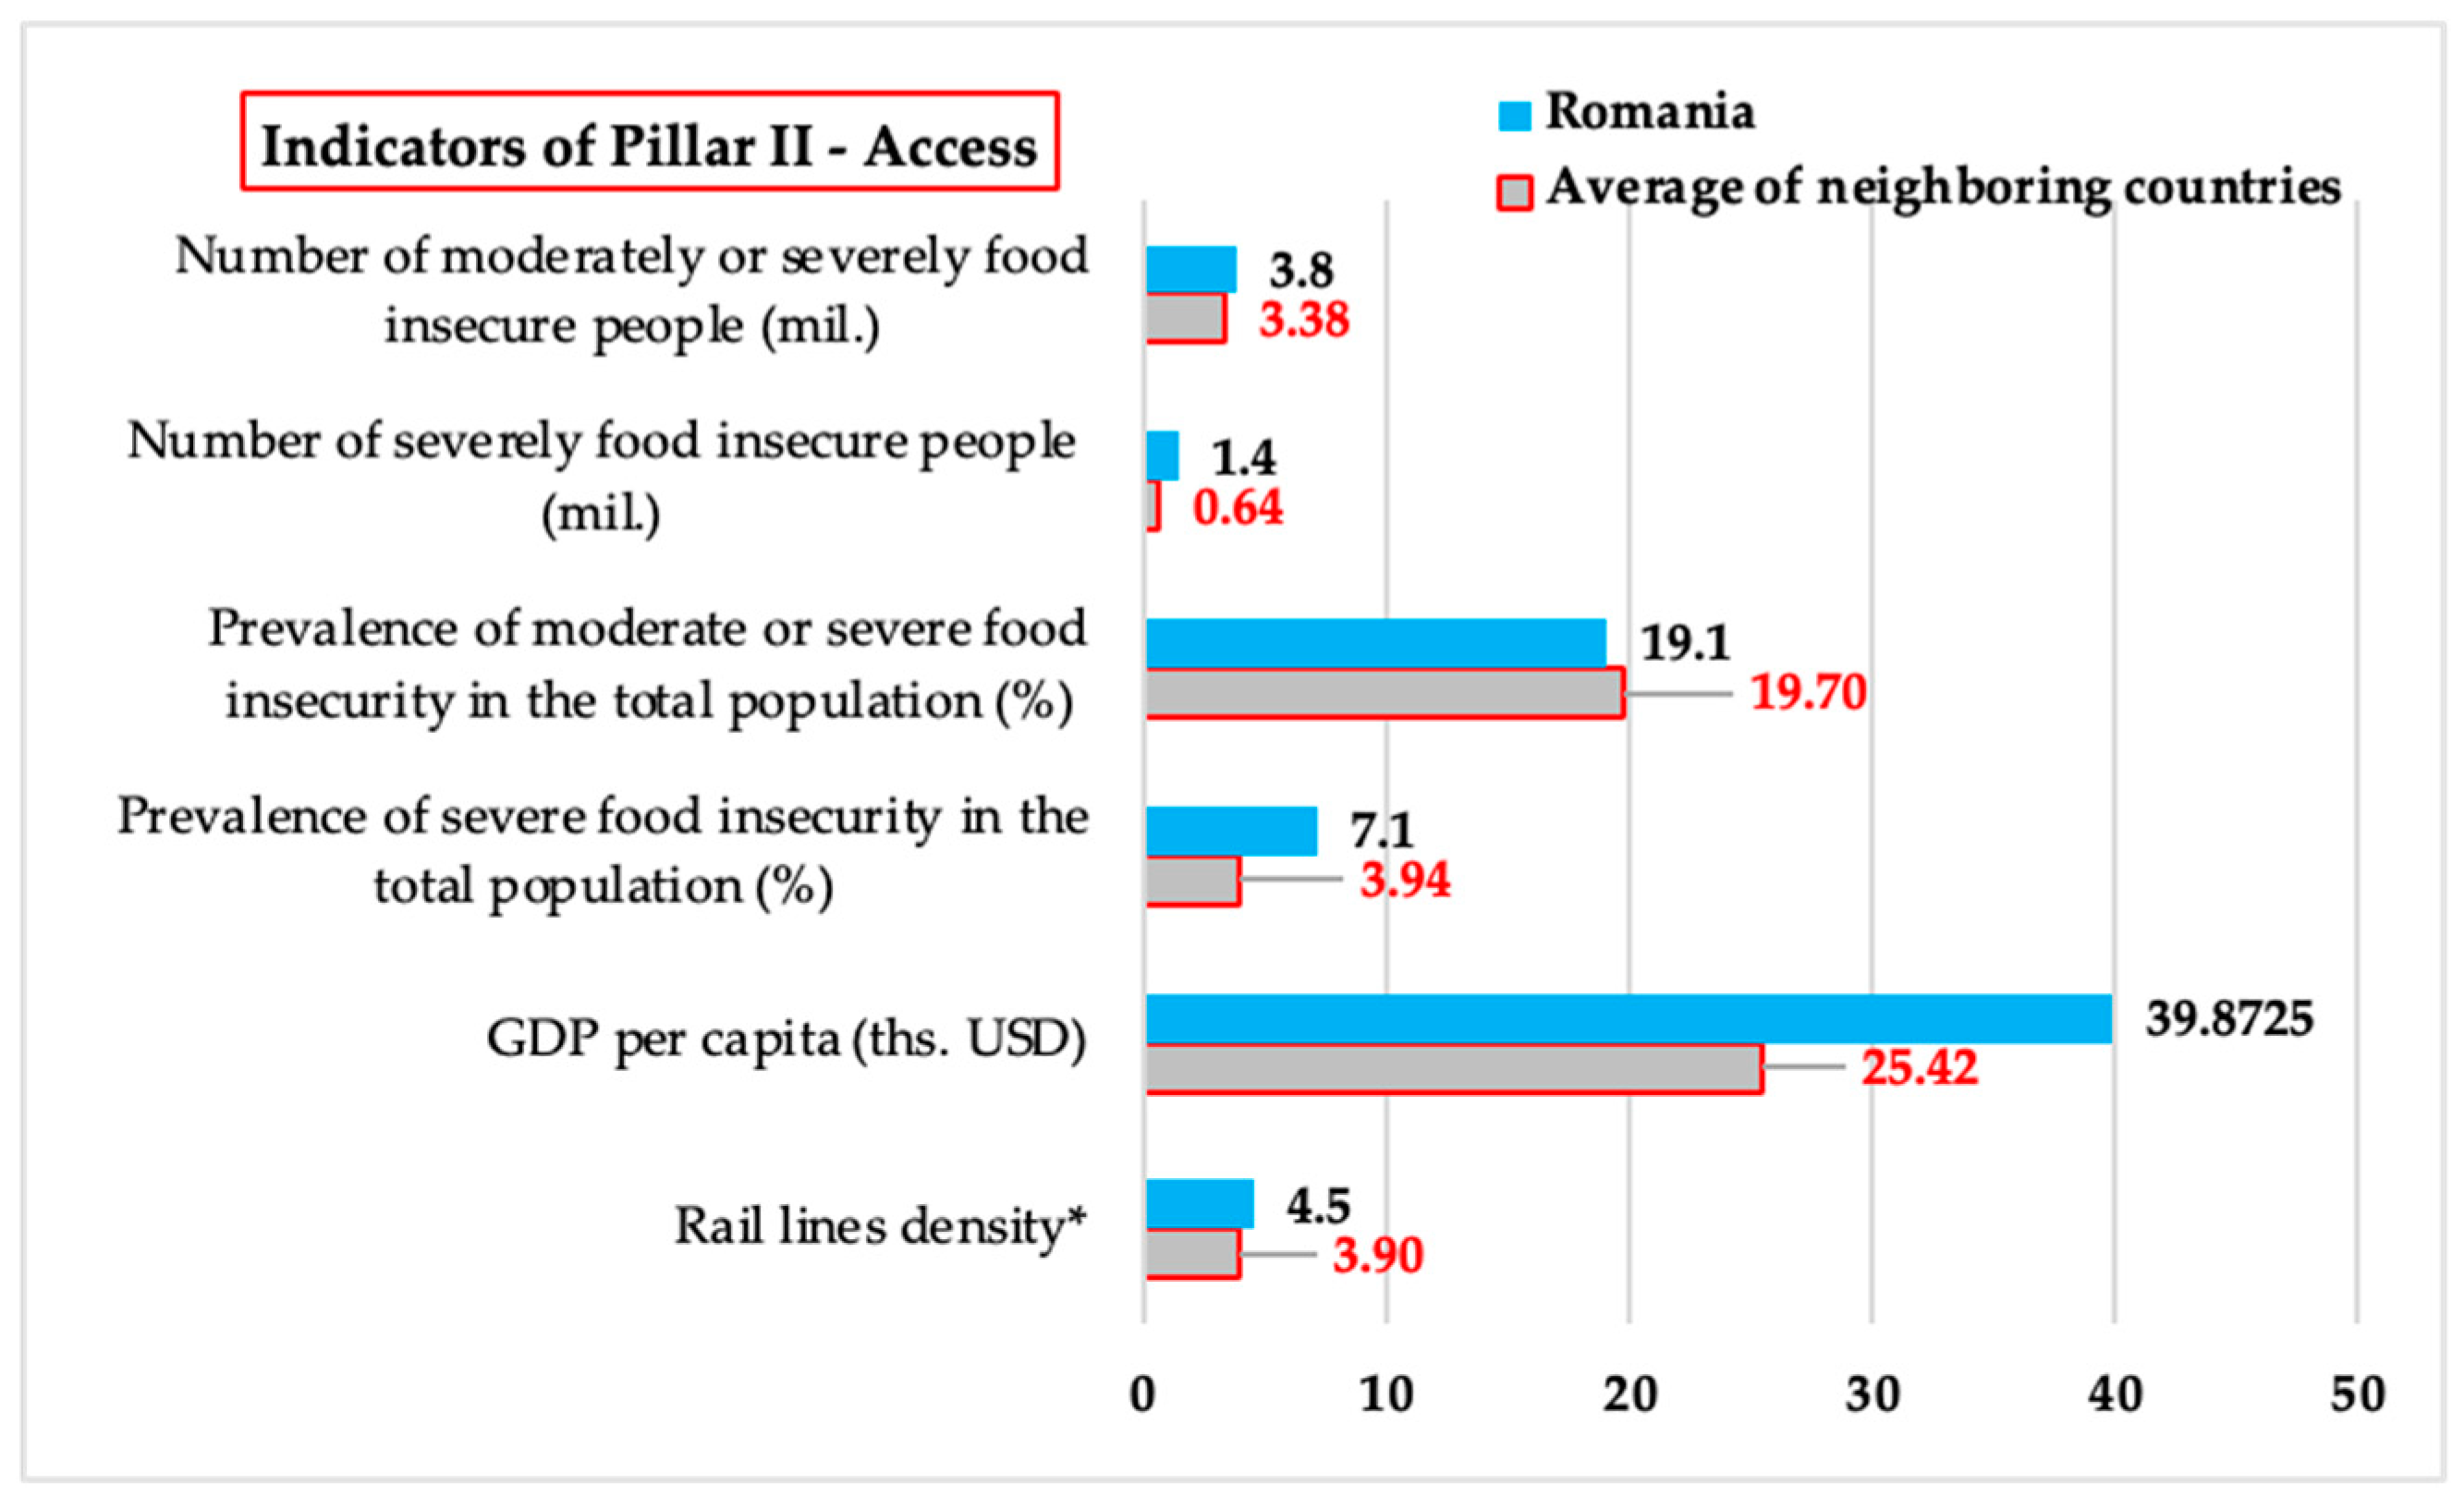
Figure 3.
Comparison of Pillar III - Stability indicators.
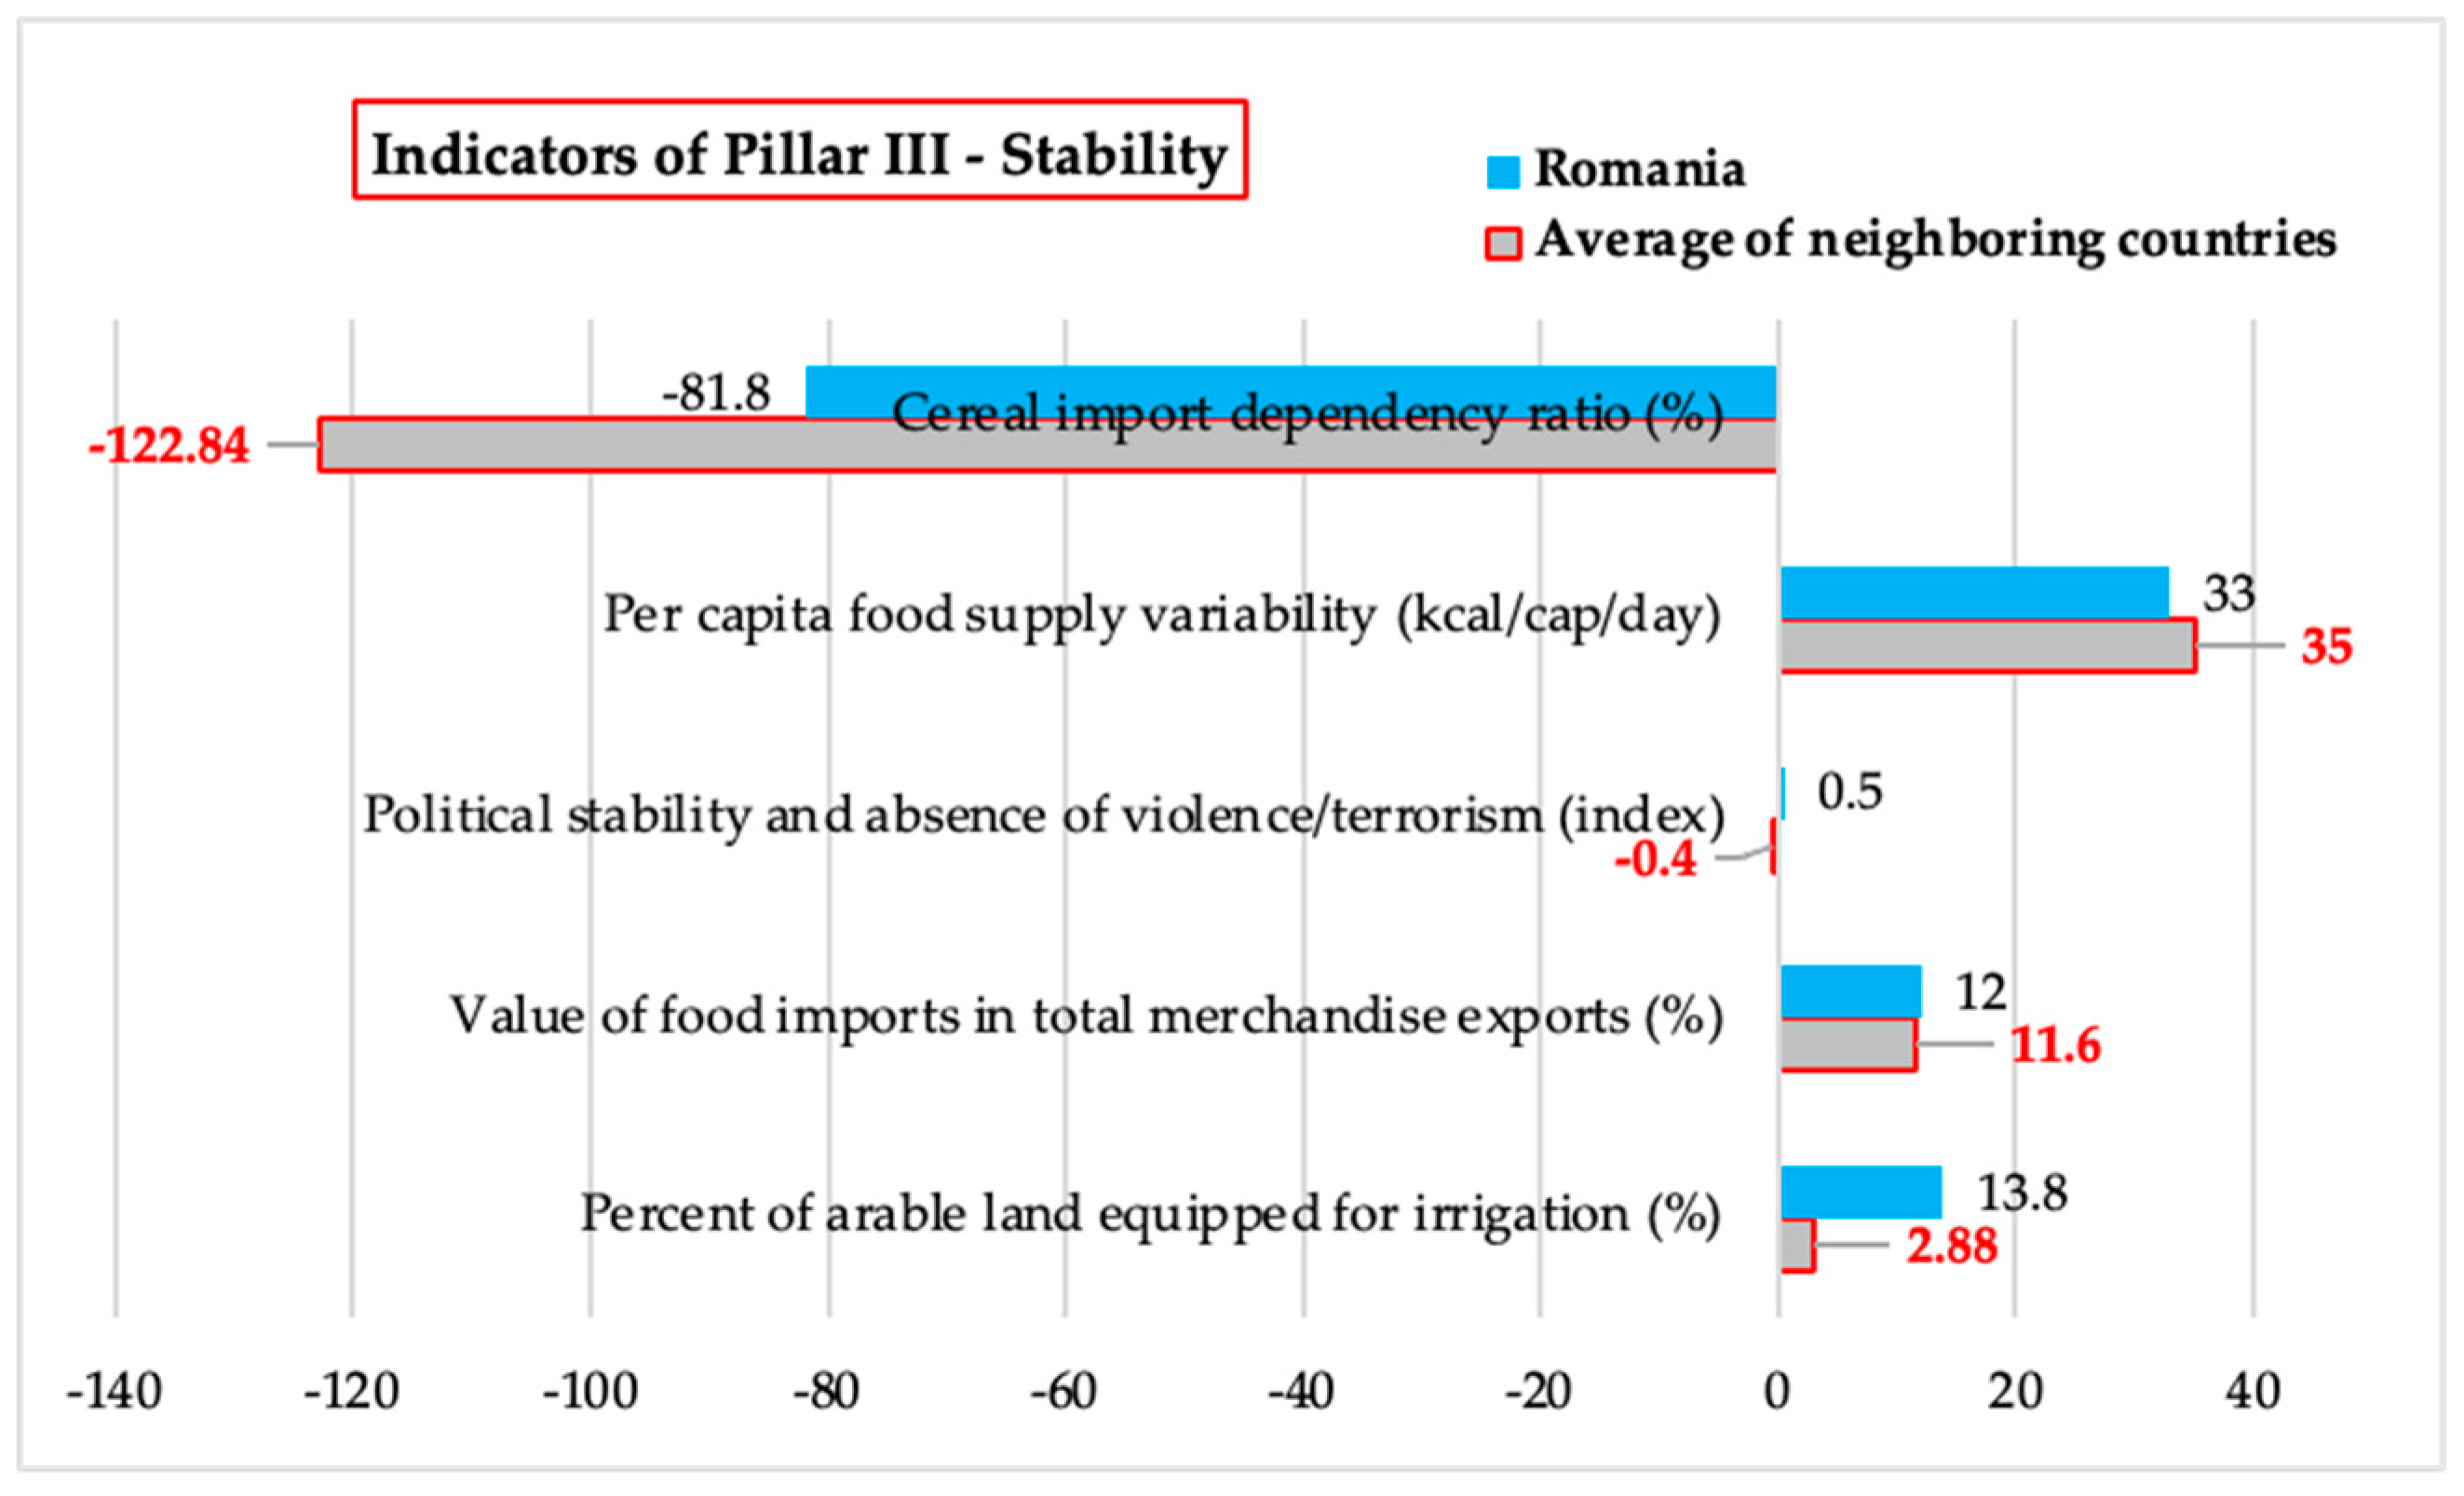
Figure 4.
Comparison of Pillar IV - Utilization indicators.
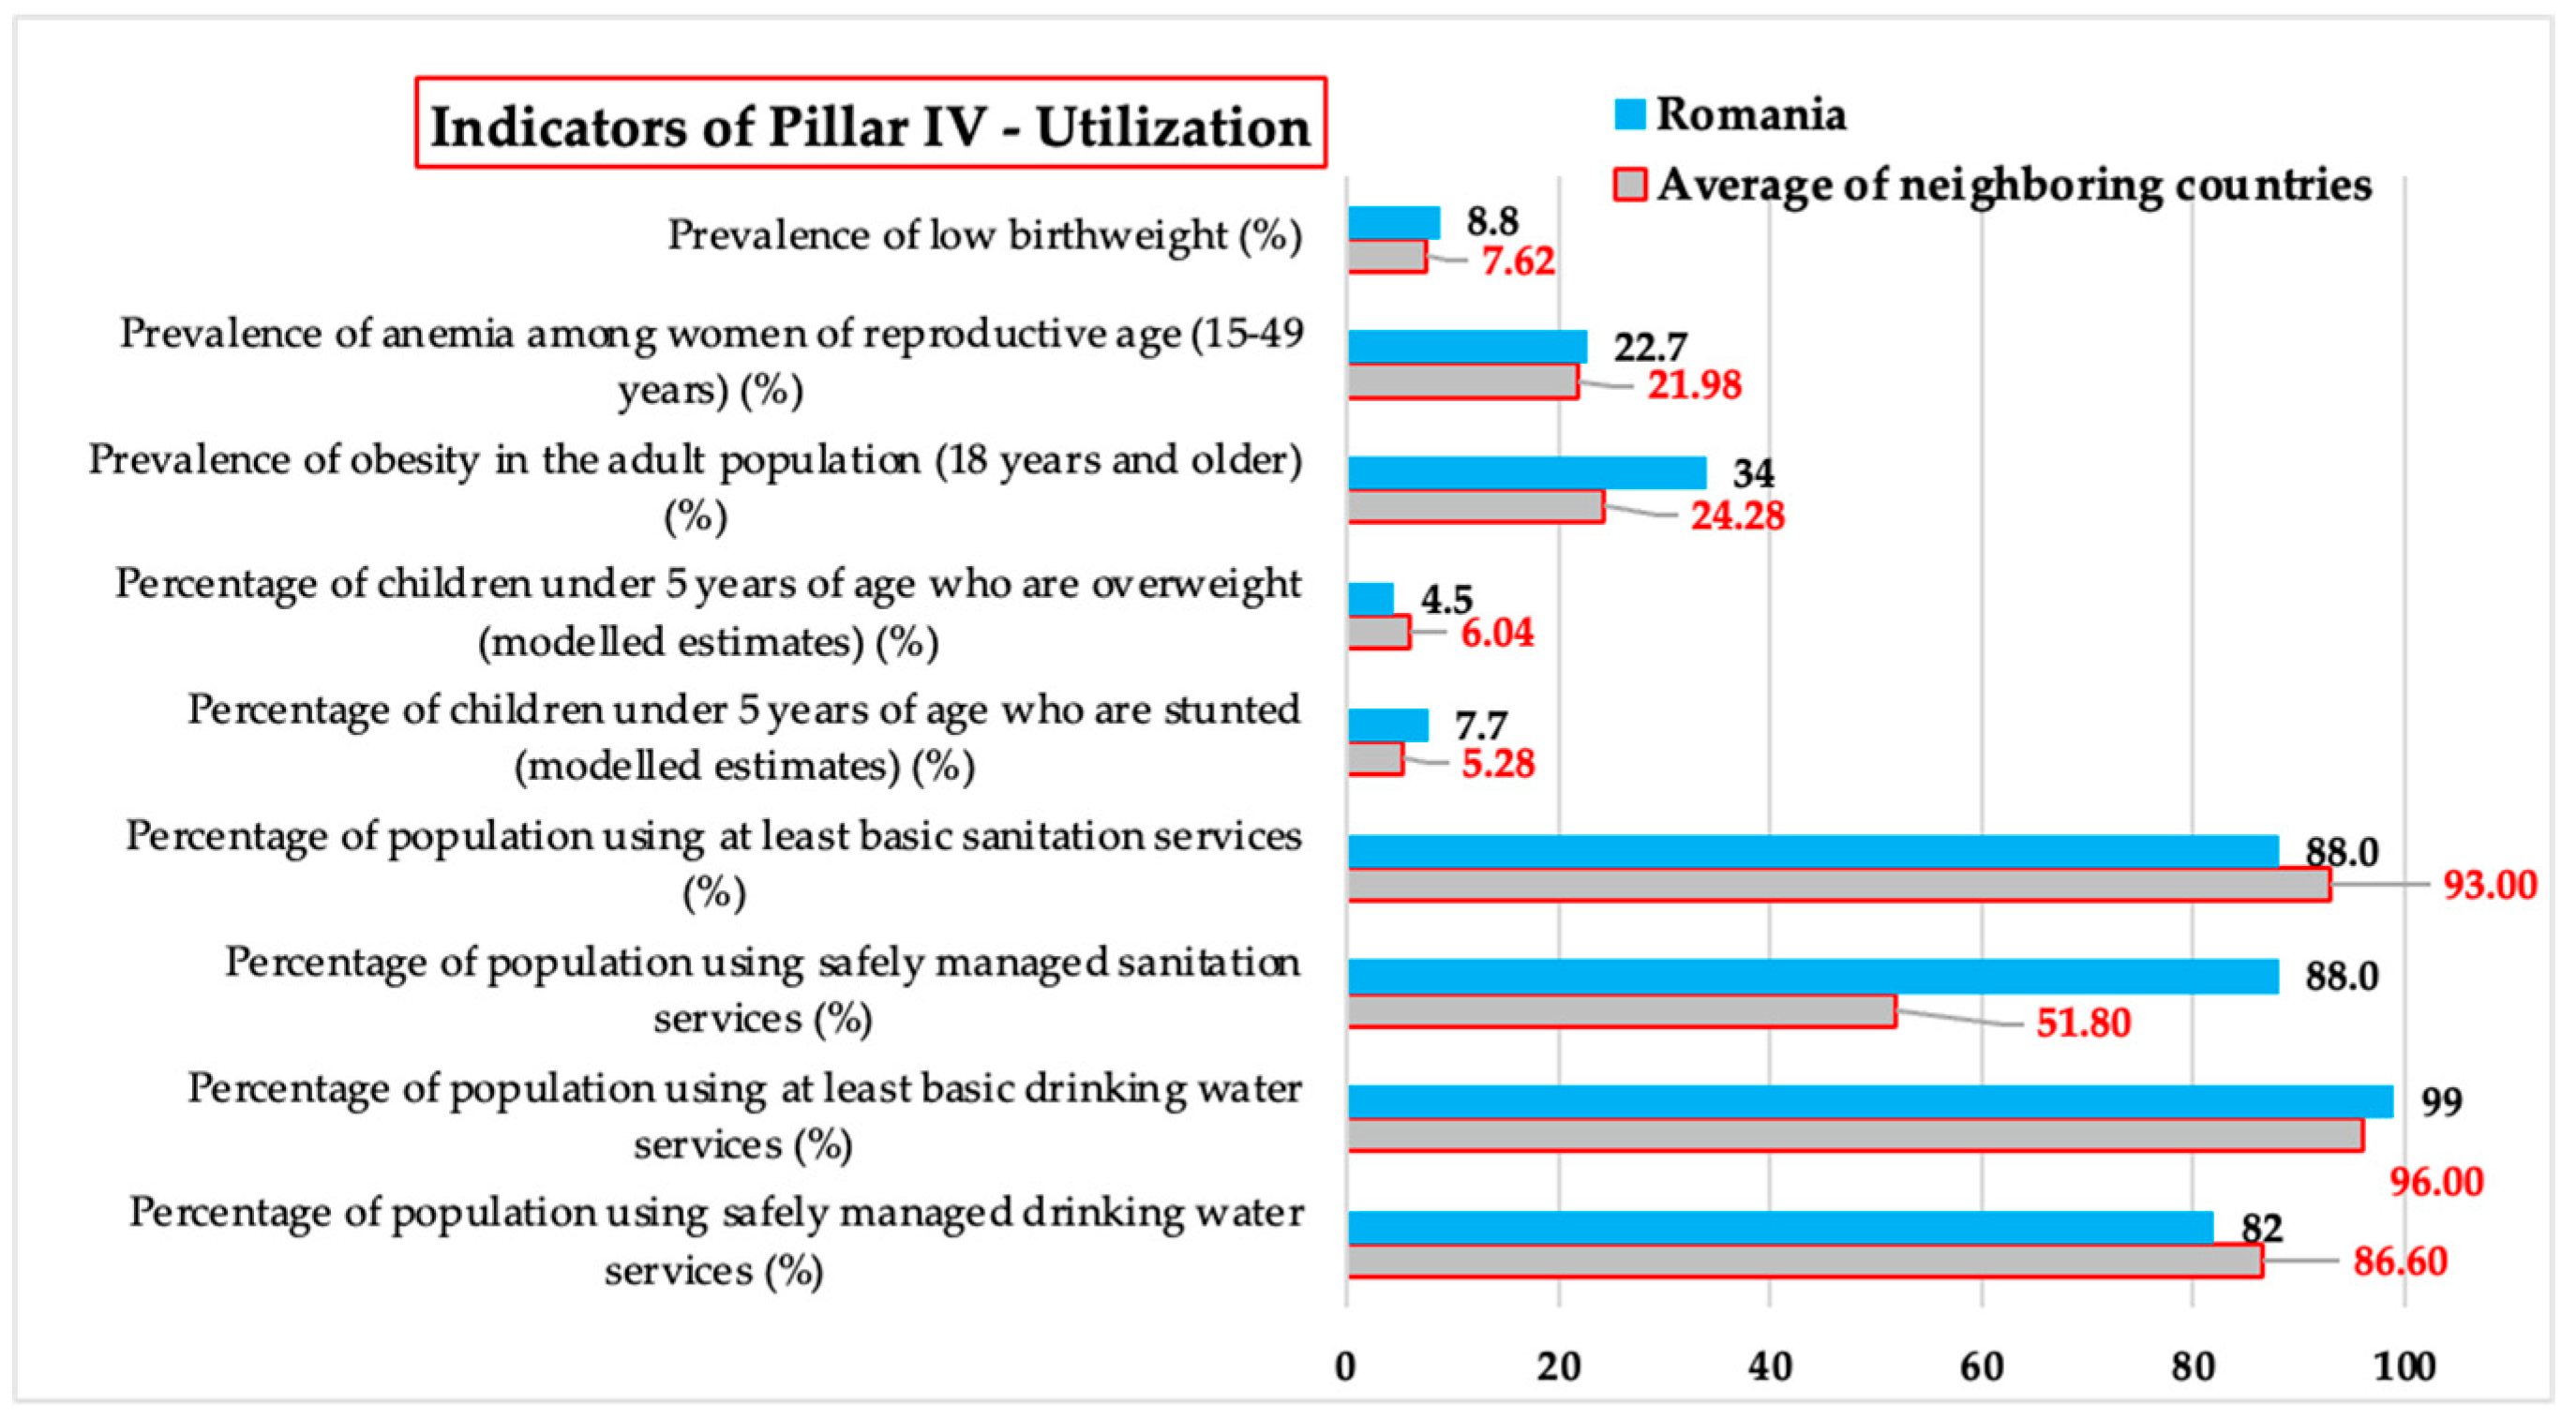
Figure 5.
Distribution of values for Pillar I - Availability indicators suite, in Romania's neighboring countries, respectively the value of the indicator in Romania (RO): (a) Average dietary energy supply adequacy (%); (b) Share of dietary energy supply derived from cereals, roots and tubers (%); (b) Average protein supply (g/head/day); (d) Average supply of protein of animal origin (g/cap/day).
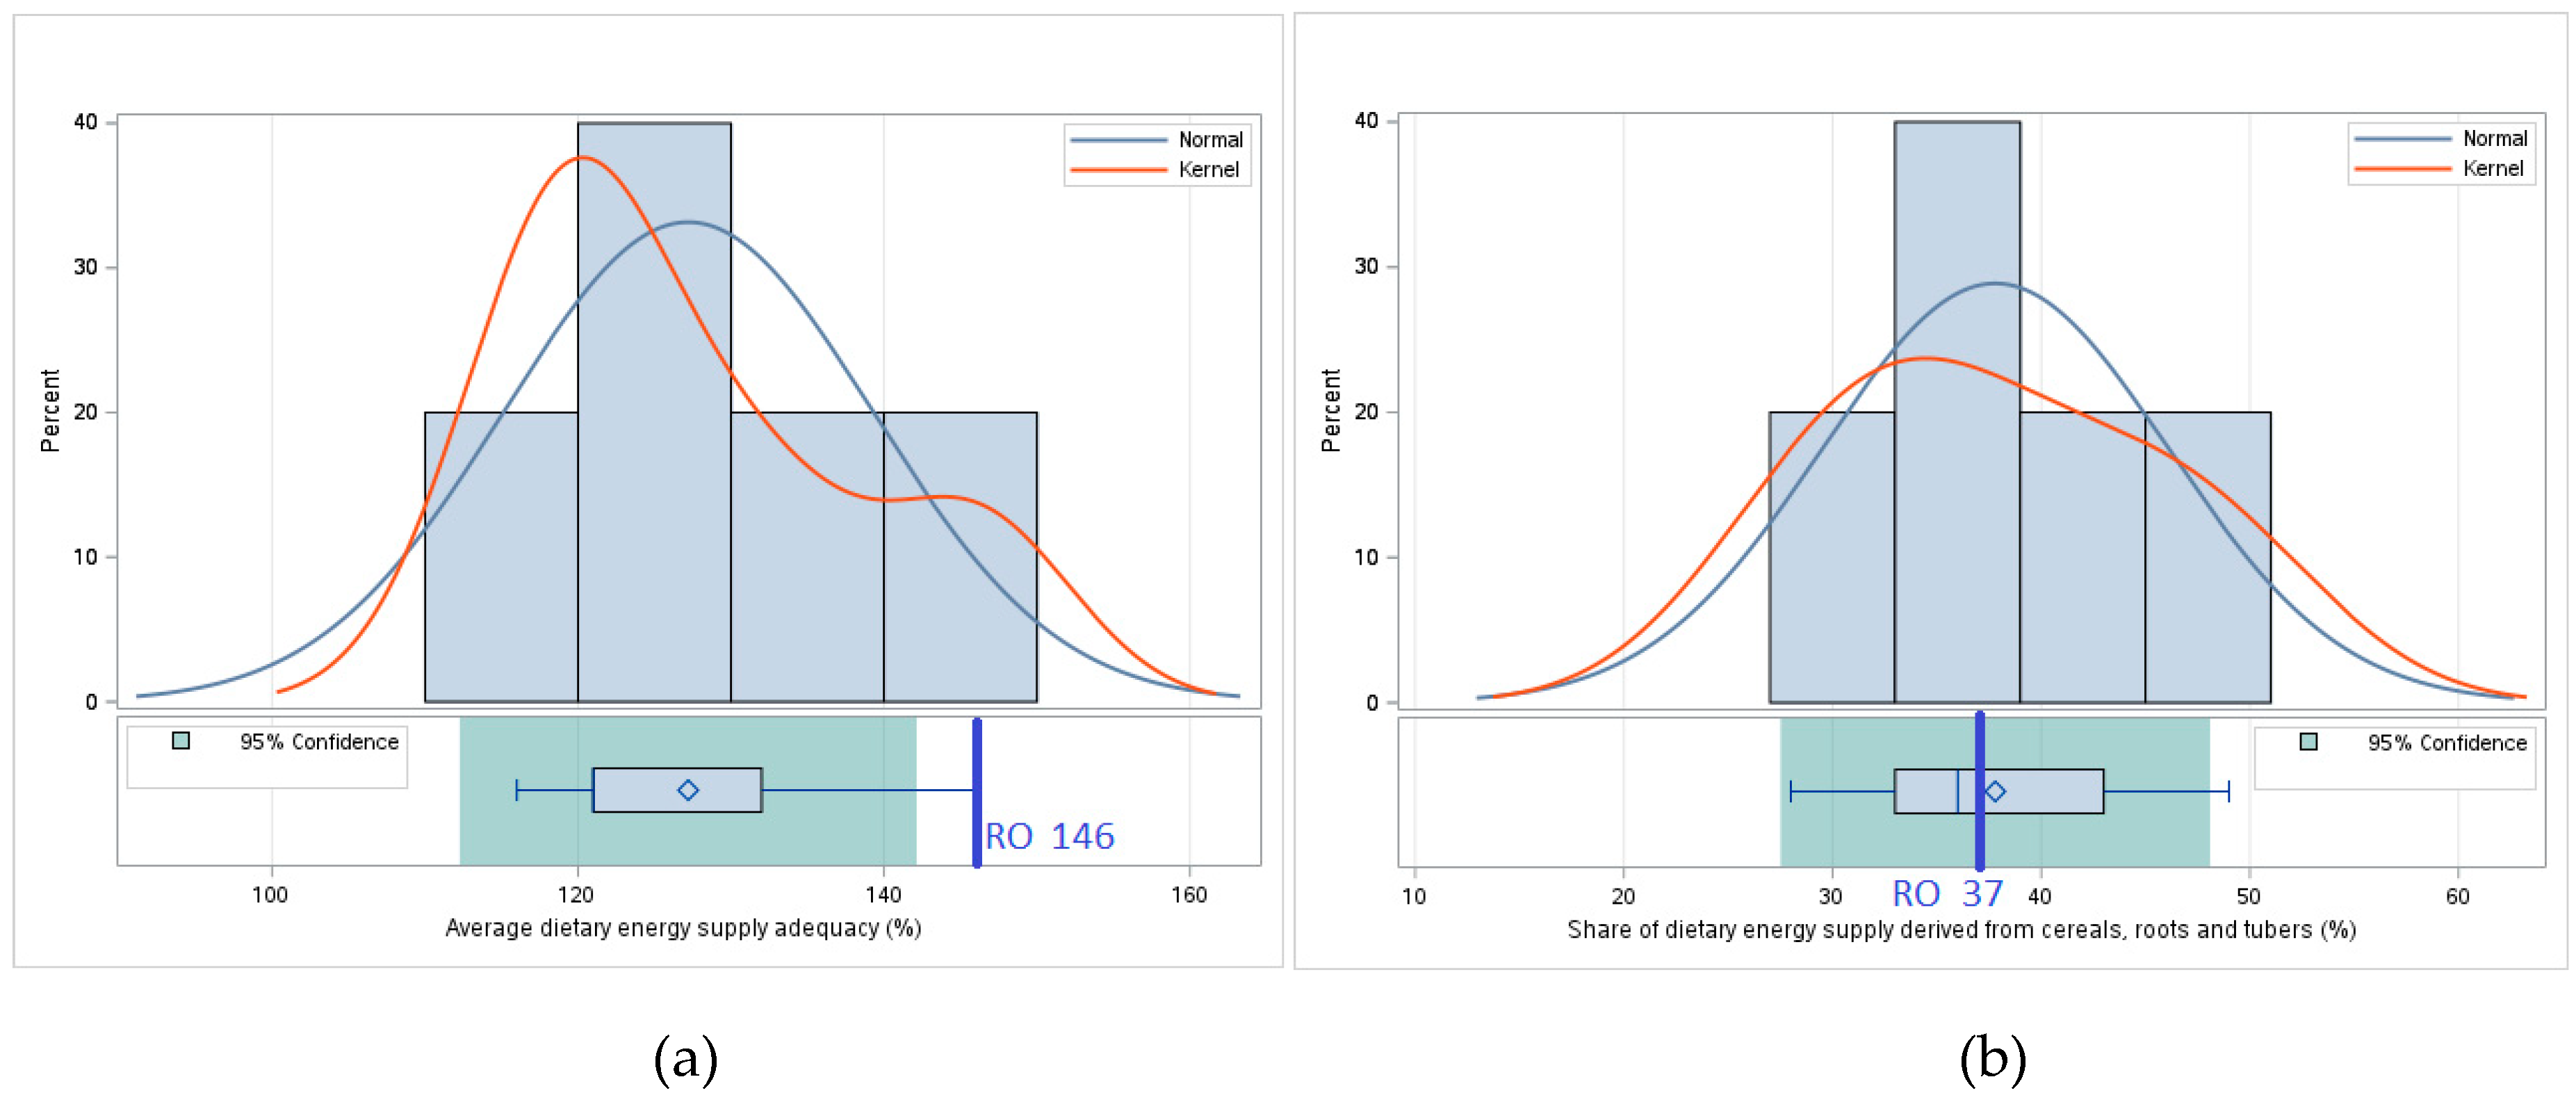
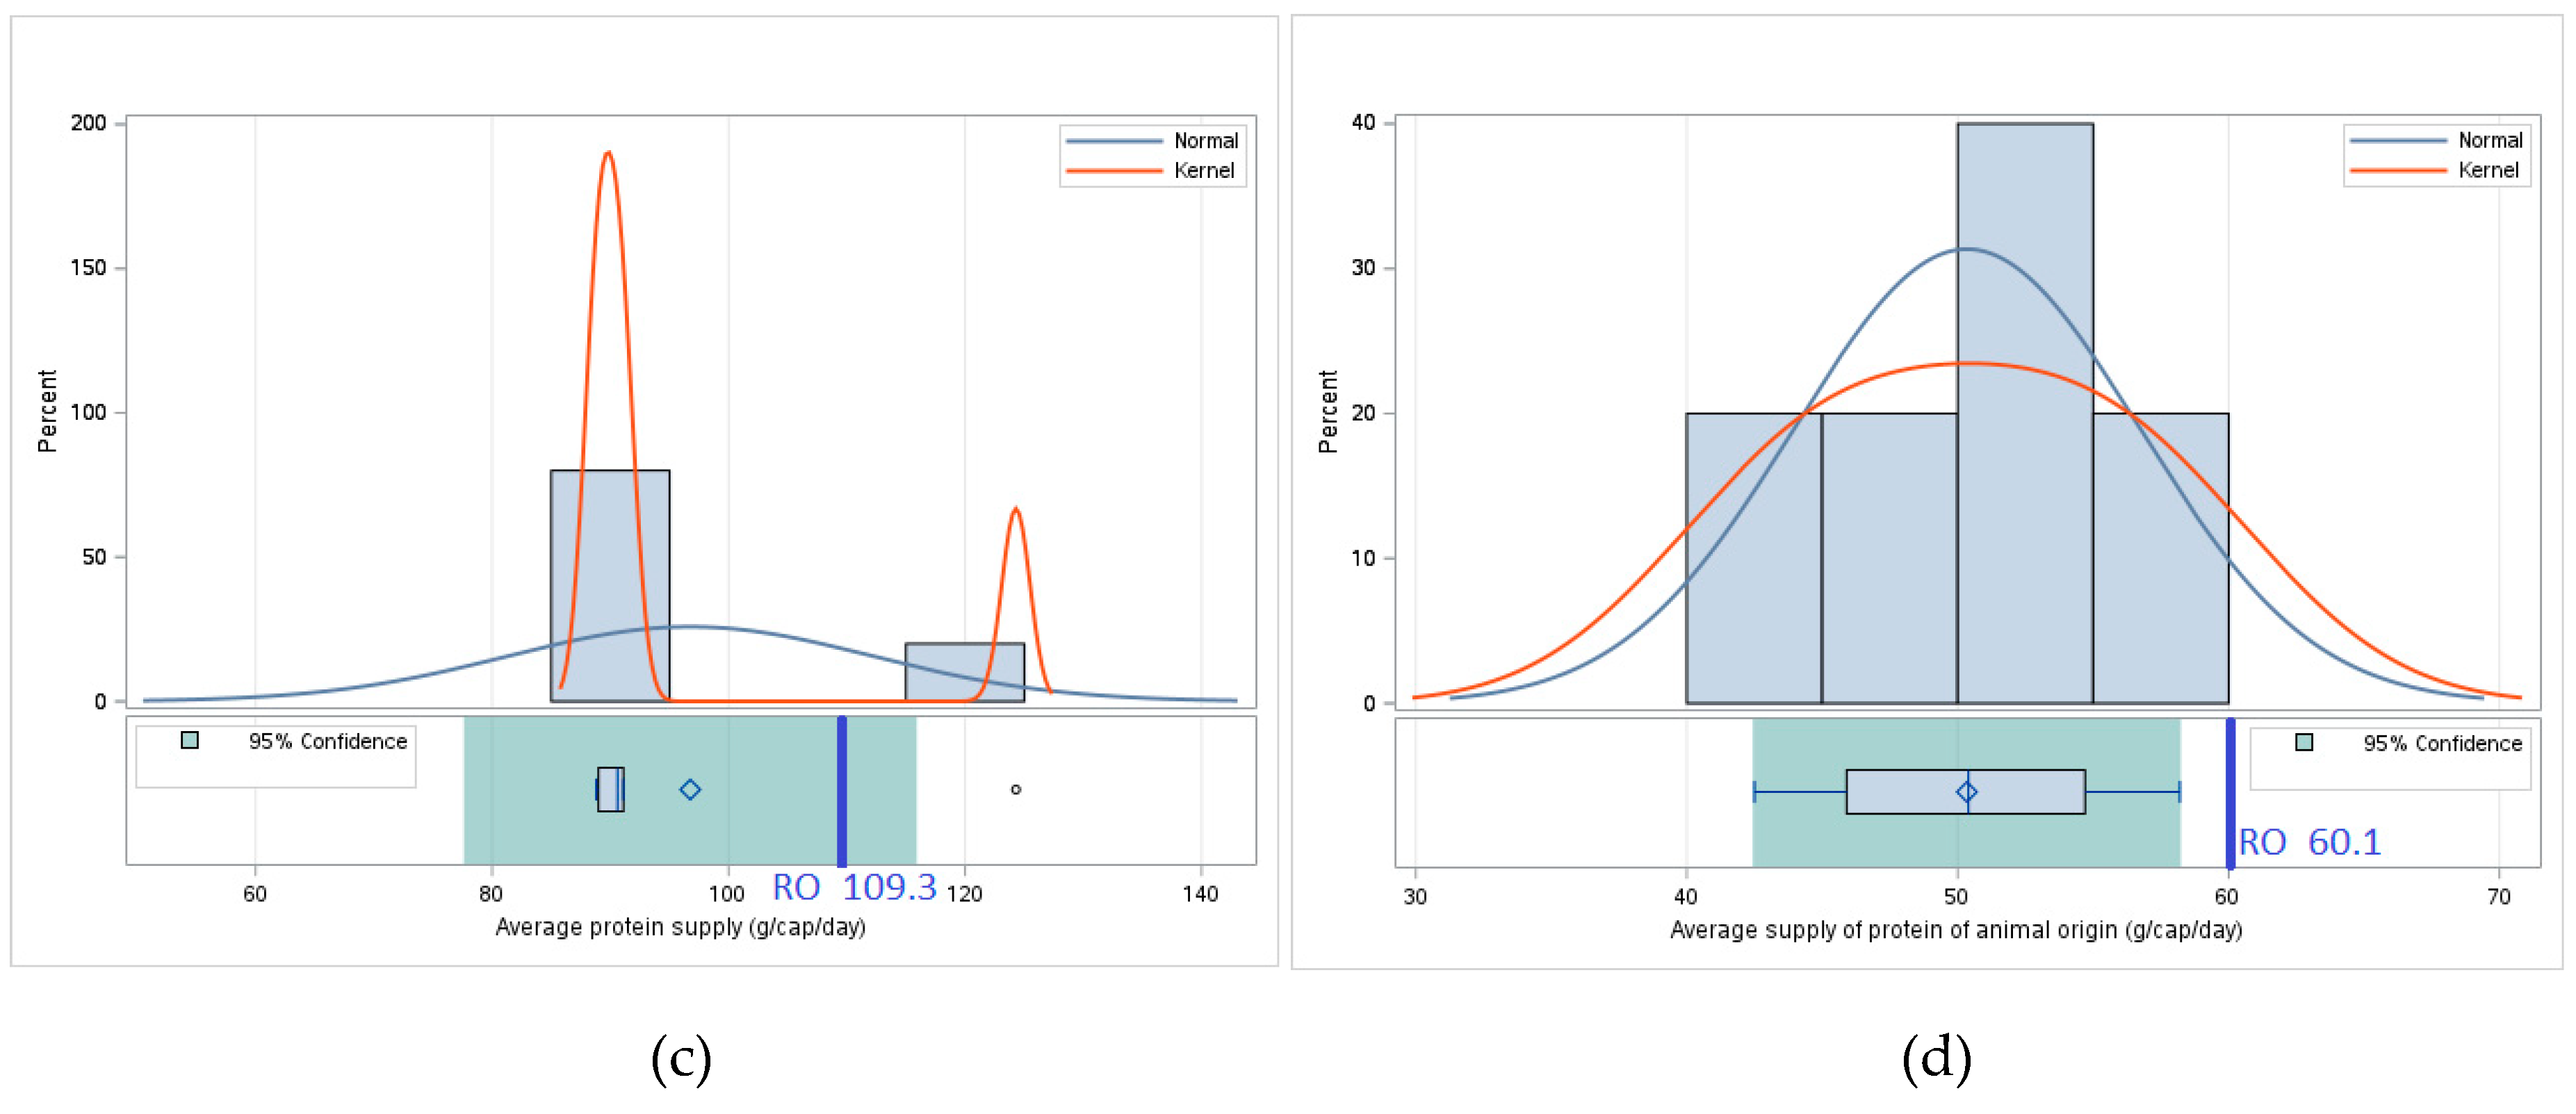
Figure 6.
Distribution of values for Pillar II - Access indicator suite, in Romania's neighboring countries, respectively the value of the indicator in Romania (RO): (a) Average dietary energy supply adequacy (%); (b) Share of dietary energy supply derived from cereals, roots and tubers (%); (b) Average protein supply (g/head/day); (d) Average supply of protein of animal origin (g/cap/day).
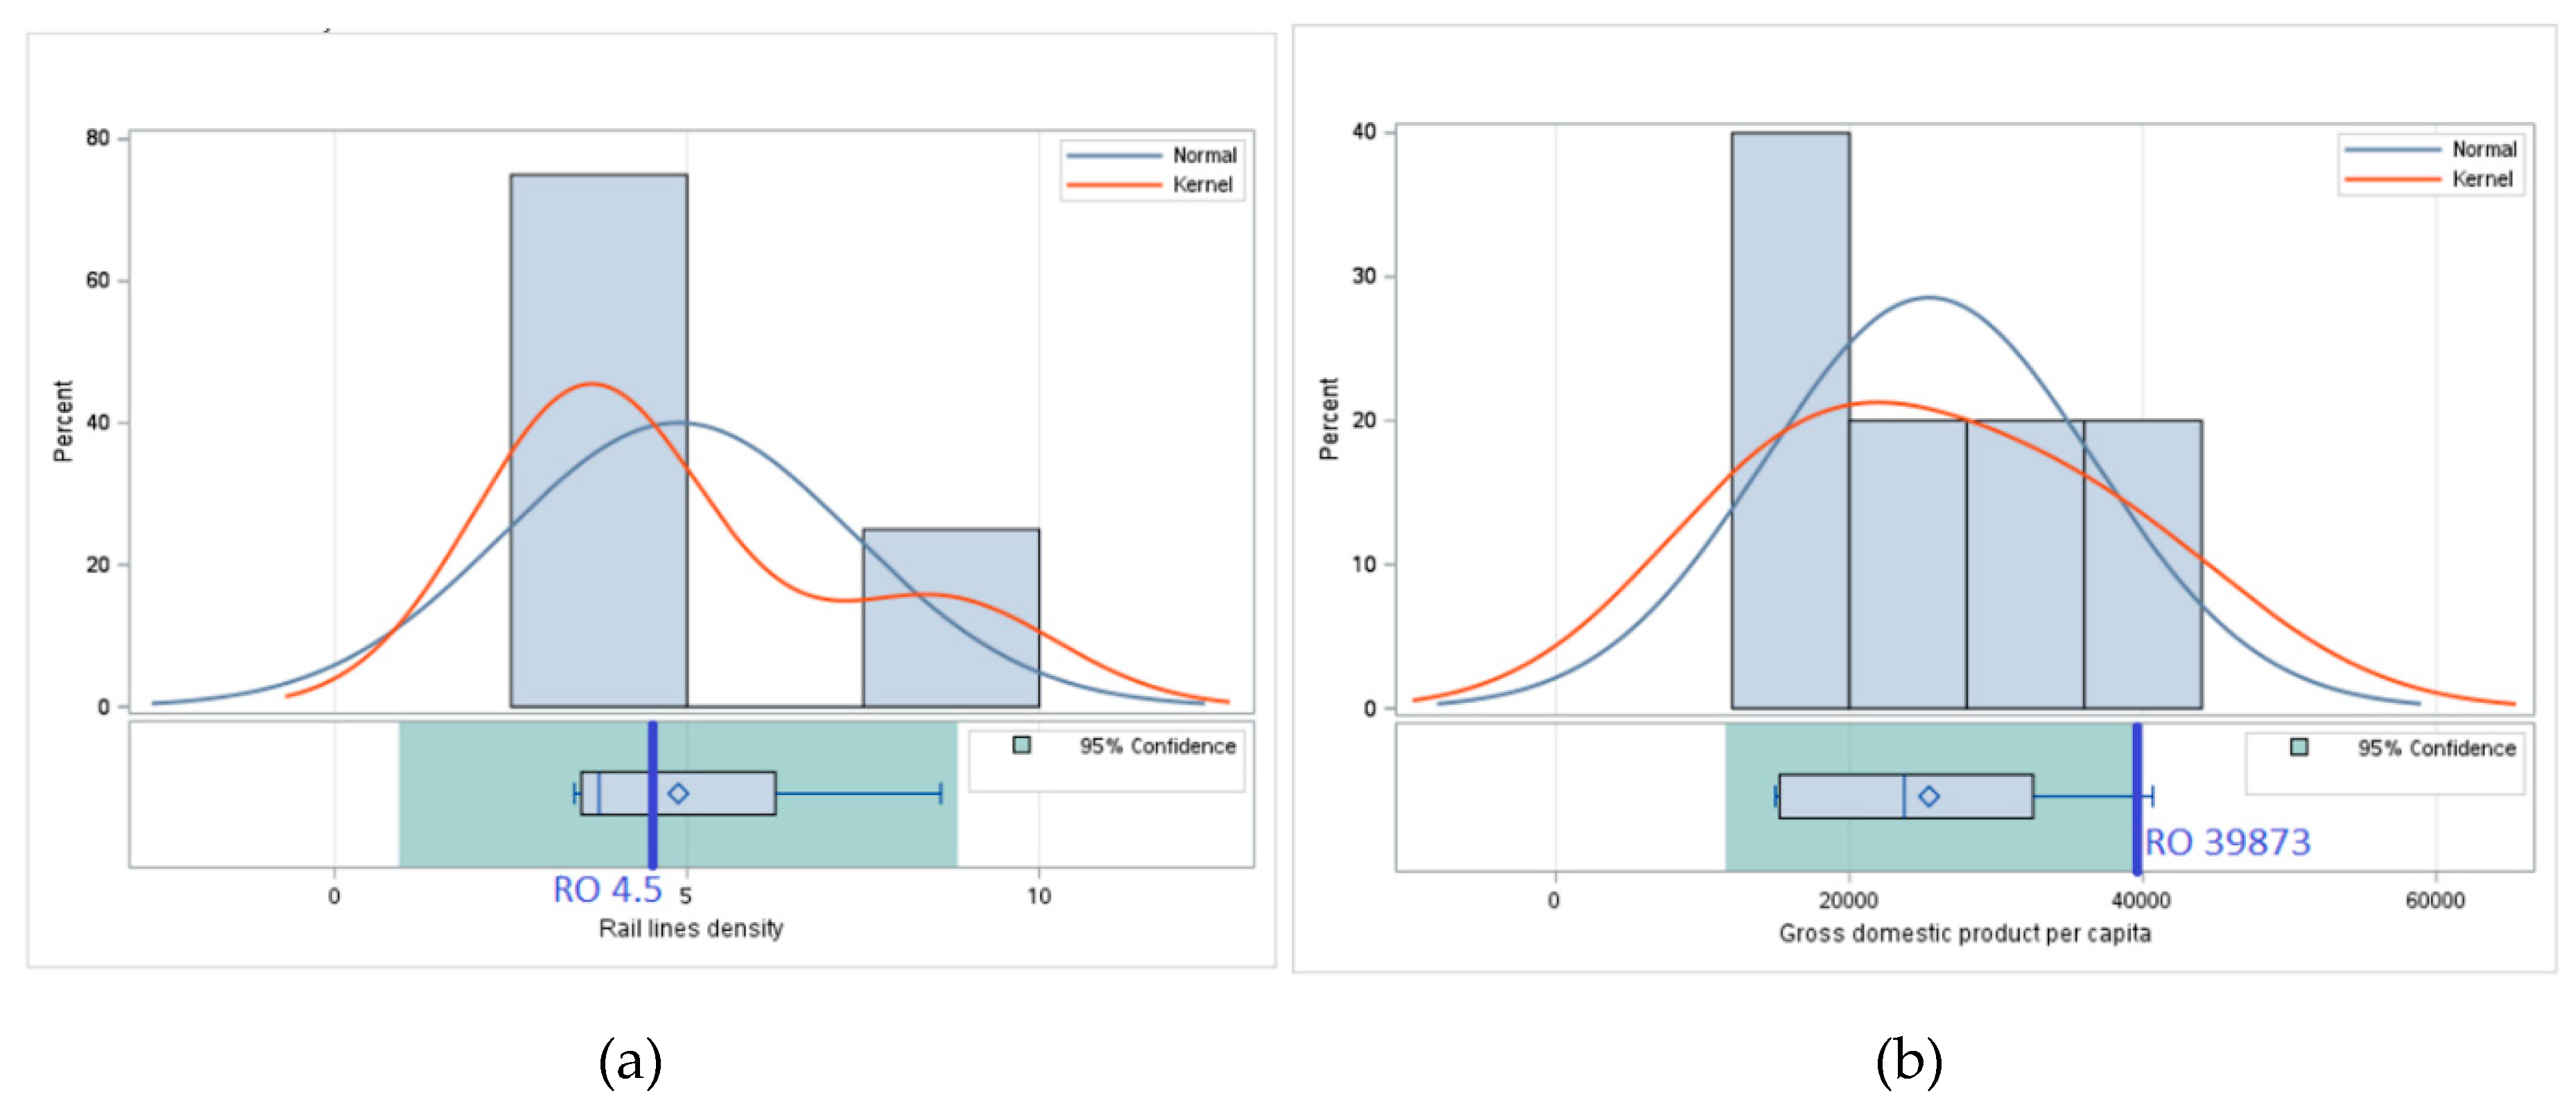
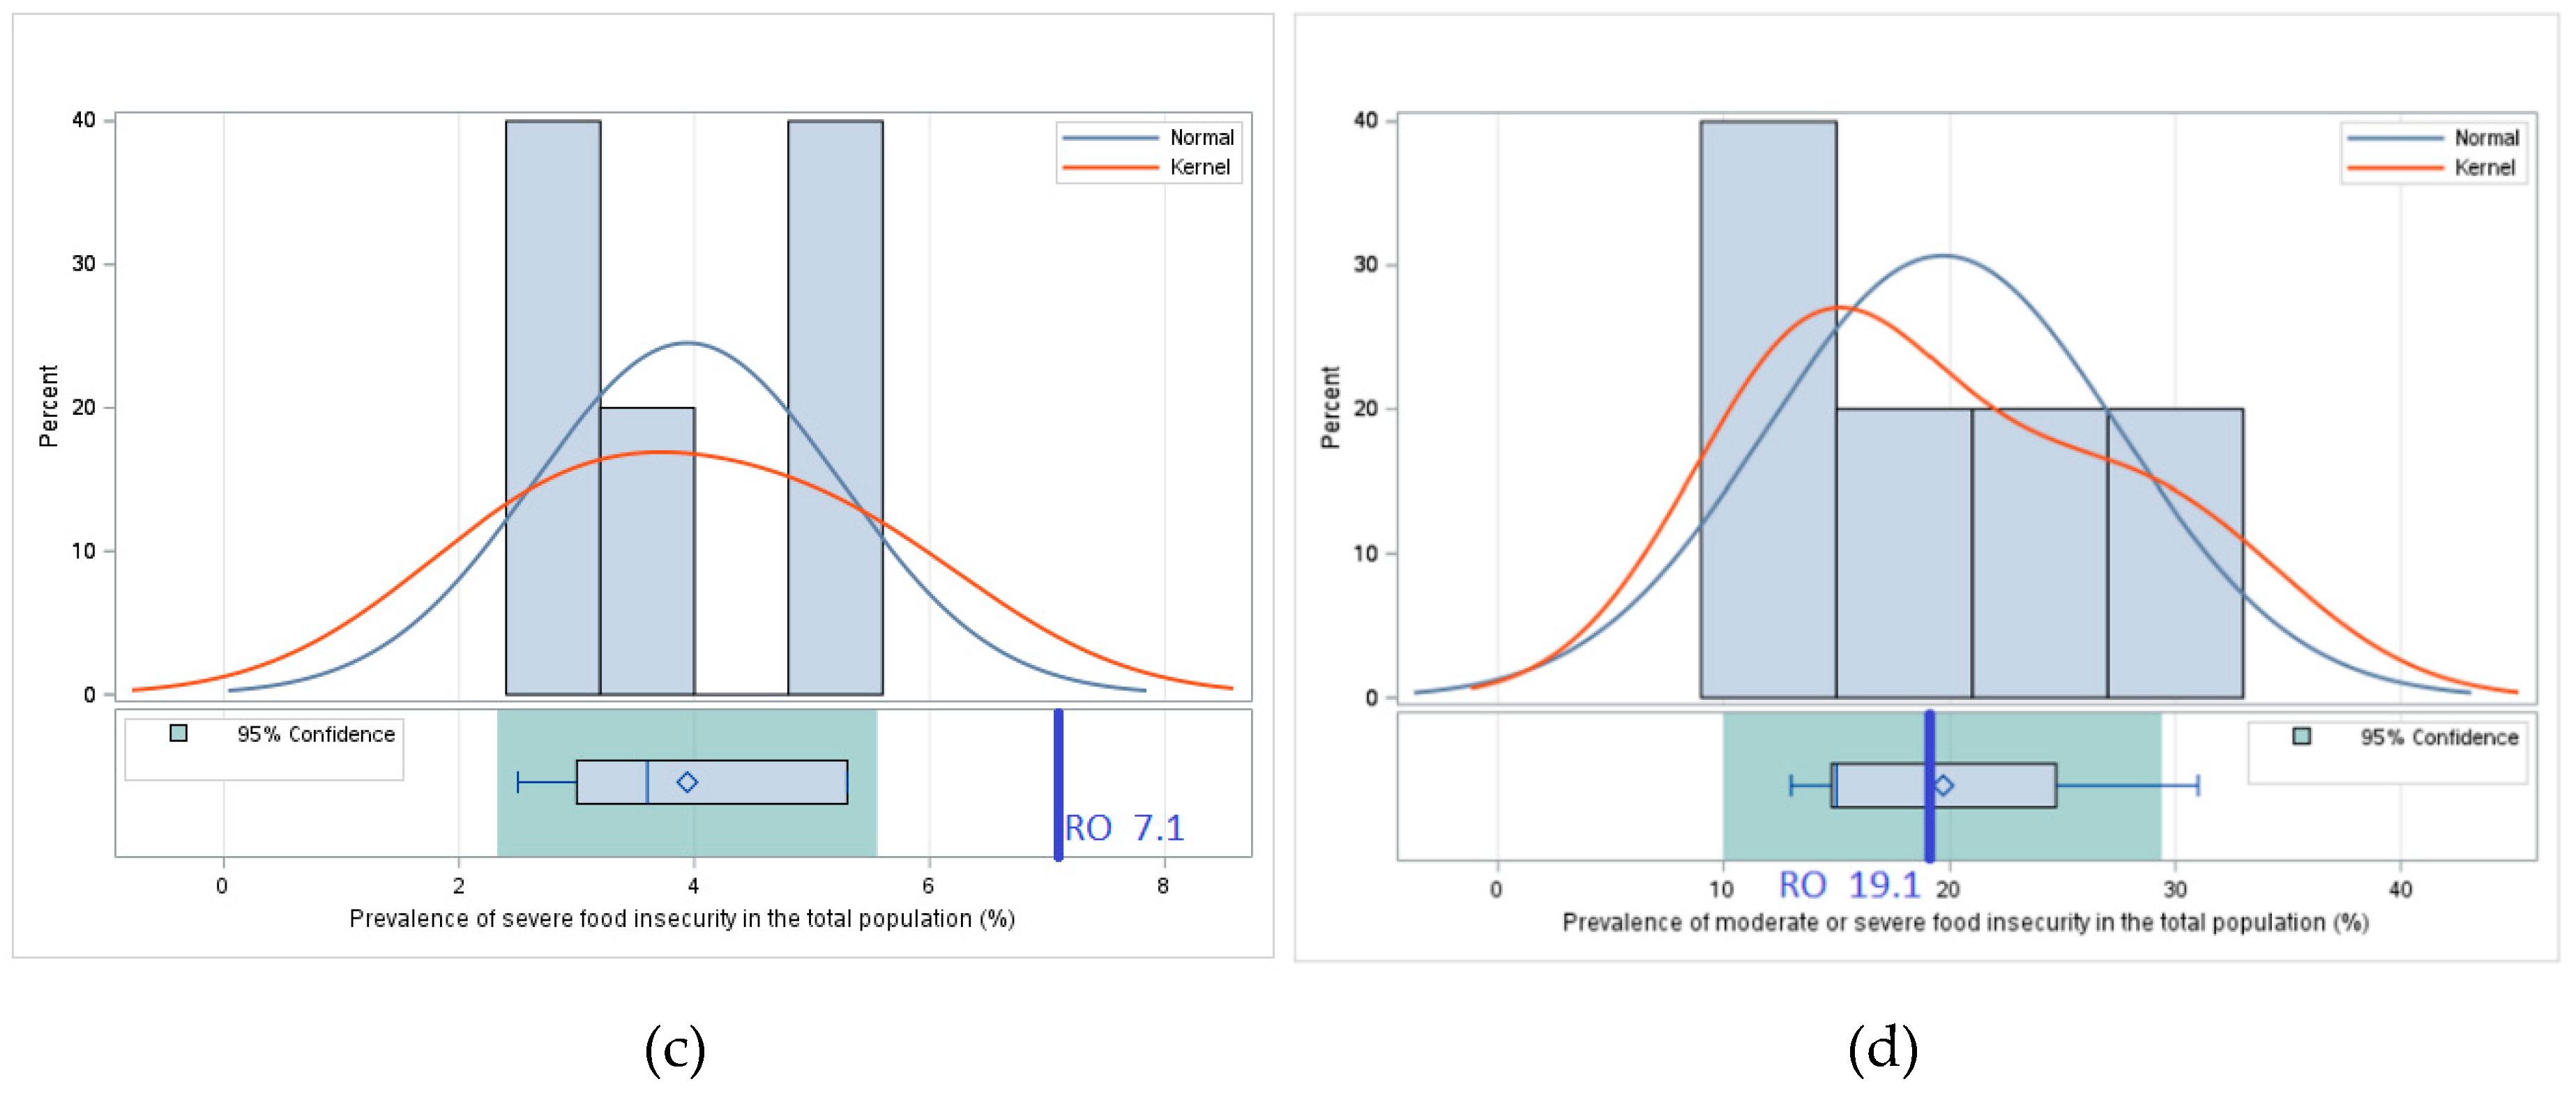
Figure 7.
Distribution of values for Pillar III - Stability indicator suite, in Romania's neighboring countries, respectively the value of the indicator in Romania (RO) :(a) Rail lines density (total route in km per 100 square km of land area); (b) Gross domestic product per capita, PPP, (constant 2017 international $); (c) Prevalence of severe food insecurity in the total population (%); (d) Prevalence of moderate or severe food insecurity in the total population (%).
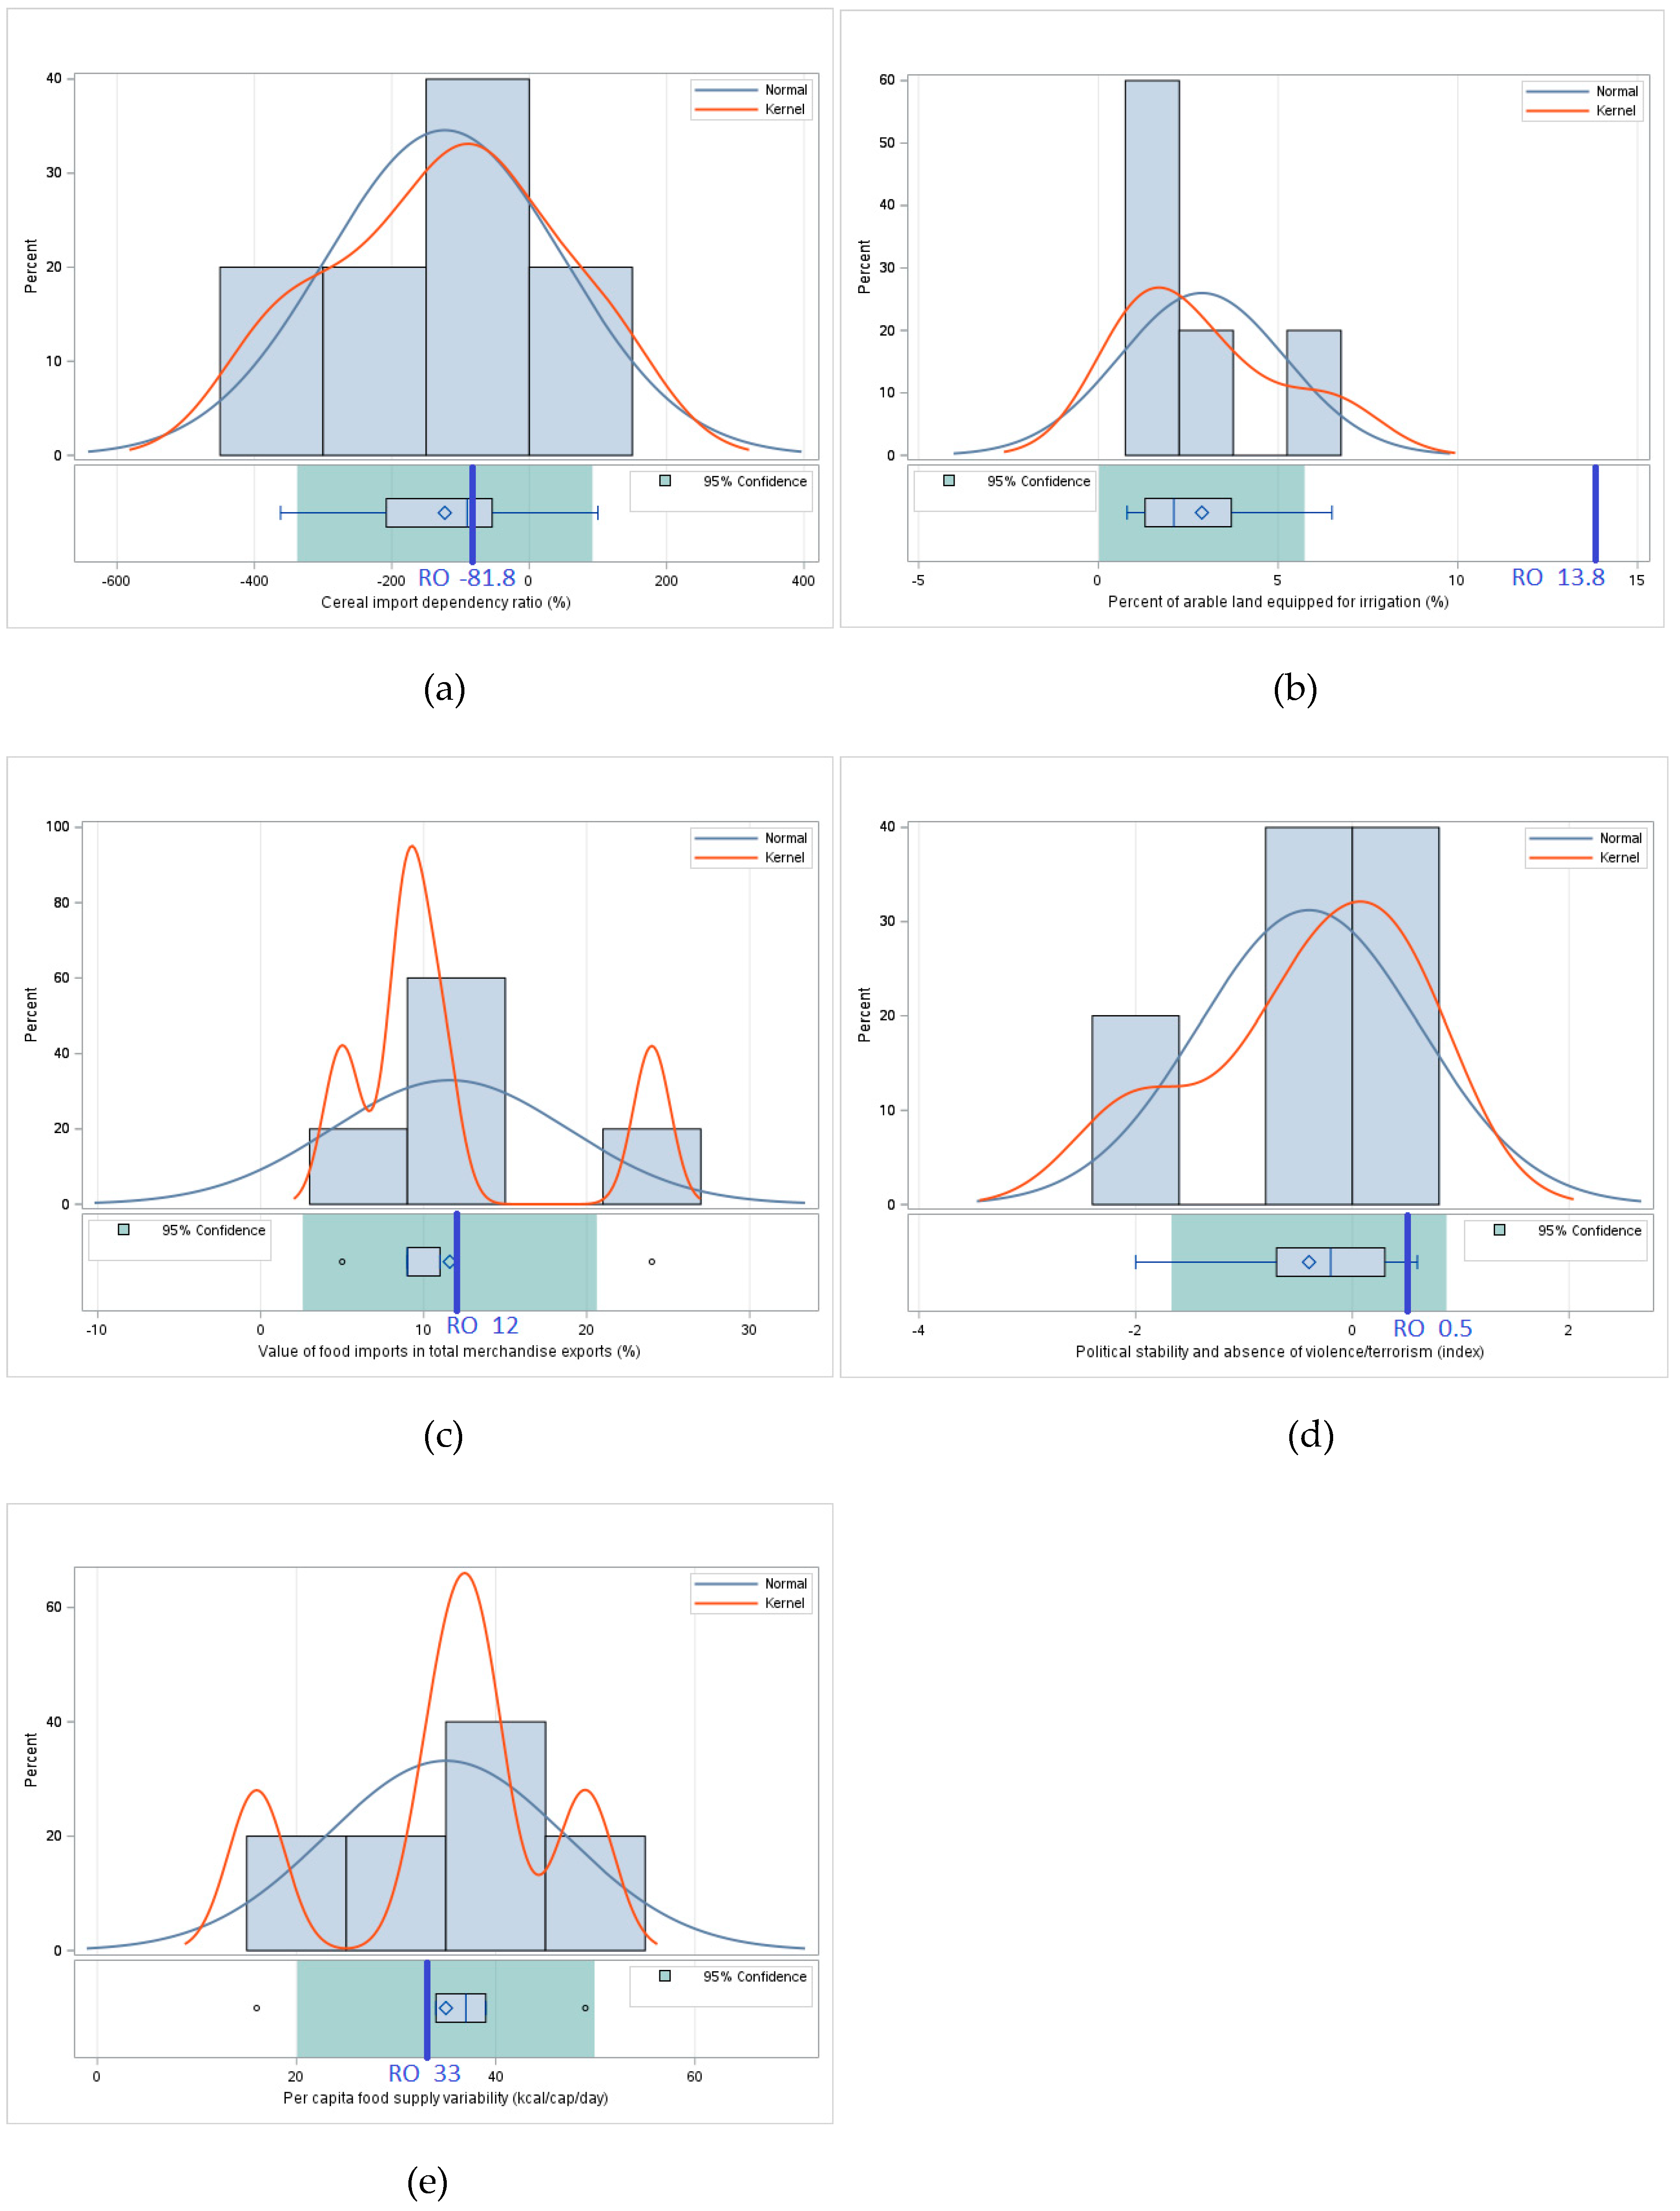
Figure 8.
Distribution for values for Pillar IV indicator suite - Utilization, in Romania's neighboring countries, respectively the value of the indicator in Romania (RO):(a) Percentage of population using safely managed drinking water services (%); (b) Percentage of population using at least basic drinking water services (%); (c) Percentage of population using safely managed sanitation services (%); (d) Percentage of population using at least basic sanitation services (%); (e) Percentage of children under 5 years of age who are stunted (modeled estimates) (%); (f) Percentage of children under 5 years of age who are overweight (modeled estimates) (%); (g) Prevalence of obesity in the adult population (18 years and older) (%); (h) Prevalence of anemia among women of reproductive age (15-49 years) (%); (i) Prevalence of low birth weight (%).
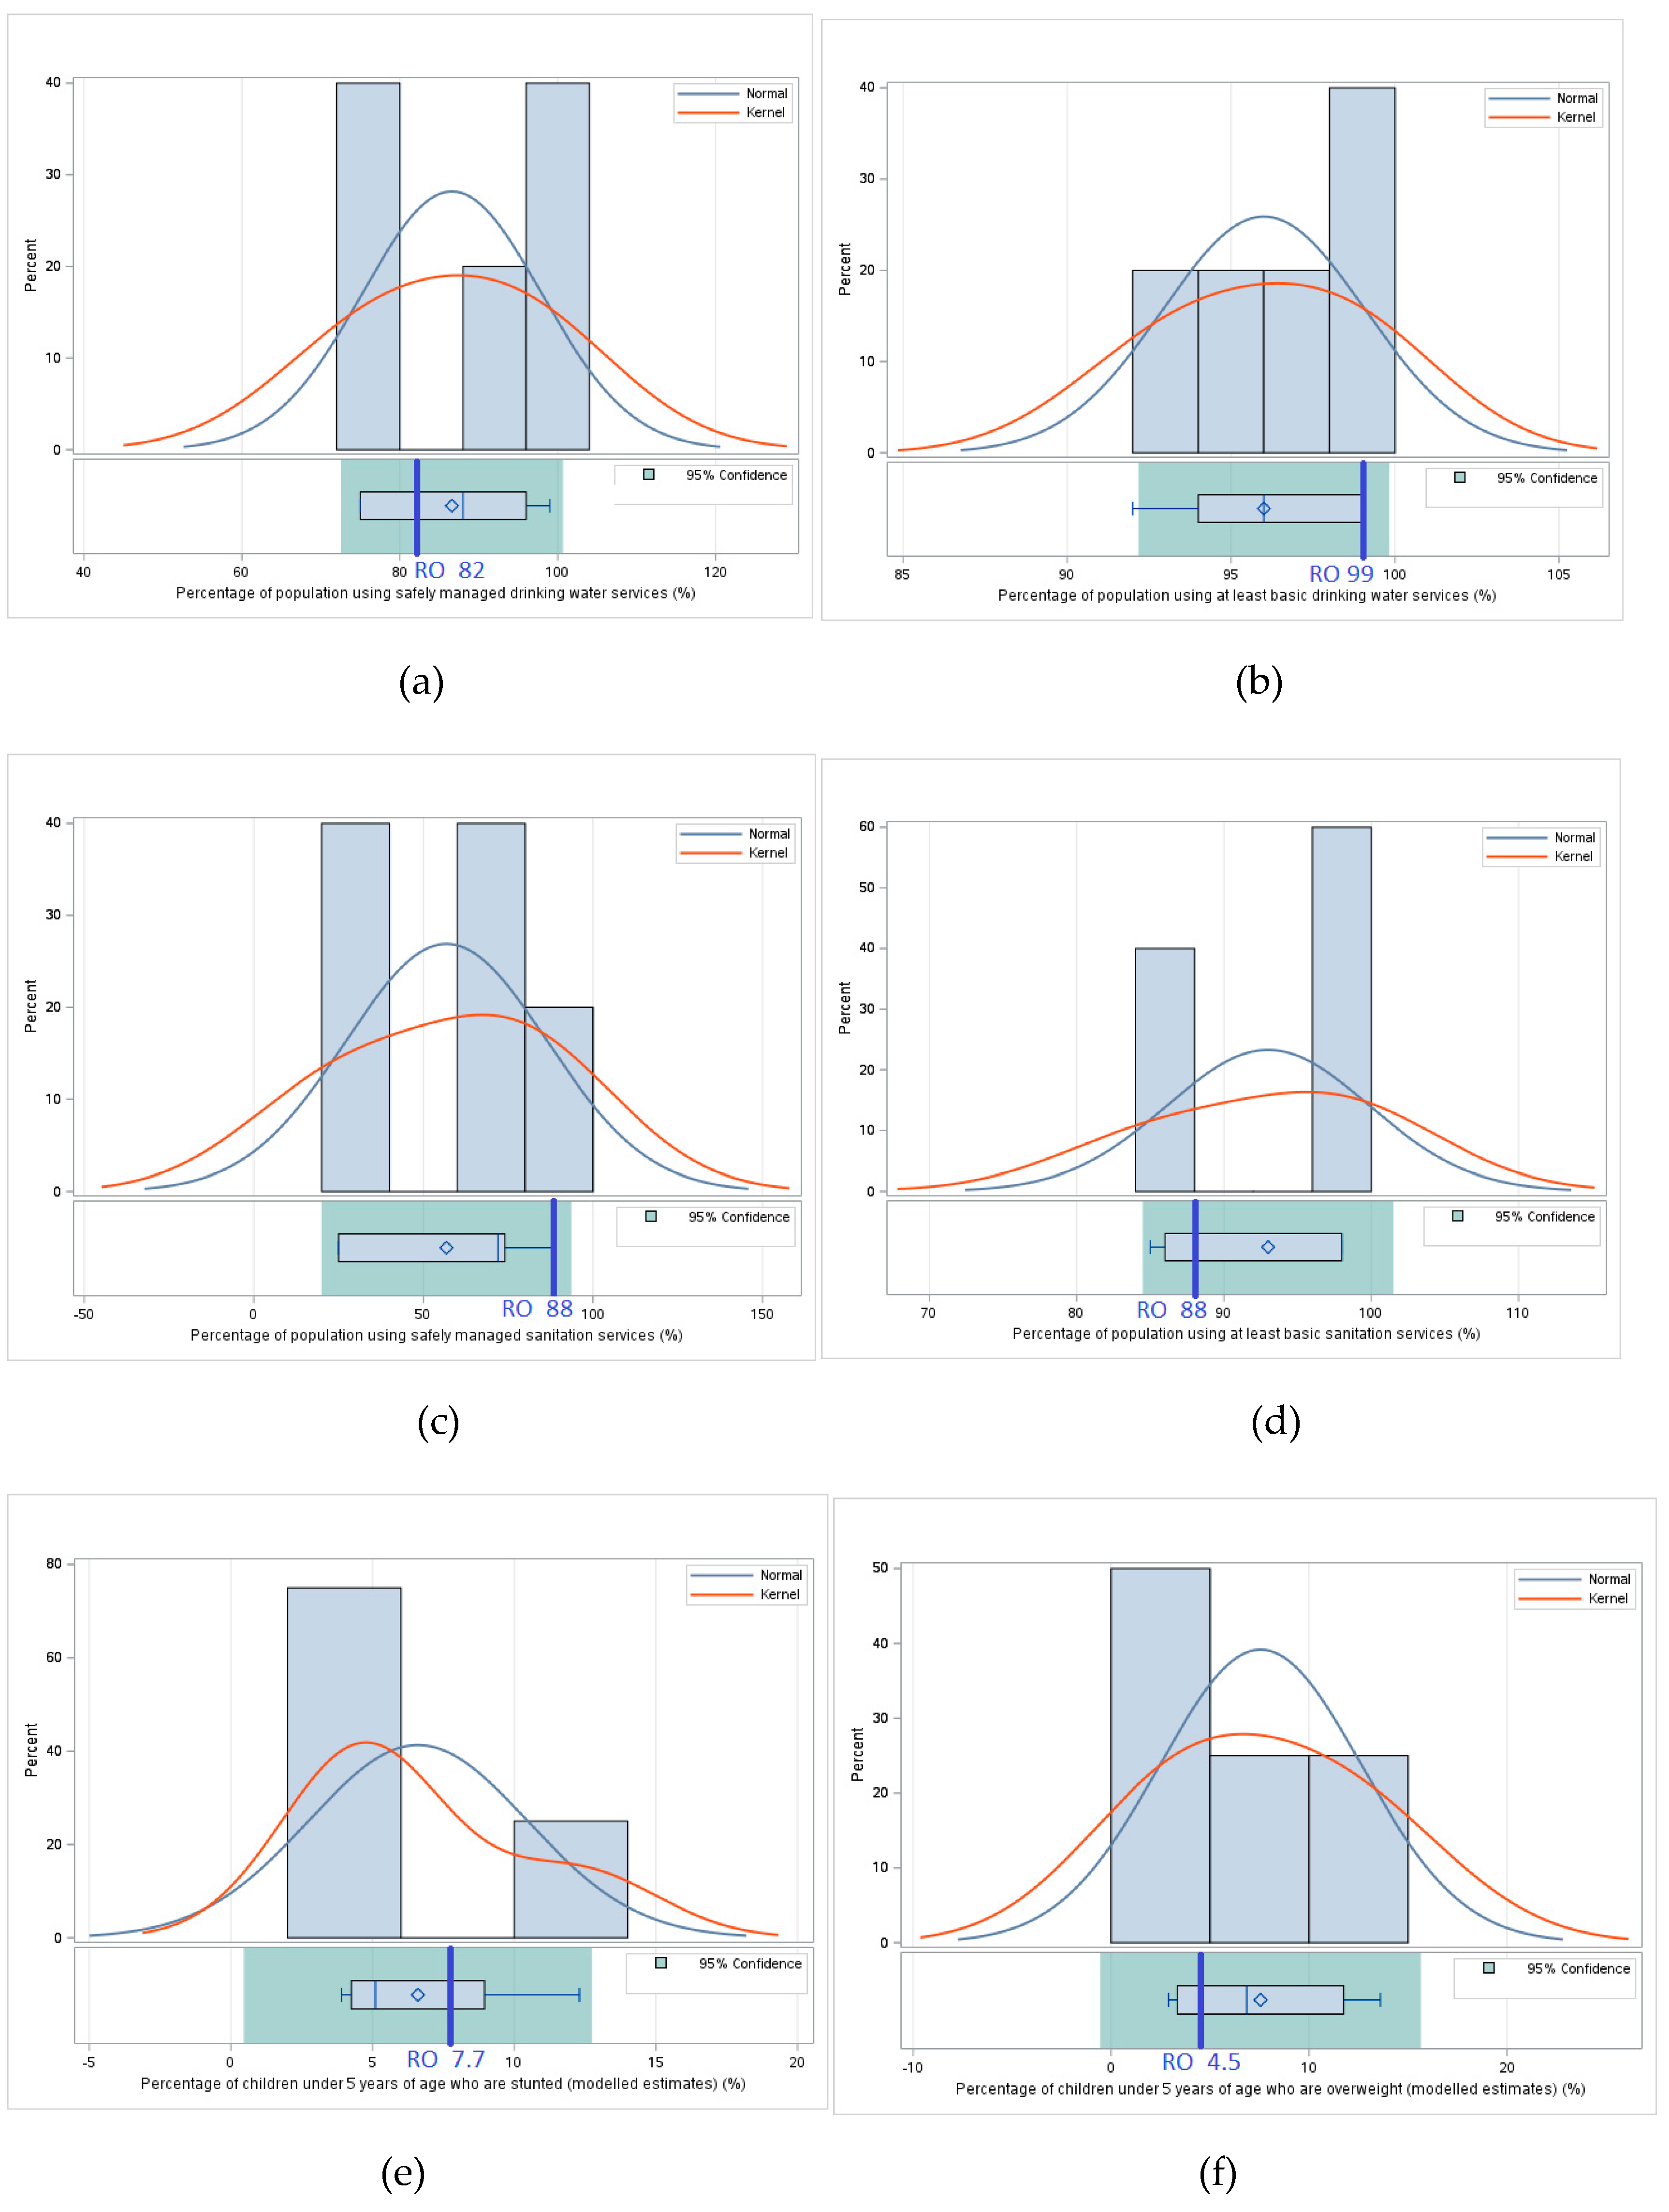
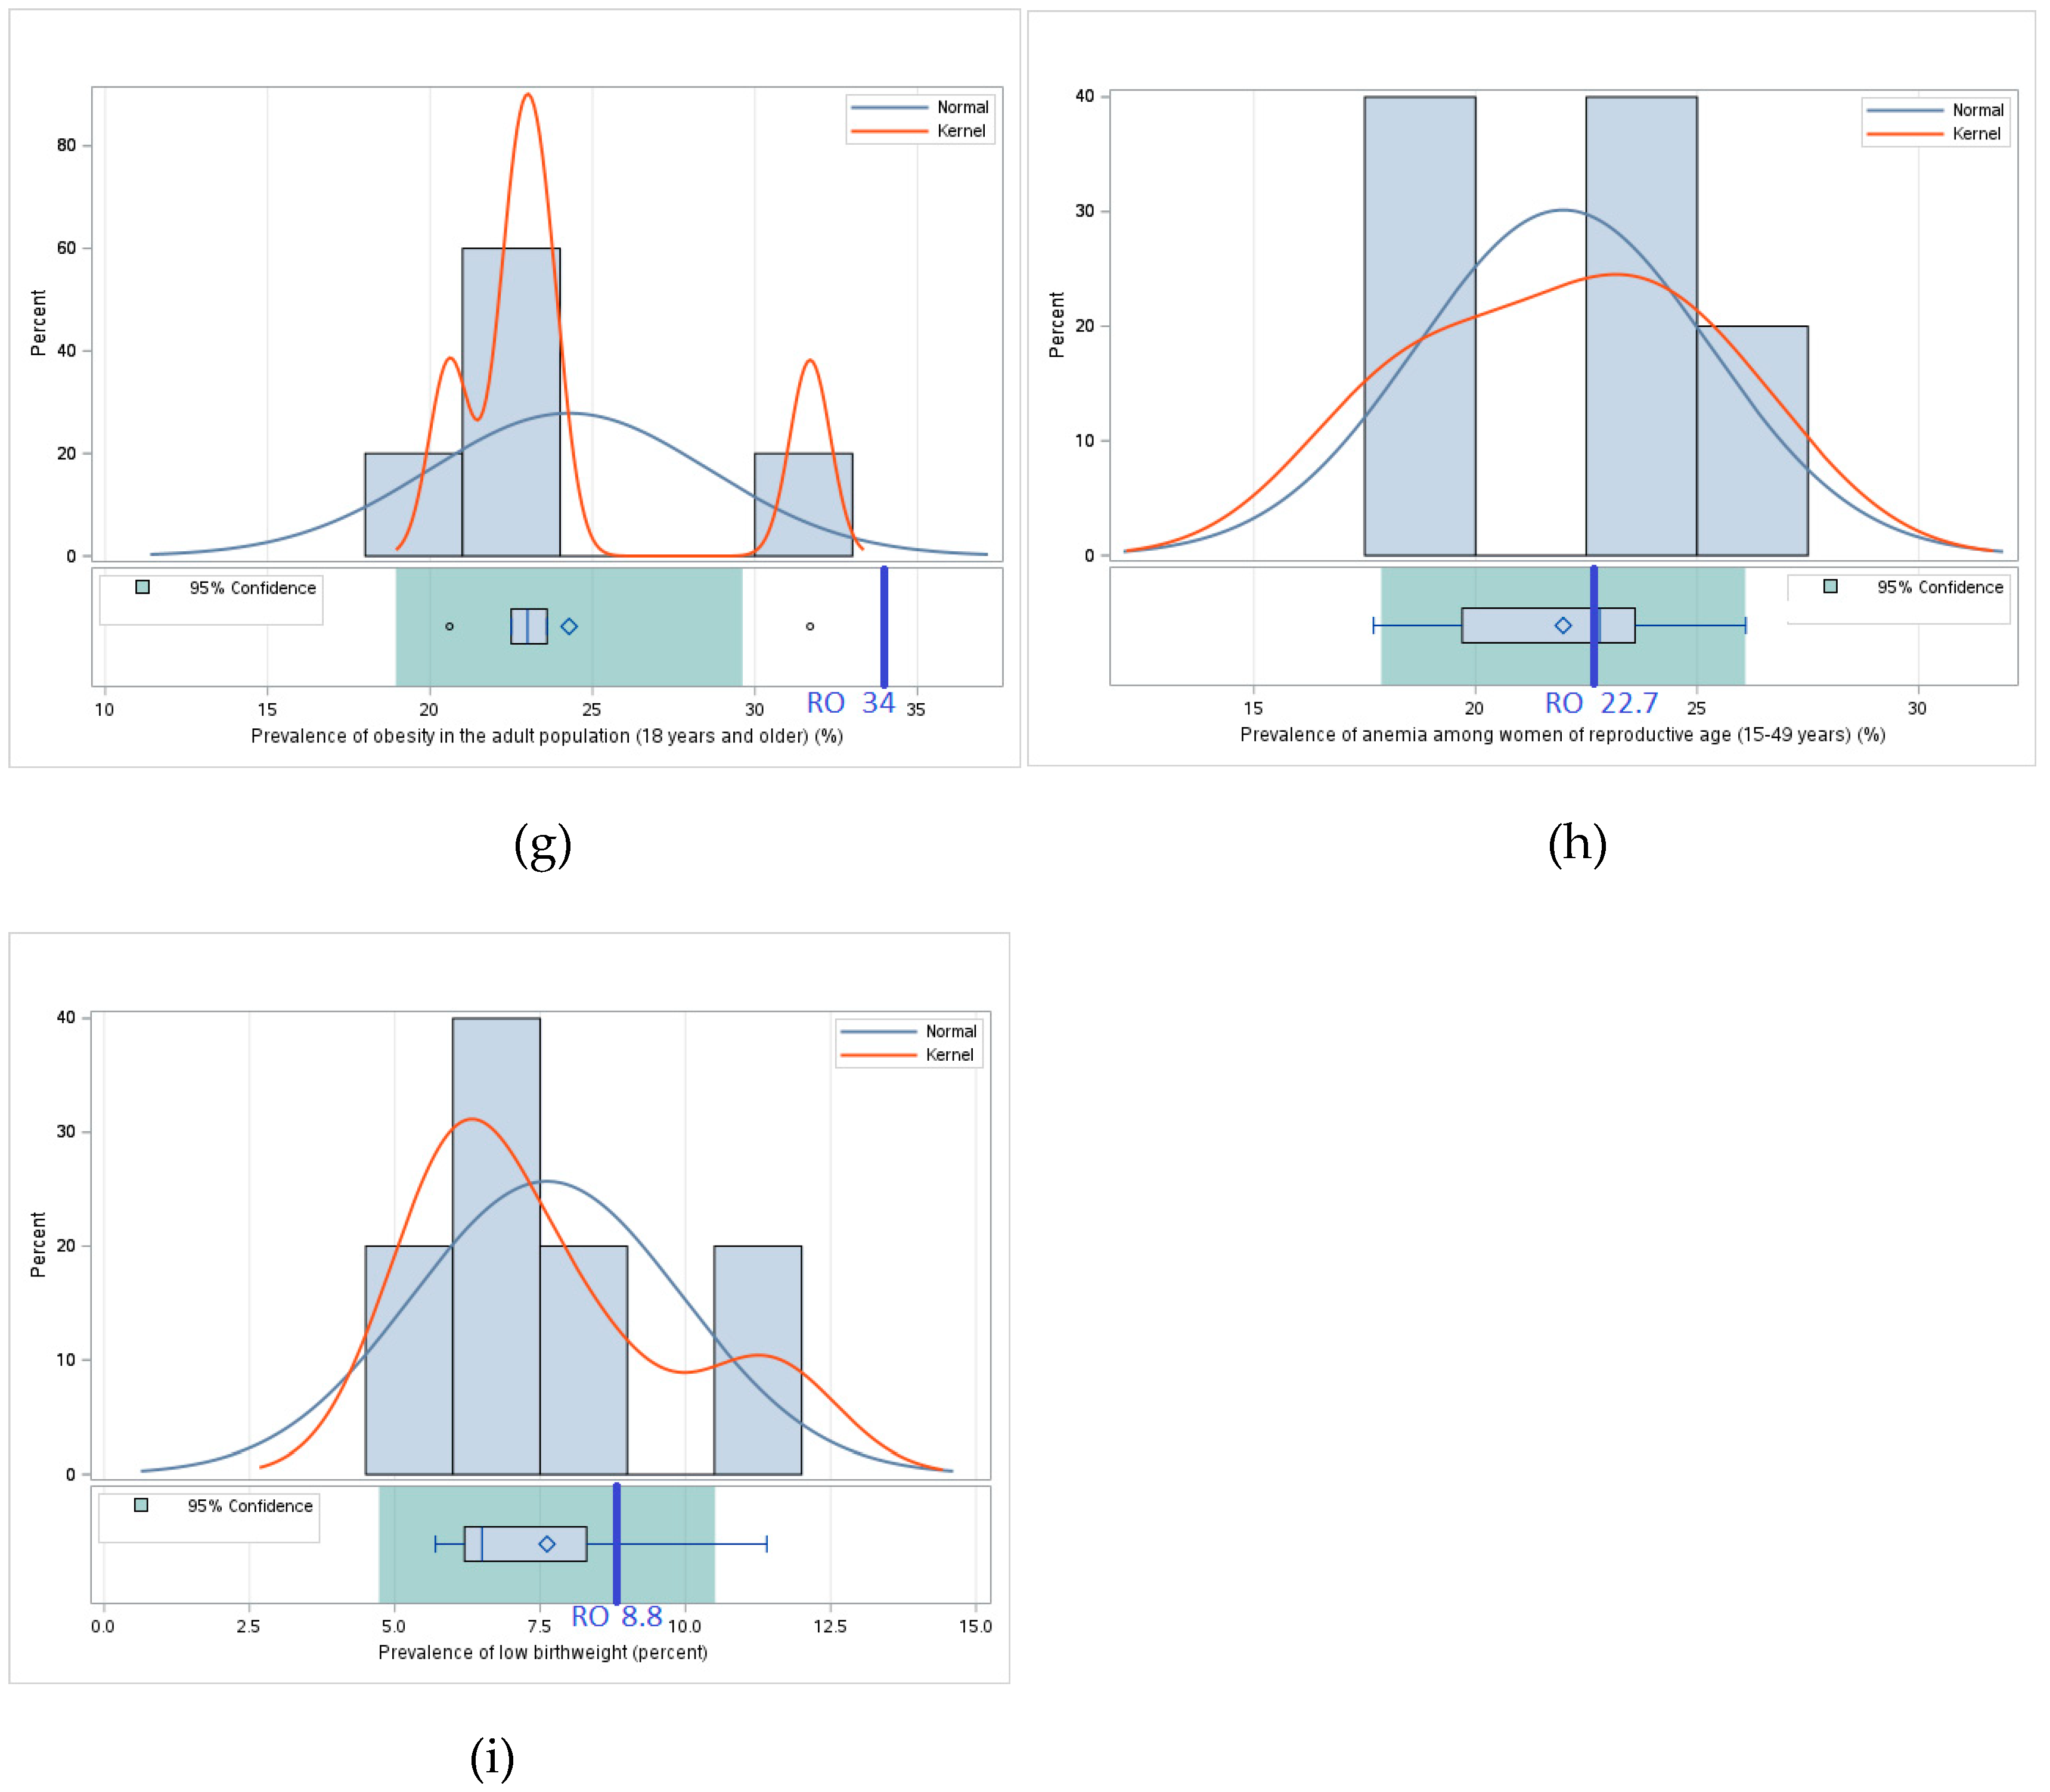
Figure 9.
Improving scheme for food security in Romania and neighboring countries. Source: Authors own interpretation by [35].
Figure 9.
Improving scheme for food security in Romania and neighboring countries. Source: Authors own interpretation by [35].
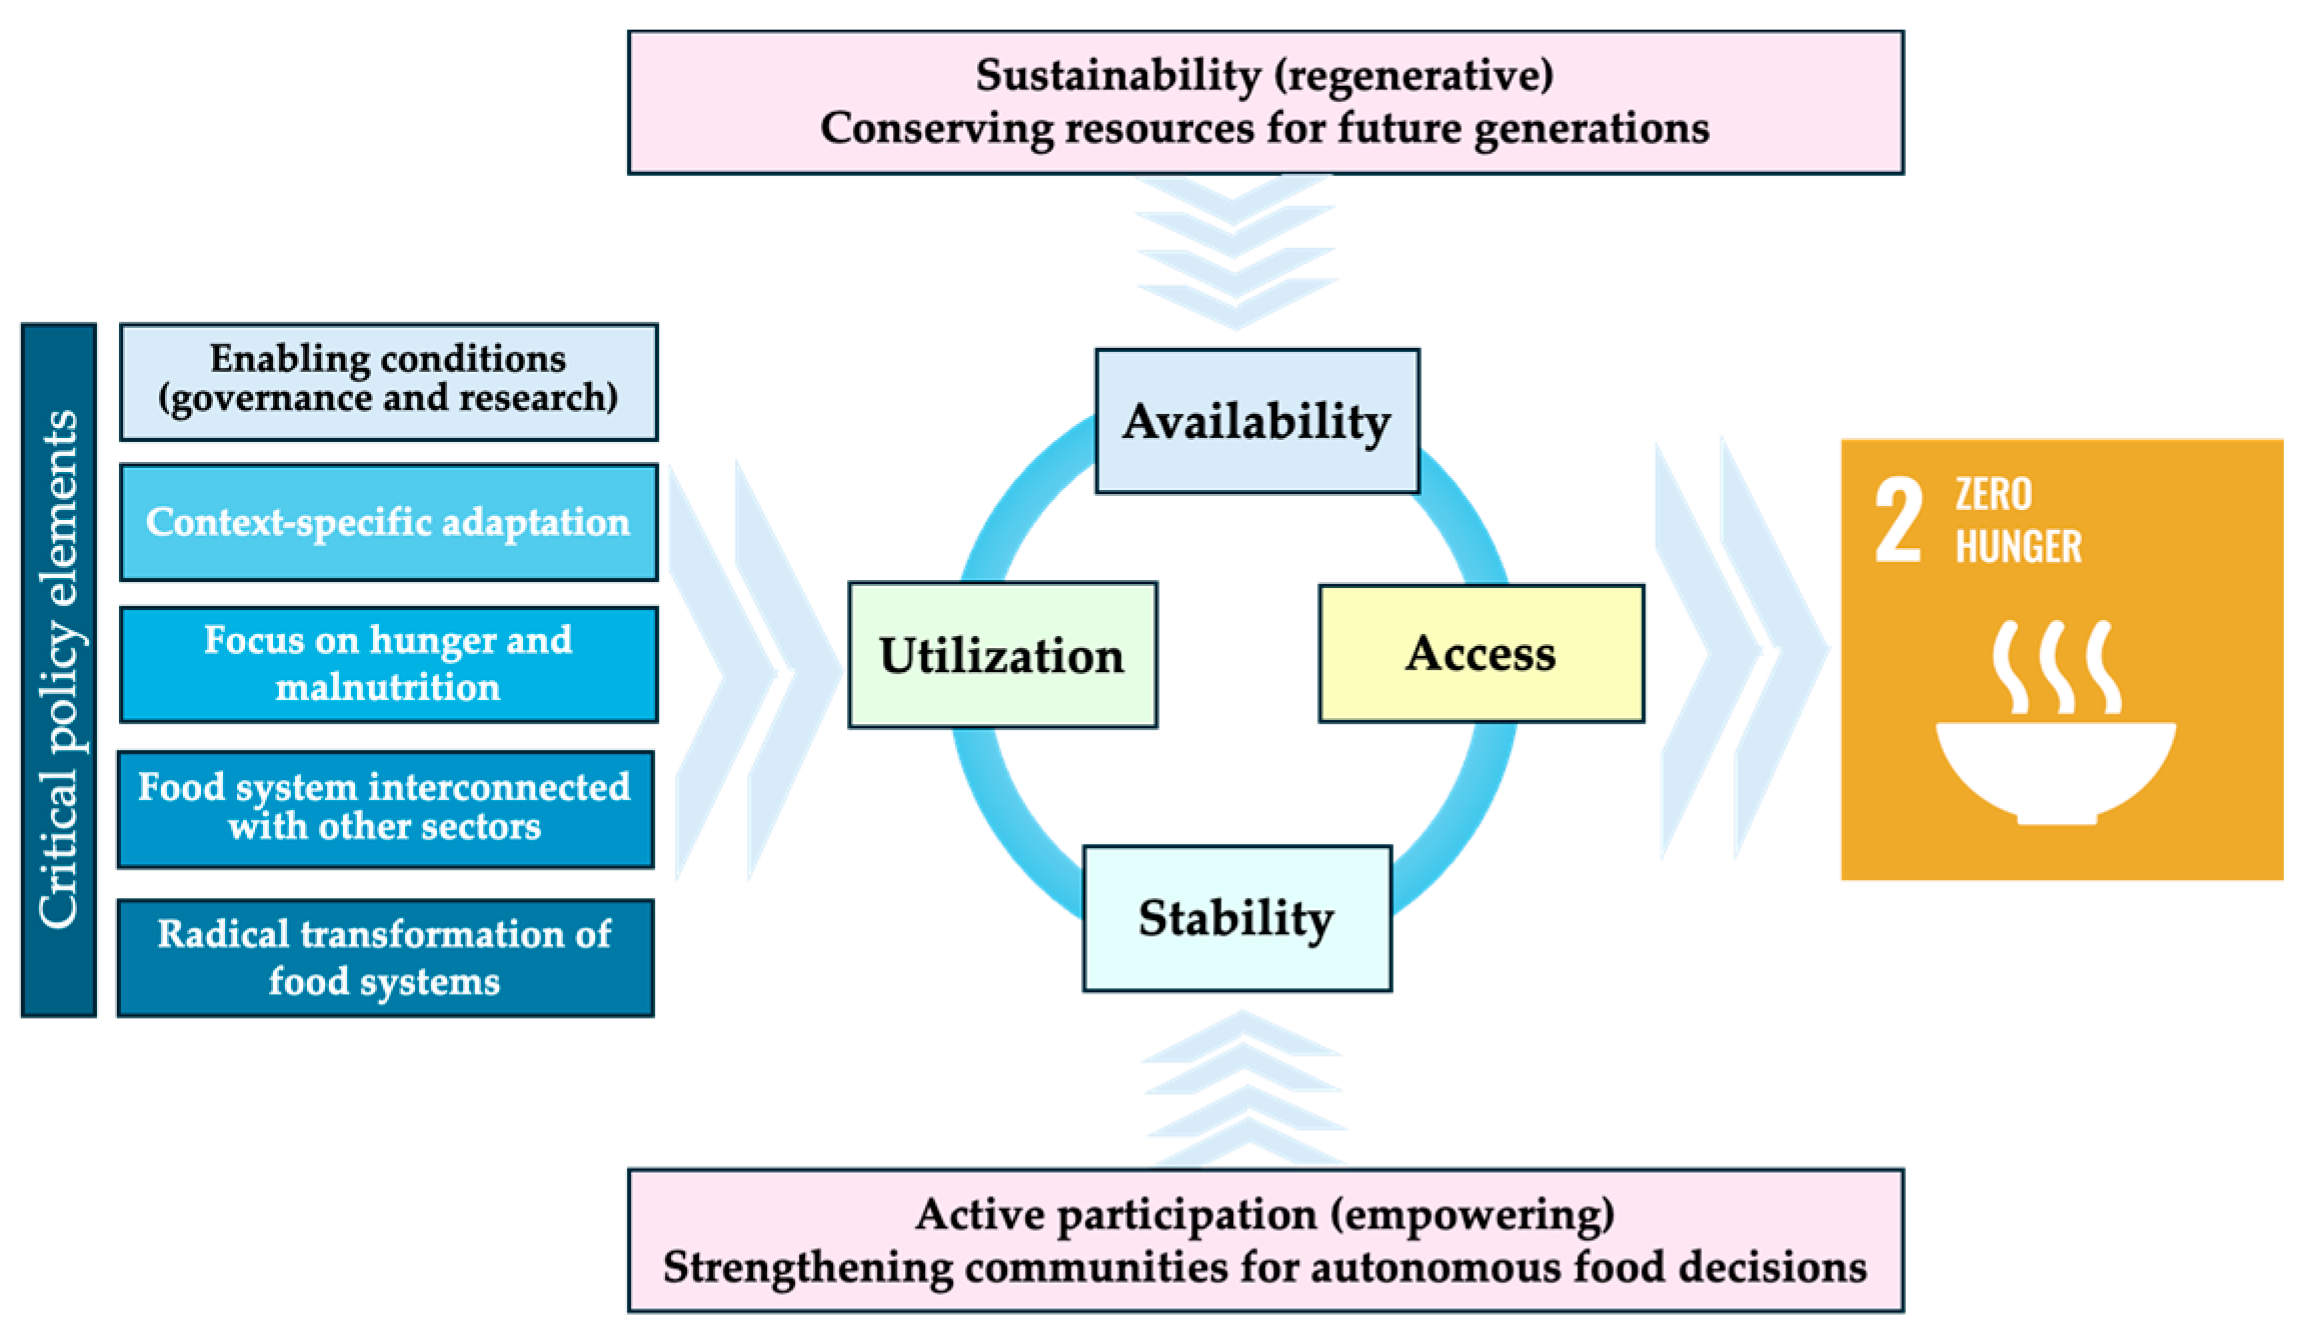
Table 1.
Food security indicators and reporting years [6].
Table 1.
Food security indicators and reporting years [6].
| PILLARS and suites of indicators |
Year/Annual average from the range |
|---|---|
| Pillar I - Availability | |
| Average dietary energy supply adequacy | 2021-2023 |
| Share of dietary energy supply derived from cereals, roots and tubers | 2020-2022 |
| Average protein supply | 2020-2022 |
| Average supply of protein of animal origin | 2020-2022 |
| Pillar II - Access | |
| Rail lines density (total route in km per 100 square km of land area) | 2021 |
| Gross domestic product per capita (in purchasing power equivalent) | 2022 |
| Prevalence of undernourishment, 3-year averages | 2021-2023 |
| Prevalence of undernourishment, yearly estimates | 2021-2023 |
| Prevalence of severe food insecurity in the total population, 3-year averages | 2021-2023 |
| Prevalence of severe food insecurity in the total population, yearly estimates | 2021-2023 |
| Prevalence of moderate or severe food insecurity in the total population, 3-year averages | 2021-2023 |
| Prevalence of moderate or severe food insecurity in the total population, yearly estimates | 2021-2023 |
| Pillar III - Stability | |
| Cereals imports dependency rate | 2020-2022 |
| Percent of arable land equipped for irrigation | 2020-2022 |
| Value of food imports over total merchandise exports | 2020-2022 |
| Political stability and absence of violence/terrorism | 2022 |
| Per capita food supply variability | 2023 |
| Pillar IV - Utilization | |
| People using at least basic drinking water services | 2022 |
| People using safely managed drinking water services | 2022 |
| People using at least basic sanitation services | 2022 |
| People using safely managed sanitation services | 2022 |
| Percentage of children under 5 years of age affected by wasting | 2019 |
| Percentage of children under 5 years of age who are stunted | 2022 |
| Percentage of children under 5 years of age who are overweight | 2022 |
| Prevalence of obesity in the adult population (18 years and over) | 2022 |
| Prevalence of anemia in women of reproductive age (15-49 years) | 2019 |
| Prevalence of exclusive breastfeeding among infants aged 0-5 months | 2019 |
| Prevalence of low birthweight | 2020 |
Table 2.
Values for Pillar I – Availability indicators [6].
Table 2.
Values for Pillar I – Availability indicators [6].
| Indicators of Pillar I - Availability |
Average dietary energy supply adequacy (%) | Share of dietary energy supply derived from cereals, roots and tubers (%) | Average protein supply (g/cap/day) | Average supply of protein of animal origin (g/cap/day) |
|---|---|---|---|---|
| Bulgaria | 121 | 33 | 89.0 | 50.4 |
| Hungary | 132 | 28 | 90.6 | 54.7 |
| Moldavia | 121 | 36 | 88.8 | 42.5 |
| Romania | 146 | 37 | 109.3 | 60.1 |
| Serbia | 146 | 49 | 124.3 | 58.2 |
| Ukraine | 116 | 43 | 91.1 | 45.9 |
| Indicators of Pillar II - Access | Rail line density (total route in km per 100 square km of land area) | Gross domestic product (GDP) per capita, PPP, (constant 2017 international $) | Prevalence of undernourishment (%) | Number of people undernourished (mil.) | Prevalence of severe food insecurity in the total population (%) | Prevalence of moderate or severe food insecurity in the total population (%) | Number of severely food insecure people (mil.) | Number of moderately or severely food insecure people (mil.) |
|---|---|---|---|---|---|---|---|---|
| Bulgaria | 3.6 | 32511.8 | <2.5 | - | 2.5 | 14.8 | 0.2 | 1.0 |
| Hungary | 8.6 | 40683.9 | <2.5 | - | 3.6 | 15.0 | 0.4 | 1.5 |
| Moldavia | 3.4 | 15229.5 | <2.5 | - | 5.3 | 24.7 | 0.2 | 0.8 |
| Romania | 4.5 | 39872.5 | <2.5 | - | 7.1 | 19.1 | 1.4 | 3.8 |
| Serbia | 3.9 | 23741.2 | <2.5 | - | 3.0 | 13.0 | 0.3 | 1.2 |
| Ukraine | - | 14950.5 | 5.8 | 2.3 | 5.3 | 31.0 | 2.1 | 12.4 |
- unreported.
Table 4.
Values of Pillar III - Stability indicators [6].
Table 4.
Values of Pillar III - Stability indicators [6].
| Indicators of Pillar III - Stability |
Cereal import dependency ratio (%) | Percent of arable land equipped for irrigation (%) | Value of food imports in total merchandise exports (%) | Political stability and absence of violence/terrorism (index) | Per capita food supply variability (kcal/cap/day) |
|---|---|---|---|---|---|
| Bulgaria | -208.0 | 1.3 | 11 | 0.3 | 16 |
| Hungary | -90.4 | 2.1 | 5 | 0.6 | 49 |
| Moldavia | 100.0 | 6.5 | 24 | -0.7 | 37 |
| Romania | -81.8 | 13.8 | 12 | 0.5 | 33 |
| Serbia | -53.9 | 0.8 | 9 | -0.2 | 39 |
| Ukraine | -361.9 | 3.7 | 9 | -2 | 34 |
Disclaimer/Publisher’s Note: The statements, opinions and data contained in all publications are solely those of the individual author(s) and contributor(s) and not of MDPI and/or the editor(s). MDPI and/or the editor(s) disclaim responsibility for any injury to people or property resulting from any ideas, methods, instructions or products referred to in the content. |
© 2025 by the authors. Licensee MDPI, Basel, Switzerland. This article is an open access article distributed under the terms and conditions of the Creative Commons Attribution (CC BY) license (http://creativecommons.org/licenses/by/4.0/).
Copyright: This open access article is published under a Creative Commons CC BY 4.0 license, which permit the free download, distribution, and reuse, provided that the author and preprint are cited in any reuse.


