
Submitted:
13 August 2024
Posted:
14 August 2024
You are already at the latest version
Preprints on COVID-19 and SARS-CoV-2
Abstract
Although extracorporeal membrane ventilation offers the possibility for low frequency ventilation, protocols commonly used in patients with acute respiratory distress syndrome (ARDS) and treated with extracorporeal membrane oxygenation (ECMO) vary largely. Whether strict adherence to low frequency ventilation offers benefit on important outcome measures is poorly understood. Background/Objectives: This pilot clinical study investigated the efficacy of low frequency ventilation on ventilator free days (VFDs) in patients suffering from ARDS treated with ECMO therapy. Methods: In this single-center randomized controlled trial, 44 (70% male) successive ARDS patients treated with ECMO (aged 56 ± 12 years, SAPS III 64 (SD ± 14)) were randomly assigned 1:1 to control group (conventional ventilation) or treatment group (low fre-quency ventilation during first 72 hours on ECMO: respiratory rate 4-5/min; PEEP 14-16cm H2O; plateau pressure 23-25 cm H2O, tidal volume: < 4mL/kg). The primary endpoint was VFDs at day 28 of ECMO start. The major secondary endpoint was ICU mortality, 28-day and 90-day mortality. Results Twenty-three (52%) patients could be successfully weaned from ECMO and were discharged from intensive care unit (ICU). Twelve patients in the treatment group and five patients in the control group showed more than one VFD at day 28 after ECMO. VFDs were 3.0 (SD ± 5.5) days in the control group and 5.4 (SD ± 6) days in the treatment group (P = 0.117). Until day 28 after ECMO initiation, patients in the treatment group could be more often successfully weaned from ventilator (OR of 0.164 of 0 VFDs at day 28 after ECMO start; 95% CI 0.036-0.758; P = 0.021). ICU mortality did not differ significantly (36% in treatment group and 59% in control group; P = 0.227). Conclusions: Low frequency ventilation is comparable to conventional protec-tive ventilation in patients with ARDS treated with ECMO. However, low frequency ventilation may support weaning from invasive mechanical ventilation in patients suffering from ARDS treated with ECMO therapy.
Keywords:
Acute respiratory distress syndrome
; Extracorporeal membrane oxygenation
; COVID-19
; Invasive mechanical ventilation
; Low frequency ventilation
1. Introduction
Acute respiratory distress syndrome (ARDS) can be caused by a variety of underlying conditions and frequently requires highly invasive mechanical ventilation (IMV) [1]. Application of high plateau pressure levels or large tidal volumes in patients with ARDS may harm the lungs independently, a phenomenon referred to ventilator-induced lung injury (VILI). Involved pathomechanisms include barotrauma, atelectotrauma, volutrauma due to alveolar overdistension, and biotrauma due to an excessive inflammatory response [2,3]. Limiting plateau and driving pressures as well as tidal volumes (TV) has been shown to reduce mortality [4,5,6]. Aside from prone positioning, muscle relaxation, high-dose steroids, recruitment maneuvers and nitric oxide (NO) inhalation, extracorporeal membrane oxygenation (ECMO) serves as an “ultima ratio” intervention in patients with severe ARDS and refractory hypoxemia [7,8,9]. During the coronavirus disease 2019 (COVID-19) pandemic, ECMO globally gained importance beyond rescue situations. Irrespective of the cause for ARDS, there are no clear recommendations for mechanical ventilation strategies for patients on ECMO [10,11]. ECMO permits a wide range of possible ventilation approaches including the application of extremely low TVs and pressure limits. Apart from some promising results from preclinical studies, it remains undefined, whether approaches with ultra-low invasiveness are superior to conventional protective ventilation in the clinical setting. We therefore investigated the safety and efficacy of low frequency ventilation in patients receiving ECMO therapy for ARDS in a randomized clinical trial.
2. Materials and Methods
Study Design
In this randomized controlled clinical trial, we enrolled mechanically ventilated patients suffering from ARDS and treated with ECMO. Study sites were the Department of Anaesthesia, General Intensive Care and Pain Medicine and the Department of Medicine I of the Medical University of Vienna
Inclusion Criteria and Randomization
Patients were enrolled if their medical condition fulfilled the Berlin Definition for ARDS 12 and decision for ECMO treatment was made by treating physicians not involved in the conduct of this study. Inclusion criteria were defined as moderate to severe ARDS (PaO2/FiO2 < 200 mmHg) before ECMO start, ECMO < 24 h in situ and age > 18 years. Exclusion criteria were defined as BMI > 40 kg/m2, expected weaning of ECMO < 3 days, combustion, restrictive chest wall impairment and pregnancy. If patients fulfilled all inclusion criteria and no exclusion criteria occurred within 24h after initiation of ECMO, we assigned patients 1:1 either to treatment or control group by using block randomization provided to the Medical University of Vienna by the Randomization Service for Multicenter Clinical Trials (Randomizer Version 2.1.0, Institute for Medical Informatics, Statistics and Documentation, Medical University of Graz).
Interventions
The applied ventilation strategies of the two different groups are summarized in Table 1. Within 24h after randomization to the treatment group, IMV was adjusted to the targeted parameters as indicated in Table 1. The duration of the study intervention in the treatment group was 72 hours from inclusion. From recorded ventilation settings we calculated driving pressure (∆P) and mechanical power (MP). We calculated MP by use of the simplified equation from Becher et al. 13. In short, MP was calculated as MP = 0.098 · RR · TV · (driving pressure + PEEP). The driving pressure was calculated Plateau Pressure minus PEEP (all included patients received a pressure controlled ventilatory mode).
When patients were randomized to control group, ventilation was continued according to the treating clinicians’ individual decision and based on local recommendations (see Table 1 and Figure 1, Consolidated Standards of Reporting Trials flow diagram).
Data Sources
Assessed data included baseline demographics and physiological parameters prior to ECMO initiation, as well as clinical (including need for vasopressor therapy, acute kidney injury with renal replacement therapy) and laboratory parameters during the ICU stay. Simplified Acute Physiology Score III (SAPS III) [14] was calculated at ICU admission. Patient identification and data collection were conducted using the patient data management system’s routine documentation (ICCA©, Philips, Amsterdam, Netherlands). Electronic data were recorded in the data management software “Clincase”, version 2.7.0.12 (Quadratek Data Solutions Limited, Münzstraße 15, 10178 Berlin, Germany), hosted by the IT Services & strategisches Informationsmanagement, Medical University of Vienna, 1090 Vienna, Austria. The electronic case report form is designed by the science support work group “IT4Science”. Clincase provides advanced data management and monitoring, maintaining the GCP criteria. Accessible from multiple devices and locations, the web-based electronic case report form allows efficient user handling and moreover error avoidance and data preparation for statistic evaluation during or after the trial. All blood samples were processed and stored at the Medical University Vienna Biobank at the Department of Laboratory Medicine [15]. Analyses of routine laboratory parameters were performed at the Central Clinical Laboratory of Medical University Vienna. Additional laboratory parameters for the assessment of inflammation including serum IL-6 were analyzed in the research laboratory of the Department of Anaesthesia, General Intensive Care and Pain Medicine using the Luminex Assay (Bio-techne; Minneapolis, MN, USA) and analyzed on a MAGPIX analyzer. The datasets supporting the conclusions of this article are included within Supplemental Files.
Endpoints/Aims
The primary endpoint was ventilator free days (VFDs) until day 28 after ECMO start. VFDs were defined as days free from mechanical ventilation. In intubated or tracheotomized patients, a T-piece trial or application continuous positive airway pressure with pressure support < 5 cm H2O were considered as unassisted breathing techniques and the respective days were deemed ventilator-free. In case of death during mechanical ventilation VFD was reported as 0 [16]. The main secondary endpoint was ICU mortality, 28-day and 90-day mortality. Additional endpoints included ECMO duration, ICU length of stay (LOS) and serum concentrations of interleukin-6 (IL-6) during the intervention period of 72h.
Statistical Methods
Normally distributed metric variables are reported as mean with standard-deviation (SD) or median (25th - 75th percentile). Categorical variables are given as absolute and relative frequencies and either Chi-squared test or Fisher´s exact test was used for comparison between groups. To determine the effect of the low frequency ventilation in the treatment group on probability and time of weaning from ventilation, a zero inflated Poisson regression of VFDs was performed, with SAPS III and covariates showing an effect on VFDs. ICU mortality was analyzed with logistic regression. To investigate effects of treatment on IL-6 levels over the whole investigation period of 28 days, a mixed linear model with fixed effects day, group and interaction and random effect intercept per patient was analyzed for logarithmically transformed values of IL-6. We considered P values < 0.05 as statistically significant. Since no multiplicity corrections were applied, P values from secondary analyses serve only descriptive purposes. Calculations were performed using R statistics software (version 4.0.5, The R Foundation for Statistical Computing, Vienna, Austria).
3. Results
This study was designed as a safety and proof of concept study. Between November 2018 and January 2021 we identified 47 consecutive patients admitted to our ICUs who required treatment with ECMO for ARDS. Of these patients, 44 could be included in the study and were randomized 1:1 to either treatment or control group (n=22 each). Twenty-six (59%) patients suffered from ARDS due to COVID-19 (treatment group n=14 (64%), control group n=12 (55%)). Mean age was 56 (SD ± 12) years. Thirty-one patients (70 %) were male, mean pre-ECMO SAPS III was 64 (SD ± 14) and mean BMI was 30 (SD ± 9) kg/m². Demographic data and detailed baseline information are depicted in Table 2.
Prior to ECMO start (baseline) mean PEEP was 12 (SD ± 3) cm H2O, DRIVING PRESSURE was 17 (SD ± 5) cm H2O and median MP was 18.6 [IQR 9.6,28.9] J/min. The arterial blood gas analysis prior to ECMO showed a median PaO2/FiO2 ratio of 96 (SD ± 62) mmHg, a mean PaCO2 of 71 (SD ± 27) mmHg and a mean pH of 7.29 (SD ± 0.13) respectively. Baseline laboratory values are shown in Table S1.
Metric data are reported by mean (± SD) or by median (IQR), n gives the number of available observations. Categorical variables are reported by absolute and relative frequencies and compared by Chi-squared tests or Fisher´s exact tests between groups. BMI=body mass index; COVID 19=coronavirus disease 2019; SAPS III=simplified acute physiology score; PaO2=partial pressure of arterial oxygen; FiO2=fraction of inspired oxygen; PaCO2=partial pressure of arterial carbon dioxide; BE=base excess; IMV=invasive mechanical ventilation; PEEP=positive end expiratory pressure; PBW=predicted body weight. PBW female = 45.5 + 0.9 * (height [cm] - 152); PBW male = 50 + 0.9 * (height [cm] - 152); mechanical power=0.098 x respiratory rate x tidal volume (l) x (driving pressure + PEEP); iNO=inhaled nitric oxide; NMBA=neuromuscular blocking agents; ECMO=extracorporeal membrane oxygenation.
Main Findings
23 patients (52%) were both successfully weaned from ECMO and discharged from ICU. Of these 23 patients, 17 patients had > 1 VFDs at day 28 of ICU stay (12 patients in the treatment group and 5 patients in the control group). Twenty-one patients (47%) died in the ICU (8 patients in the treatment group and 13 in the control group). No difference in survival could be identified between the two groups (P = 0.227). Outcome details are shown in Table 3 and Figure 2 (Kaplan-Meier survival analysis) and Figure 3 (Column chart of ICU survival versus groups).
VFDs in the control group were 3.0 (SD ± 5.5) days and 5.4 (SD ± 6) days in the treatment group (P = 0.117). Simple zero-inflated Poisson regression models identified positive effect of treatment on the probability for weaning (P = 0.07) and a negative effect of male sex on the number of VFDs (P = 0.077). Patients in the treatment group showed a significantly higher chance to be weaned from ventilator after ECMO start until day 28 (P = 0.021). Weaning failure was associated with increased SAPS III (P = 0.030). In a model including treatment group, sex and SAPS III as covariates, a positive effect of low frequency ventilation (OR: 0.16, 95% C.I.:[0.04, 0.76], P = 0.021) and a negative effect of SAPS III (OR: 1.07, 95% C.I.:[1.01, 1.013], P = 0.03) were identified on the number of VFDs. See Figure 4 (Boxplot VFDs until day 28 versus groups) and Table S2.
Asterisk indicates a significantly higher chance for VFDs in a multiple zero inflated poisson regression model including treatment group, SAPS III and sex on ventilator free days (P = 0.021). SAPS III=simplified acute physiology score.
Table S3 shows OR for VFDs. OR for 0 VFDs was lower (OR: 0.312, 95% C.I.:[0.089, 1.1], P = 0.07) in the treatment group than in the control group, respectively (P = 0.07). No differences in VFDs between patients with and without COVID-19 could be identified (OR: 2.25, 95% C.I.:[0.65, 7.81, P = 0.201]; RR: 0.901, 95% C.I.:[0.667, 01.218], P = 0.123). When 28-day mortality was adjusted for treatment group, SAPS III and sex, there was no effect of either category.
Median pre ECMO IMV duration was 2.5 [1,8] days in the control group and 7.5 [5.2,10] days in the treatment group (P = 0.015). On day 1 (the first day on ECMO) RR was significantly higher in the control group as compared to treatment group (14 ± 4 vs. 7 ± 3). PEEP was lower in the control group 12 (SD ± 3) than in the treatment group 13 (SD ± 2). Mean ∆P was 15 (SD ± 2) in the control group and 13 (SD ± 4) in the treatment group. Median MP was 8.5 [IQR 6, 12.1] in the control group and 3.9 [IQR 3.2, 5.2]) in the treatment group. These differences were identified by two-sided t-tests (RR: P < 0.001, PEEP: P = 0.03, MP: P < 0.001) respectively and a Wilcoxon Test (∆P: P = 0.031). Groups did not differ for TV, TV per PBW and peak pressures. See Figure 5 (Mean mechanical ventilation parameters versus groups per days pre ECMO and day 1-3 on ECMO), respectively.
Details of ECMO-related data are shown in Table 2. Thirty-eight patients (86%) underwent treatment with VV ECMO, six patients (14 %) with VA ECMO. Median ECMO duration was 13 [7,27] days, with a maximum of 76 days. No difference could be identified for ECMO duration between the two groups (P = 0.372).
IL-6 parameters are shown in Table 4 and Table 5. None of the parameters differed between groups at baseline. Baseline mean IL-6 levels were similar in control and treatment group (264 pg/mL ± 279 vs 745 pg/mL ±1121; P = 0.243). No significant changes in IL-6 levels were found during the interventional period. Neither group (OR: 0.57, 95% C.I.: [-0.19,1.32], P = 0.15), nor day (OR: 0.02, 95% C.I.: [0,0.04], P = 0.053) had overall time dependent effects of treatment on IL-6 levels over the investigation period of 28 days. However, negative correlation between day and treatment was identified, indicating a stronger decline of IL-6 levels in treatment patients (OR: -0.06, 95% C.I.: [-0.08, -0.03], P = <0.001) shown in Table S4.
Outcome Data
ICU mortality was 36% in treatment group and 59% in control group without reaching statistical significance (P = 0.227). Median ICU length of stay (LOS) was 30 [17,45] days without differences between groups (P = 0.526) as shown in Table 3. Causes of death were multi-organ failure in 7 patients (16%), intracranial bleeding in 2 patients (5%), heart failure in 2 patients (5%) and unresolving COVID-19 ARDS in 3 patients (7%). Adverse events are shown in Table S5.
4. Discussion
In this randomized controlled clinical trial in patients treated with ECMO due to moderate or severe ARDS, 72 hours of low frequency ventilation as compared standard-of-care protective ventilation had no effect on VFDs. However, our findings show that patients treated with low frequency ventilation had higher rates of successful weaning from ventilator weaning (i.e. successful extubation) until day 28. These findings suggests that a low frequency ventilation strategy could prevent further lung damage and thus shorten the need for IMV in patients treated with ECMO.
An experimental animal model describing less histologic lung injury with a similar ventilation strategy as applied in our study also corroborates these findings [17]. Studies in humans also suggest that decreased ventilation pressures reduce pulmonary biotrauma and thus VILI. Bein et. al. [3] compared a ventilation strategy of 3 mL/kg PBW combined with arterio-venous extracorporeal CO2-elimination (avECCO2-R) (‘low TV group’) to 6mL/kg PBW without avECCO2-R (‘normal’ lung protective management) and demonstrated significantly higher VFDs in the low TV group, without showing a significant reduction of ventilation pressures. In our study, low frequency ventilation reached a marked reduction in ventilation pressures and MP as compared to the control group on the first three days of ECMO treatment. In addition, low frequency ventilation under ECMO was well tolerated and had no measurable side effects.
Therefore, our study suggests considering the concept of low frequency ventilation as a valid option for patients on ECMO [18,19]. In our study, mortality did not differ between groups. This is in accordance with recent studies that have failed to show a beneficial effect on survival of LOW FREQUENCY VENTILATION [20]. Side effects of ultra-protective ventilation strategies could contribute to adverse outcomes, thus counteracting the beneficial effects of low frequency ventilation on VILI. In addition, patient-ventilator asynchronies and permissive hypercapnia may be more common in low frequency ventilation [21,22] due to the marked reduction of respiratory rate, leading to increased need for sedation [23] and muscle relaxation. These unwanted effects may contribute to protracted weaning and may induce further lung damage by patient self-inflicted lung injury.
Additional side effects of low frequency ventilation include insufficient arterial oxygenation or removal of carbon dioxide, necessitating application of higher tidal volumes or respiratory rates. This may provide an explanation why some patients did not reach target values of RR, PEEP, peak pressure and TV in the treatment group. However, RR and MP were overall markedly lower in the treatment group as compared to control confirming the targeted minimum ventilation invasiveness. Partial incompliance with our low frequency ventilation targets can also be explained by spontaneous breathing efforts of patients, since the use of neuromuscular blocking agents was at the discretion of the treating ICU physicians and not defined in our study protocol.
When patients are ventilated with very low tidal volumes, both atelectasis and regional overdistension of the ventilated lung may occur [18]. However, the potential for baro- and volutrauma is significantly decreased with a low frequency ventilation strategy. Further, atelectrauma can be addressed with adequate PEEP settings. Although studies showed an independent association of ∆P on mortality [2,10], conventional lung-protective ventilation strategy using TV of 6 mL/kg PBW and higher levels of PEEP do not support reducing ∆P below 15 cm H2O, as used for example in the EOLIA trial [2,24,25].
Moreover, ECMO is an invasive technique that carries serious risks including technical difficulties during cannula insertion, the requirement of systemic anticoagulation, large bore vessel access required for high blood flows, which all contribute to an increased risk of bleeding, a main contributor to ECMO related morbidity and mortality. The decision on cannula size, configuration mode and time of ECMO start was made by the treating physicians independently from and prior to study randomization. This liberal approach may explain why target values of ventilation settings were not reached in all patients in the experimental treatment group. ECMO blood flow and sweep gas flow did not differ between the groups.
About half of the patients suffered from ARDS due to COVID-19 pneumonia. COVID-19 can be considered as a unique entity of disease with specific pathological mechanisms, which may alter the disease course as compared to other ARDS etiologies. However, the distribution of COVID-19 patients was similar between groups. Consequently, when we analyzed VFDs no difference was found between patients with and without COVID-19-related ARDS. Overall ICU mortality was 48% and did not differ between COVID-19 negative and COVID-19 positive patients, respectively. This finding agrees with previous studies of COVID-19-related ARDS and severe ARDS from other causes treated with ECMO [26,27].
IMV duration prior to ECMO start was twice as long in the treatment group as compared to control group. The potential contribution of pre ECMO IMV duration on outcome measures in patients treated with ECMO remains controversial, particularly in patients with COVID-19 [28]. In our study, pre ECMO IMV duration did not affect ICU mortality.
During the first three days of our study period, IL-6 levels did not differ between the two groups. However, a significant decrease of IL-6 occurred in the treatment group after day 21. These findings should be interpreted with caution due to missing values. An experimental study be Retamal et al. described the physiological inflammatory consequences of altered RR [29]. Using a rat model, they have shown that decreased RR is associated with reduced IL-6 levels. Santos et al. [30] obtained similar results in mechanically ventilated rats by targeting lower mechanical power values, and Amado-Rodríguez et al. showed a significant reduction of IL-6 levels with decreased DRIVING PRESSURE in patients with cardiogenic shock supported by VA ECMO [31]. Our findings may therefore partially be explained by a quicker resolving inflammatory state due to earlier weaning. However, due to the low sample size, these findings should be verified in a larger cohort of patients.
It is well accepted, that VILI causes further inflammation and an increase of proinflammatory cytokines such as IL-6 [18]. Elevated levels of these cytokines in patients suffering from ARDS are major determinants of outcome [31], since they may cause further organ damage mediating vascular leakage, tissue edema, cellular hypoxia and necrosis. In severely dysregulated immune responses, a cytokine storm can lead to life-threating conditions with multiorgan failure and death [32]. Recently, classification of ARDS into two distinct phenotypes, a hyperinflammatory and a hypoinflammatory phenotype, has been shown to explain the often-different responses to therapeutic interventions in clinical trials. Distinction of phenotype follows the severity of systemic inflammation and concentrations of proinflammatory biomarkers, as well as the need for vasopressors and prevalence of sepsis [33]. Application of these classifiers in patients suffering from ARDS due to COVID-19 infection failed to reproduce the findings in non-COVID-19 induced ARDS. Several studies suggested that endothelial dysfunction may be more important in COVID-19 ARDS as compared to non-COVID-19 ARDS caused by pneumonia [34,35]. The hypothesis that mortality in COVID-19 is due to an exaggerated systemic inflammatory response is currently not supported by data [36].
Limitations
One major limitation of this study was the lack of a strict protocol for use of NMBA to commit interference with NAV by spontaneous breathing efforts during ECMO support in the treatment group. RR and MP were markedly reduced in the treatment group, although not all target values for mechanical ventilation settings were consistently achieved. TV and peak pressure did not differ between groups, demonstrating a well-established use of lung protective ventilation in our clinical routine (37). Although ventilation parameters were different between groups on day of ECMO start, the large reduction in RR and MP from pre ECMO in the following days indicates that a marked reduction in RR and MP was achieved in the treatment group, even in individuals that started with lower ventilations pressures and RR pre ECMO. IL-6 measurements were not available from all patients. Further, no bronchoalveolar lavage fluid was analyzed for other biomarkers typically associated with VILI to detect differences in regional patterns of the inflammatory response to NAV as compared to conventional lung protective ventilation.
5. Conclusions
In this small clinical trial, low frequency ventilation was comparable to conventional protective ventilation settings in a heterogenous population of patients with ARDS treated with ECMO. The marked reduction of RR and TV led to a significant lowering of DRIVING PRESSURE and MP and did not impair gas exchange. Our findings suggest that resting the lung by low frequency ventilation may facilitate earlier weaning of patients from the ventilator. Additional studies are needed to better define the role of low frequency ventilation in ARDS patients treated with ECMO.
Supplementary Materials
The following supporting information can be downloaded at: www.mdpi.com/xxx/s1, Table S1: Baseline laboratory values between groups; Table S2. Multiple zero inflated poisson regression model with treatment group, SAPS III and sex on ventilator free days; Table S3. Simple zero inflated poisson regression model for VFD on covariates; Table S4. Linear mixed model with fixed effects of treatment group and days over 28 days; Table S5. Adverse Events, as documented by the attending physicians;.
Author Contributions
conceptualization, MH, RU; methodology, MH, RU; software, MF; validation, MH, CK, AH, CB, KK, FK, VT, RU; formal analysis, CK, FK, CB; investigation, MH, SK; resources, MH, SK, VT, RU; data curation, DL, CB, MM; writing—review and editing, MH, CK, KK, VT, FK, AH, RU; supervision, RU; funding acquisition, MH; All authors have read and agreed to the published version of the manuscript.
Funding
This research was funded by Medical Scientific Fund of the Mayor of the City of Vienna (19040) to MH.
Institutional Review Board Statement
This study was approved by the local Ethics Committee of the Medical University of Vienna (EK 1694/2018), Date: 09/10/2018 and performed in accordance with the Declaration of Helsinki as well as the applicable Austrian national laws and regulations currently in force concerning the inclusion of nonconscious patients in clinical trials.
Informed Consent Statement
Written informed consent was obtained as soon as the patient’s condition allowed us to do so.
Data Availability Statement
The dataset supporting the conclusions of this article are available and saved at the Department of Anaesthesia, General Intensive Care and Pain Medicine. Data are available from the authors upon reasonable request.
Acknowledgments
We would like to thank the respective ICU teams for their support during the conduct of the study. We thank Brigitte Tichy from the Department of Orthopedics and Trauma Surgery at the Medical University of Vienna in the General Hospital for providing us the opportunity to use the MAGPIX analyzer.
Conflicts of Interest
KK reports travel expenses from Biotest GmbH and grants from Apeptico GmbH, Biotest GmbH, Bayer AG and Alterras GmbH. The remaining authors declare that the research was conducted in the absence of any commercial or financial relationships that could be construed as a potential conflict of interest.
Trial Registration
https://clinicaltrials.gov/, NCT03764319.
References
- Gajkowski, E. F.; Herrera, G.; Hatton, L.; Velia Antonini, M.; Vercaemst, L.; Cooley, E. ELSO Guidelines for Adult and Pediatric Extracorporeal Membrane Oxygenation Circuits. ASAIO J 2022, 68 (2), 133-152. From NLM Medline. [CrossRef]
- Serpa Neto, A.; Schmidt, M.; Azevedo, L. C.; Bein, T.; Brochard, L.; Beutel, G.; Combes, A.; Costa, E. L.; Hodgson, C.; Lindskov, C.; et al. Associations between ventilator settings during extracorporeal membrane oxygenation for refractory hypoxemia and outcome in patients with acute respiratory distress syndrome: a pooled individual patient data analysis : Mechanical ventilation during ECMO. Intensive Care Med 2016, 42 (11), 1672-1684. [CrossRef]
- Bein, T.; Weber-Carstens, S.; Goldmann, A.; Muller, T.; Staudinger, T.; Brederlau, J.; Muellenbach, R.; Dembinski, R.; Graf, B. M.; Wewalka, M.; et al. Lower tidal volume strategy ( approximately 3 ml/kg) combined with extracorporeal CO2 removal versus 'conventional' protective ventilation (6 ml/kg) in severe ARDS: the prospective randomized Xtravent-study. Intensive Care Med 2013, 39 (5), 847-856. [CrossRef]
- Hager, D. N.; Krishnan, J. A.; Hayden, D. L.; Brower, R. G.; Network, A. C. T. Tidal volume reduction in patients with acute lung injury when plateau pressures are not high. Am J Respir Crit Care Med 2005, 172 (10), 1241-1245. [CrossRef]
- Petrucci, N.; De Feo, C. Lung protective ventilation strategy for the acute respiratory distress syndrome. Cochrane Database Syst Rev 2013, (2), CD003844. [CrossRef]
- Spece, L. J.; Mitchell, K. H.; Caldwell, E. S.; Gundel, S. J.; Jolley, S. E.; Hough, C. L. Low tidal volume ventilation use remains low in patients with acute respiratory distress syndrome at a single center. J Crit Care 2018, 44, 72-76. [CrossRef]
- Wu, M. Y.; Chang, Y. S.; Huang, C. C.; Wu, T. I.; Lin, P. J. The impacts of baseline ventilator parameters on hospital mortality in acute respiratory distress syndrome treated with venovenous extracorporeal membrane oxygenation: a retrospective cohort study. BMC Pulm Med 2017, 17 (1), 181. [CrossRef]
- Fan, E.; Del Sorbo, L.; Goligher, E. C.; Hodgson, C. L.; Munshi, L.; Walkey, A. J.; Adhikari, N. K. J.; Amato, M. B. P.; Branson, R.; Brower, R. G.; et al. An Official American Thoracic Society/European Society of Intensive Care Medicine/Society of Critical Care Medicine Clinical Practice Guideline: Mechanical Ventilation in Adult Patients with Acute Respiratory Distress Syndrome. Am J Respir Crit Care Med 2017, 195 (9), 1253-1263. [CrossRef]
- Broman, L. M.; Malfertheiner, M. V.; Montisci, A.; Pappalardo, F. Weaning from veno-venous extracorporeal membrane oxygenation: how I do it. J Thorac Dis 2018, 10 (Suppl 5), S692-S697. [CrossRef]
- Pham, T.; Combes, A.; Roze, H.; Chevret, S.; Mercat, A.; Roch, A.; Mourvillier, B.; Ara-Somohano, C.; Bastien, O.; Zogheib, E.; et al. Extracorporeal membrane oxygenation for pandemic influenza A(H1N1)-induced acute respiratory distress syndrome: a cohort study and propensity-matched analysis. Am J Respir Crit Care Med 2013, 187 (3), 276-285. [CrossRef]
- Del Sorbo, L.; Goffi, A.; Goligher, E.; Fan, E.; Slutsky, A. S. Setting mechanical ventilation in ARDS patients during VV-ECMO: where are we? Minerva Anestesiol 2015, 81 (12), 1369-1376.
- Force, A. D. T.; Ranieri, V. M.; Rubenfeld, G. D.; Thompson, B. T.; Ferguson, N. D.; Caldwell, E.; Fan, E.; Camporota, L.; Slutsky, A. S. Acute respiratory distress syndrome: the Berlin Definition. JAMA 2012, 307 (23), 2526-2533. [CrossRef]
- Becher, T.; van der Staay, M.; Schadler, D.; Frerichs, I.; Weiler, N. Calculation of mechanical power for pressure-controlled ventilation. Intensive Care Med 2019, 45 (9), 1321-1323. [CrossRef]
- Moreno, R. P.; Metnitz, P. G.; Almeida, E.; Jordan, B.; Bauer, P.; Campos, R. A.; Iapichino, G.; Edbrooke, D.; Capuzzo, M.; Le Gall, J. R.; Investigators, S. SAPS 3--From evaluation of the patient to evaluation of the intensive care unit. Part 2: Development of a prognostic model for hospital mortality at ICU admission. Intensive Care Med 2005, 31 (10), 1345-1355. [CrossRef]
- Haslacher, H.; Gerner, M.; Hofer, P.; Jurkowitsch, A.; Hainfellner, J.; Kain, R.; Wagner, O. F.; Perkmann, T. Usage Data and Scientific Impact of the Prospectively Established Fluid Bioresources at the Hospital-Based MedUni Wien Biobank. Biopreserv Biobank 2018. [CrossRef]
- Contentin, L.; Ehrmann, S.; Giraudeau, B. Heterogeneity in the definition of mechanical ventilation duration and ventilator-free days. Am J Respir Crit Care Med 2014, 189 (8), 998-1002. [CrossRef]
- Araos, J.; Alegria, L.; Garcia, P.; Cruces, P.; Soto, D.; Erranz, B.; Amthauer, M.; Salomon, T.; Medina, T.; Rodriguez, F.; et al. Near-Apneic Ventilation Decreases Lung Injury and Fibroproliferation in an Acute Respiratory Distress Syndrome Model with Extracorporeal Membrane Oxygenation. Am J Respir Crit Care Med 2019, 199 (5), 603-612. [CrossRef]
- Del Sorbo, L.; Goffi, A.; Tomlinson, G.; Pettenuzzo, T.; Facchin, F.; Vendramin, A.; Goligher, E. C.; Cypel, M.; Slutsky, A. S.; Keshavjee, S.; et al. Effect of Driving Pressure Change During Extracorporeal Membrane Oxygenation in Adults With Acute Respiratory Distress Syndrome: A Randomized Crossover Physiologic Study. Crit Care Med 2020, 48 (12), 1771-1778. [CrossRef]
- Rozencwajg, S.; Guihot, A.; Franchineau, G.; Lescroat, M.; Brechot, N.; Hekimian, G.; Lebreton, G.; Autran, B.; Luyt, C. E.; Combes, A.; Schmidt, M. Ultra-Protective Ventilation Reduces Biotrauma in Patients on Venovenous Extracorporeal Membrane Oxygenation for Severe Acute Respiratory Distress Syndrome. Crit Care Med 2019, 47 (11), 1505-1512. [CrossRef]
- Guervilly, C.; Fournier, T.; Chommeloux, J.; Arnaud, L.; Pinglis, C.; Baumstarck, K.; Boucekine, M.; Valera, S.; Sanz, C.; Adda, M.; et al. Ultra-lung-protective ventilation and biotrauma in severe ARDS patients on veno-venous extracorporeal membrane oxygenation: a randomized controlled study. Crit Care 2022, 26 (1), 383. [CrossRef]
- Kallet, R. H.; Campbell, A. R.; Dicker, R. A.; Katz, J. A.; Mackersie, R. C. Effects of tidal volume on work of breathing during lung-protective ventilation in patients with acute lung injury and acute respiratory distress syndrome. Crit Care Med 2006, 34 (1), 8-14. [CrossRef]
- Kallet, R. H.; Corral, W.; Silverman, H. J.; Luce, J. M. Implementation of a low tidal volume ventilation protocol for patients with acute lung injury or acute respiratory distress syndrome. Respir Care 2001, 46 (10), 1024-1037.
- Holanda, M. A.; Vasconcelos, R. D. S.; Ferreira, J. C.; Pinheiro, B. V. Patient-ventilator asynchrony. J Bras Pneumol 2018, 44 (4), 321-333. [CrossRef]
- Sameed, M.; Meng, Z.; Marciniak, E. T. EOLIA trial: the future of extracorporeal membrane oxygenation in acute respiratory distress syndrome therapy? Breathe (Sheff) 2019, 15 (3), 244-246. [CrossRef]
- Tonna, J. E.; Abrams, D.; Brodie, D.; Greenwood, J. C.; Rubio Mateo-Sidron, J. A.; Usman, A.; Fan, E. Management of Adult Patients Supported with Venovenous Extracorporeal Membrane Oxygenation (VV ECMO): Guideline from the Extracorporeal Life Support Organization (ELSO). ASAIO J 2021, 67 (6), 601-610. [CrossRef]
- Barbaro, R. P.; MacLaren, G.; Boonstra, P. S.; Combes, A.; Agerstrand, C.; Annich, G.; Diaz, R.; Fan, E.; Hryniewicz, K.; Lorusso, R.; et al. Extracorporeal membrane oxygenation for COVID-19: evolving outcomes from the international Extracorporeal Life Support Organization Registry. Lancet 2021. [CrossRef]
- Abrams, D.; Schmidt, M.; Pham, T.; Beitler, J. R.; Fan, E.; Goligher, E. C.; McNamee, J. J.; Patroniti, N.; Wilcox, M. E.; Combes, A.; et al. Mechanical Ventilation for Acute Respiratory Distress Syndrome during Extracorporeal Life Support. Research and Practice. Am J Respir Crit Care Med 2020, 201 (5), 514-525. [CrossRef]
- Hermann, M.; Laxar, D.; Krall, C.; Hafner, C.; Herzog, O.; Kimberger, O.; Koenig, S.; Kraft, F.; Maleczek, M.; Markstaller, K.; et al. Duration of invasive mechanical ventilation prior to extracorporeal membrane oxygenation is not associated with survival in acute respiratory distress syndrome caused by coronavirus disease 2019. Ann Intensive Care 2022, 12 (1), 6. [CrossRef]
- Retamal, J.; Damiani, L. F.; Basoalto, R.; Benites, M. H.; Bruhn, A.; Larsson, A.; Bugedo, G. Physiological and inflammatory consequences of high and low respiratory rate in acute respiratory distress syndrome. Acta Anaesthesiol Scand 2021, 65 (8), 1013-1022. [CrossRef]
- Santos, R. S.; Maia, L. A.; Oliveira, M. V.; Santos, C. L.; Moraes, L.; Pinto, E. F.; Samary, C. D. S.; Machado, J. A.; Carvalho, A. C.; Fernandes, M. V. S.; et al. Biologic Impact of Mechanical Power at High and Low Tidal Volumes in Experimental Mild Acute Respiratory Distress Syndrome. Anesthesiology 2018, 128 (6), 1193-1206. [CrossRef]
- Amado-Rodriguez, L.; Del Busto, C.; Lopez-Alonso, I.; Parra, D.; Mayordomo-Colunga, J.; Arias-Guillen, M.; Albillos-Almaraz, R.; Martin-Vicente, P.; Lopez-Martinez, C.; Huidobro, C.; et al. Biotrauma during ultra-low tidal volume ventilation and venoarterial extracorporeal membrane oxygenation in cardiogenic shock: a randomized crossover clinical trial. Ann Intensive Care 2021, 11 (1), 132. [CrossRef]
- Datzmann, T.; Trager, K. Extracorporeal membrane oxygenation and cytokine adsorption. J Thorac Dis 2018, 10 (Suppl 5), S653-S660. [CrossRef]
- Calfee, C. S.; Delucchi, K.; Parsons, P. E.; Thompson, B. T.; Ware, L. B.; Matthay, M. A.; Network, N. A. Subphenotypes in acute respiratory distress syndrome: latent class analysis of data from two randomised controlled trials. Lancet Respir Med 2014, 2 (8), 611-620. [CrossRef]
- Bonaventura, A.; Vecchie, A.; Dagna, L.; Martinod, K.; Dixon, D. L.; Van Tassell, B. W.; Dentali, F.; Montecucco, F.; Massberg, S.; Levi, M.; Abbate, A. Endothelial dysfunction and immunothrombosis as key pathogenic mechanisms in COVID-19. Nat Rev Immunol 2021, 21 (5), 319-329. [CrossRef]
- Borrmann, M.; Brandes, F.; Kirchner, B.; Klein, M.; Billaud, J. N.; Reithmair, M.; Rehm, M.; Schelling, G.; Pfaffl, M. W.; Meidert, A. S. Extensive blood transcriptome analysis reveals cellular signaling networks activated by circulating glycocalyx components reflecting vascular injury in COVID-19. Front Immunol 2023, 14, 1129766. [CrossRef]
- Sinha, P.; Calfee, C. S.; Cherian, S.; Brealey, D.; Cutler, S.; King, C.; Killick, C.; Richards, O.; Cheema, Y.; Bailey, C.; et al. Prevalence of phenotypes of acute respiratory distress syndrome in critically ill patients with COVID-19: a prospective observational study. Lancet Respir Med 2020, 8 (12), 1209-1218. [CrossRef]
- Schmidt, M.; Pham, T.; Arcadipane, A.; Agerstrand, C.; Ohshimo, S.; Pellegrino, V.; Vuylsteke, A.; Guervilly, C.; McGuinness, S.; Pierard, S.; et al. Mechanical Ventilation Management during Extracorporeal Membrane Oxygenation for Acute Respiratory Distress Syndrome. An International Multicenter Prospective Cohort. Am J Respir Crit Care Med 2019, 200 (8), 1002-1012. [CrossRef]
Figure 2.
Kaplan-Meier survival analysis.
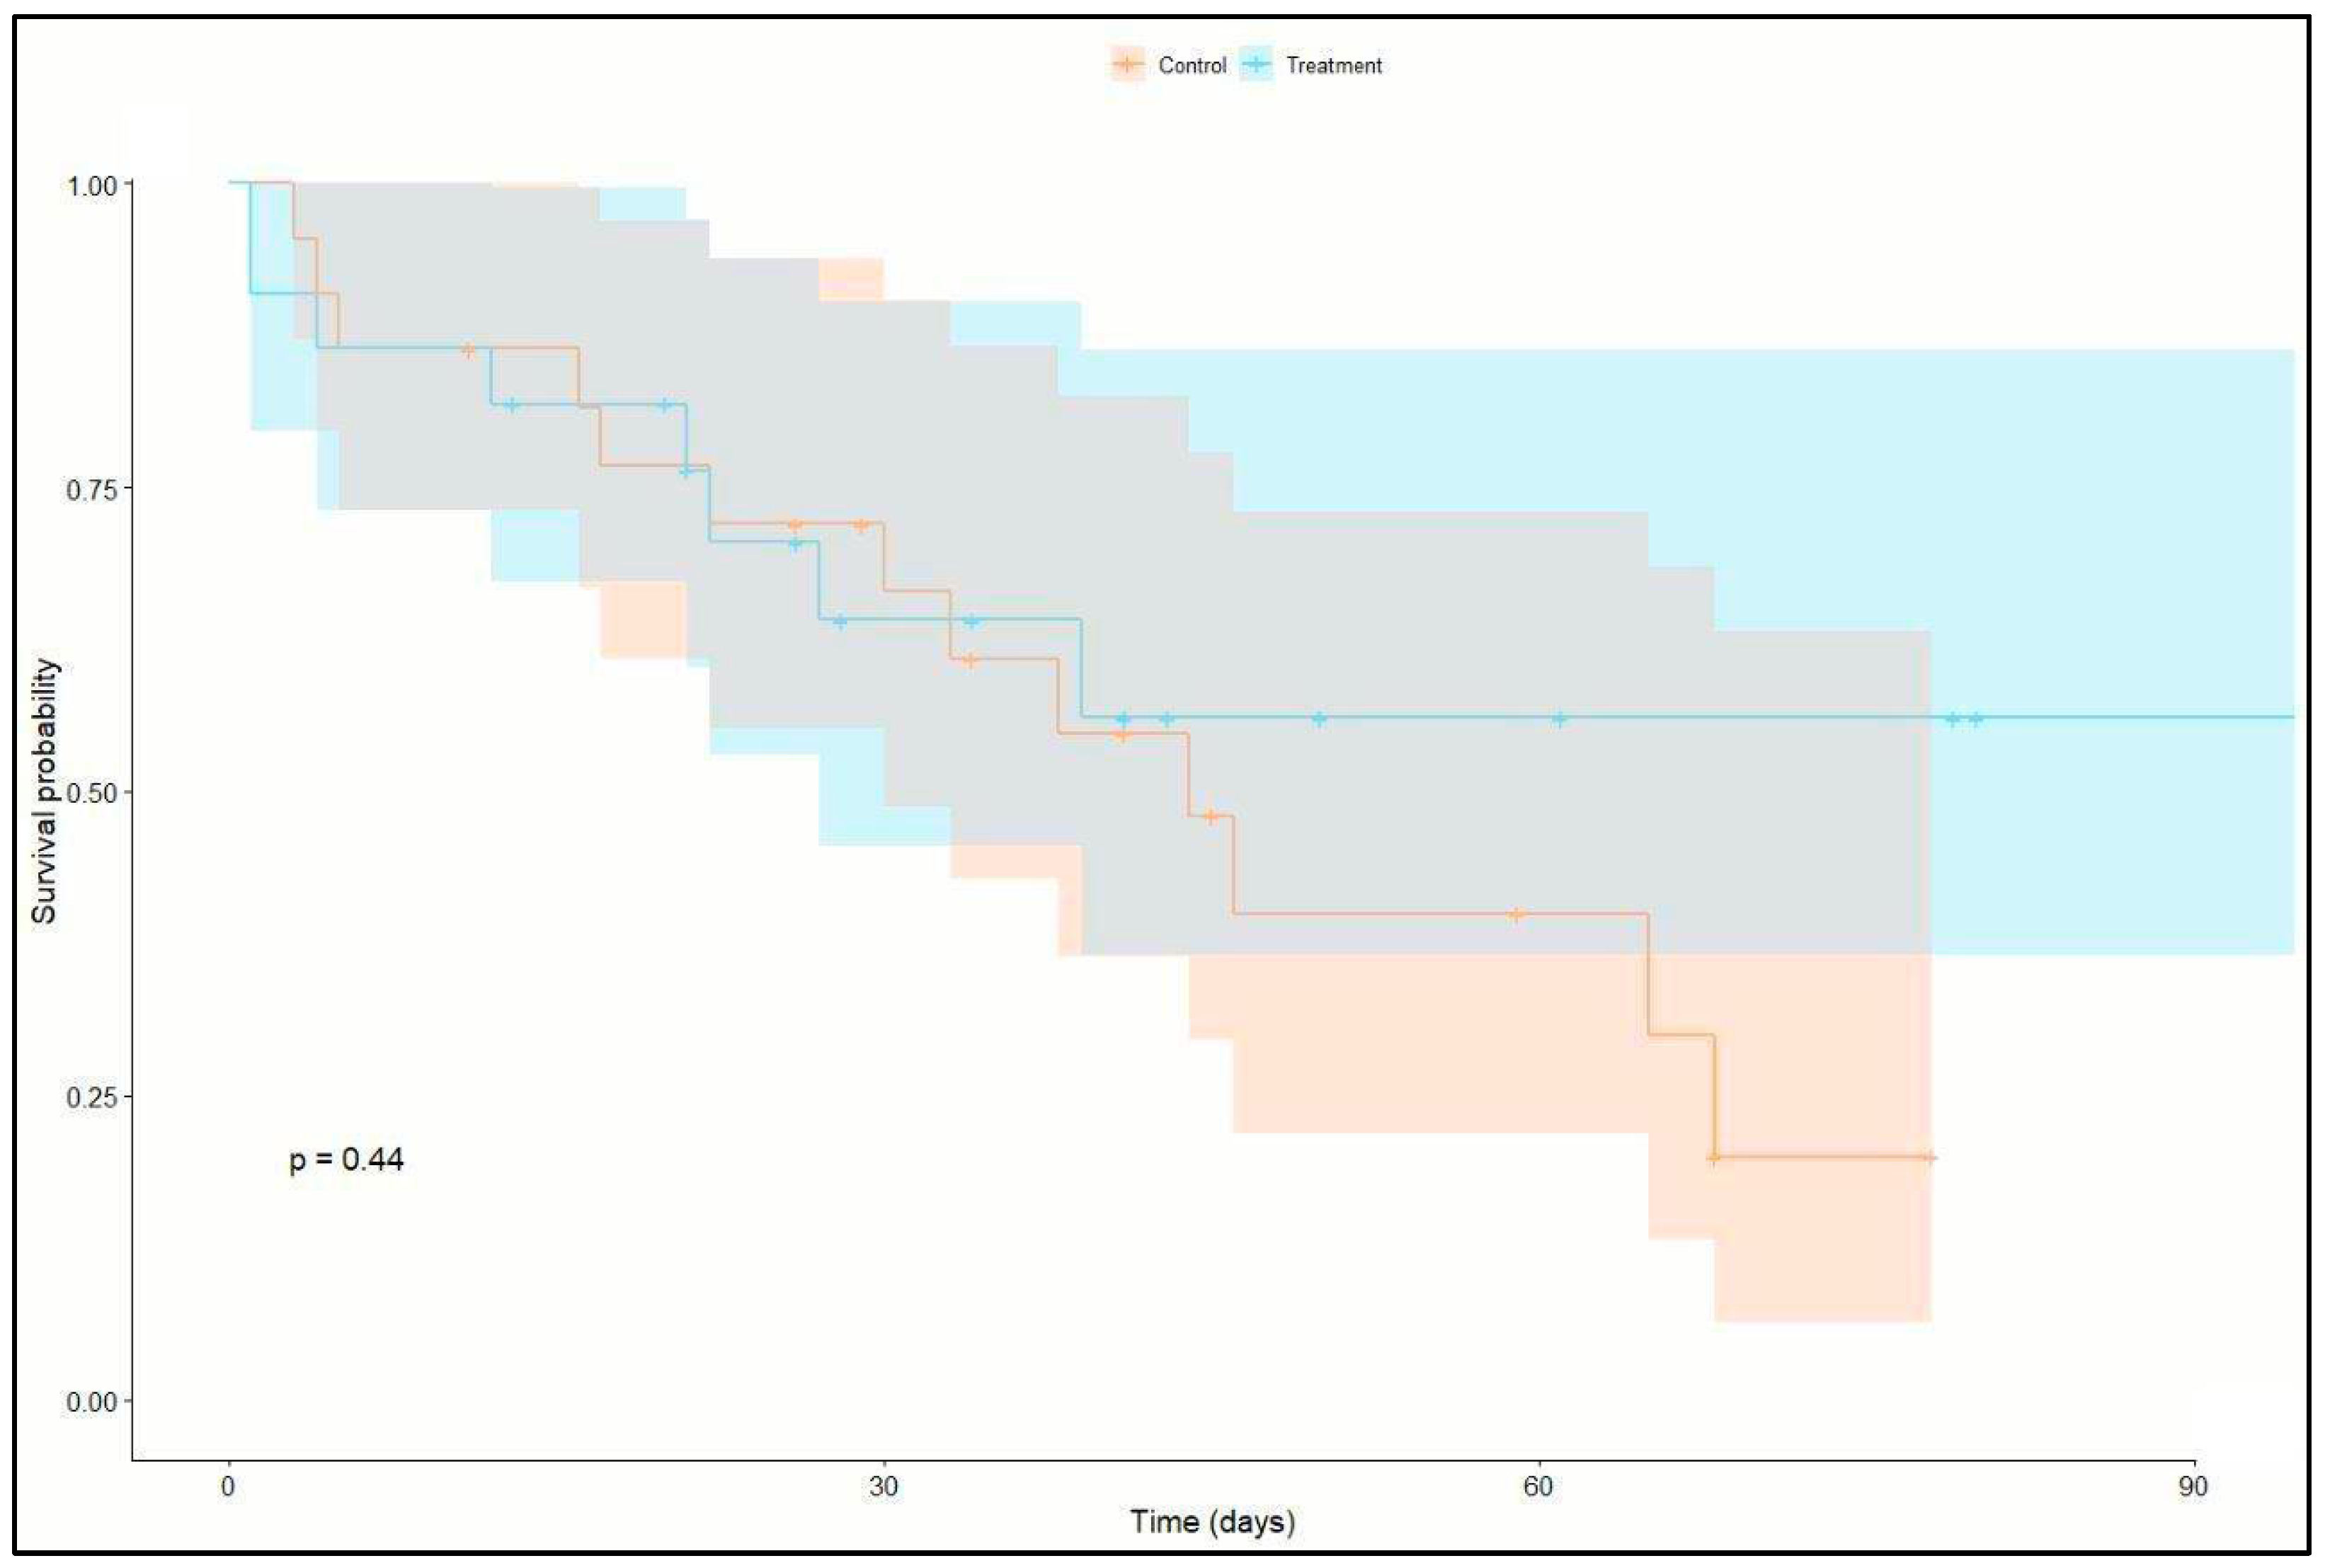
Figure 3.
Column chart of ICU survival versus groups ICU=Intensive Care Unit.

Figure 4.
Boxplot VFDs until day 28 versus groups.
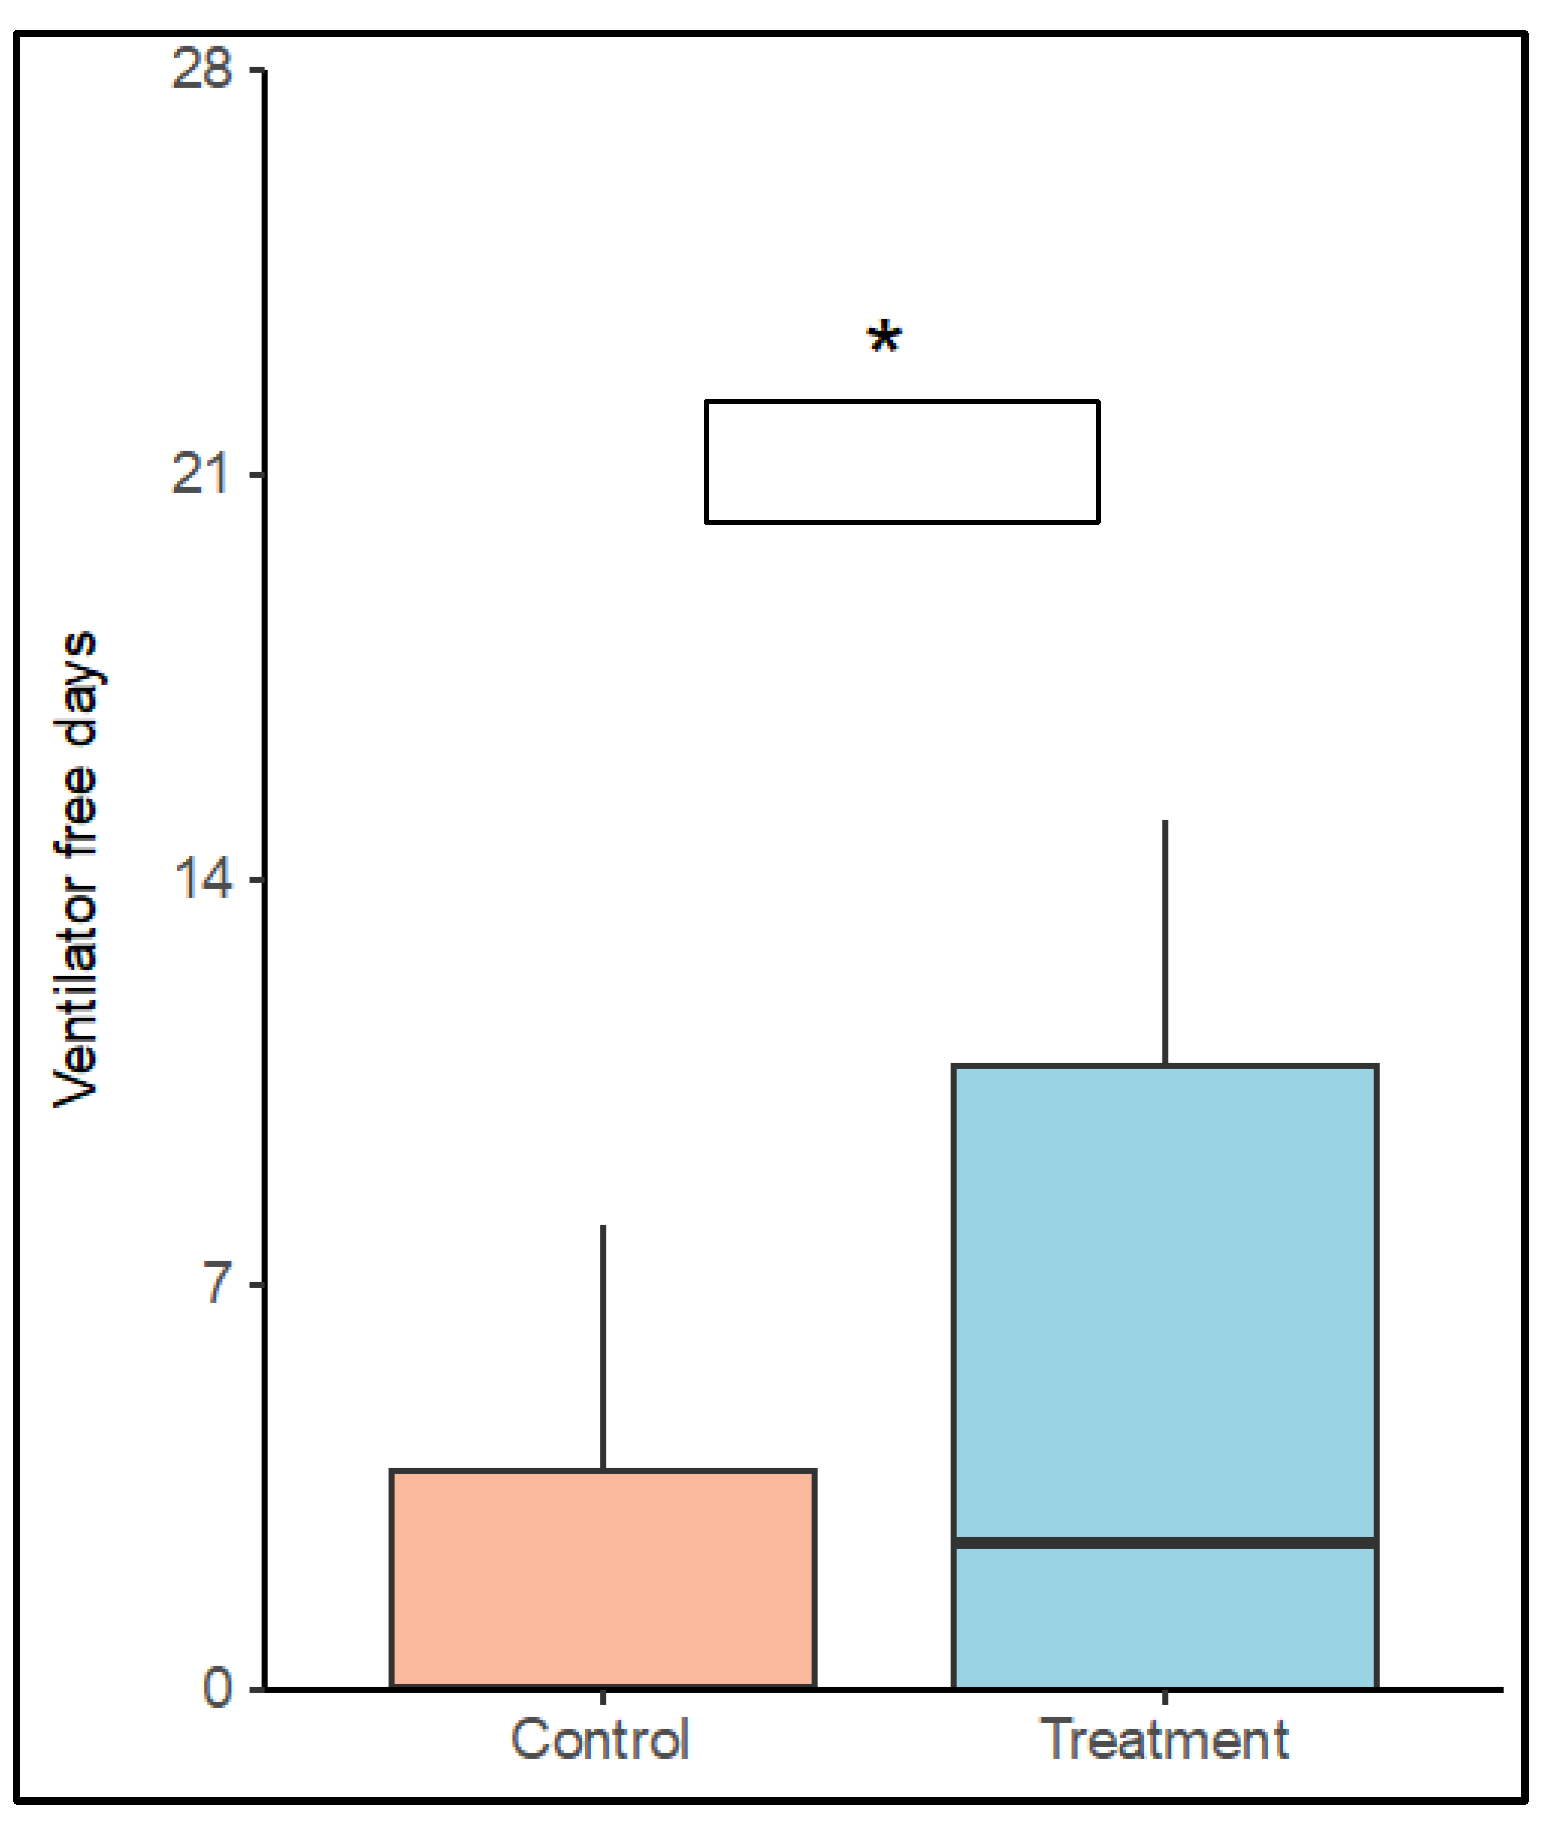
Figure 5.
Mean mechanical ventilation parameters versus groups per days pre ECMO and day 1-3 on ECMO. Asterisk indicates significant differences between groups.
Figure 5.
Mean mechanical ventilation parameters versus groups per days pre ECMO and day 1-3 on ECMO. Asterisk indicates significant differences between groups.
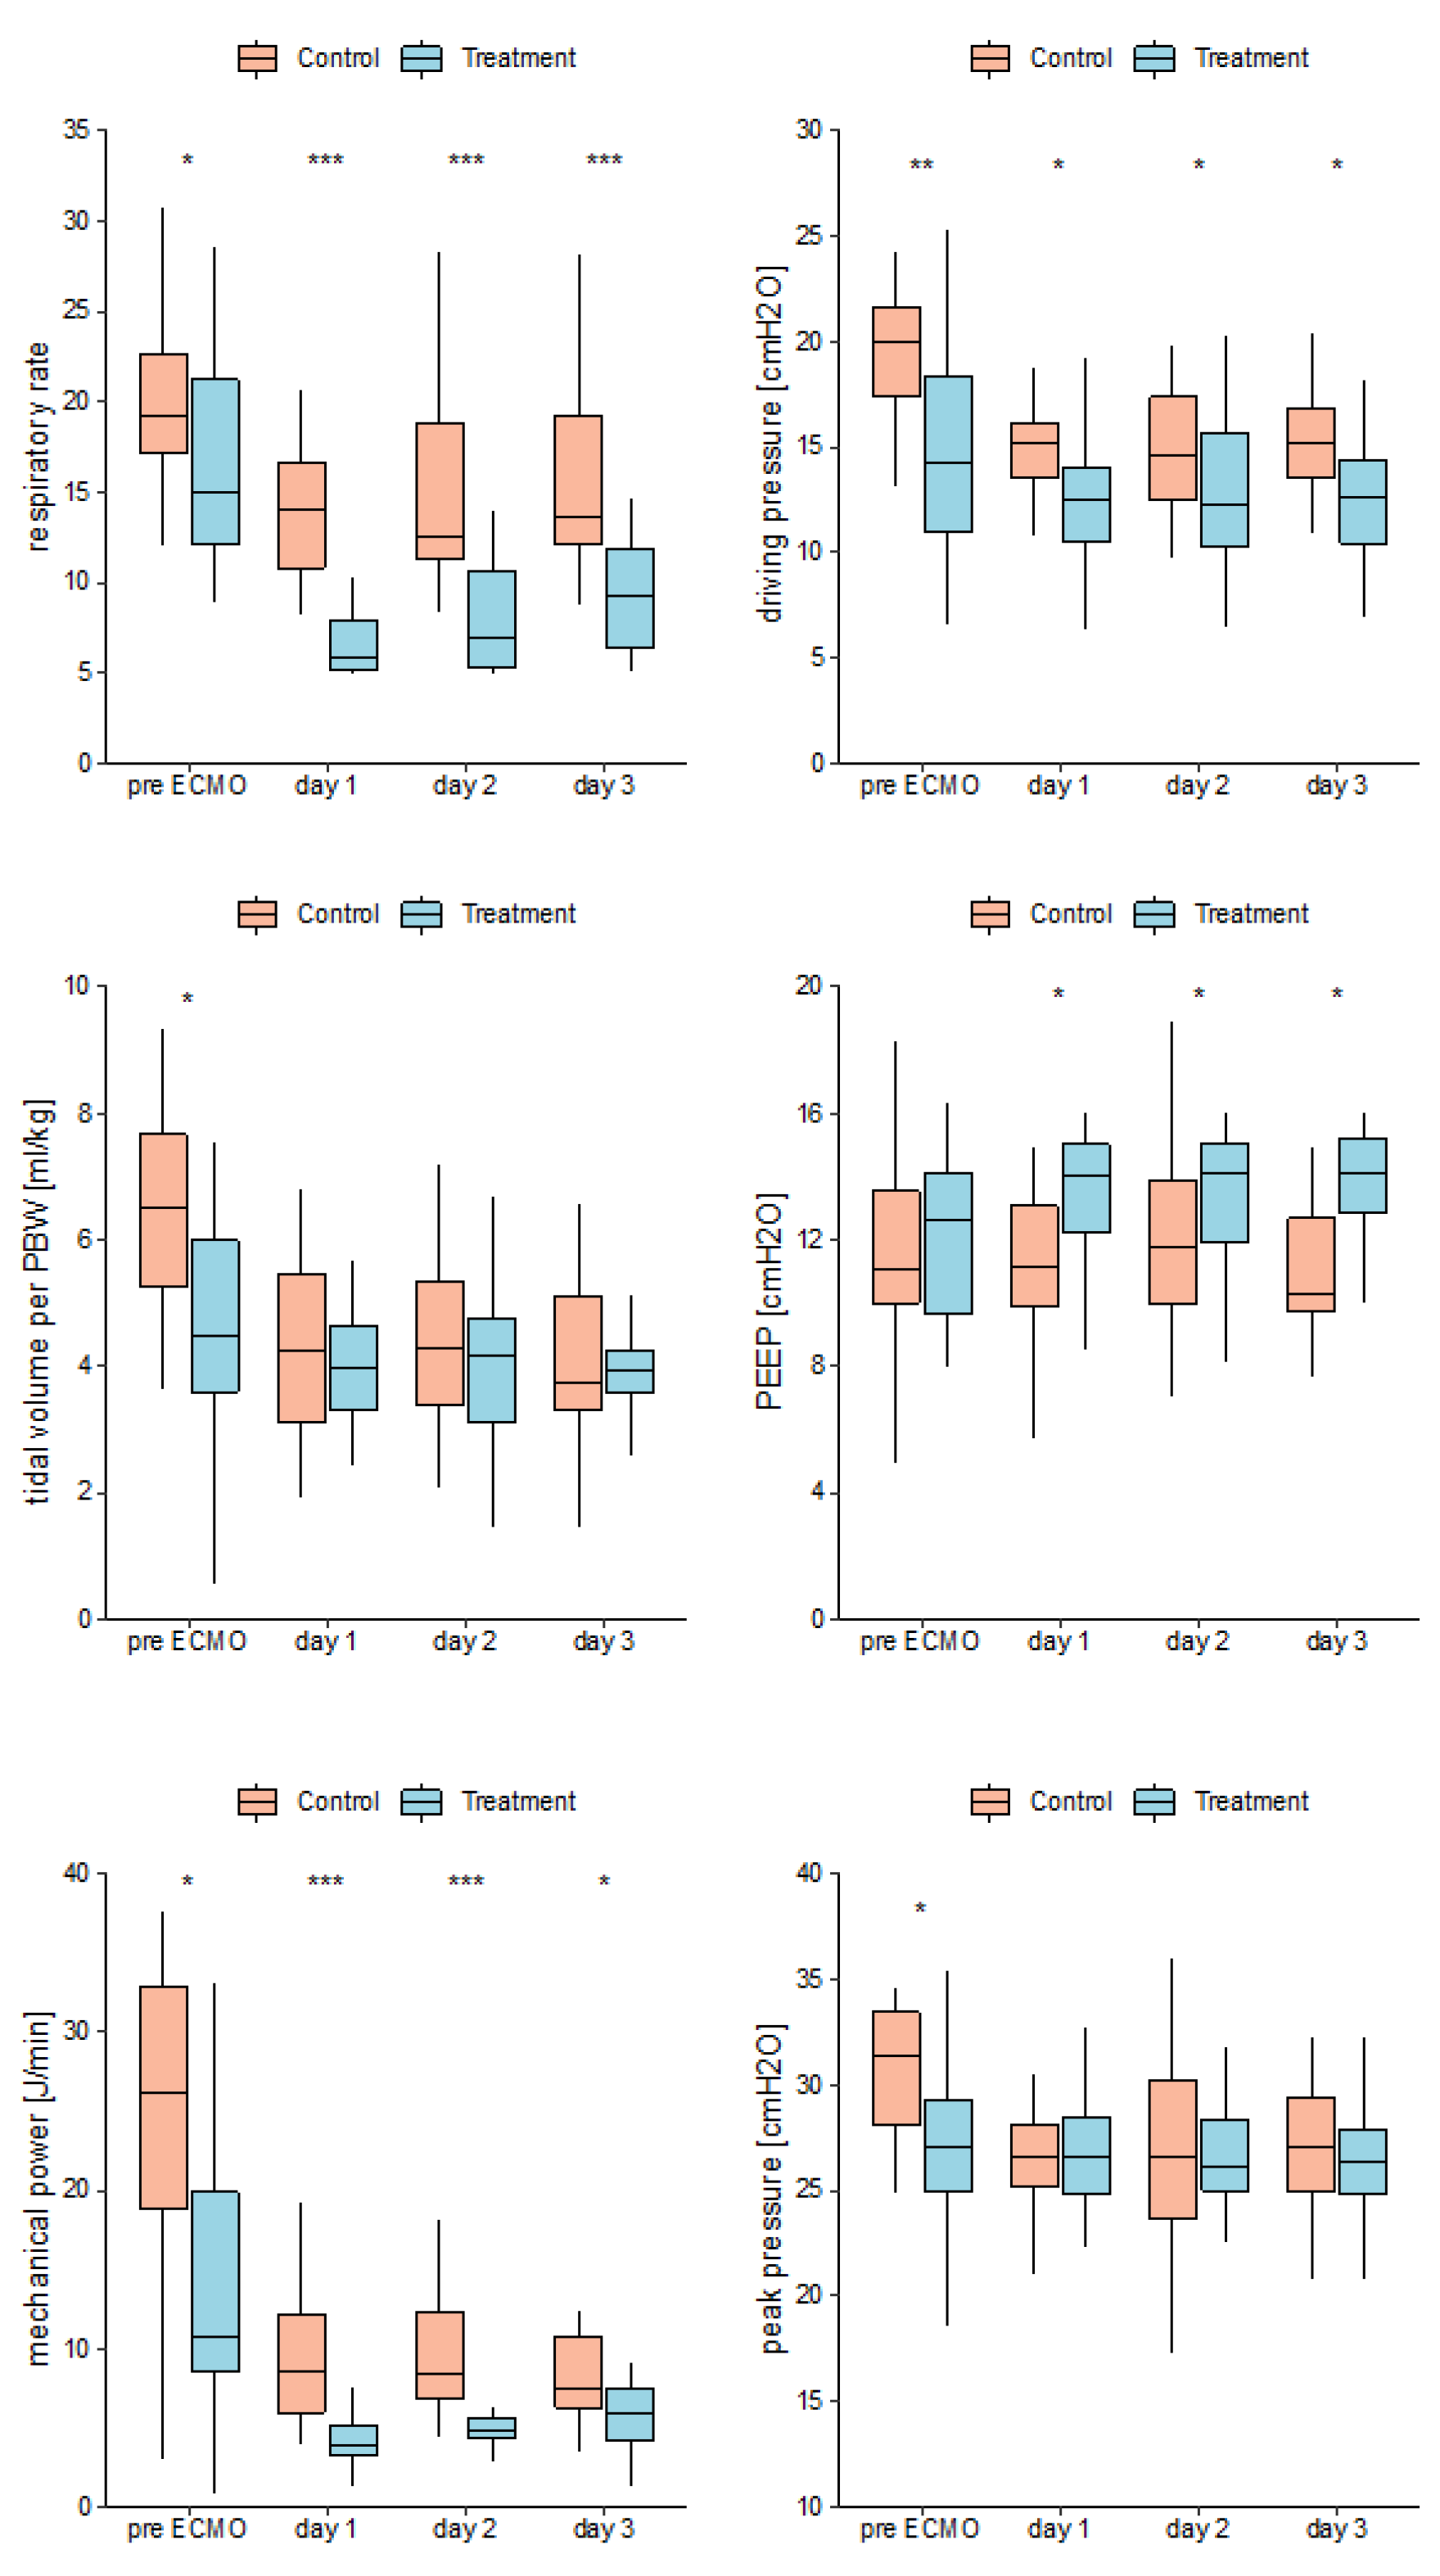

Table 1.
Mechanical ventilation settings.
| Control group | Treatment group | |
|---|---|---|
| Duration | . | 72 hours from inclusion1 |
| Ventilation Mode | Conventional settings2 | Pressure controlled ventilation |
| Respiratory Rate | 12-25 per minute | 4-5 per minute |
| PEEP | ≥ 10 cm H2O | 14-16 cm H2O3 |
| Peak Pressure | < 30 cm H2O | 23-25 cm H2O4 |
| Tidal Volume | < 6 mL/kg PBW | 4 mL/kg PBW |
| I:E | 1:1 – 1:2 | 1:5 |
PEEP=positive end expiratory pressure; PBW=Predicted body weight; PBW was calculated as 45.5 + [0.91 (centimeters of height − 152.4)] for females and 50 + [0.91 (centimeters of height − 152.4)] for males; TV=Tidal volume; I:E=Inspiratory:Expiratory time. 1After 72 hours, the treatment group was switched to a conventional ventilator management according to the treating clinician’s decision; 2 Conventional settings applied by the treating physicians according to the recent guidelines of our center; 3Adjust PEEP to achieve a peak pressure of 23-25 cm H2O; 4 Adjust peak pressure not to exceed TV of 4 mL/kg PBW;
Table 2.
Demographic data and baseline characteristics, ventilation parameters, ECMO information according to their randomization.
Table 2.
Demographic data and baseline characteristics, ventilation parameters, ECMO information according to their randomization.
| All patients | Control | Treatment | P value | |||
|---|---|---|---|---|---|---|
| Age, mean (SD) – years | 56(±12) | 56(±10) | 56(±14) | 0.912 | ||
| Sex, Male, no. (%) | 31(70) | 16(73) | 15(68) | 1 | ||
| BMI, mean (SD) – kg/m2 | 30(±9) | 30(±11) | 29(±6) | 0.738 | ||
| COVID-19, no. (%) | 26(59) | 12(55) | 14(64) | 0.759 | ||
| SAPS III, mean (SD) | 64(±14) | 60(±14) | 67(±13) | 0.074 | ||
| Tracheostomy, no. (%) | 30(68) | 18(82) | 12(55) | 0.106 | ||
| COMORBIDITIES | All patients | Control | Treatment | P value | ||
| Arterial hypertension, no. (%) | 19(43) | 9(41) | 10(45) | 0.851 | ||
| Chronic heart disease, no. (%) | 6(14) | 2(9) | 4(18) | 0.659 | ||
| Obesity, no. (%) | 5(11) | 3(14) | 2(9) | 0.690 | ||
| Diabetes, no. (%) | 8(18) | 3(14) | 5(23) | 0.794 | ||
| Chronic respiratory disease, no. (%) | 8(18) | 3(14) | 5(23) | 0.672 | ||
| COMORBIDITIES CONT. | All patients | Control | Treatment | P value | ||
| Chronic kidney disease, no. (%) | 18(41) | 10(23) | 8(18) | 0.759 | ||
| Immunosuppression, no. (%) | 6(14) | 4(18) | 2(9) | 0.763 | ||
| VENTILATION PRE ECMO | All patients | Control | Treatment | P value | ||
| PEEP, mean (SD) – cm H2O | 12(±3) | 11(±3) | 12(±3) | 0.316 | ||
| Tidal volume, mean (SD) – ml | 355(±141) | 401(±144) | 309(±126) | 0.030 | ||
| Tidal volume, mean (SD) – ml/kg PBW | 5.4(±2.1) | 6.2(±2.2) | 4.6(±1.9) | 0.013 | ||
| Respiratory rate, mean (SD) – /min | 18(±5) | 20(±4) | 16(±6) | 0.021 | ||
| Peak pressure, mean (SD) – cm H2O | 29(±4) | 31(±3) | 27(±4) | 0.003 | ||
| Driving pressure, mean (SD) – cm H2O | 17(±5) | 19(±3) | 15(±5) | 0.001 | ||
| Mechanical power, median [IQR] – J/min | 18.6[9.6,28.9] n=43 |
26.9[18.6,33.2], n=21 | 10.7[8.5,19.9], n=22 | 0.002 | ||
| BASELINE VALUES PRE ECMO | All patients | Control | Treatment | P value | ||
| pre ECMO IMV, median [IQR] – days | 6[1,10] | 2.5[1,8] | 7.5 [5.2,10] | 0.015 | ||
| PaO2/FiO2, mean (SD) | 96(±62) | 82(±50) | 109(±71) | 0.324 | ||
| PaO2, mean (SD) – mmHg | 73(±20), n=40 | 73(±19), n=19 | 72(±21), n=21 | 0.875 | ||
| PaCO2, mean (SD) – mmHg | 71(±27), n=40 | 68(±19), n=19 | 73(±33), n=21 | 0.521 | ||
| pH, mean (SD) – mmHg | 7.29(±0.13), n=40 |
7.31(±0.10), n=19 | 7.27(±0.15), n=21 | 0.403 | ||
| BE, mean (SD) – mmol/L | 6(±6), n=40 | 6(±6), n=19 | 5(±7), n=21 | 0.553 | ||
| NMBA, no. (%) | 20(45%) | 11(50%) | 9(41%) | 0.762 | ||
| VENTILATION DURING ECMO DAY 1 | All patients | Control | Treatment | P value | ||
| PEEP, mean (SD) – cm H2O | 13(±3) | 12(±3) | 13(±2) | 0.03 | ||
| Tidal volume, mean (SD) – ml | 267(±90) | 274(±106) | 261(±73) | 0.644 | ||
| Tidal volume, mean (SD) – ml/kg PBW | 4.1(±1.3) | 4.2(±1.5) | 3.9(±1.1) | 0.439 | ||
| Respiratory rate, mean (SD) – /min | 11(±5) | 14(±4) | 7(±3) | <0.001 | ||
| Peak pressure, mean (SD) – cm H2O | 26(±3) | 27(±3) | 26(±3) | 0.794 | ||
| Driving pressure, mean (SD) – cm H2O | 14(±3) | 15(±2) | 13(±4) | 0.031 | ||
| Mechanical power, median [IQR] – J/min | 5.7[3.9,9.6] | 8.5[6,12.1] | 3.9[3.2,5.2] | <0.001 | ||
| NMBA, no. (%) | 26(59) | 10(45) | 16(73) | 0.125 | ||
| VENTILATION DURING ECMO DAY 2 | All patients (n=43) |
Control (n=22) |
Treatment (n=21) | P value | ||
| PEEP, mean (SD) – cm H2O | 13(±3) | 12(±4) | 14 (±2) | 0.045 | ||
| Tidal volume, mean (SD) – ml | 273(±92) | 279(±101) | 267(±83) | 0.674 | ||
| Tidal volume, mean (SD) – ml/kg PBW | 4.2(±1.3) | 4.3(±1.4) | 4.0(±1.3) | 0.415 | ||
| Respiratory rate, mean (SD) – /min | 11(±5) | 15(±5) | 8(±3) | <0.001 | ||
| Peak pressure, mean (SD) – cm H2O | 27(±4) | 27(±5) | 27(±4) | 0.996 | ||
| Driving pressure, mean (SD) – cm H2O | 14(±3) | 15(±3) | 13(±4) | 0.075 | ||
| Mechanical power, median [IQR] – J/min | 5.9[4.7,10.5] | 8.4[6.8,12.3] | 4.8[4.4,5.6] | <0.001 | ||
| NMBA, no. (%) | 26(60) | 12(55) | 14(67) | 0.617 | ||
| VENTILATION DURING ECMO DAY 3 | All patients (n=41) |
Control (n=21) |
Treatment (n=20) | P value | ||
| PEEP, mean (SD) – cm H2O | 12(±3) | 11(±4) | 14(±2) | 0.016 | ||
| Tidal volume, mean (SD) – ml | 258.5(±87) | 262(±106) | 255(±65) | 0.806 | ||
| Tidal volume, mean (SD) – ml/kg PBW | 3.9(±1.2) | 4.0(±1.3) | 3.8(±0.9) | 0.539 | ||
| Respiratory rate, mean (SD) – /min | 12(±5) | 15(±5) | 9(±3) | <0.001 | ||
| Peak pressure, mean (SD) – cm H2O | 26(±4) | 27(±4) | 26(±4) | 0.733 | ||
| Driving pressure, mean (SD) – cm H2O | 14(±3) | 15(±2) | 13(±3) | 0.003 | ||
| Mechanical power, median [IQR] – J/min | 6.9[4.9,8.8] | 7.5[6.3,10.8] | 5.9[4.2,7.5] | 0.007 | ||
| NMBA, no. (%) | 23(56) | 11(52) | 12(60) | 0.86 | ||
|
ECMO CONFIGURATION MEAN DURING 72hours on ECMO |
All patients | Control | Treatment | P value | ||
| Venoarterial, no. (%) | 6(14%) | 1(5%) | 5(23%) | 0.188 | ||
| Venovenous, no. (%) | 38(86%) | 21(95%) | 17(77%) | 0.188 | ||
| ECMO blood flow, mean (SD) - l/min | 3.2(±0.7) | 3.1(±0.6) | 3.3(±0.8) | 0.373 | ||
| ECMO sweep gas flow, mean (SD) - l/min |
3.9(±1.2) | 3.6(±1.3) | 4.3(±1.1) | 0.066 | ||
Table 3.
Outcome data and cause of death between groups.
| OUTCOME | All patients | Control | Treatment | P value |
|---|---|---|---|---|
| Ventilator free days until day 28, mean (SD) –days | 4.2(±5.8) | 3(±5.5) | 5.4(±6) | 0.117 |
| LOS, median [IQR] – days | 30[17,45] | 34[18,46] | 27[15,43] | 0.526 |
| ECMO duration, median [IQR] – days | 13[7,27] | 16[8,30] | 12[6,23] | 0.372 |
| ICU mortality, no. (%) | 21(48) | 13(59) | 8(36) | 0.227 |
| 28-day mortality, no. (%) | 12(27) | 5(23) | 7(32) | 0.735 |
| 90-day mortality, no. (%) | 17(39) | 10(45) | 7(32) | 0.536 |
| pre ECMO IMV, mean (SD) – days vs. ICU death | 8(±8) | 8(±6) | 8(±10) | 0.997 |
| CAUSE OF DEATH | All patients | Control | Treatment | P value |
| Multiorgan failure, no. (%) | 7(16) | 4(18) | 3(14) | 1 |
| Intracranial bleeding, no. (%) | 2(5) | 2(9) | 0(0) | 0.57 |
| Heart failure, no. (%) | 2(5) | 1(5) | 1(5) | 0.864 |
| COVID 19 ARDS, no. (%) | 3(7) | 1(5) | 2(9) | 0.784 |
LOS= length of stay; ICU=intensive care unit; IMV=Invasive mechanical ventilation; ICU=intensive care unit; COVID 19=coronavirus disease 2019; ARDS=acute respiratory distress syndrome.
Table 4.
IL-6 levels between groups during the intervention period of 72 h.
| IL-6 | All patients | Control | Treatment | P value |
|---|---|---|---|---|
| Baseline pg/mL, mean (SD) | 504(±831), n=18 | 264(±279), n=9 | 745(±1121), n=9 | 0.243 |
| Day 1 pg/mL, mean (SD) | 190(±278), n=26 | 132(±138), n=14 | 256(±379), n=12 | 0.301 |
| Day 2 pg/mL, mean (SD) | 220(±264), n=24 | 191(±232), n=13 | 254(±305), n=11 | 0.58 |
| Day 3 pg/mL, mean (SD) | 152(±158), n=22 | 88(±46), n=11 | 215(±204), n=11 | 0.069 |
IL-6=Interleukin-6.
Table 5.
IL-6 levels of patients with and without COVID-19 during the intervention period of 72h.
| IL-6 COVID-19 ARDS | All patients | Non COVID-19 | COVID-19 | P value |
|---|---|---|---|---|
| Baseline pg/mL, mean (SD) | 504(±831), n=18 | 29.7(±.), n=1 | 532(±847), n=11 | . |
| Day 1 pg/mL, mean (SD) | 190(±278), n=26 | 146(±239), n=5 | 200(±291), n=17 | 0.676 |
| Day 2 pg/mL, mean (SD) | 220(±264), n=24 | 483(±558), n=5 | 196(±232), n=16 | 0.599 |
| Day 3 pg/mL, mean (SD) | 152(±158), n=18 | 13.6(±.), n=4 | 158(±159), n=14 | . |
|
OUTCOME IL-6 COVID-19 ARDS |
All patients (n=44) | Non COVID-19 (n=17) |
COVID-19 (n=27) |
P value |
| ICU Death, no. (%) | 21(48%) | 7(41%) | 14(52%) | 0.227 |
| Ventilator free days till day 28, median (IQR) – days | 0[0,9.2] | 1[0,9] | 0[0,8.5] | 0.379 |
COVID 19=coronavirus disease 2019; IL-6=Interleukin-6; ICU=intensive care unit; IQR=Interquartile Range.
Disclaimer/Publisher’s Note: The statements, opinions and data contained in all publications are solely those of the individual author(s) and contributor(s) and not of MDPI and/or the editor(s). MDPI and/or the editor(s) disclaim responsibility for any injury to people or property resulting from any ideas, methods, instructions or products referred to in the content. |
© 2024 by the authors. Licensee MDPI, Basel, Switzerland. This article is an open access article distributed under the terms and conditions of the Creative Commons Attribution (CC BY) license (http://creativecommons.org/licenses/by/4.0/).
Copyright: This open access article is published under a Creative Commons CC BY 4.0 license, which permit the free download, distribution, and reuse, provided that the author and preprint are cited in any reuse.


