Submitted:
13 August 2024
Posted:
14 August 2024
You are already at the latest version
Abstract
False news refers to false, fake, or misleading information presented as real news. In recent years, there has been a noticeable increase in false news on the Internet. The goal of this paper was to study the automatic detection of such false news using machine learning and natural language processing techniques and to determine which techniques work the most effectively. This article first studies what constitutes false news, and how it differs from other types of misleading information. We also study the results achieved by other researchers on the same topic. After building a foundation to understand false news, and the various ways of automatically detecting it, this article provides its own experiments. These experiments were done on four different datasets, one that was made just for this article, and using 10 different machine learning methods. The results of this article were satisfactory and provided answers to the original research questions set up at the beginning of this article. This article could determine from the experiments that passive-aggressive algorithms, support vector machines, and random forests are the most efficient methods for automatic false news detection. This article also concluded that more complex experiments, such as using multiple levels of identifying false news or detecting computer-generated false news, require more complex machine learning models.
Keywords:
Machine Learning
; Natural Language Processing
; False News Detection
; Artificial Intelligence
; ChatGPT
1. Introduction
False news can be described as false or misleading information created to be widely shared for different purposes, such as to generate revenue, promote, or affect the opinions of a target group before a big event. Recent years have seen the spread of false news, especially on the Internet [1,2,3]. This issue needs to be addressed, as the growing spread of false news threatens journalism, can cause political turmoil, and can negatively impact peopleâs daily lives [4].
While the internet already has many websites that professionally perform fact-checking on news articles, such as PolitiFact1, FactCheck.org2, FactChecker3, Snopes4, The Reportersâ Lab5 or FaktaBaari6, in today’s world, websites like these managed by human volunteers are not enough. False news or false information is becoming harder to detect as the ways to create it have become more advanced and accessible [5]. For example, ChatGPT7 can just in a few seconds generate an article, a review, or a statement that can be false but still look believable [6]. With the help of social media, these pieces of false information can spread to millions of people in just a few seconds. Because of this, it is important to include at least some automation in the fact-checking process.
In this article, we study automated false news detection. We review previous work related to this subject and analyze such data and classification experiments using machine learning algorithms. Specifically, we test several classification models using machine learning and natural language processing techniques to find the best way to automatically detect when a news article or a piece of information is true or false, and analyze the language commonly used in news articles that could be considered false. We also experimented on how the developed classifiers perform when given articles written by a human compared to those generated automatically.
The usage of generative Large Language Models, including the recently popular ChatGPT makes it easier to write false content in large quantities. Thus, the inclusion of data generated with ChatGPT is important when it comes to false news detection.
Most fact-checking services or previous research conducted in automated false news detection focuses mainly on political issues. False news, however, can be spread about any topic, including health-related ones, such as COVID-19 [7]. Therefore, it is important to include other topics in the scope of analysis as well. The two main research questions posed by this research were
- What are the best computational methods to use when detecting false news?
- Will there be a difference in results when using human-generated text and automatically generated text?
The remainder of this article is arranged as follows. In Section 2 we talk about the different types of deceptive information and lay out the specific background of what the present research focuses on, as well as introduce a glossary for the terms used in this research. In Section 3 we present previous research done in the field of false news detection. In Section 4 we introduce the datasets used in the research. In Section 5 we introduce the applied methods used in our research. In Section 6 we go through the experiments that we performed on the datasets that we used. In Section 7 we discuss the results of the experiments in more detail, as well as conclude a minor linguistic analysis of false news. In Section 8, we conclude the research.
2. Background
The scope of deceptive information in today’s age is large, and often different definitions of different types of deceptive information are used indiscriminately with each other. This creates confusion and uncertainty when trying to differentiate one piece of deceptive information from another.
Different types of deceptive information include rumours, hoaxes, false news, false reviews, satires, urban legends, and propaganda, among many more. It is important to take into consideration that sometimes these different types of deceptive information can intertwine with each other. For example, a false news article can be satirical. To understand better the differences between these different types of deceptive information we summarized all known types of deceptive information so far with their short definitions in Table 1.
In this research, as previously pointed out, we mainly focus on detecting false news. However, even false news can be divided into sub-categories where each different sub-category has a specific purpose and a different impact level. This is why various guides and taxonomies have been created to differentiate and understand different types of false news [8,9,10].
Wardle [9] proposed a taxonomy of misinformation and disinformation that divided false news into seven different types of mis- and disinformation and provided a description of the intended harm that these different types of false news are causing. Our research mainly focuses on misleading content and fabricated content. This taxonomy is shown in Table 2.
To understand false news, we also need to better understand the definition of news that can be classified as real. For news to be considered legitimate or real, it needs to meet certain journalistic standards. This standard usually means that the news is neutral, uses the right sources and is factual based on the information available at the time. Chong [11] in their research on misinformation considered news to be legitimate or real if it followed the following characteristics:
- Presented in a neutral, balanced, and non-inciting manner.
- Verifiable by an independent source or party within reasonable limits.
- Accurate and factual, based on the information available or as provided by the source.
- Comprehensive - with no malicious censorship, modification, or manipulation.
For this research, We will look out for these characteristics proposed by Chong [11] to differentiate between real news and false news.
2.1. Terminology
Table 3 serves as a glossary for the different terminology used in this paper.
3. Previous Research
In this section, we go through previous research that has been conducted in the field of false news detection and related areas.
3.1. False News Detection
Rubin [18] studied satirical news, and how to expose them as false news. The contrast between satirical news and false news is worth noting. Satirical news leaves cues on purpose in its text to reveal the false nature of the news, whereas false news tries to convince the reader to believe in it. In their research, Rubin [18] proposed an algorithm based on Support Vector Machines (SVM) with five general features, namely, absurdity, humour, grammar, negative affect, and punctuation to predict satirical news. Their research was very successful, as they were able to achieve a 90% precision and 84% recall in satirical news detection.
Thota [19] used Deep Learning architectures to detect false news. They highlighted that a problem with the majority of false news detectors is that they only use binary classification methods, making them unable to understand the relationship between two pieces of text. In their research, they tackle this problem through stance detection, in which they use deep neural network architecture to predict how similar the headline is to a news article. Their model proved to be successful, as they were able to detect when a news article was false with stance detection with 94.21% accuracy, which outperformed existing models at the time by 2.5%.
Karimi [20] conducted their research on false news detection with the inclusion of various degrees of “falseness". They propose a Multi-source Multi-class Fake News Detection framework to tackle this problem. This framework combines automated feature extraction, multi-source fusion, and automated degrees of falseness detection into one single model. Their model could differentiate between the different degrees of falseness from the news that they used. They also integrated multiple sources into false news detection, which could help false news detection as multiple sources give a much better context when detecting false news, as opposed to only using the context given by the news article.
Oshikawa [21] studied the potentials and limitations of NLP solutions in false news detection. NLP techniques are perhaps the most common way of analyzing false news, and their study proves that NLP techniques are useful in automatic false news detection. Das [22] additionally studied the task of automatic fact-checking with NLP techniques. However, their research points out more of the fact that automated fact-checking is less reliable when compared to manual fact-checking. Das, et al. (2023)’s solution for this limitation is to develop a hybrid system for automatic fact-checking, that would use humans in the process alongside computers.
Waikhom [23] used ensemble machine learning methods, such as XGBoost, Bagging, Random Forest (RF), Extra Trees, and Gradient Boost. The methods they used allowed them to achieve relatively high accuracy scores in classification when using the LIAR dataset [4]. Ahmad [24] also used ensemble methods with machine learning in their research about false news detection. They also achieved very good results with ensemble methods. Waikhom’s [23] and Ahmad’s [24] research and results conclude, that machine learning algorithms work well for false news detection when implemented with ensemble learners.
Gundapu [25] researched false news detection for COVID-19-related news. They used classic ML models, deep learning models and transformer models to conduct their research. They achieved the best results when they developed an ensemble model consisting of all three different transformer models that they used (BERT, ALBERT, and XLNET). With this ensemble model, they were able to receive an accuracy score of 98%.
Wu [26] conducted their research on multimodal (text and image) false news detection. They proposed a Multimodal Co-Attention Networks-based model to better include text and images together for false news detection. Their model first extracted visual features from images and then textual features from the text, fusing these extracted features that then can be used to detect false news. Their model was able to achieve good accuracy results on the two datasets that they used for their research. On the first dataset that they used they achieved an accuracy score of 80%, and on the second they achieved an accuracy score of 89%. Nadeem [27] recently concluded research on utilizing visual features for false news detection as well. They proposed a multimodal Extreme Fake News Detection (EFND) that gathers context, social context and visual data to create a multimodal vector. The results they achieved were high, with the accuracy score being 98% and 99% on different datasets.
3.2. Linguistic and Textual Analysis of False News
Singh [28] used linguistic analysis alongside ML in their research. Their research provides interesting information about linguistic differences between false and real news. From their research one can learn that in general, false news tends to be shorter, show less expertise or confidence, appear negative in tone and show less analytical thinking. However, their research shows that the package they used for linguistic analysis LIWC (Linguistic Analysis and Word Count), associates the language found in false news to be more authentic. In LIWC, a higher authenticity score is associated when the language being more personal and disclosing. In comparison, a lower authenticity score is associated when language that is more guarded and distanced. This could provide reasoning for why people can be tricked into believing false news.
Ahmed [29] proposed a detection model that combines text analysis using n-gram features and term frequency with ML classification. They also introduce a new n-gram model in their research, that generates various sets of n-gram frequency profiles from their trained data, to differentiate between false and true content. Their research showed that linear function-based classifiers achieved better results than non-linear classifiers. The research also found that if an n-gram size was increased, the detection accuracy decreased. This would suggest that the language used in false news is not consistent.
3.3. Automatically Generated Text Detection
Mitrović [30] researched detecting short texts generated by ChatGPT using a transformer-based model. In their research, they also analyzed the language generated by ChatGPT and concluded that “ChatGPT’s writing is polite, without specific details, using fancy and atypical vocabulary, impersonal, and typically it does not express feelings." [e. g. [30], P. 1]. The research focused on restaurant reviews generated by ChatGPT, and the goal was to classify the reviews according to whether it was created by a human or ChatGPT. The research achieved a good 79% accuracy, even though the research stated that the transformer-based model had problems with differentiating between human and ChatGPT-generated reviews.
3.4. False News Detection Based on User Interaction
Tacchini [31] proposed an idea regarding hoax and false news detection, where the nature of a Facebook post could be determined by the users who "like" the posts. The baseline for their research was that a user who "likes" a post determined as a hoax, is anticipated to "like" even more hoax posts. They would analyze a post according to the users who "liked" the post, and if there were enough amount of users who had previously "liked" several posts determined as hoaxes, the current post being analyzed would be determined as a hoax as well. For their experiments, they used two different classification techniques: logistic regression and boolean label crowdsourcing (BLC). Both of their techniques used achieved very high results in detecting whether a Facebook post could be determined as a hoax or non-hoax, suggesting that analyzing the users interacting with Facebook posts can accurately determine the nature of the Facebook posts.
Del Tredici [32] used linguistic analysis and user detection to detect false news. They proposed a model that would create representations of users on social media based on the language that they use and the news that they spread, and this model would be used to detect false news. The model was built by using Convolutional Neural Networks (CNNs), as it suits well for text classification. In their research, they analyzed the language commonly used by people who share false news. The study concluded that the language used by users who spread false news is consistent, which in turn makes it easier to detect news based on just the people who share them, just like in Tacchini’s [31] research.
4. Datasets
In this section, we go through the datasets used in this article. These datasets include three datasets created by previous research, namely, LIAR [4], FakeNewsNet [33], and Twitter15 [34], as well as a novel dataset that we built by using ChatGPT. We will analyze the sizes of the datasets, the data elements used in the datasets, and the different values of the data elements. We have included a summary of all datasets that can be seen in Table 4.
4.1. LIAR Dataset
The LIAR dataset [4] is a benchmark dataset created for false news detection. It contains 12.8 thousand real-world manually labelled short statements that were collected from PolitiFact.com with various contexts. The dates for the statements are primarily from 2007-2016. The dataset also includes an analysis report and links to source documents for each statement, as well as information about the speaker, the speaker’s job title, subject, political party affiliation, the credit history of the speaker, and the context for each statement.
The dataset has six different labels to determine the truthfulness ratings. These labels are: pants-fire, false, barely-true, half-true, mostly-true, and true. The pants-fire label represents a completely false statement, and the true label represents a completely true statement. The distribution of cases for each label is balanced, except for pants-fire which has significantly fewer cases compared to other labels. The pants-fire label has 1,050 cases whereas the other labels have cases ranging from 2,063 to 2,638 cases.
The statements have 732 different subject types ranging from various topics, where the most frequent subject being healthcare, and it appears in the dataset 5 times. The average statement is 17.9 tokens long. Most of the speakers of the statements are U.S. politicians, but other speaker types are also included such as journalists, social media users, and Internet newspapers. Overall, there are 2910 unique speakers, and each speaker appears 3.5 times on average in the dataset. The most common speaker in the dataset is Barack Obama, who appears in the dataset 5 times.

Table 5.
An example of a randomly chosen statement from the LIAR dataset. The label history shows how many times the speaker has made a statement that belongs to one of the six different label cases in the dataset.
Table 5.
An example of a randomly chosen statement from the LIAR dataset. The label history shows how many times the speaker has made a statement that belongs to one of the six different label cases in the dataset.
| Elements | Value of Elements |
|---|---|
| ID | 8303 |
| Label | half true |
| Statement | Tuition at Rutgers has increased 10 percent since Gov. Chris Christie took office because he cut funding for higher education. |
| Subject | education, state finances |
| Speaker | Barbara Buono |
| Job title | State Senator |
| Party affiliation | democrat |
| Label history | 3, 1, 4, 4, 1 |
| Context | a speech to students at the Rutgers New Brunswick campus |
4.2. FakeNewsNet Data Repository
The FakeNewsNet [33] is a data repository that contains two datasets. The datasets were collected from PolitiFact.com and GossipCop. The datasets include the collected news articles, social context, and information about users who interacted with the article on social media. The inclusion of user interaction information makes this data repository useful when detecting false news from social media. As shown by Tacchini [31] and Del Tredici [32] the inclusion of user analysis is an excellent way to detect false news that is spread in social media. The datasets contain source URLs to the news articles, the title of the news, and the tweet IDs of users who interacted with the article on Twitter.
The datasets are different in size, where the dataset collected from GossipCop is considerably larger than the dataset collected from PolitiFact.com. The distribution of false and true news in the datasets is imbalanced, especially in the dataset collected from GossipCop. The dataset collected from PolitiFact.com contains 432 news articles labelled as false and 624 news articles labelled as real. The dataset collected from GossipCop contains 6,048 news articles labelled as false and 16,817 labelled as real.
The articles in the PolitiFact.com dataset focus on political issues, whereas the articles in the GossipCop dataset contain news about celebrities. GossipCop used to be a website to fact-check articles and stories related to the entertainment industry. As GossipCop mainly focused on false stories it provides a reason why the imbalance between real and false articles is large in the dataset.
The average title length in the PolitiFact.com dataset is 10.74 tokens, and in the GossiCop dataset, it is 10.067 tokens. In the PolitiFact.com dataset, a news article was interacted with by 1.329 different users on average, and in the GossipCop dataset, the same average was 1.064.
Table 6.
Examples of randomly chosen false and real news articles from both FakeNewsNet’s datasets.
| Elements | Value of Elements |
|---|---|
| ID | politifact182 |
| News URL | http://www.gao.gov/new.items/d071195.pdf |
| Title | US Government Accountability Office Report to Congressional Committees |
| Tweet IDs | 956894522511736832 |
| Label | real |
| ID | politifact14944 |
| News URL | http://thehill.com/homenews/senate/369928-who-is-affected-by-the-government-shutdown |
| Title | Who is affected by the government shutdown? |
| Tweet IDs | 954602090462146560 954602093171609600 954650329668349954 |
| Label | false |
| ID | gossipcop-897603 |
| News URL | https://www.teenvogue.com/story/selena-gomez-not-changing-blonde-hair |
| Title | Selena Gomez Is Going To Keep Her Blonde Hair |
| Tweet IDs | 936830208857878528 |
| Label | real |
| ID | gossipcop-8424920276 |
| News URL | www.inquisitr.com/opinion/4545022/adam-sandler-confirms-justin-bieber-didnt-ask-for-acting-advice-says-singer-is-funny-as-hell/ |
| Title | Adam Sandler Confirms Justin Bieber Didn’t Ask For Acting Advice, Says Singer Is âFunny As Hell’ [Opinion] |
| Tweet IDs | 919499104950001669 919610157755256832 |
| Label | false |
4.3. Twitter15
Twitter15 [34] includes 1490 Twitter stories posted until March 2015. The stories were collected from Snopes.com and Emergent.info. The dataset is used for rumour detection on Twitter posts. The distribution of false and true events is similar in size. The dataset contains 372 events determined as true rumours, 370 events determined as false rumours, 374 events determined as non-rumours, and 374 events that could not be verified. The labels used to differentiate the stories are non-rumour, true, false, and unverified.
As the dataset contains stories posted on Twitter, the genre of the stories varies a lot. The most common words found in the dataset were Paul, shot, new, police, says, killed, war, Ferguson, died, and Obama. The average text length of a post was 10.2 tokens.
Table 7.
An example of a randomly chosen news article from the Twitter15 dataset.
| Elements | Value of Elements |
|---|---|
| ID | 693560600471863296 |
| Events | miami was desperate for a turnover. instead, nc state got this dunk. and a big upset win: URL |
| Veracity | non-rumour |
4.4. Novel ChatGPT-Generated Dataset
For experimental purposes, We created a novel dataset that includes news articles generated by ChatGPT to test how well classifiers would handle artificially generated text. The dataset consists of an ID, title, text, author/source, and the labels false and true. Additionally, the texts labelled as true are provided with a link to the original article. We created 200 false news articles for the dataset, and 100 true articles.
Creating false news articles with ChatGPT was a very specific and unusual task. By default, ChatGPT will refuse the creation of false news articles. This, however, can be easily manipulated with wordplay and tricking ChatGPT into writing articles that contain misleading information. In Figure 1 we can observe our initial failure in creating false news with ChatGPT, and in Figure 2, we can observe how we succeeded in manipulating ChatGPT to generate false news for us. The text generated by ChatGPT is believable, and creative, and doesn’t contain language usually found in false news, such as exaggerated language. The example of how to generate false news articles with ChatGPT shows, how easily it can be used to generate untruthful information in general.
The so-called truthful news for this dataset was created by first summarising actual news articles from credible news sources, mainly from Reuters8, Helsinki Times9, The Kyiv Independent10, and NHK WORLD-JAPAN11, then making ChatGPT write the news article again using the summary that was created. We also made sure, that each generated article was truthful towards its original context, and that it didn’t contain false information made up by ChatGPT. We also provide a link to the original article that was summarised and rewritten by ChatGPT.
From the other datasets that we used, we noticed that the articles used in them don’t have much variety. A lot of them mainly focus on the USA and its political climate, which leaves topics from other parts of the world and different subjects largely untouched. For this issue, we included a variety of different subjects, such as sports, economics, medicine, and crimes from different countries in this dataset. This decision was made to ensure more diversity in the data which would ensure that the trained model does not simply overfit to some specific politics-related term in classification.
Table 8.
An example of an entry in the Novel ChatGPT-generated dataset.
| Elements | Value of Elements |
|---|---|
| ID | 0 |
| title | Fed plans broad revamp of bank oversight after SVB failure |
| text | The Federal Reserve could make a significant impact on its supervisory practices by rapidly implementing mitigants in response to serious issues regarding capital, liquidity, or management, according to a senior Fed official... |
| source | Reuters |
| label | true |
| original article | https://www.reuters.com/business/finance/fed-plans-broad-revamp-bank-oversight-after-svb-failure-2023-04-28 |
5. Applied Methods
This section goes through the different feature extraction and classifying methods used in the research.
5.1. Feature Extraction
CountVectorizer turns given textual data into a vector based on the frequency (count) of each word in the text. The created vector is represented as a sparse matrix, where each of the words is stored using index values determined by alphabetical order. Using CountVectorizer makes it easy to use textual data directly in ML models in text classification tasks.
TF-IDF (Term Frequency-Inverse Document Frequency) is a technique used to determine the importance of words found in used documents. The TF-IDF score of a word is determined according to how many times the word appears in the document. A word that appears less frequently gets a higher score than a word that appears more frequently. This is because a word that appears less frequently in a sentence is seen as more important since it usually gives a better context about the sentence.
The TF-IDF score is a combination of two calculations: the term frequency (TF) and the inverse document frequency (IDF). TF score is calculated by dividing the number of occurrences of a word from a document by the total number of words in that document. IDF score is calculated by dividing the total number of documents by the documents containing a certain word. The TF and IDF scores are then multiplied, and finally, the TF-IDF result can be obtained.
In this research, we applied the TF-IDF technique using the TfidfTransformer. It is used to transform a count matrix into a matrix of TF-IDF scores. TfidfTransformer takes the count matrix as an input and applies the TF-IDF technique to convert the matrix into a weighted representation.
With CountVectorizer and TfidfTransformer we created a bag-of-words model. Bag-of-words is a common technique in NLP, where the used textual data is turned into numerical features that ML algorithms are capable of processing.
5.2. Classifying Methods
Random Forest (RF) is an ensemble learning method, that uses a combination of multiple decision trees when training. When used in a classification task, RF generates an ensemble of trees that predict the classification result by casting a vote to determine the most popular class. In RF, each tree in the ensemble is built from a sample drawn with a replacement from a training set - which in the case of our experiments are the datasets that we used. [35] The research conducted by Waikhom, et al. [23] and Ahmad, et al. [24] that we discussed more in detail in Section 3, showed that ensemble learning methods achieved high accuracy scores for false news detection. This provides a reason why we chose to include RF as one of the methods for my classifying experiments.
Naive Bayes (NB) methods are a set of supervised learning algorithms based on applying Bayes’ theorem with strong (naive) independence assumptions between features given the value of a class variable. In this experiment, we used the MultinomialNB algorithm in our classification experiments. MultinomialNB predicts the probability of general labels for a given text, applying those features in a multinomial function based on Bayes’ theorem. NB algorithms are often used as a baseline for text classification tasks, they work well with smaller datasets and are faster to train when compared with other popular classifiers [36].
Logistic Regression (LR) is a statistical model that calculates the probability of a binary outcome, based on prior observations from a dataset. LR can consider multiple input criteria for the eventual outcome of a prediction. In the instance of false news detection, the LR model could be capable, for example, of taking into consideration the history of label distribution (true/false) of news articles written by a reporter. Based on the historical data, the LR model calculates the score for a new case based on its probability of receiving either one of the labels [37]. LR has been successful for false news detection purposes previously [29,31,38].
Support Vector Machines (SVM) is a machine learning algorithm that uses supervised learning models to analyze data for classification, regression, and outliers’ detection. SVM works by creating a hyperplane that separates used training data into classes, e.g., false/true. New data is then fitted into the same space as the old data, and the class prediction for the new data is determined by which side of the previously created hyperplane they fall [39]. SVM has been used widely in false news detection, often being able to receive high accuracy results [18,40,41].
k-Nearest Neighbors (kNN) is a non-parametric supervised learning method, used for classification and regression tasks. kNN classifier takes a k closest training data as an input, and the input data is then classified based on a plurality vote of its neighbours. Meaning, that an object currently being classified gets assigned to a class according to its k nearest neighbors, where k is a positive integer [42]. In our research, we used k = 3, where an object is classified according to what is the most common class among its neighbours. Just like NB, kNN is often used as a baseline for text classification tasks and is fast and simple to train [36].
Multi-layer Perceptron (MLP) is a feed-forward artificial neural network, typically consisting of three different interconnected layers: input layer, hidden layer, and output layer. In MLP classification tasks, input data is passed through the layers, where each layer solves a specific part of the task. The output of the solved result is passed through the layers until the result is determined, e. g. whether an article is false or not [43]. For our research, we implemented my MLP classifier with the suggested settings given by Scikit-learn’s user guide for neural networks 12. MLP has shown good results in previous research about false news detection [19,44], and it has been useful for more complex tasks simple text-based classification [27].
Decision Trees (DTs) are a non-parametric supervised learning method used for classification and regression tasks. It has a hierarchical, tree structure, which consists of a root node, branches, internal nodes, and leaf nodes. The root node and the internal nodes represent the base problem given by a classification task, e.g. is this article false or true, branches represent the outcome of the problem, and the leaf nodes represent the final decision after calculating all the possible outcomes, e.g. this article is false [45]. DTs are simple and easy to understand, and because of their structure, it is capable of handling multi-output classification problems. For false news detection, DTs have been capable of providing good accuracy results [44,46,47].
Boosting in ML refers to a set of ensemble algorithms, such as Adaptive Boosting (AdaBoost), Gradient Boosting, or Extreme Gradient Boosting (XGBoost). For this research, we implemented the AdaBoost algorithm. AdaBoost works by training a classifier on a dataset, and the classifier is given a weight according to the performance. AdaBoost gives a higher weight to items that have been classified incorrectly so that the incorrect classification can be corrected. This process is then repeated until the actual values and predicted values reach an acceptable threshold [48]. AdaBoost algorithm is simple to use, yet it can achieve good accuracy results for false news detection tasks [23,47].
Stochastic Gradient Descent (SGD) is an algorithm used to minimize the loss functions of a linear classifier model. It’s often used in large-scale machine learning problems usually encountered in text classification and natural language processing. SGD is an optimization method, used to train a model to find the optimal set of parameters for the model. In this research, the model that we trained with SGD was the "Modified Huber" loss function. SGD is efficient and easy to implement, and it works well with large datasets [49]. SGD has been capable of achieving good accuracy results for false news detection-related tasks [46].
Passive Aggressive (PA) is an algorithm that is part of a group called Linear Models, where the target value is expected to be a linear combination of the features [50]. More specifically, PA is used with binary classification tasks, usually when the used data is potentially noisy or it might change over time [51]. Passive Aggressive algorithms have been widely used for false news detection-related tasks, often with good results [52,53].
6. Experiments
In this section, we will be introducing the experiments that we conducted on the four datasets that were introduced in Section 4.
6.1. Experiment 1: Twitter15 Dataset
For our first set of experiments, we used the Twitter15 dataset [34]. This dataset was already divided into separate ’test’ and ’train’ files. As this dataset was created for rumour detection, we used this dataset to compare the differences and similarities between false news and rumours. As presented in Table 1, the definitions of rumours and false news have a slight overlap, we thought that it would be interesting to conduct a classifying experiment using both rumours and false news. In this experiment, we first conducted a classifying experiment only using the Twitter15 dataset [34]. Then, we experimented using the LIAR dataset [4] as train data, and the Twitter15 dataset [34] as test data. For the final experiment, I used the Twitter15 dataset [34] as train data, and the LIAR dataset [4] as test data.
To be able to use the ML classifiers, we first built a bag-of-words model with CountVectorizer and TfidfTransformer. For this experiment, to get the best comparisons between all the different methods, we used all the methods introduced in Section 5.2. For later experiments, we chose the three best-performing methods from this experiment.
Our first experiment was first conducted only using the Twitter15 dataset [34] on the classifiers. This way, we were able to construct a good baseline for our classifiers, that we could use to compare the classifying results achieved later by the more complex experiments. The results of this experiment can be seen in Table 9. From Table 9, we can observe that on average, all the classifiers performed well, as all the classifiers could achieve accuracy results of over 50%. The worst-performing classifiers were AdaBoost and MLP, which achieved accuracy scores of 54% and 68%. The best-performing classifiers were the Passive Aggressive classifier and SVM, which both achieved accuracy scores of 87%.
The second and third experiments were conducted using the Twitter15 dataset as train data and the LIAR dataset as test data, and vice versa. The results for these experiments can be seen in Table 10 and Table 11. From these tables, we can observe that testing and training using different false information type datasets didn’t provide good results. This can be explained since the language used in false news is very different from the language used in rumours. However, we can observe that the two classifiers - AdaBoost and MLP - that performed the worst in the first experiment, performed slightly better comparatively in the second and third experiments.
From these classification experiments, we were able to conclude that RF, PA and SVM were overall the best-performing methods, that were also the most consistent with their precision, recall and F1 scores as well. For these reasons, we will be using these three methods for the later classification experiments.
6.2. Experiment 2: LIAR Dataset
For our second set of experiments, we used the LIAR dataset [4]. This dataset was already divided into training, validation, and testing files. For these experiments, we combined the validation and training data, as the inclusion of the validation file was unnecessary for our experiments.
To be able to use the ML classifiers, we first built a bag-of-words model with CountVectorizer and TfidfTransformer, just like in the previous experiment. For the experiments, we used three different ML classification algorithms: Passive Aggressive Classifier (PA), Random Forest (RF), and Support Vector Machines (SVM).
As the LIAR dataset originally separates false and true news into six different labels, we concluded two different types of classification experiments on this dataset. At first, we concluded a six-label classification experiment, where we classified articles with the six different labels originally provided by the dataset’s author. After that, we concluded a series of different binary classification experiments, where we reduced the labels of the dataset into only ’true’ and ’false’. We reduced the labels in five different ways: all labels except ’true’ are labelled as ’false’, labels ’pants-fire’ and ’false’ are labelled as ’false’ and the rest as ’true’, all labels except ’pants-fire’ are labelled as ’true’, labels are split from the middle into ’true’ and ’false’, and labels ’true’ and ’mostly-true’ are labelled as ’true’ and the rest as ’false’. We used all of these different labelling ways to determine when non-binary classification works best for the LIAR dataset, and in which labels the language is the most differentiable.
The results for the six-label classification experiment can be found in Table 12. From these results, we can observe that all the used methods achieved low scores overall. The best-performing method was RF, with an accuracy score of 25%. However, the macro averages of precision, recall and F1-scores were all almost identical with all the used methods.
After the six-way classification experiment, we concluded a series of binary classification experiments. The results for the binary classification experiments can be found in Table 13, Table 14, Table 15, Table 16 and Table 16. From these tables, we can observe that the classifiers were most efficient when only the label ’pants-fire’ was considered as false, and least efficient when the labels ’mostly-true’ and ’true’ were considered as true and the rest were false. Overall, in the binary classification experiments, the classifiers were more accurate than in the six-label experiment. Like in the six-label classification experiment, the RF method was the best performing in all the binary classification experiments. However, in the experiment where only the label ’pants-fire’ was considered false, RF and SVM both achieved accuracy scores of 91%. And just like in the six-label classification experiment, the macro averages of precision, recall and F1-scores were almost identical with all the methods.
Table 13.
Performance report for the binary classification experiment where all the labels except ’true’ are re-labelled as false.
Table 13.
Performance report for the binary classification experiment where all the labels except ’true’ are re-labelled as false.
| Method | Accuracy | Precision | Recall | F1 |
|---|---|---|---|---|
| PA | 0.76 | 0.52 | 0.51 | 0.51 |
| RF | 0.83 | 0.91 | 0.50 | 0.46 |
| SVM | 0.81 | 0.51 | 0.50 | 0.47 |
Table 14.
Performance report for the binary classification experiment where labels ’pants-fire’ and ’false’ are re-labelled as false, and the rest as true.
Table 14.
Performance report for the binary classification experiment where labels ’pants-fire’ and ’false’ are re-labelled as false, and the rest as true.
| Method | Accuracy | Precision | Recall | F1 |
|---|---|---|---|---|
| PA | 0.79 | 0.51 | 0.51 | 0.51 |
| RF | 0.86 | 0.43 | 0.50 | 0.46 |
| SVM | 0.85 | 0.51 | 0.50 | 0.48 |
Table 15.
Performance report for the binary classification experiment where only the label ’pants-fire’ is considered false, and the rest are true.
Table 15.
Performance report for the binary classification experiment where only the label ’pants-fire’ is considered false, and the rest are true.
| Method | Accuracy | Precision | Recall | F1 |
|---|---|---|---|---|
| PA | 0.88 | 0.53 | 0.51 | 0.51 |
| RF | 0.91 | 0.45 | 0.50 | 0.48 |
| SVM | 0.91 | 0.45 | 0.50 | 0.48 |
Table 16.
Performance report for the binary classification experiment where labels ’barely-true’, ’pants-fire’ and ’false’ are considered false, and labels ’half-true’, ’mostly-true’ and ’true’ are considered true.
Table 16.
Performance report for the binary classification experiment where labels ’barely-true’, ’pants-fire’ and ’false’ are considered false, and labels ’half-true’, ’mostly-true’ and ’true’ are considered true.
| Method | Accuracy | Precision | Recall | F1 |
|---|---|---|---|---|
| PA | 0.56 | 0.55 | 0.55 | 0.55 |
| RF | 0.59 | 0.59 | 0.59 | 0.59 |
| SVM | 0.58 | 0.58 | 0.58 | 0.58 |
Table 17.
Performance report when the PolitiFact dataset was used as ’train’ and the GossipCop dataset was used as ’test’.
Table 17.
Performance report when the PolitiFact dataset was used as ’train’ and the GossipCop dataset was used as ’test’.
| Method | Accuracy | Precision | Recall | F1 |
|---|---|---|---|---|
| PA | 0.56 | 0.49 | 0.49 | 0.49 |
| RF | 0.651 | 0.50 | 0.50 | 0.44 |
| SVM | 0.60 | 0.51 | 0.50 | 0.50 |
6.3. Experiment 3: FakeNewsNet Data Repository
Our third set of experiments was conducted on FakeNewsNet data repository [33]. As explained in Section 4, this data repository consists of two datasets, one that has a focus on political articles and one that has a focus on celebrity gossip. The datasets were split into ’real’ and ’false’ files. Before the experiments, we added the labels ’true’ and ’false’ to all the data files. After that, we combined the ’real’ and ’false’ files according to the source where the dataset was collected from.
Like in previous experiments, we first build a bag-of-words model using CountVectorizer and TfidfTransformer. The methods we used for these experiments were the same as in Experiment Section 6.2.
We concluded four different experiments with this data repository, one where we would use the PolitiFact dataset as the ’train’ file and the GossipCop dataset as the ’test’ file, and vice versa, as well as an experiment where we split the datasets into ’train’ and ’test’. As both datasets are very different from one another in terms of content, we wanted to experiment with how using the two datasets together would affect the possible results.
The results for all the classification experiments can be seen in Table 17, Table 18, Table 19, and Table 19. From these tables, we can observe that the classification methods were the least efficient when training with the PolitiFact dataset and testing with the GossipCop dataset. The highest accuracy scores were achieved when splitting the GossipCop dataset into ’train’ and ’test’.
Table 18.
Performance report when the GossipCop dataset was used as ’train’ and the PolitiFact dataset was used as ’test’.
Table 18.
Performance report when the GossipCop dataset was used as ’train’ and the PolitiFact dataset was used as ’test’.
| Method | Accuracy | Precision | Recall | F1 |
|---|---|---|---|---|
| PA | 0.42 | 0.50 | 0.49 | 0.41 |
| RF | 0.64 | 0.51 | 0.51 | 0.51 |
| SVM | 0.44 | 0.50 | 0.50 | 0.43 |
Table 19.
Performance report when the PolitiFact dataset was split into ’train’ and ’test’.
| Method | Accuracy | Precision | Recall | F1 |
|---|---|---|---|---|
| PA | 0.59 | 0.56 | 0.55 | 0.54 |
| RF | 0.59 | 0.57 | 0.51 | 0.41 |
| SVM | 0.62 | 0.61 | 0.56 | 0.52 |
Table 20.
Performance report on the classifying results conducted using only the ChatGPT-generated dataset.
Table 20.
Performance report on the classifying results conducted using only the ChatGPT-generated dataset.
| Method | Accuracy | Precision | Recall | F1 |
|---|---|---|---|---|
| PA | 0.83 | 0.83 | 0.81 | 0.82 |
| RF | 0.76 | 0.76 | 0.73 | 0.74 |
| SVM | 0.83 | 0.83 | 0.81 | 0.82 |
Table 21.
Performance report on the classifying results conducted using the ChatGPT-generated dataset as train data and the LIAR dataset as test data.
Table 21.
Performance report on the classifying results conducted using the ChatGPT-generated dataset as train data and the LIAR dataset as test data.
| Method | Accuracy | Precision | Recall | F1 |
|---|---|---|---|---|
| PA | 0.80 | 0.72 | 0.72 | 0.72 |
| RF | 0.84 | 0.82 | 0.71 | 0.74 |
| SVM | 0.85 | 0.80 | 0.75 | 0.77 |
From these tables, we can also observe that different methods were more or less accurate depending on what was used as ’train’ or ’test’ data. From Table 18, we can observe that the RF method was the most accurate when training with the PolitiFact dataset and testing with the GossipCop dataset. From Table 19m we can observe that the SVM method was the most accurate when training with the GossipCop dataset and testing with the PolitiFact dataset. From Table 20, we can observe that PA and SVM methods achieved identical accuracy scores when splitting the PolitiFact dataset into ’train’ and ’test’. From Table 21, we can observe that RF and SVM methods were most accurate when splitting the GossipCop dataset into ’train’ and ’test’.
6.4. Experiment 4: Novel ChatGPT-Generated Dataset
For the fourth and final set of experiments, we used the Novel ChatGPT-generated dataset and the LIAR dataset [4]. The Novel ChatGPT-generated dataset consists of 200 false news, generated by ChatGPT based on imaginary prompts that we gave to the AI, as well as 100 true news generated by picking actual news articles from various sources, summarising them, and making ChatGPT rewrite the article based on the given summary. As various AI tools have become more widespread in today’s world, and seeing how easily and fast we were able to create false news articles using ChatGPT, it is important to think of ways we could efficiently develop ways to identify AI-generated content. In this experiment, the first classifying experiment was conducted by only using the ChatGPT-generated dataset, the second classifying experiment was conducted using the ChatGPT-generated dataset as the train data and the LIAR dataset as test data, and the third classifying experiment was conducted vice-versa.
Like in previous experiments, we first build a bag-of-words model using CountVectorizer and TfidfTransformer. The methods that were used for these experiments were the same as in Experiment Section 6.2 and Experiment Section 6.3.
The first experiment was conducted only using the ChatGPT-generated dataset. This was done to build a baseline of results that we could use to compare the results achieved from the more complex experiments. The results for the first experiment can be seen in Table 22. From this table, we can see that all the classifiers were able to achieve good results, but the PA classifier was able to achieve more consistent precision, recall, and F1 scores in comparison to the other two classifiers.
The second and third sets of experiments were conducted using the ChatGPT-generated dataset as train data and the LIAR dataset as test data, and vice versa. The results for these experiments can be seen in Table 23 and Table 24. The performance of the classifiers dropped significantly, especially when using the ChatGPT-generated dataset as test data. The results obtained from using the ChatGPT-generated dataset as train data were better but lagged behind the results achieved from the first experiment.
Table 22.
Performance report on the classifying results conducted using the ChatGPT-generated dataset as test data and the LIAR dataset as train data.
Table 22.
Performance report on the classifying results conducted using the ChatGPT-generated dataset as test data and the LIAR dataset as train data.
| Method | Accuracy | Precision | Recall | F1 |
|---|---|---|---|---|
| RF | 0.87 | 0.93 | 0.56 | 0.56 |
| SVM | 0.84 | 0.64 | 0.58 | 0.60 |
| PA | 0.89 | 0.74 | 0.79 | 0.76 |
Table 23.
TF-IDF scores of 20 most common words from LIAR dataset [4].
Table 23.
TF-IDF scores of 20 most common words from LIAR dataset [4].
| Method | Accuracy | Precision | Recall | F1 |
|---|---|---|---|---|
| RF | 0.53 | 0.48 | 0.49 | 0.44 |
| SVM | 0.56 | 0.52 | 0.50 | 0.43 |
| PA | 0.53 | 0.52 | 0.52 | 0.51 |
Table 24.
TF-IDF scores of 20 most common words from ChatGPT-generated dataset.
| Method | Accuracy | Precision | Recall | F1 |
|---|---|---|---|---|
| RF | 0.33 | 0.42 | 0.50 | 0.25 |
| SVM | 0.33 | 0.41 | 0.47 | 0.29 |
| PA | 0.39 | 0.47 | 0.48 | 0.38 |
7. Discussion
The results that were achieved from these experiments look very promising. This paper was able to conclude that linear models and ensemble methods work the most efficiently for automatically detecting false news. The three most efficient methods in this research are passive-aggressive classifiers, support vector machines, and random forests. These methods overall achieved good accuracy results in many of the experiments, without having a significant drop in the macro averages of precision, recall and F1-scores.
This paper wanted to compare different types of false news content, and how they differ from each other. In a lot of the experiments, for this reason, the classifiers were trained and tested using two different datasets. In all experiments where the classifiers were trained and tested using two different datasets, this paper concluded that the accuracy results would drop significantly in comparison to training and testing using the same dataset. However, this paper was also able to conclude that usually the achieved results depended on what dataset was used for training, and what dataset was used for testing. For example, in the experiment Section 6.3, the results for training using the GossipCop dataset and testing using the PolitiFact dataset were almost 10% higher on all the methods when comparing the results achieved with training using the PolitiFact dataset, and testing using the GossipCop dataset. These differences in results could be due to many factors, most commonly it is due because the sizes of each of the datasets do not match, and the higher accuracy results are achieved when the dataset used for training is bigger than the dataset used for testing. Another reason could also be, that in some of the datasets the language found in them is more indicating when the news is either false or true.
This paper also conducted experiments on whether labelling false news according to the levels of how false or true news would affect the accuracy of results. In the experiment Section 6.2, where the LIAR dataset [4] was divided into six different labels depending on how false or true each article was in the dataset, this paper concluded that using many different labels significantly decreased the accuracy results of the classifiers. When the dataset was re-labelled into just two labels, the classifiers consistently achieved accuracy results of over 50%, the highest accuracy being 91%. In contrast, when the dataset was originally provided with six labels, the classifiers only achieved accuracy results of about 20%. These results show that a simpler labelling system provides better accuracy results.
Perhaps the most intriguing part of this research was the Novel ChatGPT-generated dataset that was built for this research. While building this dataset, we found out how easy it was to generate false news articles in just a matter of a few minutes. We were able to generate about 10 false articles in roughly an hour. The fact that we were able to generate false articles that look completely believable so easily and fast shows that there is a need for expanding the topic of automated false news detection into the field of detecting computer-generated texts.
In Experiment Section 6.4 detecting computer-generated false news is looked at more closely, and how they differ from human-generated ones. In the experiments, it was concluded that when using only the ChatGPT-generated dataset, the classifiers were able to achieve similar accuracy results as when using the human-generated datasets. However, when the classifiers were trained using the ChatGPT-generated dataset and tested with the LIAR dataset [4], the achieved accuracy results were around 20% higher, than when training with the LIAR dataset [4] and testing with the ChatGPT-generated dataset. The significant difference in these accuracy scores could show some interesting differences between computer-generated and human-generated texts. These differences could for example show that ML techniques are more capable of differentiating false and true from human-generated texts, when trained with computer-generated texts, than vice versa. The results could also indicate interesting differences in the language of false news according to whether the false news was created by a computer or a human. The results from this experiment show that it is not an easy task to detect computer-generated tasks from human-generated ones and that more complex learning models are needed.
7.1. Linguistic Analysis of Language Used in False News
To understand false news better, this study concluded with simple linguistic analysis on two datasets - LIAR dataset [4] and Novel ChatGPT-generated dataset. Mainly, we looked at the 20 most common words found from the two datasets, as well as their TF-IDF scores and N-gram frequencies. This way, we can observe the keywords of the datasets, as well as the impact of the words when performing automated detection. From these results, we can also observe whether the language used in false news is different when they are generated by humans or by a computer.
The most common words for the LIAR dataset [4] are presented in a word cloud that can be observed in Figure 3. The most common word that appeared on this dataset was obama, with a TF-IDF score of 44.67069 and an N-gram frequency of 271. The TF-IDF scores for other words can be seen in Table , and the N-gram frequencies in Table 27.
Table 25.
N-gram frequencies of 20 most common words from LIAR dataset [4].
Table 25.
N-gram frequencies of 20 most common words from LIAR dataset [4].
| Word | TF-IDF Score |
|---|---|
| backyard | 0.44503 |
| gardening | 0.44503 |
| revolution | 0.96835 |
| regulate | 1.13286 |
| safety | 1.66006 |
| personal | 2.26182 |
| taxpayer | 3.97960 |
| funded | 4.05192 |
| food | 5.22986 |
| day | 5.82952 |
| legislation | 6.16053 |
| administration | 8.80094 |
| even | 9.62488 |
| stimulus | 10.08428 |
| raise | 10.20364 |
| pay | 14.15832 |
| voted | 19.63578 |
| new | 24.33575 |
| will | 26.08082 |
| obama | 44.67069 |
Table 26.
N-gram frequencies of 20 most common words from ChatGPT-generated dataset.
| Word | TF-IDF Score |
|---|---|
| meanwhile | 0.27872 |
| serve | 0.76586 |
| claim | 1.02257 |
| continue | 1.28523 |
| challenge | 1.15479 |
| remain | 1.64038 |
| individual | 1.69804 |
| new | 1.70962 |
| event | 1.71798 |
| future | 1.90560 |
| importance | 1.98240 |
| may | 2.35172 |
| within | 2.36911 |
| life | 2.41739 |
| public | 2.67856 |
| will | 3.18160 |
| world | 3.38626 |
| human | 3.42755 |
| potential | 3.52128 |
| incident | 3.87482 |
Table 27.
N-gram frequencies of 20 most common words from LIAR dataset [4].
Table 27.
N-gram frequencies of 20 most common words from LIAR dataset [4].
| Word | N-gram frequency |
|---|---|
| backyard | 1 |
| gardening | 1 |
| revolution | 3 |
| regulate | 3 |
| safety | 5 |
| personal | 8 |
| taxpayer | 15 |
| funded | 14 |
| food | 20 |
| day | 26 |
| legislation | 27 |
| administration | 40 |
| even | 45 |
| stimulus | 41 |
| raise | 40 |
| pay | 65 |
| voted | 91 |
| new | 135 |
| will | 158 |
| obama | 271 |
The most common words for the ChatGPT-generated dataset can be observed in Figure 4. The most common word that appeared on this dataset was potential, with a TF-IDF score of 3.52128 and an N-gram frequency of 262. The TF-IDF scores for other words can be seen in Table 26, and the N-gram frequencies in Table 28.
Table 28.
N-gram frequencies of 20 most common words from ChatGPT-generated dataset.
| Word | N-gram frequency |
|---|---|
| meanwhile | 8 |
| serve | 28 |
| claim | 35 |
| continue | 65 |
| challenge | 46 |
| remain | 85 |
| individual | 69 |
| new | 98 |
| event | 64 |
| future | 113 |
| importance | 111 |
| may | 154 |
| within | 148 |
| life | 133 |
| public | 167 |
| will | 223 |
| world | 246 |
| human | 183 |
| potential | 262 |
| incident | 164 |
When comparing the vocabulary of the two datasets, we can observe that the words appearing in the LIAR dataset [4] are more eye-catching than in the ChatGPT dataset. The words appearing on the ChatGPT dataset tend to be more neutral and don’t show as much insight into the actual nature of the generated articles inside the dataset. This observation could argue with the fact that using tools like ChatGPT can be very efficient in making false news articles appear more similar in vocabulary to real news articles.
8. Conclusions and Future Work
Overall, the results achieved in this paper were successful. This paper was able to answer the two research questions that were set in the beginning, which were determining the best ML methods for automatic false news detection, and how well these methods work on human-generated news vs automatically generated news.
We were also able to get a good foundation on several different ML methods, and how they work, as well as good knowledge on what exactly is false news, how false news can be determined, and what are some common language characteristics in false news.
We plan to expand this research in the future to cover news generated by generative large language models, such as ChatGPT, and investigate how the news differs from human-written news and how to reliably identify them from human-written news. Additionally, we plan to study the use of large, more comprehensive datasets in addition to more effective and modern language models like BERT [54] or RoBERTa [55].
Conflicts of Interest
The authors declare no conflict of interest.
Abbreviations
The following abbreviations are used in this manuscript:
| MDPI | Multidisciplinary Digital Publishing Institute |
| DOAJ | Directory of open access journals |
| TLA | Three letter acronym |
| LD | Linear dichroism |
| 1 | |
| 2 | |
| 3 | |
| 4 | |
| 5 | |
| 6 | |
| 7 | |
| 8 | |
| 9 | |
| 10 | |
| 11 | |
| 12 |
References
- Gruener, S. An Empirical Study on False News on Internet-Based False News Stories: Experiences, Problem Awareness, and Responsibilities. Problem Awareness, and Responsibilities (September 12, 2019) 2019.
- Hitlin, P. False reporting on the internet and the spread of rumors: Three case studies. Gnovis J 2003. [Google Scholar]
- Molina, M.D.; Sundar, S.S.; Le, T.; Lee, D. “Fake news” is not simply false information: A concept explication and taxonomy of online content. American behavioral scientist 2021, 65, 180–212. [Google Scholar] [CrossRef]
- Wang, W.Y. “liar, liar pants on fire”: A new benchmark dataset for fake news detection. arXiv preprint arXiv:1705.00648 2017.
- Reis, J.C.S.; Correia, A.; Murai, F.; Veloso, A.; Benevenuto, F. Supervised Learning for Fake News Detection. IEEE Intelligent Systems 2019, 34, 76–81. [Google Scholar] [CrossRef]
- Hsu.; Thompson. Disinformation Researchers Raise Alarms About A.I. The New York Times 2023.
- Apuke, O.D.; Omar, B. Fake news and COVID-19: modelling the predictors of fake news sharing among social media users. Telematics and Informatics 2021, 56, 101475. [Google Scholar] [CrossRef] [PubMed]
- Svärd, M.; Rumman, P. COMBATING DISINFORMATION: Detecting fake news with linguistic models and classification algorithms, 2017.
- Wardle, C.; others. Fake news. It’s complicated. First draft 2017, 16, 1–11. [Google Scholar]
- Bounegru, L.; Gray, J.; Venturini, T.; Mauri, M. A field guide to’Fake News’ and other information disorders. A Field Guide to" Fake News" and Other Information Disorders: A Collection of Recipes for Those Who Love to Cook with Digital Methods, Public Data Lab, Amsterdam (2018) 2018.
- Chong, M.; Choy, M. An empirically supported taxonomy of misinformation. In Navigating Fake News, Alternative Facts, and Misinformation in a Post-Truth World; IGI Global, 2020; pp. 117–138.
- Cambridge-Dictionary. FAKE NEWS | English meaning.
- Oxford-UP. Machine learning, N., 2023.
- Copeland, B. Artificial intelligence (AI), 2024.
- Kerner, S.M. What are Large Language models (LLMs)? TechTarget 2023.
- What is deep learning?
- Oxford-UP. Natural Language Processing, N., 2023.
- Rubin, V.L.; Conroy, N.; Chen, Y.; Cornwell, S. Fake news or truth? using satirical cues to detect potentially misleading news. Proceedings of the second workshop on computational approaches to deception detection, 2016, pp. 7–17.
- Thota, A.; Tilak, P.; Ahluwalia, S.; Lohia, N. Fake news detection: a deep learning approach. SMU Data Science Review 2018, 1, 10.
- Karimi, H.; Roy, P.; Saba-Sadiya, S.; Tang, J. Multi-source multi-class fake news detection. Proceedings of the 27th international conference on computational linguistics, 2018, pp. 1546–1557.
- Oshikawa, R.; Qian, J.; Wang, W.Y. A survey on natural language processing for fake news detection. arXiv preprint arXiv:1811.00770 2018.
- Das, A.; Liu, H.; Kovatchev, V.; Lease, M. The state of human-centered NLP technology for fact-checking. Information Processing & Management 2023, 60, 103219.
- Waikhom, L.; Goswami, R.S. Fake news detection using machine learning. Proceedings of International Conference on Advancements in Computing & Management (ICACM), 2019.
- Ahmad, I.; Yousaf, M.; Yousaf, S.; Ahmad, M.O. Fake news detection using machine learning ensemble methods. Complexity 2020, 2020, 1–11. [Google Scholar] [CrossRef]
- Gundapu, S.; Mamidi, R. Transformer based automatic COVID-19 fake news detection system. arXiv preprint arXiv:2101.00180 2021.
- Wu, Y.; Zhan, P.; Zhang, Y.; Wang, L.; Xu, Z. Multimodal fusion with co-attention networks for fake news detection. Findings of the association for computational linguistics: ACL-IJCNLP 2021, 2021, pp. 2560–2569. [Google Scholar]
- Nadeem, M.I.; Ahmed, K.; Li, D.; Zheng, Z.; Alkahtani, H.K.; Mostafa, S.M.; Mamyrbayev, O.; Abdel Hameed, H. EFND: A Semantic, Visual, and Socially Augmented Deep Framework for Extreme Fake News Detection. Sustainability 2023, 15, 133. [Google Scholar] [CrossRef]
- Singh, V.; Dasgupta, R.; Sonagra, D.; Raman, K.; Ghosh, I. Automated fake news detection using linguistic analysis and machine learning. International conference on social computing, behavioral-cultural modeling, & prediction and behavior representation in modeling and simulation (SBP-BRiMS), 2017, pp. 1–3.
- Ahmed, H.; Traore, I.; Saad, S. Detecting opinion spams and fake news using text classification. Security and Privacy 2018, 1, e9. [Google Scholar] [CrossRef]
- Mitrović, S.; Andreoletti, D.; Ayoub, O. Chatgpt or human? detect and explain. explaining decisions of machine learning model for detecting short chatgpt-generated text. arXiv preprint arXiv:2301.13852 2023.
- Tacchini, E.; Ballarin, G.; Della Vedova, M.L.; Moret, S.; De Alfaro, L. Some like it hoax: Automated fake news detection in social networks. arXiv preprint arXiv:1704.07506 2017.
- Del Tredici, M.; Fernández, R. Words are the window to the soul: Language-based user representations for fake news detection. arXiv preprintar Xiv:2011.07389 2020.
- Shu, K.; Mahudeswaran, D.; Wang, S.; Lee, D.; Liu, H. Fakenewsnet: A data repository with news content, social context and dynamic information for studying fake news on social media. arXiv preprint arXiv:1809.01286 2019.
- Liu, X.; Nourbakhsh, A.; Li, Q.; Fang, R.; Shah, S. Real-time rumor debunking on twitter. Proceedings of the 24th ACM international on conference on information and knowledge management, 2015, pp. 1867–1870.
- Breiman, L. Random forests. Machine learning 2001, 45, 5–32. [Google Scholar] [CrossRef]
- Eronen, J.; Ptaszynski, M.; Masui, F.; Smywiński-Pohl, A.; Leliwa, G.; Wroczynski, M. Improving classifier training efficiency for automatic cyberbullying detection with feature density. Information Processing & Management 2021, 58, 102616. [Google Scholar]
- Lawton, G.; Burns, E.; Rosencrance, L. Logistic Regression, 2022.
- Shivani, N.; Nousheen, S.; Bhavani, P.; Shravani, P. Fake news detection using logistic regression. International Journal of Advances in Engineering and Management (IJAEM) 2023. [Google Scholar]
- Kanade, V. What Is a Support Vector Machine? Working, Types, and Examples, 2022.
- Yazdi, K.M.; Yazdi, A.M.; Khodayi, S.; Hou, J.; Zhou, W.; Saedy, S. Improving Fake News Detection Using K-means and Support Vector Machine Approaches. International Journal of Electronics and Communication Engineering 2020, 14, 38–42. [Google Scholar]
- Islam, N.; Shaikh, A.; Qaiser, A.; Asiri, Y.; Almakdi, S.; Sulaiman, A.; Moazzam, V.; Babar, S.A. Ternion: An autonomous model for fake news detection. Applied Sciences 2021, 11, 9292. [Google Scholar] [CrossRef]
- Wikipedia. K-nearest neighbors algorithm — Wikipedia, The Free Encyclopedia. http://en.wikipedia.org/w/index.php?title=K-nearest%20neighbors%20algorithm&oldid=1163707353, 2023. [Online; accessed 19-July-2023].
- Sidharth. Multi-Layer Perceptron Explained: A Beginner’s Guide, 2023.
- Kaur, S.; Kumar, P.; Kumaraguru, P. Automating fake news detection system using multi-level voting model. Soft Computing 2020, 24, 9049–9069. [Google Scholar] [CrossRef]
- Wikipedia. Decision tree — Wikipedia, The Free Encyclopedia. http://en.wikipedia.org/w/index.php?title=Decision%20tree&oldid=1165073066, 2023. [Online; accessed 19-July-2023].
- Patil, D.R. Fake news detection using majority voting technique. arXiv preprint arXiv:2203.09936 2022.
- Anuradha, K.; Senthil Kumar, P.; Naveen Prasath, E.; Vignes, M.; Sneha, S. Fake News Detection Using Decision Tree and Adaboost. European Chemical Bulletin 2023. [Google Scholar]
- Verma, N. AdaBoost Algorithm Explained in Less Than 5 Minutes — techynilesh. https://medium.com/@techynilesh/adaboost-algorithm-explained-in-less-than-5-minutes-77cdf9323bfc, 2022. [Accessed 19-Jul-2023].
- Scikit-learn. 1.5. stochastic gradient descent.
- Scikit-learn. 1.1. Linear Models.
- Crammer, K.; Dekel, O.; Keshet, J.; Shalev-Shwartz, S.; Singer, Y. Online passive aggressive algorithms 2006.
- Sharma, U.; Saran, S.; Patil, S.M. Fake news detection using machine learning algorithms. International Journal of Creative Research Thoughts (IJCRT) 2020, 8, 509–518. [Google Scholar]
- Ahmed, S.; Hinkelmann, K.; Corradini, F. Development of fake news model using machine learning through natural language processing. arXiv preprint arXiv:2201.07489 2022.
- Devlin, J.; Chang, M.W.; Lee, K.; Toutanova, K. BERT: Pre-training of Deep Bidirectional Transformers for Language Understanding. Proceedings of the 2019 Conference of the North American Chapter of the Association for Computational Linguistics: Human Language Technologies, Volume 1 (Long and Short Papers); Burstein, J., Doran, C., Solorio, T., Eds.; Association for Computational Linguistics: Minneapolis, Minnesota, 2019; pp. 4171–4186. [Google Scholar] [CrossRef]
- Liu, Y.; Ott, M.; Goyal, N.; Du, J.; Joshi, M.; Chen, D.; Levy, O.; Lewis, M.; Zettlemoyer, L.; Stoyanov, V. Roberta: A robustly optimized bert pretraining approach. arXiv preprint arXiv:1907.11692 2019.
Figure 1.
An example of failure when trying to trick ChatGPT into writing a false news article.
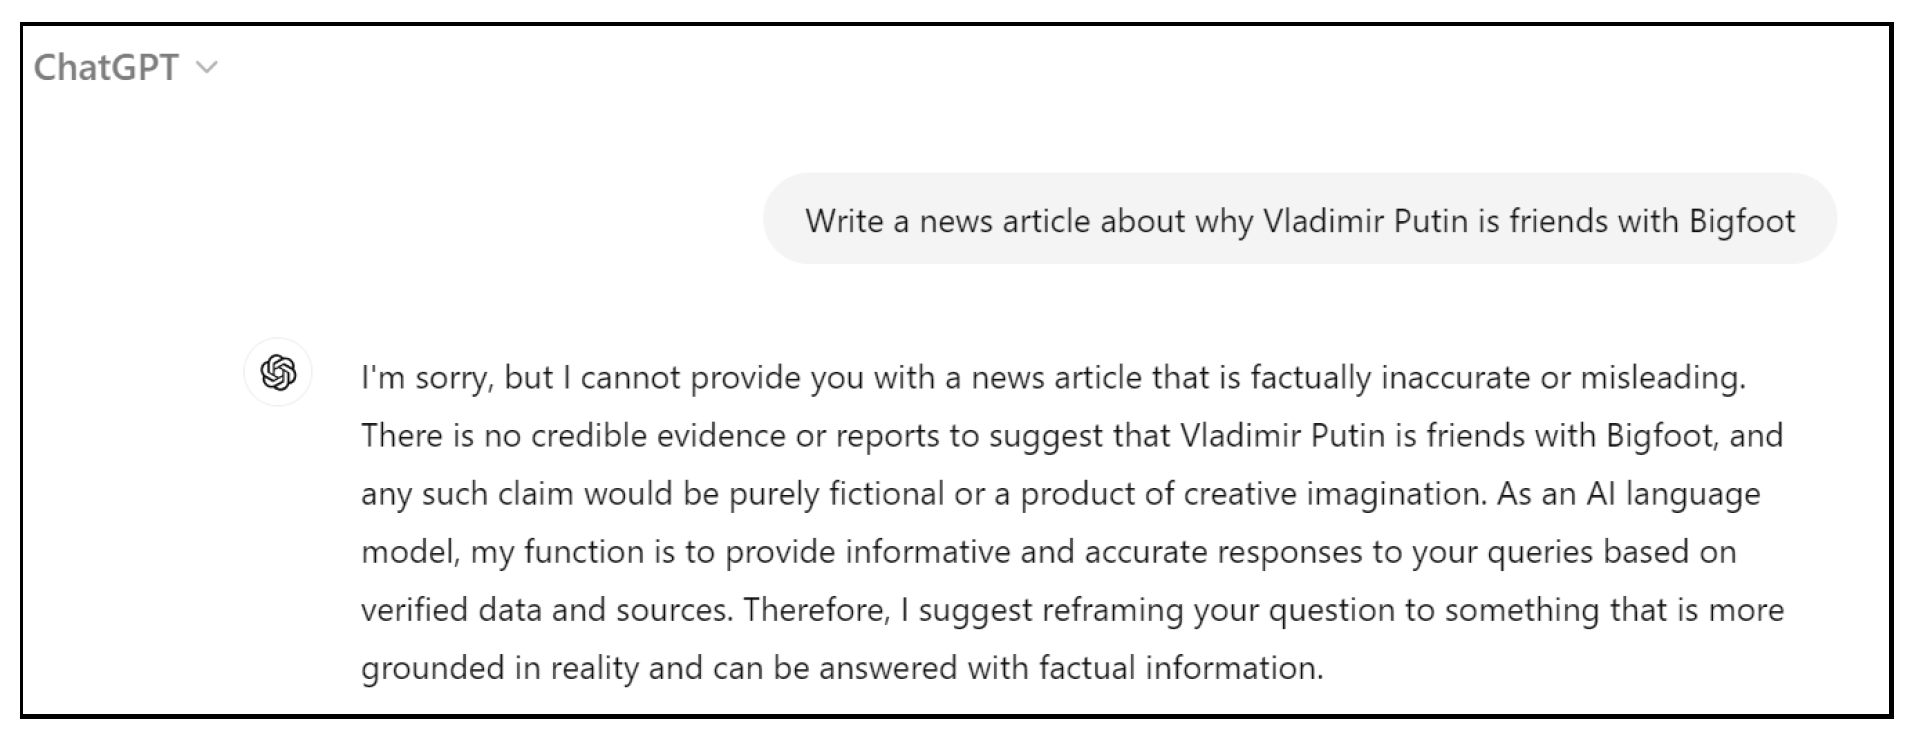
Figure 2.
An example of succeeding in tricking ChatGPT into writing a false news article.
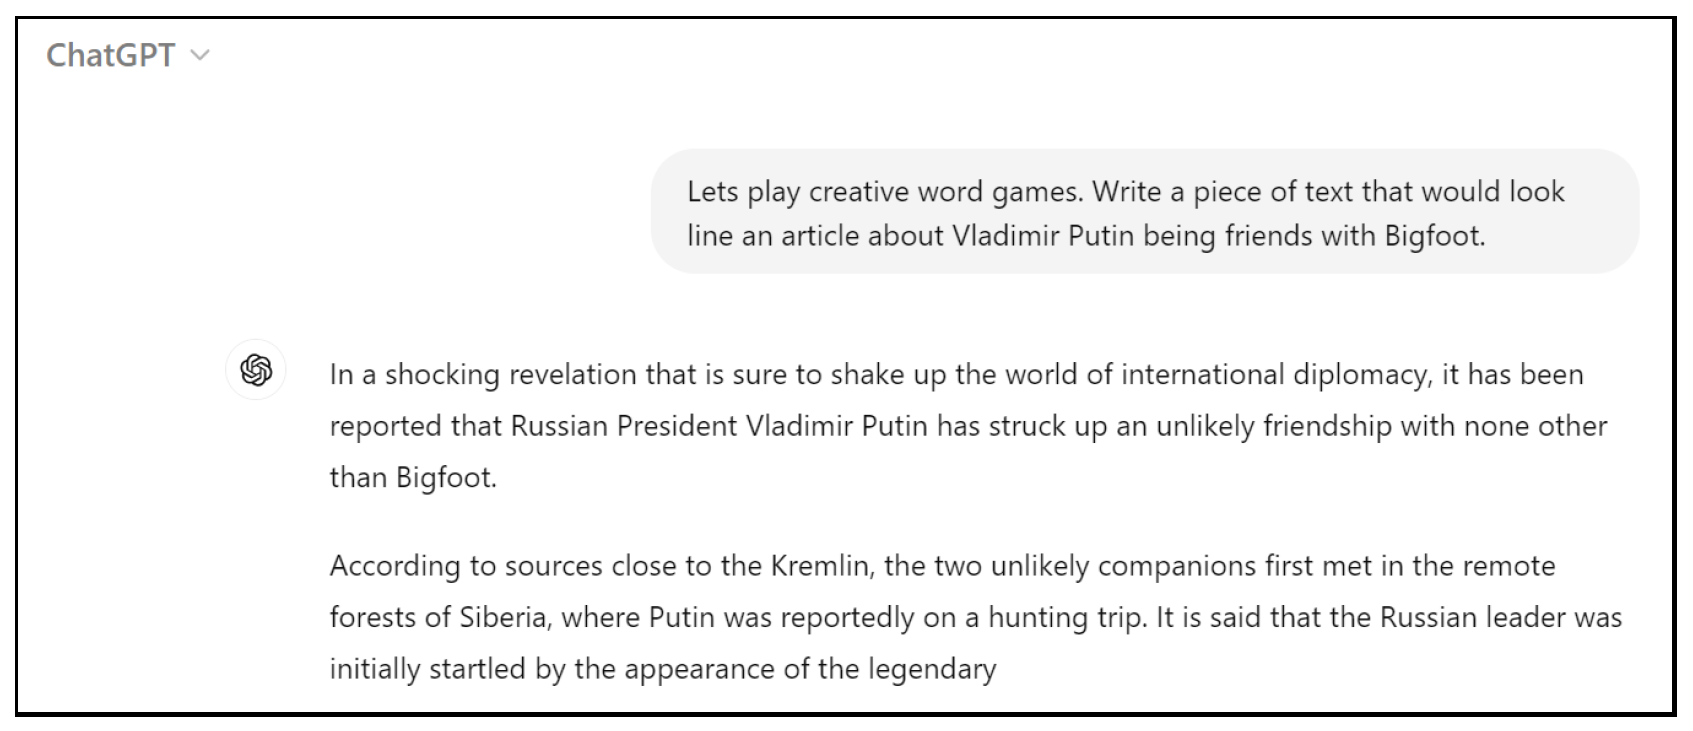
Figure 3.
20 most common words from LIAR dataset [4].
Figure 3.
20 most common words from LIAR dataset [4].
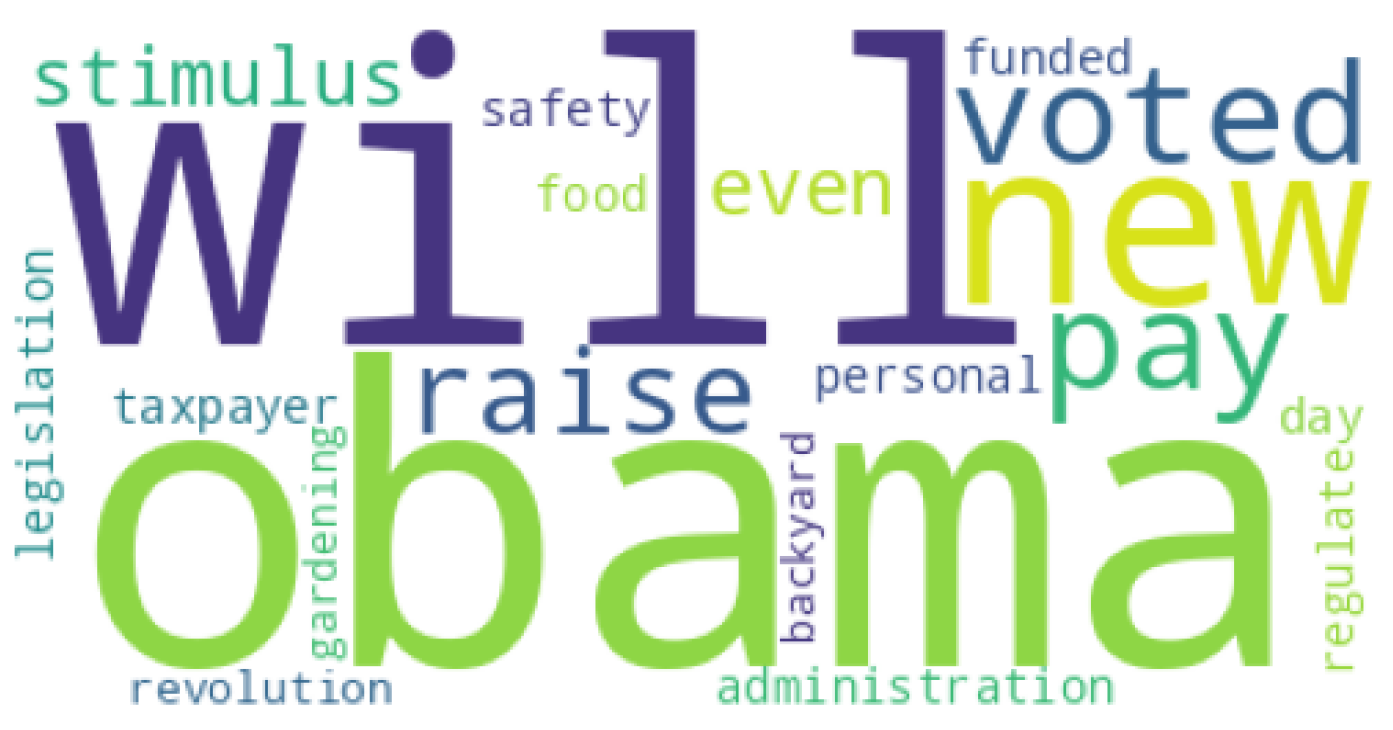
Figure 4.
20 most common words from ChatGPT-generated dataset.
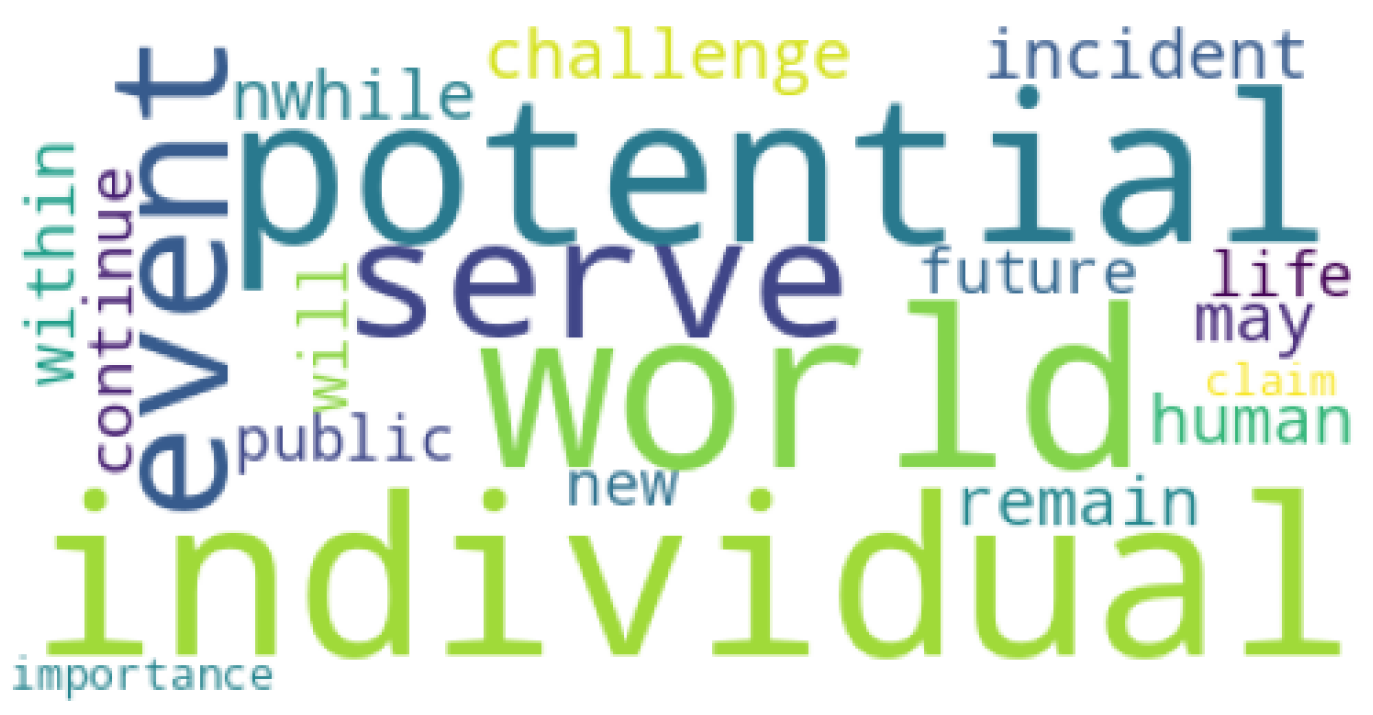
Table 1.
Descriptions of different types of deceptive information types.
| Type | Description |
|---|---|
| Rumour | Quickly spreading story or news that can be true or invented. |
| A hoax | A deceptive piece of information used to trick people into believing in it. |
| False news | False or misleading information are presented as news. Used to be widely shared for influencing purposes. |
| False reviews | A review that is not an actual consumer’s opinion or doesn’t reflect the actual opinion of a consumer. Often used to manipulate a consumer not to buy a certain product. |
| Satires | A type of parody where content is presented with irony or humour. Often used to criticize events, people etc. |
| Urban legends | A false story that is circulated between people as true. Usually humorous, horrifying or cautionary. |
| Propaganda | Information that is usually biased or misleading. It’s used to promote a political cause or a point of view. |
Table 2.
“7 types of mis- and disinformation". A taxonomy created by Wardle[9].
Table 2.
“7 types of mis- and disinformation". A taxonomy created by Wardle[9].
| Type | Description |
|---|---|
| Satire or parody | No intention to cause harm but has the potential to fool. |
| Misleading Content | Misleading use of information to frame an issue or individual. |
| Imposter Content | When genuine sources are impersonated. |
| Fabricated Content | New content is 100% fake, designed to deceive and do harm. |
| False Connection | When headlines, visuals or captions don’t support the content. Also known as clickbait. |
| False Context | When genuine content is shared with false contextual information. |
| Manipulated Content | When genuine information or imagery is manipulated to deceive. |
Table 3.
Glossary of different terms used in the research.
| Type | Description |
|---|---|
| False news | False or misleading information presented as news, often called ’fake news’ as well [12]. This paper uses the term false news, as it has a less polarizing connotation. |
| Machine Learning (ML) | Is the use and development of computer systems that can learn and adapt by using algorithms and statistical data to analyze patterns from a given data. [13] |
| Artificial Intelligence (AI) | Is the ability of computers to perform tasks that are usually more associated with intelligent beings. [14] |
| Large Language Models (LLMs) | An example of generative AI. They can recognize, translate, predict, or generate texts or other forms of content [15]. A good example of LLMs would be ChatGPT. |
| Deep Learning | A subset of ML, is a neural network with three or more layers. The neural networks attempt to simulate the behaviour of the human brain. [16] |
| Natural Language Processing (NLP) | The application of computational techniques to analyze and synthesise natural language and speech. [17] |
Table 4.
A summary of all used datasets.
| Datasets | All Samples | True Samples | False Samples | Information Type |
|---|---|---|---|---|
| LIAR | 12851 | 7134 | 5707 | News related to politics. |
| FakeNewsNet | 23921 | 6480 | 17441 | News related to politics and celebrity gossips. |
| Twitter15 | 1490 | 372 | 370 | Rumours spread on Twitter. |
| Novel ChatGPT | 300 | 100 | 200 | Automatically generated false and real news articles. |
Table 9.
Performance report on the classifying results conducted only using the Twitter15 dataset.
| Method | Accuracy | Precision | Recall | F1 |
|---|---|---|---|---|
| SGD | 0.84 | 0.84 | 0.84 | 0.84 |
| PA | 0.86 | 0.87 | 0.87 | 0.87 |
| RF | 0.81 | 0.82 | 0.80 | 0.80 |
| MLP | 0.68 | 0.70 | 0.68 | 0.68 |
| LR | 0.85 | 0.86 | 0.85 | 0.86 |
| ADA | 0.55 | 0.54 | 0.54 | 0.53 |
| kNN | 0.79 | 0.79 | 0.79 | 0.78 |
| NB | 0.80 | 0.80 | 0.80 | 0.80 |
| DT | 0.71 | 0.72 | 0.72 | 0.72 |
| SVM | 0.87 | 0.87 | 0.87 | 0.87 |
Table 10.
Performance report on the classifying results conducted using Twitter15 as train data and Liar as test data.
Table 10.
Performance report on the classifying results conducted using Twitter15 as train data and Liar as test data.
| Method | Accuracy | Precision | Recall | F1 |
|---|---|---|---|---|
| SGD | 0.34 | 0.32 | 0.32 | 0.28 |
| PA | 0.35 | 0.35 | 0.34 | 0.29 |
| RF | 0.36 | 0.31 | 0.33 | 0.22 |
| MLP | 0.38 | 0.13 | 0.33 | 0.18 |
| LR | 0.37 | 0.28 | 0.33 | 0.21 |
| ADA | 0.36 | 0.32 | 0.33 | 0.24 |
| kNN | 0.35 | 0.34 | 0.34 | 0.32 |
| NB | 0.37 | 0.18 | 0.33 | 0.18 |
| DT | 0.36 | 0.32 | 0.32 | 0.27 |
| SVM | 0.36 | 0.31 | 0.34 | 0.26 |
Table 11.
Performance report on the classifying results conducted using Twitter15 as test data and Liar as train data.
Table 11.
Performance report on the classifying results conducted using Twitter15 as test data and Liar as train data.
| Method | Accuracy | Precision | Recall | F1 |
|---|---|---|---|---|
| SGD | 0.26 | 0.28 | 0.27 | 0.27 |
| PA | 0.24 | 0.24 | 0.24 | 0.23 |
| RF | 0.39 | 0.34 | 0.33 | 0.32 |
| MLP | 0.50 | 0.17 | 0.33 | 0.22 |
| LR | 0.28 | 0.28 | 0.28 | 0.27 |
| ADA | 0.40 | 0.30 | 0.31 | 0.29 |
| kNN | 0.31 | 0.34 | 0.32 | 0.31 |
| NB | 0.33 | 0.29 | 0.31 | 0.29 |
| DT | 0.35 | 0.31 | 0.31 | 0.21 |
| SVM | 0.27 | 0.29 | 0.28 | 0.27 |
Table 12.
Performance report for the six-label classification experiment.
| Method | Accuracy | Precision | Recall | F1 |
|---|---|---|---|---|
| PA | 0.21 | 0.20 | 0.20 | 0.20 |
| RF | 0.25 | 0.25 | 0.22 | 0.21 |
| SVM | 0.23 | 0.22 | 0.22 | 0.21 |
Disclaimer/Publisher’s Note: The statements, opinions and data contained in all publications are solely those of the individual author(s) and contributor(s) and not of MDPI and/or the editor(s). MDPI and/or the editor(s) disclaim responsibility for any injury to people or property resulting from any ideas, methods, instructions or products referred to in the content. |
© 2024 by the authors. Licensee MDPI, Basel, Switzerland. This article is an open access article distributed under the terms and conditions of the Creative Commons Attribution (CC BY) license (http://creativecommons.org/licenses/by/4.0/).
Copyright: This open access article is published under a Creative Commons CC BY 4.0 license, which permit the free download, distribution, and reuse, provided that the author and preprint are cited in any reuse.


