
Submitted:
11 August 2024
Posted:
12 August 2024
You are already at the latest version
Abstract
For decades, the discoverability and visibility of a paper relied on the readership of the academic journal where the publication was issued. The public's increasing interest in scientific research, particularly in biomedicine, has led news media outlets to play a significant role in disseminating scientific advances. This investigation, which explores the potential impact of news media stories on the citations and altmetrics of a paper, was conducted with thoroughness and rigour. A total of 2020 open access biomedical research papers, all published in the same year, 2015, and in journals with an impact factor between 10 and 14, were investigated. The papers were split into two groups based on the sole criterion of receiving or not receiving news media coverage. Papers with news media coverage accounted for 44% of the total. They received, on average, 60% more citations, 104% more blogs, 150% more X posts, 106% more Facebook reports, 40% more Wikipedia references, 85% more videos, and 51% more Mendeley readers than papers without news media coverage. The correlation between news media outlets and increased citations and altmetrics is evident. However, the broader societal impact of news media coverage, in terms of bringing scientific matters or discoveries to the public eye, appears to be more robust when compared to the reactions of the scientific community.
Keywords:
News media
; Science communication
; Selective dissemination
; Citations
; Blogs
; Tweets
; Facebook
; Wikipedia
; Videos
; Mendeley.
1. Introduction
Recognising a scientific contribution by peers, as recorded by citations, is essential for a scientific author to support career development, increase status in the scientific community, and access to financial support for research. International academic editions provide the means to disseminate research findings to the scientific community of specialists in the same topic or domain. However, in the vicinity of thousands or millions of papers, discoverability in the first place becomes crucial. The journal's title, where a scientific paper is published, reputation, and impact on the relevant research field are determinants of citation counts [1]. On top, the bibliometrics of a journal, as the number of articles published, their references and citations measures per year or other chronological period, represent the communication process and ranking among academic editions [2,3]. Of course, the quality of the work, content, importance, novelty, rationale, methodologies, and findings are the essence of an original scientific research paper. But if it is not searchable, discoverable, retrievable, or accessible to many peers, it will not be easily visible and ultimately citable [4].
Disruptive innovations in current awareness services for scientists such as Current Contents [5], the Chemical Abstracts [6], the Medline [7], and the introduction of new publication system technologies, the electronic [8] and open access [9] ones, changed fundamentally the searchability and discoverability of papers but also increased the output of worldwide scientific productivity. In biomedicine and health sciences alone, more than seventeen million research papers have been published over the past decade. Together with the thirty million preceding ones, they compete for citations when the yearly average citation output of the decade is more than fifty million [10]. The citation distribution in biomedicine is highly skewed [11], with almost 35% of the total biomedical papers without citations [10]. The percentage of documents per year without citation has increased for recent publications, with 42% for the year before, 60% for last year, and 88% for this year [10]. This indicates that the intensity of competition for citations for recent paper publications represents a trend of increasing pressure.
The increasing enthusiasm of the public in the US for scientific advances at the turn of the 20th century and the insufficiency of journalism reporting on research results of this era led to the formation of the first scientific news media organisation, the publisher of Science News [12]. From this point forward, scientific journalism has expanded worldwide in news media agencies. Scientific sections enrich the content of newspapers, magazines, radio, and television. The internet era brought news outlets and their stories online, accompanied by blogs and social media reposts [13]. Consumption of biomedical, clinical, biological and health sciences breakthroughs through news media outlets are expected but not free from exaggerations or distortions in the stories or the follow-up comments and people's views [14]. The media outlets’ scientific coverage of biomedical sciences peaked during the COVID-19 pandemic when a wave of information was described as infodemic [15]. The haphazard accumulation of contradicting information derived from scientific communications through scholarly peer-reviewed papers and unreviewed preprints confused the public but, at the same time, exhibited the influential role of news media stories for the people [16]. However, is the impact of news media coverage of the same magnitude to the scientific community and the public?
Previous reports applied different methodologies to assess the press relations to scientific publications and their implication in scholarly communication and society. One approach is to focus on news media channels and their content. By analysing their content and their relations to scientific journal reports and topics of interest, conclusions could be extracted from their mutual interactions [17]. Another approach is topic-oriented, when news stories about a particular subject are analysed to track their source [18,19]. A third approach is to use social media to track their relationships with news and credible informational sources [15] or to check the scientific news background and quality by text analysis, keywords, or phrases in scientific literature [20]. This paper's scientific literature-driven approach was preferred as the starting point for data collection and analysis.
This work investigates whether the bibliometrics and altmetrics of biomedical papers in news media outlets' spotlight significantly differ from those bypassed. This work is not focused on specific news media outlets or their types, commercial or non-profit, nor their scopes general, political, business, scientific, educational, health, entertainment or lifestyle-oriented, fact-checking or biases, but rather on the reference material, the scientific papers reported. A decade-old aged- and middle-to-top impact factor-matched, all open access, bibliographical portfolio of biomedical papers was generated and served as a sample. The portfolio was divided into two subsets based on news media stories. In this paper, the identities or types of news media outlets were not considered because their complete, detailed information was unavailable in the database. The bibliometric and altmetrics of the two groups were compared to show that papers with news stories received more citations, blog reports, X posts, Facebook mentions, Wikipedia references, video references, and more Mendeley readers than their matching counterparts without news media attention. The magnitude of differences was substantially higher for all altmetrics variables compared to citations or Mendeley readers. This indicates that news media stories were inflated by the social media responses of the public and that the papers out of the news media spotlight were not negligible enough to be neglected by the media and left outside of public awareness. The invisibility of a scientific work from the public eye could affect public understanding and opinions. A merely informed society may face the same risks as a misinformed one. In both cases, it would be challenging to make wise decisions for policy formulations in crucial public health issues [21]. Therefore, the journalist's newsworthiness criteria for a scientific report should be carefully considered and evaluated.
2. Materials and Methods
2.1. Journal and Articles Collection
To generate a homogenous bibliographical portfolio of biomedical papers of closely similar publication attributes by eliminating possible factors that could affect citations and altmetrics, it was decided: (a) to seek journals of the same impact factor rank by the time of their publication, (b) to look for a publication year a time point old enough to follow up citations and altmetrics [22] but within the altmetrics era [23], and not severely affected by the COVID-19 observed infodemic [15], (c) to consider only All Open Access publications to avoid possible distortions because of paywall accessibility restrictions, and (d) to consider only research papers, not reviews, news, views or editorials. A preliminary analysis of news media stories' attention for publications in highly ranked scientific journals suggested the most appropriate segregating impact factor values from 10 to 14. The content of these middle- to top-ranked journals received a 50:50 news media outlet’s attention, according to their various journalism scopes. The publication era selected was 2015. The Clarivate Journal Citation Reports (JCR) Science Citation Index Expanded (SCIE) 2015 edition® was used as a reference. The indexed journals for the following 6 Web of Science Categories: Medicine, General & Internal; Medicine, Research & Experimental; Physiology; Biochemistry & Molecular Biology; Genetics & Heredity; and Neuroscience, were considered, and 26 journal titles found within the pre-specified impact factor limits. These titles were the following: Neuron, Molecular Cell, Molecular Biology and Evolution, Journal of Clinical Investigation, Brain, Journal of Experimental Medicine, Nature Chemical Biology, Genes & Development, American Journal of Human Genetics, Nature Structural &Molecular Biology, Genome Research, PLOS Medicine, Molecular Psychiatry, Progress in Neurobiology, Trends in Biochemical Sciences, Trends in Neurosciences, Annual Review of Genetics, Acta Neuropathologica, Genome Biology, Progress in Lipid Research, Biological Psychiatry, Natural Product Reports, Annual Review of Medicine, Molecular Aspects of Medicine, Biological Reviews, and Molecular Systems Biology. These journals were applied as Source Title to the Digital Science Dimensions® search query to retrieve all papers issued by them in 2015 with the additional pre-specified inclusion criteria of only research papers and only All Open Access publications. The outcome included 18 source titles, namely Acta Neuropathologica, American Journal of Human Genetics, Biological Psychiatry, Brain, Genes & Development, Genome Biology, Journal of Clinical Investigation, Journal of Experimental Medicine, Molecular Aspects of Medicine, Molecular Cell, Molecular Psychiatry, Nature Structural & Molecular Biology, Neuron, PLOS Medicine, Progress in Lipid Research, Progress in Neurobiology, Trends in Biochemical Sciences, and Trends in Neurosciences, with 2020 publications. All journals included in the study publish papers in the English language.
2.2. Data Extraction
The outcome of the bibliographic investigation was retrieved through the export results function of Digital Science Dimensions® by downloading the export full record comma-separated values and the export for the bibliometric mapping file. The bibliometric information for the number of citations received by a publication and its field citation ratio (FCR) and relative citation ratio (RCR) were retrieved with the export of the entire record file. FCR is the comparative ratio of the citations received by a publication to the average citations received by similarly aged publications of the same field. RCR indicates the relative citation performance of a publication to other publications in the same area of research. However, the altmetrics indicators were not directly extractable from the database. Therefore, the collective export full record extracted files were merged into a single spreadsheet file with additional altimetric columns as follows: Altmetric Attention Score®, as the weighted count of all online altmetrics calculated by Digital Science Dimensions®, News outlets, referred to news stories online, blogs references, references in policy sources, X posts (former tweets), patent citations, mentions by peer review sites, Facebook mentions, Sina Weibo mentions, a Chinese microblogging service, Wikipedia, Google+, a social network that ceased operations in 2019, Reddit, videos from YouTube creators, research highlight platform, such as faculty opinions, Mendeley readers, and CiteULike bookmarks. These data were directly accessed through the Altmetric® doughnut link accompanied by each publication record from Digital Science Dimensions® and manually copied to the spreadsheet file next to each paper title.
2.3. Statistical Analysis
Descriptive statistics, box and whisker plots, agreement statistics on dichotomous ratings, and Pearson correlation tests were performed with Microsoft Excel®. Likelihood ratio chi-square tests were performed to calculate odds ratios and their 95% confidence interval. Data are presented as mean ± standard deviation. A p-value of <0.05 was considered statistically significant. Power calculations for proportions were performed before considering biomedical literature associations with news stories and the strategic design of this observational study. For a difference of 5% of observed proportions of compared datasets of a sample size of 100 to 1000 at the 0.05 significant level with the Yates correction factor, the statistical power increased from 0.187 to 0.986. Therefore, subgrouping considerations that reduce the comparable sample size <100 should be considered carefully.
3. Results
To investigate the effects of news stories of scientific paper publications on their citations and altmetrics, a bibliographical portfolio of common attributes was generated, as depicted in the flowchart presented in Figure 1. The common qualities applied to achieve as much uniformity as possible were for all works to be published in a cohort of biomedical journals with a journal impact factor between 10 and 14 by 2015, the year of their publication, and to be original research papers, all open access. The information about bibliometrics and altmetrics was manually collected from Digital Science Dimensions®, for each report met the inclusion criteria. This 2020 original research biomedical report portfolio was divided into two groups of 882 published papers (44% of the total) and 1138 without (56% of the total) news stories. The publications with and without news stories are presented in Figure 2. The percentage of papers receiving news attention per journal varied from 30% (American Journal of Human Genetics) to 52% (Acta Neuropathologica). The documents with news stories received 5,121 mentions by news outlets, on average 5.8 ± 9.9, with a lower quartile (25% percentile) of 1, a median of 3, and an upper quartile (75% percentile) of 7 mentions. The distribution of news stories per journal studied is presented in Figure 3. Except for journals with less than five publications with new stories, the rest exhibited similar news story distributions. Noteworthy, outliers receive significantly higher news stories far above the upper quartile of the journals’ paper distribution. This suggests that these papers' unique individual characteristics, topic, title, authors, and content strongly contribute to the increased attraction of news outlets, which, for some, is accompanied by increased altmetrics.
The number of papers with citations, FCR, RCR, Altmetric Score, blogs, policy sources, X posts, patent citations, peer review sites, Facebook, Weibo, Wikipedia, mentions in Q & A, Google+, Reddit, videos, faculty opinions, Mendeley, and CiteULike per group with and without news stories are depicted in Table 1. Nearly all papers in both groups with and without news stories received at least one citation, one X post, or one Mendeley reader, but other altmetrics variables differed significantly with 3.6-fold more papers with blog mentions, 3.7-fold more with policy sources, twice as many with Google+ mentions, 5-fold more with Reddit mentions, 2.6-fold more papers with videos in the news stories group, whilst the rest, namely patent citations, Facebook, Weibo, Wikipedia, faculty opinions and CiteULike were pretty similar.
The total number of these variables metrics per group is presented in Table 2. Papers with news media coverage exhibited a 60% increase in the average number of citations per paper, 70% higher average FCR, and 69% higher RCR. However, regarding the altmetrics these differences are much more significant with a 9-fold increase of the average Altmetrics Score for papers with news stories when compared to those without, 7-fold more blogs, 6-fold more policy sources, 2.7-fold more X posts, 50% more patent citations, 3.4-fold more Facebook mentions, 5-fold more mentions in Weibo, twice more mentions in Wikipedia, 7-fold more mentions in Google+, 6-fold more mentions in Reddit, 6.5-fold more videos, and 60% more of the average Mendeley readers. The only variables with similar average values were peer review sites, mentions in Q & A, faculty opinions and CiteULike. These positive correlations between news stories, bibliometrics and altmetrics are further increased when the number of news stories per paper is considered. Papers that received news outlets' attention of the upper quartile and above, with at least seven news stories, received on average twice as many citations, blogs, X posts, Facebook mentions, Wikipedia references, videos, and Mendeley readers than papers of the lower quartile.
The distributions of citations per journal with and without news stories are depicted in Figure 4. News stories affect the odds of receiving more citations for publications in the same journal and year, as indicated by the increase in the lower, median, and upper quartiles. The effect of news media stories on altmetrics scores is far more prominent as it is presented in the comparative depiction of the distributions of altmetrics scores per journal with and without news stories in Figure 5. Orders of magnitude increases of lower, median and upper quartiles of the distribution of altmetrics are evident for all journals for the papers that attract news outlets' attention compared to those without.
Notably, the odds ratio for increased citations, FCR, altmetrics score, blogs, policy sources, X posts, Facebook mentions, Weibo, Wikipedia, Google+, Reddit, videos and Mendeley readers of original biomedical research, all open access reports with news outlets attention when compared to age- and attributes-matched reports, all published in the same cohort of journals with similar median to high impact factors, found to be statistically significant different as depicted in the agreement statistical analysis in Figure 6. The highest odds ratios were obtained for altmetrics score and Mendeley readers, with OR values nearly 50 (95% CI, 7-357), followed by blogs with an OR 9 (95% CI, 7-11), and Reddit with an OR 6 (95% CI, 3.5-10). This observation suggests that the impact of news stories is more substantial for altmetrics when compared to bibliometrics.
Pearson correlation analysis of paper citations, FCR, altmetrics score, news stories, X posts, Facebook, Mendeley and patents citations for the complete bibliographic portfolio of 2020 reports revealed the correlations between these variables as indicated in Table 3 and Figure 7(a). These correlations reflect linear associations between these parameters, as Figure 7(b) depicts. Citations correlate well with FCR and Mendeley but not with news stories, whilst news stories correlate with altmetrics score and, to a lesser extent, with X posts and Facebook mentions. The scatter plots and linear regressions of news stories exhibited slopes of 1.146 for citations, 0.653 for FCR, 10.015 for altmetrics score, 3.284 for X posts, 0.236 for Facebook, 6.180 for Mendeley, but 0.003 for patents citations. This is an additional indication of the impact of news stories on altmetrics when compared to bibliometrics.
Collectively, these data suggest that news outlets' stories on original research paper publications are an independent factor correlated well with enhanced bibliometrics parameters but strongly associated with increased altmetrics variables.
4. Discussion
Quantifying multivariable-dependent trends in cross-sectional studies, such as the correlation of news stories with bibliometrics and altmetrics, could be particularly challenging. Therefore, this study focused on generating homogenous and well-matched groups of scientific publications to compare. A total of 2020 original biomedical research articles were investigated, and all open-access articles published within the same year in 18 journals had impact factors between 10 and 14. By selecting 2015 as the publication year, the recent effects of COVID-19 infodemics were also avoided [15]. This bibliographic portfolio was split into two groups of articles: those with and those without news stories. By controlling for the research field, year of publication, journal impact factor, and accessibility to readers, the effects of news stories were accessible.
The distribution of news stories per journal is similar except for journals with less than five papers with news stories. The outliers above the upper quartile of these distributions indicate journals with unique characteristics that explain the increased attention by news outlets and other altmetrics variables that reflect public opinion, reactions or discussions over them. As recently postulated, a scientific publication communicated to different audiences, peers or the public may produce different responses [24]. This study sheds light on the differential dynamics of the impact of biomedical research on specialists and non-specialist audiences. News stories correlate with more citations, blogs, X posts, Facebook reports, Wikipedia references, videos, and Mendeley readers in biomedicine. However, their impact on papers’ altmetrics is several times stronger than bibliometrics, as indicated by two lines of evidence: the collective data of a total number of citations or altmetrics mentions with their descriptive statistics and the box and whisker plots of paper distribution per journal according to citations or altmetrics score. Whilst the outliers indicate papers with unique characteristics that explain their high citability or altmetrics attraction state, the distributions per journal attest that grouping by news stories reflect actual differences of papers published in the same journal and year in bibliometrics and altmetrics. However, the predictive ability of news stories for citations or altmetrics variables differs significantly, as indicated by agreement statistics. According to this analysis, the predictive ability of at least one news story is good for overall altmetrics score, blogs, policy sources, X posts, Facebook, Wikipedia, Google+, Reddit, videos, and Mendeley readers. Therefore, the impact of news stories on social media appears to be significantly more potent than on the scientific audience. Although it has been shown that early Mendeley readers correlate well with later citation counts [25], the odds ratio of papers with news stories versus papers without suggests that the impact on citations is moderate compared to a 25-times more substantial effect on Mendeley readers. When considering that the publications explored are already ten years old, so there was enough time to receive citations, it may be concluded that the Mendeley readers may cite only a few from all the reports they accessed and read, as well as that the Mendeley readers population is parted by few expert scientific authors when compared to many young investigators that still don’t produce their peer-review works.
Pearson correlation accompanied by linear regression analyses were performed to detect linear relationships between the variables examined. These analyses were not performed in groups but in the whole bibliographic portfolio. They showed that the bibliometric variables correlate with each other and Mendeley, and altmetrics variables correlate well but with lesser linear relationships rather than modifier factors. News stories correlate linearly with the overall altmetrics score, with a relationship of 1 news story to an increase of 10 in the altmetrics score. This finding suggests an amplification of news stories by altmetrics resources. There are also partial linear correlations between news stories with X posts and Facebook mentions but not with citations. This finding indicates that even though news stories are associated with more citations, this relationship is not linear, and the effect of outliers with individual characteristics that attract citations may be significant.
This study has some limitations that should be mentioned. Firstly, obtaining the flow of altmetrics variables in time series was impossible due to the platform restrictions. Secondly, selecting a publication year to achieve uniformity of citation and altmetrics information may mask longitudinal trends. Thirdly, this study didn’t consider the individual characteristics of each publication examined, such as topic, title, authors, affiliated institutions or countries, abstracts, or keywords. Fourthly, the criteria for journalists to select newsworthy research papers is out of the scope of this work. Fifth, this report couldn’t obtain the full text of the news stories about the documents examined to comment on the manner of scientific information delivery or explanation by the news outlets.
This is the first cross-sectional investigation of news stories' effects in bibliometrics and altmetrics in biomedicine, with uniformity of age, journal impact factor, and access-matched groups of papers. Its quantified observations provide a better understanding of the relationships between published research reports' audiences, scientific experts, and the public.
5. Conclusions
This cross-sectional controlled study demonstrated the strong impact of news media outlets on social media mentions and its close correlation with more citations for the mentioned papers in biomedicine. News media stories may serve as predictors for high altmetrics performance and, to a lesser extent, for bibliometrics. The relationship of news stories with each social media resource suggests the co-existence of modifying factors possibly associated with each paper's individual characteristics. Outliers represent unique cases of attention attraction by the scientific community, the public or both. The critical appraisal and dissemination criteria of a recently published scientific work remained to be elucidated. Still, overall, the data presented suggest that any news media publicity impacts the bibliometrics and altmetrics of a biomedical original research paper.
Conflicts of Interest
The authors declare no conflicts of interest.
References
- Didegah, F. , & Thelwall, M. (2013). Which factors help authors produce the highest impact research? Collaboration, journal and document properties. Journal of informetrics, 7(4), 861-873. [CrossRef]
- Glänzel, W., & Moed, H. F. (2002). Journal impact measures in bibliometric research. Scientometrics, 53, 171-193. [CrossRef]
- Weingart, P. (2005). Impact of bibliometrics upon the science system: Inadvertent consequences?. Scientometrics, 62, 117-131. [CrossRef]
- Baykoucheva, S. (2021). Driving Science Information Discovery in the Digital Age. Chandos Publishing. [CrossRef]
- Garfield, E. (1979). Current Contents: its impact on scientific communication. Interdisciplinary Science Reviews, 4(4), 318-323. [CrossRef]
- Dittmar, P. G., Stobaugh, R. E., & Watson, C. E. (1976). The chemical abstracts service chemical registry system. I. General design. Journal of Chemical Information and Computer Sciences, 16(2), 111-121. [CrossRef]
- Hristovski, D., Stare, J., Peterlin, B., & Dzeroski, S. (2001). Supporting discovery in medicine by association rule mining in Medline and UMLS. In MEDINFO 2001, 84, 1344-1348. IOS Press. Series, Studies in Health Technology and Informatics. [CrossRef]
- Neavill, G. B. (1984). Electronic publishing, libraries, and the survival of information. Library resources & Technical Services, 28(1), 76-89. http://digitalcommons.wayne.edu/slisfrp/47.
- Suber, P. (2003). Removing the barriers to research: an introduction to open access for librarians. College & Research Libraries News, 64(2), 92-94. http://nrs.harvard.edu/urn-3:HUL.InstRepos:3715477.
- Digital Science & Research Solutions, Inc. Dimensions. Available online: https://app.dimensions.ai/ (accessed on 17 July 2024).
- Albarrán, P. , Crespo, J. A., Ortuño, I., & Ruiz-Castillo, J. (2011). The skewness of science in 219 sub-fields and a number of aggregates. Scientometrics, 88(2), 385-397. [CrossRef]
- Blum, D. (2021). Science journalism grows up. Science, 372(6540), 323-323. [CrossRef]
- Segado-Boj, F. , Noguera-Vivo, J. M., & Hermida, A. (2022). Introduction. Users, content and platforms: A multidimensional approach to the research of news sharing. Communication & Society, 35(2), 201-203. [CrossRef]
- Brossard, D. (2013). New media landscapes and the science information consumer. Proceedings of the National Academy of Sciences, 110(supplement_3), 14096-14101. [CrossRef]
- Gallotti, R. , Valle, F., Castaldo, N., Sacco, P., & De Domenico, M. (2020). Assessing the risks of ‘infodemics’ in response to COVID-19 epidemics. Nature human behaviour, 4(12), 1285-1293. [CrossRef]
- West, J. D., & Bergstrom, C. T. (2021). Misinformation in and about science. Proceedings of the National Academy of Sciences, 118(15), e1912444117. [CrossRef]
- Lewison, G. (2009). Biomedical news items and feature articles in New Scientist magazine and the research papers that they cite. In Proceedings of the 12th meeting of the International Society for Scientometrics and Informetrics (pp. 719-729). https://www.issi-society.org/proceedings/issi_2009/ISSI2009-proc-vol2_Aug2009_batch1-paper-21.pdf.
- Hubner, A. (2021). How did we get here? A framing and source analysis of early COVID-19 media coverage. Communication Research Reports, 38(2), 112-120. [CrossRef]
- Fleerackers, A. , Riedlinger, M., Moorhead, L., Ahmed, R., & Alperin, J. P. (2022). Communicating scientific uncertainty in an age of COVID-19: An investigation into the use of preprints by digital media outlets. Health Communication, 37(6), 726-738. [CrossRef]
- Smeros, P., Castillo, C., & Aberer, K. (2019, May). Scilens: Evaluating the quality of scientific news articles using social media and scientific literature indicators. In The World Wide Web Conference (pp. 1747-1758). [CrossRef]
- Nirenberg, M. W. (1967). Will society be prepared?. Science, 157(3789), 633-633. [CrossRef]
- Aksnes, D. W. , Langfeldt, L., & Wouters, P. (2019). Citations, citation indicators, and research quality: An overview of basic concepts and theories. Sage Open, 9(1), 2158244019829575.
- Priem, J., Taraborelli, D., Groth, P., & Neylon, C. (2011). Altmetrics: A manifesto. https://altmetrics.org/manifesto.
- Torres-Salinas, D. , Docampo, D., Arroyo-Machado, W. et al. The many publics of science: using altmetrics to identify common communication channels by scientific field. Scientometrics 129, 3705–3723 (2024). [CrossRef]
- Thelwall, M. Early Mendeley readers correlate with later citation counts. Scientometrics 115, 1231–1240 (2018). [CrossRef]
Figure 1.
Inclusion criteria and numbers of included and excluded articles. JCR SCIE, Journal Citation Reports Science Citation Index Expanded.
Figure 1.
Inclusion criteria and numbers of included and excluded articles. JCR SCIE, Journal Citation Reports Science Citation Index Expanded.
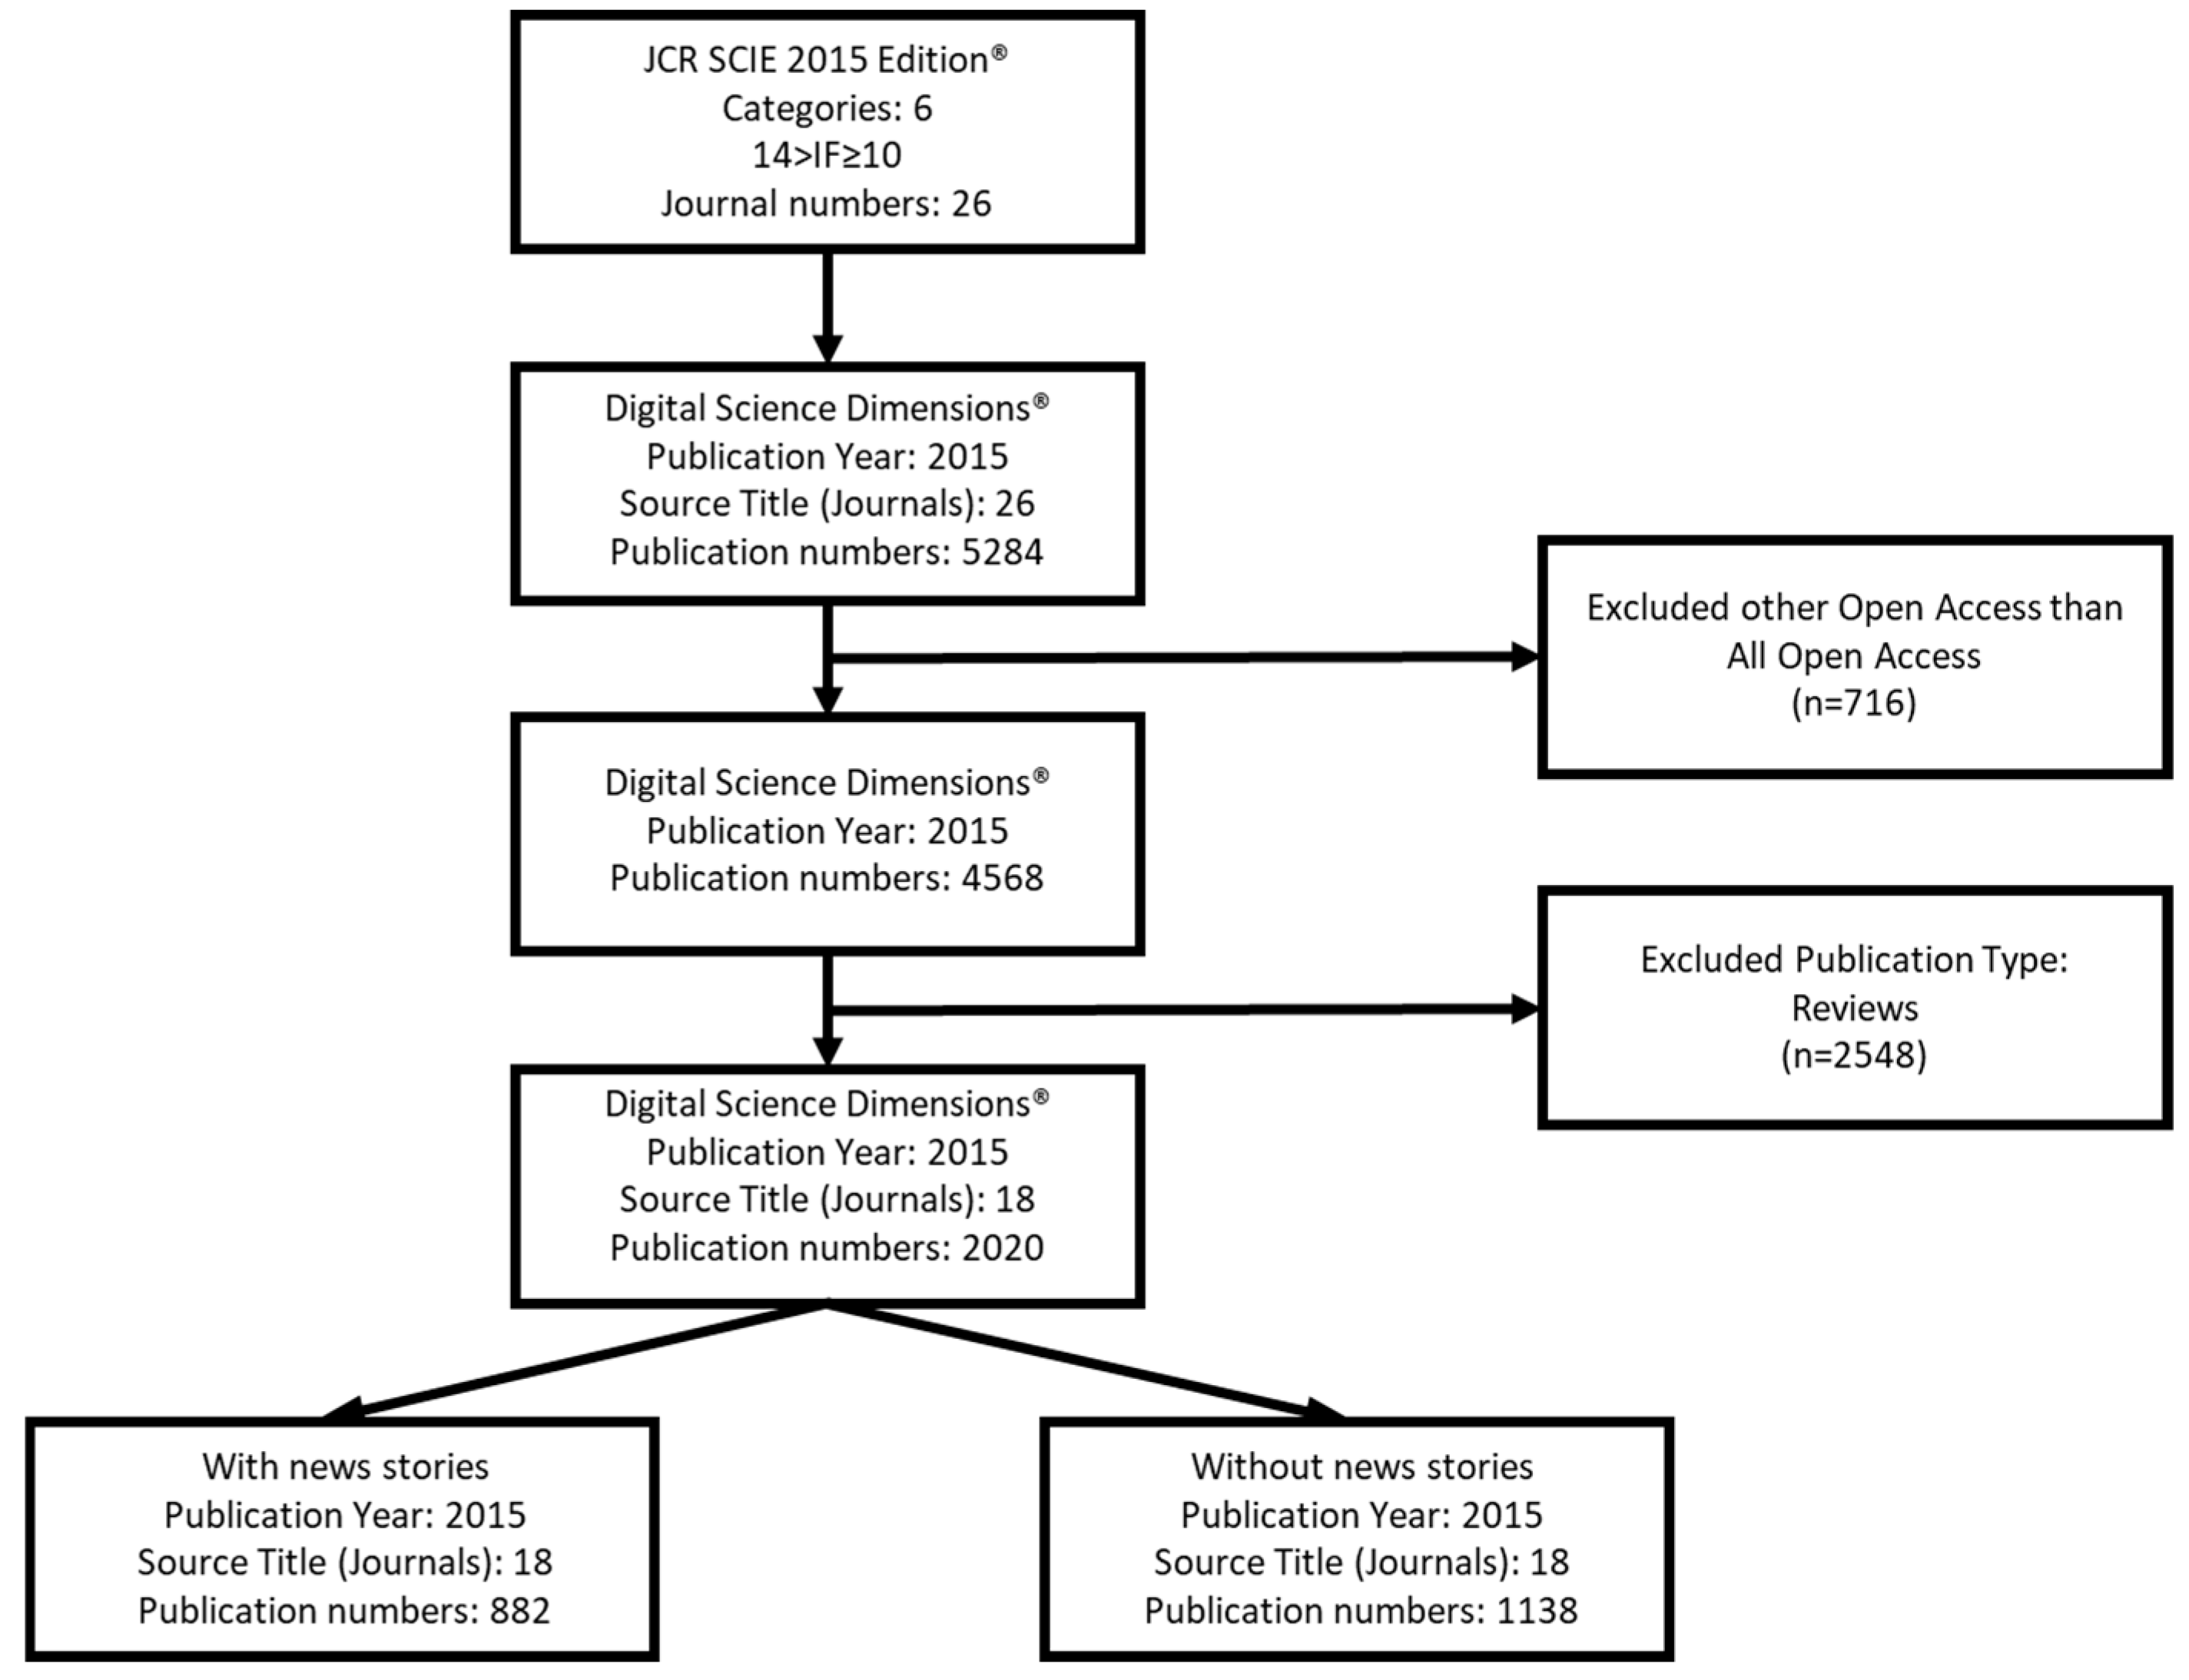
Figure 2.
Original research, open access papers with (blue) and without (orange) new stories per biomedical journal with an impact factor between 10 and 14 when published in 2015.
Figure 2.
Original research, open access papers with (blue) and without (orange) new stories per biomedical journal with an impact factor between 10 and 14 when published in 2015.
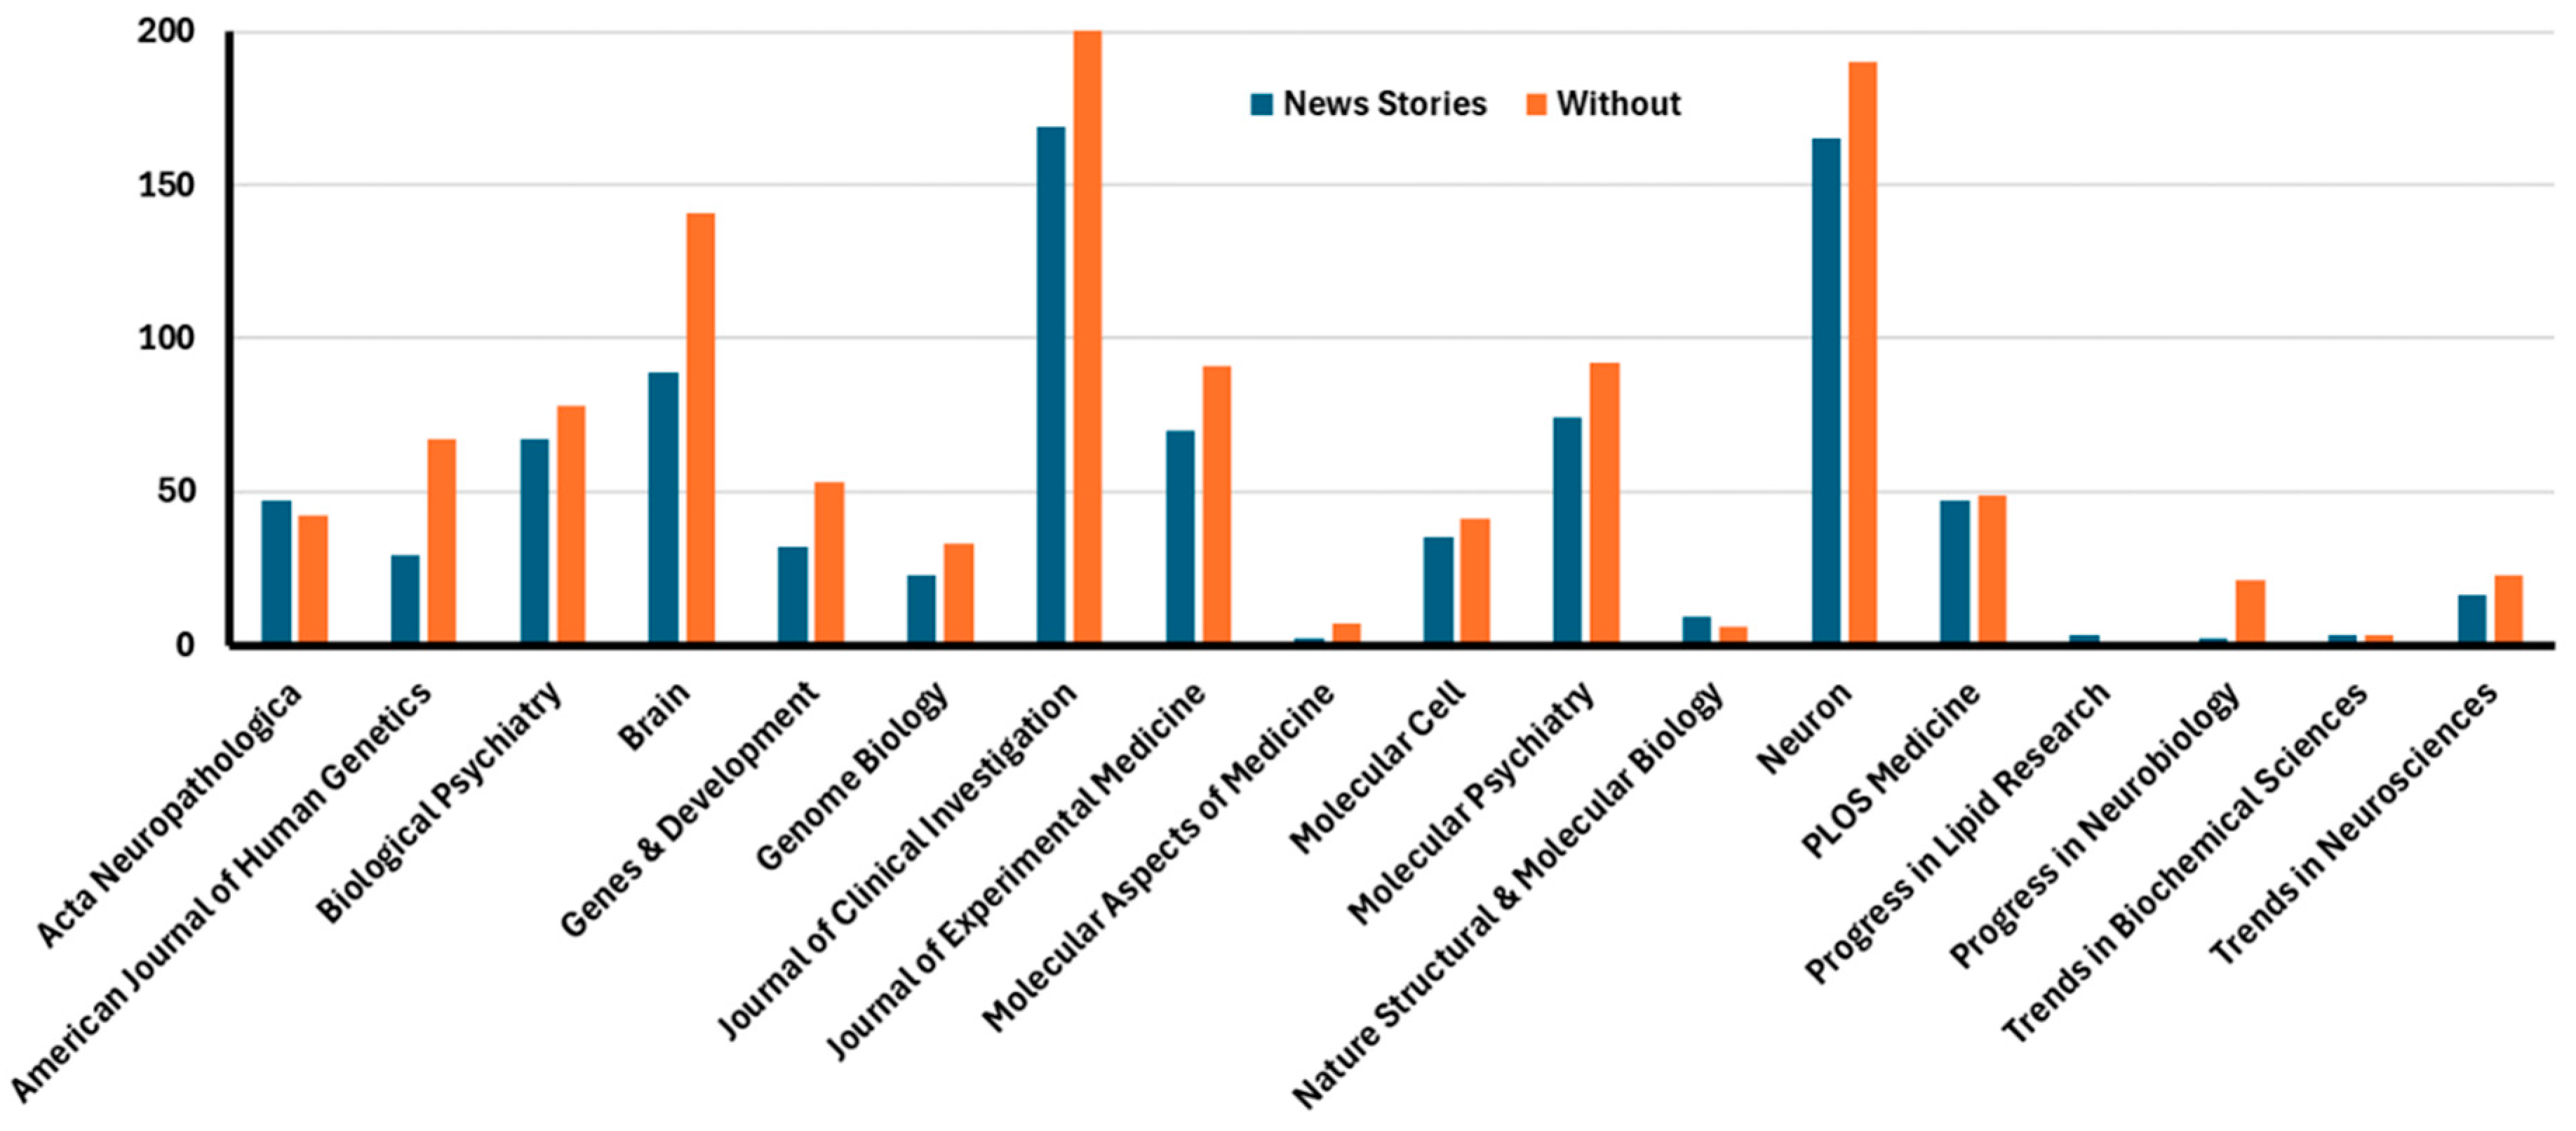
Figure 3.
The distribution of news stories per journal. Circles (◦) indicate outliers, and Xs indicate the mean markers. Progress in Neurobiology, Trends in Biochemical Sciences, Progress in Lipid Research and Molecular Aspects of Medicine have less than five papers in the news stories group.
Figure 3.
The distribution of news stories per journal. Circles (◦) indicate outliers, and Xs indicate the mean markers. Progress in Neurobiology, Trends in Biochemical Sciences, Progress in Lipid Research and Molecular Aspects of Medicine have less than five papers in the news stories group.
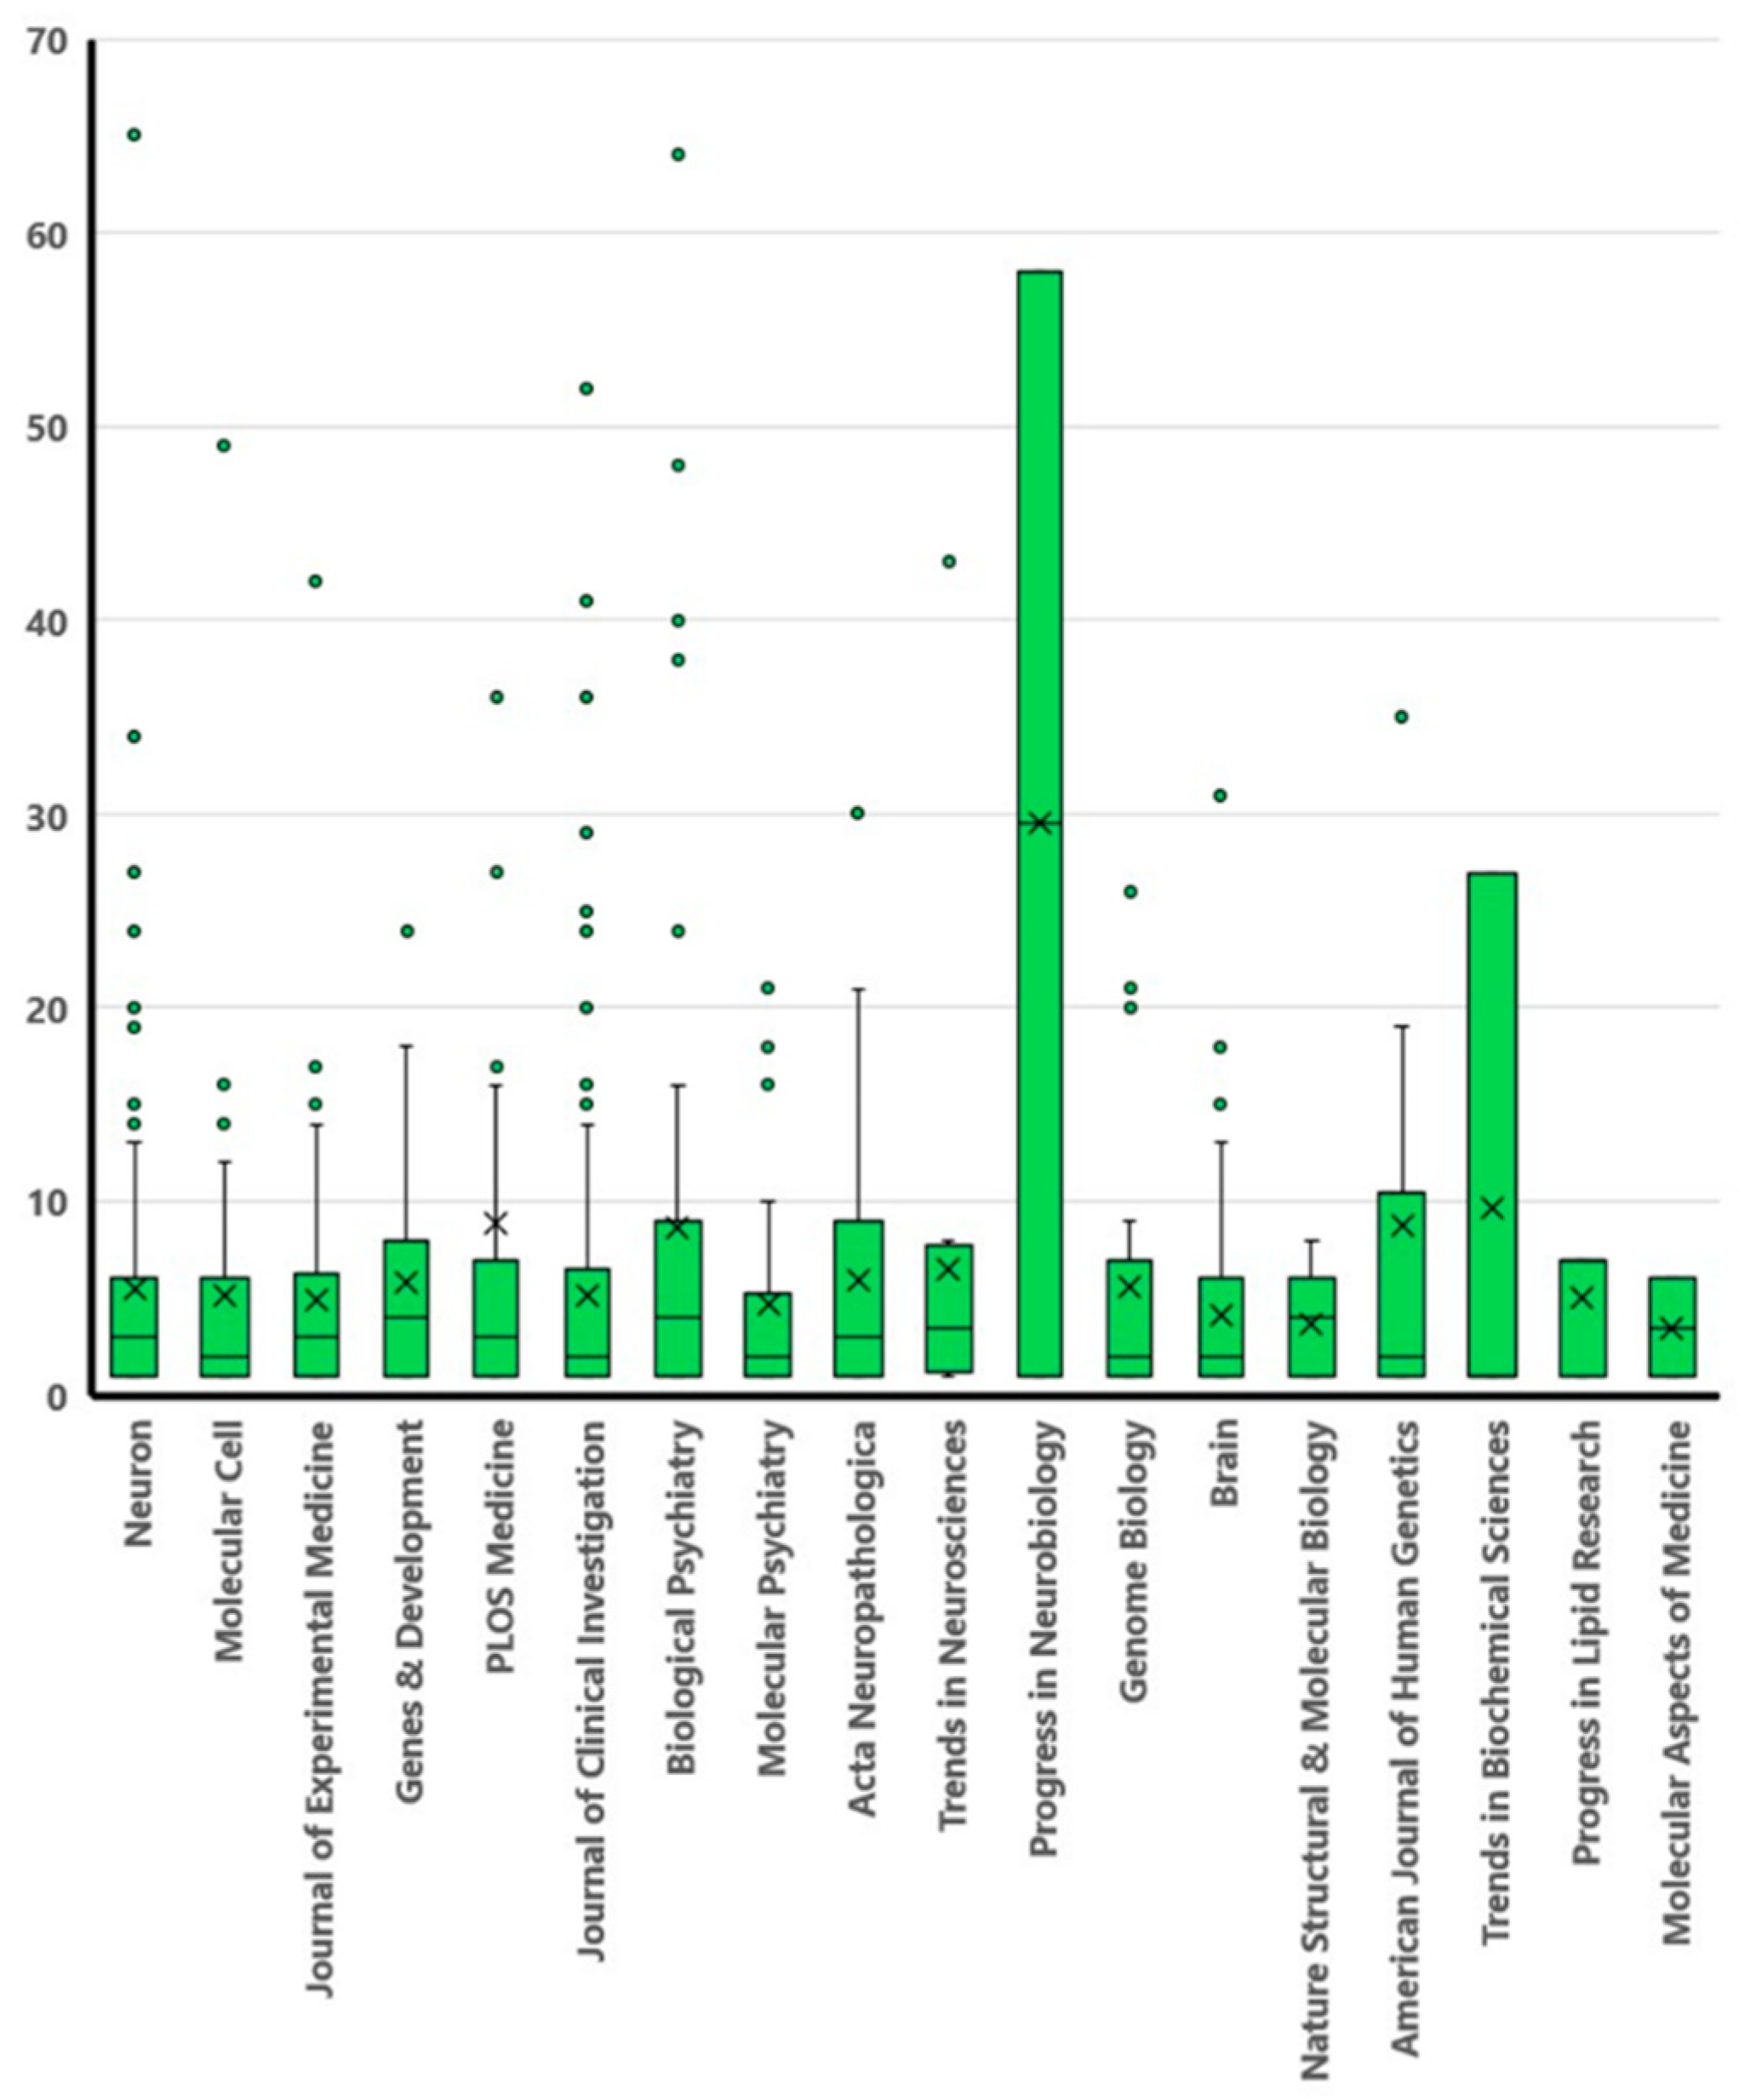
Figure 4.
Distributions of citations per journal: (a) Papers with news stories; (b) Papers without news stories. Circles (◦) indicate outliers, and Xs indicate the mean markers. Progress in Neurobiology, Trends in Biochemical Sciences, Progress in Lipid Research and Molecular Aspects of Medicine have less than five papers in the news stories group, and Progress in Lipid Research and Trends in Biochemical Sciences in the control group.
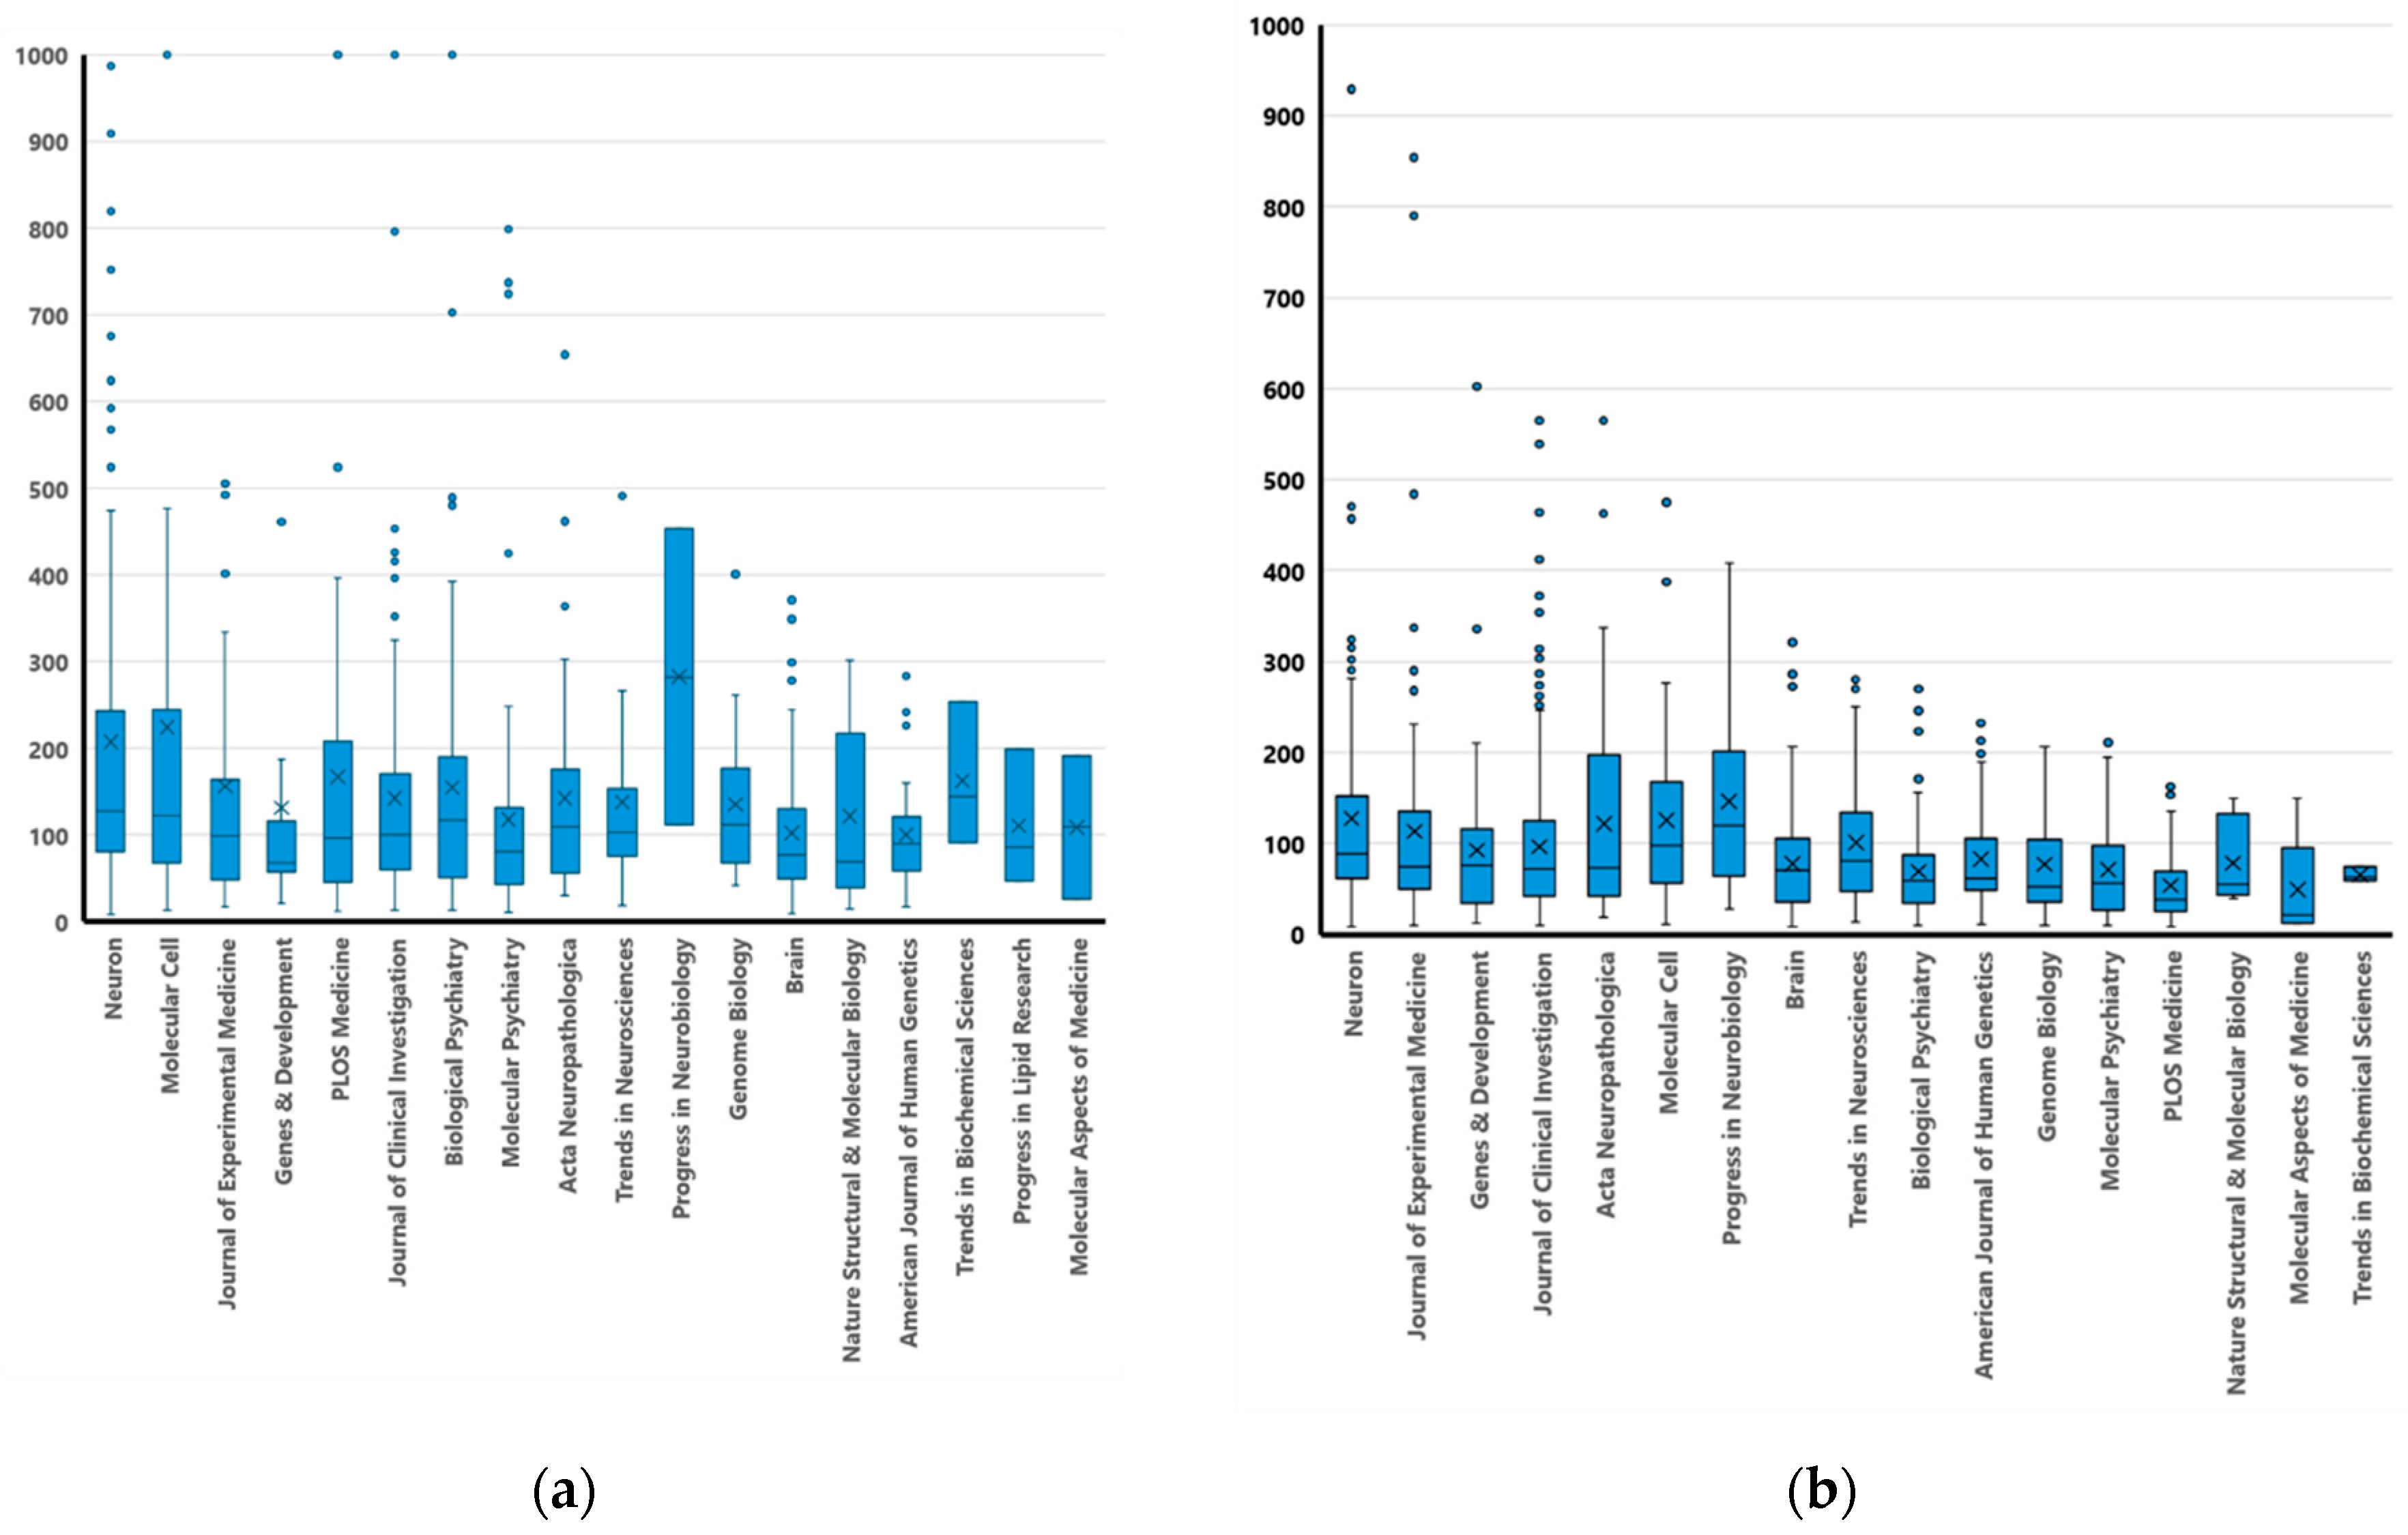
Figure 5.
Distributions of altmetrics scores per journal: (a) Papers with news stories; (b) Papers without news stories. Circles (◦) indicate outliers, and Xs indicate the mean markers. Progress in Neurobiology, Trends in Biochemical Sciences, Progress in Lipid Research and Molecular Aspects of Medicine have less than five papers in the news stories group, and Progress in Lipid Research and Trends in Biochemical Sciences in the control group.
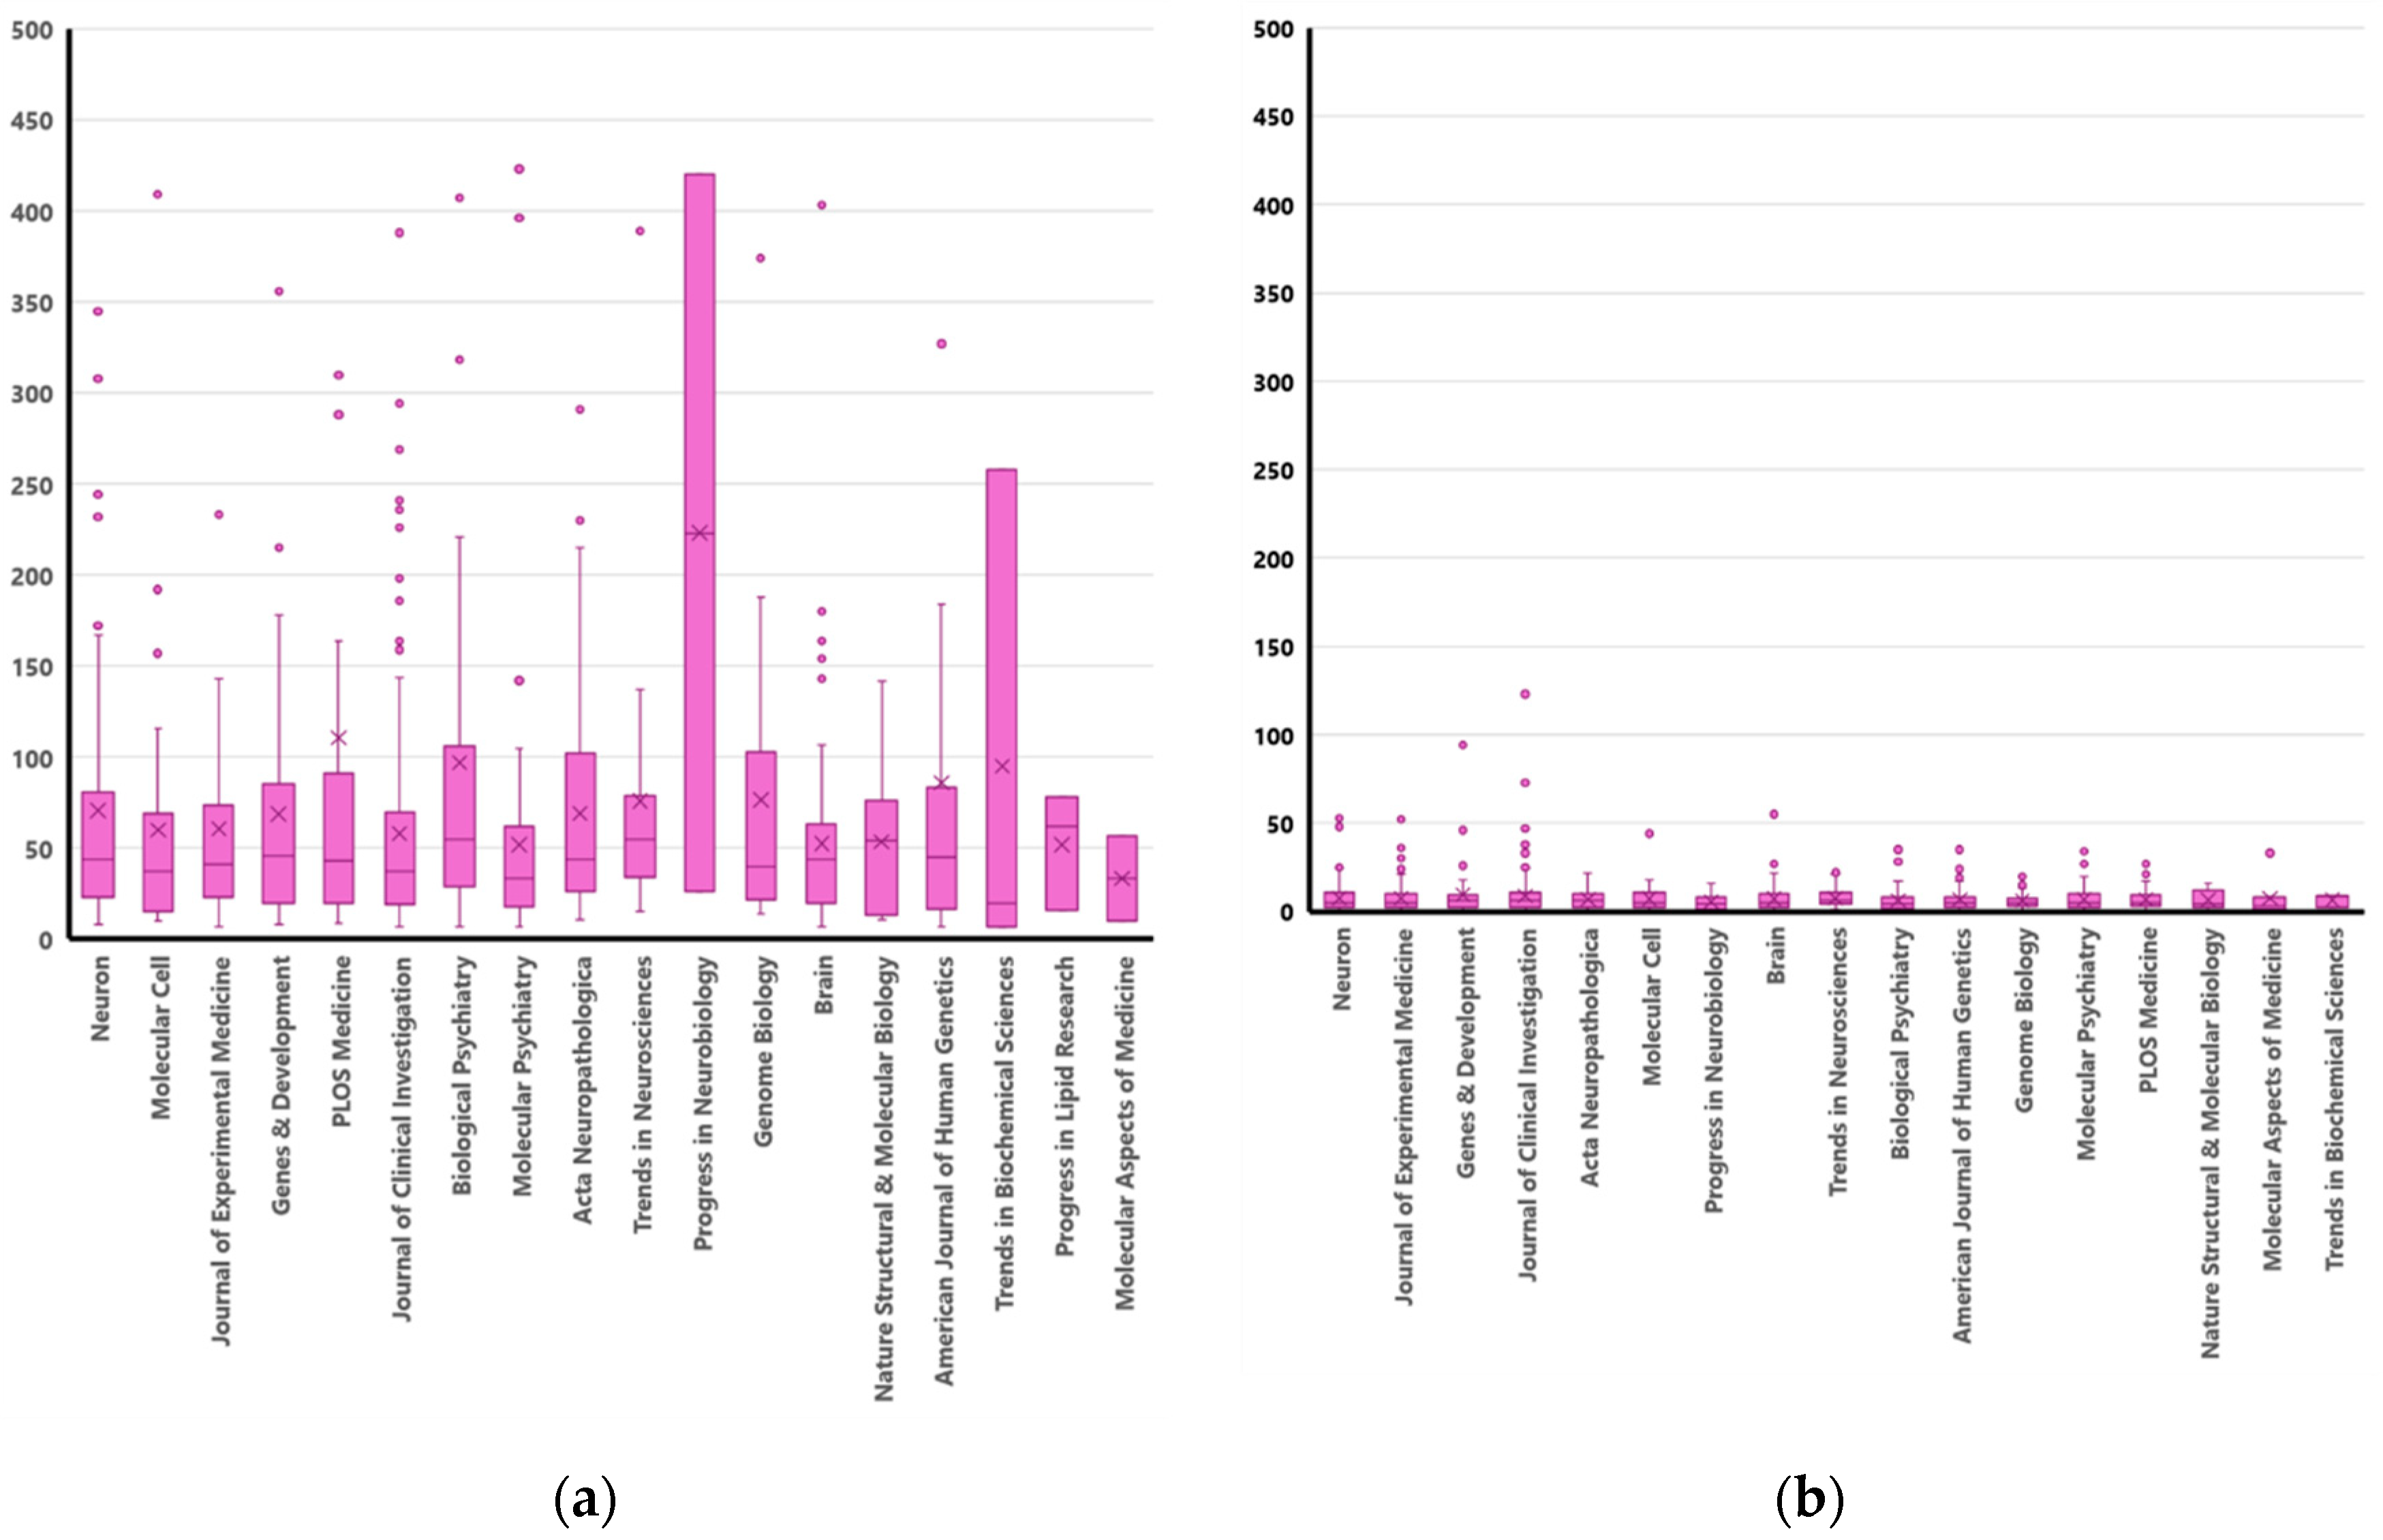
Figure 6.
Odds ratios (OR) with a 95% confidence interval (lower and upper 95% CI) of receiving at least one citation or altmetrics mention when at least one new story has been received by a research paper (logarithmic scale). With violet statistical significance p-value(likelihood ration chi-square)<0.05, with green, p-value(likelihood ration chi-square)<0.001.
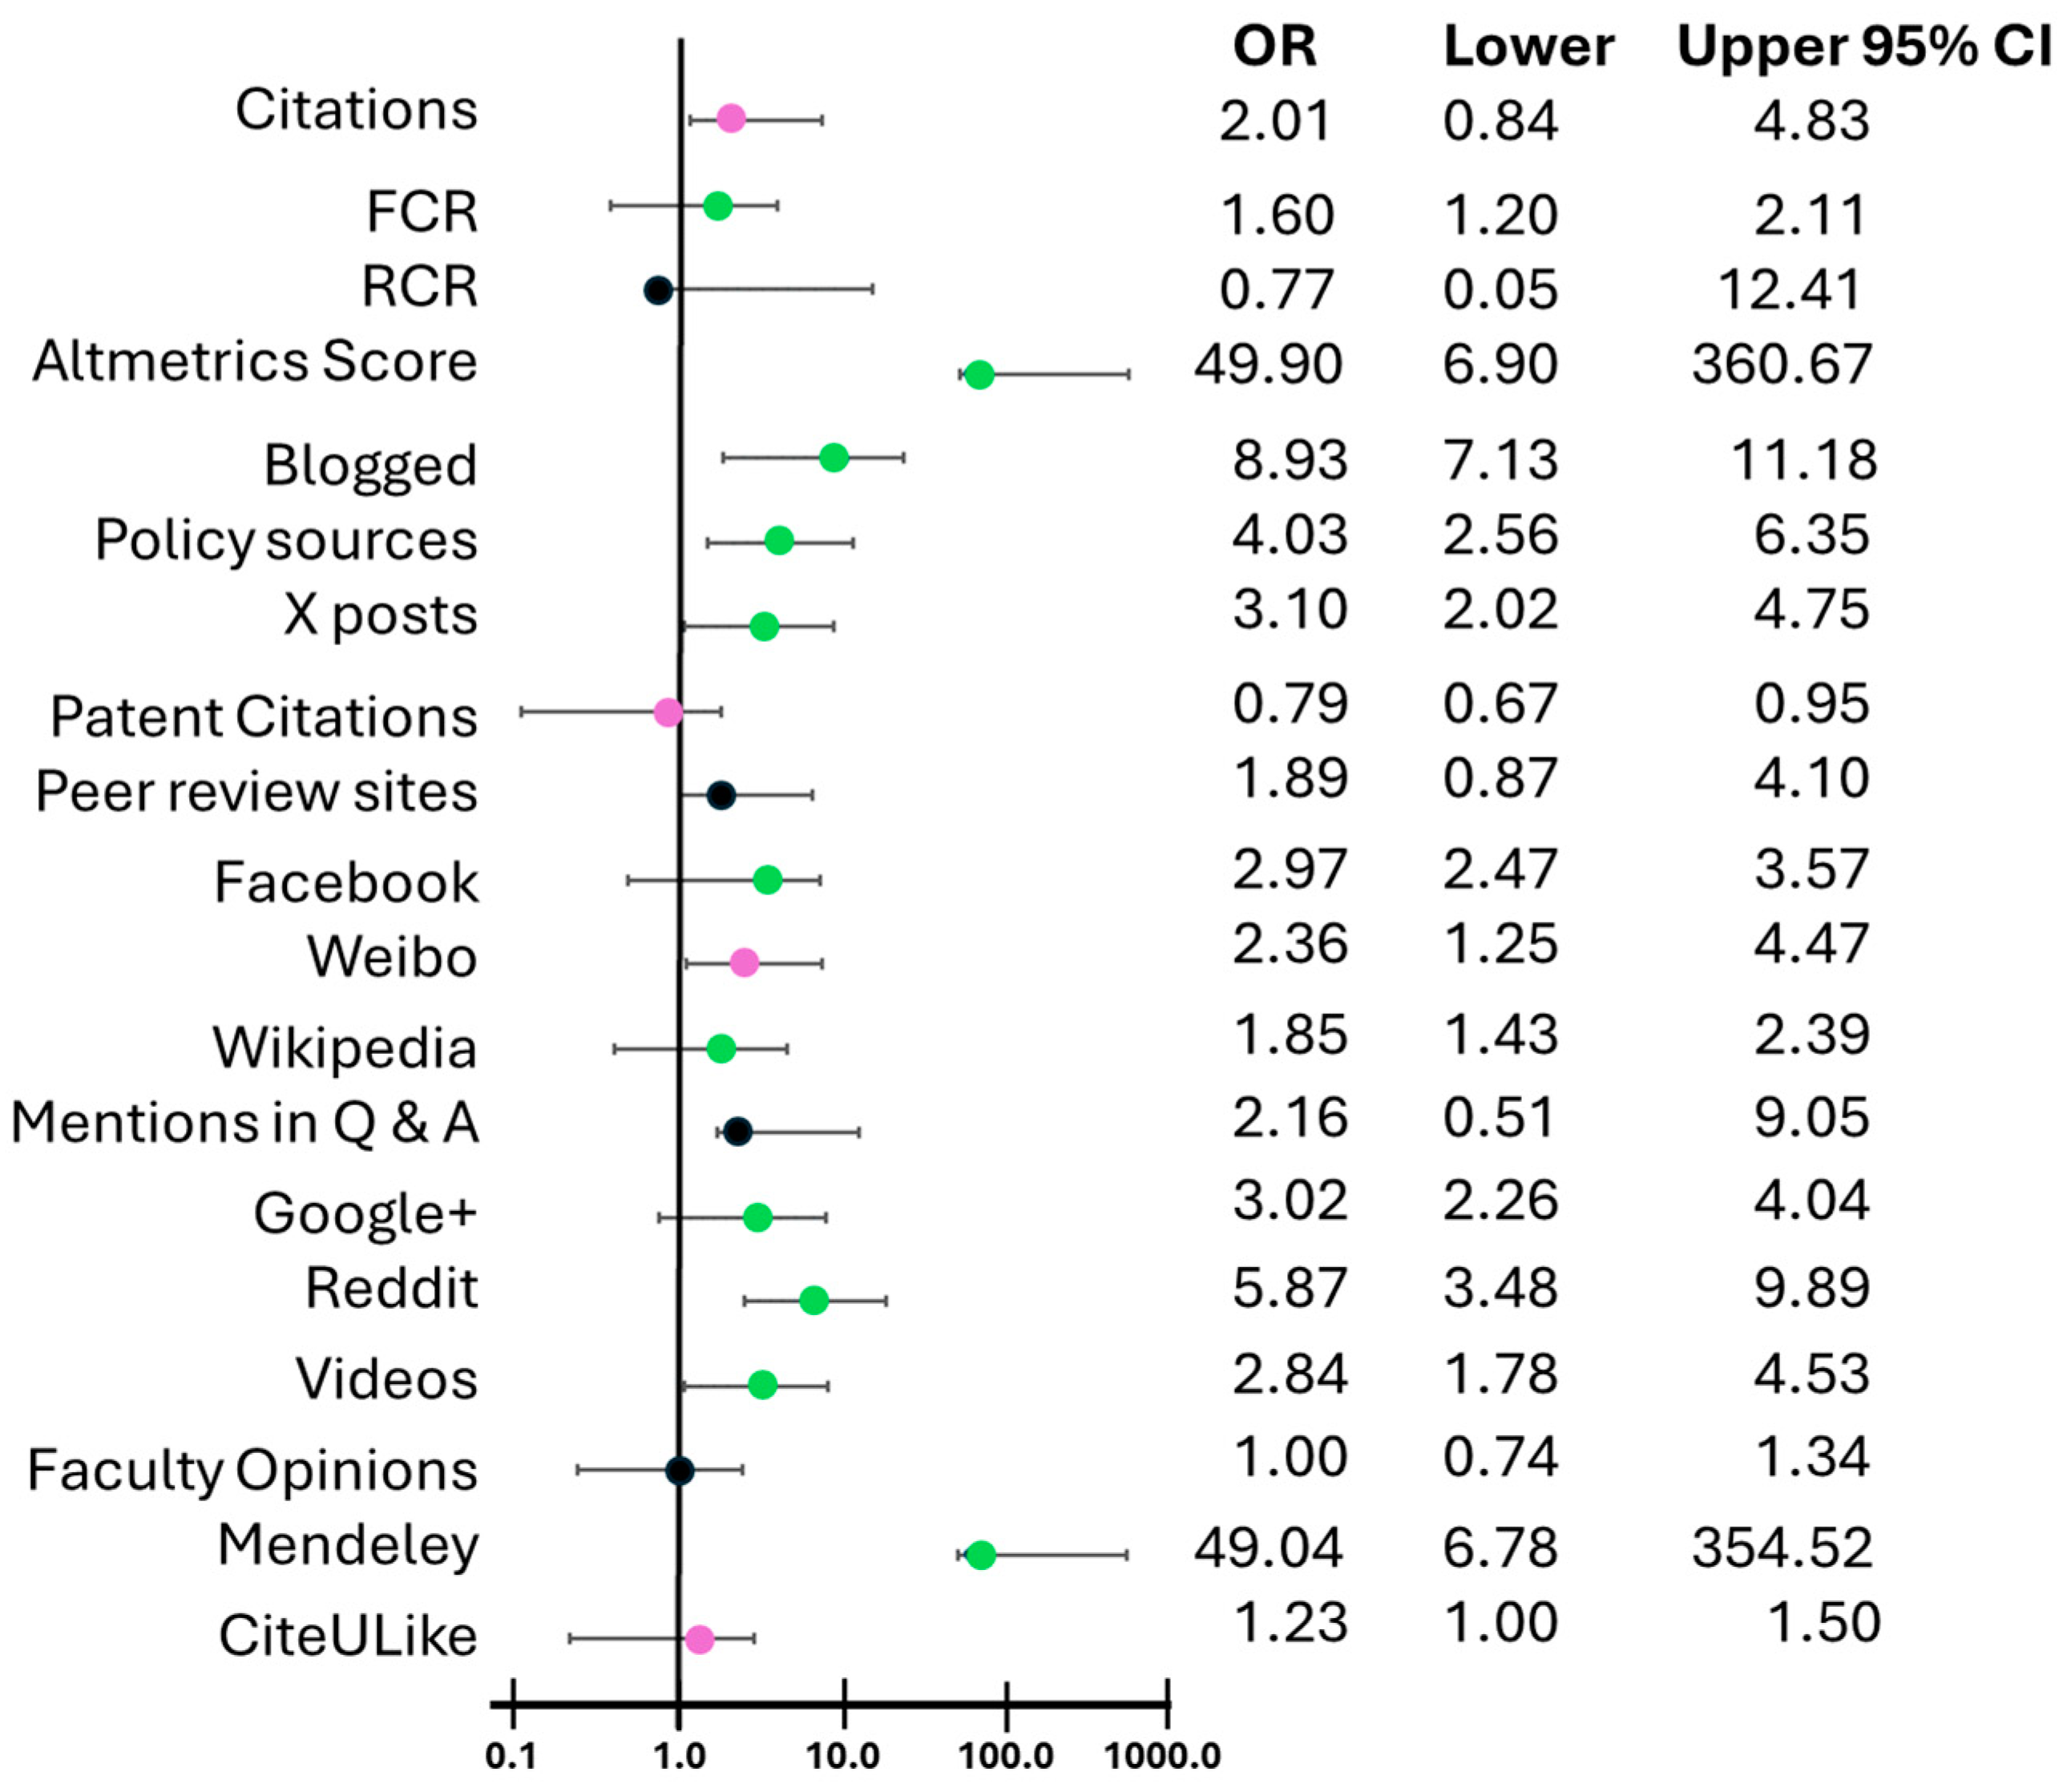
Figure 7.
Pearson correlation and scatter plots with linear regression analysis of variables: (a) Pearson correlation analysis of citations, FCR, altmetrics score, news stories, X posts, Facebook, Mendeley, and patents citations, with green positive correlation, with black no correlation, and with red negative correlation; (b) Scatter plots with linear regressions of the papers examined from top to bottom, citations as a function of FCR (left), Mendeley readers (middle) and news stories (right), news stories as a function of altmetrics score (left), X posts (middle) and Facebook (right), and X posts as a function of Facebook (left) as well as Mendeley as a function of FCR (right) (n=2020). The linear equation and R-squared goodness-of-fit calculated by regression analysis are presented in the scatter plots.
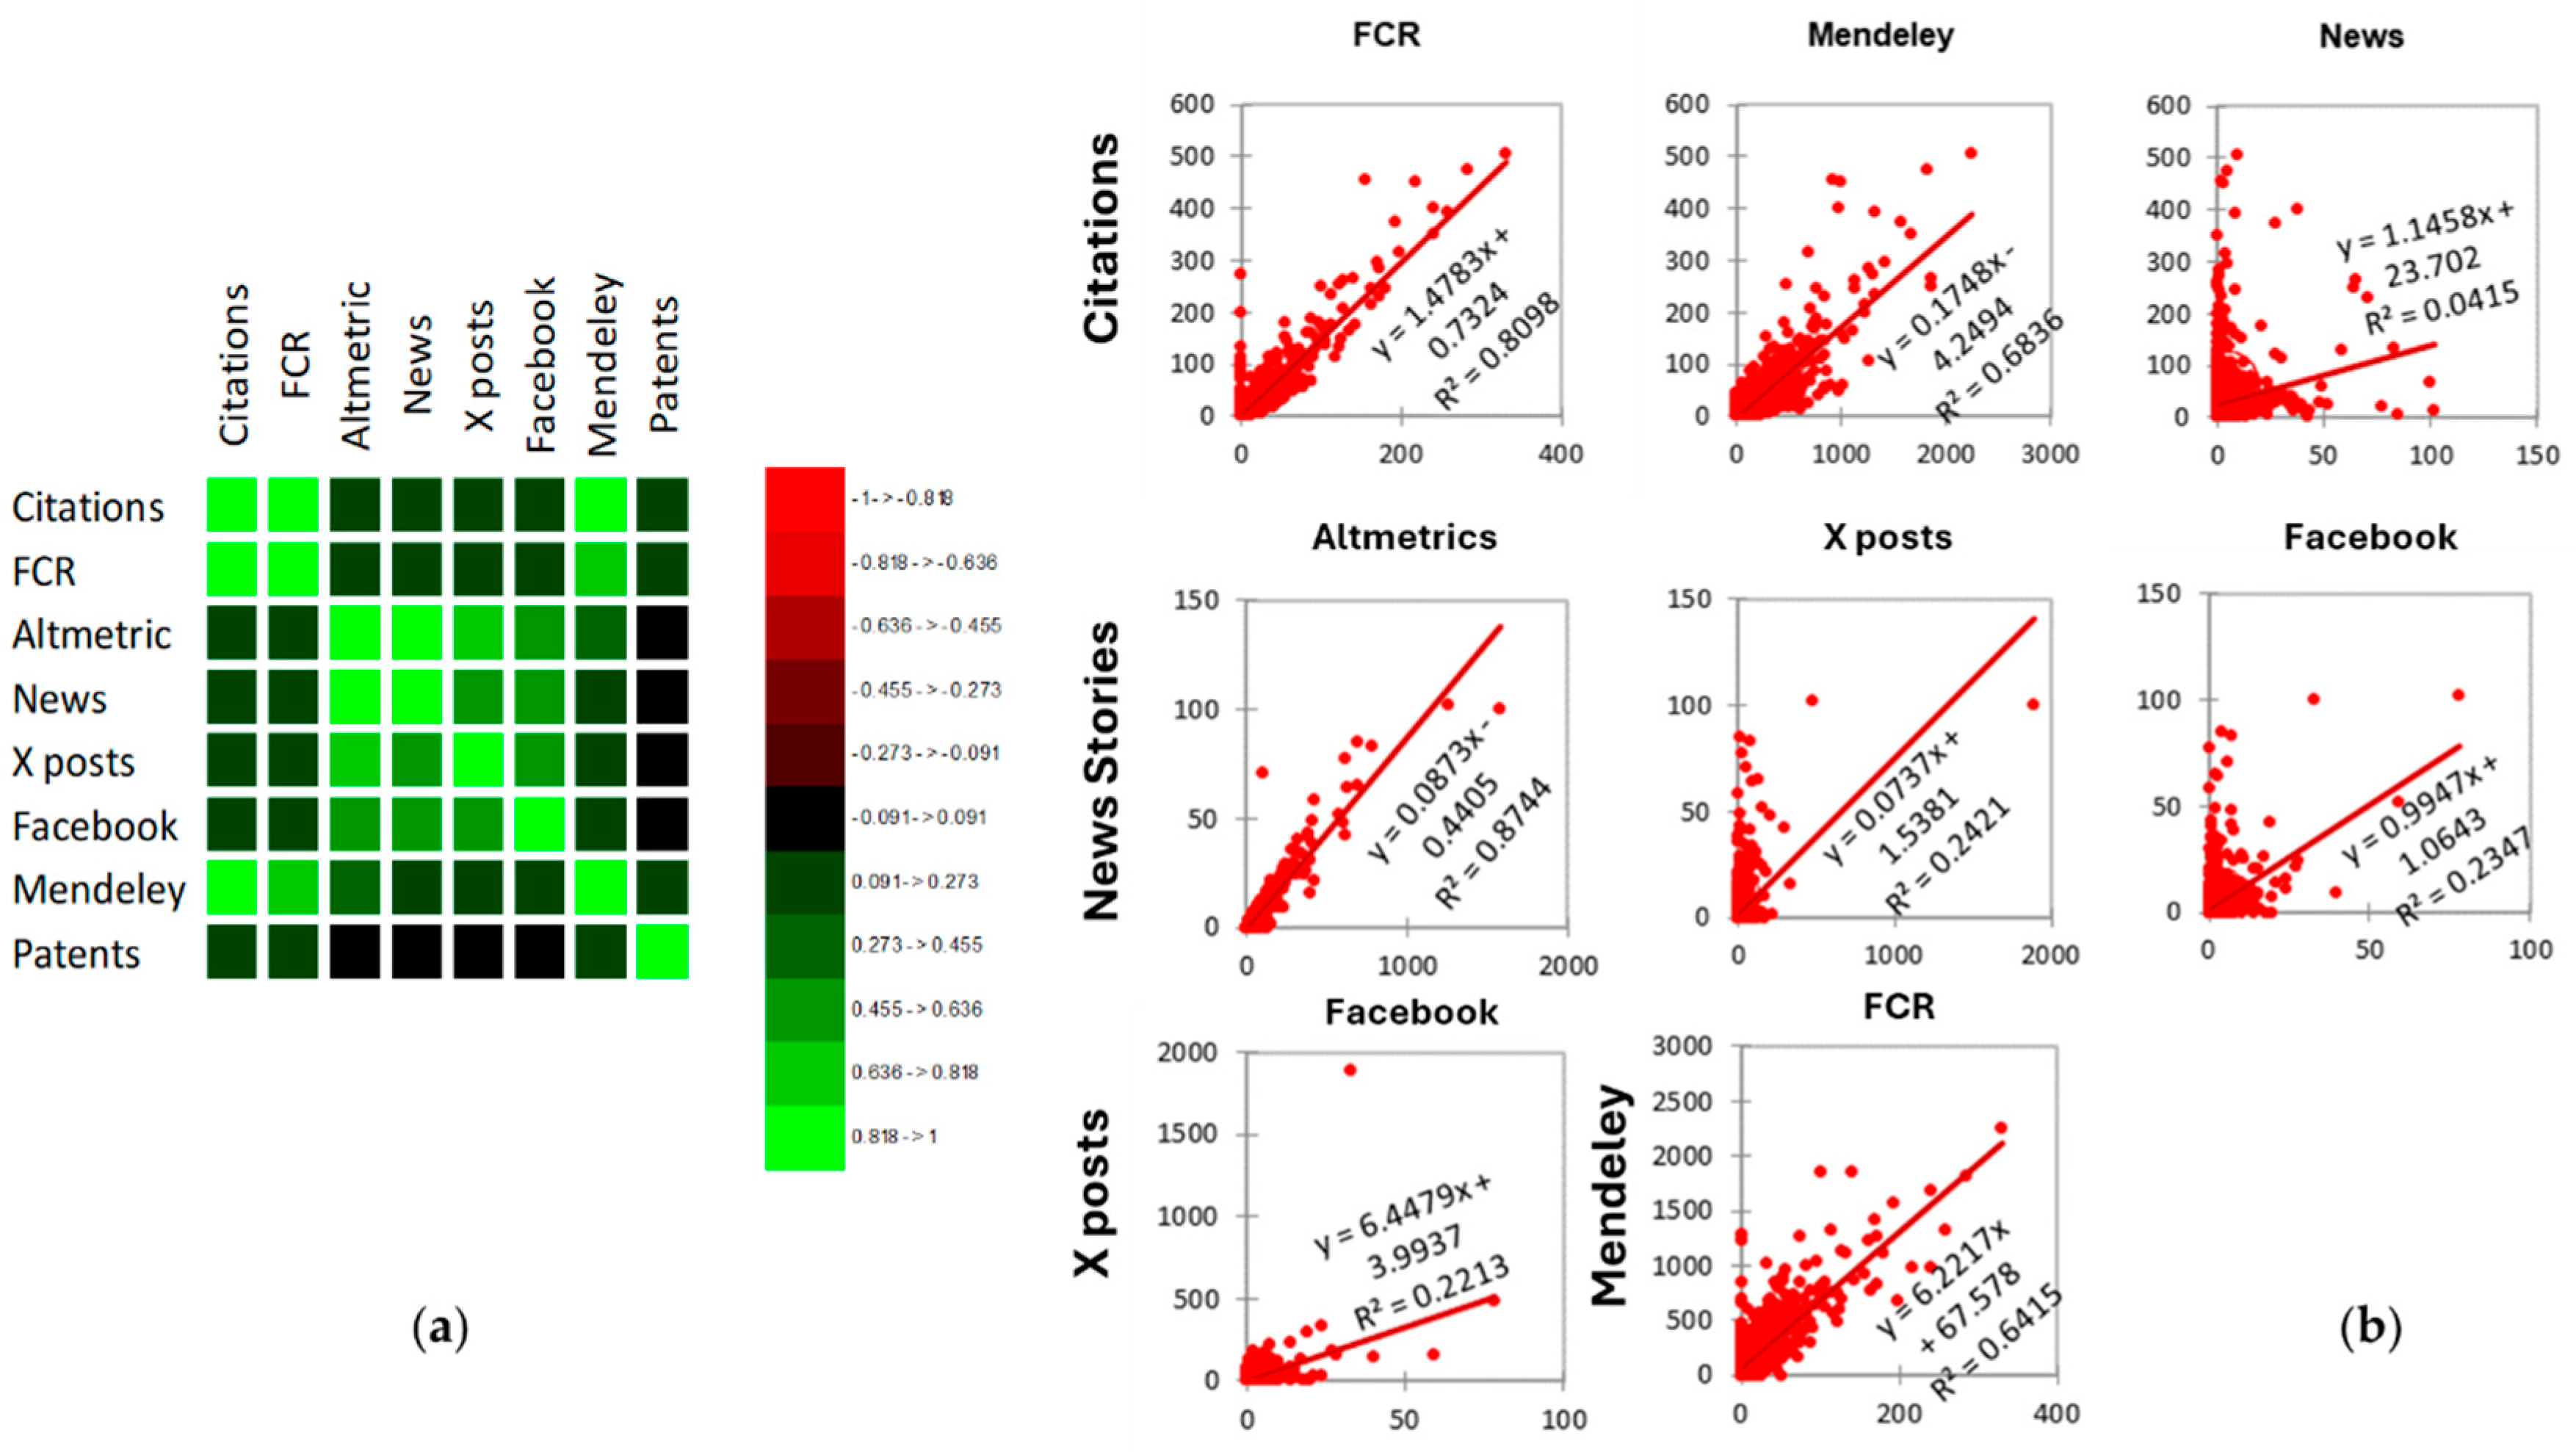

Table 1.
Papers with at least one citation or altmetrics mention.
| Papers with News Stories | Papers without News Stories | |
|---|---|---|
| Citations | 875 (99.2% of the total) | 1120 (98.4% of the total) |
| FCR | 800 (90.7%) | 978 (85.9%) |
| RCR | 882 (100%) | 1137 (99.9%) |
| Altmetrics Score | 882 (100%) | 1077 (94.6%) |
| Blogged | 464 (53.7%) | 171 (15.0%) |
| Policy sources | 76 (8.6%) | 26 (2.3%) |
| X posts | 854 (96.8%) | 1033 (90.8%) |
| Patent Citations | 267 (30.2%) | 238 (20.9%) |
| Peer review sites | 16 (1.8%) | 11 (1.0%) |
| 611 (69.3%) | 837 (73.6%) | |
| 27 (3.1%) | 37 (3.3%) | |
| Wikipedia | 158 (17.9%) | 200 (17.6%) |
| Mentions in Q & A | 5 (0.6%) | 3 (0.3%) |
| Google+ | 155 (17.6%) | 96 (8.4%) |
| 76 (8.6%) | 18 (1.6%) | |
| Videos | 57 (6.5%) | 29 (2.5%) |
| Faculty Opinions | 86 (9.7%) | 111 (9.8%) |
| Mendeley | 881 (99.9%) | 1078 (94.7%) |
| CiteULike | 247 (28%) | 274 (24.0%) |
Table 2.
A total number of citations or altmetrics mentions with descriptive statistics (mean ± standard deviation).
Table 2.
A total number of citations or altmetrics mentions with descriptive statistics (mean ± standard deviation).
| Papers with News Stories | Papers without News Stories | |
|---|---|---|
| Citations | 135184 (153.3 ± 188.3) | 109246 (96.0 ± 97.2) |
| FCR | 20174.3 (22.8 ± 31.8) | 15180 (13.3 ± 15.7) |
| RCR | 4326.9 (4.9 ± 6.1) | 3270.4 (2.9 ± 3.1) |
| Altmetrics Score | 60403 (68.5 ± 106.5) | 8443 (7.4 ± 8.7) |
| Blogged | 1260 (1.4 ± 2.2) | 171 (0.2 ± 0.5) |
| Policy sources | 104 (0.1 ± 0.4) | 26 (0.0 ± 0.1) |
| X posts | 18423 (20.9 ± 70.7) | 8904 (7.8 ± 11.4) |
| Patent Citations | 1030 (1.2 ± 3.7) | 905 (0.8 ± 3.0) |
| Peer review sites | 16 (0.0 ± 0.1) | 11 (0.0 ± 0.1) |
| 2150 (2.4 ± 4.9) | 837 (0.7 ± 1.4) | |
| 72 (0.1 ± 0.8) | 37 (0.0 ± 0.5) | |
| Wikipedia | 368 (0.4 ± 1.8) | 200 (0.2 ± 0.7) |
| Mentions in Q & A | 5 (0.0 ± 0.1) | 3 (0.0 ± 0.1) |
| Google+ | 577 (0.7 ± 4.6) | 96 (0.1 ± 0.4) |
| 92 (0.1 ± 0.4) | 18 (0.0 ± 0.1) | |
| Videos | 113 (0.1 ± 0.7) | 29 (0.0 ± 0.2) |
| Faculty Opinions | 86 (0.1 ± 0.3) | 111 (0.1 ± 0.3) |
| Mendeley | 196970 (223.3 ± 236.5) | 159501 (140.2 ± 135.4) |
| CiteULike | 390 (0.4 ± 0.9) | 428 (0.4 ± 0.8) |
Table 3.
Correlation matrix (Pearson).
| Variables | Citations | FCR | Altmetric | News | X posts | Mendeley | Patents | |
| Citations | 1 | 0.900* | 0.222* | 0.204* | 0.099* | 0.112* | 0.827* | 0.257* |
| FCR | 0.900* | 1 | 0.214* | 0.191* | 0.109* | 0.146* | 0.801* | 0.244* |
| Altmetric | 0.222* | 0.214* | 1 | 0.935* | 0.695* | 0.600* | 0.281* | 0.027 |
| News | 0.204* | 0.191* | 0.935* | 1 | 0.492* | 0.484* | 0.232* | 0.007 |
| X posts | 0.099* | 0.109* | 0.695* | 0.492* | 1 | 0.470* | 0.168* | -0.008 |
| 0.112* | 0.146* | 0.600* | 0.484* | 0.470* | 1 | 0.142* | 0.002 | |
| Mendeley | 0.827* | 0.801* | 0.281* | 0.232* | 0.168* | 0.142* | 1 | 0.194* |
| Patents | 0.257* | 0.244* | 0.027 | 0.007 | -0.008 | 0.002 | 0.194* | 1 |
* Values are different form 0 with a significance level alpha=0.05 (p-value(Pearson)<10-4).
Disclaimer/Publisher’s Note: The statements, opinions and data contained in all publications are solely those of the individual author(s) and contributor(s) and not of MDPI and/or the editor(s). MDPI and/or the editor(s) disclaim responsibility for any injury to people or property resulting from any ideas, methods, instructions or products referred to in the content. |
© 2024 by the authors. Licensee MDPI, Basel, Switzerland. This article is an open access article distributed under the terms and conditions of the Creative Commons Attribution (CC BY) license (http://creativecommons.org/licenses/by/4.0/).
Copyright: This open access article is published under a Creative Commons CC BY 4.0 license, which permit the free download, distribution, and reuse, provided that the author and preprint are cited in any reuse.


