
Submitted:
08 August 2024
Posted:
09 August 2024
You are already at the latest version
Abstract
High levels of heavy metal contamination in soil present substantial threats to human health and the environment, leading to severe health problems such as neurotoxicity, cancer, kidney issues, chronic obstructive pulmonary disease, and reduced life expectancy. This research aims to identify and analyze heavy metals in soil samples collected from Superfund sites in North Birmingham, Alabama, specifically in affected areas with Zip codes 35207, 35217, and control area 35214. These affected areas were previously used for mining, coal-fired power plants, coke furnaces, smelting, and other potential sources of heavy metal pollution. Laser-Induced Breakdown Spectroscopy (LIBS) was employed to study 60 soil samples systematically collected from affected and control areas. We found that using LIBS, we could detect arsenic (As), lead (Pb), and manganese (Mn) in all soil samples from the affected areas. The limit of detection (LoD) was 16 ppm for Pb, 43 ppm for As, and 33 ppm for Mn using specific parameters of the detection system and/or argon gas purging at atmospheric pressure. The results were compared with ICP-MS measurements to validate the accuracy of the LIBS findings. Data showed a good linearity for all calibration data at relatively low concentrations and a good correlation between ICP-MS measurements.
Keywords:
Laser-Induced Breakdown Spectroscopy (LIBS)
; Soil
; Heavy metals (HM)
1. Introduction
In contemporary society, numerous human activities, such as accelerated industrial development, atmospheric deposition, agricultural practices including manure application, and the widespread use of chemical fertilizers, have led to the release of metals into the environment, becoming a major contributor to pollution. Soil is particularly affected by the release of heavy metals such as Manganese (Mn), Lead (Pb), Cadmium (Cd), and Arsenic (As) [1]. These toxic heavy metals in soil present a significant environmental challenge due to their persistent characteristics and detrimental effects. Consequently, elevated levels of heavy metal contamination in soil pose significant risks to both human health and the environment, leading to a variety of serious health issues, including neurotoxicity, carcinogenicity, renal problems, shortened lifespans, Parkinson's disease, Alzheimer's disease, kidney disorders, respiratory ailments, mental health disorders in children, vision impairments, depression, dementia [2], and chronic obstructive pulmonary disease (COPD). COPD, characterized by chronic lung inflammation and obstructed airflow, affects approximately 11.7 million adults annually and results in numerous emergency department visits and significant healthcare costs (American Lung Association). Notably, COPD, a leading cause of death in the USA, has been linked to exposure to heavy metals carried in airborne dust.
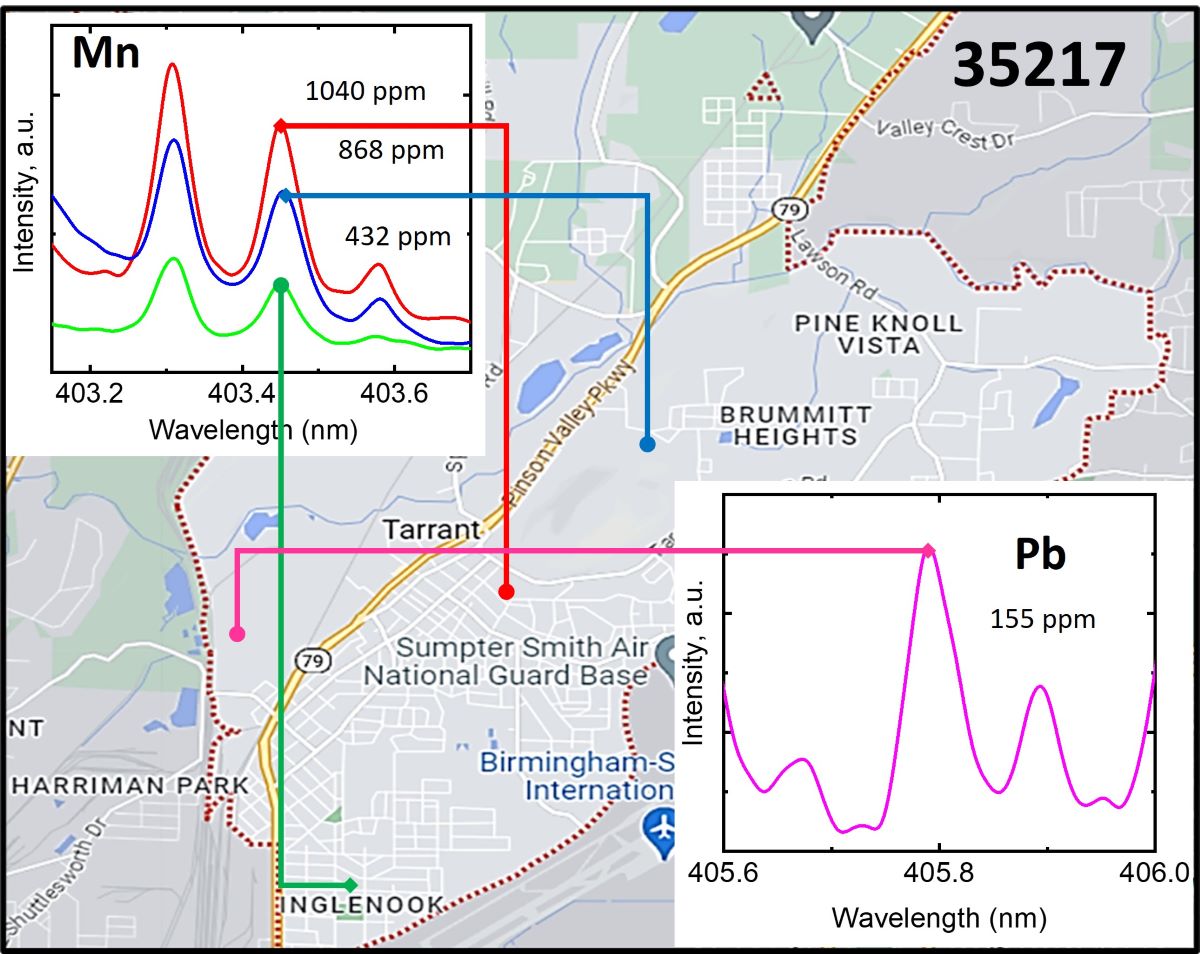
North Birmingham in Alabama, specifically the area covering zip codes 35207 and 35217, as depicted in Figure 1, hosts active open quarries, mining operations, steel mills, coal-fired power plants, coke furnaces, and other industrial activities that contribute significantly to heavy metal pollution. Cadmium, arsenic, manganese, and other toxic substances have heavily contaminated this region's air, soil, and water, posing significant health risks to local residents. Due to the historical and ongoing pollution in North Birmingham, this area has been suggested for inclusion in the National Priorities List (NPL) as a Superfund site. Therefore, the persistent contamination of air, water, and soil in North Birmingham due to heavy metals and other toxic compounds significantly elevates health risks within the community.
Rapid and comprehensive analytical techniques for detecting heavy metals (HMs) are essential to address these concerns. These methods are crucial for comprehending HM-induced pulmonary injuries and assessing the efficacy of mechanical and chemical pollution mitigation strategies. They are also instrumental in implementing effective control measures.
Conventional off-line analytical techniques such as atomic absorption spectroscopy (AAS), UV-visible spectrophotometry, inductively coupled plasma atomic emission spectroscopy (ICP-AES), X-ray fluorescence (XRF), energy dispersive X-ray spectroscopy (EDX), and inductively coupled plasma mass spectrometry (ICP-MS) have traditionally been used to measure HM concentrations in soil. While these methods offer good detection limits and accuracy, they are limited by lengthy and complex sample preparation procedures, extended detection times, resource-intensive requirements, and the generation of chemical waste. As a result, they often fail to meet the demand for cost-effective and real-time measurements [3,4], crucial for practical rapid analysis [5]. Moreover, many of these techniques are inherently destructive [6], further complicating their applicability.
In contrast, laser-induced breakdown spectroscopy (LIBS) overcomes these challenges. LIBS can examine samples in any atmospheric condition, regardless of their state (solid, liquid, gas, powder, aerosol, biological material, polymer, etc.). It is a safe and eco-friendly method that avoids the complexities associated with conventional analytical techniques like XRF, neutron activation analysis (NAA), AAS, X-ray photoelectron spectroscopy (XPS), ICP-AES, and laser ablation inductively coupled plasma mass spectrometry (LA-ICP-MS). While these traditional methods are more precise, they are often less preferred due to the complexity of instrumentation and the demanding nature of sample preparation. The cost-efficiency, speed, and minimal waste generation of LIBS make it a compelling choice for elemental analysis.
Laser-induced breakdown spectroscopy (LIBS) is a form of atomic emission spectroscopy [7,8] widely acknowledged for its effectiveness in elemental analysis. LIBS uses a high-energy pulsed laser to interact with the sample surface, causing ablation and forming a high-temperature plasma. As atoms and ions in the plasma move from high to low energy states, they emit photons that provide elemental information in the resulting spectrum. Compared to conventional analytical techniques, LIBS offers numerous benefits. These include rapid analysis in real-time with minimal or no sample preparation [9], capability for online, in-situ, or stand-off detection, portability, non-destructiveness, remote analysis, and simultaneous multi-element detection [10]. As a result, LIBS has been widely applied across various fields such as materials science, metallurgy, jewelry analysis, cultural heritage preservation, soil and sediment studies [11], combustion processes, environmental monitoring, archaeology, space exploration, biomedical research, medicine, and military applications. LIBS can analyze elements ranging from very light to heavy, and its instrumentation is cost-effective and easy to use [8,12,13]. These attributes have contributed to LIBS becoming a preferred choice among elemental analysis techniques, expanding its application from explosives detection to the analysis of biological materials [14].
In recent years, there has been a pressing need to improve and optimize the performance of LIBS, particularly by lowering the limit of detection (LOD) for certain elements and enhancing the signal intensity of emission lines across various applications. However, enhancing the signal can also be achieved by refining conventional LIBS systems [15]. One common criticism of LIBS is its poor signal repeatability from shot to shot, attributable to the complex interactions between the laser and sample, the transient and heterogeneous nature of plasma phenomena, and the sensitivity of the plasma to the physical and chemical characteristics of the sample and environmental conditions [16]. The presence of oxygen in the atmosphere has been observed to affect the persistence of LIBS emission lines [17].
Matrix effects pose a significant challenge in quantifying toxic elements using LIBS, an issue many reviewed studies have inadequately addressed. Typically, these studies have utilized a limited number of samples doped with varying toxic element concentrations. The authors of these studies argue that this approach is necessary to create a calibration set with a reasonable range of element concentrations, which is difficult to achieve with actual soil samples. However, this strategy has a major flaw: the calibration models are developed using samples with minimal matrix variation, which do not accurately represent actual soil conditions. Recent advancements in the LIBS technique for toxic element analysis have greatly improved signal strength and minimized matrix effects, representing significant progress in this area.
Some studies have managed to minimize the matrix effect effectively. One such method involves normalization using an internal reference or background radiation. This technique employs an element with minimal variation among samples, like Fe in soil samples [18], as an internal reference. Background radiation can be evaluated by measuring the total plasma intensity [11] or examining a spectral region without peaks near the emission line of interest [1].
Another effective strategy is the use of multivariate models, which establish linear or nonlinear relationships between the element of interest and the matrix elements, thereby reducing matrix effects [18,19,20]. Soil classification is another successful approach, followed by developing calibration curves for each class. Bousquet et al. [21] emphasized significant matrix effects in quantification models and recommended classifying soil samples and creating a quantification model for each class.
The phase transformation method introduced by Yi et al. [22] involves a solid-liquid-solid transformation process that theoretically eliminates matrix effects. Additionally, Wang et al. [20] implemented a comprehensive data processing sequence that includes log transformation of the spectrum, outlier removal using the median absolute deviation (MAD) method, denoising via Wavelet Transform, baseline removal, and the application of multivariate models.
In this research, we evaluated the capability of LIBS for quantitative analysis on diverse soil samples through the calibration curve method. We determined the overall concentrations of As, Mn, and Pb, and these findings were compared with those acquired through ICP-MS. The differences in soil samples physical and chemical properties, like particle size, heterogeneity, and organic matter content, made it hard to determine an appropriate internal standard for the analyzed soils. Therefore, the methodology chosen included the construction of a calibration curve and the normalization of spectral intensity to the overall integrated signal of plasma emission.
In our approach, signal improvement under ambient conditions involves using an inert gas, specifically Argon (Ar). With its lower conductivity and specific heat compared to air, Argon has a lower breakdown point [23]. Under an Ar gas environment, the spectral intensity of heavy metals (HMs) has demonstrated a doubling effect. Additionally, Argon promotes larger and more stable plasma emissions while reducing self-absorption, resulting in a more uniform plasma core temperature [24]. Improving LIBS sensitivity involves either increasing signal intensity or reducing background noise from the plasma [1].
The primary objective of this study is to enhance LIBS signal performance for the quantitative analysis of HMs in soil samples collected from the Superfund site in North Birmingham. The results obtained from LIBS were compared with those from ICP-MS to validate the accuracy and reliability of the experimental results.
2. Materials and Methods
2.1. Experimental Setup
Figure 2 illustrates the diagram of the LIBS system. This system comprises a Q-switched Nd:YAG laser (Litron Laser Nano 120-20) with an output wavelength of 1064 nm, an energy of 100 mJ per pulse, a pulse width of 7 ns, and a repetition rate of 20 Hz. The laser beam is focused through an aperture in the collecting spherical mirror onto the sample surface using a focusing optical system with a focal length of 400 mm. The plasma emission spectrum is collected by a spherical mirror (F = 150 mm) positioned 300 mm from the focal point and directed onto a fiber input with a numerical aperture (NA) of 0.22. An optical fiber (in the original configuration) transmits the LIBS signal to an Echelle spectrograph (Aryelle 200; aperture f/10; spectral resolving power 9000; 40 µm input slit) paired with an intensified charge-coupled device (ICCD) camera (DH334T-18F-03-27A, Andor Technology, UK).
However, as shown in the figure, we have modified the LIBS system by replacing the optical fiber with two CaF2 collection lenses. This modification improved coupling to the spectrometer and increased the overall signal severalfold.
The delay between the optical pulse and the ICCD gate is adjusted using a pulse generator. Sophy Software (LTB Lasertechnik Berlin, GmbH) manages the ICCD gate width, delay time and pulse averaging. The detection platform's sensitivity is calibrated with the 63358 Oriel lamp. An XYZ translational stage adjusts the position of the platform holding the samples. LIBS spectra measured in the 200-850 nm spectral range.
The volume of the LIBS system chamber was approximately 100 liters. An argon flow rate of 13 liters per minute was used to continuously purge the chamber under atmospheric pressure to measure As and Mn concentrations in soil samples.
2.2. Sample Preparation
To examine heavy metal contamination in soil, we gathered soil samples from areas near industrial sites, mining operations, transportation routes, waste disposal facilities, and other locations impacted by human activities. Our prominent sampling locations included ZIP Codes 35207 and 35217 (Superfund sites) and 35214 (control area), known for significant metal pollution from metallurgical activities, coal power plants, and mining operations in North Birmingham's Superfund sites.
To ensure accurate soil testing, we carefully collected samples from the topsoil layer (5-10 cm depth) using appropriate tools and protective gear, such as gloves, trowels, containers, tags, documentation forms, and GPS devices, ensuring they remained uncontaminated. Before processing, each sample was stored in individually labeled containers with essential information, including the location name, GPS coordinates, and date.
For sample preparation, we manually removed organic matter, gravel, and rocks, followed by drying the samples at 130-140°C for 1-4 hours, depending on soil moisture content. The samples were then ground using a stainless-steel grinder, and the resulting powder was sifted through a 100 μm plastic sieve into a clean, uncontaminated plastic container. This sieving process was repeated until all fine particles passed through the sieve, with larger particles reintroduced into the grinder for reprocessing as needed. The grinder was cleaned with methanol after processing each sample to maintain accuracy.
Subsequently, 2.5 g of the sifted soil sample was used to create compressed pellets using a hydraulic press, applying 8 metric tons of pressure for 3 minutes, followed by a 30-second resting period. These compressed pellets were then analyzed using LIBS to assess soil properties comprehensively.
The calibration samples were prepared using actual soil samples that contained lower initial concentrations of concomitants, according to ICP-MS measurements. For arsenic (As) and lead (Pb), we selected samples with initial concentrations of 12 ppm and 14 ppm, respectively. For manganese (Mn), we used a soil sample with an initial concentration of 63 ppm. We added the appropriate amounts of standard solutions for atomic absorption spectrometry (AAS), obtained from Fisher Scientific, to each sample to achieve the desired concentrations for the calibration curves. The samples were then dried and pressed into pellets as described above.
3. Experimental Results and Discussion
The quantitative analysis of arsenic (As), manganese (Mn), and lead (Pb) was achieved by constructing a calibration curve for each element and plotting the emission line intensity against the concentration determined by ICP-MS. The specific emission lines used in these experiments were As at 228.812 nm, Mn at 403.30 nm, and Pb at 405.78 nm. Identifying an appropriate internal standard for the soils analyzed was challenging given the high element content, a wide range of concentrations, and variability in physical and chemical properties such as texture, particle size heterogeneity, organic matter content, and thermal properties. Therefore, the chosen methodology for calibration curve construction involved normalizing the spectral intensity to the overall (integral) plasma emission signal in the 200 850 nm spectral range. This approach is acceptable by the consistent experimental conditions across all experiments and is further validated by the good linearity observed in the calibration curves. The calibration linearity was confirmed by a correlation coefficient higher than 0.98.
We have calculated the limit of detection (LoD) as follows:
where σ is the standard deviation of the background signal, and s is the slope of the calibration curve [25].
LoD = 3σ/s,
At the initial creation of laser-induced plasma, a broad spectrum of continuum emission is observed due to Bremsstrahlung radiation. This phenomenon can mask the analyte emission lines until the plasma expands and its temperature decreases. Thus, selecting the correct detector gate delay and gate width is essential to acquire optimal line emissions while minimizing the continuum radiation. Through our experiments, we have found that the optimal parameters for manganese (Mn) detection were a 1.5 µs delay time, a 5 µs gate width, and an accumulation of 100 pulses. In the case of arsenic (As) and lead (Pb), different settings were required due to the distinct parameters associated with plasma formation in an argon atmosphere. Our findings indicated that the following parameters were optimal for As and Pb detection: a 2 µs delay time, a 30 µs gate width, an accumulation of 10 pulses, and 100 averages to enhance the signal-to-noise ratio. For Mn, the LIBS spectra were recorded in an ambient atmosphere, while for Pb and As the spectra were recorded in an argon atmosphere at ambient pressure. Initially, the LIBS system chamber, with a volume of 100 L, was purged with Argon at a rate of 13 L/min for 30 minutes before measurements commenced. Following this, LIBS spectra were measured under continuous Argon purging at the same rate to maintain consistency and accuracy in our observations.
Figure 3 presents the plasma emission spectra generated by the fundamental harmonics of an Nd:YAG laser in soil samples. The spectra show emission lines of As(I) at 228.812 nm, Pb(I) at 405.78 nm, and Mn(I) at 403.3 nm. Figure 4 displays the calibration curves and measurements for pristine soil samples of As(I) at 228.812 nm, Pb(I) at 405.78 nm, and Mn(I) at 403.3 nm. The points represented by black squares were used for the linear fit. In contrast, although part of the calibration measurements, the red squares were excluded from the linear fit due to saturation effects common in LIBS measurements at high analyte concentrations. The points depicted as green triangles correspond to the measurements of pristine soil samples.
At low analyte concentrations, calibration curves usually exhibit a linear dependence. However, they start to deviate from linear dependence and experience saturation [26,27]. The points that deviate from linearity are usually excluded from the linear fit. This effect was especially noticeable in Mn calibration measurements because we had to use relatively high concentrations, in the thousands of ppm, due to the high abundance of Mn in soil. To assess the analytical capability of our LIBS system, we explored the linearity of calibration curves with analyte concentration and determined the limit of detection using expression (1). The detection limit (LoD) was calculated as 16 ppm for lead (LoDPb = 16 ppm), 43 ppm for arsenic (LoDAs = 43 ppm), and 33 ppm for manganese (LoDMn = 33 ppm).
We have found that under an argon atmosphere, arsenic and lead signals were enhanced approximately threefold compared to the ambient atmosphere. This significant enhancement enabled the limit of detection (LoD) of the LIBS system to reach the double-digit range for both As and Pb. Consequently, this improvement allowed us to accurately measure the concentrations of As and Pb in practically all soil samples collected from the affected area. This capability is particularly valuable for comprehensive environmental assessments, ensuring that even low concentrations of these elements can be detected and quantified with relatively good precision.
Table 1 shows the permissible amounts of As, Pb, and Mn in soil, as established by the United States Environmental Protection Agency (EPA). As we can see, the detection limit of our LIBS system is reaching the safety level due to the improvement of the collection system and additional purging with Argon during measurement.
We used soil that visually consisted of sand, clay, and loam to create samples for calibration curves. However, some samples presumably contained a large amount of coal, considering the place of origin close to the coke factories; these samples produced a signal about twofold weaker, likely due to a considerably larger plasma plume, which was visually observable. This larger plasma plume particularly affected the coupling efficiency of the detection system due to its size. However, normalizing the spectra by the integral signal of the plasma over the entire spectral range substantially mitigated this matrix effect, as seen in the Mn detection case.
4. Conclusions
In conclusion, we would like to report that the obtained limit of detection (LoD) was 16 ppm for lead (LoDPb = 16 ppm), 43 ppm for arsenic (LoDAs = 43 ppm), and 33 ppm for manganese (LoDMn = 33 ppm). We achieved these results due to the modification of the LIBS optical collection, which provided better coupling to the spectrometer. We also measured As and Pb in an argon atmosphere under ambient pressure. This modified the ablation plasma characteristics, further improving the signal-to-noise ratio. We could measure As, Mn, and Pb within the safety range established by the US EPA in all soil samples from the affected area of the Superfund site. Surprisingly, most soil samples from the affected area contained cadmium (Cd) below the detection limit of ICP-MS, and only a few had Cd concentrations in the single digits (ppm). Therefore, we are not reporting Cd detection in this manuscript.
Author Contributions
Conceptualization, Veena Antony and Sergey Mirov; Data curation, Nirmala Adhikari, Dmitry Martyshkin and Vladimir Fedorov; Methodology, Nirmala Adhikari, Dmitry Martyshkin, Vladimir Fedorov, Deblina Das and Sergey Mirov; Writing – review & editing, Nirmala Adhikari, Dmitry Martyshkin, Vladimir Fedorov, Deblina Das, Veena Antony and Sergey Mirov. All authors have approved the final version of the manuscript.
Funding
This research was supported by the National Institute of Environmental Health Sciences (1P42ES027723-01A1).
Acknowledgments
We thank the members of the UAB Superfund Research Center for useful discussions.
Conflicts of Interest
The authors declare no conflicts of interest.
References
- Srungaram, P. K.; Ayyalasomayajula, K. K.; Yu-Yueh, F.; Singh, J. P., Comparison of laser induced breakdown spectroscopy and spark induced breakdown spectroscopy for determination of mercury in soils. Spectrochimica Acta Part B: Atomic Spectroscopy 2013, 87, 108-113. [CrossRef]
- Ahmed, T.; Noman, M.; Ijaz, M.; Ali, S.; Rizwan, M.; Ijaz, U.; Hameed, A.; Ahmad, U.; Wang, Y.; Sun, G.; Li, B., Current trends and future prospective in nanoremediation of heavy metals contaminated soils: A way forward towards sustainable agriculture. Ecotoxicol Environ Saf 2021, 227, 112888. [CrossRef]
- Nicolodelli, G.; Cabral, J.; Menegatti, C. R.; Marangoni, B.; Senesi, G. S., Recent advances and future trends in LIBS applications to agricultural materials and their food derivatives: An overview of developments in the last decade (2010–2019). Part I. Soils and fertilizers. TrAC Trends in Analytical Chemistry 2019, 115, 70-82. [CrossRef]
- Singh, J. P.; Yueh, F. Y.; Bhatt, C. R., Scope of future development in LIBS. In Laser-Induced Breakdown Spectroscopy, Elsevier: 2020; pp 581-590DOI: 10.1016/b978-0-12-818829-3.00025-3.
- Chen, T.; Zhang, T.; Li, H., Applications of laser-induced breakdown spectroscopy (LIBS) combined with machine learning in geochemical and environmental resources exploration. TrAC Trends in Analytical Chemistry 2020, 133, 116113. [CrossRef]
- Hussain Shah, S. K.; Iqbal, J.; Ahmad, P.; Khandaker, M. U.; Haq, S.; Naeem, M., Laser induced breakdown spectroscopy methods and applications: A comprehensive review. Radiation Physics and Chemistry 2020, 170, 108666. [CrossRef]
- Guo, L.-B.; Zhang, D.; Sun, L.-X.; Yao, S.-C.; Zhang, L.; Wang, Z.-Z.; Wang, Q.-Q.; Ding, H.-B.; Lu, Y.; Hou, Z.-Y.; Wang, Z., Development in the application of laser-induced breakdown spectroscopy in recent years: A review. Frontiers of Physics 2021, 16 (2), 1-25. [CrossRef]
- Zhang, T.-L.; Wu, S.; Tang, H.-S.; Wang, K.; Duan, Y.-X.; Li, H., Progress of Chemometrics in Laser-induced Breakdown Spectroscopy Analysis. Chinese Journal of Analytical Chemistry 2015, 43 (6), 939-948. [CrossRef]
- Nicolodelli, G.; Senesi, G. S.; Romano, R. A.; de Oliveira Perazzoli, I. L.; Milori, D. M. B. P., Signal enhancement in collinear double-pulse laser-induced breakdown spectroscopy applied to different soils. Spectrochimica Acta Part B: Atomic Spectroscopy 2015, 111, 23-29. [CrossRef]
- de Carvalho, G. G. A.; Santos Jr, D.; da Silva Gomes, M.; Nunes, L. C.; Guerra, M. B. B.; Krug, F. J., Influence of particle size distribution on the analysis of pellets of plant materials by laser-induced breakdown spectroscopy. Spectrochimica Acta Part B: Atomic Spectroscopy 2015, 105, 130-135. [CrossRef]
- Dell'Aglio, M.; Gaudiuso, R.; Senesi, G. S.; De Giacomo, A.; Zaccone, C.; Miano, T. M.; De Pascale, O., Monitoring of Cr, Cu, Pb, V and Zn in polluted soils by laser induced breakdown spectroscopy (LIBS). J Environ Monit 2011, 13 (5), 1422-6. [CrossRef]
- Bhatt, C. R.; Hartzler, D.; Jain, J.; McIntyre, D. L., Determination of As, Hg, S, and Se in liquid jets by laser-based optical diagnostic technique. Applied Physics B 2021, 127 (1), 8. [CrossRef]
- Jantzi, S. C.; Motto-Ros, V.; Trichard, F.; Markushin, Y.; Melikechi, N.; De Giacomo, A., Sample treatment and preparation for laser-induced breakdown spectroscopy. Spectrochimica Acta Part B: Atomic Spectroscopy 2016, 115, 52-63. [CrossRef]
- Yan, C.; Liang, J.; Zhao, M.; Zhang, X.; Zhang, T.; Li, H., A novel hybrid feature selection strategy in quantitative analysis of laser-induced breakdown spectroscopy. Anal Chim Acta 2019, 1080, 35-42. [CrossRef]
- Nicolodelli, G.; Senesi, G. S.; Ranulfi, A. C.; Marangoni, B. S.; Watanabe, A.; de Melo Benites, V.; de Oliveira, P. P. A.; Villas-Boas, P.; Milori, D. M. B. P., Double-pulse laser induced breakdown spectroscopy in orthogonal beam geometry to enhance line emission intensity from agricultural samples. Microchemical Journal 2017, 133, 272-278. [CrossRef]
- Tognoni, E.; Cristoforetti, G., [INVITED] Signal and noise in Laser Induced Breakdown Spectroscopy: An introductory review. Optics & Laser Technology 2016, 79, 164-172. [CrossRef]
- Menegatti, C. R.; Nicolodelli, G.; Senesi, G. S.; da Silva, O. A.; Filho, H. J. I.; Villas-Boas, P. R.; Marangoni, B. S.; Milori, D. M. B. P., Evaluation of LIBS under controlled atmosphere to quantify cadmium at low concentration in landfill leachates. Applied Physics B 2019, 125 (5), 1-6. [CrossRef]
- Popov, A. M.; Labutin, T. A.; Zaytsev, S. M.; Seliverstova, I. V.; Zorov, N. B.; Kal’ko, I. A.; Sidorina, Y. N.; Bugaev, I. A.; Nikolaev, Y. N., Determination of Ag, Cu, Mo and Pb in soils and ores by laser-induced breakdown spectrometry. J. Anal. At. Spectrom. 2014, 29 (10), 1925-1933. [CrossRef]
- Zaytsev, S. M.; Krylov, I. N.; Popov, A. M.; Zorov, N. B.; Labutin, T. A., Accuracy enhancement of a multivariate calibration for lead determination in soils by laser induced breakdown spectroscopy. Spectrochimica Acta Part B: Atomic Spectroscopy 2018, 140, 65-72. [CrossRef]
- Wang, T.; He, M.; Shen, T.; Liu, F.; He, Y.; Liu, X.; Qiu, Z., Multi-element analysis of heavy metal content in soils using laser-induced breakdown spectroscopy: A case study in eastern China. Spectrochimica Acta Part B: Atomic Spectroscopy 2018, 149, 300-312. [CrossRef]
- Bousquet, B.; Sirven, J. B.; Canioni, L., Towards quantitative laser-induced breakdown spectroscopy analysis of soil samples. Spectrochimica Acta Part B: Atomic Spectroscopy 2007, 62 (12), 1582-1589. [CrossRef]
- Yi, R.; Yang, X.; Zhou, R.; Li, J.; Yu, H.; Hao, Z.; Guo, L.; Li, X.; Lu, Y.; Zeng, X., Determination of Trace Available Heavy Metals in Soil Using Laser-Induced Breakdown Spectroscopy Assisted with Phase Transformation Method. Anal Chem 2018, 90 (11), 7080-7085. [CrossRef]
- Fu, X.; Li, G.; Dong, D., Improving the Detection Sensitivity for Laser-Induced Breakdown Spectroscopy: A Review. Frontiers in Physics 2020, 8, 68. [CrossRef]
- Hahn, D. W.; Omenetto, N., Laser-induced breakdown spectroscopy (LIBS), part II: review of instrumental and methodological approaches to material analysis and applications to different fields. Appl Spectrosc 2012, 66 (4), 347-419. [CrossRef]
- Xiu, J.; Motto-Ros, V.; Panczer, G.; Zheng, R.; Yu, J., Feasibility of wear metal analysis in oils with parts per million and sub-parts per million sensitivities using laser-induced breakdown spectroscopy of thin oil layer on metallic target. Spectrochimica Acta Part B: Atomic Spectroscopy 2014, 91, 24-30. [CrossRef]
- Haider, A. F. M. Y.; Parvin, M.; Khan, Z. H.; Wahadoszamen, M., Highly Sensitive Detection of Lead in Aqueous Solution using Laser-Induced Breakdown Spectroscopy Coupled with Adsorption Technique. Journal of Applied Spectroscopy 2021, 87 (6), 1163-1170. [CrossRef]
- Haider, A. F. M. Y.; Hedayet Ullah, M.; Khan, Z. H.; Kabir, F.; Abedin, K. M., Detection of trace amount of arsenic in groundwater by laser-induced breakdown spectroscopy and adsorption. Optics & Laser Technology 2014, 56, 299-303. [CrossRef]
- US Environmental Protection Agency (EPA) The Arsenic Rule: Background and Rule Provisions. https://www.epa.gov/sites/default/files/2015-09/documents/train1-background.pdf (accessed September, 2015).
- US Environmental Protection Agency (EPA) EPA Strengthens Safeguards to Protect Families and Children from Lead in Contaminated Soil at Residential Sites in Region 7. https://www.epa.gov/newsreleases/epa-strengthens-safeguards-protect-families-and-children-lead-contaminated-soil (accessed January 17, 2024).
- US Environmental Protection Agency (EPA) Regional Screening Levels (RSLs) - Generic Tables. https://www.epa.gov/risk/regional-screening-levels-rsls-generic-tables (accessed May, 2024).
Figure 1.
Affected zip codes 35207, 35217 (red) and control zip code 35214 (yellow) (similar demographics, smoking prevalence, and socioeconomic status). There is more than twice the prevalence of patients with COPD and other lung diseases in zip codes 35207 and 35217.
Figure 1.
Affected zip codes 35207, 35217 (red) and control zip code 35214 (yellow) (similar demographics, smoking prevalence, and socioeconomic status). There is more than twice the prevalence of patients with COPD and other lung diseases in zip codes 35207 and 35217.
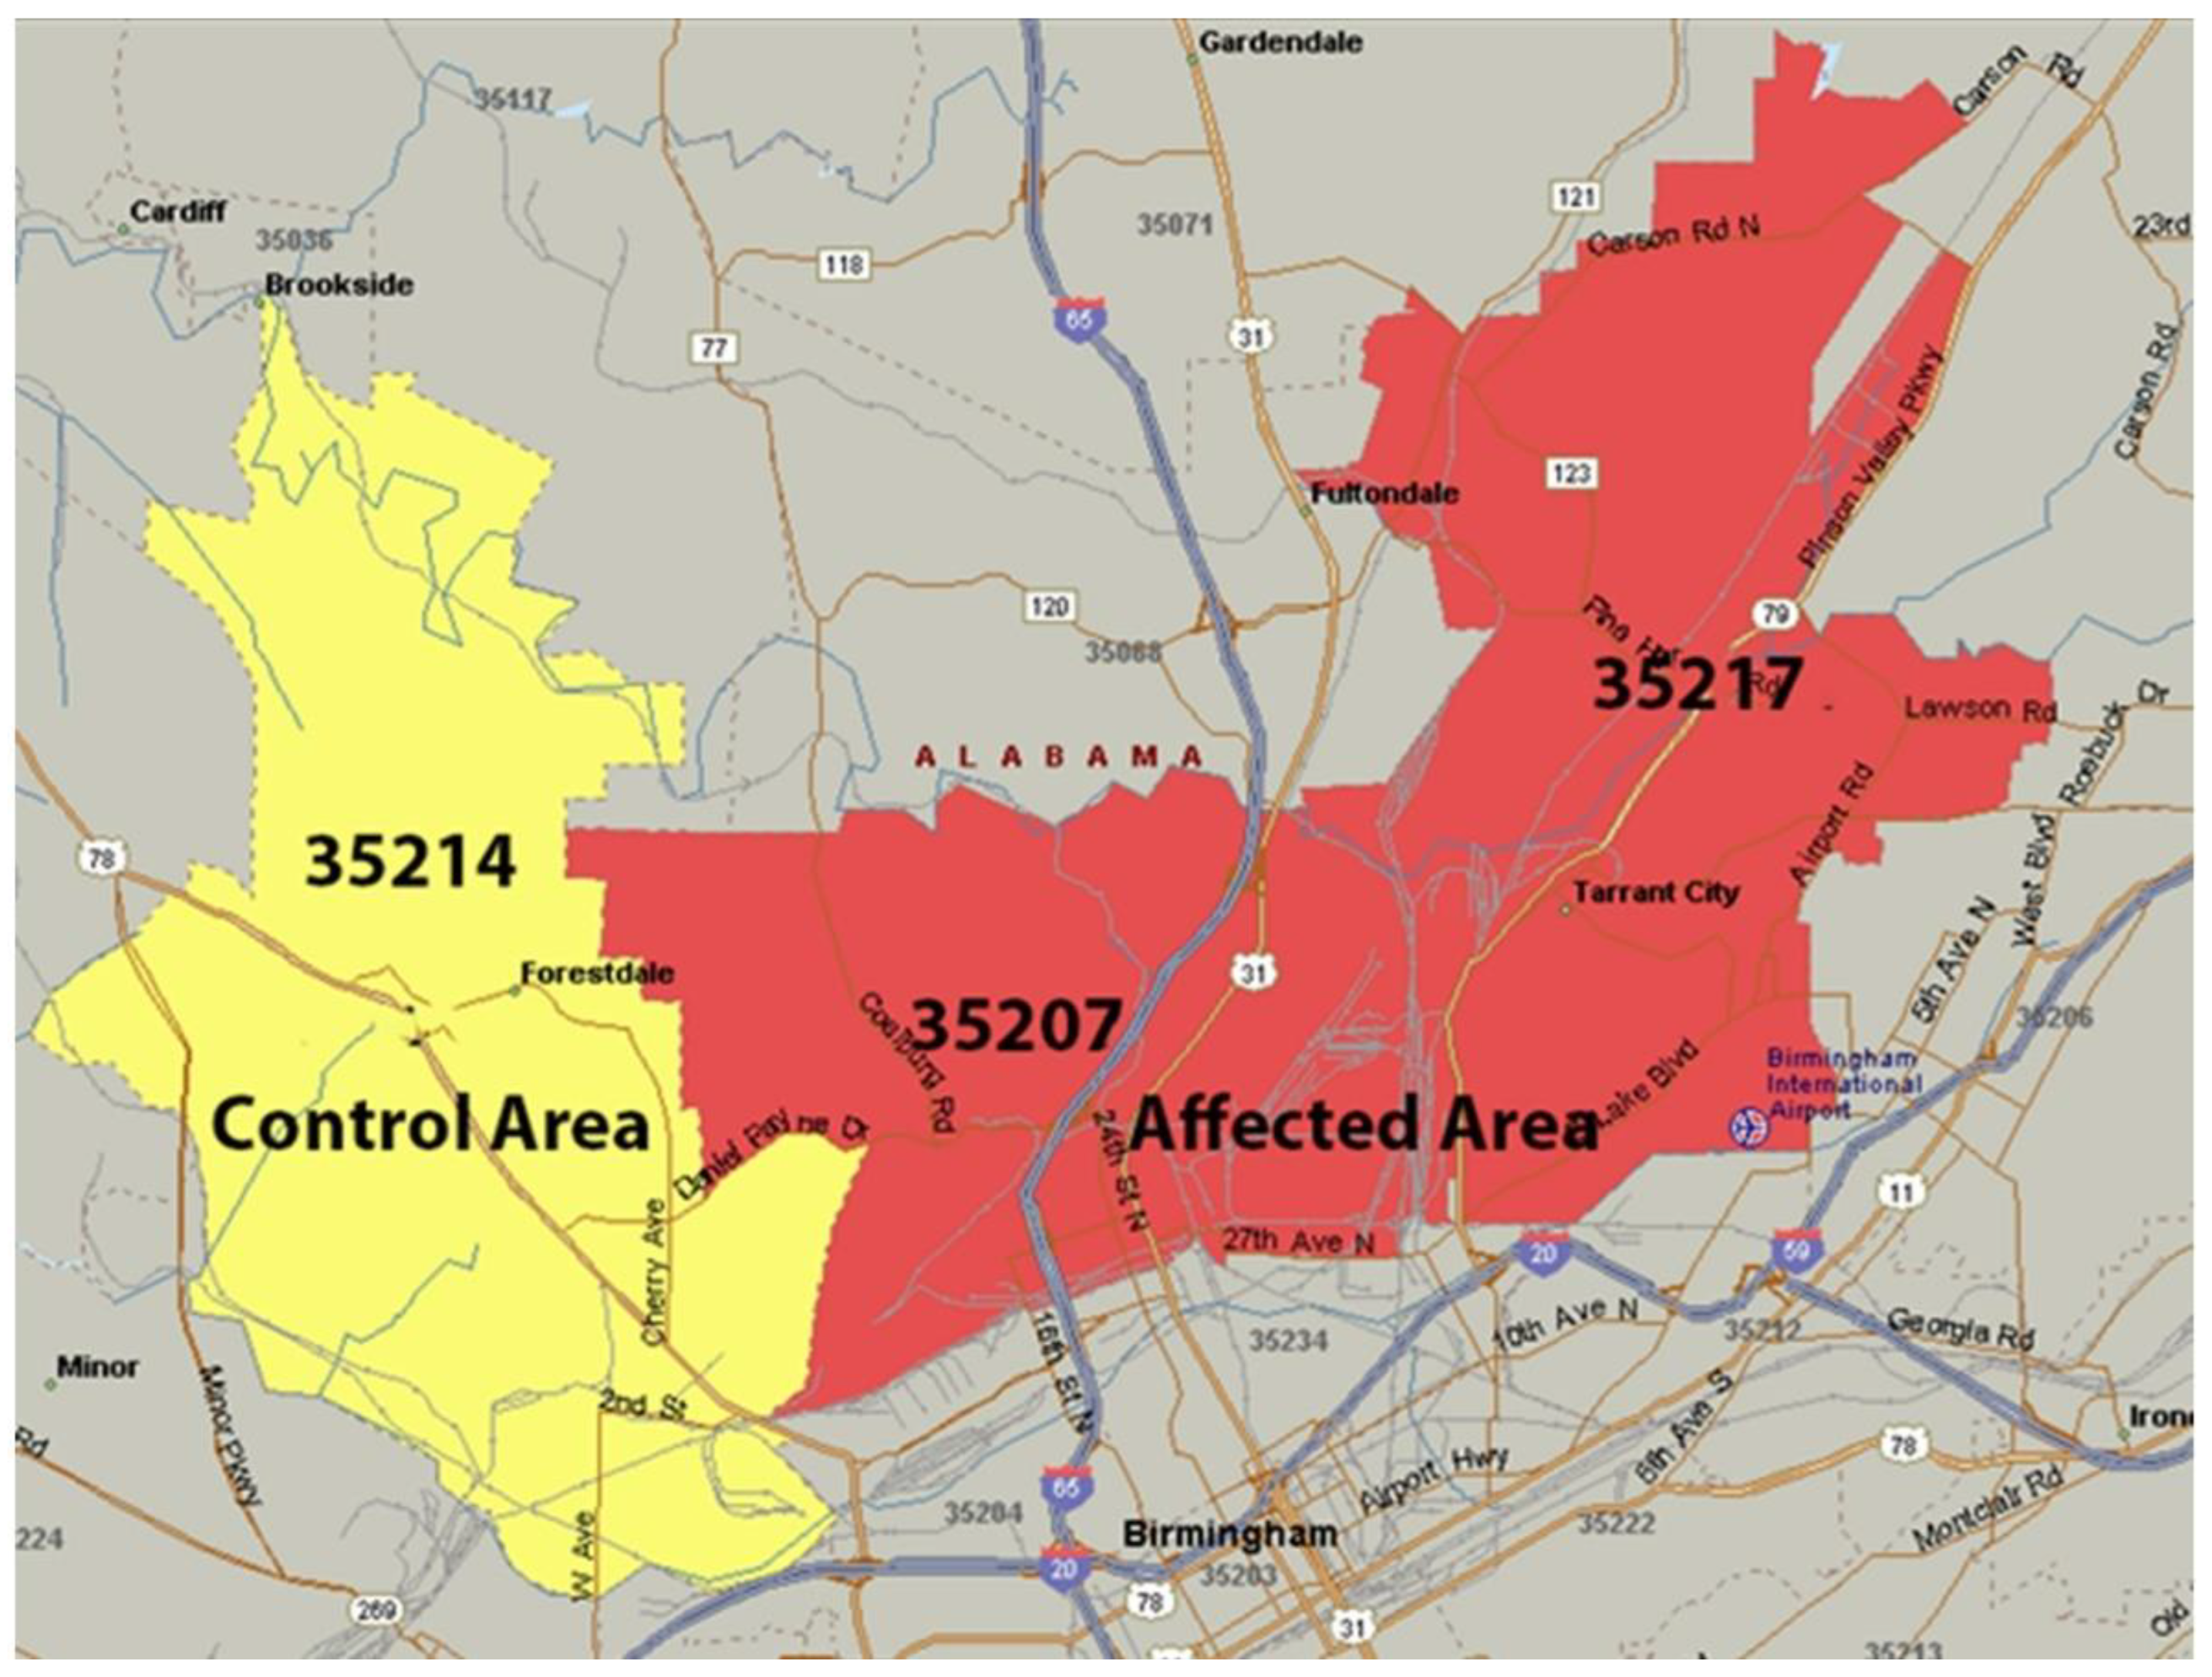
Figure 2.
Experimental setup.
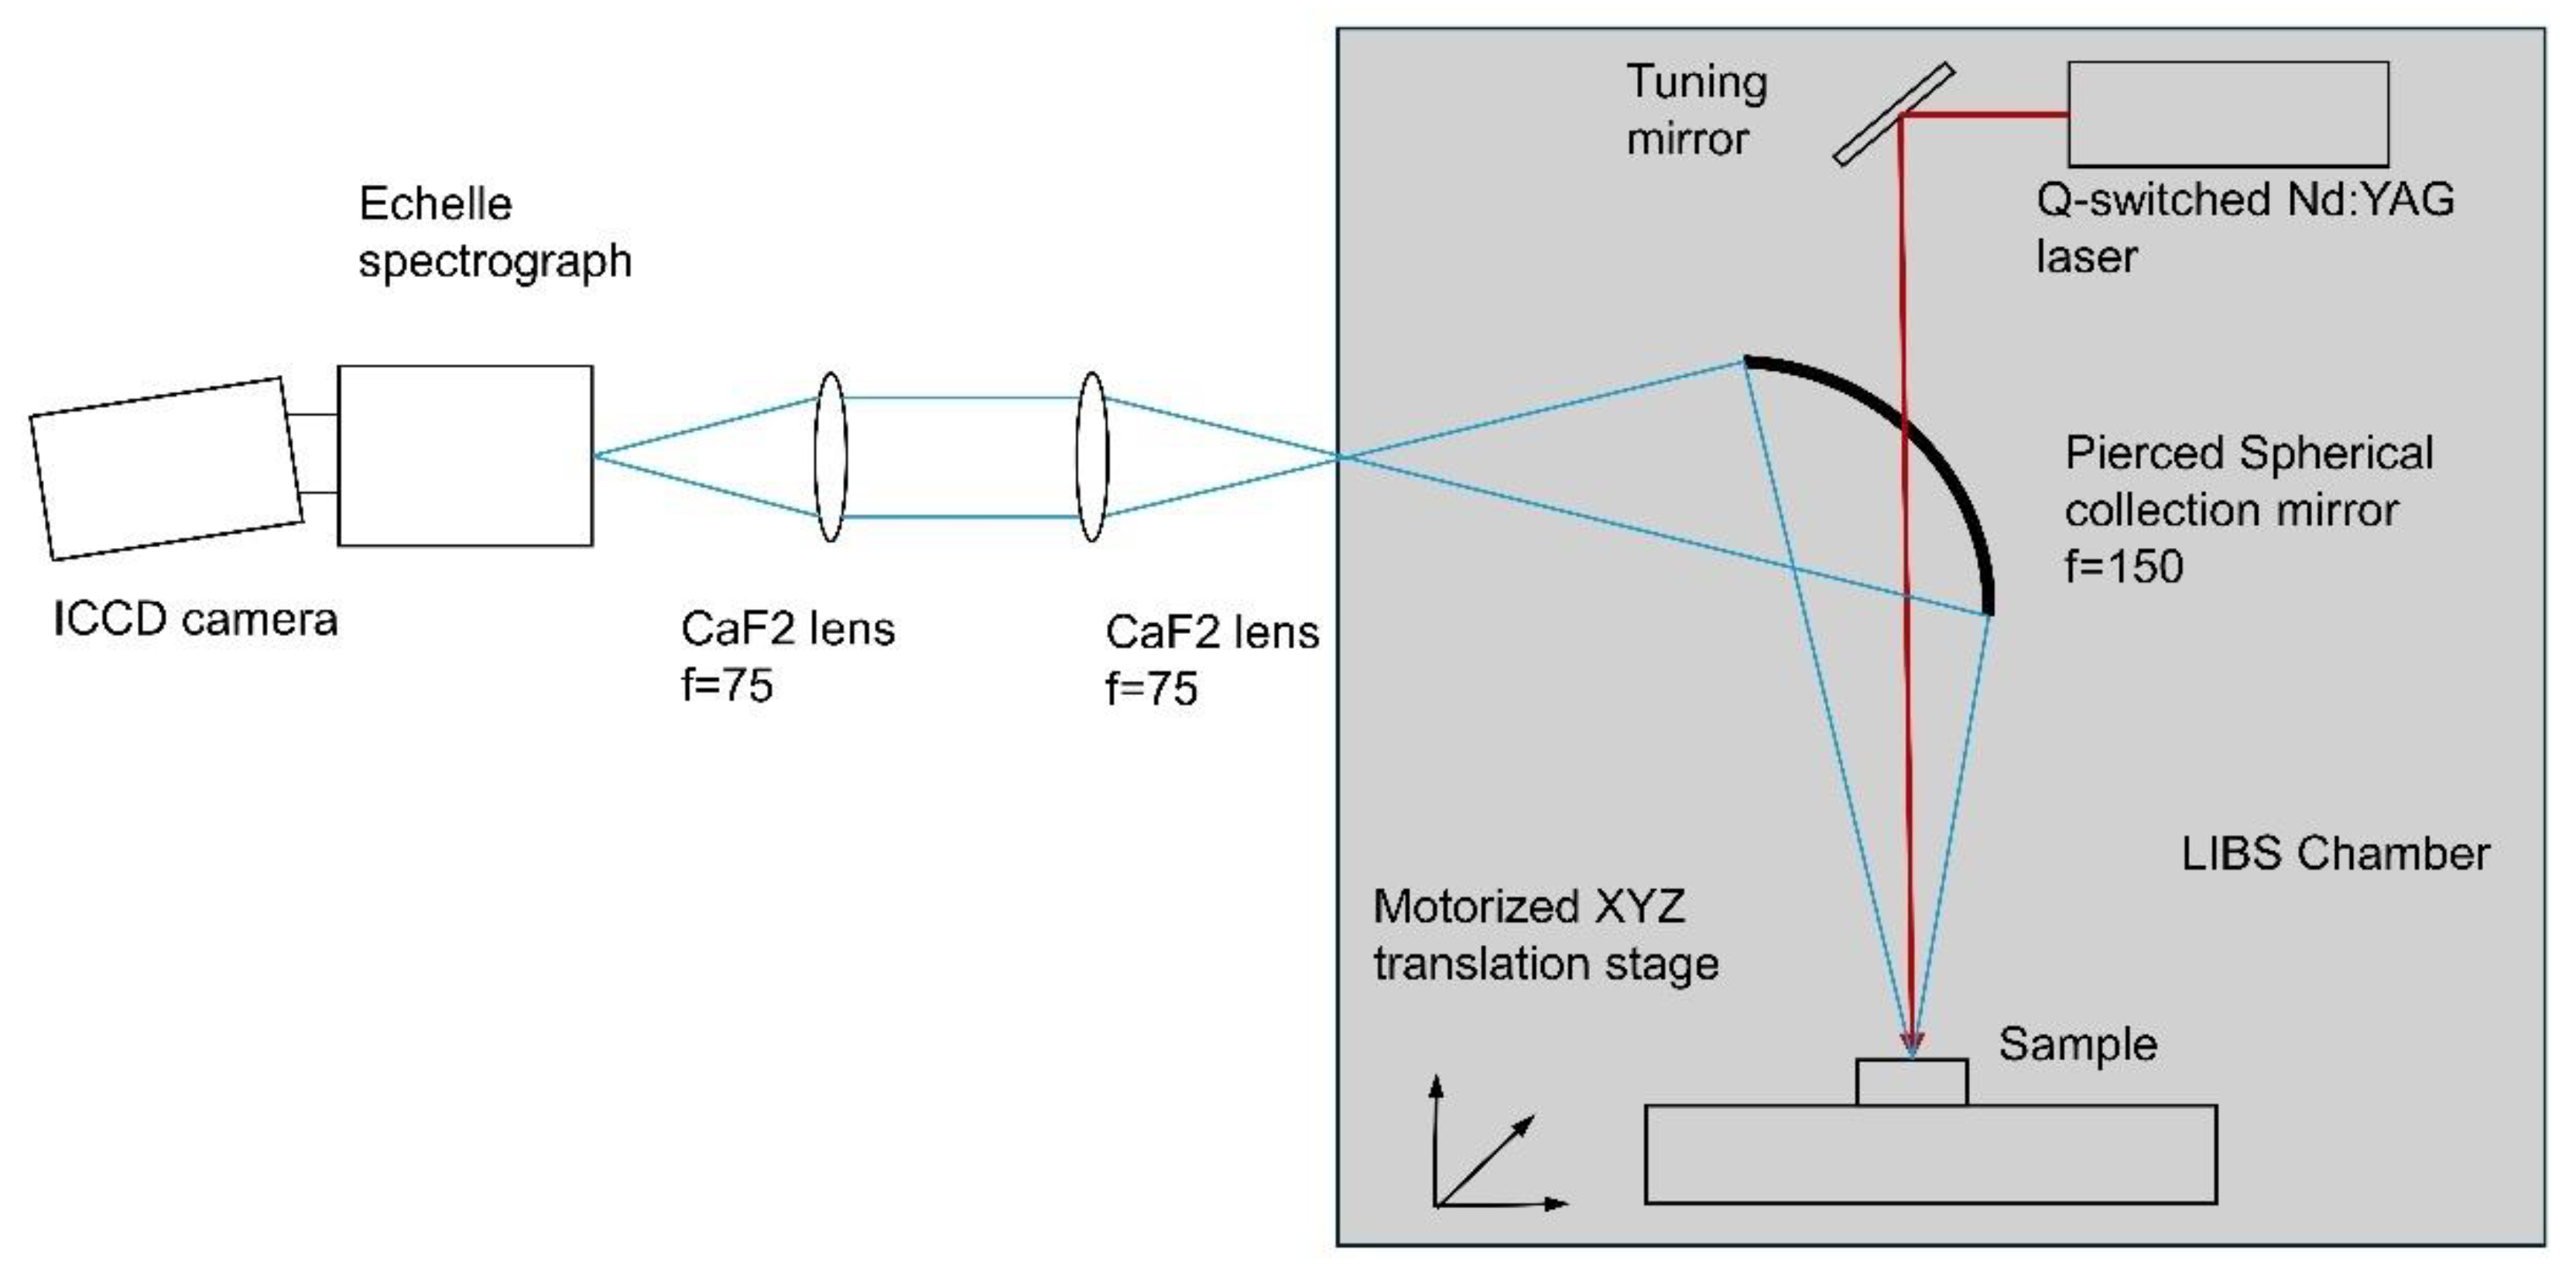
Figure 3.
Emission spectra of plasma produced with fundamental harmonics of Nd:YAG laser in soil samples, showing emission lines of: A) As(I) at 228.812 nm, B) Pb(I) at 405.78 nm, and C) Mn(I) at 403.3 nm.
Figure 3.
Emission spectra of plasma produced with fundamental harmonics of Nd:YAG laser in soil samples, showing emission lines of: A) As(I) at 228.812 nm, B) Pb(I) at 405.78 nm, and C) Mn(I) at 403.3 nm.
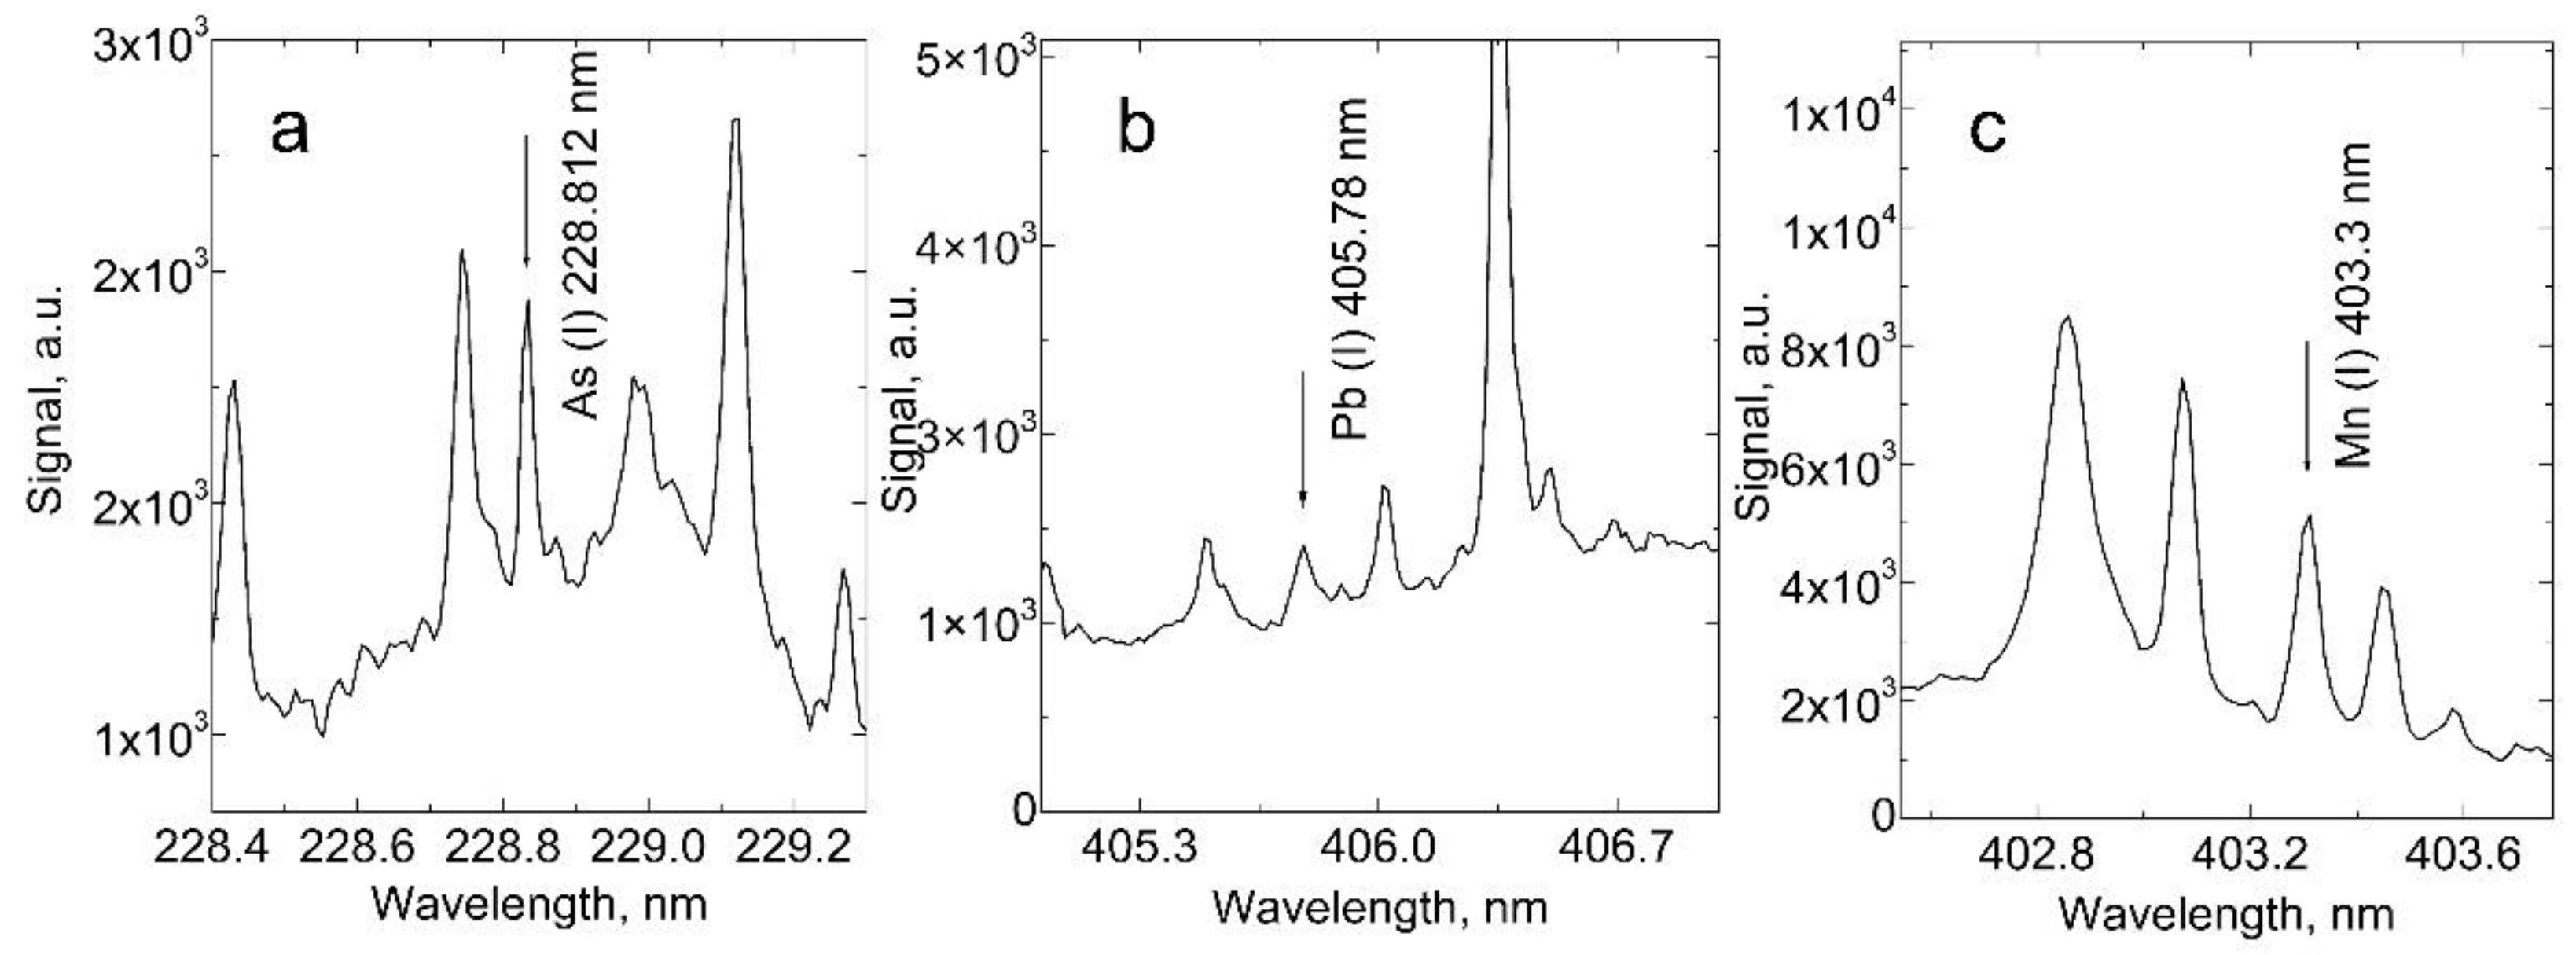
Figure 4.
Calibration curves and measurements of pristine soil samples of: A) As(I) at 228.812 nm, B) Pb(I) at 405.78 nm, and C) Mn(I) at 403.3 nm. The points shown as black squares were used for the linear fit, while the red squares belong to the calibration measurements but were excluded from the linear fit due to the effect of saturation typical in LIBS measurements for high analyte concentrations. The points shown as green triangles correspond to measurements of pristine soil samples.
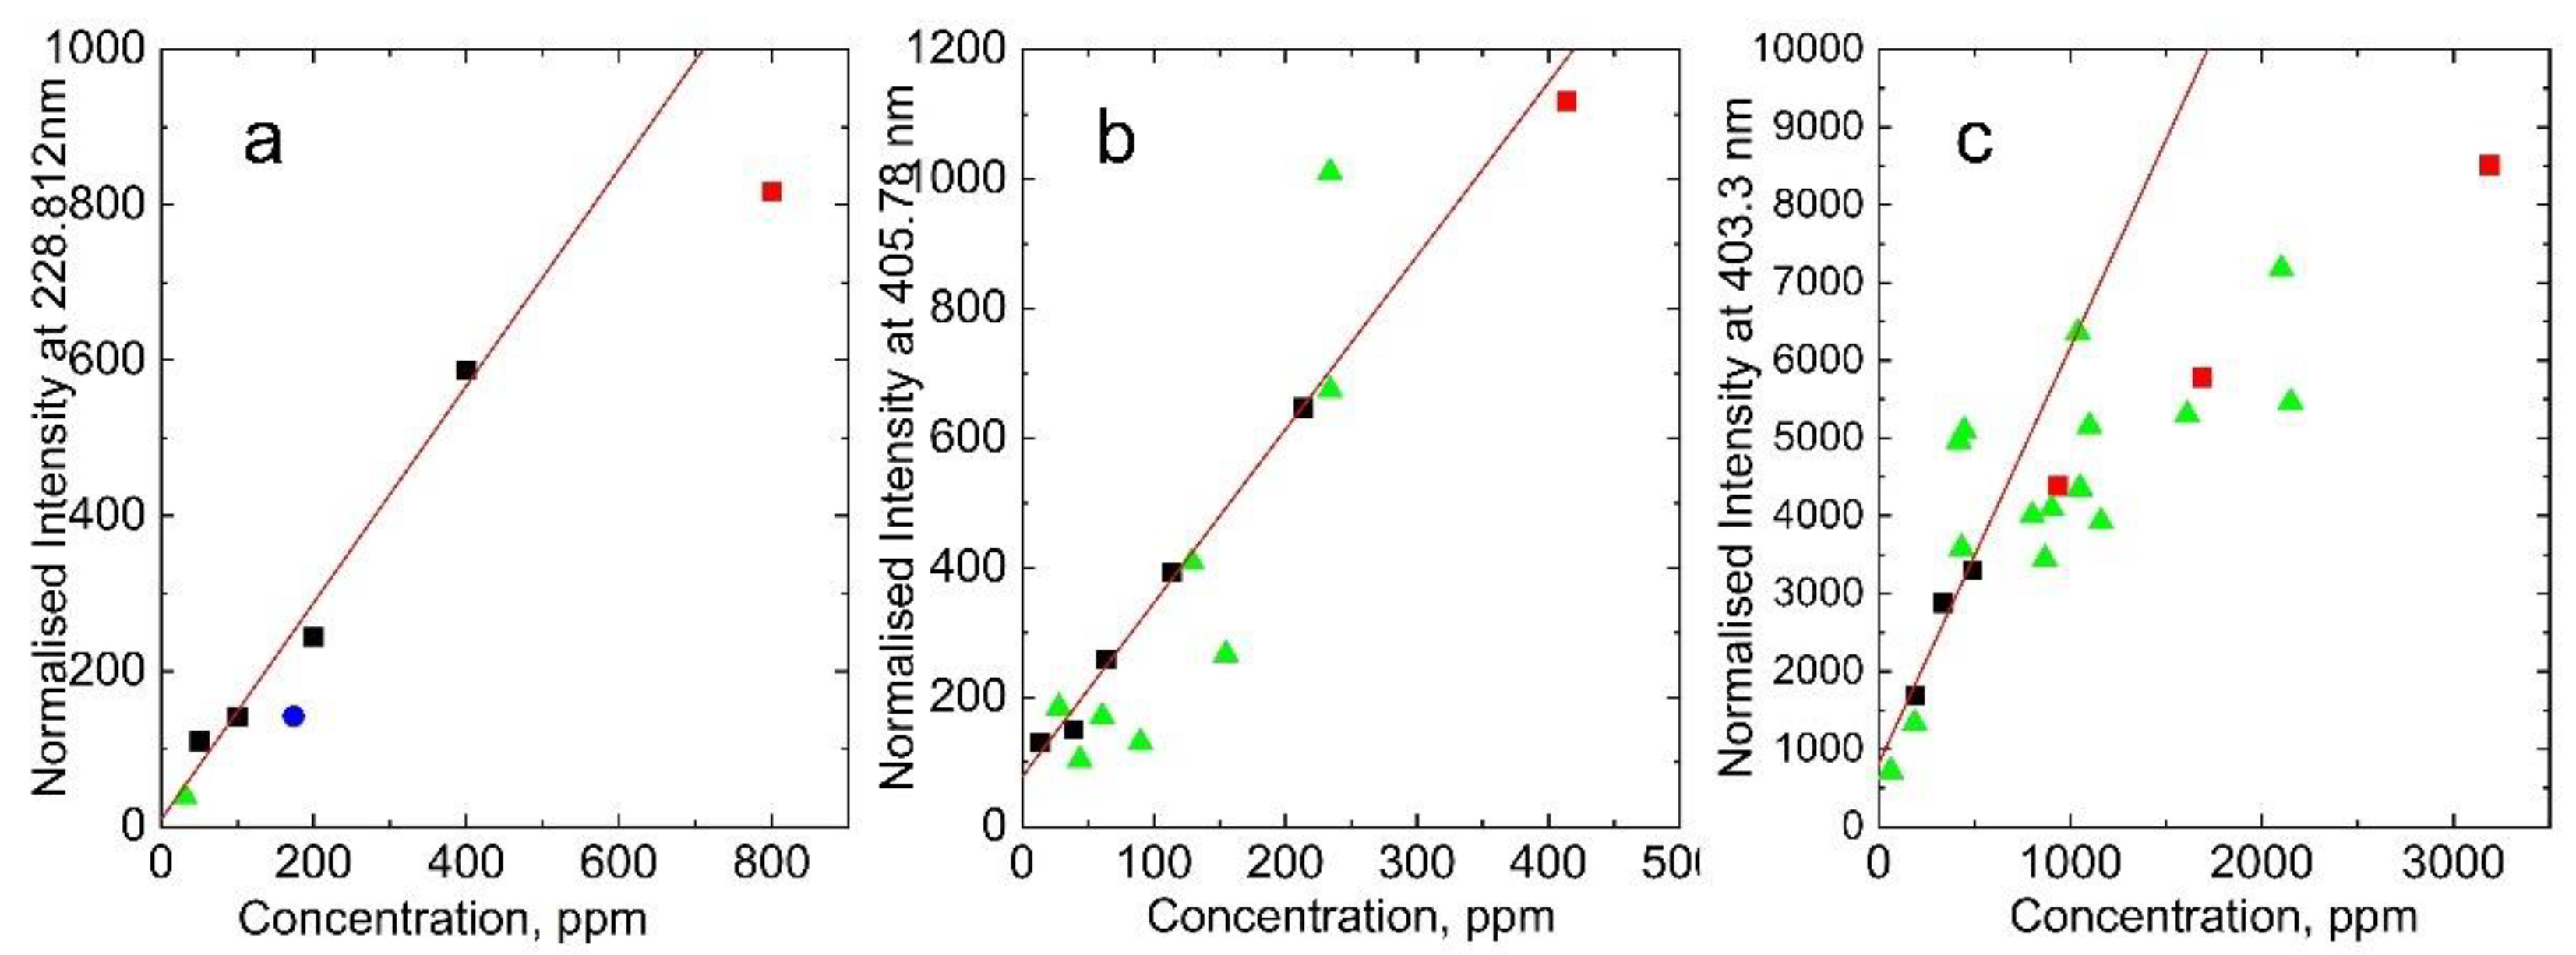

Table 1.
Permissible amounts of As, Pb, and Mn in different media published by several agencies:.
| Element | Media | Level | Agency and reference | LoD | Max measured concentration in studied samples |
| Arsenic (AS) | Soil | 40 ppm | USS EPA [28] | 43ppm | 174ppm |
| Led (Pb) | Soil | 200 ppm | USS EPA [29] | 16ppm | 234ppm |
| Manganese (Mn) | Soil | 1800 ppm | USS EPA [30] | 33ppm | 2100ppm |
Disclaimer/Publisher’s Note: The statements, opinions and data contained in all publications are solely those of the individual author(s) and contributor(s) and not of MDPI and/or the editor(s). MDPI and/or the editor(s) disclaim responsibility for any injury to people or property resulting from any ideas, methods, instructions or products referred to in the content. |
© 2024 by the authors. Licensee MDPI, Basel, Switzerland. This article is an open access article distributed under the terms and conditions of the Creative Commons Attribution (CC BY) license (http://creativecommons.org/licenses/by/4.0/).
Copyright: This open access article is published under a Creative Commons CC BY 4.0 license, which permit the free download, distribution, and reuse, provided that the author and preprint are cited in any reuse.


