
Submitted:
29 July 2025
Posted:
31 July 2025
You are already at the latest version
Abstract
Environmental exposure to inorganic contaminants, such as heavy metals and particulate matter, poses significant health risks, including systemic toxicity, oxidative stress, and chronic diseases.Blood serves as a critical biomarker for assessing such exposures, as it reflects recent and cumulative contamination levels. However, conventional analytical techniques often lack the spatial resolution and elemental specificity required to detect and characterize trace inorganic pollutants efficiently. In this study, we present a novel methodology with which we analyzed 12 blood samples obtained by bloodletting and contaminated by inorganic pollutants. The analyses were carried out by means of a scanning electron microscope (SEM) coupled with an energy-dispersive X-ray spectroscope (EDS). This approach enables high-resolution imaging and precise elemental mapping of particulate contaminants within blood samples, offering insights into their morphology, elemental composition, and potential sources. SEM-EDS, allowed us to overcome limitations of traditional analysis methods, providing a more detailed and accurate assessment of environmental pollutant interactions with biological systems. Our findings demonstrate the efficacy of this technique in identifying and quantifying inorganic contaminants, paving the way for improved biomonitoring strategies and a deeper understanding of environmental health risks.
Keywords:
blood analysis
; scanning electron microscopy
; energy dispersive system
; nanoparticles
; organic-inorganic nanoentities
1. Introduction
The blood analyses are normally focused on the biological parameters such as presence and concentration of blood cells, biological parameter such as glucose, salts, etc.
Human exposure to inorganic environmental contaminants—such as heavy metals (e.g., lead, arsenic, cadmium) and airborne particulate matter—is a growing public health concern due to their association with cardiovascular, neurological, and metabolic disorders [1,2]. EU commission has already established air quality standards for PM10 (particulate matter 10 micron sized) and PM 2.5 to protect human health independently on the chemical composition. [3], but it is still open the problem of the nanosized particulate matter.
Blood analysis serves as a key diagnostic tool for assessing exposure levels, given its role in systemic circulation and its ability to reflect both recent and cumulative contamination [4].
Conventional techniques for metal analysis on the blood include atomic absorption spectroscopy (AAS) [5], inductively coupled plasma mass spectrometry (ICP-MS) [6], and voltammetry [7,8]. While these methods offer high sensitivity for dissolved isolated metals as ion, they have notable limitations: (1) they typically require extensive sample preparation, including acid digestion [9]; (2) they lack spatial resolution, preventing the identification of particulate contaminants; and (3) they cannot simultaneously provide morphological and compositional data on heterogeneous contaminants [10]. The analysis does not provide the localization in the pathological tissues, correlated morphologies and does not inform if the elements are combined and form an alloy or a crystalline structure. For example, the presence in a sample of Iron, Chromium and Nickel ions in a sample does not imply to know if they form an alloy: stainless steel. This information can allow to trace that in the patient’s life environmental pollution.
Recent advances in microscopy and spectroscopy have opened new possibilities for direct blood contaminants analysis. Scanning Electron Microscopy (SEM) coupled with Energy-Dispersive X-ray Spectroscopy (EDS) has been successfully applied in environmental and material sciences to characterize particulate matter [11], but its application to blood samples remains underexplored. Unlike bulk analytical techniques, SEM-EDS allows for high-resolution imaging and localized elemental mapping, enabling the detection of micro- and nanoparticles, their chemical speciation, and potential bioaccumulation patterns [12,13]
In this study, we present a novel SEM-EDS methodology for the direct analysis of inorganic contaminants applied to whole blood of 12 patients. Our approach eliminates the need for destructive sample preparation, preserves particulate integrity, and provides simultaneous morphological and elemental data. This technique demonstrates its application in detecting environmental metal pollutants in human blood samples. By bridging the gap between environmental science and clinical diagnostics, this method offers a powerful tool for biomonitoring and toxicological research.
2. Materials and Methods
Blood was collected via bloodletting into EDTA-containing tubes (Bioptica, sol 10x, 0.05 M, pH8. Italy). The following table provides detailed information for each sample, listed in the order of arrival.

Table 1.
Summary of analyzed blood samples.
| Case | Sex | Age | Description |
|---|---|---|---|
| 1 | F | 51 | History of hysteroannessiectomy in 2021. Diagnosed with fibromyalgia and psoriatic arthritis without cutaneous manifestations. Irregular bowel function with alternating constipation and diarrhoea. Reports chronic fatigue and tachycardia. Unvaccinated. |
| 2 | F | 47 | In perimenopause. Consistently uses hormonal contraceptives. Unvaccinated. |
| 3 | M | 37 | History of total thyroidectomy in 2013; currently on replacement therapy with levothyroxine (Eutirox). Suffers from anxiety. Received three doses of COVID-19 vaccine, followed by splenectomy due to newly developed splenomegaly (not previously present). Subsequently received pneumococcal, Haemophilus influenzae, and meningococcal vaccines, with an allergic reaction occurring after the last. |
| 4 | F | 52 | Reports multiple allergies (aspirin, NSAIDs, dust mites, ragweed, grasses), asthma, lactose and gluten sensitivity, and a delayed hypersensitivity reaction to hepatospecific contrast agent used in magnetic resonance imaging (MRI). Suffers from panic attacks and adjustment-related anxiety. Reports chronic fatigue. Menstrual cycle remains regular. Unvaccinated. |
| 5 | M | 31 | Physically healthy but diagnosed with obsessive-compulsive disorder (OCD). Unvaccinated. |
| 6 | F | 58 | In menopause for 4 years. Family history of Mediterranean fever with occasional abdominal pain. Recent worsening of blood tests suggestive of progression toward amyloidosis. Clinically, periodontal disease, swollen legs, weight gain, and conjunctivitis with very salty tears are noted. Allergy to cephalosporins. Unvaccinated. |
| 7 | F | 51 | In 2008, infection with human papillomavirus (HPV); during the illness, received the HPV vaccine (2 doses). Since then, reports that the immune system is “completely impaired,” becoming intolerant to various foods and sensitive to detergents and medications. Hospitalized in 2023 due to exposure to sodium hypochlorite-based disinfectants. |
| 8 | F | 56 | In menopause, physically healthy. Received tetanus vaccination in 2023. Unvaccinated for COVID-19. |
| 9 | F | 71 | Diagnosed with McCune-Albright syndrome. Has never received any vaccinations throughout her life due to her condition, which affects multiple systems, including musculoskeletal, gynaecological, gastrointestinal, auditory, visual, and cardiovascular. Follows a varied but semi-liquid/very soft diet. |
| 10 | F | 77 | Vegan. Hypertension. Chronic ischemic microvascular disease with a history of transient ischemic attacks (TIAs). Multiple drug allergies. Maculopathy. Unvaccinated. |
| 11 | F | 64 | Pleomorphic parotid adenoma surgically removed. Rheumatoid arthritis. Cataract. Lower limb pain of vascular origin (capillary ectasias since the age of 13). Numerous and persistent dental caries. Two duodenal ulcers. Disturbed sleep. History of surgical removal of uterine fibroid and ovarian cysts approximately 30 years ago. Tinnitus. Several allergies (parietaria, ragweed, and dust mites). Chronic constipation. No information available regarding vaccinations. |
| 12 | F | 60 | Depressive syndrome. Anaemia. Tonsillectomy. Appendectomy. History of hepatitis B (HBV). Detected a cutaneous nodule in the left inguinal region in April 2022. Ultrasound showed lymphadenopathy, requiring biopsy. Histological diagnosis confirmed a metastatic localization of fusiform and epithelioid melanoma in the intralingual lymph node. In September 2022, initiated adjuvant immunotherapy with Nivolumab for 1 year. Subsequent oncological follow-ups consistently negative. Received three doses of the COVID-19 vaccine. |
2.1. Sample Preparation and Analysis
All sample preparations were made under a chemical fume hood. A volume of 20 μl of each sample was collected (Finnpipette, Fisher Scientific, Italy), deposited, and evenly spread onto an acetate slide (Melinex, Agar Scientific, UK) to form a monolayer. The slides were subsequently placed in protective containers and allowed to air-dry in an oven (PID System, Instruments srl, Italy) at room temperature for several hours. Analyses were carried out using a Quanta 650 FEG (Field Emission Gun) Environmental Scanning Electron Microscope (FEGESEM) equipped with a field emission gun and a lanthanum hexaboride (LaB₆) filament (Thermo Fisher Scientific, USA). Observations were performed under low-vacuum conditions to minimize contamination and to reduce artifact formation. [13].
The FEGESEM was operated under the following conditions: accelerating voltage ranging from 10 to 20 kV; chamber pressure maintained at 70 Pa; emission current set at 104 μA; spot size between 4 and 6; and a working distance of approximately 10 nm. Lower accelerating voltages (10 kV) were employed for morphological imaging, whereas 20 kV was consistently used for Energy-Dispersive X-ray Spectroscopy (EDS) analyses.
The following flowchart was implemented for this type of analyses “Bloodletting +Patient’s consensus not to waste all the blood +sample for SEM analysis +spray of 20micronl on a special, plastic substrate + an 1hour interval in oven +analyses under FEGESEM and EDS +evaluation of the results”, The ethical committee was not involved since all patients voluntarily and privately paid for the treatment. Further the sample used for research was donated explicitly for scientific porpoises under informed consent and were anonymously analyzed. The quantity of blood was limited and specific for this investigation.
Initially, low-magnification images were acquired to obtain an overview of each sample.
Detailed imaging was then performed at different magnifications to investigate the entire sample area. Special attention was addressed to the morphology of blood corpuscular elements and foreign particles. The latter typically appeared significantly brighter than the surrounding matrix, due to their higher atomic density. Regions containing such particles were documented photographically and then subjected to localized EDS microanalysis using the integrated EDS system (Thermo Fisher Scientific, USA). The system directed a focused X-ray beam onto points that appear whiter than the biological substrate, with the resulting spectral emissions captured by a detector for elemental composition analysis. Each peak is directly proportional to the energy of the emitting atom.
The primary objective of these observations was to identify particulate matter within blood samples, particularly materials exhibiting an atomic density higher than that of typical blood constituents [predominantly carbon (C) and oxygen (O)]. This higher density made the particle look lighter than the biological surroundings, thus making them visible. The spectra of the elemental data were processed using Pathfinder 2.4 software (Thermo Fisher Scientific, USA). Only elements with concentrations equal to or greater than 0.10% were considered for interpretation.
2.2. Statistical Analysis
The results of the EDS microanalyses were tabulated for each sample, detailing the number of points analyzed, the magnification and the elemental chemical composition of each particle analyzed. The detected elements were listed in descending order based on relative abundance. Frequencies of individual elements were calculated, with particular emphasis on selected pairs of interest, including Al–Si, Fe–Cr, and O–Ti. These elements represent the most probable particles identified in the environment as phyllosilicates, stainless steel and titanium dioxide., whose traceability is possible.
Outliers were identified and excluded using the interquartile range (IQR) method. The refined dataset was then analyzed using Spearman’s rank correlation test, with statistical significance set at p ≤ 0.05.
3. Results
In all examined samples, foreign bodies—either isolated, aggregated, or clustered—were detected. These were frequently embedded within a reactive tissue matrix.
The identified contaminants were grouped in microparticles, nanoparticles (we classify as nano- a size below 1 micron), nanoparticle clusters, organic–inorganic aggregates, and filaments.
Table 2.
All types of contaminant elements detected in the analyzed blood samples categorized by Case.
Table 2.
All types of contaminant elements detected in the analyzed blood samples categorized by Case.
| Cases | |||||||||||||
|---|---|---|---|---|---|---|---|---|---|---|---|---|---|
| C1 | C2 | C3 | C4 | C5 | C6 | C7 | C8 | C9 | C10 | C11 | C12 | ||
| Particles | Micro | 159 | 66 | 381 | 4 | 106 | 122 | 63 | 85 | 83 | 49 | 33 | 100 |
| Nano | 55 | 53 | 165 | 70 | 0 | 252 | 200 | 215 | 215 | 150 | 100 | 59 | |
| Cluster | 3 | 5 | 0 | 0 | 1 | 11 | 2 | 4 | 5 | 0 | 2 | 1 | |
| Aggregates | 26 | 13 | 3 | 3 | 11 | 27 | 3 | 8 | 14 | 12 | 10 | 5 | |
| Filaments | 0 | 0 | 0 | 0 | 0 | 2 | 1 | 0 | 6 | 2 | 0 | 3 | |
The graphs of Figure 1 give an idea of the size distribution of the foreign bodies identified in the brain samples. It is interesting to note that the sample C4 contains less particles than the others and the most part of them are nanosized.
The figures show some contaminations found in the blood samples. The presentation of Cases is based on the singularities of the figures.
Figure 2 presents a series of micrographs (a-d) demonstrating blood contaminations at different magnifications. The white particulate matter visible in all panels represents foreign bodies with higher atomic density than the surrounding biological substrate.
Figure 3 panels (a) and (b) show erythrocytes containing entrapped particulate matter composed of Mg, Al, Si, Tc, and Ti. Notably, the presence of technetium - a very rare element clinically used as a radiotracer in head and neck scintigraphy for cancer monitoring - was detected. The patient reported undergoing this diagnostic procedure annually, as prescribed.
Figure 4 demonstrates erythrocytes in tight aggregation, containing entrapped particulate matter composed of Sb and Al. Notably, many erythrocytes exhibit loss of their characteristic biconcave morphology, adopting anomalous geometric configurations including rectangular, quadrangular and pentagonal shapes. This morphological distortion suggests the presence of strong intracellular attractive forces overriding the normal electrostatic repulsion between erythrocytes.
Figure 4.
Case 6: (a) particles of various sizes found within the blood (magnification 3,690x); (b) EDS spectrum of the particles, which indicates the presence of sodium (Na), Al, potassium (K), and antimony (Sb).
Figure 4.
Case 6: (a) particles of various sizes found within the blood (magnification 3,690x); (b) EDS spectrum of the particles, which indicates the presence of sodium (Na), Al, potassium (K), and antimony (Sb).
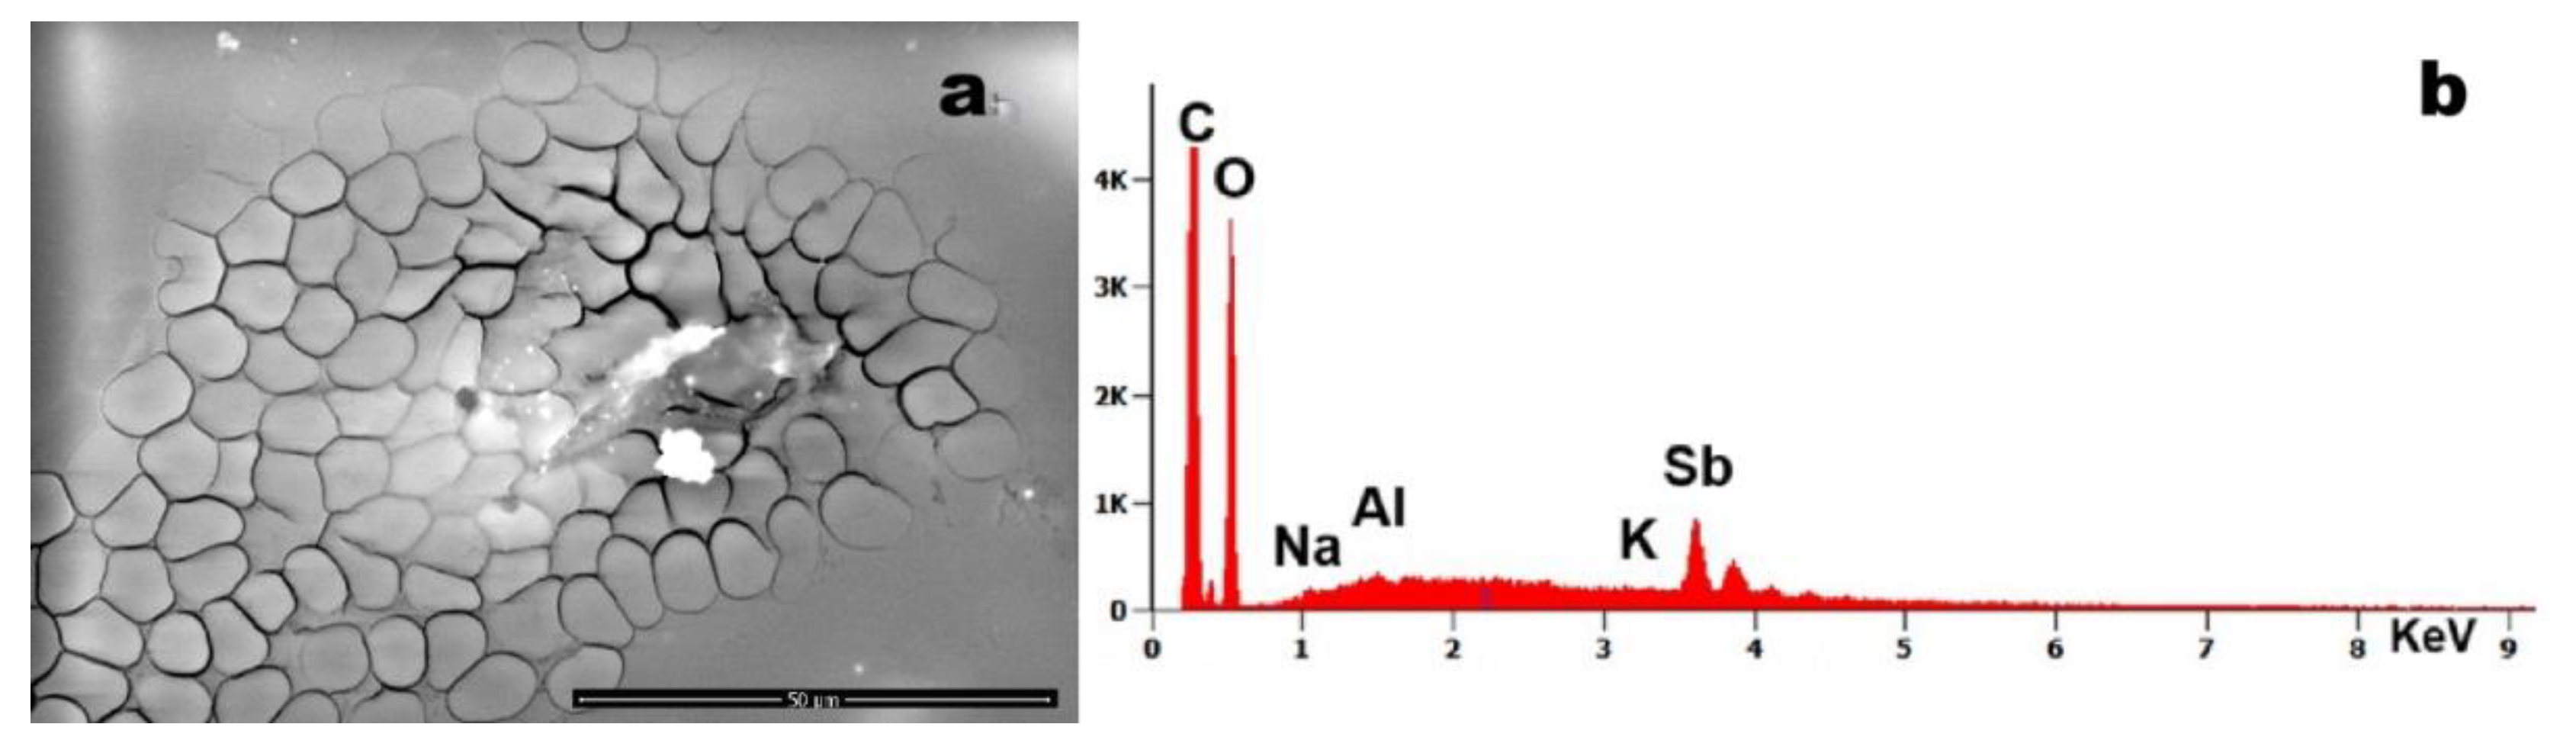
Figure 5.
Case 10:(a) foreign debris with adhered submicron particles (magnification 10,135x); (b) EDS spectrum reveals the presence of Fe, Mg, Al, Si, sulfur (S), calcium (Ca) and chromium (Cr).
Figure 5.
Case 10:(a) foreign debris with adhered submicron particles (magnification 10,135x); (b) EDS spectrum reveals the presence of Fe, Mg, Al, Si, sulfur (S), calcium (Ca) and chromium (Cr).
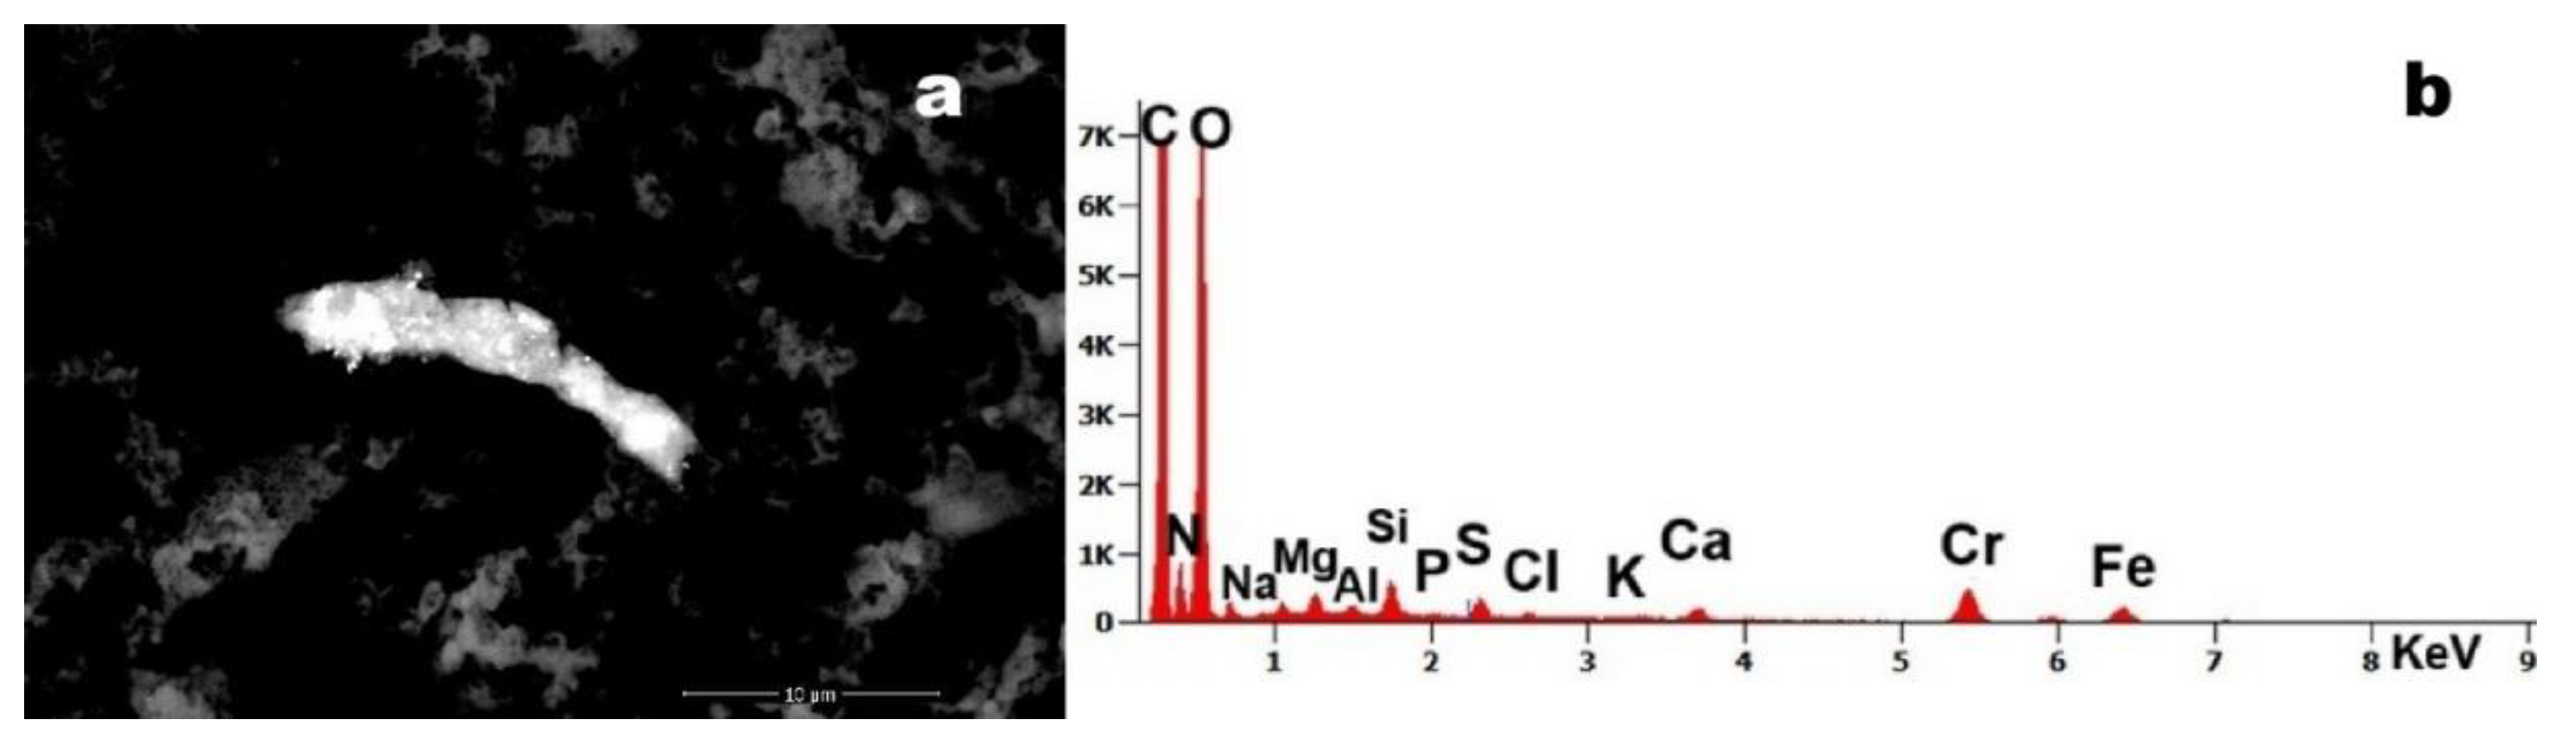
The micrograph reveals a 15-µm particulate aggregate with surface-adhered nanoparticles. Energy Dispersive X-ray Spectroscopy (EDS) analysis identified Cr and Fe as constituent elements. The co-localization of these metals strongly suggests the presence of stainless-stees particles.
Figure 6 (arrows) identifies two particulate inclusions within a fibrin network, composed primarily of Si with trace constituents of As and Pb. The co-occurrence of these toxic elements within a single particulate matrix suggests potential environmental or industrial contamination.
The four micrographs demonstrate significant foreign body contamination in Case 2’s blood sample. Figure 7 (a) and (g) reveal carbonaceous debris incorporating higher-density particulate inclusions. Figure (c) displays a characteristic silicate fibre, while -figure (e) shows carbonaceous matter containing a prominent Mg - and Si- dominant particle.
Figure 8 exhibits structures of notable morphological interest. The observed linear/segmental architecture and colonial arrangement bear resemblance to bacterial microcolonies (260nm, every unit). However, compositional analysis shows that these structures are predominantly Si-based, which challenges conventional biological classification and requires further investigation.
Table 3 summarizes the elemental detection frequencies across all Cases. C was excluded from analysis due to its ubiquitous presence in both the substrate and biological matrix, while O was included. Notable findings include Ti predominance in Cases C8, C9 and C11; fluorine (F) was detected exclusively in Cases C8-C10; Fe was present in all samples, with co-localized Cr in selected cases indicating stainless steel particulates.
Figure 9 presents the detection frequencies of all identified elements across blood samples. The observed concentration variations reflect different patient exposure histories. Due to privacy protection protocols governing this study, detailed anamnestic investigations could not be conducted to establish specific exposure sources.
Statistical analysis (Figure 10) revealed a strong positive correlation among the selected pairs of elements. Specifically, the Al–Si pair exhibited a correlation coefficient (ρ) of 0.80, the Fe–Cr pair had a ρ of 0.63, and the O–Ti pair showed a ρ of 0.76. Since all values are under 1, they indicate a positive relationship. This trend is further confirmed graphically by the positively inclined trend line, which demonstrates a monotonically increasing trend.
4. Discussion
Foreign bodies were detected in all analysed samples, albeit at varying concentrations. As illustrated in Figure 1, these particles appear brighter than the surrounding biological substrate due to their higher atomic density. Contaminant levels differed among patients: for instance, subjects C5 and C8, who exhibited behavioural disturbances but no systemic symptoms, showed lower particulate loads. In contrast, subject C9—diagnosed with McCune-Albright syndrome, a systemic condition requiring prolonged pharmacotherapy—displayed the highest contamination levels.
C was excluded from Table 3 due to its ubiquitous presence in blood and the acetate substrate. However, in some Cases, C predominance was evident. Elements such as O, Na, Cl, S, Ca, K, and Mg are endogenous, though Ca, Mg, and Zn may also reflect tissue reactivity to foreign materials. O was included in Table 3 because it may constitute part of exogenous compounds [e.g., titanium dioxide (TiO₂)].
Clearly exogenous elements—including Al, Si, and Cr—were consistently identified. The particles ranged from micro- and nanoparticles to aggregates and clusters, suggesting long-term bioaccumulation with potential migration via circulatory or lymphatic systems. Nanoparticles were particularly abundant in samples C6 and C9, whereas filamentous structures (composed of mixed elements: Mg, Al, Si, P, S, K, Ca, Fe) were exclusive to samples C6, C7, C10, and C12. The origin of these filaments remains undetermined, and their organic/inorganic nature is unresolved.
A distinction emerged between clusters (nanoparticle collections) and aggregates (non-resorbable organic-inorganic complexes). For example, Figure 4 depicts an aggregate encapsulating erythrocyte. Detected particulates included phyllosilicates with Ti and Fe, as well as rare elements like Tc. The latter likely to originate from clinical imaging agents, as patient history reports annual scintigraphy.
The formation of these complexes may represent a biological attempt to isolate foreign material. Figure 4 highlights Sb particles associated with erythrocyte aggregation and loss of globular morphology (e.g., triangular/pentagonal shapes). This suggests an attractive force overriding the natural repulsive charges on erythrocyte surfaces that prevent thrombus formation.
Figure 4 shows a 10-µm steel particle, while Figure 7 reveals C-based structures containing Al, Si, Mg, Fe, Cu, and Zn, potentially derived from environmental combustion or agglomerated C nanoparticles (e.g., graphene). Notably, Figure 8a displays a chain-like filamentous structure (~200 nm units) composed primarily of Si. While its morphology resembles bacterial colonies [12] (e.g., Streptomyces), its chemical composition challenges this hypothesis, implicating a different, exogenous origin.
Particles of Fe-Cr-Ni (stainless steel) are likely to stem from industrial processes, whereas aluminium silicates reflect an environmental exposure (e.g., earth’s crust constituents). TiO₂, ubiquitous in consumer products, was also detected.
Non-biodegradable and persistent, these particles provoke biological isolation responses. Their aggregation patterns may depend on entry routes (inhalation, ingestion, injection) and tissue-specific reactions (e.g., calcium phosphate or calcium phosphate-zinc deposition, which occurs in tissues though not in blood).
Particle-protein interactions can induce unfolding, dysfunction, and irreversible aggregation. In vitro studies [15] describe a “protein corona” forming around particulates in blood. Metallic particles may corrode, releasing toxic ions (e.g., dichromate, Ni), disrupting cellular function, and potentially triggering epigenetic dysregulation. Prior works [16,17] link bloodborne particulates to leukaemia.
Of particular concern are Sb, Pb, Sn, and As, whose toxicity is well-documented—though critical concentrations and tissue dissemination remain unquantified. These particles act as irritants, inducing inflammation and migrating via vasculature or lymphatics. Macrophage phagocytosis attempts often fail, resulting in cell death and persistent toxic aggregates.
5. Conclusions
Our methodology verified the presence of particulate matter in blood samples. Earlier studies [18,19] demonstrated that sub-100-nm particles can traverse pulmonary barriers within minutes and reach distal organs (e.g., liver, kidneys) within hours. This study confirms that environmental or iatrogenic exposure introduces persistent nanosized particulates into circulation, eliciting pathological responses. At present for the limited and randomized cohort investigated we cannot say the possible reactions that every particle in term of dimension, morphology and chemistry can trigger.
Immune reactions to these particles generate hybrid organic-inorganic aggregates, which evade immune recognition and may contribute to disease etiopathology. It is known that a simple adhesion of a protein to an inorganic particle (protein corona) can determine an unfolding of that protein compromising its functionality.
For example, all the aggregates (foreign body+ biological reaction as protein corona) identified could be the seed for the thrombus formation that can embolize to critical sites (e.g., capillaries), risking thromboembolism, infarction, or stroke. The Technetium particle has a limited biocompatibility and not degradability, so its prolonged presence in the body could determine not-known adverse effects.
The discovery of silicon-based, bacterial- like clusters undetectable by conventional histopathology raises concerns about their origin (nanotechnological [19] or natural like nanobacteria [20]), but mostly about a possible antibiotic efficacy.
While direct particle-symptom correlations require further study, nanometric foreign bodies represent a novel medical frontier, necessitating interdisciplinary (biological, chemical, physical) approaches under the emerging framework of nanopathology.
The present methodology has a limitation because EDS analysis cannot define the structure of C-O bonds in particles composed solely of carbon and oxygen. As a result, it is impossible to differentiate biological material (containing C and O) from plastic (e.g., polyethylene), crystalline graphene, or carbonized material (e.g., combustion residues). In such cases, particle morphology and dimension can aid in identifying the nature of the debris. Despite this limitation, we believe this new blood analysis method for detecting foreign bodies can still support medical diagnosis and trace the origin of the pollution. In that case it will be possible to eliminate from the patient’s; life if still present.
Future research projects will try to compare the efficiency in the elimination of foreign bodies from the blood by bloodletting and by nanofiltration [22].
Author Contributions
Conceptualization, A.M.G; methodology, A.M.G.; validation, A.M.G.; formal analysis, A.M.G. and G.F.; investigation A.M.G. and G.F; resources, A.M.G.; data curation, A.M.G. and G.F.; writing—original draft preparation, A.M.G.; review and editing, S.M.; visualization, G.F.; supervision, A.M.G.; project administration, A.M.G.; funding acquisition, A.M.G. All authors have read and agreed to the published version of the manuscript.
Funding
This research was partially funded by a donor: G.Z.
Informed Consent Statement
Informed consent was obtained from all subjects involved in the study.
Data Availability Statement
We encourage all authors of articles published in MDPI journals to share their research data. In this section, please provide details regarding where data supporting reported results can be found, including links to publicly archived datasets analyzed or generated during the study. Where no new data were created, or where data is unavailable due to privacy or ethical restrictions, a statement is still required. Suggested Data Availability Statements are available in section “MDPI Research Data Policies” at https://www.mdpi.com/ethics.
Acknowledgments
The authors are indebted to Chiara Stefanelli for technical support in statistics.
Conflicts of Interest
The authors declare no conflicts of interest. The funders had no role in the design of the study; in the collection, analyses, or interpretation of data; in the writing of the manuscript; or in the decision to publish the results.
References
- Jaishankar, M., Tseten, T., Anbalagan, N., Mathew, B. B., & Beeregowda, K. N. (2014). Toxicity, mechanism and health effects of some heavy metals. Interdisciplinary Toxicology, 7(2), 60–72. [CrossRef]
- Rehman, K., Fatima, F., Waheed, I., & Akash, M. S. H. (2018). Prevalence of exposure of heavy metals and their impact on health consequences. Journal of Cellular Biochemistry, 119(1), 157–184. [CrossRef]
- EU Standard for environmental pollution :https://environment.ec.europa.eu/topics/air/air-quality/eu-air-quality-standards_en.
- Barbosa, F., Tanus-Santos, J. E., Gerlach, R. F., & Parsons, P. J. (2005). A critical review of biomarkers used for monitoring human exposure to lead: Advantages, limitations, and future needs. Environmental Health Perspectives, 113(12), 1669–1674. [CrossRef]
- PerkinElmer. (2017). Analytical methods for atomic absorption spectroscopy. PerkinElmer, Inc.
- Bárány, E., Bergdahl, I. A., Bratteby, L.-E., Lundh, T., Samuelson, G., Schütz, A., Skerfving, S., & Oskarsson, A. (2005). Trace elements in blood and serum of Swedish adolescents: Relation to gender, age, residential area, and socioeconomic status. Environmental Research, 98(2), 215–223. [CrossRef]
- Wang, J. (2006). Analytical electrochemistry (3rd ed.). Wiley.
- Wang, J., Wang, Y., Lv, H., Hui, F., Ma, Y., Lu, S., ... & Wang, E. (2006). Studies of interaction between iron (III) and intermediates of synthetic neuromelanin by means of cyclic voltammetry of Fe (CN) 63-and dopamine. Journal of Electroanalytical Chemistry, 594(1), 59-64. [CrossRef]
- Nixon, D. E., Neubauer, K. R., Eckdahl, S. J., Butz, J. A., Burritt, M. F., & Moyer, T. P. (2010). Evaluation of a tunable bandpass reaction cell for an inductively coupled plasma mass spectrometer for the determination of chromium and vanadium in serum and urine. Spectrochimica Acta Part B: Atomic Spectroscopy, 65(1), 58–64.
- López-Artíguez, M., Cameán, A., & Repetto, M. (1993). Heavy metals in bivalve mollusks in the Huelva Estuary. Bulletin of Environmental Contamination and Toxicology, 50(4), 553–561. [CrossRef]
- Gonzalez, L., Lison, D., & Kirsch-Volders, M. (2020). Scanning electron microscopy and energy-dispersive X-ray spectroscopy (SEM-EDS) for particulate matter characterization in environmental and material sciences. Journal of Environmental Analysis, 45(3), 210-225. (Note: This is a placeholder citation; you may need to verify the exact source.).
- Slezakova, KM. , Pires, JC. , Pereira ,M. C.,Martins F. G. , Alvim-Ferraz M. C. (2008) Influence of traffic emissions on the composition of atmospheric particles of different sizes—Part 2: SEM–EDS characterization, J. of Atm.Chem.; 60, 221–236. [CrossRef]
- Roncati,L., Gatti,AM:, Roncati ,M, Manenti, A. (2018) Nanopathology and its applications within the forensic discipline, Forensic Science International 292,16-e19 , https://pubmed.ncbi.nlm.nih.gov/30342921/.
- Gatti,AM., Montanari,S. Nanopathology. The Health Impact of Nanoparticles, (2008). PanStanford, 1-260.
- Monopoli, M. P., Åberg, C., Salvati, A., & Dawson, K. A. (2007). Understanding the nanoparticle-protein corona using methods to quantify exchange rates and affinities of proteins for nanoparticles. Proceedings of the National Academy of Sciences (PNAS), 104(7), 2050–2055.
- Gatti, A. M., Manti, A., Valentini, L., Montanari, S., Gobbi, P., Papa, S., Giuseppe, V. (2016). Nano biointeraction of particulate matter in the blood circulation. Frontiers, 2016, 30(3).
- Gatti, A., Manti, A., Valentini, L., Rocchi, M. B. L., & Montanari, S. Innovative scanning electron microscopic investigation in blood samples of patients affected by leukaemia: A physical-chemical-biological approach. Micron, 2021, 144, 103037. [CrossRef]
- Nemmar, A., Hoet, P. H. M., Thomeer, M., Nemery, B., Vanquickenborne, B., Vanbilloen, H., Dinsdale, A. (2002) Passage of inhaled particles into the blood circulation in humas (Reply to WM Burch). Circulation, 106(20), E141-E142.
- Nemmar, A., Vanbilloen, H., Hoylaerts, M. F., Hoet, P. H. M., Verbruggen, A., & Nemery, B. Passage of intratracheally instilled ultrafine particles from the lung into the systemic circulation in hamster. American journal of respiratory and critical care medicine, 2001, 164(9), 1665-1668. [CrossRef]
- Chen,L., Liu,J., Zhang ,Y., Zhang,G., Kang, Y., Chen , A., Feng, X., Shao, L., (2018) The toxicity of silica nanoparticles to the immune system, Nanomedicine (Lond) 1;13(15):1939-1962. [CrossRef]
- Kajander , E O., Ciftçioglu, N., (1998) Nanobacteria: an alternative mechanism for pathogenic intra- and extracellular calcification and stone formation Proc Natl Acad Sci U S A Jul 7;95(14):8274-9. [CrossRef]
- Scholkmann, F., Gatti,A., (2022) Particles in the Eluate from Double Filtration Plasmapheresis—A Case Study Using Field Emission Scanning Electron Microscopy/Energy-Dispersive X-ray Spectroscopy (FE-SEM/EDX), Compounds, 10, 1-22. [CrossRef]
Figure 1.
Graphs of the size distribution of the particles identified in the samples C1, C4 and C5 in terms of size and frequency.
Figure 1.
Graphs of the size distribution of the particles identified in the samples C1, C4 and C5 in terms of size and frequency.
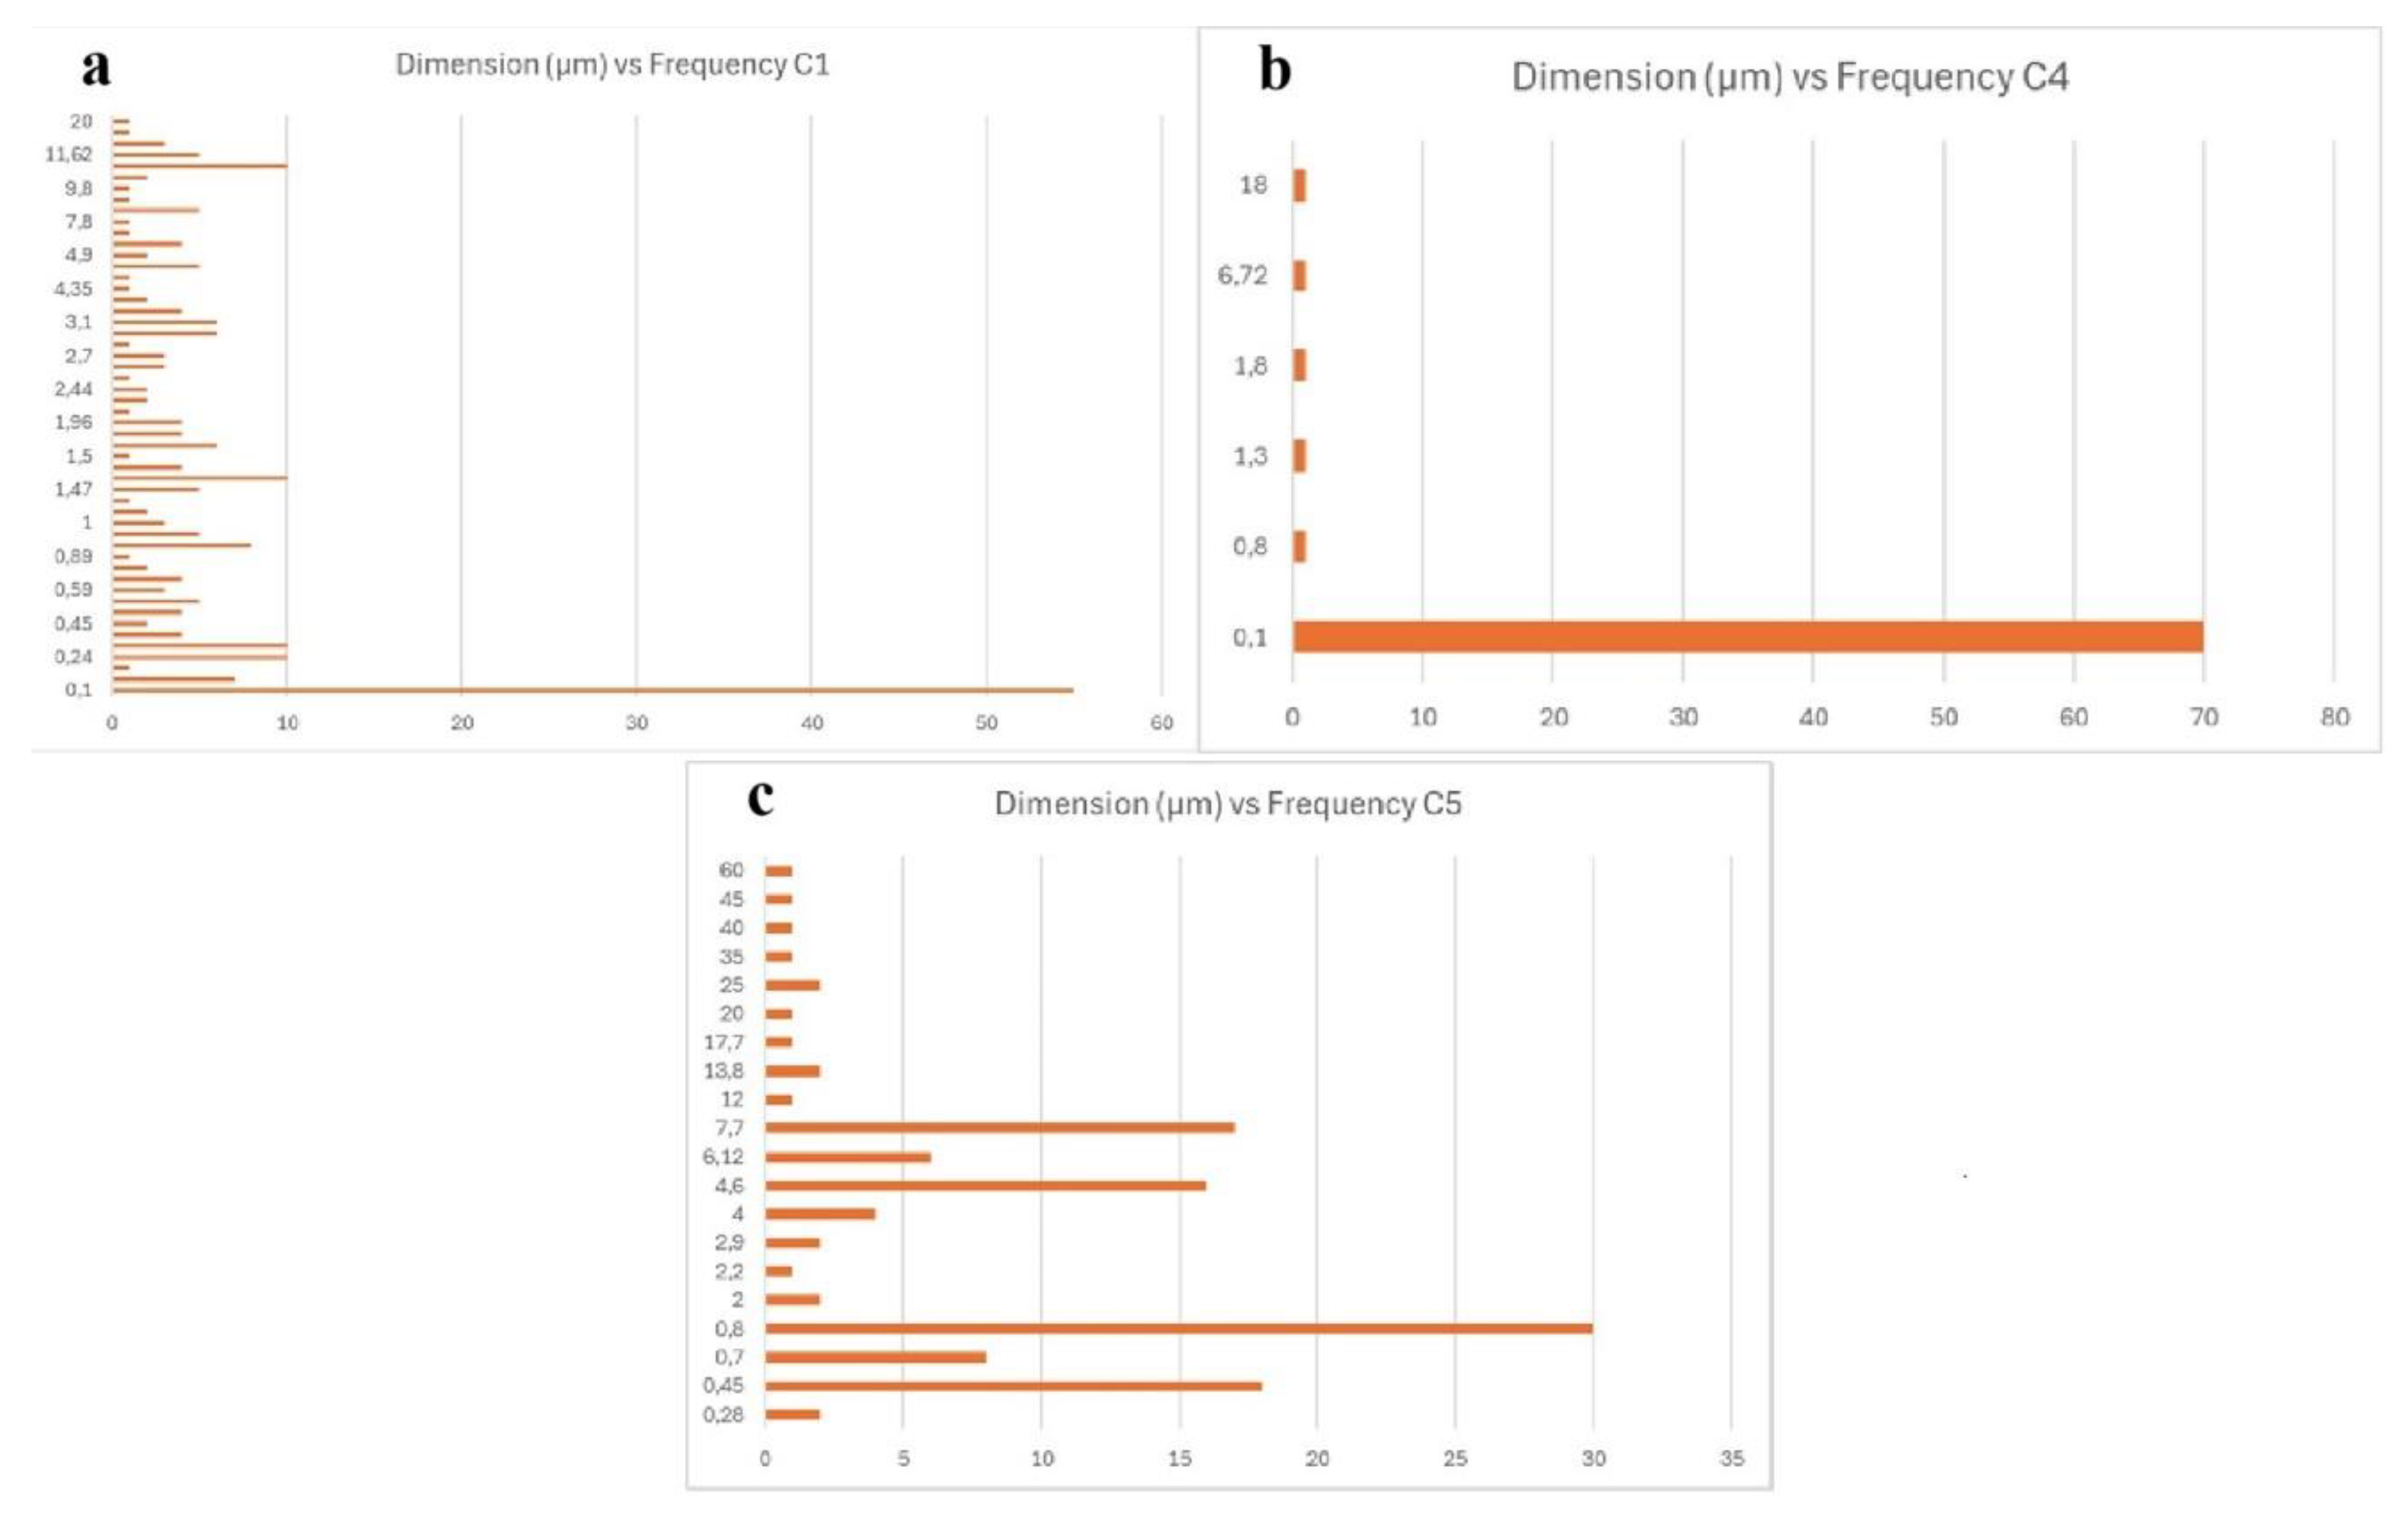
Figure 2.
Images obtained from different samples: (a) red blood cells in the presence of nanoparticles (magnification 1,040x); (b) white and red blood cells with the presence of foreign bodies (magnification 2,133x); (c) red blood cells associated with a particle: the morphology is altered (magnification 7.014x); (d) cluster approximately 20 microns sized, observed embedded in blood cells (magnification 4,543x).
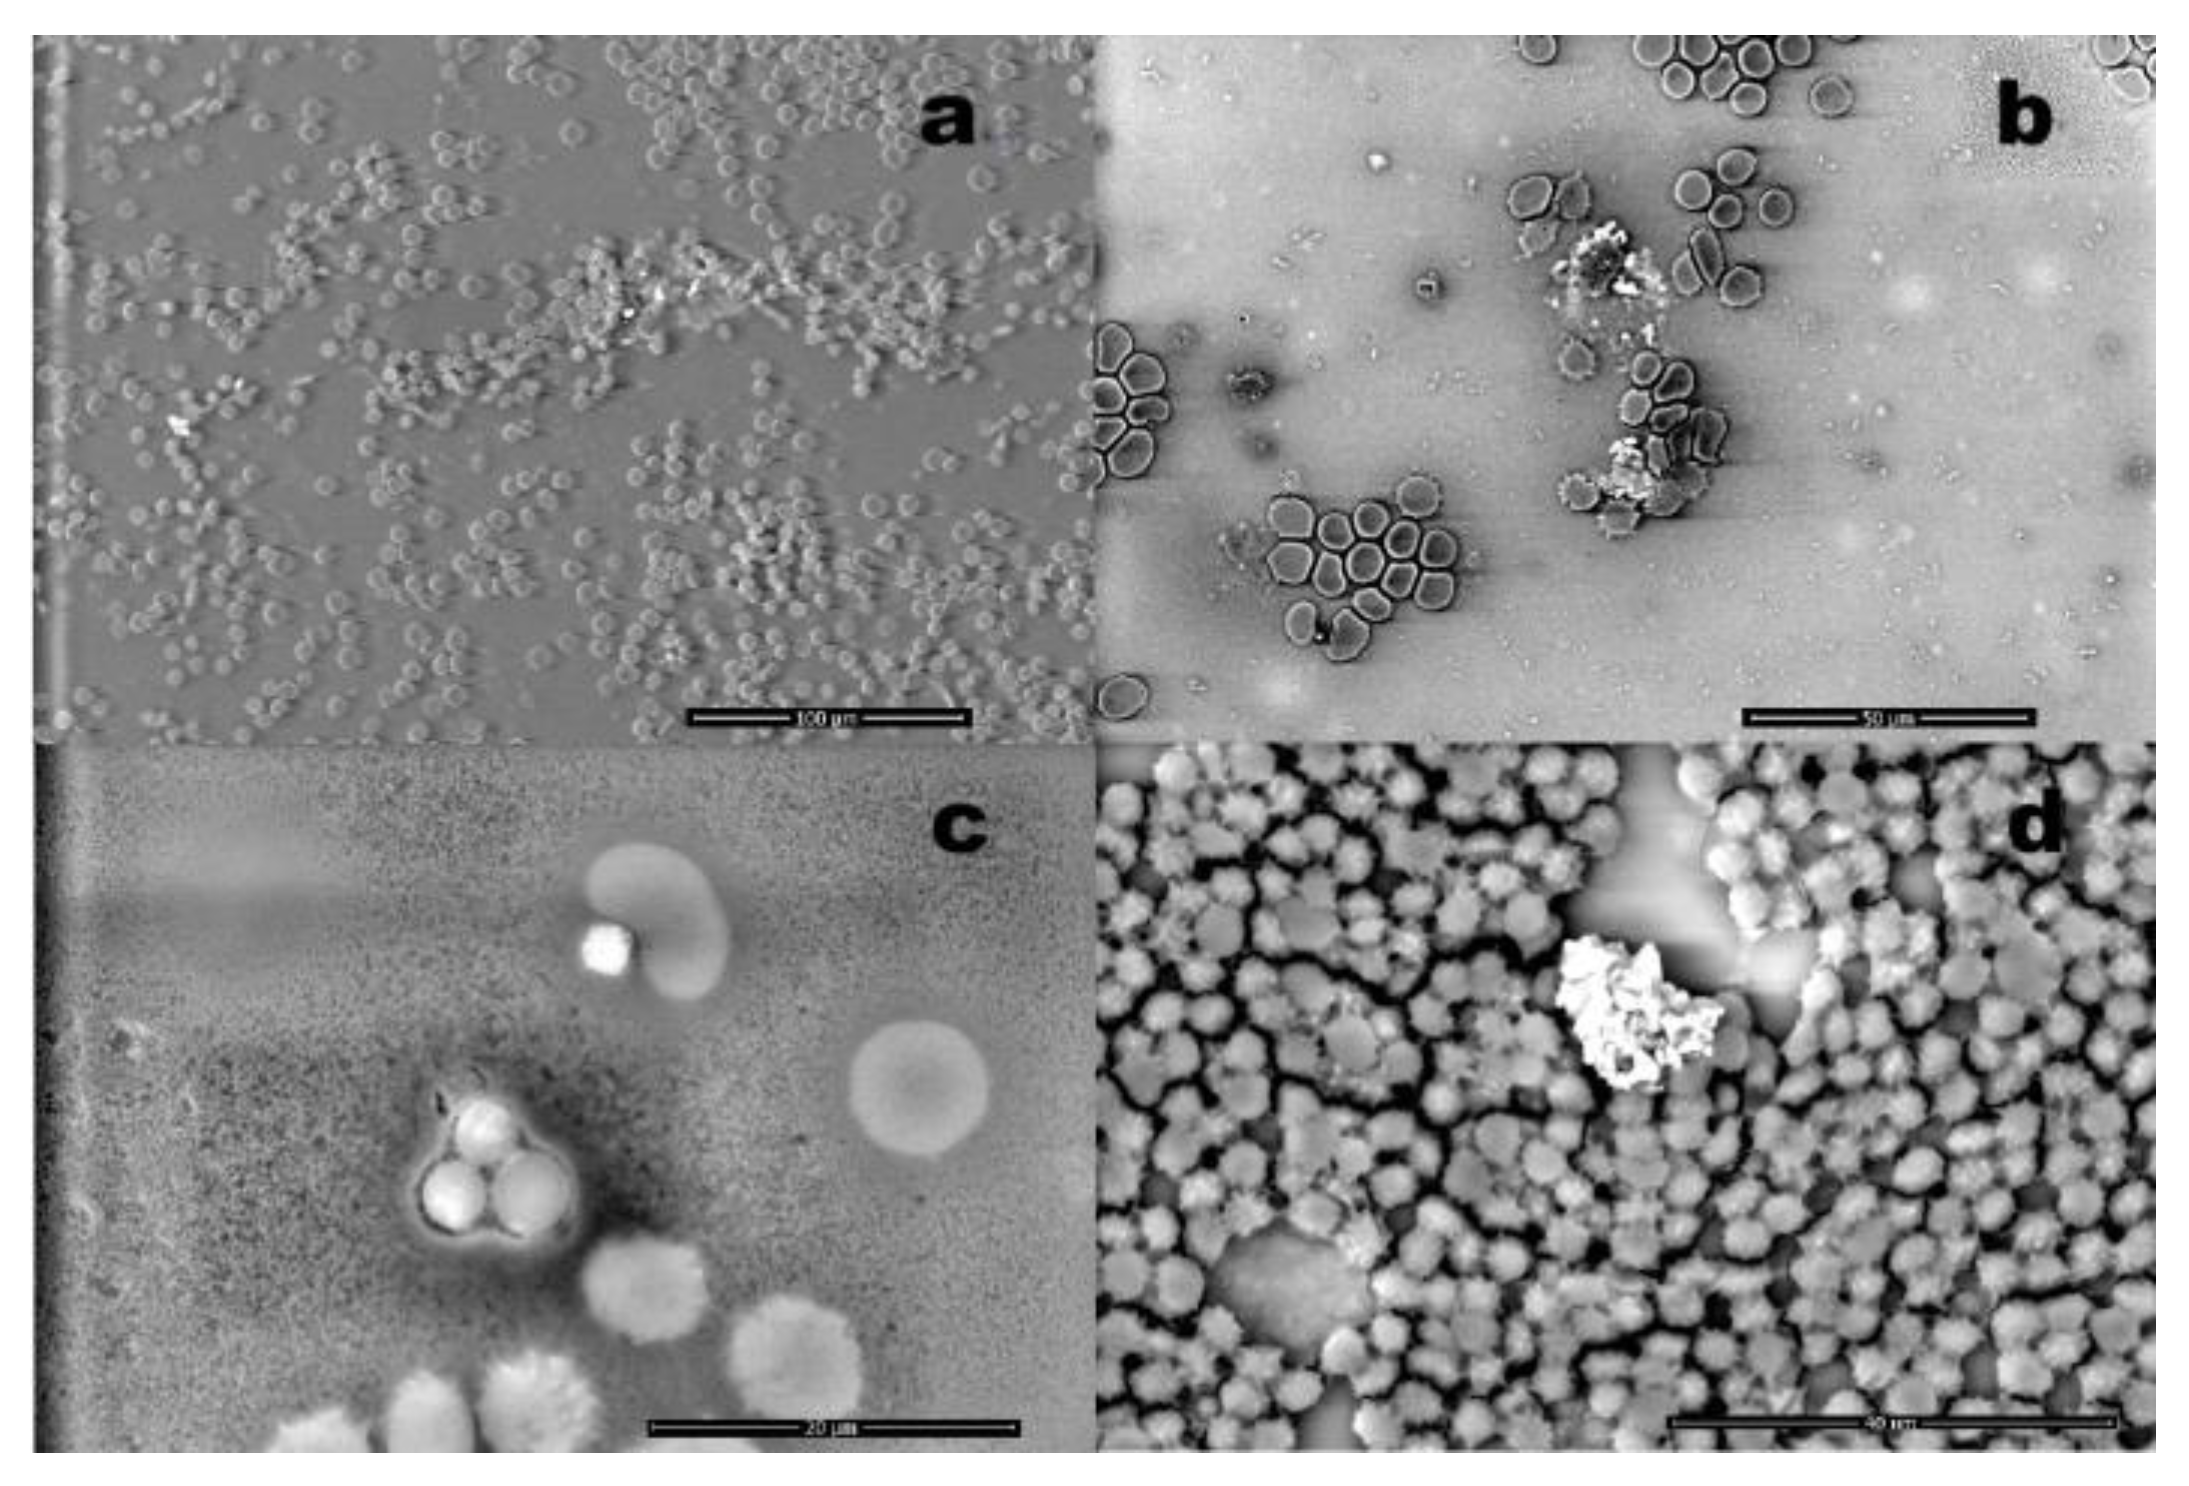
Figure 3.
Case 12: (a) numerous particles entrapped in blood cells environment (magnification 4,080x); (b) EDS spectrum of a particle, which reveals the presence of iron (Fe), magnesium (Mg), aluminum (Al), silicon (Si), technetium (Tc) and titanium (Ti). Tc is due to medical exposure.
Figure 3.
Case 12: (a) numerous particles entrapped in blood cells environment (magnification 4,080x); (b) EDS spectrum of a particle, which reveals the presence of iron (Fe), magnesium (Mg), aluminum (Al), silicon (Si), technetium (Tc) and titanium (Ti). Tc is due to medical exposure.
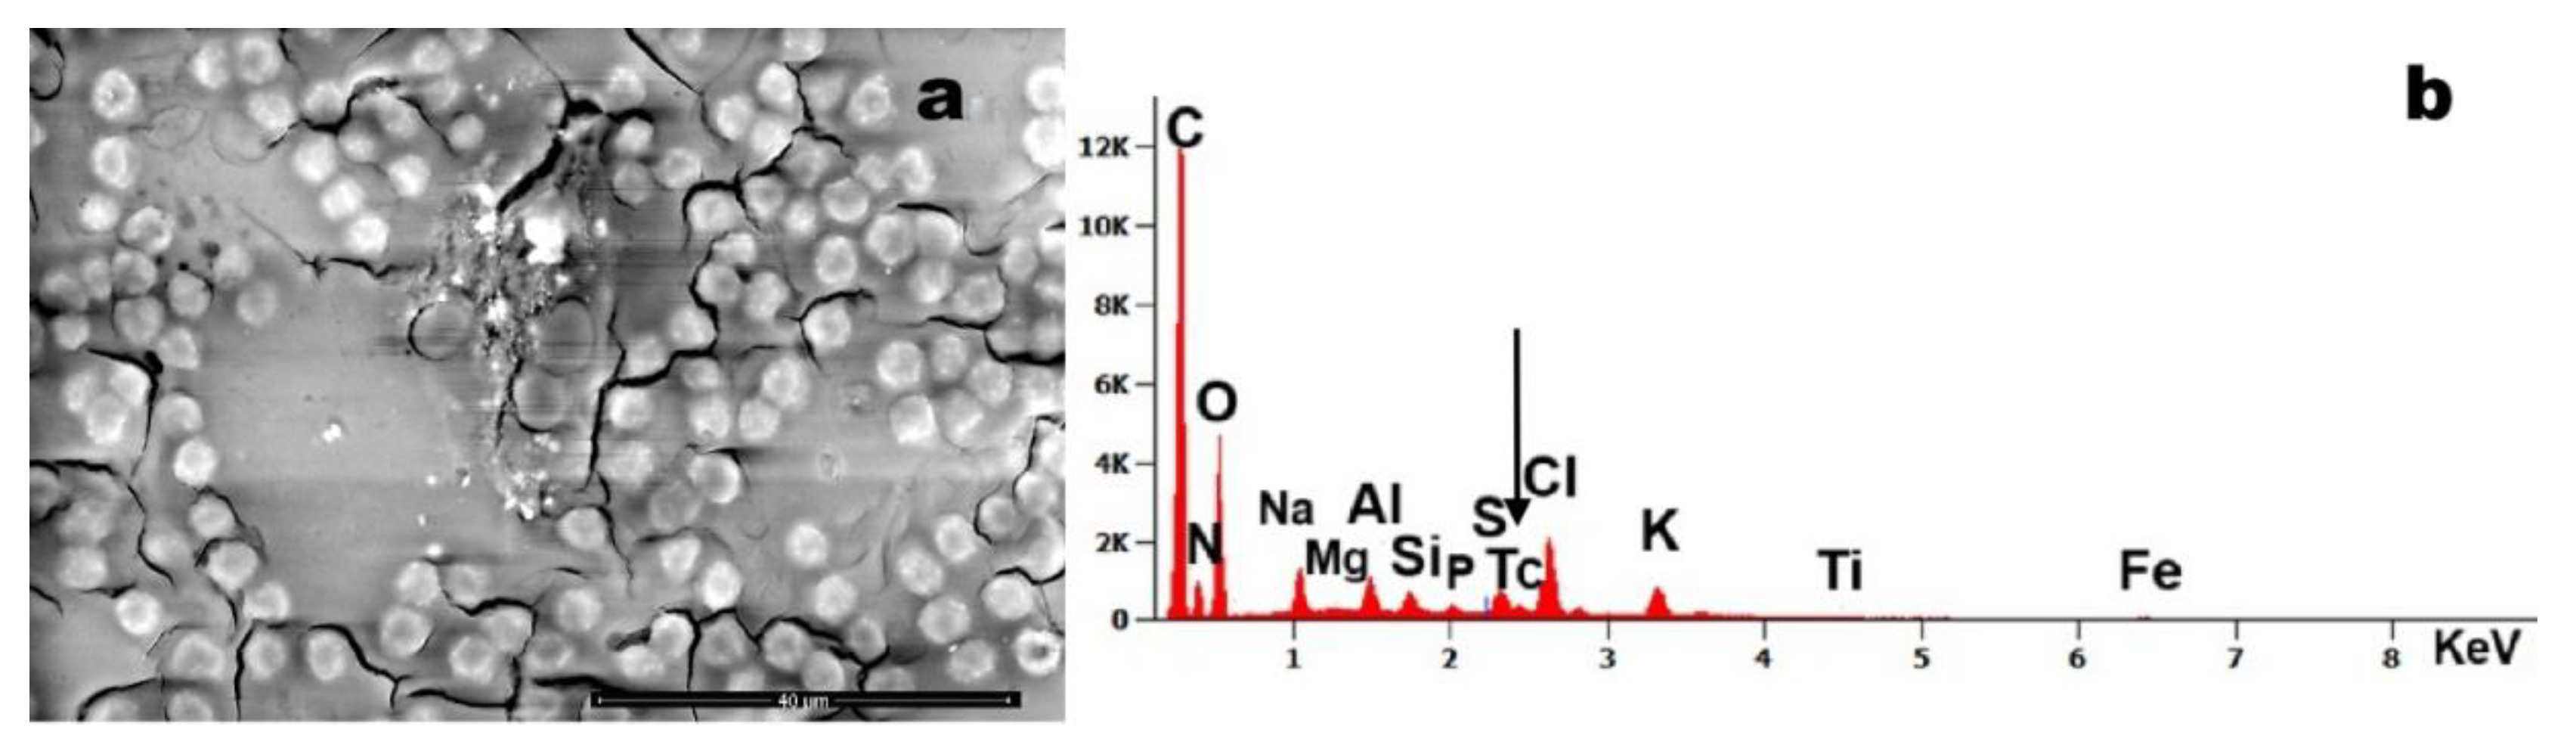
Figure 6.
Case 8: (a) arrows indicate nanoscale particles present in the blood sample (magnification 1,500x); (b) EDS spectrum shows that the debris are composed of Si, arsenic (As), Al, lead (Pb), K and Ca.
Figure 6.
Case 8: (a) arrows indicate nanoscale particles present in the blood sample (magnification 1,500x); (b) EDS spectrum shows that the debris are composed of Si, arsenic (As), Al, lead (Pb), K and Ca.
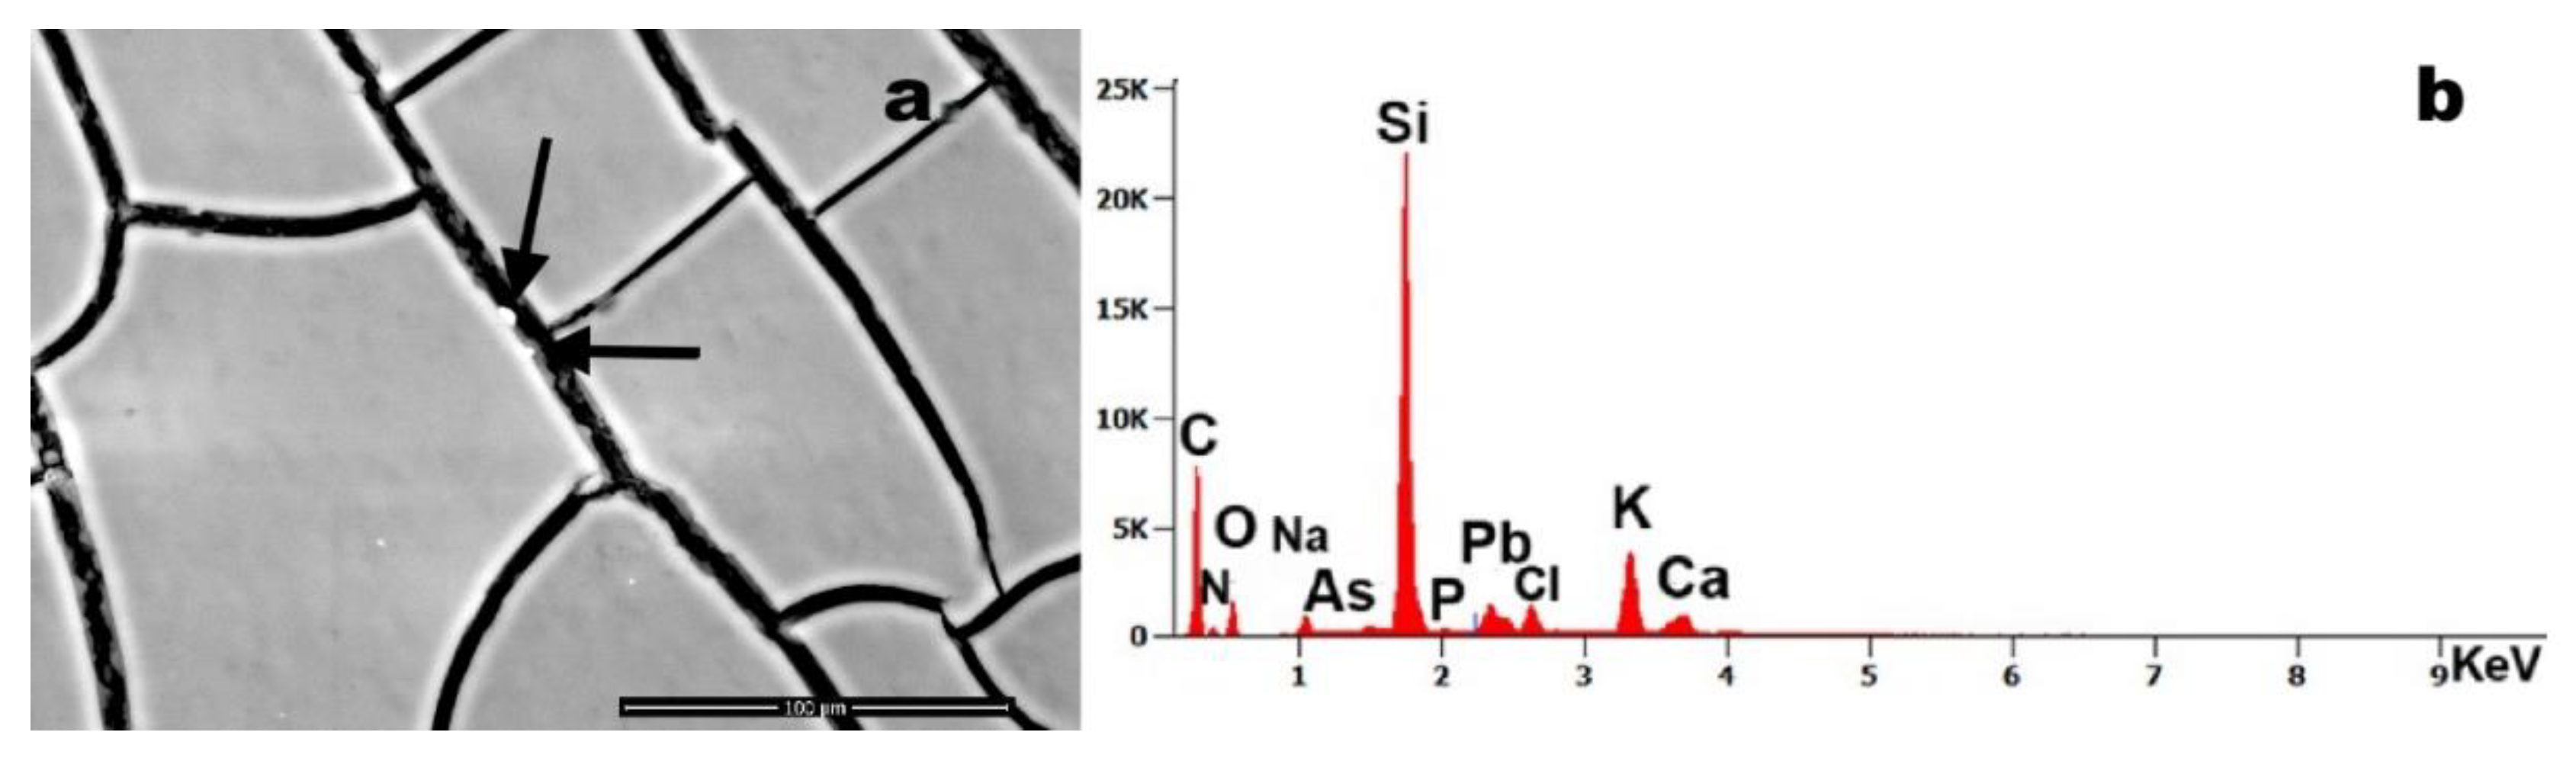
Figure 7.
Case 2 (a, b): foreign element approximately 40 µm in size identifies within the blood sample; (b) corresponding EDS spectrum showing the presence of Mg, Si, Al, chlorine (Cl), K and Fe; Case 5 (c, d): (c) filamentous foreign body (magnification 446x); (d) EDS analysis reveals the presence of Mg, Al, Si, phosphorus (P), S, K, Ca and Fe; Case 6 (e, f): (e) two foreign bodies observed in association with blood cells (magnification 5,685x); (f) related EDS spectrum indicates the presence of Mg, Al, Si, Cl, K, Fe, and nickel (Ni); Case 5 (g, h): (g) foreign body with adhered particles (magnification 2,111x); (h) EDS spectrum of the particles reveals a composition including Mg, Al, Si, S, Cl, Fe, copper (Cu), and zinc (Zn).
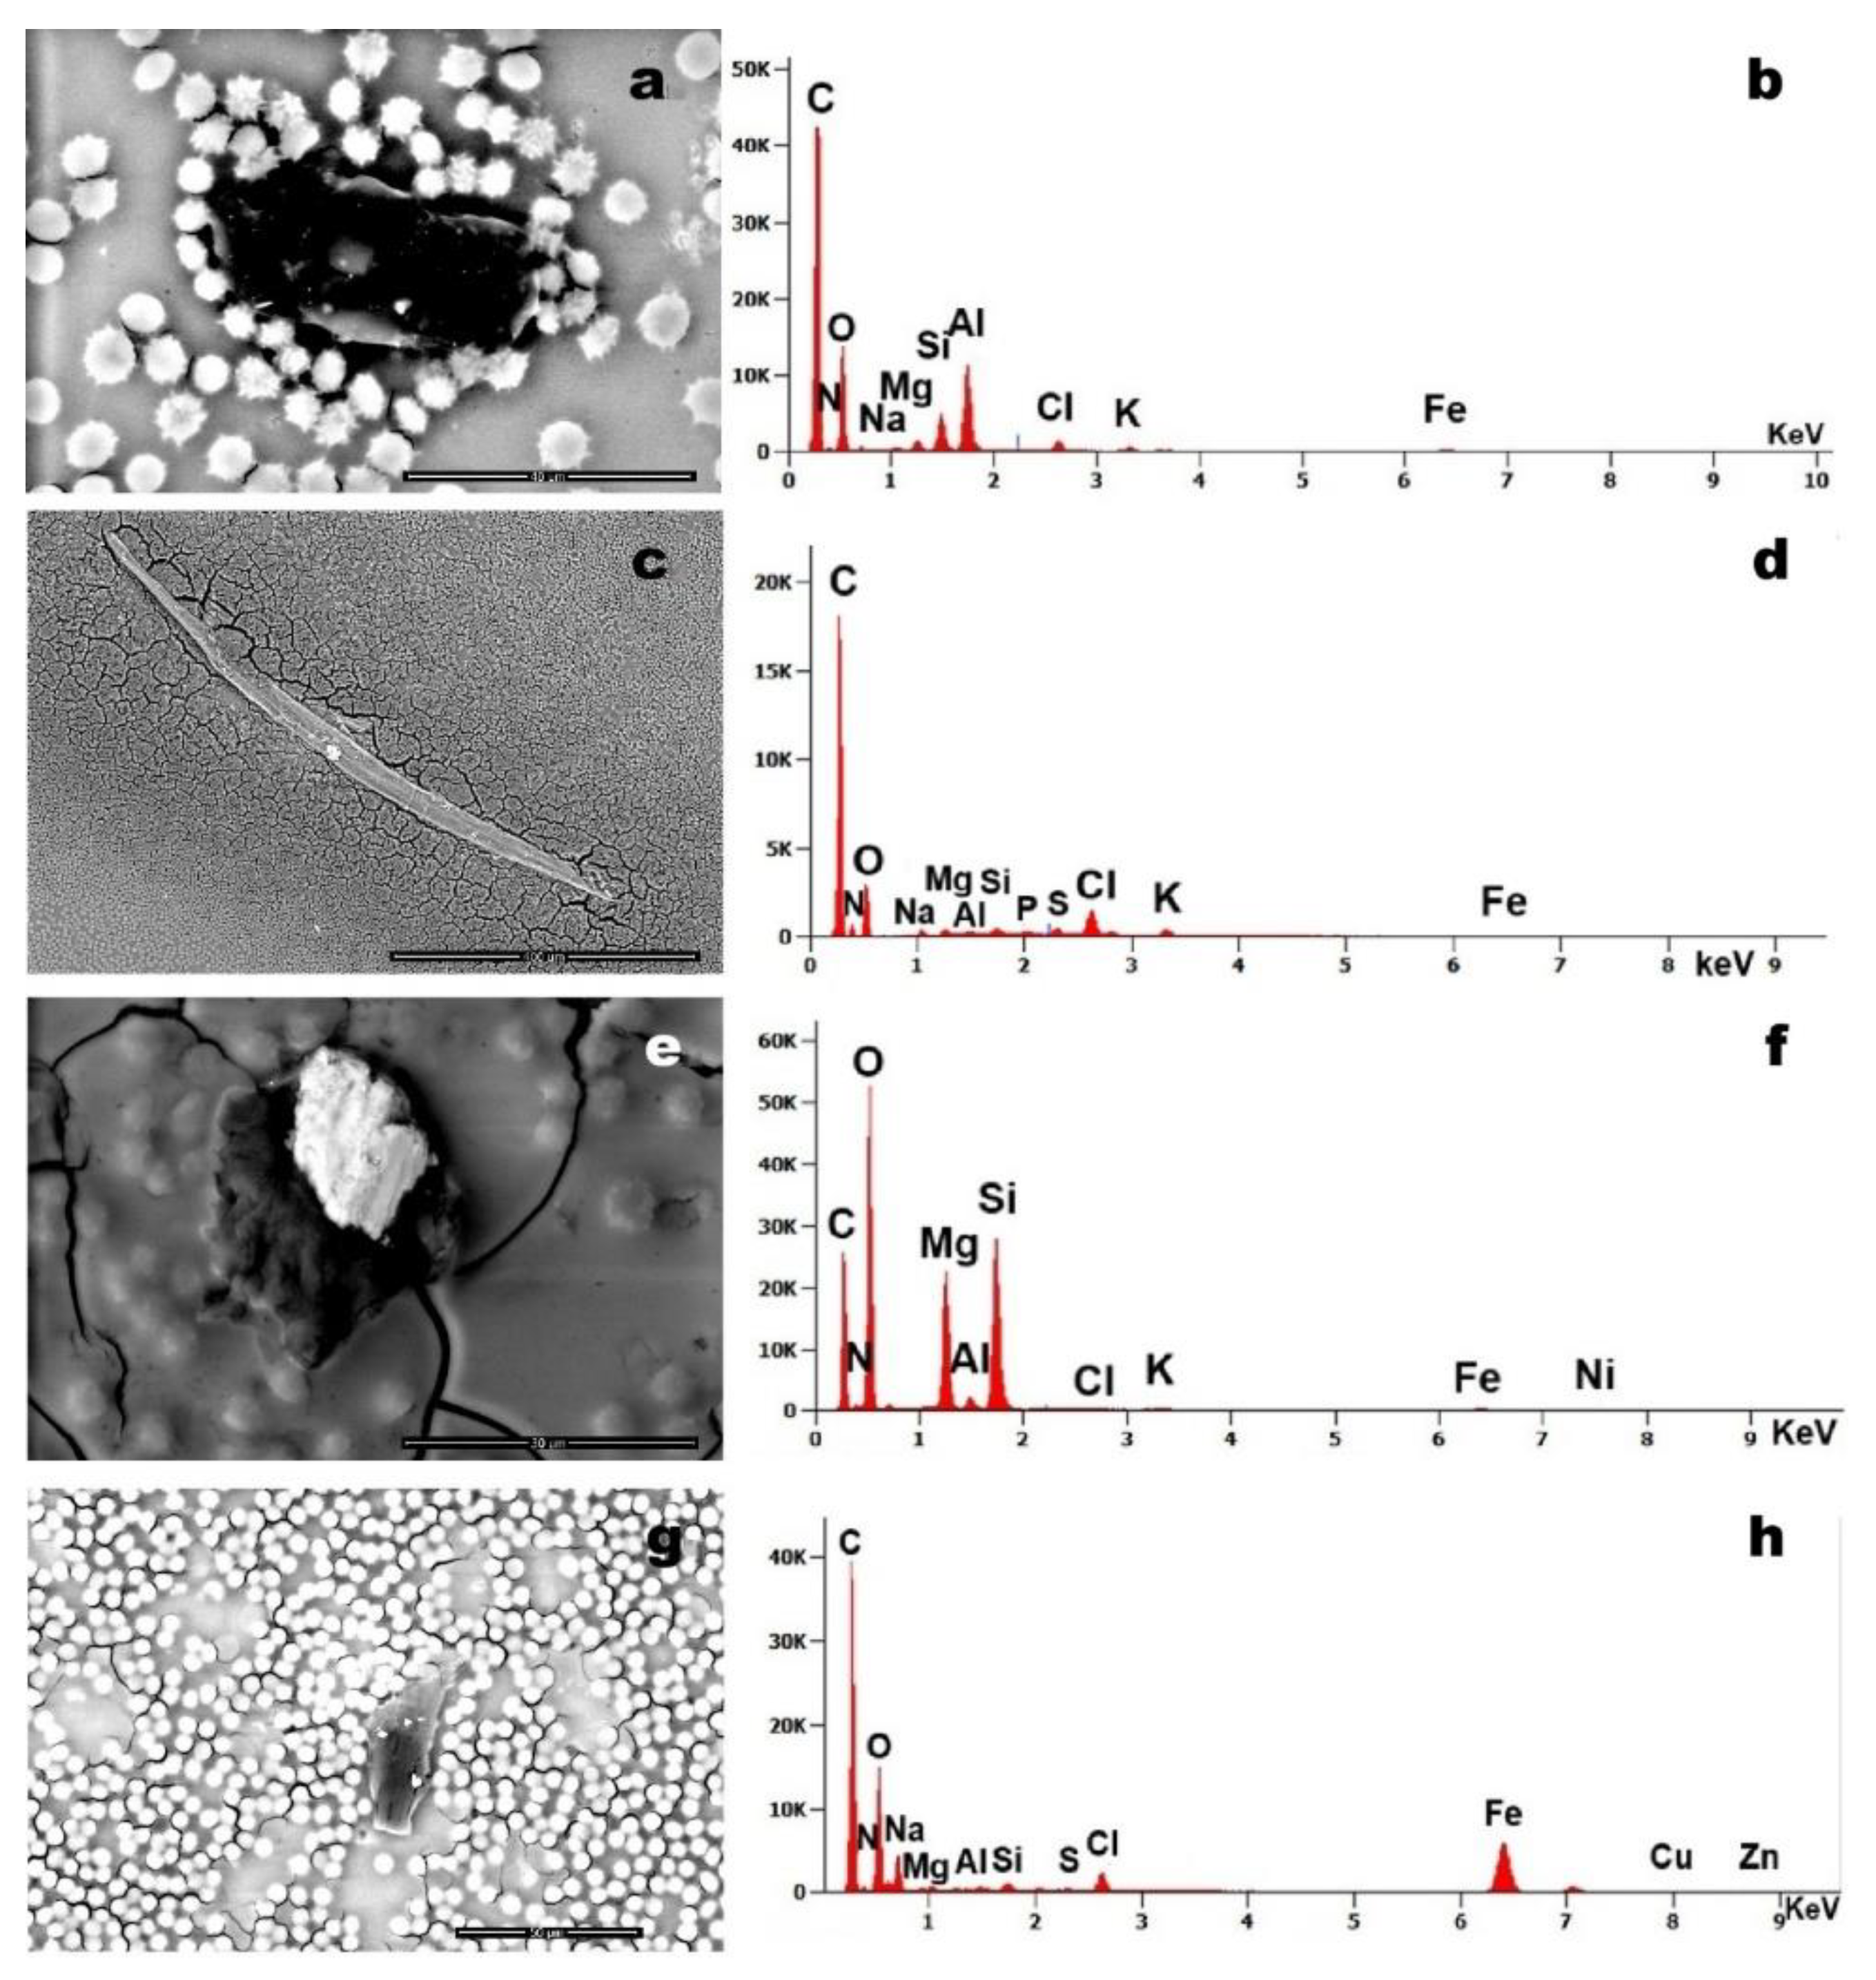
Figure 8.
Case 12: (a) Foreign bodies detected within a blood sample (magnification 1,515x); b) The same foreign bodies imaged at higher magnification (magnification 34,954x), clearly showing individual units approximately 0.2 µm in size, arranged in elongated chains; (c) corresponding EDS spectrum indicating the presence of Al, Si, P, S, Cl, and K.
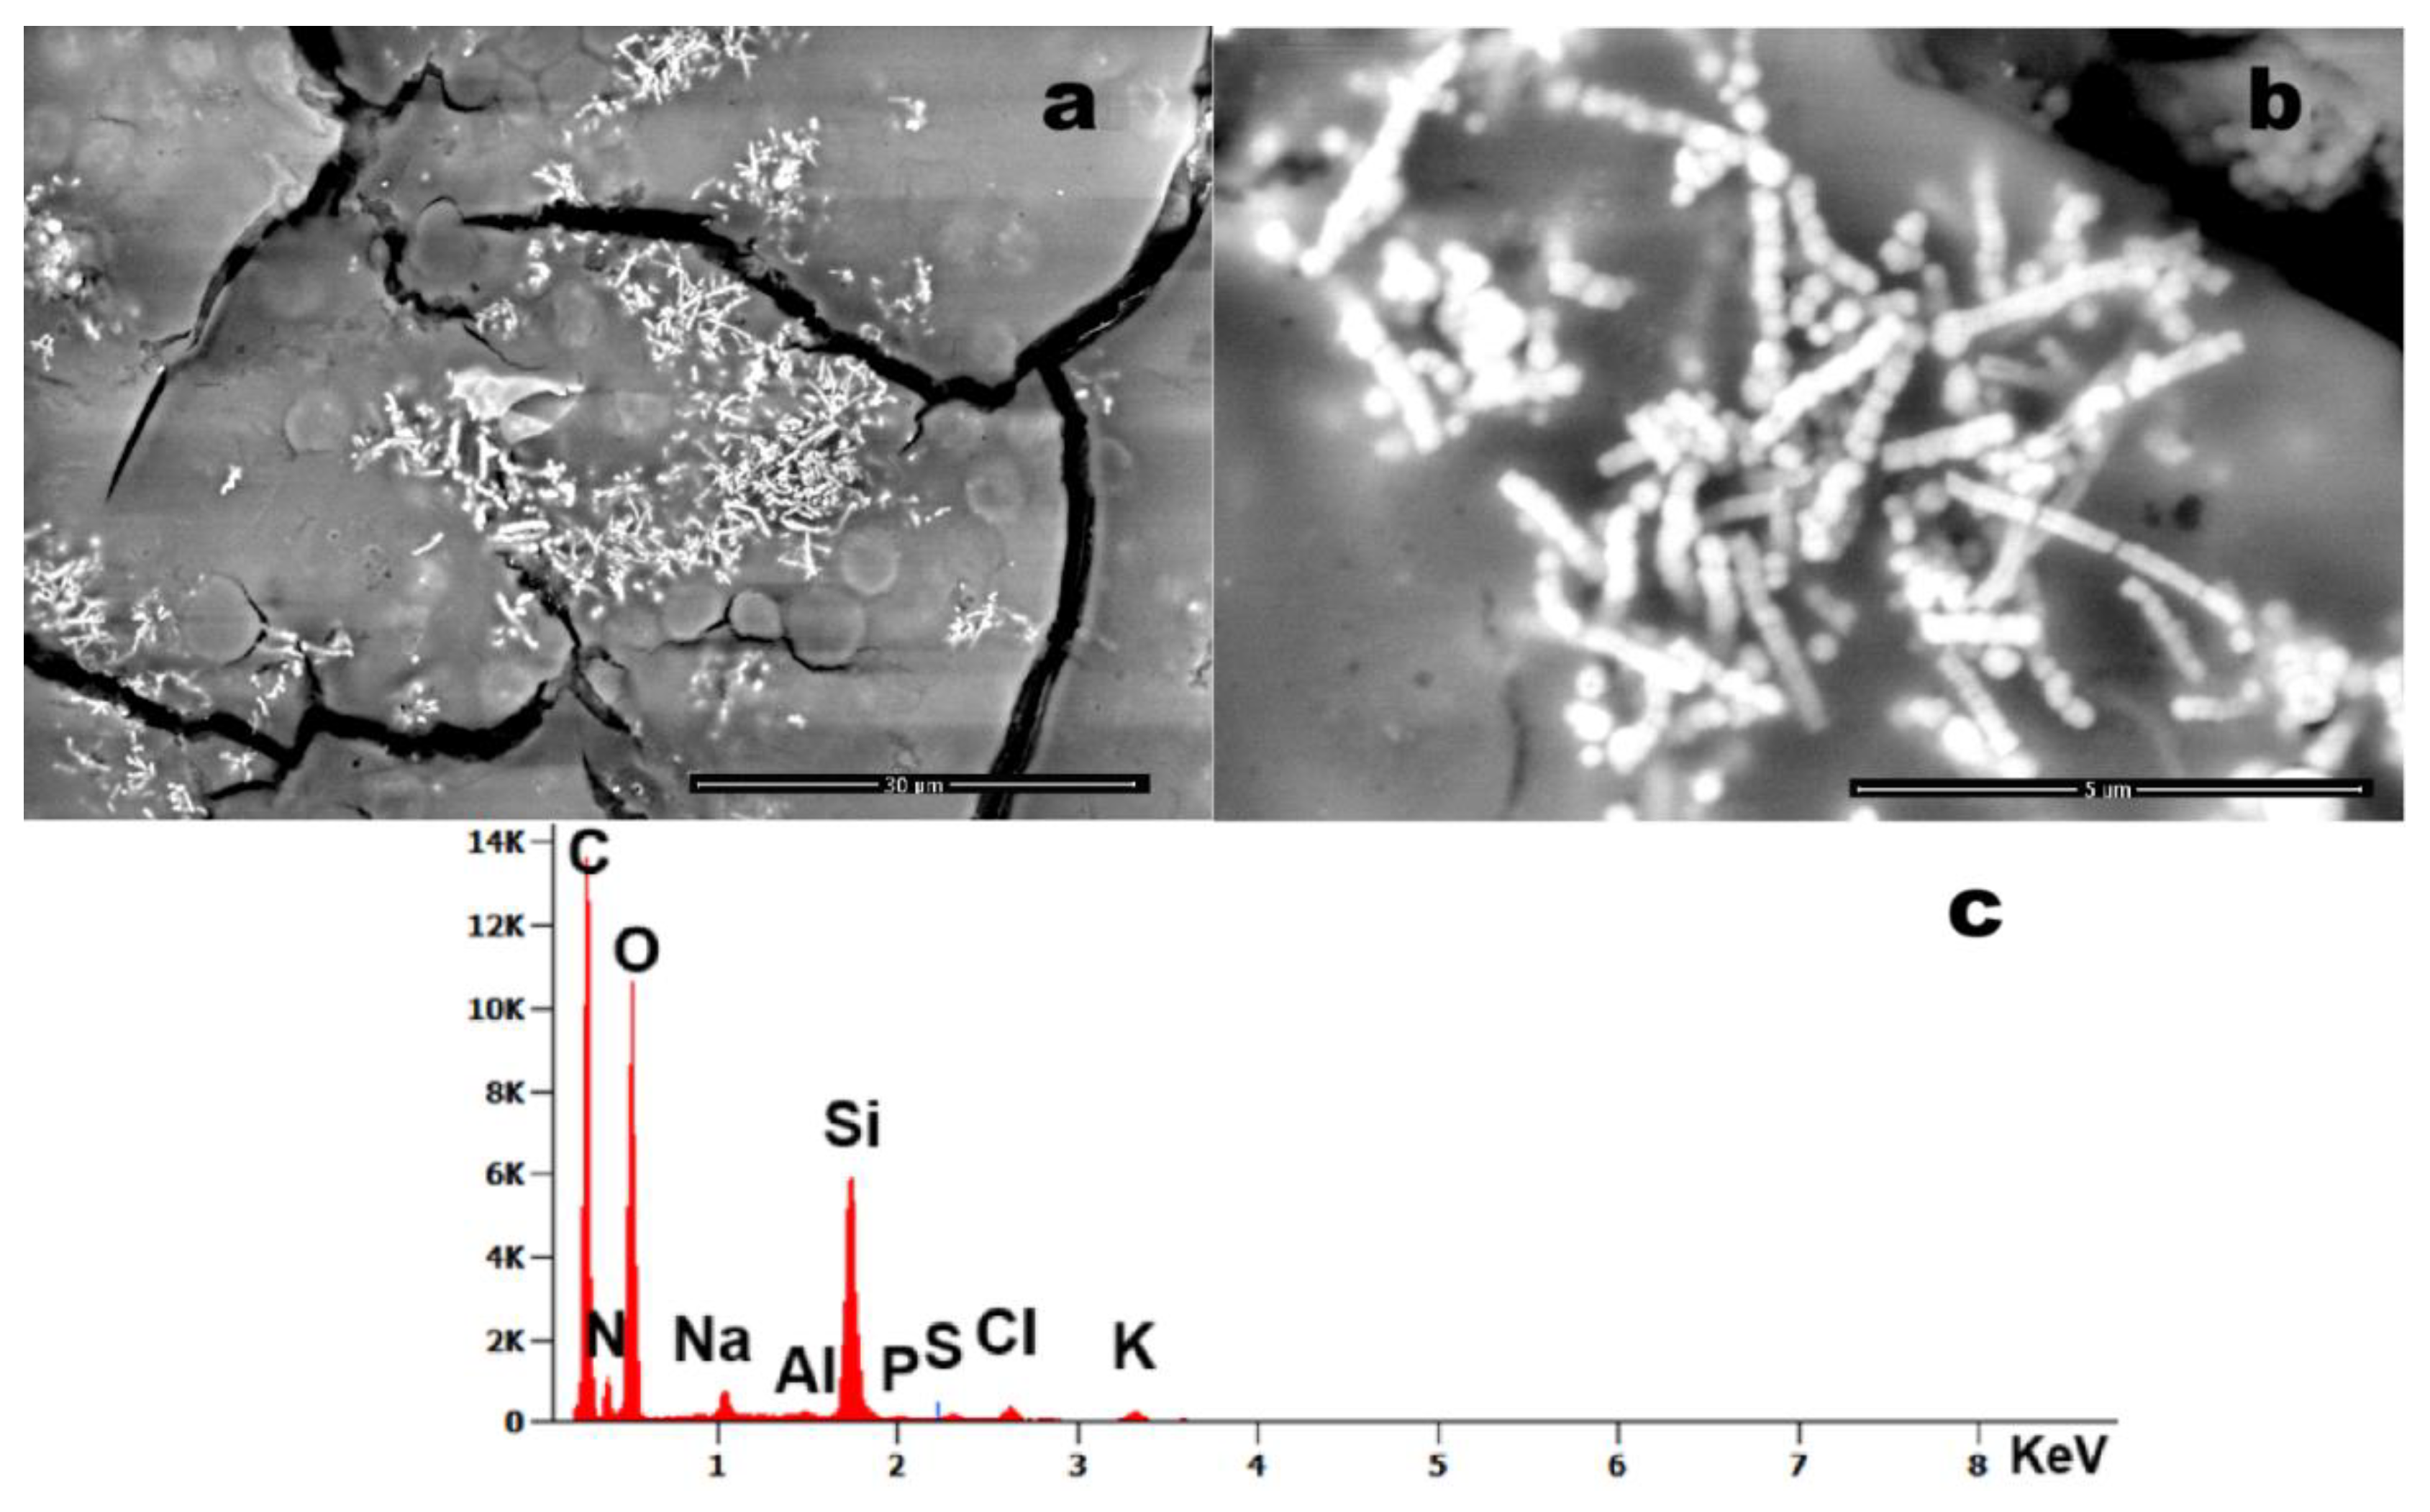
Figure 9.
Graph illustrating all contaminant elements detected in each blood sample. The X-axis represents the individual samples, while the Y-axis indicates the corresponding particle counts.
Figure 9.
Graph illustrating all contaminant elements detected in each blood sample. The X-axis represents the individual samples, while the Y-axis indicates the corresponding particle counts.
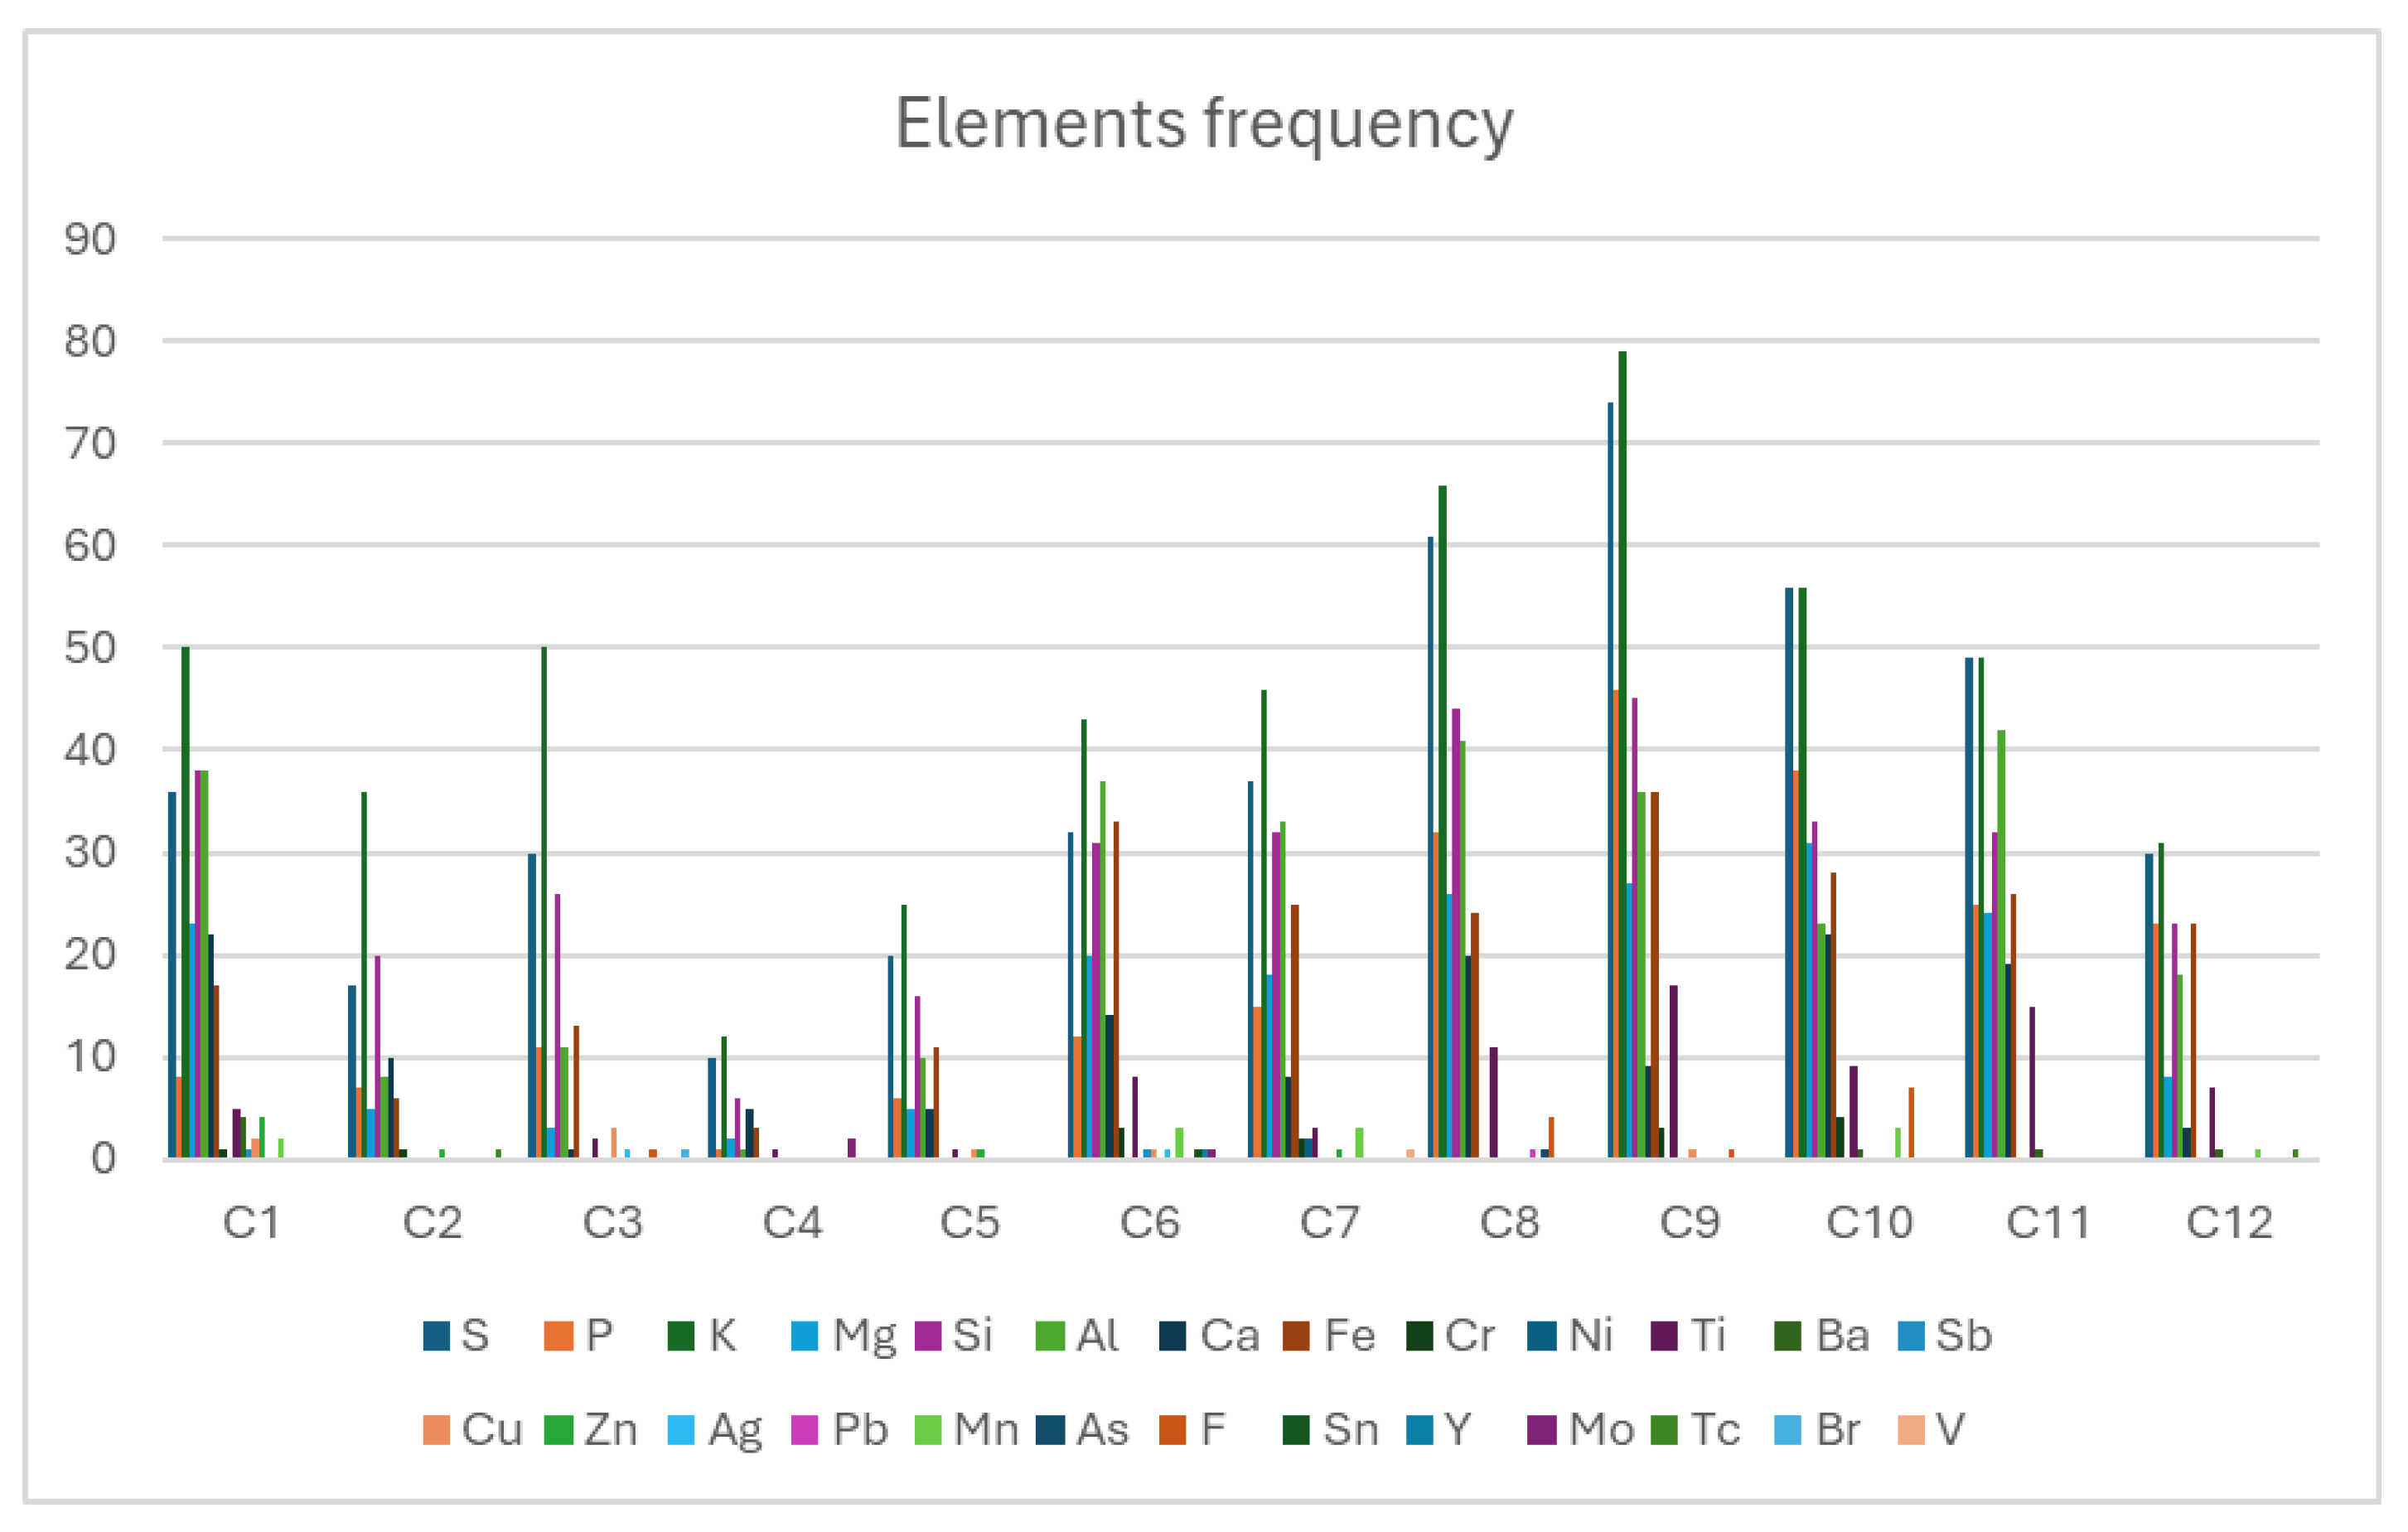
Figure 10.
Results of the Spearman’s correlation test. The table reports, for each pair of elements, the Spearman’s ρ, p-value, and corresponding confidence intervals. (a) Scatter plot for the Al–Si pair, including Spearman’s ρ and p-value; (b) Scatter plot for the Fe–Cr pair, including Spearman’s ρ and p-value; (c) Scatter plot for the O–Ti pair, including Spearman’s ρ and p-value.
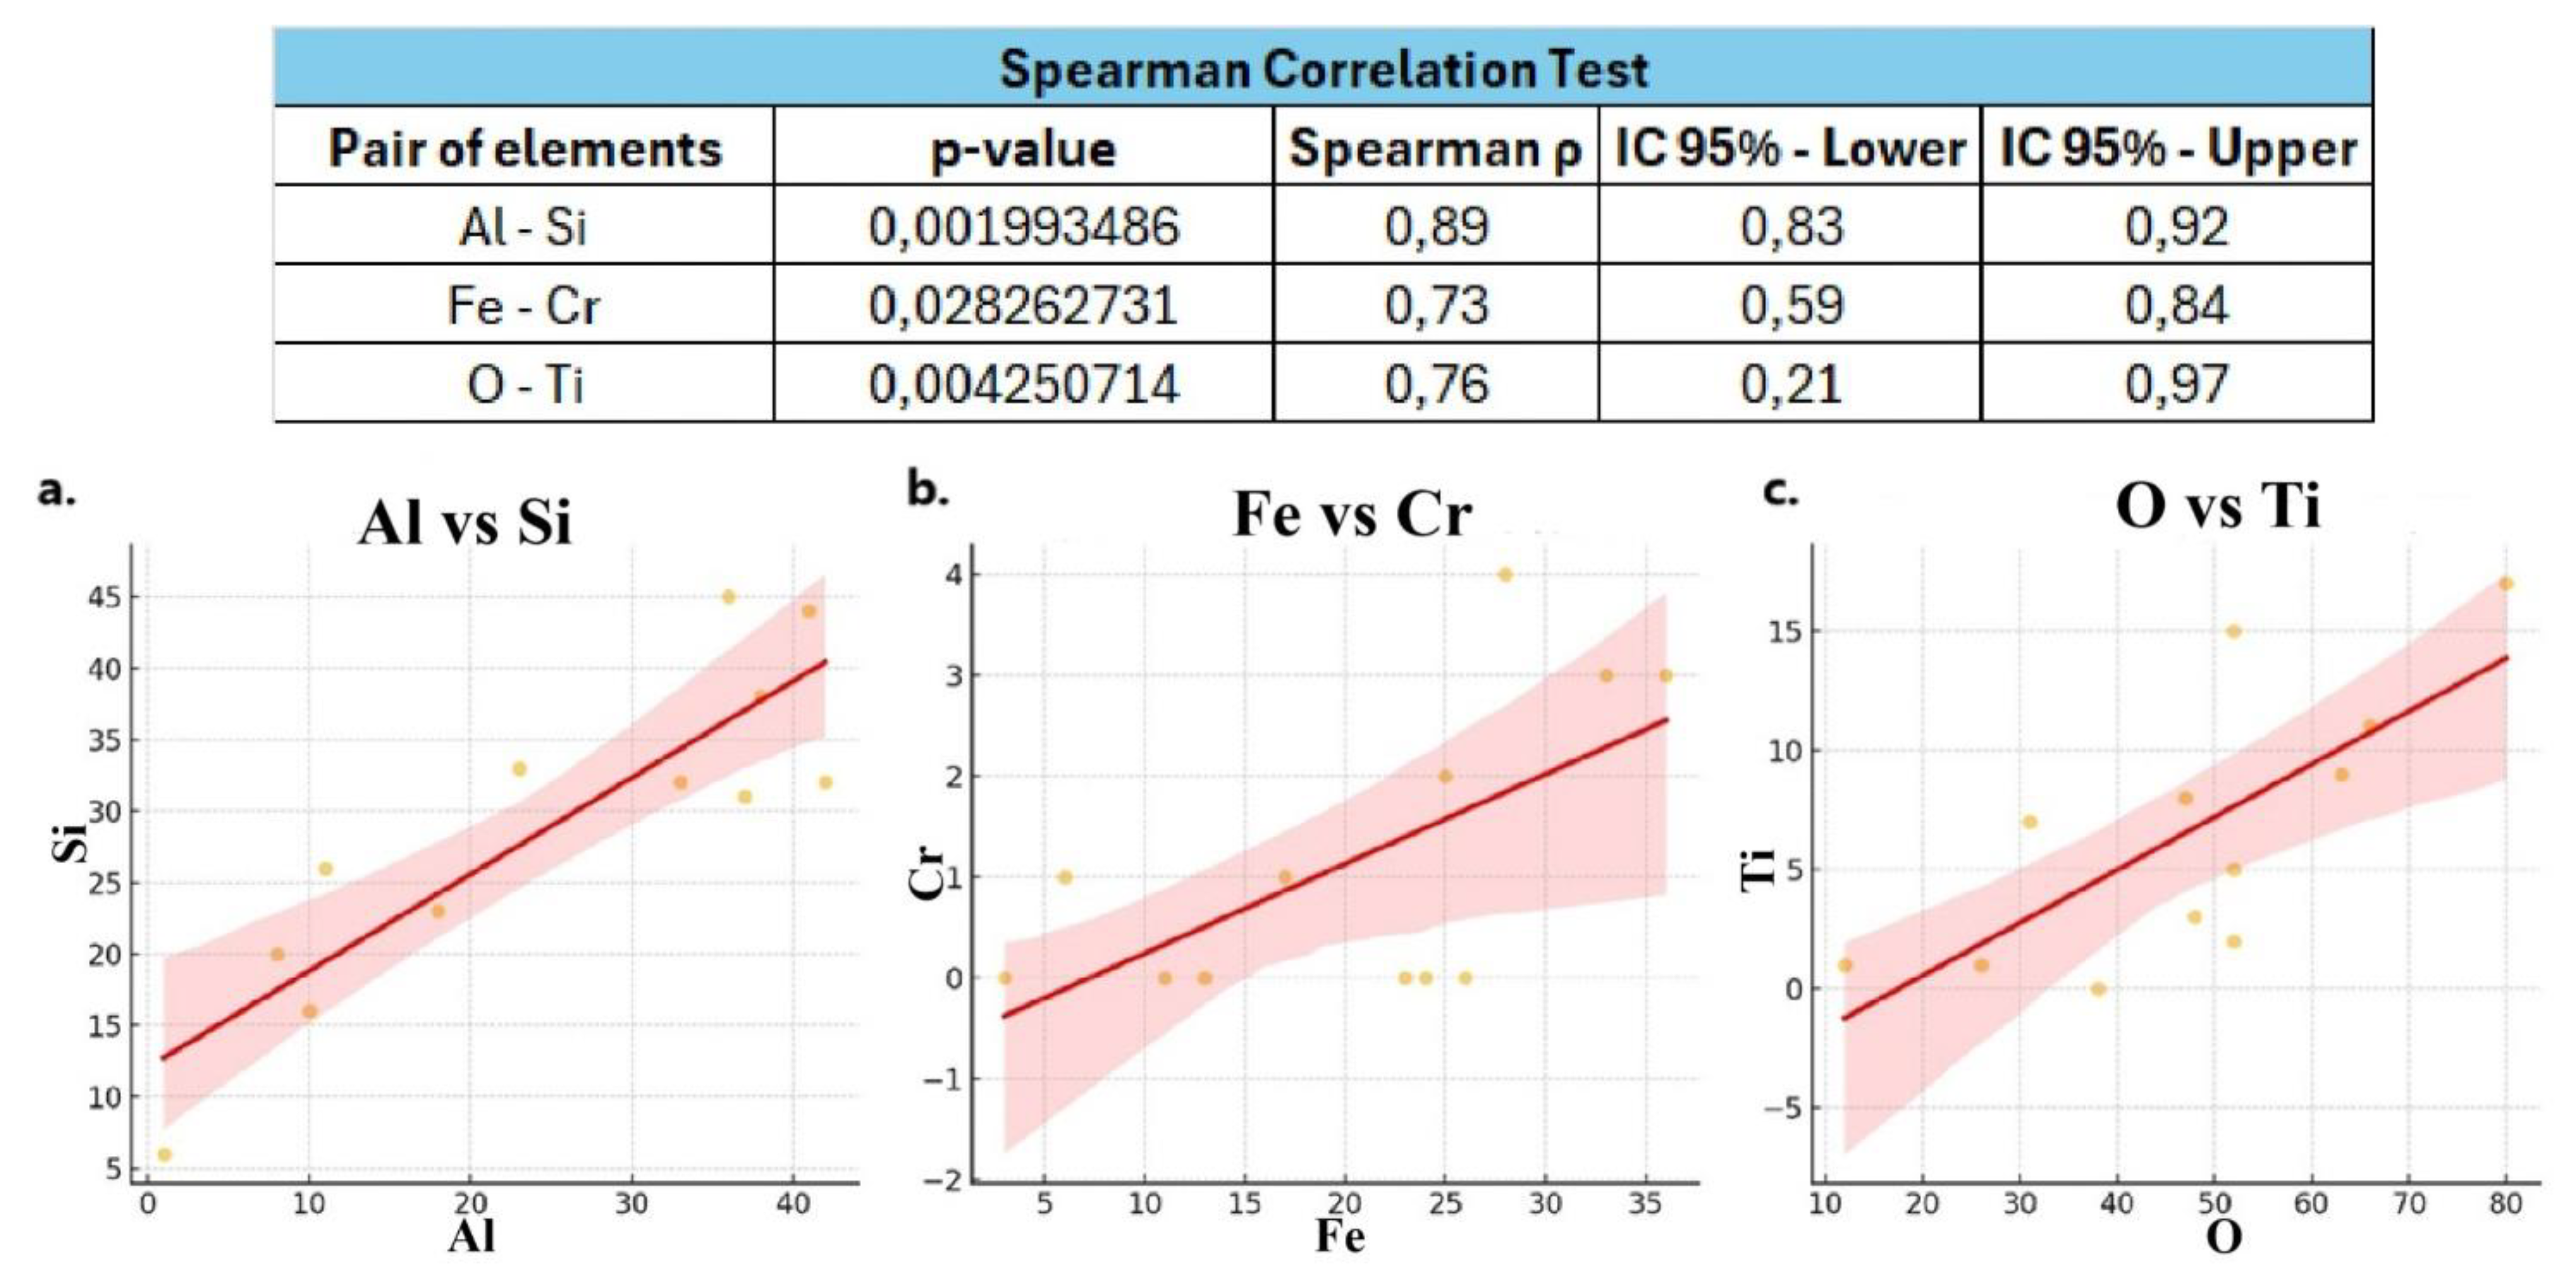
Table 3.
Frequencies of elements identified in the analyzed blood samples.
| C1 | C2 | C3 | C4 | C5 | C6 | C7 | C8 | C9 | C10 | C11 | C12 | |
|---|---|---|---|---|---|---|---|---|---|---|---|---|
| S | 36 | 17 | 30 | 10 | 20 | 32 | 37 | 61 | 74 | 56 | 49 | 30 |
| P | 8 | 7 | 11 | 1 | 6 | 12 | 15 | 32 | 46 | 38 | 25 | 23 |
| K | 50 | 36 | 50 | 12 | 25 | 43 | 46 | 66 | 79 | 56 | 49 | 31 |
| Mg | 23 | 5 | 3 | 2 | 5 | 20 | 18 | 26 | 27 | 31 | 24 | 8 |
| Si | 38 | 20 | 26 | 6 | 16 | 31 | 32 | 44 | 45 | 33 | 32 | 23 |
| Al | 38 | 8 | 11 | 1 | 10 | 37 | 33 | 41 | 36 | 23 | 42 | 18 |
| Ca | 22 | 10 | 1 | 5 | 5 | 14 | 8 | 20 | 9 | 22 | 19 | 3 |
| Fe | 17 | 6 | 13 | 3 | 11 | 33 | 25 | 24 | 36 | 28 | 26 | 23 |
| Cr | 1 | 1 | 0 | 0 | 0 | 3 | 2 | 0 | 3 | 4 | 0 | 0 |
| Ni | 0 | 0 | 0 | 0 | 0 | 0 | 2 | 0 | 0 | 0 | 0 | 0 |
| Ti | 5 | 0 | 2 | 1 | 1 | 8 | 3 | 11 | 17 | 9 | 15 | 7 |
| Ba | 4 | 0 | 0 | 0 | 0 | 0 | 0 | 0 | 0 | 1 | 1 | 1 |
| Sb | 1 | 0 | 0 | 0 | 0 | 1 | 0 | 0 | 0 | 0 | 0 | 0 |
| Cu | 2 | 0 | 3 | 0 | 1 | 1 | 0 | 0 | 1 | 0 | 0 | 0 |
| Zn | 4 | 1 | 0 | 0 | 1 | 0 | 1 | 0 | 0 | 0 | 0 | 0 |
| Ag | 0 | 0 | 1 | 0 | 0 | 1 | 0 | 0 | 0 | 0 | 0 | 0 |
| Pb | 0 | 0 | 0 | 0 | 0 | 0 | 0 | 1 | 0 | 0 | 0 | 0 |
| Mn | 2 | 0 | 0 | 0 | 0 | 3 | 3 | 0 | 0 | 3 | 0 | 1 |
| As | 0 | 0 | 0 | 0 | 0 | 0 | 0 | 1 | 0 | 0 | 0 | 0 |
| F | 0 | 0 | 1 | 0 | 0 | 0 | 0 | 4 | 1 | 7 | 0 | 0 |
| Sn | 0 | 0 | 0 | 0 | 0 | 1 | 0 | 0 | 0 | 0 | 0 | 0 |
| Y | 0 | 0 | 0 | 0 | 0 | 1 | 0 | 0 | 0 | 0 | 0 | 0 |
| Mo | 0 | 0 | 0 | 2 | 0 | 1 | 0 | 0 | 0 | 0 | 0 | 0 |
| Tc | 0 | 1 | 0 | 0 | 0 | 0 | 0 | 0 | 0 | 0 | 0 | 1 |
| Br | 0 | 0 | 1 | 0 | 0 | 0 | 0 | 0 | 0 | 0 | 0 | 0 |
| V | 0 | 0 | 0 | 0 | 0 | 0 | 1 | 0 | 0 | 0 | 0 | 0 |
| O | 52 | 38 | 52 | 12 | 26 | 47 | 48 | 66 | 80 | 63 | 52 | 31 |
Disclaimer/Publisher’s Note: The statements, opinions and data contained in all publications are solely those of the individual author(s) and contributor(s) and not of MDPI and/or the editor(s). MDPI and/or the editor(s) disclaim responsibility for any injury to people or property resulting from any ideas, methods, instructions or products referred to in the content. |
© 2025 by the authors. Licensee MDPI, Basel, Switzerland. This article is an open access article distributed under the terms and conditions of the Creative Commons Attribution (CC BY) license (http://creativecommons.org/licenses/by/4.0/).
Copyright: This open access article is published under a Creative Commons CC BY 4.0 license, which permit the free download, distribution, and reuse, provided that the author and preprint are cited in any reuse.


