
Submitted:
07 August 2024
Posted:
12 August 2024
You are already at the latest version
Abstract
System xc-, the cystine/glutamate exchanger, is a membrane transporter that plays a critical role in the antioxidant response of cells. Recent work has shown that System xc- localizes to the plasma membrane during oxidative stress, allowing for increased activity to support production of glutathione. In this study, we used site-directed mutagenesis to examine the role of C-terminal lysine residues (K422, K472, K473) of xCT (SLC7A11) in regulating System xc-. We observed that K473R exhibits loss of transporter activity and membrane localization and is 7.5 kD lower in molecular weight, suggesting that K473 regulates System xc- trafficking and is modified under basal conditions. After ruling out ubiquitination and neddylation, we demonstrated that unlike WT xCT, K473R lacks N- and O-glycosylation and is sequestered in the endoplasmic reticulum. Next we demonstrated that K473Q, a constitutively acetylated lysine mimic, also exhibits loss of transporter activity, decreased membrane expression, and a 4 kD decrease in molecular weight, however, it is N- and O-glycosylated and localized to the endoplasmic reticulum and Golgi. These results suggest that acetylation and deacetylation of K473 in the endoplasmic reticulum and Golgi, respectively, serves to regulate the progression of the transporter through the biosynthetic pathway.
Keywords:
SLC7A11
; xCT
; System xc-
; endoplasmic reticulum acetylation
; trafficking
; glycosylation
1. Introduction
System xc- is a membrane transporter that plays a central role in the cellular antioxidant response [1,2], including protection from ferroptosis, an iron-dependent, non-apoptotic mechanism of cell death associated with numerous disease pathways [3]. This membrane transporter exchanges intracellular glutamate for extracellular cystine, and the internalized cystine is rapidly reduced to cysteine which is required for the synthesis of the endogenous antioxidant glutathione. Given that cysteine is the rate limiting reagent for glutathione synthesis, the proper regulation of System xc- is essential for the maintenance of glutathione levels and prevention of oxidative stress and ferroptosis [3].
Recently, System xc- has been shown to be acutely regulated by oxidant exposure [1]. Within 10 min of exposure to physiologically relevant levels of hydrogen peroxide, System xc- traffics to the plasma membrane, resulting in a doubling of transporter activity, recovery of cellular glutathione levels, and reestablishment of oxidative balance within the cell [1]. Specifically, hydrogen peroxide appears to increase the transporter delivery rate to and decrease the internalization rate from the membrane, resulting in an overall increase in cell surface localization. But the mechanism by which hydrogen peroxide influences the trafficking of the transporter is not yet understood.
Examples of dynamic regulation of the trafficking of membrane proteins to and from the cell surface are as numerous as the signals that appear to regulate them [4,5,6,7,8,9,10]. For example, G-protein coupled receptors exhibit downregulation after prolonged exposure to agonists which triggers an increase in receptor internalization [11], and the epithelial sodium channel is activated by aldosterone [12], leading to a reduction in the rate of internalization of the channel from the plasma membrane. In nearly all cases, these changes in trafficking result from signal-induced changes in post-translational modification (PTM) of trafficking motifs within the N- or C-terminus of the membrane protein. Ultimately, the shift in PTM status of the protein alters its interaction with trafficking proteins within the cell, directly impacting protein delivery and/or internalization rates.
While there have been numerous studies that have detailed the transcription factors that regulate the expression of System xc- [13,14,15,16,17,18], there have been surprisingly few which examine the acute, reversible regulation and trafficking of this transporter. System xc- belongs to the family of heterodimeric amino acid transport (HAAT) proteins (SLC7 gene family) that includes nine different members with unique amino acid substrate specificities (for review see [19,20,21]). Like most members of the HAAT family, System xc- is composed of two proteins, a 50 kD light chain protein xCT (SLC7A11) that is linked through a disulfide bond to a 98 kD type II glycosylated heavy chain protein 4F2HC (SLC3A2) [22,23]. Each member of the HAAT family has a unique light chain which confers substrate specificity, while the role of the heavy chain is not well understood [24,25,26,27].
Studies focused on identifying PTMs of xCT and 4F2HC are lacking, and to date, no definitive trafficking motifs within xCT have been identified. Serine 26 of xCT is phosphorylated by mammalian target of rapamycin 2 (mTORC2), leading to inhibition of transporter activity perhaps through changes in membrane localization [28]. Very recently, xCT was reported to be palmitoylated at cysteine 327 which appears to increase the stability of the protein, perhaps by reducing its ubiquitination [29]. Lastly, five phosphorylation sites were identified in the extracellular domain of 4F2HC, but these motifs appear to regulate cell-cell interactions [30]. Thus, our understanding of the role PTMs play in the regulation of System xc- is poor relative to other families of membrane proteins.
Therefore, the primary objective of this study was to use site-directed mutagenesis to identify trafficking motifs within xCT so that we can better understand its regulation. Since many trafficking motifs are typically found within the internal N- or C-terminus of proteins, we chose to focus on the C-terminus of xCT, given that it is more highly conserved across species relative to the N-terminus (Fig 1). We reasoned that the high degree of conservation increased our likelihood of identifying trafficking motifs. In addition, we chose to focus on lysine residues exclusively in this study. Lysine residues are common sites of PTM which are known to impact protein trafficking, including ubiquitination, neddylation, SUMOylation, and acetylation [31,32,33,34,35]. xCT has numerous conserved lysine residues, and the C-terminus has three conserved lysine sites (K422, K472, and K473) that are positioned on the intracellular surface of xCT when located on the plasma membrane, suggesting they would allow for potential interaction with trafficking proteins within the intracellular compartment (Figure 1). Therefore, in this study we sought to determine how site-directed mutagenesis of these C-terminal lysine residues affected the trafficking and activity of System xc-. This work has led to the identification of a lysine residue, K473, that appears to regulate trafficking of xCT through the ER and Golgi, and ultimately, its maturation into a functional transporter.
2. Results
2.1. Effect of C-Terminal Lysine Mutations on System xc- Activity and Molecular Weight of xCT
As previously mentioned, xCT contains three highly conserved lysine residues located toward the C-terminus. K422 is found in an intracellular loop between transmembrane domains 10 and 11, and K472, and K473 are found within the C-terminal tail. (Figure 1A). These lysine sites are located on the intracellular surface of xCT where they are conveniently available to undergo PTM (Figure 1B and C) and potentially interact with trafficking proteins.
We began this study by determining if these lysine residues (K422, K472, and/or K473) are critical for transporter activity. Since it is known that System xc- imports cystine and exports glutamate, we measured transporter activity through a glutamate release assay. Distinct lysine to arginine (K→R) mutants were created corresponding to each of the three C-terminal lysine residues (K422R, K472R, and K473R) using site-directed mutagenesis. COS-7 cells were transfected with recombinant wildtype (WT) or mutant xCT DNA along with recombinant HA-4F2HC and the glutamate release assay was performed 48 hours later to quantitatively measure System xc- activity. One way ANOVA demonstrated that mutant type had a significant effect on transporter activity (F(5,46)=77.38, p<0.001). Specifically, K422R and K472R did not change transporter activity relative to WT, but K473R showed nearly complete loss of System xc- activity. (Post-hoc Tukey analysis of mutant relative to WT, p=0.918, p=0.995, p<0.001 respectively; Figure 2A). These data suggest that K473 is critical for System xc- function.
In order to confirm that all K→R mutants were expressed in COS-7 cells, we performed Western blot analysis of cell lysates of transfected COS-7 cells. While all mutants appeared to be expressed, K473R showed a decrease in molecular weight of approximately 7.5 kD relative to WT and the other K→R mutants (Figure 2B), suggesting that K473 either is a site of constitutive post-translational modification that is necessary for proper function or K473 regulates the post-translational modification of xCT at a distinct site on the protein.
2.2. K473R Affects xCT Localization to the Plasma Membrane
Since xCT must be localized to the plasma membrane in order for System xc- to properly function, next we sought to determine whether K473R regulated the cell surface localization of the transporter using a cell surface biotinylation assay followed by Western blot analysis. K473R showed significantly decreased membrane localization relative to WT (Figure 3) (One Way ANOVA F(3, 23)=15.92, p<0.001, post hoc Tukey relative to WT p<0.001). These results indicate that K473 plays an important role in the trafficking and membrane localization of xCT and therefore, the proper functioning of System xc-.
2.3. K473R Does Not Impact the Ubiquitination of the Monomer form of xCT
Since the K473R mutation exhibited a 7.5 kD shift in molecular weight along with a significant decrease in System xc- activity and plasma membrane localization, we sought to identify the PTM associated with K473. Lysine residues can be extensively modified in vivo. Modifications include ubiquitination (8.5 kD), neddylation (9 kD), sumoylation (12 kD), acetylation, methylation, or deamination. Ubiquitination of lysine residues regulate the trafficking of numerous membrane proteins, suggesting that perhaps ubiquitination of K473 may be necessary for the trafficking of xCT to the membrane. Moreover, given that ubiquitin has a molecular weight of 8.5 kD, which is very similar to the 7.5 kD shift in molecular weight observed for K473R, we first examined whether K473R impacted the ubiquitination of xCT.
We used anti-myc beads to immunoprecipitate WT, K422R, K472R, or K473R from transiently transfected COS-7 cells, followed by Western blot analysis using anti-myc and anti-Ubiquitin antibodies. Since low doses of hydrogen peroxide (H2O2) are known to inhibit deubiquitinases, we performed this assay in transfected cells that were treated with 0.3 mM H2O2 or vehicle immediately prior to transfection in order to potentially enhance ubiquitination of xCT.
As expected, more ubiquitin immunoreactivity was observed in the lysates of H2O2-treated cells relative to vehicle-treated cells (Figure 4A). In the IP samples, ubiquitin appeared to be colocalized with xCT at high molecular weights (>100 kD) which may indicate polyubiquitination of xCT and/or xCT:4F2HC complexes. However, there was no evidence of ubiquitination of the WT xCT monomer (42 kD) or any of the K→R xCT mutants, which would be expected if xCT exhibited constitutive monoubiquitination at K473 (Figure 4A). Interestingly, K473R exhibited nearly a complete loss of the high molecular weight ubiquitinated form of xCT, which could indicate that this mutant may not be polyubiquitinated in the same manner as WT or the other mutants. However, the data clearly demonstrated that the K473R mutation does not affect the ubiquitination status of the 42 kD monomer.
2.4. Neddylation Status of xCT
Neddylation is a lysine PTM, similar to ubiquitination, in which NEDD8 is covalently linked to the ε-NH3 group of lysine. NEDD8 also been shown to play a role in the trafficking of membrane proteins such as the AMPA and mGlu7 receptors [33,36]. Since NEDD8 is approximately 9 kD and K473 appears to undergo a modification of approximately 7.5 kD, we sought to determine if K473 is undergoing neddylation through Western blot analysis. Similar to the ubiquitin analysis, there was no evidence of neddylation occurring on the monomer form of WT or K473R xCT, despite the fact that there was a strong NEDD8 signal in the original cell lysates (Figure 4B). Thus, the WT xCT monomer does not appear to be neddylated in vivo, and the K473R mutant does not impact the neddylation status of xCT.
2.5. Glycosylation Status of xCT
Glycosylation occurs on over 50% of human proteins [37], playing an important role in a wide variety of cellular processes, including protein trafficking [26,38,39,40,41,42]. Glycosylation occurs on asparagine residues (N-linked glycosylation) or serine and threonine residues (O-linked glycosylation), and PTM of lysine residues has been shown to regulate the glycosylation status of several membrane proteins. Moreover, the molecular weight of N- and O-glycosyl groups is variable, depending on the number of sugars attached, with glycosyl groups often ranging between 3-4 kD [43]. Given that xCT is predicted to contain one putative N-glycosylation site (N314) and multiple O-glycosylation sites, we reasoned that K473R may regulate the glycosylation of this transporter in a form PTM crosstalk. Therefore, we sought to determine if the monomer form of xCT was glycosylated.
We treated immunoprecipitated WT myc-xCT with either Peptide-N-Glycosidase F (PNGase F), an enzyme which cleaves N-linked oligosaccharides from glycoproteins, or Neuraminidase/O-Glycosidase (Neu/O-Gly) which cleaves mucin-type O-linked oligosaccharides from glycoproteins (Figure 5A and B). We observed that PNGaseF treatment led to a 2.5 kD reduction in molecular weight of WT xCT, while Neu/O-Gly led to a modest 1.5 kD shift in molecular weight. As expected, these effects were additive, with the WT xCT sample treated with both enzymes exhibiting a 4 kD reduction relative to untreated WT, demonstrating that the xCT monomer is glycosylated in vivo.
Therefore, we next sought to determine if K473R was also glycosylated. Given the 7.5 kD reduction in MW of K473R relative to WT, we hypothesized that K473R may not be able to be glycosylated in vivo. We treated K473R with PNGasF, Neu/O-Gly, and a combination of all glycosidases and observed no change in its molecular weight (Figure 5D and E) confirming that K473R is not glycosylated. In addition, we observed that WT xCT that was treated with both N- and O-glycosidases, it was still higher in molecular weight than K473R, suggesting that WT exhibits additional PTMs beyond N- and O-glycosylation under basal conditions.
2.6. Activity and Glycosylation Status of K473Q, an Acetylation Mimic Mutant of xCT
Given that K473R is unable to be glycosylated, we reasoned that K473 may regulate the glycosylation of xCT. Transient acetylation of lysine residues often occurs in the endoplasmic reticulum (ER) and plays an important role in the export of membrane proteins to the Golgi as well as maintaining protein stability [34,44]. We reasoned that if xCT could not be acetylated at K473, then perhaps it would not progress properly through the ER, precluding its ability to become glycosylated. However, acetylation at K473 may permit xCT to progress through the ER, become glycosylated and exported to the Golgi. To test this hypothesis, we created a lysine to glutamine mutant at position 473 on xCT (K473Q) and sought to evaluate whether this mutation would rescue System xc- activity, cell surface localization and the glycosylation status of xCT. Glutamine serves as a structural mimic of acetylated lysine, thus we predicted this mutant would be glycosylated and exhibit comparable activity to WT when expressed in COS-7 cells. Surprisingly, K473Q also exhibited significantly decreased transporter activity (Figure 2A) and cell surface expression (Figure 3) similar to K473R. But, K473Q (41 kD) appears to exhibit an intermediate molecular weight between K473R (37.5 kD) and WT (45 kD) (Figure 5C), suggesting perhaps it is glycosylated.
Therefore, we performed a glycosylation analysis of the K473Q mutant to determine whether the addition of the acetyl mimetic allowed for the glycosylation of xCT. PNGaseF and Neu/O-Gly were effective in removing glycosyl groups from K473Q, demonstrating that K473Q is N- and O-glycosylated. Furthermore, when the glycosidases were used together on K473Q, the molecular weight of the mutant now matched that of the K473R mutant (Figure 5D and E). These results collectively indicate that the acetylation mimic mutant K473Q allows for the glycosylation of xCT, but glycosylation of xCT alone is not sufficient for the proper membrane localization and function of xCT.
2.7. Evaluation of Putative Glycosylation Site N314
Since we found evidence of xCT N-glycosylation, we next sought to determine whether we could identify the site of glycosylation within xCT. Asparagine 314 within xCT is predicted to be a site of N-linked glycosylation, therefore an N→Q mutant was created (N314Q) which would remove the ability of the site to undergo glycosylation. We then assessed the effect of this mutation on transporter activity and cell surface localization. We reasoned that if glycosylation of xCT was necessary for proper trafficking and function of this transporter, this mutation should lead to a non-functional transporter and reduced cell surface localization. However, N314Q showed much greater activity than K473R and K473Q, exhibiting 75% of the activity of WT (Figure 2A). We next sought to determine the membrane expression of N314Q using the biotinylation assay, and it did not differ from WT, indicating that the partial loss of activity associated with N314Q is not due to its ability to localize to the plasma membrane (Figure 3).
From our western blot analysis, we observed that N314Q did not differ in molecular weight compared to WT, suggesting the N314Q is not the site of N-glycosylation as predicted (Figure 6A). To confirm this hypothesis, N314Q was treated with PNGase F and O-glycosidase (Figure 6B and C). Both enzymes were effective in reducing the molecular weight of the N314Q, indicating that N314 is not a site of N-glycosylation within xCT, thus explaining why this mutation had little impact on transporter activity and membrane localization.
2.8. xCT Localization in ER and Golgi Apparatus
Since K473R and K473Q show decreased System xc- activity and membrane expression, we sought to use immunocytochemistry coupled with confocal microscopy to determine the intracellular localization of these mutants compared to WT. K473R is not glycosylated, a process which is initiated in the ER, therefore, we hypothesized that K473R may be retained in the ER. As expected, K473R appeared to be primarily localized around the nucleus (Figure 7 and Figure 8), with no plasma membrane expression (Figure 8). WT xCT, however, exhibited staining throughout intracellular compartments and the plasma membrane (Figure 7 and Figure 8). Using phosphodiester isomerase (PDI) as an ER marker, we observed extensive colocalization of K473R with PDI (Figure 7). We calculated the fraction of the K473R signal that colocalized with PDI by performing a Manders colocalization analysis. Compared to WT, K473R exhibited significantly higher Manders colocalization with PDI, suggesting nearly 75% of K473R was localized to the ER, while only 40% of the WT was localized in the ER (One-way ANOVA F(2,27)=7.81, p=0.002; post hoc Tukey analysis, K473R (p=0.002) exhibits higher Manders colocalization with ER relative to WT).
K473Q, the acetylation mimic, is N- and O-glycosylated, but exhibits reduced cell surface expression in respect to WT. N-linked glycosylation matures in the Golgi and most O-linked glycosylation occurs in the Golgi, therefore we hypothesized that K473Q may exit the ER, but perhaps get retained in the Golgi or other transport vesicles that are involved in the constitutive trafficking pathway [45]. ICC analysis of K473Q showed localization around the nucleus and lack of plasma membrane expression, similar to K473R (Figure 7 and 8). Again, significantly more K473Q co-localized with PDI relative to WT, (p=0.025) suggesting the majority of the K473Q is still maintained in the ER (Figure 7).
To test our hypothesis that K473R is not exported to the Golgi, but K473Q reaches the Golgi, we examined the localization of each mutant with GM130, a Golgi-specific marker. As expected, K473Q showed significantly increased colocalization with GM130 relative to WT and K473R (One-Way ANOVA F(2,32)=9.11, p<0.001; post-hoc Tukey test, p=0.001 (WT) and p=0.006 (K473R), respectively, exhibit lower colocalization than K473Q to the Golgi; Figure 8). Thus, WT xCT seems to disperse throughout the ER and plasma membrane, with very little retained within the Golgi. K473R, the acetylation deficient mutant is withheld primarily within the ER, with virtually no colocalization to the Golgi or plasma membrane. However, K473Q, the acetylation mimic appears to properly track through the ER and then become retained within the Golgi.
3. Discussion
In this study we have identified a novel mechanism for the regulation of xCT trafficking through the secretory pathway and have identified K473 as a critical residue involved in this regulatory process. Specifically, we demonstrated that mutation of lysine 473 to arginine, an amino acid of similar size and charge which cannot be post-translationally modified, eliminates System xc- activity as a result of diminished trafficking of xCT to the plasma membrane. Instead, this transporter is sequestered nearly completely within the ER. Interestingly, we discovered that this mutation also results in a 7.5 kD loss in the apparent molecular weight of xCT. While we originally postulated that this was a result of loss of ubiquitination or neddylation at K473, our results instead indicate that the K473R mutant lacks both N-and O-glycosylation, accounting for some, but not all, of the loss in molecular weight relative to WT. Since lysine is not a substrate for glycosylation, these results suggest that PTM of K473 may regulate the glycosylation of the transporter and its progression through the ER and ultimately prevent xCT from acquiring additionals PTMs. Such PTM crosstalk, in which PTMs on different residues within the same protein influence each other, is a common way to meticulously regulate a protein’s activity, localization, and stability[46,47,48].
An example of such PTM crosstalk, ER acetylation is a relatively recent discovery that has been found to play a crucial role in the processing of proteins in the ER that follow the secretory pathway through the Golgi and ultimately become localized to the plasma membrane [34]. In particular, ER lysine acetylation of some glycoproteins is essential for export of these proteins from the ER, proper N-glycan maturation in the Golgi, and subsequent post-Golgi trafficking [49]. For example β-site APP cleaving enzyme 1 (BACE-1) and Prominin1 (CD133) undergo lysine acetylation in the ER lumen, a process which is necessary for their exit from the ER [44,50]. Subsequently, both proteins are deacetylated in the Golgi lumen once the protein is fully mature and trafficked to the plasma membrane. However, more recent studies have shown that at least 143 proteins are acetylated uniquely in the ER, including the System xc- accessory protein, 4F2HC [51].
Therefore, we tested the hypothesis that acetylation of K473 is necessary for xCT to transition appropriately through the secretory pathway by creating the structural acetylated lysine mimetic mutant, K473Q. Like K473R, we discovered that K473Q lacks transporter activity and exhibits decreased cell surface localization. Unlike K473R, however, we observed that K473Q is exported to the Golgi, supporting our hypothesis that acetylation of K473 may allow for ER export, but the acetylation mimic still prevents further progression out of the Golgi. Consistent with these findings, K473Q is 3.5 kD greater in molecular weight than K473R which we demonstrated results from its ability to be N- and O-glycosylated, similar to WT. Collectively, these data suggest that acetylation of K473 allows for both glycosylation of xCT as well as export to the Golgi. However, these data also suggest that deacetylation of K473 of xCT is necessary to transition out of the Golgi as has been noted for proteins which are acetylated in the ER [50].
Our results also suggest that xCT is further post-translationally modified after being exported from the Golgi. Specifically, the fully glycosylated K473Q mutant remains nearly 4 kD less in molecular weight than WT xCT and does not traffic beyond the Golgi in the secretory pathway. In addition, treatment of WT xCT with PNGase-F and O-glycosidase (41 kD) results in a deglycoslyated protein that remains greater in molecular weight than K473R and K473Q. Thus, glycosylation represents only part of the basal post-translational modifications observed on xCT. Previous research has shown that xCT can be reversibly palmitoylated, phosphorylated, and O-GlcNAcylated [28,29], so other PTMs such as these may occur during post-Golgi trafficking of xCT and make up the extra approximately 3.5 kD that is not accounted for after WT is treated with both glycosidases.
Based on these collective results, we have developed a hypothetical model for how K473 may serve as a site of regulation of xCT (Figure 9) which is modeled after BACE1 processing. We suggest acetylation of K473 in the ER allows for the initiation of N- glycosylation and the subsequent export of xCT from the ER into the Golgi where it is O-glycosylated. Furthermore, we propose that xCT must be deacetylated at K473 in order to exit the Golgi, so that it can be further post-translationally modified and eventually trafficked to the plasma membrane. This model shares several similarities with other proteins that are known to be acetylated in the ER and deacetylated in the Golgi [44,50].
There are some important differences between the processing of xCT in the ER compared to the BACE1 and CD133, however, that must be acknowledged. 1) In the case of xCT, we find mutation of a single lysine is able to halt progression through the ER, whereas BACE acetylates seven lysines in the N-terminus prior to ER export. 2) In addition, K473 is found within a random coil that exists within the intracellular C-terminal tail. Thus, when synthesized in the ER, K473 of xCT faces the cytoplasmic compartment within the cisternae of the ER rather than the ER lumen. The acetylated lysines in BACE are localized to an extracellular region of the protein, thus are acetylated in the ER lumen. This distinction is important as it could mean that xCT is able to be acetylated by a greater array of acetylases that are localized in the cytoplasm relative to the ER. In addition, the acetylation of xCT would not be limited by ER lumenal acetyl CoA concentration as observed for BACE. 3) Finally, our data suggest that modification of K473 of xCT is necessary prior to xCT N-glycosylation while BACE is able to be glycosylated in the absence of lysine acetylation [52]. This may suggest that unlike BACE1, lack of acetylation of K473 may be necessary for the recruitment of the oligosaccharyltransferase enzyme necessary for N-glycosylation of xCT.
Of course, we must acknowledge that more evidence is needed to develop full support for our proposed model. Most critically, we have yet to provide direct experimental evidence that K473 is acetylated in vivo. Lysine can also be modified by many small molecule metabolites including formylation, succinylation, malonylation, butyrylation, propionylation, glutarylation, β-hydroxybutylation, 2-hydroxyisobutyryation, lactylation, benzoylation and crotonylation [53], therefore, we are currently using a mass spectroscopy approach to address this question. However, the observation that the acetylation mutant K473Q is able to transition to the Golgi supports the hypothesis that K473 undergoes acetylation in the ER. In addition, the fact that the heterodimeric partner of xCT, 4F2HC, is also likely regulated by acetylation in the ER [52] would allow for effective coordination of both xCT and 4F2HC translocation through the biosynthetic pathway.
In addition, identification of the acetylase/deacetylase enzymes which acetylate and deacetylate xCT will be critically important. Given that mutation of K473 alone is able to completely halt the translocation of xCT through the secretory pathway, identification of the acetylase that acts on K473 will allow us to understand how biosynthetic trafficking of this transporter is regulated at the cellular level. This idea is particularly intriguing given that acetylation is a key regulator of metabolism [54], especially during instances of hypoxia/reperfusion and increased generation of reactive oxygen species [55]. In other words, such a mechanism would allow for coordination of System xc- activity and metabolic demands, allowing for increased capacity for cystine import and glutathione synthesis during times of increased vulnerability to oxidative stress. In addition, glutathione depletion increases lysine acetylation in astrocytes [56], suggesting that xCT translocation through the biosynthetic pathway could be enabled in such conditions. Such a hypothesis is consistent with our previous observation that xCT exhibits an increased rate of trafficking to the plasma membrane during glutathione depletion[1].
We also acknowledge the possibility that K473 may not be post-translationally modified in the ER and that the K473R mutation may instead disrupt protein folding to such an extent that the protein is sent immediately for degradation through the ERAD system, thus preventing it from becoming glycosylated. There is no question that K473 is highly conserved, and thus must be critical for xCT function or regulation. However, given that K473 is found in a region of the C-terminus that is less ordered and relatively far from the primary transporter transmembrane cluster which includes the cystine and glutamate translocation paths [57], it is less likely that such a minor mutation would lead to significant unfolding. Moreover, given its location within a more peripheral random coiled structure is consistent with the hypothesis that this site is important for interaction with cell signaling or trafficking proteins [58].
Further work must also be done to identify the site of xCT N-glycosylation that occurs in the ER. Based on our observation that treatment of xCT with PNGase-F led to a 2.5 kD reduction in molecular weight, there is likely only one N-glycosylation site on xCT. N-Acetylglucosamine (GlcNAc), mannose and the other monosaccharides typically found in N-linked oligosaccharides have molecular weights ranging from 0.18 to 0.22 kD/sugar. Therefore, a shift of 2.5 kD suggests between 11-14 sugars in the oligosaccharide which is the typical range observed for N-linked oligosaccharides in mammals. xCT has been predicted to be glycosylated at N314 [59], this study is the first to provide experimental evidence that xCT is N-glycosylated in vivo. However, given that the N314Q xCT mutant had the same molecular weight as WT and was sensitive to PNGaseF treatment, it is evident that N314 is not the site of N-glycosylation in this expression system. N314Q showed equivalent membrane localization as WT, despite exhibiting slightly reduced activity, suggesting that the mutation may have a modest impact on transporter function, but not localization.
Similarly, in this study we have provided the first evidence that xCT is also O-glycosylated. Neuraminidase and O-glycosidase cleave bonds between proteins and core 1 and 3 type oligosaccharides that are capped with sialic acid. Treatment of WT and K473Q xCT with these enzymes led to a 1.5 kD reduction in molecular weight which is consistent with the expected molecular weight of core 1 O-glycosylation structures which are most common in humans. For example, mass spectrometry analysis of the CD8β receptor has a single core 1 O-glycosylation site to which a 1.7 kD glycan is attached, suggesting that a core 1 glycan is likely attached to xCT [60]. Thus future work will need to probe the functional role of O-glycosylation of xCT as well as identify the site of glycosylation.
In summary, we have identified a single, highly conserved lysine residue (K473) in an intracellular domain of the C-terminus of xCT that appears to regulate its progression through the ER and Golgi. Our results suggest that K473 may be transiently acetylated in the endoplasmic reticulum allowing for the glycosylation of xCT and its export to the Golgi. Once in the Golgi, K473 likely needs to be deacetylated to allow for complete post-translational modification of xCT and its export to the plasma membrane. Thus, this site may act as a molecular switch for rapidly regulating xCT trafficking and activity.
4. Materials and Methods
4.1. Cell Culture
COS-7 cells were maintained in Dulbecco’s Modified Eagle Medium supplemented with 4 mM L-glutamine, 4500 mg/L glucose, 1 mM sodium pyruvate, 1500 mg/L NaCO3, 10% FBS and 1% penicillin/streptomycin in 100-mm dishes. Medium was changed every two to three days, and cultures were split 1:6 every 6-8 days. COS-7 cells were obtained from the American Type Culture Collection, and cells were not passaged over 15 times. Tissue culture media and chemicals were purchased from Thermo Fisher (Gibco).
4.2. Human myc-xCT and HA-4F2HC Constructs
Human xCT was subcloned into pCMV-3Tag-2A (Clonetech) vector at the EcoR1/HindIII site. Human CD98 was subcloned into pCMV-HA-N (Clonetech) at the EcoR1/NotI site [1].
4.3. Creation of Mutants Using Site-Directed Mutagenesis
Several mutants, including K422R, K472R, K473R, K473Q, and N314Q, were created using the QuikChange Lightning Site-Directed Mutagenesis Kit (Agilent). The QuikChange Primer Design Program website was used to design optimal primers for mutagenesis. The primer sequences are given in Table 1 All single-stranded primers were synthesized by IDT at the 25 nmol scale.
Stock primer solutions were created by resuspending each synthesized primer to a concentration of 1 mg/mL in DNase/RNase-free water. Next, working primer solutions (125 ng/µL) were prepared using the same nuclease free water. Reagents were combined in PCR tubes according to instructions detailed in the QuikChange Lightning Site-Directed Mutagenesis Kit Manual. The template DNA used in the sample reactions was the human xCT construct (section 4.2) purified from XL-10 Gold Competent Cells (Agilent). The PCR reactions were run in a thermocycler (Thermo Hybaid PX2) following the guidelines in the QuikChange manual. Next, DpnI digestion of the template DNA and transformation of XL10-Gold ultracompetent cells were performed according to the instructions in the QuikChange manual. The transformation reaction was placed on agar plates containing kanamycin (50 µg/mL) and incubated overnight. Insertion of the correct mutations was confirmed using DNA sequencing of the entire xCT gene (Eurofins).
4.4. Heterologous Expression of Human myc-xCT and HA-4F2HC in COS-7 Cells
Transfection quality cDNA was produced using the Pure Yield Plasmid Midi-prep system (Promega). myc-xCT (wildtype or mutant) and HA-4F2HC were co-transfected into COS-7 cells using FuGENE 6 (Promega) following manufacturer’s guidelines using a 3:1 ratio of FuGENE 6 to myc-xCT and a 3:1 ratio of FuGENE 6 to HA-4F2HC in antibiotic-free media. 18-24 hours later the media was replaced with growth medium which was maintained for 24 hours prior to the initiation of immunoprecipitation or cell surface biotinylation assays.
4.5. Glutamate Oxidase and HRP Assay for Measuring xCT Activity
Activity of xCT was measured using a high throughput glutamate release as outlined by [61]. COS-7 cells grown and transiently transfected with myc-xCT (wt or mutant) and HA-4F2HC in a 96-well plates were washed twice with warm PBS (37oC) and treated with 100 µL of warm cystine (80 µM) in Earle’s Balanced Salt Solution (mM: NaCl 116.4, NaHCO3 26.2, NaH2PO4 1.02, KCl 5.36, MgSO4 0.81,CaCl2 1.8 and Glucose 5.56, pH 7.4) and incubated for one hour at 37 °C. Enzyme solution (50 µL) consisting of Glutamate Oxidase (0.04 U/mL), Horseradish Peroxidase (0.125 U/mL), Amplex (50 µM), and 1x reaction buffer (100 mM Tris, pH 7.4) was added to each well. A plate reader was used to measure the fluorescence (530 nm excitation, 590 nm emission) in each well every 30 seconds for 5 minutes in order to obtain the initial rate of glutamate turnover. A standard curve of glutamate (0-20 µM) was used to convert rates of activity to concentration of glutamate released. Specific activity was determined by subtracting the average glutamate released (n=8) from untransfected cells from the glutamate released from transfected cells.
4.6. Immunoprecipitation for Isolating myc-xCT
COS-7 cells transiently transfected with myc-xCT (wildtype of mutant) and HA-4F2HC were grown to 90% confluence in 35 mM dishes. Plates were placed on ice and rinsed once with ice-cold phosphate buffered saline (PBS). Next, a cell lysis buffer (25 mM Tris, 0.15 M NaCl, 1 mM EDTA, 1% NP40, 5% glycerol; pH 7.4) containing protease inhibitor cocktail (Sigma G6521) was added to the plates. The plates were set on ice for 5 minutes and rocked.
The lysates were transferred to microcentrifuge tubes, centrifuged at 13,000 rpm for 10 minutes at room temperature, and the supernatant was transferred to new microcentrifuge tubes. Aliquots of lysate (250 μL) were added to equal volumes of Pierce Anti-c-Myc Magnetic Beads (25 μl) pre-washed with lysis buffer and incubated for 30 min at room temperature with gentle rocking.
The beads were then collected using a magnetic stand and the supernatants were transferred to new microcentrifuge tubes (unbound protein sample). The beads were washed three times with diluted 20X Mag c-Myc IP/Co-IP Buffer-2 (500 mM Tris, 3 M NaCl, 1% Tween-20 Detergent pH 7.5) and once with ultrapure water. The beads were resuspended using diluted 5X Non-reducing Sample Buffer (0.3 M Tris-HCl, pH 6.8, 5% SDS, 50% glycerol, lane marker tracking dye) and incubated for 10 minutes at 95 °C. The beads were collected using a magnetic stand and the supernatants were recovered (bound protein sample). All of the samples were stored and frozen at -20°C prior to Western blot analysis. Prior to electrophoresis, 1.3 µL of 30% SDS and 0.4 µL of β-mercaptoethanol were added to the immunoprecipitated samples to aid in xCT denaturation.
4.7. Biotinylation of Cell Surface Proteins
Biotinylation of cell surface proteins was performed using the method from Chase, et al. with the following modification [1]. Transfected COS-7 were not serum-starved 24-hr prior to the experiment, and the avidin-lysate solution was rocked for 1 hour at room temperature.
4.8. PNGase F to Cleave N-Linked Oligosaccharides
The immunoprecipitation protocol was followed according to section 4.5 until resuspension of the beads. Instead of Non-Reducing Sample Buffer, the beads were resuspended in 1% RapiGest (Waters) in ddH2O. Aliquots of resuspended beads were transferred to new microcentrifuge tubes and heated at 95 °C for 10 minutes. Protease inhibitors, 10X GlycoBuffer 2, and PNGase F (New England Biolabs) were added to the beads. The reaction was incubated at 37 °C for 1 hour. The samples were taken for Western blot analysis and frozen at -20°C. To prepare the samples for electrophoresis, 4x Laemmli Sample Buffer (Bio-Rad) was added to the samples, as well as β-mercaptoethanol and 30% SDS in the same ratios as in the immunoprecipitated samples in section 4.6.
4.9. O-Glycosidase to Cleave O-Linked Oligosaccharides
The immunoprecipitation protocol was followed according to section 4.5 until resuspension of the beads. Instead of Non-Reducing Sample Buffer, the beads were resuspended in 1% RapiGest (Waters) in ddH2O. Aliquots of resuspended beads were transferred to new microcentrifuge tubes and heated at 95 °C for 10 minutes. Protease inhibitors, 10X GlycoBuffer 2,, α2-3,6,8 Neuraminidase, and O-Glycosidase (New England Biolabs) were added to the beads. The reaction was incubated at 37 °C for 3 hours. The samples were taken for Western blot analysis and frozen at -20°C. To prepare the samples for electrophoresis, 4x Laemmli Sample Buffer (Bio-Rad) was added to the samples, as well as β-mercaptoethanol and 30% SDS in the same ratios as in the immunoprecipitated samples in section 4.6.
4.10. Western Blot Analysis
Protein samples were electrophoresed at 200V on either 12% Mini-PROTEAN TGX Precast Protein Gels (Bio-Rad) or 10% Bolt Bis-Tris Plus Mini Protein Gels (Thermo Fisher) and transferred to a PVDF membrane (Millipore Immobilon-FL)) at 30 volts for 1 hour. The membranes were blocked with Intercept (TBS) Blocking Buffer (LI-COR 927-60001) for 1 hour at 4 °C. The membranes were probed with goat anti-myc (1:2500, Novus Biologicals NB600-335), rabbit anti-HA (1:1000, Cell Signaling #3724), rabbit anti-Ub (1:1000, Cell Signaling #43124) and/or rabbit anti-NEDD8 (1:1000, Cell Signaling #2754) in Intercept Blocking Buffer containing 0.2% Tween 20 overnight at 4 °C. The membranes were washed in TBS-T (0.1%) 3 times for 5 minutes each and incubated in the dark with donkey anti-goat IRDYE 680RD (LI-COR, 926-68074) and donkey anti-rabbit IRDYE 800CW (LI-COR, 926-32213), each diluted 1:15,000 in Intercept Blocking Buffer with 0.2% Tween 20 and 0.01% SDS. The membranes were washed 3 times for 5 minutes each in TBS-T (0.1%) and visualized using the Odyssey XF imaging system (LI-COR). Bands were analyzed also using the Image Studio software v 5.2.
4.11. Immunocytochemistry
COS-7 cells transiently transfected with myc-xCT (wildtype or mutant) and HA-4F2HC were grown on poly-L-lysine-coated coverslips (0.01%, Sigma P4707) placed in 6 well plates. Plates were removed, placed on ice and rinsed once with ice-cold PBS, fixed with 4% paraformaldehyde in PBS for 15 minutes. Cells were rinsed with PBS 3 times for 2 minutes each. Cells were then treated with ice-cold methanol for 10 minutes at -20 °C and washed with PBS one more time for 5 minutes. In preparation for immunostaining, cells were blocked by the addition of 5% donkey sera in PBS with 0.3% Tween-20 for 1 hour. Cells were incubated with with primary antibody for mouse anti-myc (1:100; SCBT #SC-40) or goat anti-myc (1:100; Novus), rabbit anti-protein disulfide isomerase (PDI) (1:100; Cell Signaling #3501T) or rabbit anti-GM130 (1:100; Cell Signaling #12480), and donkey anti-HA (1:100; ThermoFisher #190-138A) overnight at 4°C. Cells were washed 2 times with PBS and 1 time with dH2O for 10 minutes each and then incubated with Alexa-Fluor 488 conjugated donkey anti-mouse IgG, Rhodamine RedX conjugated donkey anti-rabbit IgG (1:100), and Alexa-Fluor 647 conjugated donkey-anti goat (JacksonImmuno) 1 hour at 4°C. The cells were washed 2 times with PBS and 1 time with H2O for 10 minutes each and the coverslips were mounted on slides with ProLong Diamond with DAPI (Thermoisher) and dried overnight in the dark. Slides were viewed using the Nikon A1R-si confocal microscope and imaged using NIS elements imaging software.
4.12. Immunocytochemistry Co-Localization Analysis
Manders co-localization analysis was performed using the open source software Fiji. Background was subtracted from each color channel of an image using the rolling ball method (radius 50 pixels). The cell was outlined to create a region of interest and the Colocalization Threshold macro was employed to determine the Manders coefficients for each cell. This macro uses the Costes, et al. method [62] for determining threshold and calculating Mander’s coefficients. Significance of Manders coefficients for each cell marker and xCT were determined for mutants of xCT using One-Way ANOVA followed by a post-hoc Tukey test.
Author Contributions
Individual contributions are as follows: conceptualization, L.C. and A.K.; methodology, L.C. and A.K..; validation, L.C. and A.K..; formal analysis, L.C. and A.K.; investigation, A.K and L.C..; resources, L.C..; data curation, L.C..; writing—original draft preparation, A.K. and L.C.; writing—review and editing, A.K. and L.C..; visualization, A.K. and L.C..; supervision, L.C..; project administration, L.C.; funding acquisition, L.C.. All authors have read and agreed to the published version of the manuscript.
Funding
This research was funded by NSF RUI #0843564, NSF MRI #1335890, Schaap Funds for Undergraduate Research, the Hope College Departments of Biology and Chemistry, and the Hope College Neuroscience program.
Institutional Review Board Statement
Not applicable.
Informed Consent Statement
Not applicable
Data Availability Statement
The data presented in this study are available upon request from the corresponding author.
Acknowledgments
The authors wish to thank Madelyn Vitu and Elizabeth Schuurman for their work in developing and performing the glutamate release assays.
Conflicts of Interest
The authors declare no conflicts of interest. The funders had no role in the design of the study; in the collection, analyses, or interpretation of data; in the writing of the manuscript; or in the decision to publish the results.
References
- Chase, L.A.; VerHeulen Kleyn, M.; Schiller, N.; King, A.G.; Flores, G.; Engelsman, S.B.; Bowles, C.; Smith, S.L.; Robinson, A.E.; Rothstein, J. Hydrogen Peroxide Triggers an Increase in Cell Surface Expression of System Xc− in Cultured Human Glioma Cells. Neurochem. Int. 2020, 134, 104648. [Google Scholar] [CrossRef] [PubMed]
- Bridges, R.; Lutgen, V.; Lobner, D.; Baker, D.A. Thinking Outside the Cleft to Understand Synaptic Activity: Contribution of the Cystine-Glutamate Antiporter (System Xc−) to Normal and Pathological Glutamatergic Signaling. Pharmacol. Rev. 2012, 64, 780–802. [Google Scholar] [CrossRef] [PubMed]
- Li, J.; Cao, F.; Yin, H.; Huang, Z.; Lin, Z.; Mao, N.; Sun, B.; Wang, G. Ferroptosis: Past, Present and Future. Cell Death Dis. 2020, 11, 1–13. [Google Scholar] [CrossRef] [PubMed]
- Black, J.L. The Voltage-Gated Calcium Channel Gamma Subunits: A Review of the Literature. J. Bioenerg. Biomembr. 2003, 35, 649–660. [Google Scholar] [CrossRef] [PubMed]
- Miranda, M.; Dionne, K.R.; Sorkina, T.; Sorkin, A. Three Ubiquitin Conjugation Sites in the Amino Terminus of the Dopamine Transporter Mediate Protein Kinase C–Dependent Endocytosis of the Transporter. Mol. Biol. Cell 2007, 18, 313–323. [Google Scholar] [CrossRef] [PubMed]
- Alvi, F.; Idkowiak-Baldys, J.; Baldys, A.; Raymond, J.R.; Hannun, Y.A. Regulation of Membrane Trafficking and Endocytosis by Protein Kinase C: Emerging Role of the Pericentrion, a Novel Protein Kinase C-Dependent Subset of Recycling Endosomes. Cell. Mol. Life Sci. 2007, 64, 263–270. [Google Scholar] [CrossRef] [PubMed]
- Sher, E.; Rosa, P.; Francolini, M.; Codignola, A.; Morlacchi, E.; Taverna, E.; Giovannini, F.; Brioschi, A.; Clementi, F.; McEnery, M.W.; et al. Metabolism and Trafficking of N-Type Voltage-Operated Calcium Channels in Neurosecretory Cells. J. Bioenerg. Biomembr. 1998, 30, 399–407. [Google Scholar] [CrossRef] [PubMed]
- Braithwaite, S.P.; Meyer, G.; Henley, J.M. Interactions between AMPA Receptors and Intracellular Proteins. Neuropharmacology 2000, 39, 919–930. [Google Scholar] [CrossRef] [PubMed]
- Marchand, S.; Cartaud, J. Targeted Trafficking of Neurotransmitter Receptors to Synaptic Sites. Mol. Neurobiol. 2002, 26, 117–135. [Google Scholar] [CrossRef] [PubMed]
- Shepherd, J.D.; Huganir, R.L. The Cell Biology of Synaptic Plasticity: AMPA Receptor Trafficking. Annu. Rev. Cell Dev. Biol. 2007, 23, 613–643. [Google Scholar] [CrossRef] [PubMed]
- Weis, W.I.; Kobilka, B.K. The Molecular Basis of G Protein–Coupled Receptor Activation. Annu. Rev. Biochem. 2018, 87, 897–919. [Google Scholar] [CrossRef] [PubMed]
- Rotin, D.; Staub, O. Function and Regulation of the Epithelial Na+ Channel ENaC. Compr. Physiol. 2021, 11, 2017–2045. [Google Scholar] [CrossRef] [PubMed]
- Bannai, S.; Kitamura, E. Adaptive Enhancement of Cystine and Glutamate Uptake in Human Diploid Fibroblasts in Culture. Biochim. Biophys. Acta 1982, 721, 1–10. [Google Scholar] [CrossRef] [PubMed]
- Habib, E.; Linher-Melville, K.; Lin, H.-X.; Singh, G. Expression of xCT and Activity of System Xc− Are Regulated by NRF2 in Human Breast Cancer Cells in Response to Oxidative Stress. Redox Biol. 2015, 5, 33–42. [Google Scholar] [CrossRef] [PubMed]
- Liu, X.; Albano, R.; Lobner, D. FGF-2 Induces Neuronal Death through Upregulation of System Xc-. Brain Res. 2014, 1547, 25–33. [Google Scholar] [CrossRef] [PubMed]
- Albrecht, P.; Lewerenz, J.; Dittmer, S.; Noack, R.; Maher, P.; Methner, A. Mechanisms of Oxidative Glutamate Toxicity: The Glutamate/Cystine Antiporter System Xc- as a Neuroprotective Drug Target. CNS Neurol. Disord. Drug Targets 2010, 9, 373–382. [Google Scholar] [CrossRef] [PubMed]
- Lewerenz, J.; Maher, P.; Methner, A. Regulation of xCT Expression and System $$ X_{\text{c}}^{ - } $$function in Neuronal Cells. Amino Acids 2012, 42, 171–179. [Google Scholar] [CrossRef] [PubMed]
- Lewerenz, J.; Hewett, S.J.; Huang, Y.; Lambros, M.; Gout, P.W.; Kalivas, P.W.; Massie, A.; Smolders, I.; Methner, A.; Pergande, M.; et al. The Cystine/Glutamate Antiporter System Xc− in Health and Disease: From Molecular Mechanisms to Novel Therapeutic Opportunities. Antioxid. Redox Signal. 2013, 18, 522–555. [Google Scholar] [CrossRef] [PubMed]
- Verrey, F.; Closs, E.I.; Wagner, C.A.; Palacin, M.; Endou, H.; Kanai, Y. CATs and HATs: The SLC7 Family of Amino Acid Transporters. Pflüg. Arch. 2004, 447, 532–542. [Google Scholar] [CrossRef] [PubMed]
- Chillarón, J.; Roca, R.; Valencia, A.; Zorzano, A.; Palacín, M. Heteromeric Amino Acid Transporters: Biochemistry, Genetics, and Physiology. Am. J. Physiol. Renal Physiol. 2001, 281, F995–1018. [Google Scholar] [CrossRef] [PubMed]
- Palacín, M.; Kanai, Y. The Ancillary Proteins of HATs: SLC3 Family of Amino Acid Transporters. Pflüg. Arch. 2004, 447, 490–494. [Google Scholar] [CrossRef] [PubMed]
- Sato, H.; Tamba, M.; Ishii, T.; Bannai, S. Cloning and Expression of a Plasma Membrane Cystine/Glutamate Exchange Transporter Composed of Two Distinct Proteins *. J. Biol. Chem. 1999, 274, 11455–11458. [Google Scholar] [CrossRef] [PubMed]
- Gasol, E.; Jiménez-Vidal, M.; Chillarón, J.; Zorzano, A.; Palacín, M. Membrane Topology of System Xc- Light Subunit Reveals a Re-Entrant Loop with Substrate-Restricted Accessibility *. J. Biol. Chem. 2004, 279, 31228–31236. [Google Scholar] [CrossRef] [PubMed]
- Yan, R.; Li, Y.; Shi, Y.; Zhou, J.; Lei, J.; Huang, J.; Zhou, Q. Cryo-EM Structure of the Human Heteromeric Amino Acid Transporter B0,+AT-rBAT. Sci. Adv. 2020, 6, eaay6379. [Google Scholar] [CrossRef] [PubMed]
- Chubb, S.; Kingsland, A.L.; Bröer, A.; Bröer, S. Mutation of the 4F2 Heavy-Chain Carboxy Terminus Causes y+LAT2 Light-Chain Dysfunction. Mol. Membr. Biol. 2006, 23, 255–267. [Google Scholar] [CrossRef] [PubMed]
- Console, L.; Scalise, M.; Tarmakova, Z.; Coe, I.R.; Indiveri, C. N-Linked Glycosylation of Human SLC1A5 (ASCT2) Transporter Is Critical for Trafficking to Membrane. Biochim. Biophys. Acta BBA - Mol. Cell Res. 2015, 1853, 1636–1645. [Google Scholar] [CrossRef] [PubMed]
- Devés, R.; Boyd, C.A. Surface Antigen CD98(4F2): Not a Single Membrane Protein, but a Family of Proteins with Multiple Functions. J. Membr. Biol. 2000, 173, 165–177. [Google Scholar] [CrossRef] [PubMed]
- Gu, Y.; Albuquerque, C.P.; Braas, D.; Zhang, W.; Villa, G.R.; Bi, J.; Ikegami, S.; Masui, K.; Gini, B.; Yang, H.; et al. mTORC2 Regulates Amino Acid Metabolism in Cancer by Phosphorylation of the Cystine-Glutamate Antiporter xCT. Mol. Cell 2017, 67, 128–138.e7. [Google Scholar] [CrossRef] [PubMed]
- Wang, Z.; Wang, Y.; Shen, N.; Liu, Y.; Xu, X.; Zhu, R.; Jiang, H.; Wu, X.; Wei, Y.; Tang, J. AMPKα1-Mediated ZDHHC8 Phosphorylation Promotes the Palmitoylation of SLC7A11 to Facilitate Ferroptosis Resistance in Glioblastoma. Cancer Lett. 2024, 584, 216619. [Google Scholar] [CrossRef] [PubMed]
- Nguyen, H.T.T.; Dalmasso, G.; Yan, Y.; Obertone, T.S.; Sitaraman, S.V.; Merlin, D. Ecto-Phosphorylation of CD98 Regulates Cell-Cell Interactions. PLOS ONE 2008, 3, e3895. [Google Scholar] [CrossRef] [PubMed]
- Guntupalli, S.; Jang, S.E.; Zhu, T.; Huganir, R.L.; Widagdo, J.; Anggono, V. GluA1 Subunit Ubiquitination Mediates Amyloid-β-Induced Loss of Surface α-Amino-3-Hydroxy-5-Methyl-4-Isoxazolepropionic Acid (AMPA) Receptors. J. Biol. Chem. 2017, 292, 8186–8194. [Google Scholar] [CrossRef] [PubMed]
- Cartier, E.; Garcia-Olivares, J.; Janezic, E.; Viana, J.; Moore, M.; Lin, M.L.; Caplan, J.L.; Torres, G.; Kim, Y.-H. The SUMO-Conjugase Ubc9 Prevents the Degradation of the Dopamine Transporter, Enhancing Its Cell Surface Level and Dopamine Uptake. Front. Cell. Neurosci. 2019, 13. [Google Scholar] [CrossRef] [PubMed]
- Kang, M.; Lee, D.; Song, J.; Park, S.; Park, D.; Lee, S.; Suh, Y.H. Neddylation Is Required for Presynaptic Clustering of mGlu7 and Maturation of Presynaptic Terminals. Exp. Mol. Med. 2021, 53, 457–467. [Google Scholar] [CrossRef] [PubMed]
- Farrugia, M.A.; Puglielli, L. Nε-Lysine Acetylation in the Endoplasmic Reticulum – a Novel Cellular Mechanism That Regulates Proteostasis and Autophagy. J. Cell Sci. 2018, 131, jcs221747. [Google Scholar] [CrossRef] [PubMed]
- Staub, O. Regulation of Stability and Function of the Epithelial Na+ Channel (ENaC) by Ubiquitination. EMBO J. 1997, 16, 6325–6336. [Google Scholar] [CrossRef] [PubMed]
- Brockmann, M.M.; Döngi, M.; Einsfelder, U.; Körber, N.; Refojo, D.; Stein, V. Neddylation Regulates Excitatory Synaptic Transmission and Plasticity. Sci. Rep. 2019, 9, 17935. [Google Scholar] [CrossRef] [PubMed]
- Fernández-Tejada, A.; Brailsford, J.; Zhang, Q.; Shieh, J.-H.; Moore, M.A.S.; Danishefsky, S.J. Total Synthesis of Glycosylated Proteins. Top. Curr. Chem. 2015, 362, 1–26. [Google Scholar] [CrossRef] [PubMed]
- Weng, T.-Y.; Chiu, W.-T.; Liu, H.-S.; Cheng, H.-C.; Shen, M.-R.; Mount, D.B.; Chou, C.-Y. Glycosylation Regulates the Function and Membrane Localization of KCC4. Biochim. Biophys. Acta BBA - Mol. Cell Res. 2013, 1833, 1133–1146. [Google Scholar] [CrossRef] [PubMed]
- Li, J.V.; Ng, C.-A.; Cheng, D.; Zhou, Z.; Yao, M.; Guo, Y.; Yu, Z.-Y.; Ramaswamy, Y.; Ju, L.A.; Kuchel, P.W.; et al. Modified N-Linked Glycosylation Status Predicts Trafficking Defective Human Piezo1 Channel Mutations. Commun. Biol. 2021, 4, 1038. [Google Scholar] [CrossRef] [PubMed]
- Thomson, R.B.; Thomson, C.L.; Aronson, P.S. N-Glycosylation Critically Regulates Function of Oxalate Transporter SLC26A6. Am. J. Physiol. - Cell Physiol. 2016, 311, C866–C873. [Google Scholar] [CrossRef] [PubMed]
- Kandel, M.B.; Yamamoto, S.; Midorikawa, R.; Morise, J.; Wakazono, Y.; Oka, S.; Takamiya, K. N-Glycosylation of the AMPA-Type Glutamate Receptor Regulates Cell Surface Expression and Tetramer Formation Affecting Channel Function. J. Neurochem. 2018, 147, 730–747. [Google Scholar] [CrossRef] [PubMed]
- Tachida, Y.; Iijima, J.; Takahashi, K.; Suzuki, H.; Kizuka, Y.; Yamaguchi, Y.; Tanaka, K.; Nakano, M.; Takakura, D.; Kawasaki, N.; et al. O-GalNAc Glycosylation Determines Intracellular Trafficking of APP and Aβ Production. J. Biol. Chem. 2023, 299. [Google Scholar] [CrossRef] [PubMed]
- Lee, S.-Y.; Byambaragchaa, M.; Choi, S.-H.; Kang, H.-J.; Kang, M.-H.; Min, K.-S. Roles of N-Linked and O-Linked Glycosylation Sites in the Activity of Equine Chorionic Gonadotropin in Cells Expressing Rat Luteinizing Hormone/Chorionic Gonadotropin Receptor and Follicle-Stimulating Hormone Receptor. BMC Biotechnol. 2021, 21, 52. [Google Scholar] [CrossRef] [PubMed]
- Costantini, C.; Ko, M.H.; Jonas, M.C.; Puglielli, L. A Reversible Form of Lysine Acetylation in the ER and Golgi Lumen Controls the Molecular Stabilization of BACE1. Biochem. J. 2007, 407, 383–395. [Google Scholar] [CrossRef] [PubMed]
- Stanley, P. Golgi Glycosylation. Cold Spring Harb. Perspect. Biol. 2011, 3, a005199. [Google Scholar] [CrossRef]
- Guo, W.; Shi, L.; Filizola, M.; Weinstein, H.; Javitch, J.A. Crosstalk in G Protein-Coupled Receptors: Changes at the Transmembrane Homodimer Interface Determine Activation. Proc. Natl. Acad. Sci. 2005, 102, 17495–17500. [Google Scholar] [CrossRef] [PubMed]
- Zhang, Y.; Zeng, L. Crosstalk between Ubiquitination and Other Post-Translational Protein Modifications in Plant Immunity. Plant Commun. 2020, 1. [Google Scholar] [CrossRef] [PubMed]
- Leney, A.C.; El Atmioui, D.; Wu, W.; Ovaa, H.; Heck, A.J.R. Elucidating Crosstalk Mechanisms between Phosphorylation and O-GlcNAcylation. Proc. Natl. Acad. Sci. 2017, 114, E7255–E7261. [Google Scholar] [CrossRef] [PubMed]
- Dieterich, I.A.; Cui, Y.; Braun, M.M.; Lawton, A.J.; Robinson, N.H.; Peotter, J.L.; Yu, Q.; Casler, J.C.; Glick, B.S.; Audhya, A.; et al. Acetyl-CoA Flux from the Cytosol to the ER Regulates Engagement and Quality of the Secretory Pathway. Sci. Rep. 2021, 11, 2013. [Google Scholar] [CrossRef]
- Mak, A.B.; Pehar, M.; Nixon, A.M.L.; Williams, R.A.; Uetrecht, A.C.; Puglielli, L.; Moffat, J. Post-Translational Regulation of CD133 by ATase1/ATase2 Mediated Lysine Acetylation. J. Mol. Biol. 2014, 426, 2175–2182. [Google Scholar] [CrossRef] [PubMed]
- Pehar, M.; Lehnus, M.; Karst, A.; Puglielli, L. Proteomic Assessment Shows That Many Endoplasmic Reticulum (ER)-Resident Proteins Are Targeted by Nϵ-Lysine Acetylation in the Lumen of the Organelle and Predicts Broad Biological Impact. J. Biol. Chem. 2012, 287, 22436–22440. [Google Scholar] [CrossRef] [PubMed]
- Ding, Y.; Dellisanti, C.D.; Ko, M.H.; Czajkowski, C.; Puglielli, L. The Endoplasmic Reticulum-Based Acetyltransferases, ATase1 and ATase2, Associate with the Oligosaccharyltransferase to Acetylate Correctly Folded Polypeptides. J. Biol. Chem. 2014, 289, 32044–32055. [Google Scholar] [CrossRef] [PubMed]
- Wang, Z.A.; Cole, P.A. The Chemical Biology of Reversible Lysine Post-Translational Modifications. Cell Chem. Biol. 2020, 27, 953–969. [Google Scholar] [CrossRef] [PubMed]
- Shi, L.; Tu, B.P. Acetyl-CoA and the Regulation of Metabolism: Mechanisms and Consequences. Curr. Opin. Cell Biol. 2015, 33, 125–131. [Google Scholar] [CrossRef] [PubMed]
- Herr, D.J.; Singh, T.; Dhammu, T.; Menick, D.R. Regulation of Metabolism by Mitochondrial Enzyme Acetylation in Cardiac Ischemia-Reperfusion Injury. Biochim. Biophys. Acta BBA - Mol. Basis Dis. 2020, 1866, 165728. [Google Scholar] [CrossRef] [PubMed]
- Pehar, M.; Ball, L.E.; Sharma, D.R.; Harlan, B.A.; Comte-Walters, S.; Neely, B.A.; Vargas, M.R. Changes in Protein Expression and Lysine Acetylation Induced by Decreased Glutathione Levels in Astrocytes. Mol. Cell. Proteomics 2016, 15, 493–505. [Google Scholar] [CrossRef] [PubMed]
- Molecular Basis for Redox Control by the Human Cystine/Glutamate Antiporter System Xc− | Nature Communications. Available online: https://www.nature.com/articles/s41467-021-27414-1 (accessed on 7 August 2024).
- Bah, A.; Forman-Kay, J.D. Modulation of Intrinsically Disordered Protein Function by Post-Translational Modifications. J. Biol. Chem. 2016, 291, 6696–6705. [Google Scholar] [CrossRef] [PubMed]
- SLC7A11 - Cystine/Glutamate Transporter - Homo Sapiens (Human) | UniProtKB | UniProt. Available online: https://www.uniprot.org/uniprotkb/Q9UPY5/entry#ptm_processing (accessed on 1 August 2024).
- Jensen, P.H.; Kolarich, D.; Packer, N.H. Mucin-Type O-Glycosylation – Putting the Pieces Together. FEBS J. 2010, 277, 81–94. [Google Scholar] [CrossRef] [PubMed]
- Thomas, A.G.; Sattler, R.; Tendyke, K.; Loiacono, K.A.; Hansen, H.; Sahni, V.; Hashizume, Y.; Rojas, C.; Slusher, B.S. High-Throughput Assay Development for Cystine-Glutamate Antiporter (Xc-) Highlights Faster Cystine Uptake than Glutamate Release in Glioma Cells. PloS One 2015, 10, e0127785. [Google Scholar] [CrossRef] [PubMed]
- Costes, S.V.; Daelemans, D.; Cho, E.H.; Dobbin, Z.; Pavlakis, G.; Lockett, S. Automatic and Quantitative Measurement of Protein-Protein Colocalization in Live Cells. Biophys. J. 2004, 86, 3993–4003. [Google Scholar] [CrossRef] [PubMed]
Figure 1.
(A) A cross-species amino acid sequence comparison of the C-terminus of xCT showing three highly conserved lysine residues (K422, K472, and K473). Lysine residues are highlighted in orange, bold type indicates fully conserved amino acids (identical across species), white italics indicate conservative amino acid substitutions. (B) Cryo-EM structure of System xc-. xCT is shown in blue and 4F2HC is shown in orange with K422, K472, and K473 side chains of xCT detailed on the intracellular surface. (C) Magnified view of intracellular interface of xCT and conserved lysines.
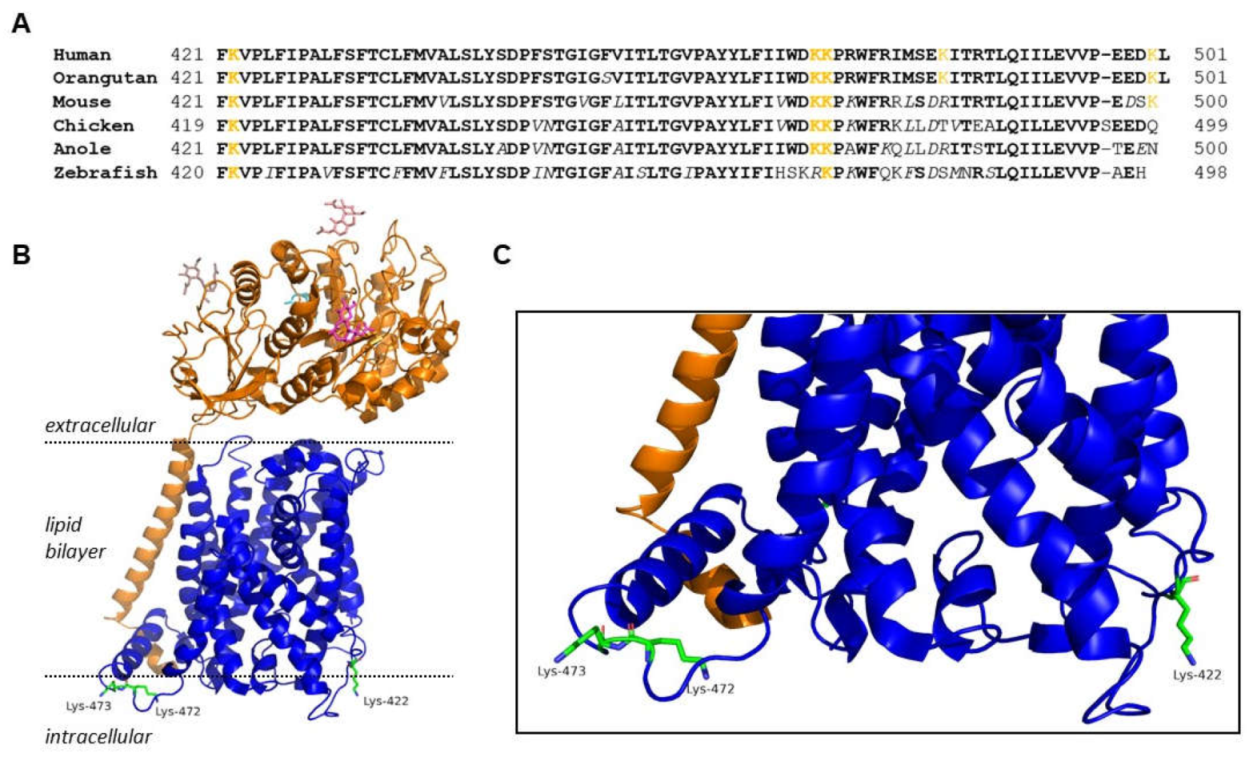
Figure 2.
(A) Activity of System xc- measured using a glutamate release assay. WT or mutant xCT were recombinantly coexpressed with 4F2HC in COS-7 cells. (n=8, *p<0.001 relative to WT, #p<0.05 relative to WT). (B) Molecular weight analysis of isolated WT and K→R xCT mutants. WT, K422R, and K472R appear to be the same molecular weight while K473R, as indicated with an arrow, is approximately 7.5 kD lower.
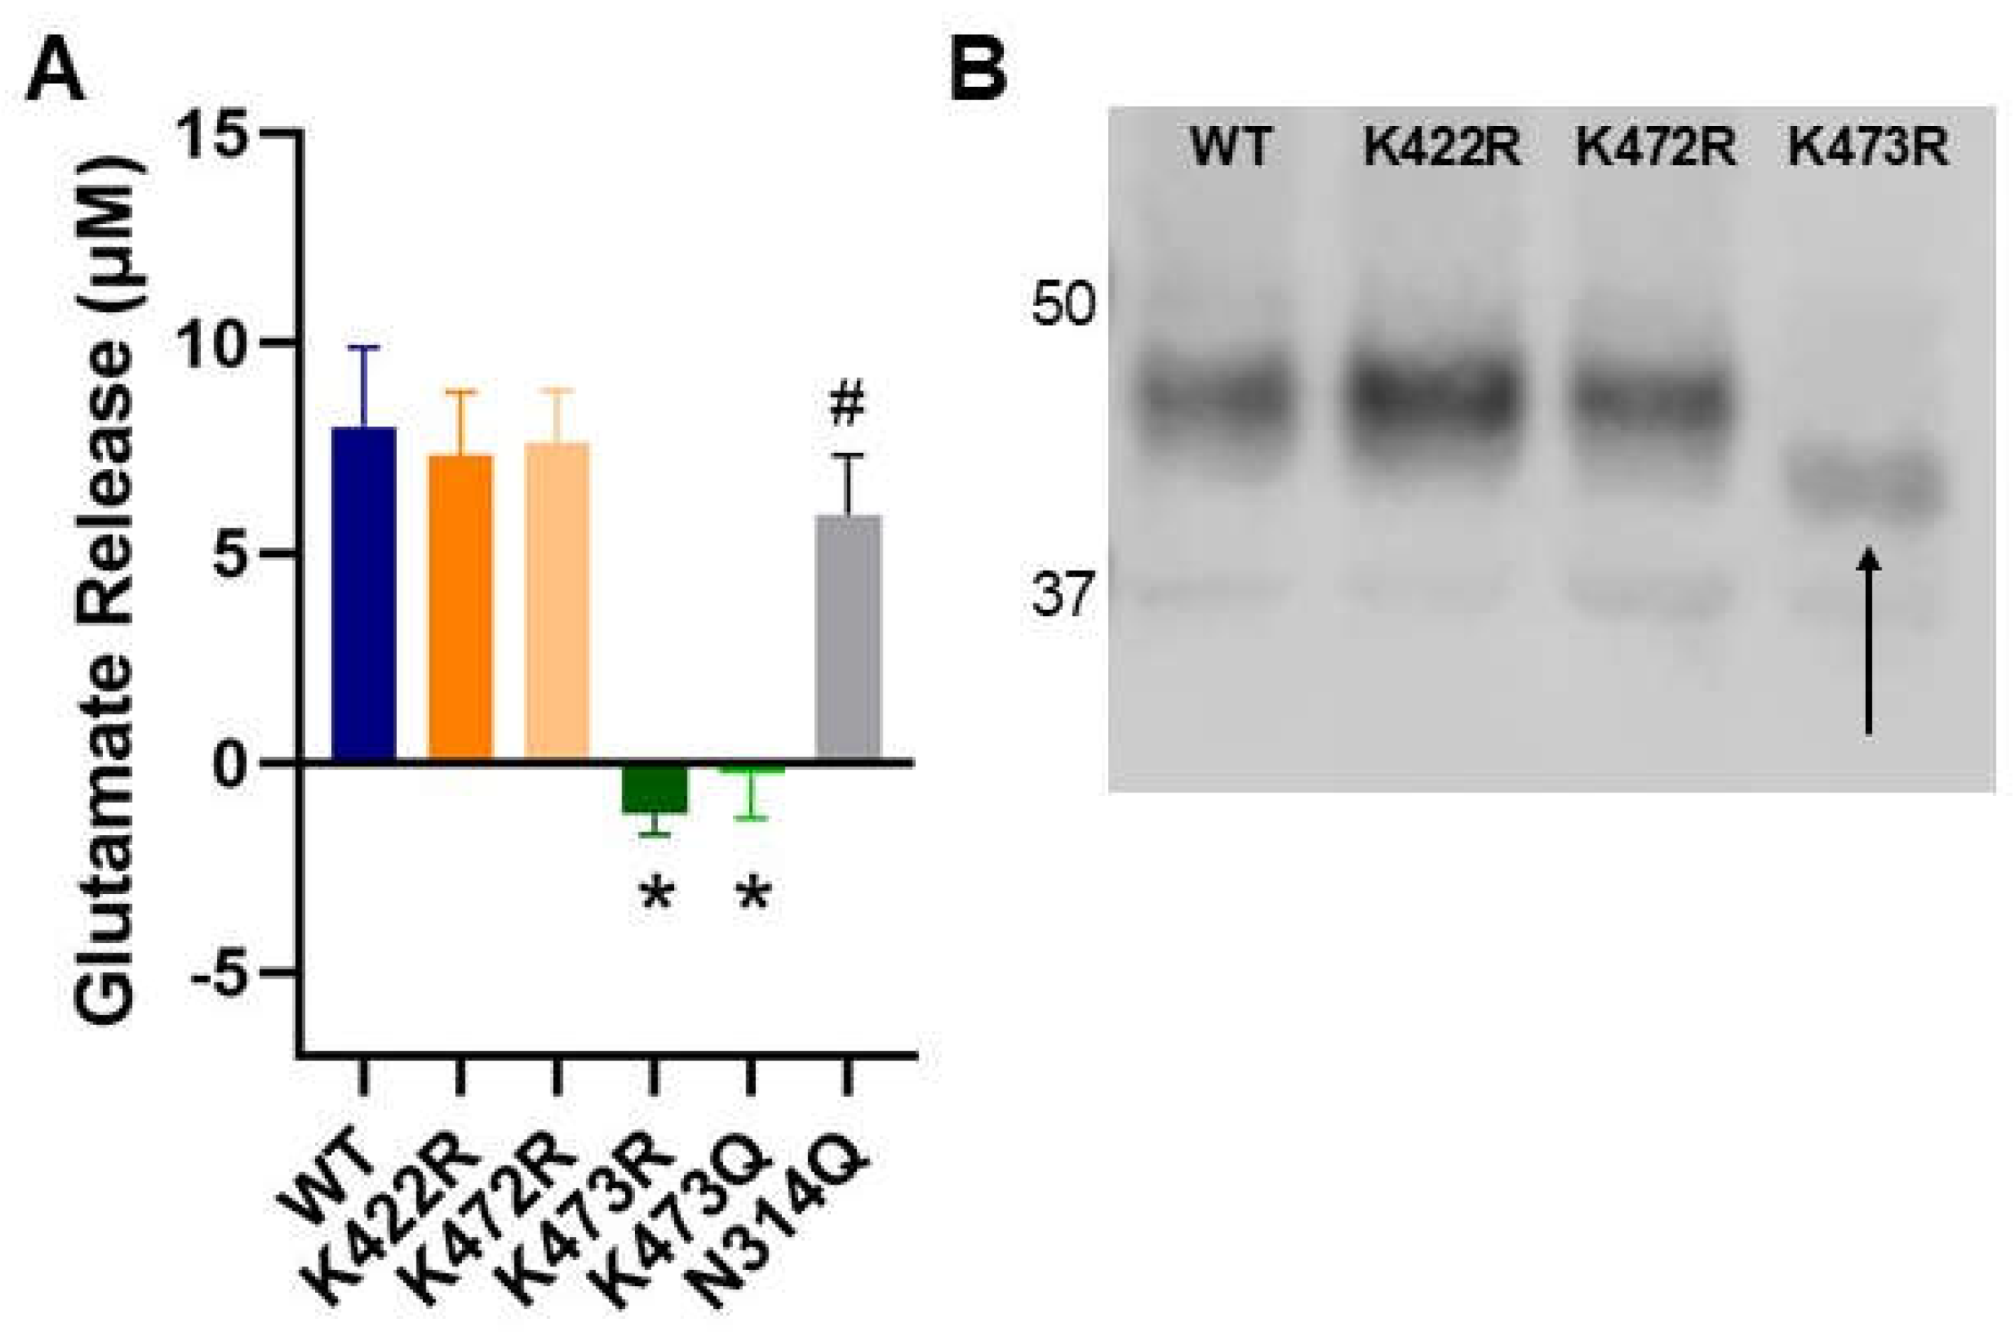
Figure 3.
(A) A cell surface biotinylation assay was performed followed by Western blot analysis to measure xCT in intracellular and membrane fractions. Average % on membrane values are plotted (n=6, *p<0.05, **p<0.001). (B) Representative intracellular (I) and membrane (M) bands of WT and xCT mutants from biotinylation assays. .
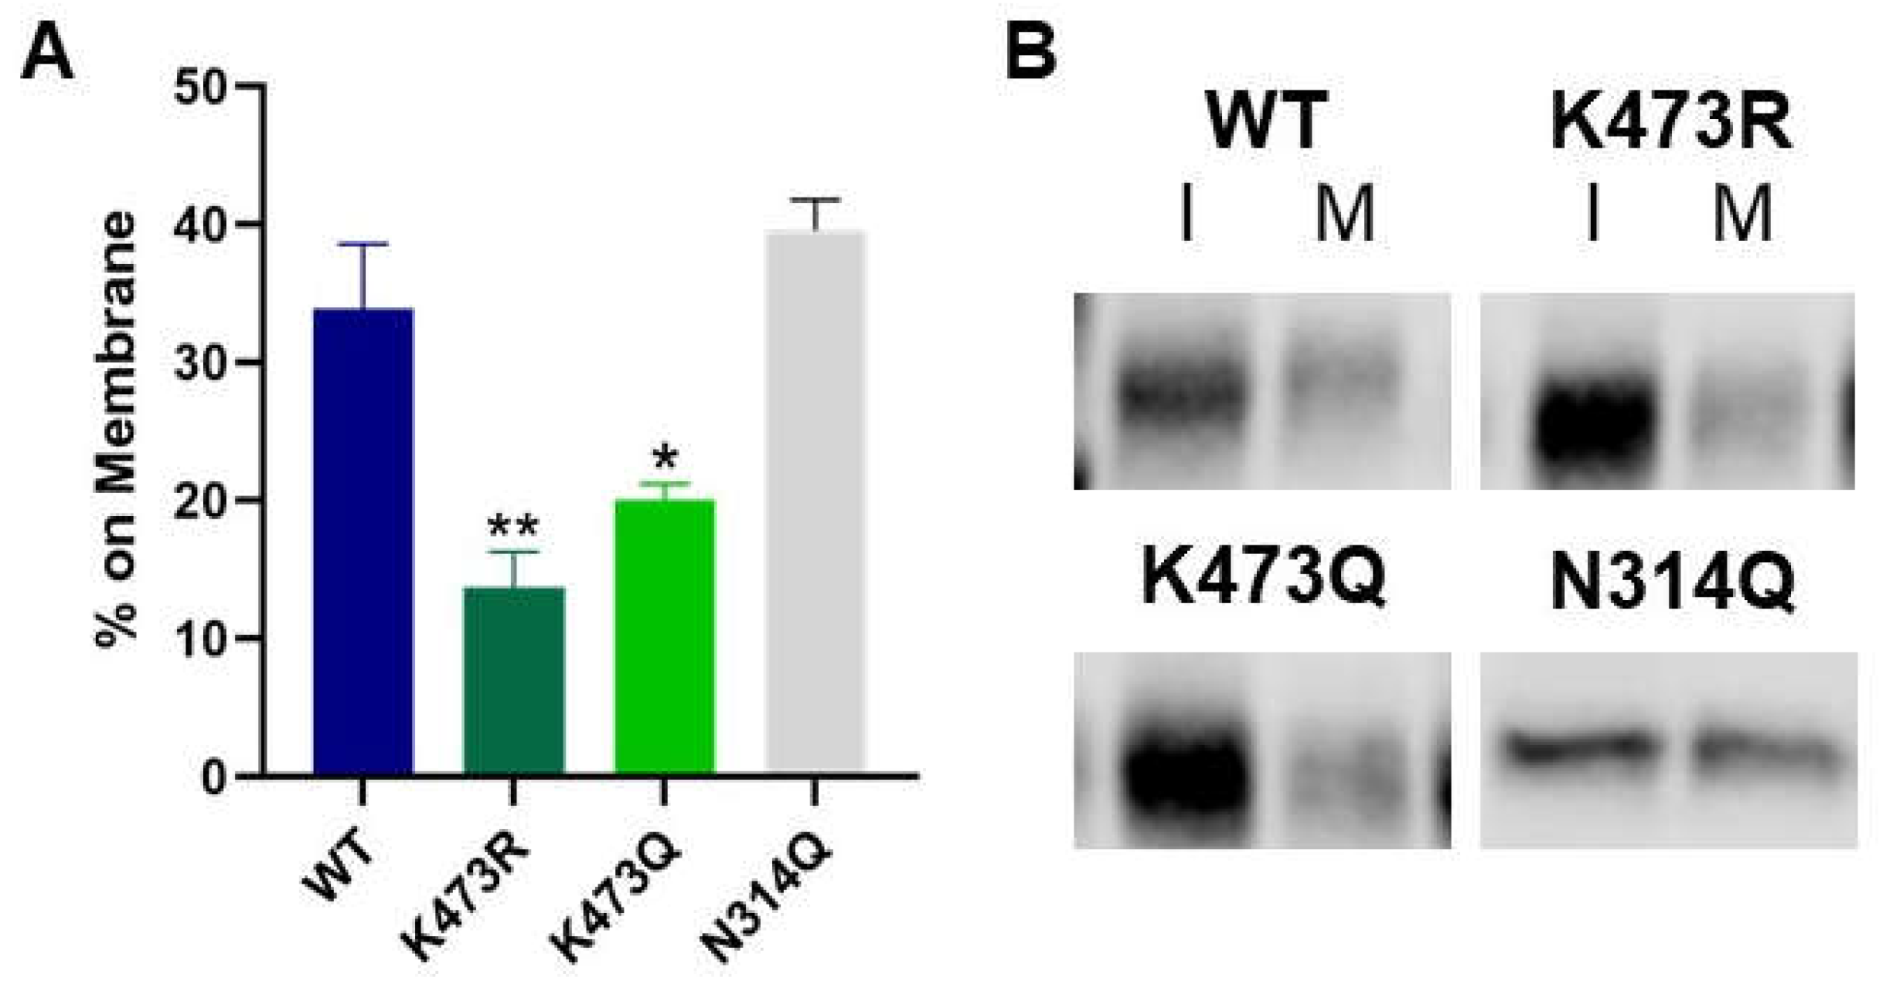
Figure 4.
(A) Assessment of the ubiquitination status of xCT. Western blots of immunoprecipitated myc-xCT were probed with anti-myc (left) or anti-ubiquitin (middle) antibodies. COS-7 cells were treated with 0.3 mM H2O2 (P) or vehicle (C) immediately prior to IP of myc-tagged proteins. The anti-ubiquitin signal in the original cell lysates (right) serves as a positive Ubiquitin antibody control. (B) Assessment of neddylation status of xCT. Western blots of immunoprecipitated myc-xCT were probed with anti-myc (left) and anti-NEDD8 (middle) antibodies. The anti-NEDD8 signal in the original cell lysates (right) serves as a positive NEDD8 antibody control.
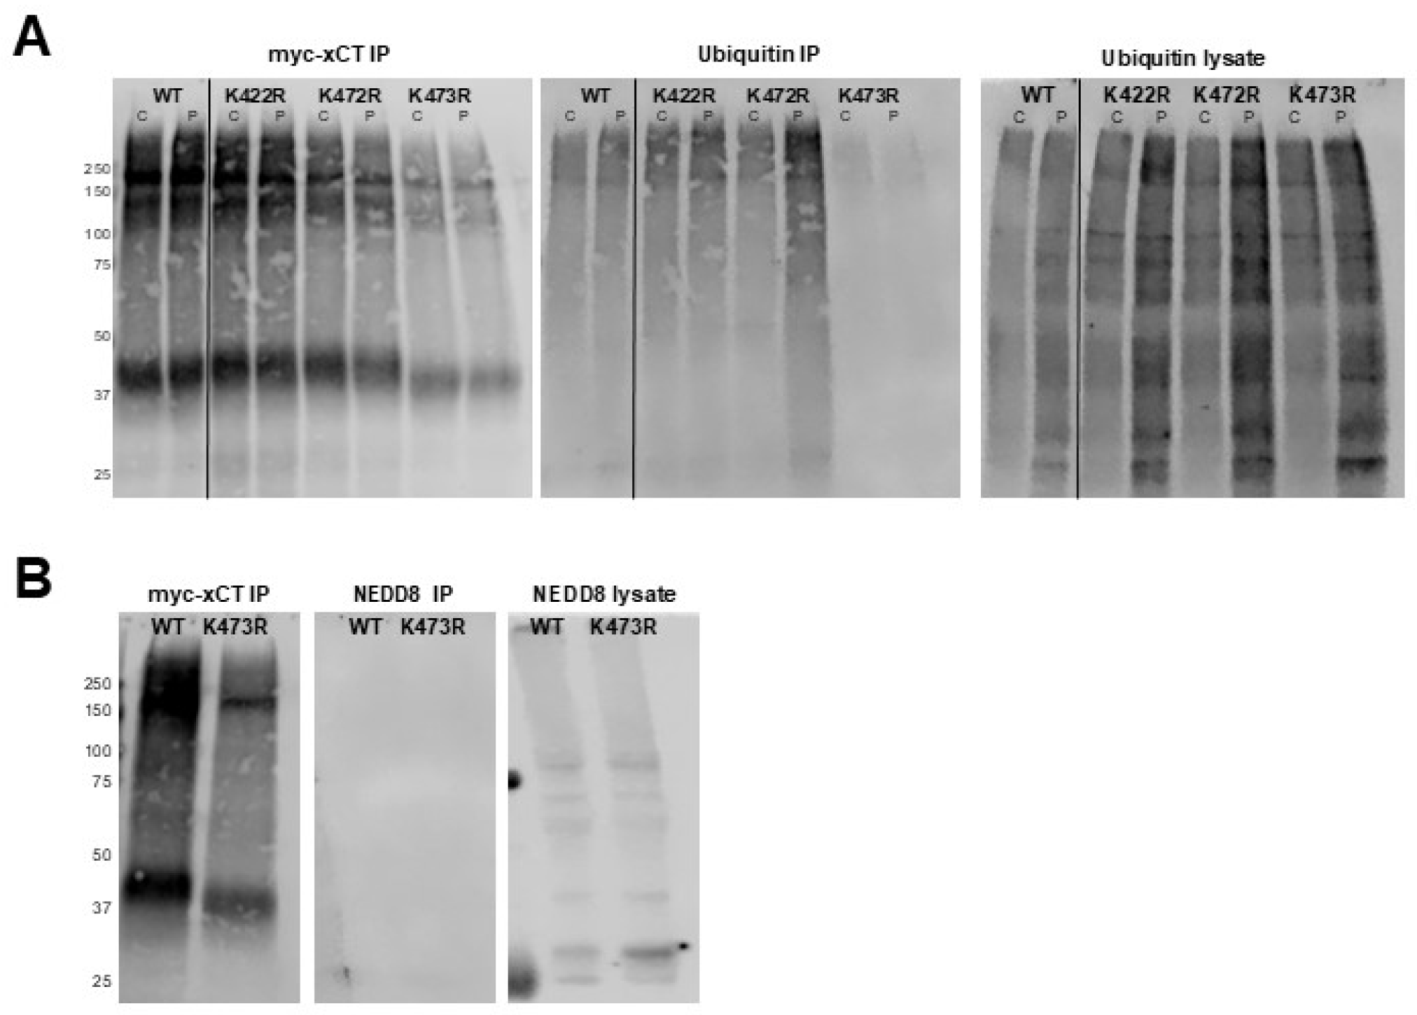
Figure 5.
(A) Immunoprecipitated WT myc-xCT treated with PNGase F, Neuraminidase/O-glycosidase (Neur/O-glyc), or all glycosidases. The monomer of xCT (bottom myc-xCT signal) shows molecular weight reductions of 2.5 kD, 1.5 kD, and 4 kD when treated with PNGase F, Neur/O-glyc, and all glycosidases, respectively. 4F2HC (top HA-4F2HC signal) serves as a positive control for PNGase F. Dashed line indicates position of the top of WT xCT band. Dotted line denotes position of the bottom of the WT xCT band treated with all glycosidases. (B) Density plots for the bands of the xCT monomer when treated with PNGase F, Neur/O-glyc, and both. Dashed and dotted lines from blot in A are added for reference. The solid blue line indicates the middle of the untreated WT band to aid in assessment of molecular weight shifts. (C) Molecular weight analysis of immunoprecipitated WT, K473R, and K473Q. (D) Immunoprecipitated WT, K473R, and K473Q treated with PNGase F, Neur/O-glyc, or all glycosidases. K473R shows no molecular weight changes with glycosidase treatment. K473Q shows molecular weight reductions when treated with PNGase F, Neur/O-glyc, and all glycosidases. Dashed line indicates position of top of the WT xCT band. Dotted line indicates the bottom of the K473R band. (E) Density plots for WT, K473R, and K473Q. Dashed and dotted lines from blot in D are added for reference. The solid blue line indicates the middle of the untreated xCT band for WT, K473R or K473Q to aid in assessment of molecular weight shifts.
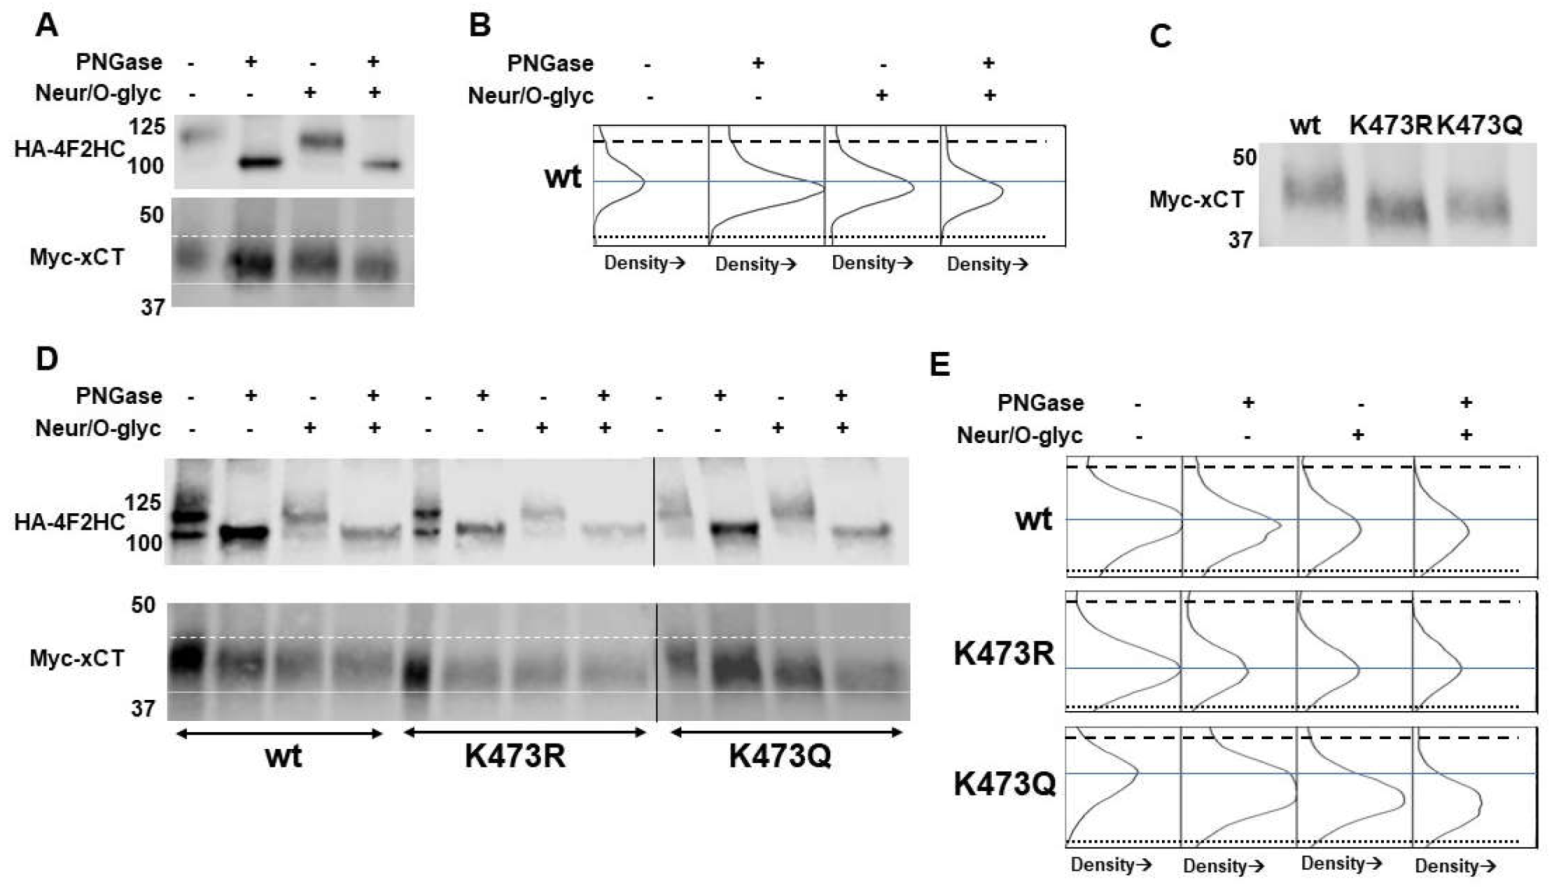
Figure 6.
(A) Molecular weight analysis of immunoprecipitated WT, N314Q, K473R, and K473Q. (B) N314Q shows molecular weight reductions when treated with PNGase F and Neur/O-glyc, similar to WT. The dashed line indicates the position of top of the N314Q band. The dotted line indicates the position of the bottom of the N314Q band treated with PNGaseF. (C) Density plots for the bands of N314Q when treated with PNGase F and Neur/O-glyc to more clearly show molecular weight shifts. Dashed and dotted lines from blot in D are added for reference. The solid blue line indicates the middle of the untreated N314Q xCT band to aid in assessment of molecular weight shifts.
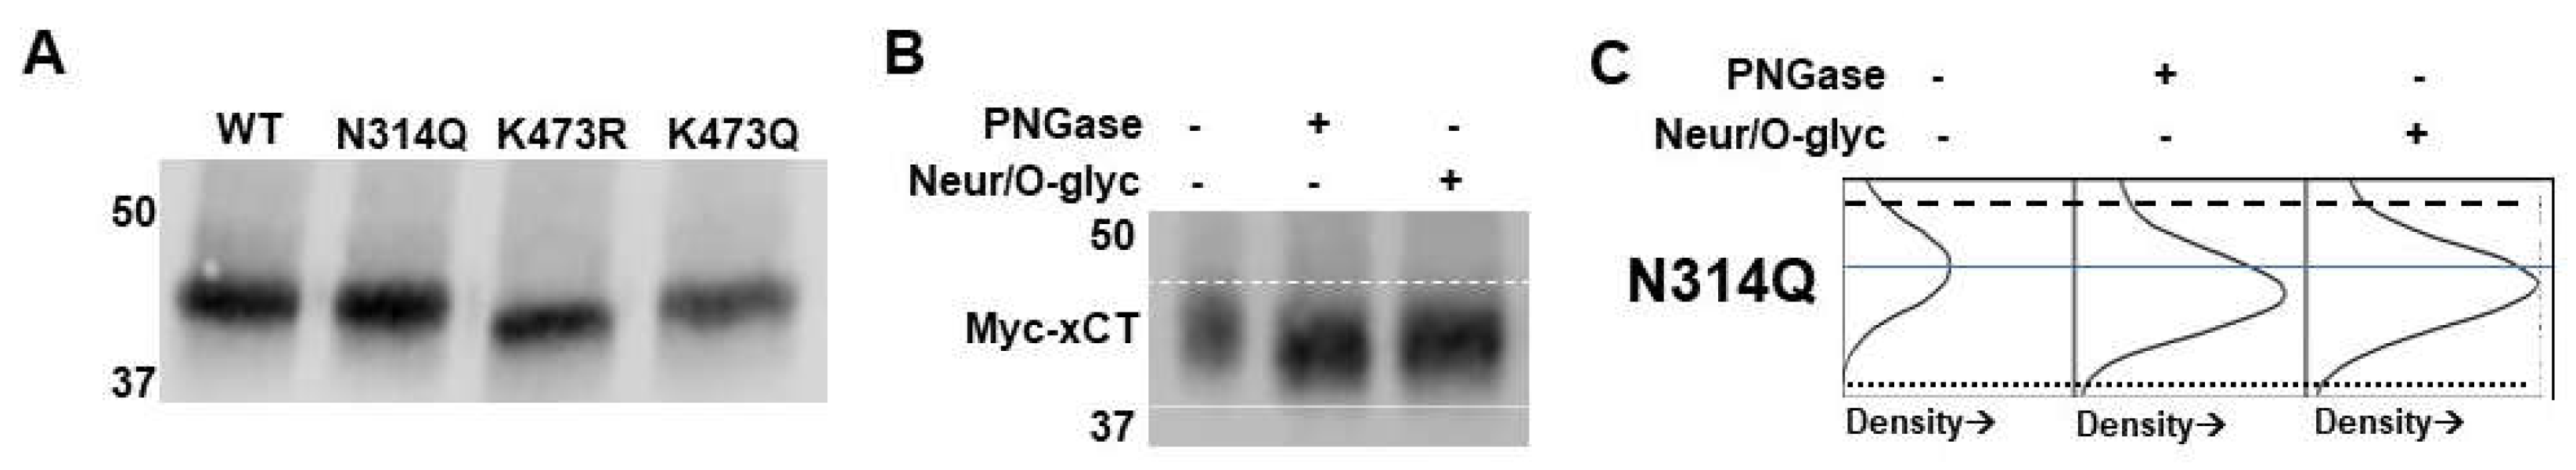
Figure 7.
(A) Immunocytochemistry coupled with confocal microscopy was used to examine the colocalization of WT, K473R and K473Q xCT with PDI, an ER marker. Confocal images show myc-xCT (green), PDI (red), and the Maders colocalization of xCT with PDI (white). (B) Zoom image of area of prominent ER density for each xCT construct indicated by white box in A. (C) Fraction of xCT signal that is colocalized with PDI was calculated by performing a Manders colocalization analysis (*p<0.01).
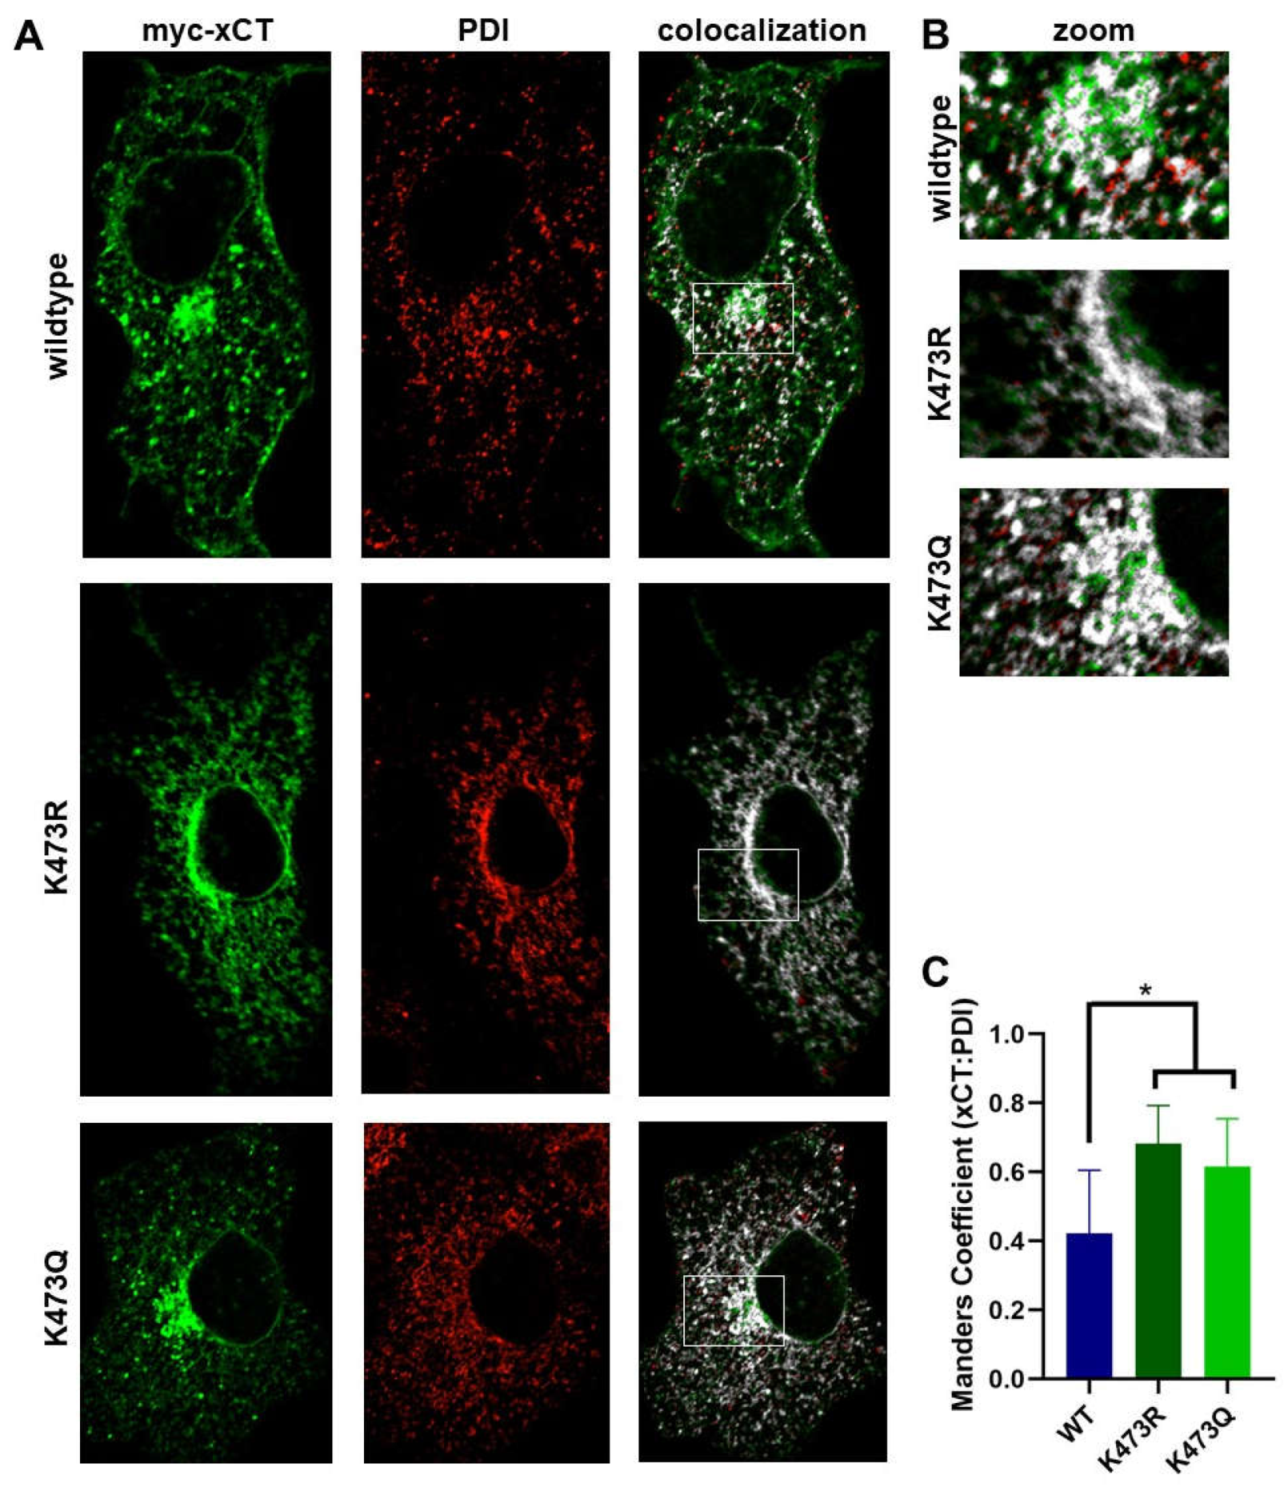
Figure 8.
(A) Immunocytochemistry coupled with confocal microscopy was used to examine the localization of WT, K473R and K473Q with GM130, a Golgi marker. Confocal images show myc-xCT (green), GM130 (red), and Manders colocalization of xCT with GM130 (white). (B) Zoom image of area of membrane at the cell surface with arrows showing areas of high xCT density. (C) Fraction of xCT signal that is colocalized with GM130 was calculated by performing a Manders colocalization analysis (*p<0.01).
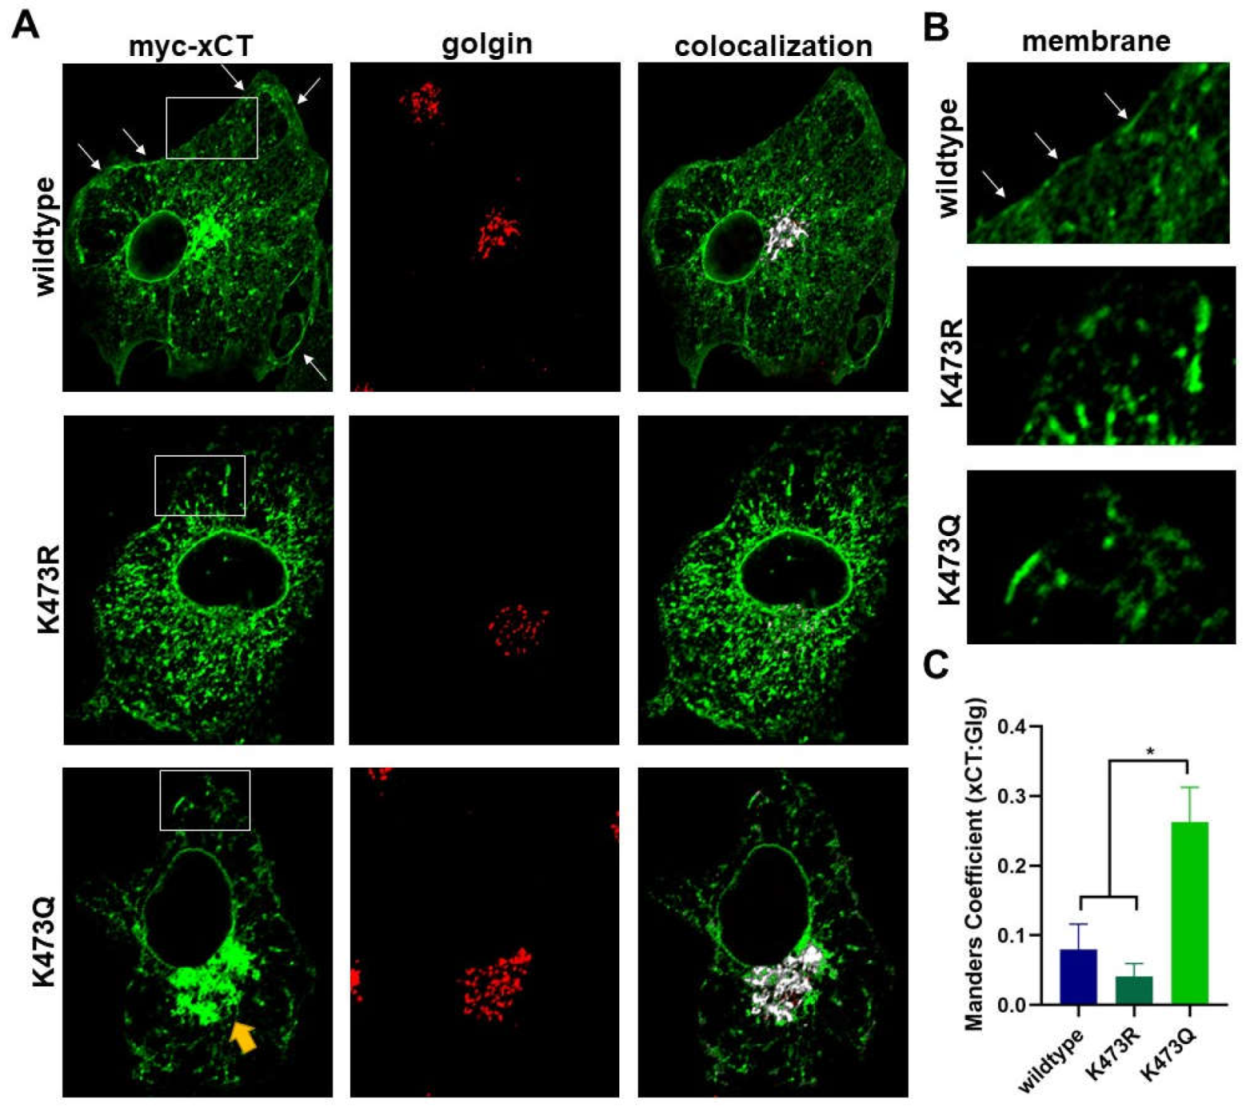
Figure 9.
Model of K473 regulated trafficking of xCT through the biosynthetic pathway.
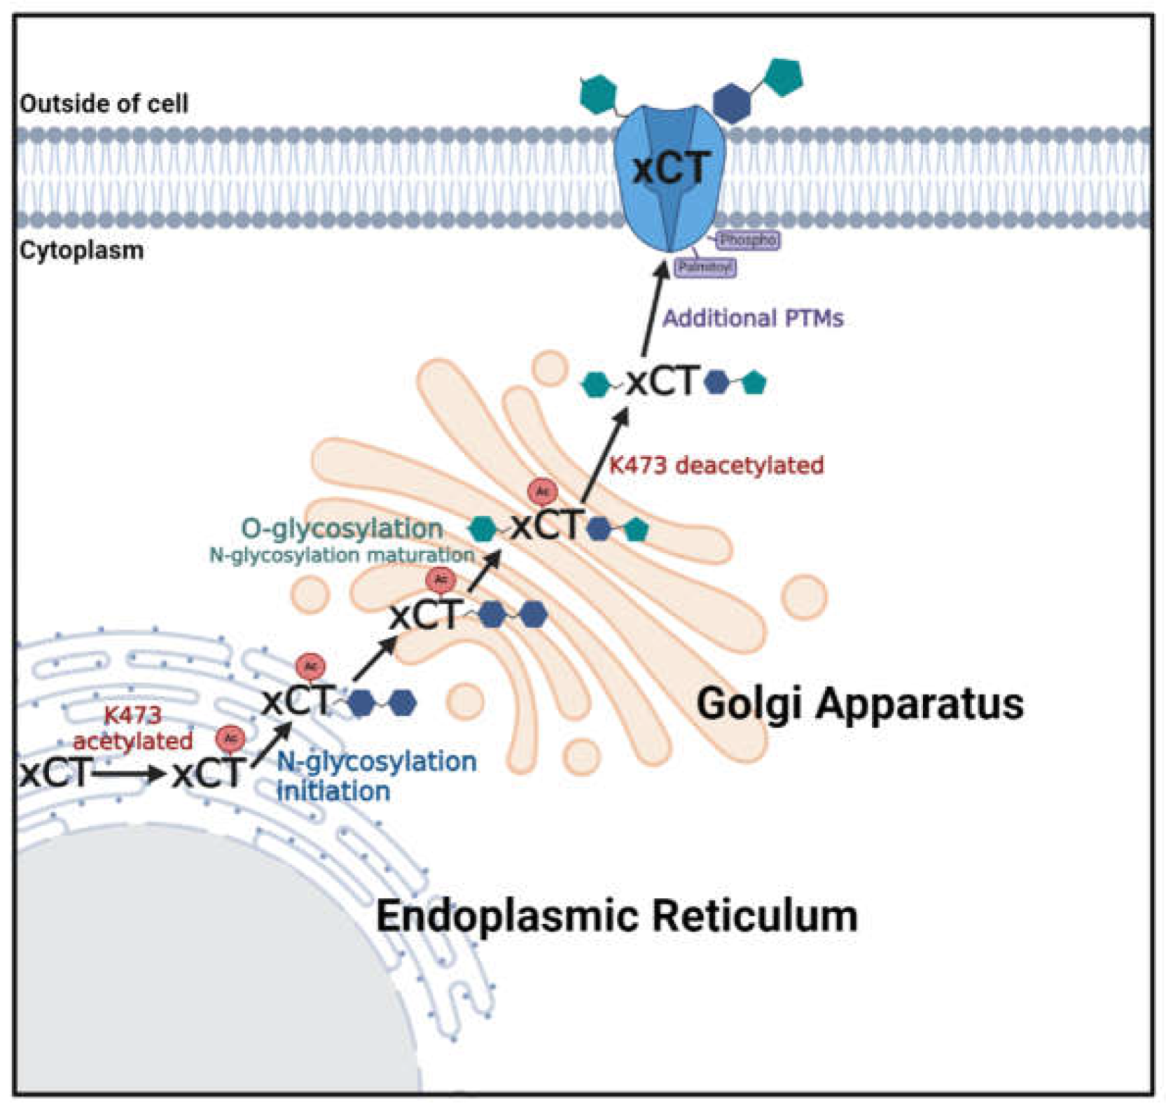

Table 1.
Forward and reverse primer sequences for the creation of xCT mutants.
| Mutant | Forward | Reverse |
|---|---|---|
| K422R | 5’-aacagtggcaccctgaaaggacgatgcatatctggg-3’ | 5’-cccagatatgcatcgtcctttcagggtgccactgtt-3’ |
| K472R | 5’-ttatctctttattatatgggacaggaaacccaggtggtttagaataa-3’ | 5’-aatagagaaataatataccctgttctttgggtccaccaaatcttatt-3’ |
| K473R | 5’-tctaaaccacctgggtctcttgtcccatataataaagagataatac-3’ | 5’-gtattatctctttattatatgggacaagagacccaggtggtttaga-3’ |
| K473Q | 5’-tgacattattctaaaccacctgggctgcttgtcccatataataaagagata-3’ | 5’-tatctctttattatatgggacaagcagcccaggtggtttagaataatgtca-3’ |
| N314Q | 5’-cggaactgctaatgagaactgtcccagtagccgctcaga-3’ | 5’-tctgagcggctactgggacagttctcattagcagttccg-3’ |
Disclaimer/Publisher’s Note: The statements, opinions and data contained in all publications are solely those of the individual author(s) and contributor(s) and not of MDPI and/or the editor(s). MDPI and/or the editor(s) disclaim responsibility for any injury to people or property resulting from any ideas, methods, instructions or products referred to in the content. |
© 2024 by the authors. Licensee MDPI, Basel, Switzerland. This article is an open access article distributed under the terms and conditions of the Creative Commons Attribution (CC BY) license (https://creativecommons.org/licenses/by/4.0/).
Copyright: This open access article is published under a Creative Commons CC BY 4.0 license, which permit the free download, distribution, and reuse, provided that the author and preprint are cited in any reuse.


