
Submitted:
08 August 2024
Posted:
09 August 2024
You are already at the latest version
Abstract
The aim of this study was to quantify methane (CH4) emissions from dairy cows during milking by maximum amplitude of eructation peaks and compare estimates with other metrics for CH4 emissions. Spot measurements of CH4 and carbon dioxide (CO2) emissions were recorded for at least 7 days of continuous sampling using an infrared gas analyser in a robotic milking station whilst cows were milked. Concentrations of CH4 and CO2 were measured at 1 second intervals. A total of 105,701 CH4 spot measurements were obtained from 2,206 dairy cows on 18 farms. Methane emissions per individual cow were quantified by maximum amplitude of eructation peaks, average area under eructation peaks (integral of eructation), average concentration during milking and ratio of CH4 to CO2 concentration. There was a high correlation (r = 0.71) between CH4 emissions quantified by maximum amplitude and integral of eructation peaks. The correlation between maximum amplitude and average CH4 concentration was low, and there was no correlation between maximum amplitude and ratio of CH4 to CO2. As both approaches identify and extract eructation peaks to quantify enteric CH4 emissions, the substantial association between maximum amplitude and eructation integral was expected.
Keywords:
dairy cows
; enteric methane
; eructation
; measurement
1. Introduction
During the last decade, several methods for quantifying CH4 emissions from cattle have been proposed. A common approach used is the “sniffer method” which makes use of sensors that were initially created to find hazardous gas leaks [1]. The sniffer method samples gas at a place that the animal frequently visits such as a feed bin. The aim is to sample the air near the animal’s mouth and nostrils. Sniffer or breath sampling techniques have several advantages over other techniques for large-scale measurement of CH4 emissions by individual animals. After the device is installed, animals are unaware of it and are in their normal surroundings, making sampling non-invasive. There is no need for training, handling, or dietary changes because animals follow their regular pattern, which includes feeding and milking. Equipment is often inexpensive, and operating costs are minimal [1].
Automatic milking stations provide an ideal location to measure CH4 emissions on commercial farms given that all cows visit for milking several times per day and gas measurements can be obtained in a standard way at the feed bin [2]. Furthermore, infrared gas analysers are available that are generally mobile, durable and with high sensitivity (e.g. Nondispersive Infrared (NDIR), Fourier-transform infrared (FTIR), or photoacoustic infrared (PAIR)). Eructations produced by an animal can be detected as large peaks in CH4 concentration by a gas analyser. Detection of peaks to quantify enteric CH4 emissions shows good agreement with respiration chamber measurements of total CH4 production from the same cows [3]. Bell et al. [4] found that CH4 emissions for cows quantified by the integral of an eructation peak had higher repeatability and rank correlation compared to average CH4 concentration and CH4 to CO2 ratio during milking. To test the precision and adoption of eructation peak detection for spot measurement of CH4 emissions, there is a need to evaluate performance of alternative CH4 metrics.
The objective of this study was to quantify CH4 emissions from dairy cows during milking by maximum amplitude of eructation peaks and compare estimates with other metrics for CH4 emissions.
2. Results
Cows in the study had an average lactation number of 2.6 ± 1.9, were milked 2.4 ± 0.8 times per day at robotic milking stations and produced 30.4 ± 9.7 kg of milk per day (mean ± standard deviation). Average CH4 emissions for maximum amplitude of eructation peaks, average CH4 concentration, integral of eructation peaks and ratio CH4 to CO2 are shown in Table 1. There was a higher coefficient of variation for CH4 calculated by maximum amplitude of eructation peaks compared to other metrics.
There was a high correlation (r = 0.71 and CCC = 0.64) between CH4 emissions calculated from integral of eructation peaks and maximum amplitude of eructation peaks (Figure 1).
3. Discussion
Using peak analysis techniques, enteric CH4 obtained from integral and maximum amplitude of eructation peaks in the current study showed a strong association. The association between maximum eructation amplitude with average CH4 concentration and ratio of CH4 to CO2 was weak. Both integral and maximum eructation amplitude use peak analysis approaches to extract features associated with the detection and shape of eructation peaks i.e. rise time and height. The correlation in the current study between average CH4 concentration and ratio of CH4 to CO2 with maximum amplitude of eructation peaks was lower (r = 0.29 and 0.08 respectively) than reported by Bell et al. [4] assessing the rank correlation of CH4 measurements for average CH4 concentration and ratio of CH4 to CO2 in cows fed on a commercial ration (ranging from r = 0.35 to 0.62). The current study used a larger dataset of 2,206 cows across multiple farms compared to the single experimental study of 36 cows by Bell et al. [4].
Approximately 87% to 93% of enteric CH4 emissions, along with other volatile compounds such as CO2, are released by dairy cows through eructation from their mouths and nostrils. Ruminant animals expel rumen gas from digestion of food as large eructations on a regular basis. These emissions from fermentation of food are highest after feeding [5,6]. In the current study, the proximity of the animals’ head to the sampling tube was not measured but the maximum peak amplitude assumes that the eructation produced by a cow, and with the greatest amplitude during a milking, represents the time when the mouth and nostrils of the cow are closest to the sampling tube. This approach therefore accounts for cow head position to obtain a representative spot measurement from the animal being sampled. This approach to eructation peak detection is based on the theory that CH4 pulses expelled by the animal can produce a repeatable and reliable measure of individual CH4 emissions from spot measurements when compared to respiration chamber measurements [3,7,8].
Garnsworthy et al. [3] noted differences in CH4 concentration and frequency of eructation peaks between high and low CH4-emitting cows. Other studies using signal processing and detection of eructation peaks found that dairy cows with high and low enteric CH4 production have distinct CH4 profiles [9]. Cows that produce more CH4 exhibit higher average CH4 concentrations and more frequent eructation peaks than cows with lower CH4 production [10]. To effectively analyse large datasets, identify hidden trends in CH4 emissions, develop accurate estimation models, and facilitate real-time monitoring and updates, machine learning and artificial intelligence techniques hold significant potential [11,12,13,14,15].
4. Materials and Methods
Approval for this study was obtained from the Animal Welfare and Ethical Review Body of the University of Nottingham (approval number 30/3210). Data used were from previous research collecting CH4 measurements across commercial farms [16].
4.1. Data
A total of 105,701 CH4 spot measurements were collected from 2,206 dairy cows across 17 commercial farms (Farms A to Q) and the University of Nottingham (Farm R) in the UK (Table 2). Measurements were obtained between December 2009 and December 2013. The majority of the study's cows were Holstein-Friesian breeds. The diets provided to cows were categorised as either a partial mixed ration (PMR; conserved forage and concentrate feed) or a PMR with pasture that had been grazed. The CO2 and CH4 concentrations were only recorded simultaneously at farm R. The cows were fed ad libitum. During milking, concentrate feed was supplied to each cow to correspond with her daily milk production. Live weight, milk output, and robot concentrate consumption were recorded automatically at every milking. Eleven farms fed PMR and 7 farms fed a PMR with grazing (farms A to R).
4.2. Gas Sampling
A sniffer approach was used to measure CH4 and CO2 concentrations in the feed bin of robotic milking stations whilst dairy cows was being milked (Figure 4). Gas measurements were recorded for at least 7 days continuously at 1 second intervals using a data logger (Simex SRD-99; Simex Sp. Z o.o., Gdańsk, Poland) connected to an infrared gas analyser (Guardian SP; Edinburgh Instruments Ltd., Livingston, UK). Before each monitoring period, each analyser was calibrated using standard mixtures of CH4 in nitrogen (0.0, 0.25, 0.50, 0.75, and 1.0% CH4; Thames Restek UK Ltd., Saunderton, UK).
Time series gas measurement during milking was aligned to when each individual cow visited the robotic milking station using milking station records. A single infrared CH4 analyser was used with each automatic milking station. Each gas analyser had a range of 0 to 1% for CH4 or 0 to 5% for CO2 concentrations. Between the gas entry port and the analyser, an integrated pump drew air through the apparatus. A 3 m long, 8 mm diameter polyethylene tube attached to the analyser’s gas inlet port was used to constantly sample air at a rate of 1 L/min from the feed bins in the milking stations. The analyser’s exhaust port was vented into the atmosphere at least 3 metres away from every sample location. An inline combination particle filter and water separator (Air-Pro IF-14; Flotec Industrial Ltd., Loughborough, UK) was installed about 50 cm from the analyser inlet port on the sample tube. The sample tube’s inlet end was placed at the back of the milking station’s feed bin. Although feed bin design can vary in milking stations, all stations had a trough that was about 50 cm wide by 50 cm long and 25 cm deep into which concentrates were delivered by a chute that was about 8 cm in diameter.
4.3. Gas Measurements
The maximum amplitude of eructation peaks, area under eructation peaks (integral of eructation), average CH4 concentration and ratio of CH4 to CO2 were extracted from the time series gas concentration (Figure 5).
Maximum amplitude of eructation peaks, area under eructation peaks and average CH4 concentration were obtained for all spot measurements. Concentration of CO2 was only measured at Farm R and provided 2,474 spot measurements with CO2 concentration measured at the same time as CH4 concentration. Background concentration of both gases during milking was assumed to be the lowest gas concentration and were subtracted from the average concentration recorded.
4.3.1. Maximum Eructation Amplitude
Maximum peak amplitude was extracted from measured CH4 concentration using signal processing peak analysis tools in MatLab Signal Processing Toolbox (version R2018a, The MathWorks, Inc., Natick, United States). The rationale for this approach was that maximum amplitude should correspond to an eructation when the cow had its nose closest to the sampling tube, thus reducing variation in CH4 measurements due to head position as proposed by Bell et al. [5]. The peak analysis tools identify eructation peaks using the findpeak function. Maximum peak amplitude of an eructation peak also removed background CH4 concentration. Rise time to maximum peak was also determined. Filters were applied to data to prevent detection of the same peak more than once, with a minimum peak amplitude of 100 ppm and a minimum peak separation of 10 seconds. Given that the analyser needs 60 seconds to reach the "real" peak asymptote and finish processing the gas sample, all extracted emission rates (in grams per minute) during milking were scaled to estimated emissions based on the exponential increase in gas concentration and the extracted rise time for eructation peaks by Equation (1) as:
CH4 emission rate (g/min) = maximum peak amplitude (ppm)/ [1- EXP ( -( peak rise for amplitude in seconds /60))] x 60 x 0.706 x 10-6
Measurements were converted to emission rate in grams per minute by multiplying by 60 and density of CH4, assumed to be 0.706 × 10⁻⁶ g/L.
4.3.2. Integral of Eructation
Average area under eructation peaks of three or more eructations per milking were calculated as the integral of peak concentrations in mg/L per minute multiplied by frequency of eructation peaks per minute to calculate concentration of CH4 produced by the cow in mg/L. A custom-designed program developed by Garnsworthy et al. [3] extracted the integral of peaks and peak frequency. Milkings with less than three eructation peaks were excluded from analysis. Peaks that rose less than 200 mg/kg above baseline were excluded. Eructation frequency and integral were calculated for every milking. The product of calculated mean integral and eructation frequency was used to compute CH4 emission index during each milking per cow in mg/L [3].
4.3.3. Average Concentration and Ratio of CH4 to CO2
Average concentrations of CH4 and CO2 emitted in ppm during each milking were calculated by subtracting minimum concentration at the start of the milking from average concentration during each milking. Ratio of CH4 to CO2 concentrations was then calculated by dividing average CH4 concentration by average CO2 concentration.
4.4. Statistical Analysis
Data were analysed using Genstat Version 21.1 (VSN International, Hemel Hempstead, UK) VSN, Hemel Hempstead, UK). Relationships between CH4 spot measurement metrics were assessed using Pearson correlation coefficient (r), Lin’s bias correction factor (rb), and concordance correlation coefficient (CCC). The concordance correlation coefficient (CCC) was obtained by multiplying coefficient r by Lin’s bias correction factor (rb), which assesses how far the best-fit line deviates from the 45° line through the origin [17].
5. Conclusions
In this study, four enteric CH4 emission metrics for dairy cow were compared. Methane emissions computed using maximum peak amplitude and integral of eructation peaks showed a high positive correlation. There was a low positive correlation between peak analysis measures and average CH4 concentration or CH4 to CO2 ratio. The correlation between integral CH4 peak analysis and maximum amplitude CH4 peak analysis was anticipated given both methods detect and extract eructation peaks to estimate enteric CH4 emissions.
Author Contributions
Conceptualization, A.H., M.J.B. and P.C.G.; methodology, A.H., M.J.B. and P.C.G.; software, A.H. and M.J.B.; formal analysis, A.H.; investigation, A.H.; resources, A.H., M.J.B. and P.C.G.; data curation, A.H.; writing—original draft preparation, A.H., M.J.B. and P.C.G.; writing review and editing, A.H., M.J.B. and P.C.G.; supervision, M.J.B. and P.C.G.; project administration, M.J.B.; funding acquisition, A.H. All authors have read and agreed to the published version of the manuscript.
Funding
The Sultanate of Oman through a postgraduate studentship funded this research (Reference number PGE051154). Collection of original CH4 data was funded by Department for Environment, Food and Rural Affairs (Defra, London, UK), the Scottish Government (Edinburgh, UK), Department of Agriculture and Rural Development (DARD, Belfast, UK), and the Welsh Government (Cardiff, UK) as part of the UK Agricultural Greenhouse Gas (GHG) Research Platform project (Project AC0115).
Institutional Review Board Statement
All animal work was carried out under the authority of the UK Animals Scientific Procedures Act (1986), within Project Licence number 30/3210. Approval for the work was obtained prior to commencement, from the University of Nottingham Animal Welfare and Ethical Review Body.
Informed Consent Statement
Although this study did not involve human subjects, informed consent was obtained from all farmers for use of their anonymised farm data in analyses.
Data Availability Statement
The datasets analysed are available from the corresponding author on request.
Acknowledgments
We are grateful to the farms for allowing data collection, and to the technical team for their help to collect the data.
Conflicts of Interest
The authors declare no conflict of interest. The funders had no role in the design of the study; in the collection, analysis, or interpretation of data; in the writing of the manuscript; or in the decision to publish the results.
References
- Garnsworthy, P.C.; Difford, G.F.; Bell, M.J.; Bayat, A.R.; Huhtanen, P.; Kuhla, B.; Lassen, J.; Peiren, N.; Pszczola, M.; Sorg, D.; et al. Comparison of Methods to Measure Methane for Use in Genetic Evaluation of Dairy Cattle. Animals 2019, 9, 837. [Google Scholar] [CrossRef] [PubMed]
- Negussie, E.; Lehtinen, J.; Mäntysaari, P.; Bayat, A.R.; Liinamo, A.-E.; Mäntysaari, E.A.; Lidauer, M.H. Non-invasive individual methane measurement in dairy cows. Animal 2017, 11, 890–899. [Google Scholar] [CrossRef] [PubMed]
- Garnsworthy, P.C.; Craigon, J.; Hernandez-Medrano, J.H.; Saunders, N. On-farm methane measurements during milking correlate with total methane production by individual dairy cows. J. Dairy Sci. 2012, 95, 3166–3180. [Google Scholar] [CrossRef] [PubMed]
- Bell, M.J.; Saunders, N.; Wilcox, R.H.; Homer, E.M.; Goodman, J.R.; Craigon, J.; Garnsworthy, P.C. Methane emissions among individual dairy cows during milking quantified by eructation peaks or ratio with carbon dioxide. J. Dairy Sci. 2014, 97, 6536–6546. [Google Scholar] [CrossRef] [PubMed]
- Bell, M.J.; Garnsworthy, P.C.; Mallis, D.; Eckard, R.; Moate, P. Modified approach to estimating daily methane emissions of dairy cows by measuring filtered eructations during milking. J. Sustain. Organ. Agric. Syst. 2019, 69, 47–56. [Google Scholar]
- Crompton, L.; Mills, J.; Reynolds, C.; France, J. Fluctuations in methane emission in response to feeding pattern in lactating dairy cows. In Modelling Nutrient Digestion and Utilisation in Farm Animals; Sauvant, D., Van Milgen, J., Faverdin, P., Friggens, N., Eds.; Wageningen Academic Publishers: Wageningen, The Netherlands, 2011; pp. 176–180. [Google Scholar]
- Kebreab, E.; Clark, K.; Wagner-Riddle, C.; France, J. Methane and nitrous oxide emissions from Canadian animal agriculture: A review. Can. J. Anim. Sci. 2006, 86, 135–157. [Google Scholar] [CrossRef]
- Bell, M.; Eckard, R. Reducing enteric methane losses from ruminant livestock—Its measurement, prediction and the influence of diet; Tech Publishing: Rijeka, Croatia, 2012; pp. 135–150. [Google Scholar]
- Hardan, A.; Garnsworthy, P.C.; Bell, M.J. Detection of Methane Eructation Peaks in Dairy Cows at a Robotic Milking Station Using Signal Processing. Animals 2022, 12, 26. [Google Scholar] [CrossRef] [PubMed]
- Bošnjaković, D.; Kirovski, D.; Prodanović, R.; Vujanac, I.; Arsić, S.; Stojković, M.; Dražić, S.; Nedić, S.; Jovanović, L. Methane Emission and Metabolic Status in Peak Lactating Dairy Cows and Their Assessment Via Methane Concentration Profile. Acta Vet. 2023, 73, 71–86. [Google Scholar] [CrossRef]
- Jeong, S.; Fischer, M.L.; Breunig, H.; Marklein, A.R.; Hopkins, F.M.; Biraud, S.C. Artificial intelligence approach for estimating dairy methane emissions. Environ. Sci. Technol. 2022, 56, 4849–4858. [Google Scholar] [CrossRef] [PubMed]
- Toyao, T.; Suzuki, K.; Kikuchi, S.; Takakusagi, S.; Shimizu, K.; Takigawa, I. Toward effective utilization of methane: Machine learning prediction of adsorption energies on metal alloys. J. Phys. Chem. C 2018, 122, 8315–8326. [Google Scholar] [CrossRef]
- Goodfellow, I.; Bengio, Y.; Courville, A. Deep Learning; MIT Press: Cambridge, MA, USA, 2016. [Google Scholar]
- Liu, Y.; Esan, O.C.; Pan, Z.; An, L. Machine learning for advanced energy materials. Energy AI 2021, 3, 100049. [Google Scholar] [CrossRef]
- Ghassemi Nejad, J.; Ju, M.S.; Jo, J.H.; Oh, K.H.; Lee, Y.S.; Lee, S.D.; Lee, H.G. Advances in Methane Emission Estimation in Livestock: A Review of Data Collection Methods, Model Development and the Role of AI Technologies. Animals 2024, 14, 435. [Google Scholar] [CrossRef] [PubMed]
- Bell, M.J.; Potterton, S.L.; Craigon, J.; Saunders, N.; Wilcox, R.H.; Hunter, M.; Goodman, J.R.; Garnsworthy, P.C. Variation in enteric methane emissions among cows on commercial dairy farms. Animal 2014, 8, 1540–1546. [Google Scholar] [CrossRef] [PubMed]
- Lin, L.; Torbeck, L.D. Coefficient of accuracy and concordance correlation coefficient: new statistics for methods comparison. PDA J. Pharm. Sci. Technol. 1998, 52, 55–59. [Google Scholar] [PubMed]
Figure 1.
Relationship between integral CH4 (mg/L) and maximum CH4 amplitude (g/min) of eructation peaks. Data points are means for individual cows; line and equation are linear regression between variables; r = simple correlation coefficient; rb = Lin’s bias correction factor; CCC = Lin’s concordance correlation coefficient.
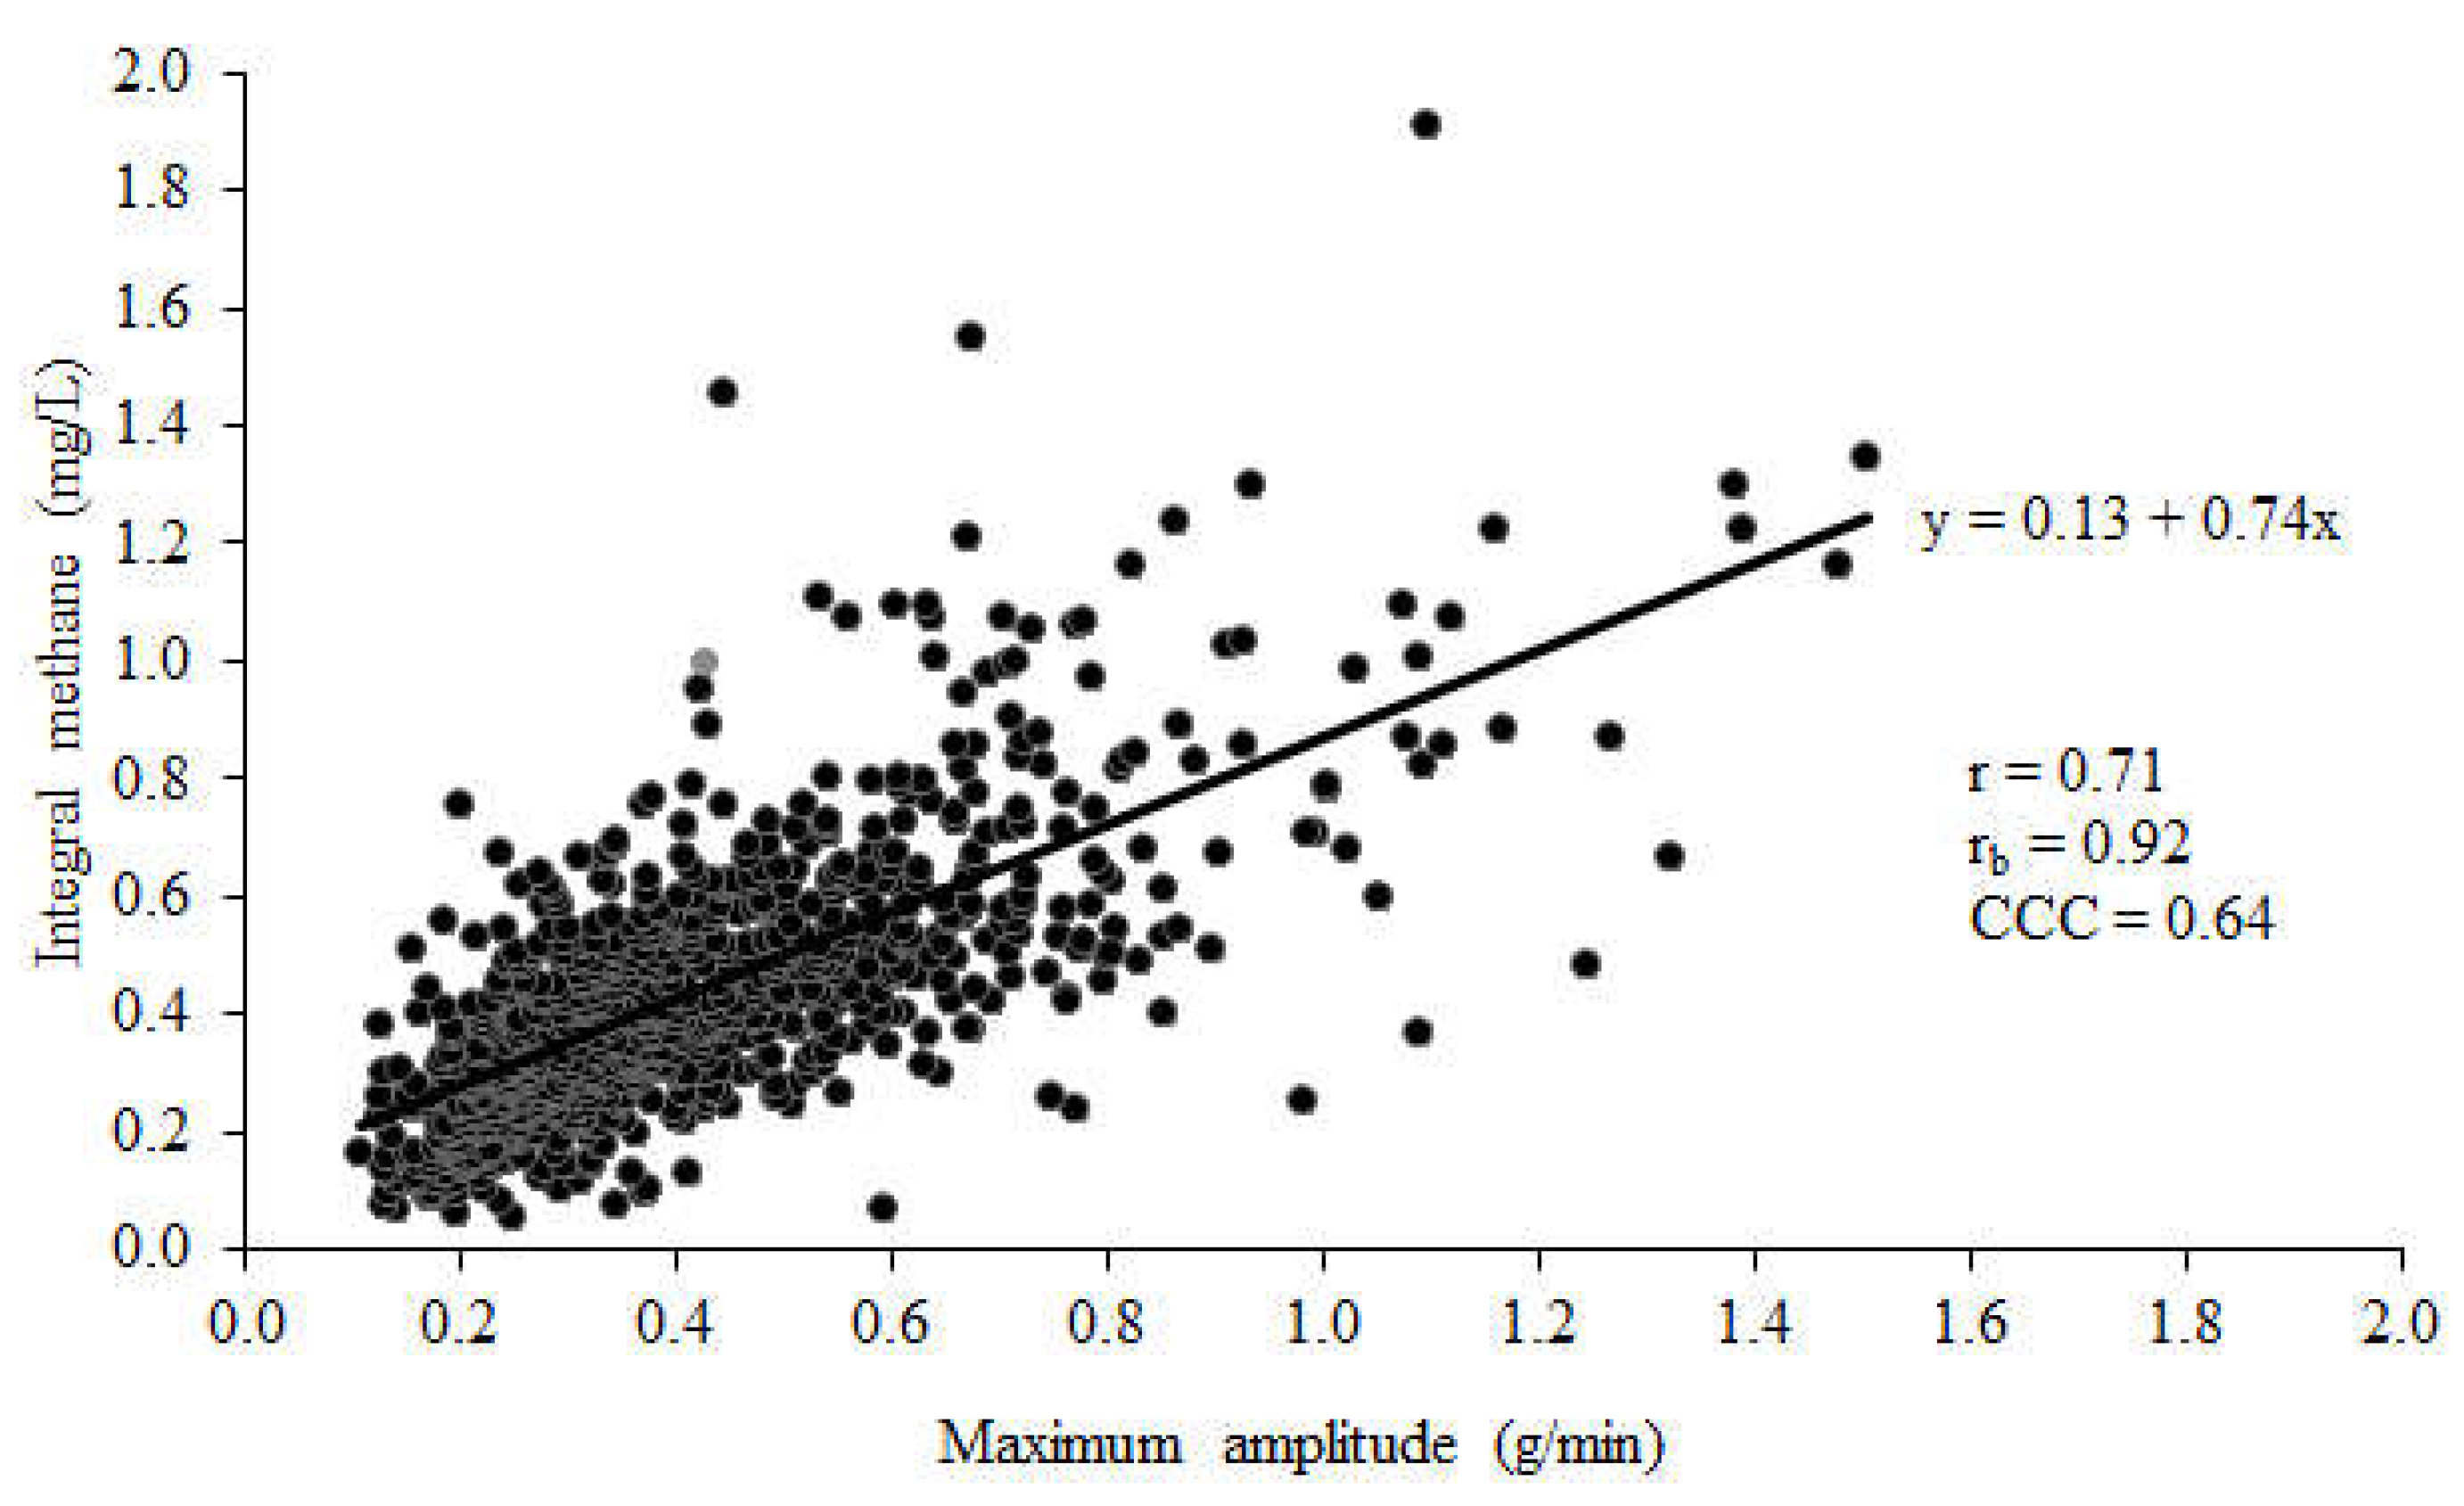
Figure 2.
Relationship between CH4 emissions calculated from average CH4 concentration (ppm) and maximum amplitude of eructation peaks (g/min). Data points are means for individual cows; line and equation are linear regression between variables; r = simple correlation coefficient; rb = Lin’s bias correction factor; CCC = Lin’s concordance correlation coefficient.
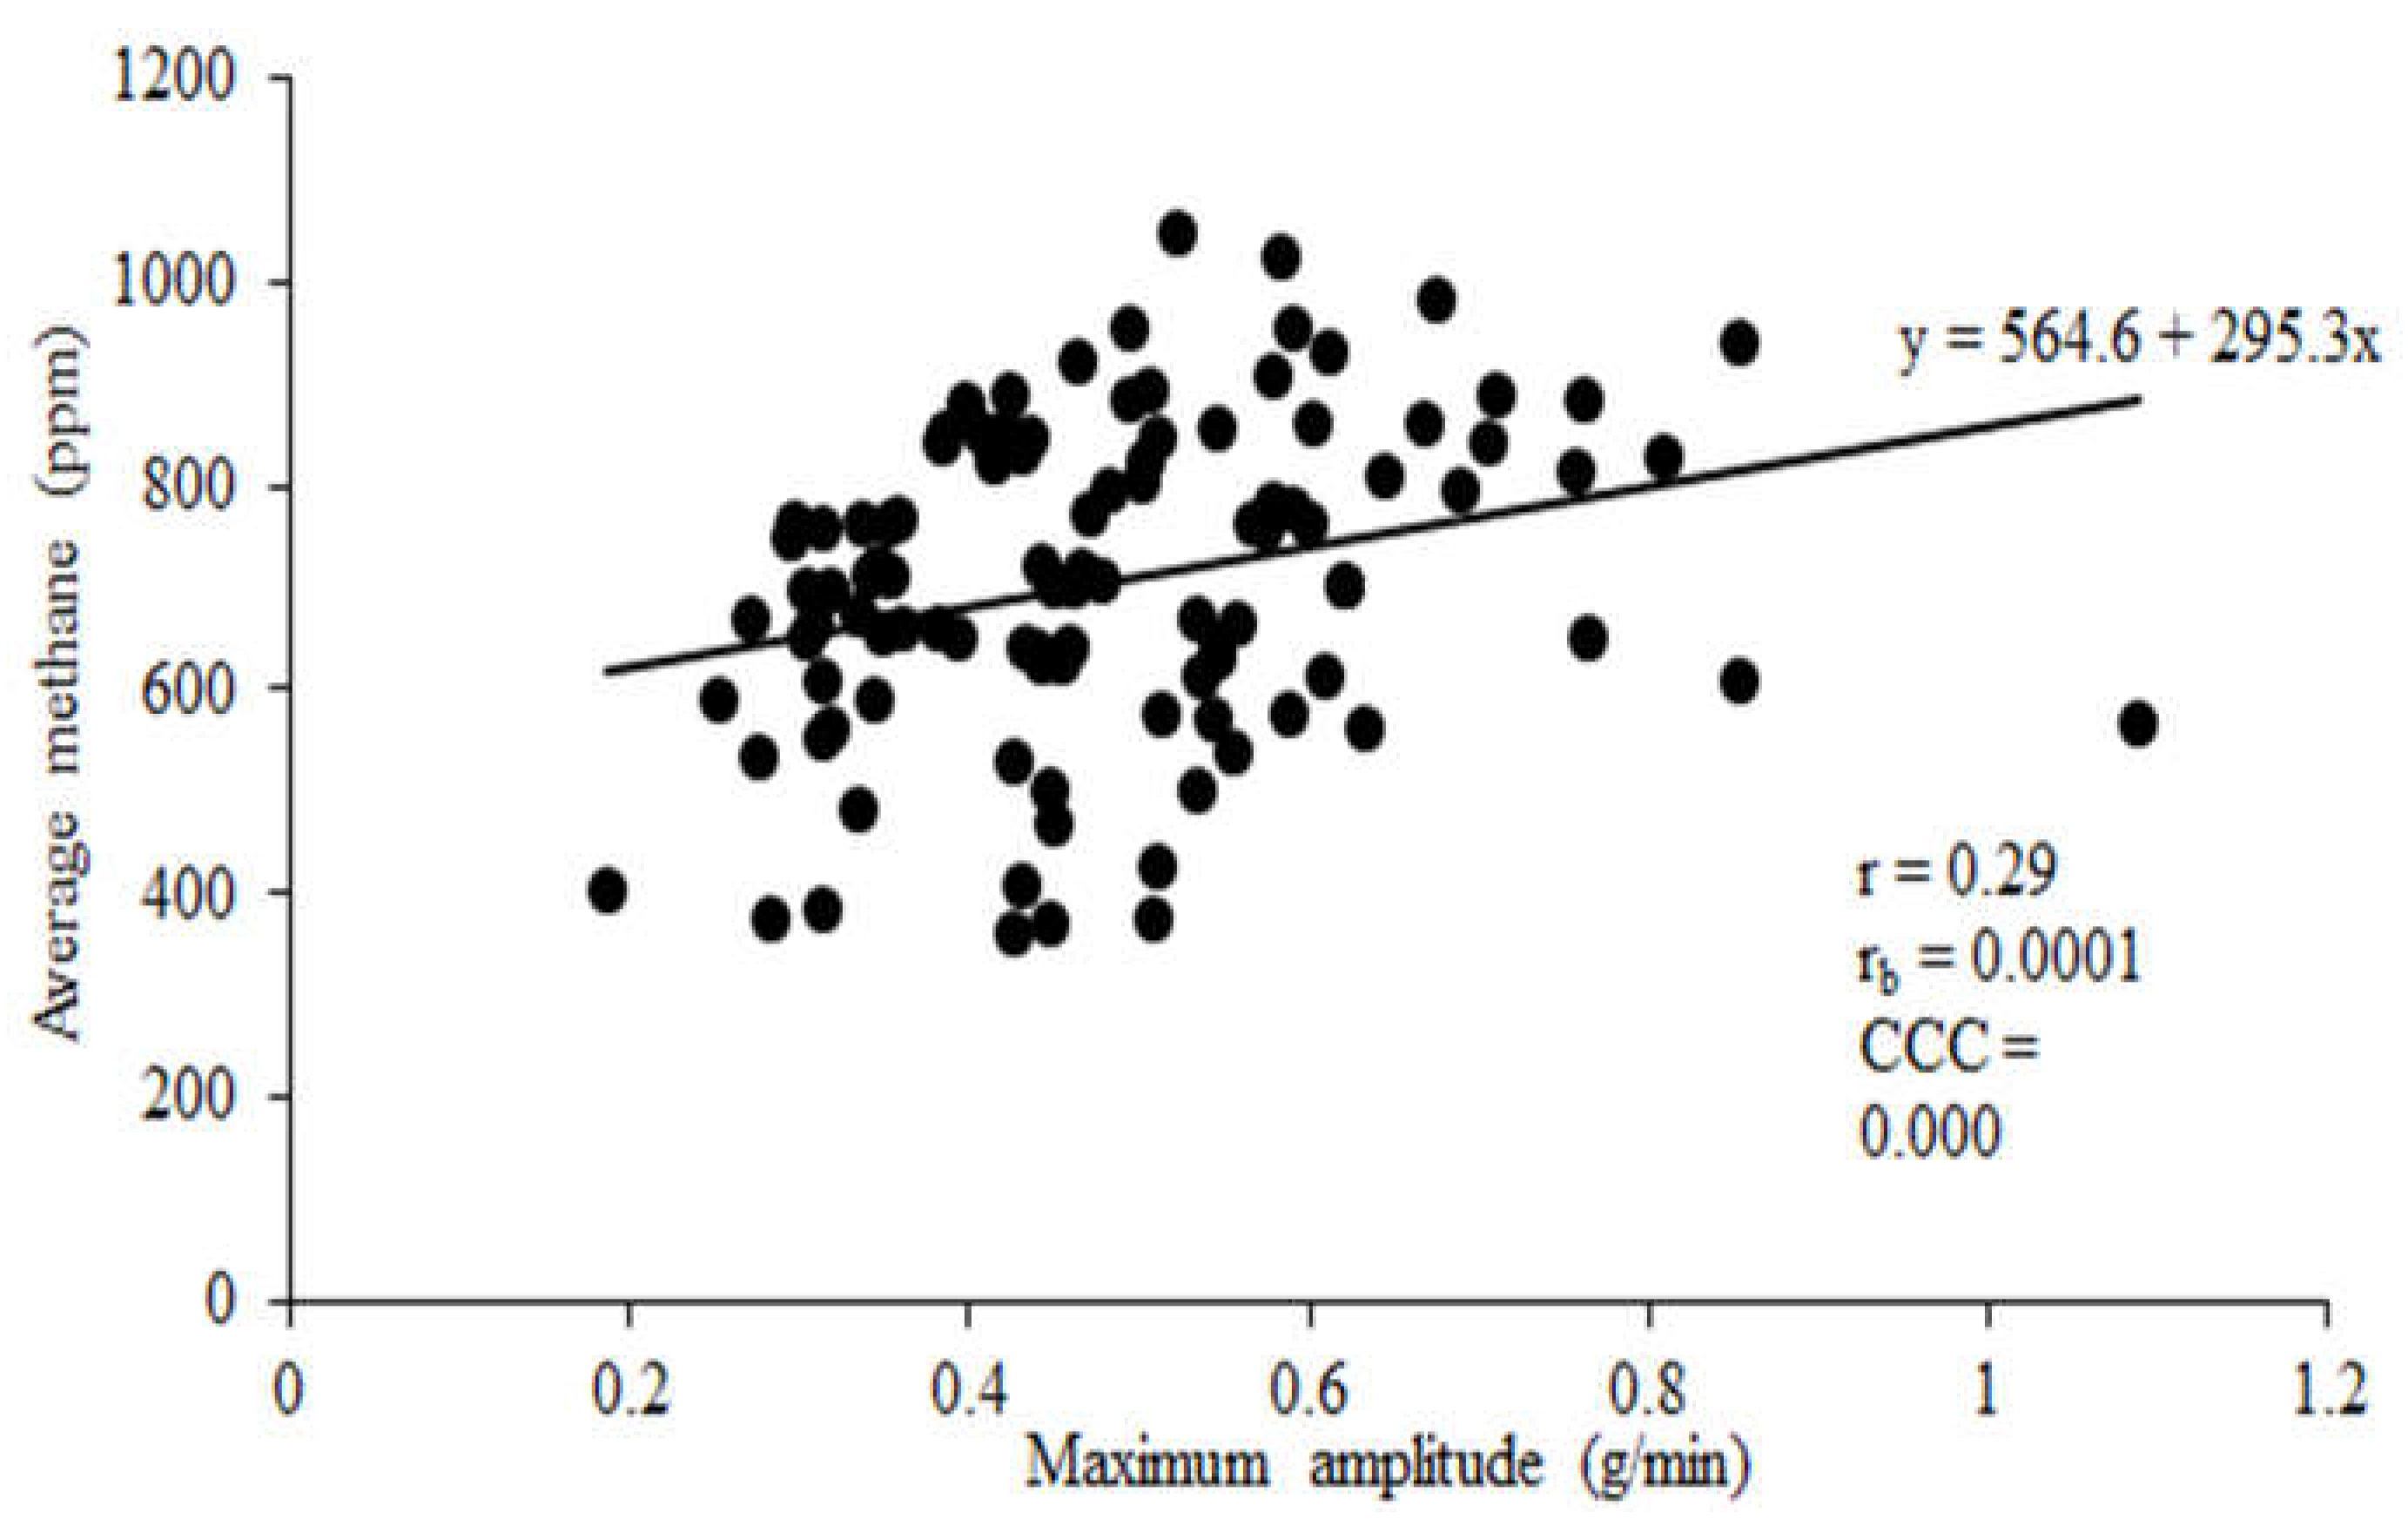
Figure 3.
Relationship between CH4 emissions calculated from the ratio of CH4 to CO2 concentrations and maximum amplitude of eructation peaks (g/min). Data points are means for individual cows; line and equation are linear regression between variables; r = simple correlation coefficient; rb = Lin’s bias correction factor; CCC = Lin’s concordance correlation coefficient.
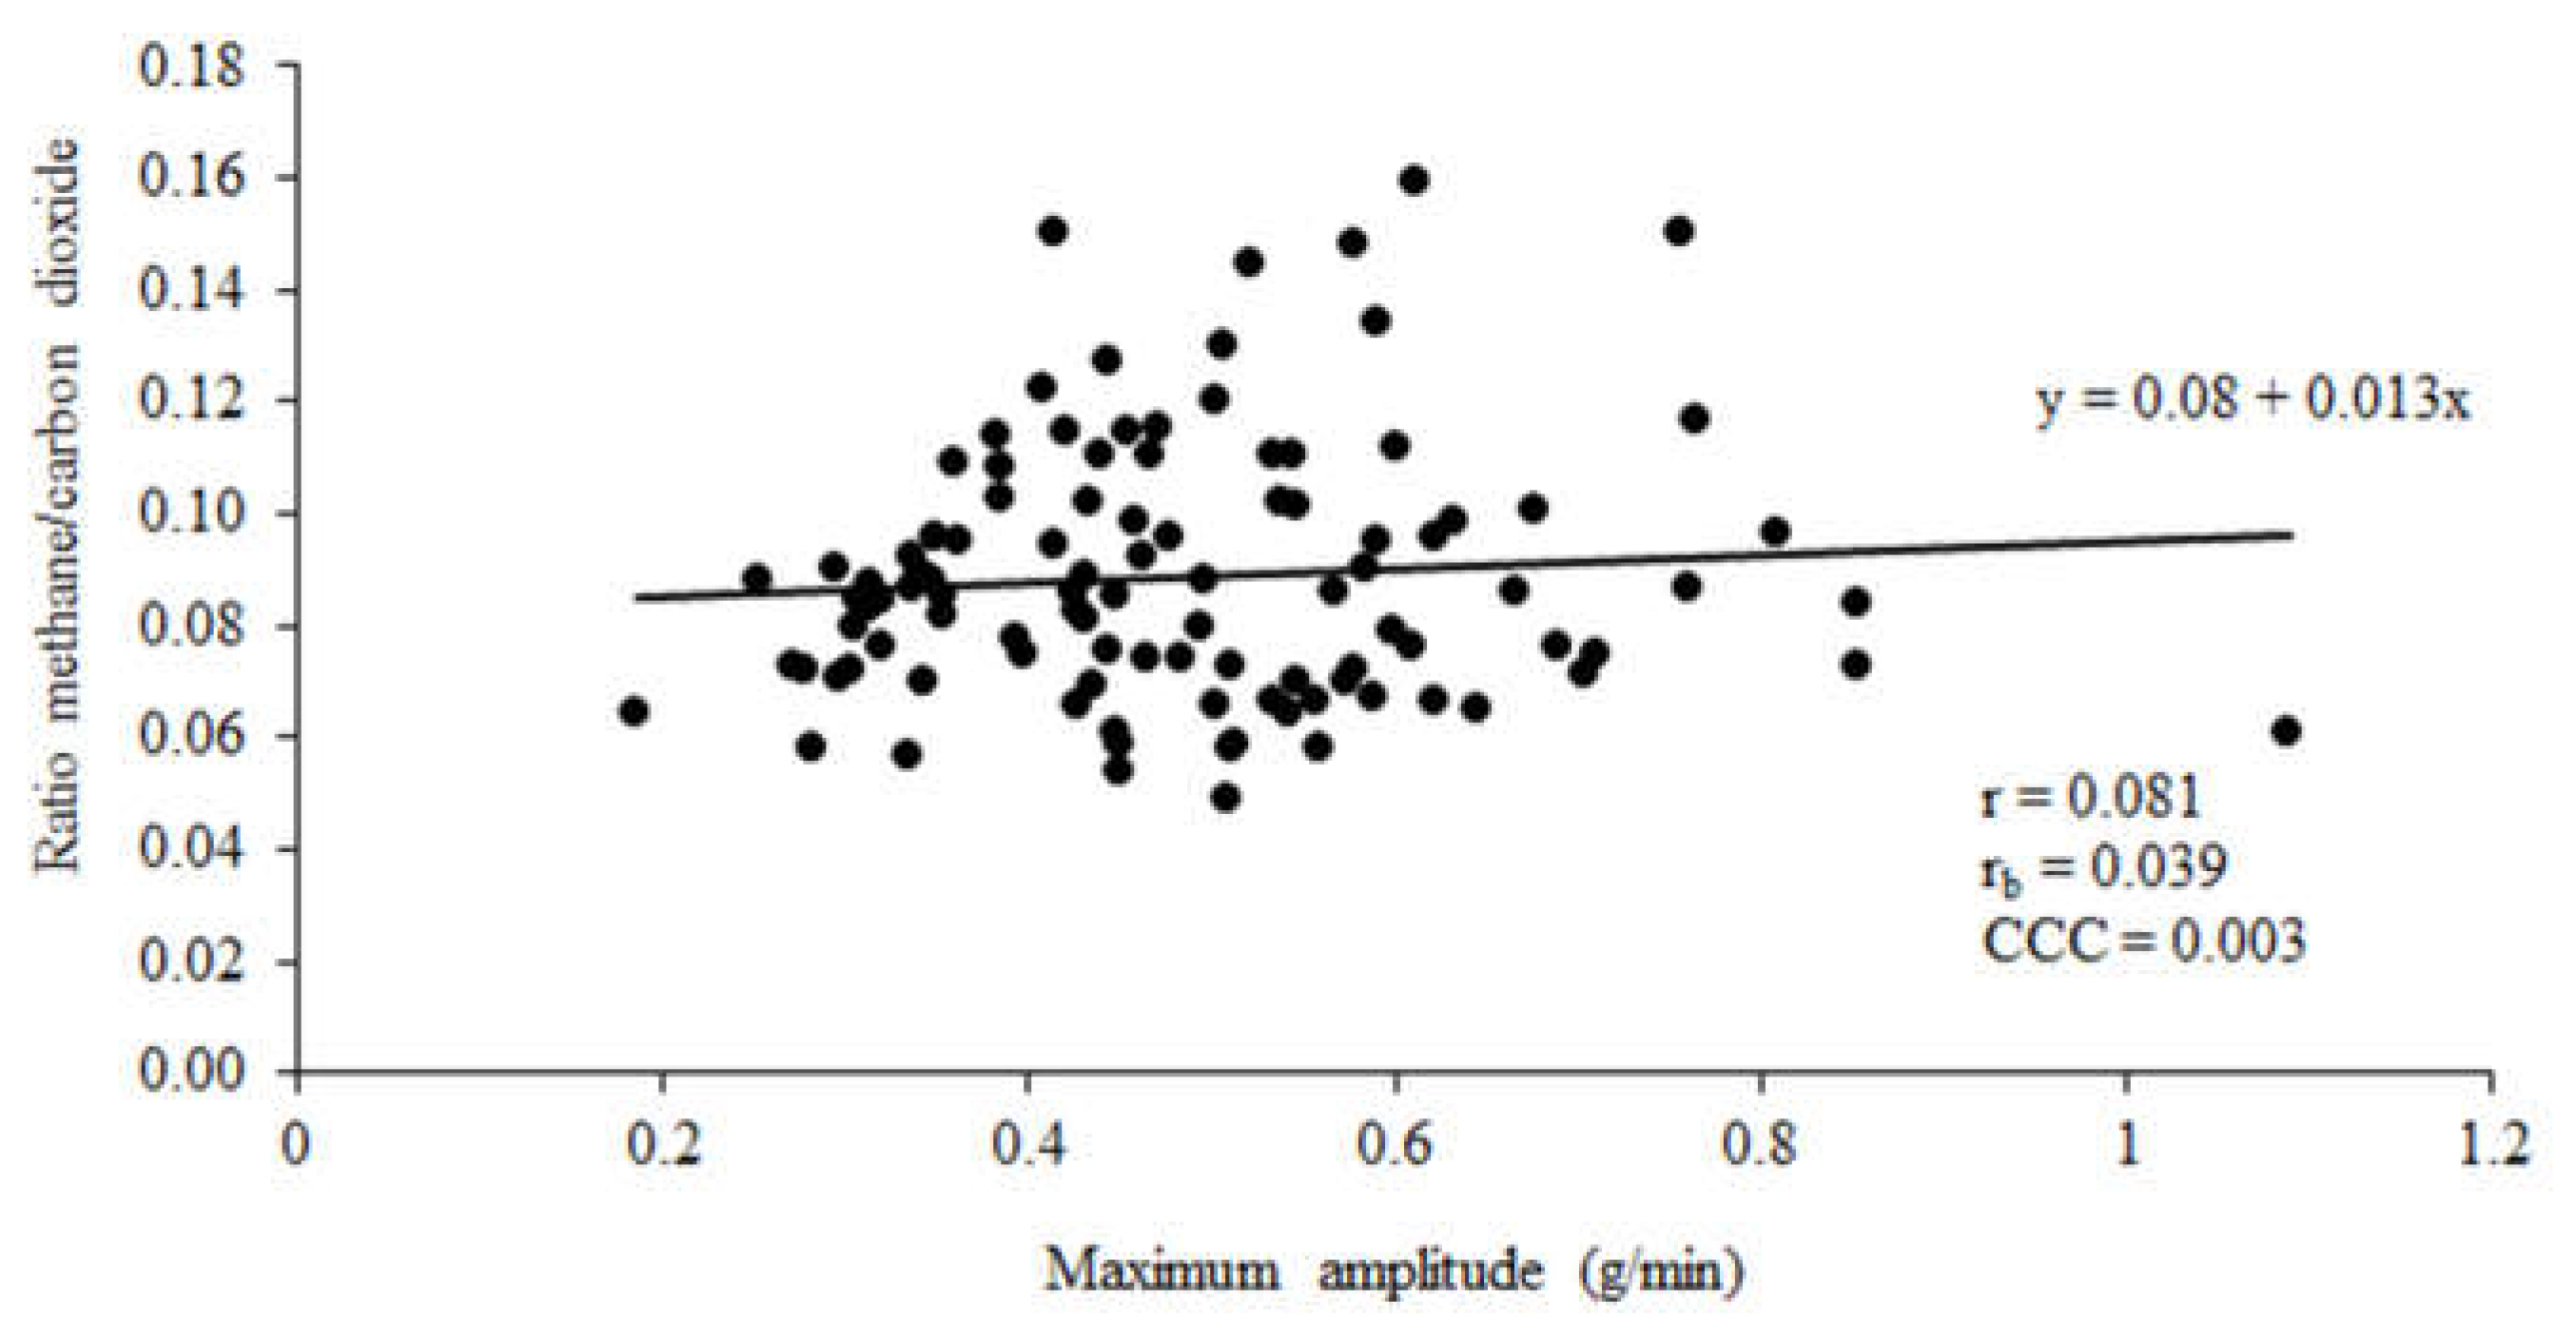
Figure 4.
Spot measurements of enteric CH4 emissions obtained in the feed bin of a robotic milking station whilst a cow is being milked.
Figure 4.
Spot measurements of enteric CH4 emissions obtained in the feed bin of a robotic milking station whilst a cow is being milked.
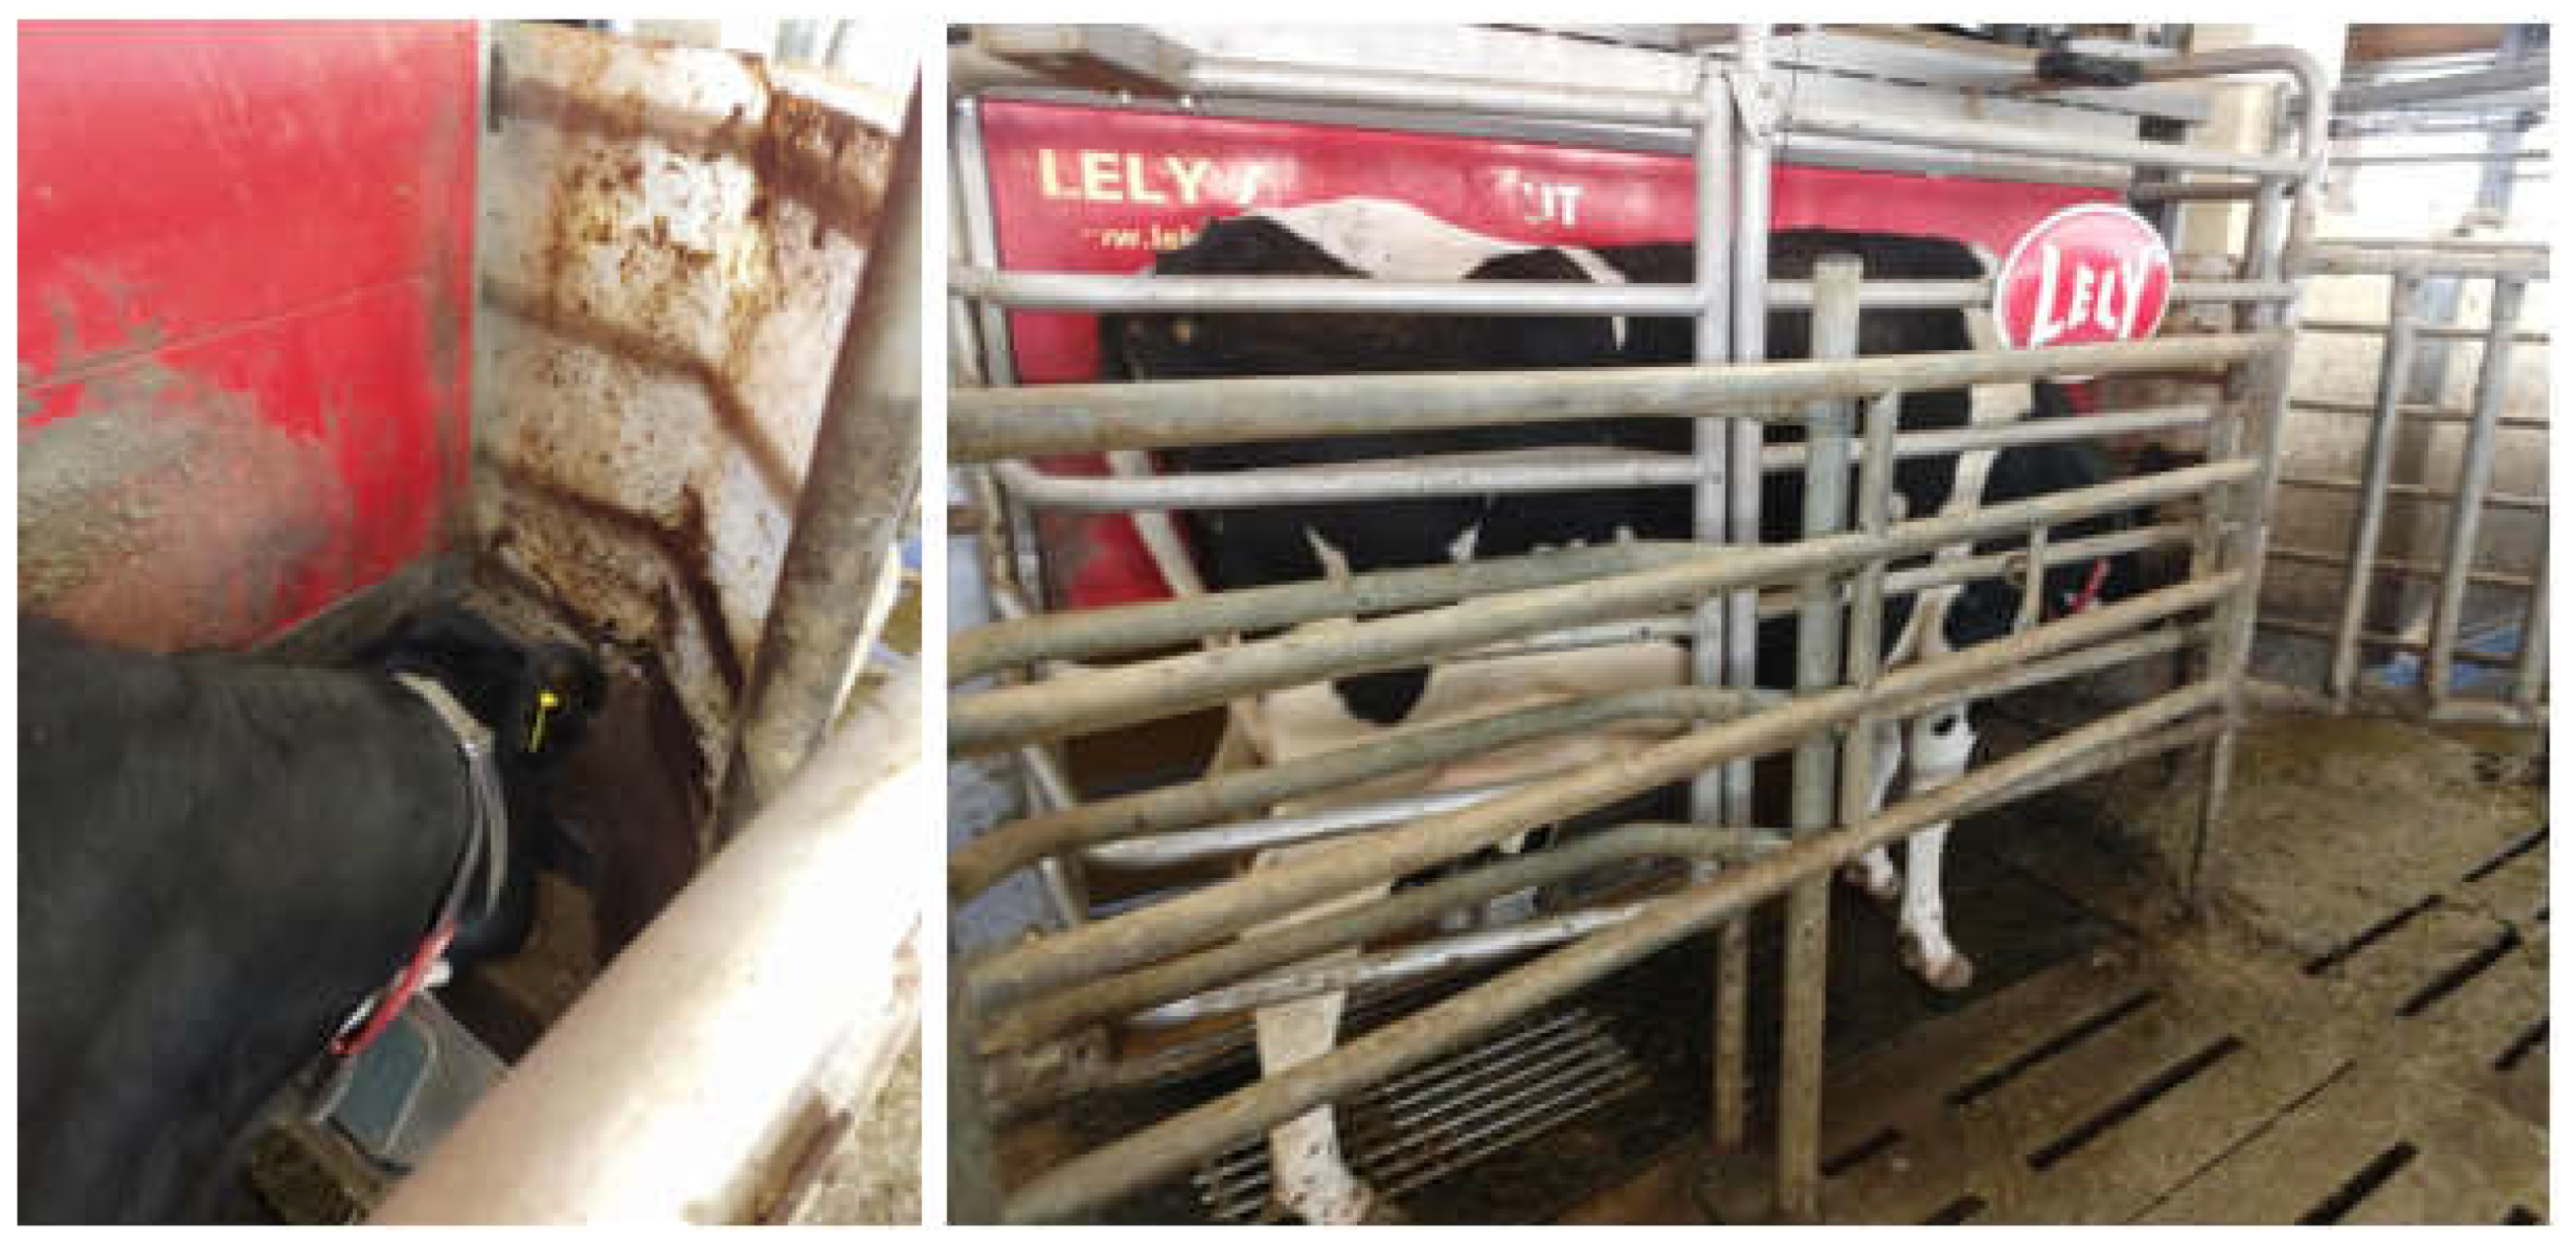
Figure 5.
Maximum peak amplitude (solid black line with arrow) and area under peaks (solid black area) are shown on a CH4 concentration profile in eructated gas for a single cow during milking. Within each milking period, background concentrations were retrieved (dashed black line), and average concentration during this time [5,9].
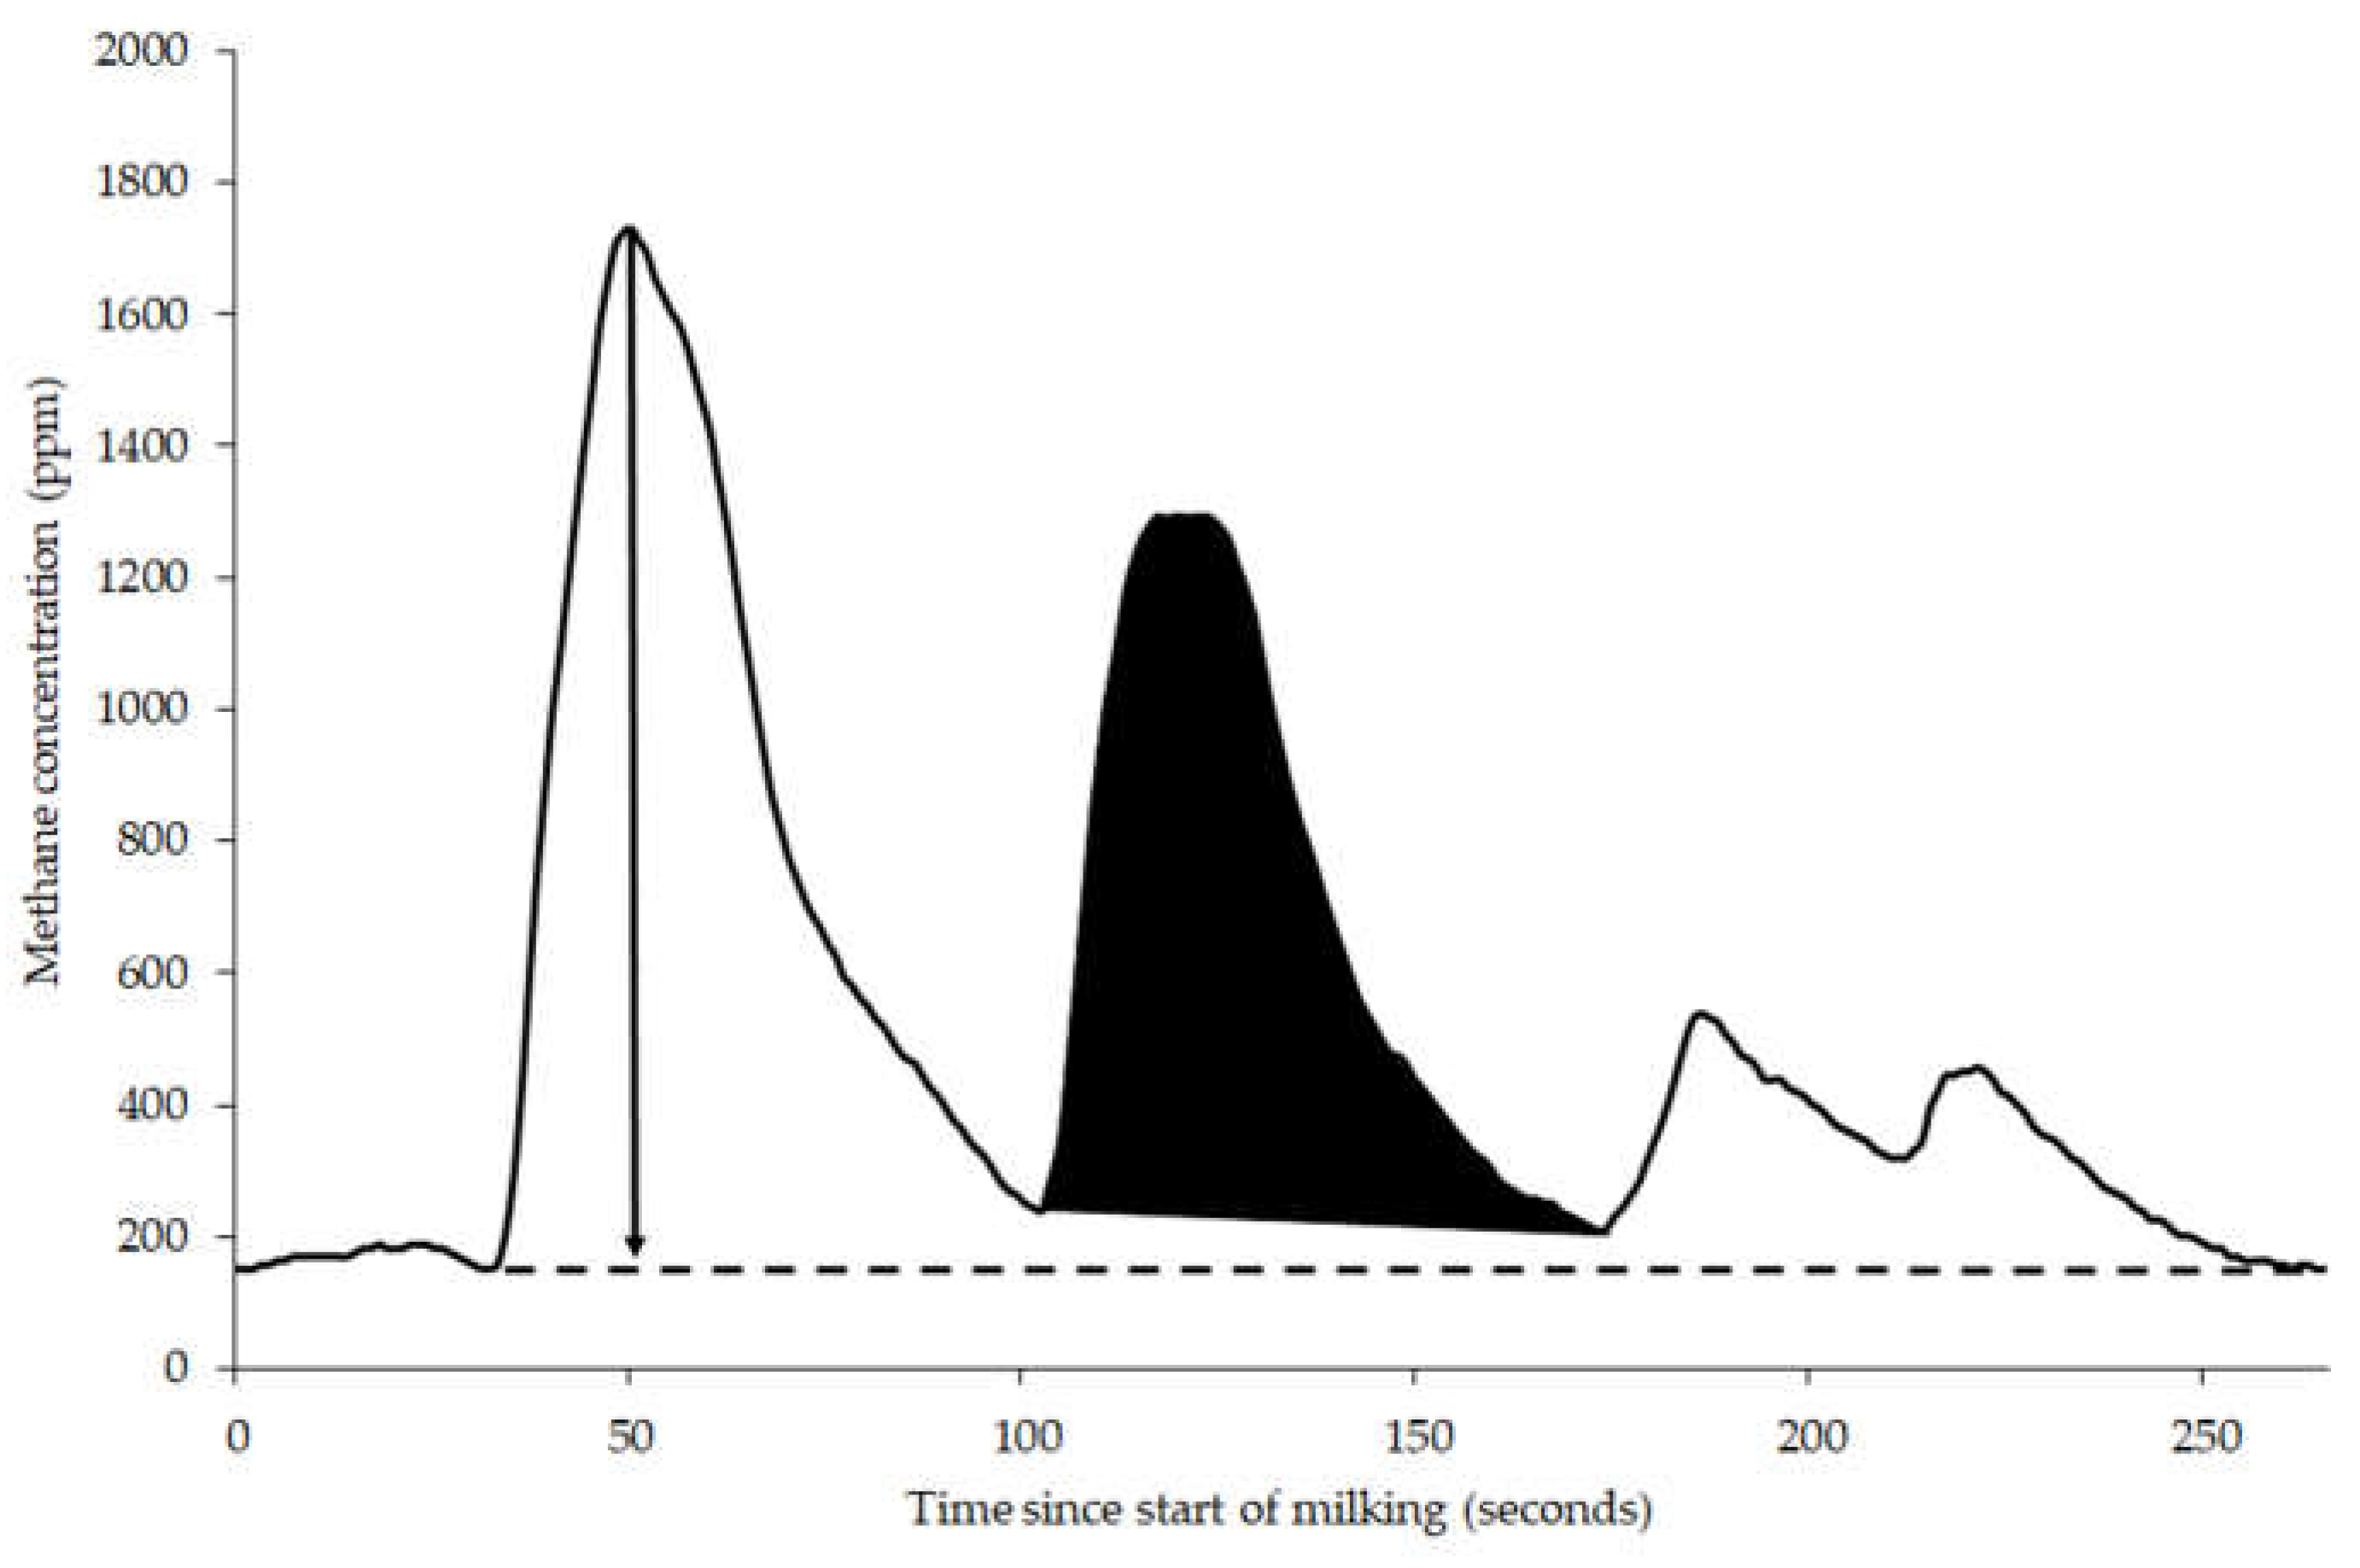

Table 1.
Average CH4 expressed as maximum eructation amplitude, average CH4 concentration, integral of eructation peaks and ratio of CH4 to CO2 concentrations.
Table 1.
Average CH4 expressed as maximum eructation amplitude, average CH4 concentration, integral of eructation peaks and ratio of CH4 to CO2 concentrations.
| Measure | Units | Mean | SD | Minimum | Maximum | Coefficent of Variation (%) |
|---|---|---|---|---|---|---|
| Maximum amplitude of eructation peaks | g/min | 0.48 | 0.15 | 0.19 | 1.09 | 31.3 |
| Average CH4 concentration | ppm | 708 | 156 | 361 | 1046 | 22.0 |
| Integral of eructation peaks | mg/l | 0.46 | 0.1 | 0.24 | 0.69 | 21.7 |
| Ratio CH4 to CO2 | 0.09 | 0.02 | 0.05 | 0.16 | 22.2 |
Disclaimer/Publisher’s Note: The statements, opinions and data contained in all publications are solely those of the individual author(s) and contributor(s) and not of MDPI and/or the editor(s). MDPI and/or the editor(s) disclaim responsibility for any injury to people or property resulting from any ideas, methods, instructions or products referred to in the content. |
© 2024 by the authors. Licensee MDPI, Basel, Switzerland. This article is an open access article distributed under the terms and conditions of the Creative Commons Attribution (CC BY) license (http://creativecommons.org/licenses/by/4.0/).
Copyright: This open access article is published under a Creative Commons CC BY 4.0 license, which permit the free download, distribution, and reuse, provided that the author and preprint are cited in any reuse.


