Submitted:
07 August 2024
Posted:
08 August 2024
You are already at the latest version
Abstract
Stormwater runoff from large roads is a major source of pollutants to receiving waters. Porous pavements have been shown to substantially reduce many of these pollutants, but studies are lacking on arterial roads. We sampled typical stormwater pollutants in runoff from sections of an arterial road 9-16 years after installation of three pavement types: control with conventional asphalt, porous asphalt overly, and full-depth porous asphalt. Both types of porous pavements substantially reduced most of the stormwater pollutants measured. Total suspended solids, turbidity, total lead, total copper, and 6PPD-quinone were all reduced by >75%. Total nitrogen, ammonia, total phosphorus, biochemical oxygen demand, total and dissolved copper, total mercury, total zinc, total polycyclic aromatic hydrocarbons, and di-2-ethylhexyl phthalate were all reduced by >50%. Reductions were lower or absent for nitrate, orthophosphate, E. coli, dissolved lead, and dissolved zinc. Most reductions were statistically significant. Many pollutants exceeded applicable water quality standards in the control samples but met them with both types of porous pavement. This study demonstrates that porous overlays and full-depth porous asphalt can provide substantial reductions of several priority stormwater pollutants on arterial roads for many years after installation.
Keywords:
porous pavements
; porous overlay
; pervious pavement
; pervious friction course
; water quality
; stormwater treatment
1. Introduction
Urbanization has steadily increased since 1950; more than 50% of the global population currently lives in urban areas which is a significant increase from 33% in the 1950s, and is expected to increase to 66% by 2050 [1]. In the United States, 81% of the population lives in urban areas [2]. Urban development has resulted in increased impervious areas, including roads, parking lots, and buildings. Stormwater from roads contains contaminants from cars and pollutants deposited on the roadway, which is then transported to receiving waters [3,4]. These pollutants negatively impact aquatic organisms and biogeochemical cycles [3,4,5]. Many common roadway pollutants such as copper, zinc, tire chemicals, and hydrocarbons have been shown to be toxic to aquatic species, particularly salmon, at concentrations observed in stormwater [6,7,8,9,10].
Common stormwater treatment techniques such as vegetated green infrastructure and porous pavements can reduce contaminants discharging to aquatic ecosystems, reduce flooding and erosion, and reconnect the hydrologic cycle. Many cities have implemented green stormwater infrastructure to slow and treat runoff [11,12,13]. “Sponge cities” rely on vegetated green infrastructure and permeable surfaces to increase infiltration and manage flooding [14]. Vegetated green stormwater infrastructure typically consists of an inlet draining runoff from the street or building to a land area with soil and plants. These systems have been shown to be effective at removing stormwater contaminants [15,16,17,18,19,20]. In many highly urbanized and industrial areas, space is limited or nonexistent for vegetated green infrastructure. These areas typically have high pollutant loads, and could benefit from an alternative treatment method. Porous pavement may be one way to effectively treat stormwater in these areas without additional space requirements.
Porous pavements are made by reducing sand and fines content used in conventional pavement mixes, which results in a pavement with small, interconnected pore spaces that allow stormwater to move through the pavement and drain to the base aggregate and soil below the pavement [21]. Porous overlays, also called pervious friction courses, are also used, which include a layer of porous asphalt (typically 25-76 mm or 1-3 in thick) on top of conventional impervious pavement. Porous overlays allow for drainage of stormwater under the overlay to a stormwater inlet, providing many of the same benefits as full-depth porous pavements but without infiltration. Porous pavements can reduce the urban heat island effect and increase road safety. Porous pavements have been designated “cool pavements” by the U.S. Environmental Protection Agency (EPA), which is defined as paving materials that reflect more solar energy and retain more water than conventional pavement [22,23]. Road safety is also improved by significantly reducing standing water on streets, which reduces hydroplaning and improves skid resistance [24,25]. Reductions in tire noise and water spray as well as improved nighttime visibility have also been observed [22], and the rough texture of porous pavements provides more traction for vehicles. The Texas Department of Transportation evaluated porous asphalt sections from 2003-2011, and found that porous asphalt lowers noise levels, increases skid resistance, reduces the number of accidents, injuries, and fatalities, and requires little to no maintenance compared to conventional pavement [26]. They also observed minimal raveling and delamination. Because porous pavements effectively drain stormwater, there is less maintenance required for fixing potholes and cracking compared to conventional pavement [21]. The main concern with porous pavements is clogging of the pore spaces, which can be minimized by vacuum sweeping on an annual to monthly basis, depending on sediment load. In addition to lower maintenance costs, the overall cost of porous pavements can be lower due to the elimination of drainage systems and piping for stormwater conveyance [27].
Studies have shown that pollutant removal with porous pavements is generally as effective as bioretention and other types of vegetated green infrastructure [28,29,30,31,32,33,34,35]. Several studies have shown a significant reduction in total suspended solids (TSS), with many observing >90% removal [29,33,34,36,37,38]. Many studies have observed significant removal of metals [29,30,32]. On average, removal of total copper, zinc, and lead is 67% in porous pavements [33,36,37,39,40,41,42]. Physical removal as the stormwater drains through the pore spaces of the pavement is likely the main removal mechanism of metals and TSS [43], with the majority of lead, zinc, copper, and cadmium removed in the top 30 cm (~12 in) of the pavement [44,45]. Higher removal was observed for contaminants that tend to attach to particles [36,42]. Studies on porous overlays have shown similar TSS and metals removal [46]. Removal of hydrocarbons and PAHs has also been significant [28,29,32,34]. Many studies reported removal of hydrocarbons to levels below detection limits [28,32,34]. Results for nutrients have been mixed; some studies have found 80-96% removal of nitrogen and phosphorus [31,47] whereas other studies found no removal or leaching of nitrogen and phosphorus [37,48,49]. More studies on nutrients are needed to determine the mechanisms of nitrogen and phosphorus removal to optimize removal in porous pavements. In the few studies evaluating E. coli, >90% removal was observed [50,51]. Although results are promising, most studies on porous pavements have either taken place in the laboratory [38,41,42,47] or focused on parking lots [29,33,34,35], highways [36,37,39], and residential areas [38,40]. To our knowledge, there are no studies on water quality of porous pavements for arterial roads. Arterial roads are unique in that they experience high traffic volumes traveling at moderate speeds compared to slower residential roads and high-speed highways, and are generally swept more frequently. More field studies on arterial roads are needed to fully understand the benefits of porous pavements.
Despite the safety and water quality benefits of porous pavements, there is still a reluctance by some transportation agencies to implement porous pavements on a large scale. Additional field studies are needed to provide data to evaluate performance over time and aid in developing design guidelines. This study evaluates an arterial road with a section of 7.6-cm (3-in) porous asphalt overlay and a section of full-depth porous asphalt installed in 2008 in comparison with a section of conventional asphalt. All of these sections drain to an existing stormwater system. Grab samples were taken during multiple storm events and analyzed for metals, nutrients, TSS, hydrocarbons, E. coli, and the tire chemical 6PPD-quinone. We hypothesize that significant removal of contaminants will occur in the porous pavement and porous overlay compared to the conventional pavement.
2. Materials and Methods
2.1. Sampling Sites
All sites were on Kane Drive in Gresham, Oregon U.S.A. (Figure 1). Annual precipitation in Gresham is 112 cm (44 in), with most precipitation occurring during the rainy months (Nov-Mar) and little to no precipitation occurring July-October [52]. Kane Drive is a five-lane arterial road with >30,000 vehicle trips per day and is a truck route for freight transport from Interstate 84 to Highway 26. Stormwater runoff generally drains to Kelly Creek, a tributary to the salmon-bearing Beaver Creek. A 292-m (958 ft) section of 20.3-cm (8-in) porous asphalt and a 532-m (1745 ft) section of a 7.6-cm (3-in) porous asphalt overlay over 12.7-cm (5-in) of conventional asphalt were installed in 2008. Because full infiltration was not feasible due to low infiltrating soils, runoff from both sections drains to an existing stormwater system. A sweep of the curb lanes is conducted monthly with a vacuum street sweeper, and additional sweeps as needed for leaf fall or cleanup of winter weather traction applications.
Three sampling sites were chosen to compare the porous asphalt overlay and the full-depth porous asphalt to conventional asphalt (Figure 1). The conventional asphalt site was the control, and is approximately 1,200-m (~4,000-ft) from the other two sites. The stormwater system was accessed from either a manhole or catch basin which receives runoff from each of the three pavement types. Sites were selected at locations that received drainage from each type of pavement and have similar drainage areas (0.50-0.63 ha or 1.25-1.55-acres).
2.2. Sample Collection
Five storms were sampled from 2017-2024, when the road had been in place for 9-16 years. Storms ranged in size from 1.0-4.0 cm (0.41-1.59 in) over 24 hours and all were preceded by an antecedent dry period of at least 12 hours. Grab samples were collected at each site in three rounds during the storms, targeting the rising limb, peak, and falling limb of the hydrograph. Rounds of grab samples were collected at least one hour apart and samples among sites within a round were collected within one hour.
2.3. Water Quality Analysis
Turbidity, pH, conductivity, and temperature were measured at the site when grab samples were collected. Samples were analyzed for TSS, nutrients, biochemical oxygen demand (BOD), metals, E. coli, PAHs and phthalates at the City of Portland Water Pollution Control Lab. Table 1 lists the methods for each analyte. Standard methods were followed for sample bottle preparation and sample preservation [53]. The emerging pollutant 6PPD-quinone was added to sampling in 2021 [8], and collected in high-density polyethylene (HDPE) bottles during three storms. ALS Environmental Laboratories used LC/MS-MS with a solid phase extraction to quantify 6PPD-quionone. There was no standard or EPA method at the time of sampling for 6 PPD-quionone.
Results were compared to Oregon Department of Environmental Quality’s (ODEQ) instream water quality standards for aquatic life and for human health via fish consumption (OAR 340-041), ODEQ’s industrial stormwater permit (1200-Z) discharge benchmarks for the Willamette Valley (ORS 468B.050), and Washington State’s Technology Assessment Protocol – Ecology (TAPE) percent reduction goals [54]. The instream water quality standards for ammonia and some metals vary based on hardness, pH, and other parameters. Average values of these parameters were determined from the City of Gresham’s 20-year dataset of instream water quality samples in the city.
Percent reduction was determined by comparing concentrations from each treatment (porous overlay or full-depth porous) to the control (conventional pavement) using Equation 1. This equation assumes that the influent to the porous pavement was similar to the direct runoff from the control site.
2.4. Statistical Analysis
The arithmetic mean of the three grab samples collected during each storm was calculated for each site and used in subsequent analyses. When a result was below detection limits, one half of that limit was used [55]. The Wilcoxon signed rank test was used to evaluate statistically significant differences between the conventional pavement and the two treatments for analytes with data from all five storms [56]. Differences were considered significant if p<0.05 and potential trends if 0.05<p<0.10. Box and whisker plots were developed to compare the conventional pavement, porous overlay, and full-depth porous results to relevant water quality standards.
3. Results and Discussion
In general, pollutant concentrations were lower from the porous asphalt overlay and full-depth porous asphalt sections than from the conventional asphalt. Percent reductions were greatest for sediment, total recoverable metals, and 6PPD-quinone, where they were generally >70% (Table 2). Runoff concentrations were higher from the porous overlay and full-depth porous pavement than from the conventional asphalt (control) for nitrate and orthophosphate, and for dissolved zinc with the porous overlay. Runoff was visually much clearer after passing though the porous overlay and full-depth porous pavements (Figure 2), which is consistent with the lower TSS concentrations. Several pollutants exceeded water quality standards in runoff from the conventional asphalt, but met them after passing through the porous overlay or full-depth porous (Figure 3, Figure 4, Figure 5 and Figure 6). Reductions were similar throughout the sampling period and to preliminary results from a nearby arterial road which was sampled 6 months after installation (unpublished data), indicating porous pavements consistently remove many pollutants up to 16 years after installation.
Field measurements of pH, temperature, dissolved oxygen, and conductivity did not differ significantly among pavement types (p: 0.313-1.000). Due to equipment and sampling errors, turbidity, PAHs, and phthalates were only collected during four storms. Three individual grab samples were excluded from the analyses due to sample contamination or because they did not meet the runoff targets for sampling and the remaining grab samples were averaged for analyses of those storms. There was one storm with two extreme outliers for % reduction (both for E. coli) due to very low levels in the control sample, and those two outliers were removed for the average % reduction calculation.
3.1. Particles
TSS was reduced by >80% for both the porous overlay and full-depth porous pavement compared to the conventional asphalt (Table 3, Figure 3). This meets the TAPE standards for pretreatment and for basic treatment [54]. The concentration of TSS was significantly lower for both types of porous pavement when compared to conventional asphalt (p=0.031). The average concentration from conventional asphalt was 217 mg/L, which exceeds the 1200-Z benchmark of 100 mg/L, while the concentrations from the porous overlay and full-depth porous both met this standard with a mean of 31 mg/L each (Figure 3).
Turbidity was also reduced by >80% with both types of porous pavement (Table 3). The sample size was not large enough to evaluate if the reductions were statistically significant. Average values from conventional pavement were 442 NTU while those from the porous overlay and full-depth porous were 57 NTU and 36 NTU, respectively.
Observed particle reductions were similar to other studies that reported 89-97% TSS removal [29,33,34,36,37,38]. Particles are likely being physically filtered when stormwater passes through the porous pavement [43]. Particles collected on the surface of the pavement are then eventually removed by the vacuum street sweeper. These results indicate porous pavements and overlays are an effective means for reducing particles in stormwater.
3.2. Nutrients, BOD, and E. coli
Overall, total nitrogen and phosphorus were reduced by >50% with both types of porous pavement as measured by total Kjeldahl nitrogen (TKN) and total phosphorus (total P). This meets TAPE standard for phosphorus treatment [54]. Ammonia was also reduced by >60%, although nitrate and orthophosphate were higher with both types of porous pavement than conventional asphalt (Table 3, Figure 4). Values for TKN, total P, and ammonia were significantly lower for both types of porous pavement compared to conventional asphalt (p=0.031). Values were not significantly different for nitrate or orthophosphate (p=0.85-1.00). All samples were well below the average instream water quality standard for ammonia of 20,400 µg/L, and the human health standard for fish consumption for nitrate of 10,000 µg/L (Figure 4). The other nutrients did not have applicable water quality standards or benchmarks for comparison. While TKN and total P were reduced, some nitrogen and phosphorus species were not. Removal of TKN and total P may be due to the organic forms of N and P associated with soil particles, which are physically filtered out in the porous pavement, whereas nitrate and orthophosphate are soluble and transported through the pavement with the stormwater. This is supported by studies that have reported removal of total P and total nitrogen [31,37,47] and insignificant removal or leaching of nitrate and phosphate [37,48,49].
BOD was reduced by at least 60% with both types of porous pavement (Table 3), which is within the 58-97% removal range observed by Tota-Maharaj and Scholz [51]. BOD was significantly lower for both types of porous pavement when compared to conventional asphalt (p=0.031). Values from the conventional pavement averaged 8.9 µg/L while those from the porous overlay and full-depth porous averaged 2.2 µg/L and 3.8 µg/L, respectively. Similar to TKN and total P, this may be due to the removal of organic matter associated with particles physically removed via filtration.
E. coli results were inconsistent across storms and average reduction was low (Table 3, Figure 4). There were no significant differences in values between either of the porous pavements and conventional asphalt (p=0.813). The average value from conventional asphalt was 429 MPN/100mL, which is above the single-sample instream water quality standard of 406 MPN/100mL, while the average values from the porous overlay and full-depth porous were below the standard at 303 MPN/100mL and 288 MPN/100mL, respectively. Results differ from other studies that showed >90% removal of E. Coli [50,51]. However, bacteria such as E. coli was not necessarily expected to be reduced because a diverse biofilm of bacteria and fungi is known to form in the pore spaces of porous pavements [57,58]. This biofilm contributes to water quality treatment through filtration and biological breakdown, and can be disrupted by non-target effects of biocides, such as glyphosate-containing herbicides, when used to kill moss or vegetation on the pavements [59]. While glyphosate is not used on this roadway, it is important to note that E. coli can be present in biofilms associated with stormwater systems and is not always associated with recent fecal contamination from warm-blooded organisms [60].
3.3. Metals
Most metals were reduced substantially by both types of porous pavement with reductions generally higher for total-phase than for dissolved-phase metals (Table 3, Figure 5). Concentrations of most metals were significantly lower for both porous pavements. Several metals exceeded standards in the runoff from conventional pavement but met the standards after passing through either type of porous pavement.
Total copper and lead were reduced by >75% in both types of porous pavement while total mercury, zinc, and dissolved copper were reduced by 40-70%. Results are similar to the average ~67% removal of total zinc, copper, and lead observed in other studies [33,36,37,40,41,42]. Most of the dissolved lead samples were below detection limits and were therefore not assessed; however, the only detectable levels were from the conventional pavement. Dissolved zinc was reduced by >35% with the full-depth porous, but was higher with the porous overlay compared to the conventional pavement (Table 3). Therefore, the porous pavements met the TAPE standard for metals treatment for copper but not for zinc [54].
Concentrations of total copper, lead, and of dissolved copper were significantly lower with both types of porous than from conventional pavement (p=0.031). Concentrations of total mercury and zinc showed a trend towards being lower with both types of porous than with conventional pavement (p=0.063). Dissolved zinc also showed a trend towards being lower with the full-depth porous compared to conventional pavement (p=0.063), but was not significantly different between the porous overlay and conventional pavement (p=0.125).
Total copper averaged 37 µg/L from conventional pavement, generally exceeding the 1200-Z benchmark of 15 µg/L, while the values from both the porous overlay and the full-depth porous generally met that benchmark, averaging 6.5 µg/L and 7.1 µg/L, respectively. Total lead levels were all below the 1200-Z benchmark of 110 µg/L. Total mercury levels were all below the acute instream water quality standard of 2.4 µg/L. However, levels averaged 0.016 µg/L from conventional pavement which exceeds the chronic instream water quality standard of 0.012 µg/L, while the values from both the porous overlay and the full-depth porous generally met that standard, averaging 0.0043 µg/L and 0.0053 µg/L, respectively. Total zinc values averaged 165 µg/L from conventional pavement, generally exceeding the 1200-Z benchmark of 140 µg/L, while the values from both the porous overlay and the full-depth porous generally met that benchmark, averaging 89 µg/L and 39 µg/L, respectively (Figure 5).
Some values for dissolved copper exceeded the average instream water quality standards of 10.1 µg/L (acute) and 6.3 µg/L (chronic) from the conventional pavement. Although the conventional pavement average value was below these standards at 5.6 µg/L, all samples from the porous overlay and the full-depth porous were below the standards, averaging 2.6 µg/L and 2.5 µg/L, respectively. Dissolved lead values were all below the average instream water quality standards of 30.2 µg/L (acute) and 1.2 µg/L (chronic). Some values for dissolved zinc exceeded the average instream water quality standards of 65.2 µg/L (acute) and 65.8 µg/L (chronic) from both the conventional pavement and the porous overlay, but average values were below at 46 µg/L and 81 µg/L, respectively. All samples from the full-depth porous were below the standards, averaging 25 µg/L (Figure 5).
Differences in total and dissolved metals reduction may be due to the main removal mechanisms for metals. Metals that are sorbed to particles are removed by physical filtration, and dissolved metals are removed via sorption to the pavement. The smaller thickness of the porous overlay and lack of base rock layer may have resulted in fewer binding sites which may have reduced removal efficiencies of zinc. Copper also competes for binding sites and is preferentially removed before zinc [61]. This is supported by the higher reductions of copper compared to zinc reductions in the full depth porous overlay; copper reduction was 52% whereas zinc was reduced by 38%. The higher zinc concentrations from the porous overlay compared to the conventional pavement may also be due to buildup of zinc during smaller storms between sampling, and subsequent resuspension of zinc during larger storms which were targeted for sampling.
3.4. Organic Comppunds
Total PAHs were reduced by >50% with both types of porous pavements, with higher reductions occurring with the full-depth porous (Table 3, Figure 6). These numbers are likely underestimates of reductions because many of the PAHs measured were non-detectable with both porous pavements. The sample size was not large enough to evaluate if the reductions were statistically significant. Average values for the conventional pavement were 3.22 µg/L while the porous overlay and full-depth porous averaged 1.08 µg/L and 0.9 µg/L, respectively.
Of the phthalates analyzed, only DEHP had multiple detections. DEHP was reduced by >65% with both types of porous pavements (Table 3, Figure 6). The sample size was not large enough to evaluate if the reductions were statistically significant. All results were above the human health standard for fish consumption of 0.20 µg/L; however, average values were ~100x higher than the standard in runoff from conventional pavement and only ~10-15x higher after passing through either porous pavement (Figure 6).
Results are similar to other studies that observed removal of PAHs, diesel fuel, and motor oil [28,48,49]. Poor et al. also observed several non-detects when evaluating removal in the lab using cylinders [48], and Boving et al. reported PAH concentrations near detection limits from a parking lot [49]. Charlesworth et al. observed oil concentrations near the detection limit, with oil removal occurring in the top 10-cm (4-in) of pavement [28]. Microbial degradation may be the main removal mechanism; Charlesworth et al. found a microbial biofilm on the surface layer of the pavement [28]. Additional studies are needed to verify whether microbial degradation is the main removal mechanism for PAHs and phthalates.
6PPD-quinone was reduced by 80% in the porous overlay and 90% in the full-depth porous (Table 3, Figure 6). This is consistent with experiments conducted in a parking lot that showed 52-100% removal of 6PPD-quinone with porous pavements [62]. The sample size was not large enough to evaluate if the reductions were statistically significant. Average values were 1.03 µg/L from the conventional pavement and 0.17 µg/L and 0.08 µg/L with the porous overlay and full-depth porous, respectively. Because 6PPD-q is a recent emerging contaminant, water quality standards do not yet exist, but toxicity has been measured for various life stages of several aquatic species and reported as median lethal concentrations (LC50). The current LC50 values for coho salmon are 0.095 mg/L for adults [63] and 0.041 mg/L for juveniles [64]. These levels were exceeded in all runoff samples from the conventional pavement, but were often met with both types of porous pavements. For the next most sensitive species, the LC50 is 0.51 mg/L for spotted char [65], 0.59 mg/L for brook trout, and 1.00 mg/L for rainbow trout [66]. Runoff from the conventional pavement often exceeded these levels, but all samples from both types of porous pavements were below these limits. Installing porous pavements on roads with heavy traffic may reduce concentrations of 6PPD-quinone in urban areas to levels that are protective of salmon. Results are encouraging; more studies are needed to evaluate presence and removal from porous pavements. 6PPD-quinone has been shown to bind to particulate matter and it will therefore likely be removed with particles during vacuum sweeping [67]. Because 6PPD-quinone is an emerging contaminant, analysis methods are still being developed and updated and additional sampling with a standardized method is needed.
4. Conclusions
This study evaluated the water quality benefits of a porous asphalt overlay and full-depth porous asphalt on a major arterial road 9-16 years after installation. Overall, reduction of pollutants in runoff was significant. Almost all water quality standards were met with both the porous overlay and full-depth porous pavements. This study indicates that porous pavements can provide substantial reductions in several priority stormwater pollutants on arterial roads many years after installation. Porous pavements have the potential to reduce the impacts of urban development on aquatic ecosystems, with increased protectiveness of endangered species such as salmon. Porous pavements not only reduce pollutants, they reduce flooding on roadways and increase safety for drivers. Transportation agencies should consider increasing the use of porous pavements, particularly on roads with heavy traffic in urban areas.
Author Contributions
Conceptualization, K.H.; methodology, K.H and C.P.; formal analysis, K.H. and C.P.; investigation, K.H. and C.P.; resources, K.H.; data curation, K.H.; writing—original draft preparation, K.H. and C.P.; writing—review and editing, K.H. and C.P.; visualization, K.H. and C.P. project administration, K.H.; funding acquisition, K.H. All authors have read and agreed to the published version of the manuscript.
Funding
This research received no external funding.
Data Availability Statement
Data are available through the Oregon Department of Environmental Quality’s Ambient Water Quality Management System database: https://www.oregon.gov/deq/wq/pages/wqdata.aspx .
Acknowledgments
Sample collection assistance was provided by Karen Bromley, Torrey Lindbo, Richard Trownsell, Adam Hogue, and Brian Raney. Field work was made possible with help from Agger Chiropractic Clinic.
Conflicts of Interest
The authors declare no conflicts of interest. The funders had no role in the design of the study; in the collection, analyses, or interpretation of data; in the writing of the manuscript, or in the decision to publish the results.
References
- UN Population Division. World Urbanization Prospects, The 2018 Revision (ST/ESA/SER.A/420). Department of Economic and Social Affairs: New York, NY, USA, 2019. Available online: https://www.un.org/development/desa/pd/sites/www.un.org.development.desa.pd/files/files/documents/2020/Jan/un_2018_wup_report.pdf (accessed on 1 May 2024).
- US Census Bureau. Redefining Urban Areas Following the 2020 Census. U.S. Census Bureau Geography Division: Washington, DC, USA, 2022. Available online: https://www.census.gov/newsroom/blogs/random-samplings/2022/12/redefining-urban-areas-following-2020-census.html (accessed on 1 May 2024).
- McGrane, S.J. Impacts of urbanisation on hydrological and water quality dynamics, and urban water management: a review. Hydro Sci J 2016, 61, 2295-2311. [CrossRef]
- Paul, M.J. and Meyer, J.L. Streams in the urban landscape. Annual Review of Ecol and Syst 2001, 32, 333-365. [CrossRef]
- Walsh, C.J.; Fletcher, T.D. and Ladson, A.R. Stream restoration in urban catchments through redesigning stormwater systems: looking to the catchment to save the stream. J. North American Benth Soc 2005, 24, 690-705. [CrossRef]
- McIntyre, J.K.; Baldwin, D.H.; Beauchamp, D.A. and Scholz, N.L. Low-level copper exposures increase visibility and vulnerability of juvenile coho salmon to cutthroat trout predators. Ecol App 2012, 22, 1460-1471. [CrossRef]
- Bowen, L.; Werner, I. and Johnson, M.L. Physiological and behavioral effects of zinc and temperature on coho salmon (Oncorhynchus kisutch). Hydrobiologia 2006, 559, 161-168. [CrossRef]
- Tian, Z.; Zhao, H.; Peter, K.T.; Gonzalez, M.; Wetzel, J.; Wu, C.; Hu, X.; Prat, J.; Mudrock, E.; Hettinger, R. and Cortina, A.E. A ubiquitous tire rubber–derived chemical induces acute mortality in coho salmon. Science 2021, 371, 185-189. [CrossRef]
- Martins, K.; Hagedorn, B.; Ali, S.; Kennish, J.; Applegate, B.; Leu, M.; Epp, L.; Pallister, C. and Zwollo, P. Tissue phthalate levels correlate with changes in immune gene expression in a population of juvenile wild salmon. Arch of Env Cont and Toxicol 2016, 71, 35-47. [CrossRef]
- Meador, J.P.; Sommers, F.C.; Ylitalo, G.M. and Sloan, C.A. Altered growth and related physiological responses in juvenile Chinook salmon (Oncorhynchus tshawytscha) from dietary exposure to polycyclic aromatic hydrocarbons (PAHs). Can J Fish and Aquatic Sci 2006, 63, 2364-2376. [CrossRef]
- Wethington, B. Green Infrastructure in the City of Portland, OR. City of Portland Bureau of Environmental Services Presentation, January 6, 2015. Available online: https://www.casfm.org/wp-content/uploads/2018/01/CASFM_Lunch_and_Learn_20150126.pdf (accessed on 17 May 2024).
- Environmental Protection Agency (EPA). Benefits of Green Infrastructure. Available online: https://www.epa.gov/green-infrastructure/benefits-green-infrastructure (accessed on 13 May 2024).
- Liu, L. and Jensen, M.B. Green infrastructure for sustainable urban water management: Practices of five forerunner cities. Cities 2018, 74, 126-133. [CrossRef]
- Zhang, W.; Li, Q.; Wang, J.; Meng, Y.; Zhou, Z. Aging Behavior of High-Viscosity Modified Asphalt Binder Based on Infrared Spectrum Test. Materials 2022, 15, 2778. [CrossRef]
- Hsieh, C.; Davis, A.P. Evaluation and optimization of bioretention media for treatment of urban storm water runoff. J. Environ. Eng. 2005, 131, 1521–1531. [CrossRef]
- Davis, A.P.; Hunt, W.; Traver, R.G.; Clar, M. Bioretention technology: Overview of current practice and future needs. J. Environ. Eng. 2009, 135, 109–117. [CrossRef]
- Chapman, C.; Horner, R.R. Performance assessment of street-drainage bioretention system. Water Environ. Res. 2010, 82, 109–119. [CrossRef]
- Trowsdale, S.; Simcock, R. Urban stormwater treatment using bioretention. J. Hydrol. 2011, 397, 167–174. [CrossRef]
- Poor, C.; Membrere, T. and Miyasato, J. Impact of green stormwater infrastructure age and type on water quality. Sustainability 2021, 13, 10484. [CrossRef]
- Okita, J.; Poor, C.; Kleiss, J.M. and Eckmann, T. Effect of green roof age on runoff water quality in Portland, Oregon. J. Green Bldg 2018, 13, 42-54. [CrossRef]
- Environmental Protection Agency (EPA). Permeable Pavements. Stormwater Best Management Practice EPA-832-F-21-031W; Office of Water: Washington, DC, USA, 2021.
- Environmental Protection Agency (EPA). Using Cool Pavements to Reduce Heat Islands. Available online: https://www.epa.gov/heatislands/using-cool-pavements-reduce-heat-islands#2 (accessed on 3 May 2024).
- Haddad, B.; Karaky, H.; Boutouil, M.; Boudart, B. and Sebaibi, N. Investigation Properties of Pervious and Water-Retaining Recycled Concrete to Mitigate Urban Heat Island Phenomena. Sustainability 2023, 15, 5384. [CrossRef]
- Ndon, U.J. and Al-Manaseer, A. Permeable Pavement as a Sustainable Management Option for Highway Stormwater and Safe Use of Roadways; WP Report 12–13; Mineta Transportation Institute: San Jose, CA, USA, 2017.
- Holleran, I.; Wilson, D.J.; Holleran, G.; Walubita, L.F. and Byrony, J. Porous Asphalt—More Than Just Safety. In Proceedings of the IPENZ Transportation Group Conference, Auckland, NZ, 7–9 March 2016.
- Arámbula, E.; Estakhri, C.K.; Martin, A.E.; Trevino, M.; de Fortier Smit, A. and Prozzi, J. Performance and cost effectiveness of permeable friction course (PFC) pavements (No. FHWA/TX-12/0-5836-2); Texas A&M Transportation Institute: College Station, TX, USA, 2013.
- Nassiri, S. and Alsharedah, O. Development of Protocol to Maintain Winter Mobility of Different Classes of Pervious Concrete Pavement Based on Porosity. Final Project Report, Pacific Northwest Transportation Consortium, U.S Department of Transportation: Seattle, WA, USA, 2020.
- Charlesworth, S.M.; Beddow, J. and Nnadi, E.O. The Fate of Pollutants in Porous Asphalt Pavements, Laboratory Experiments to Investigate Their Potential to Impact Environmental Health. Int. J. Environ. Res. Public Health 2017, 14, 666. [CrossRef]
- Pilon, B.S.; Tyner, J.S.; Yoder, D.C. and Buchanan, J.R. The Effect of Pervious Concrete on Water Quality Parameters: A Case Study. Water 2019, 11, 263. [CrossRef]
- Haselbach, L.; Poor, C. and Tilson, J. Dissolved Zinc and Copper Retention from Stormwater Runoff in Ordinary Portland Cement Pervious Concrete. Constr. Bldg. Mater. 2013, 53, 652–657. [CrossRef]
- Jayasuriya, L.N.N.; Kadurupokune, N.; Othman, M. and Jesse, K. Contributing to the Sustainable Use of Stormwater: The Role of Pervious Pavements. Water Sci. Tech. 2007, 56, 69–75. [CrossRef]
- Brattebo, B.O. and Booth, D.B. Long-term Stormwater Quantity and Quality Performance of Permeable Pavement Systems. Water Res. 2003, 37, 4369–4376. [CrossRef]
- Jayakaran, A.D.; Knappenberger, T.; Stark, J.D. and Hinman, C. Remediation of stormwater pollutants by porous asphalt pavement. Water 2019, 11, 520. [CrossRef]
- Roseen, R.M.; Ballestero, T.P.; Houle, J.J.; Briggs, J.F. and Houle, K.M. Water quality and hydrologic performance of a porous asphalt pavement as a storm-water treatment strategy in a cold climate. J. Environ. Eng. 2012 138, 81-89. [CrossRef]
- Alam, T.; Mahmoud, A.; Jones, K.D.; Bezares-Cruz, J.C. and Guerrero, J. A comparison of three types of permeable pavements for urban runoff mitigation in the semi-arid South Texas, USA. Water 2019, 11, 1992. [CrossRef]
- Barrett, M.E.; Kearfott, P. and Malina Jr, J.F. Stormwater quality benefits of a porous friction course and its effect on pollutant removal by roadside shoulders. Water Environ Res, 2006, 78, 2177-2185. [CrossRef]
- Eck, B.J.; Winston, R.J.; Hunt, W.F. and Barrett, M.E. Water quality of drainage from permeable friction course. J. Environ. Eng. 2012, 138, 174-181. [CrossRef]
- Brown, C.; Chu, A.; Van Duin, B. and Valeo, C. Characteristics of sediment removal in two types of permeable pavement. Water Qual. Res. J. 2009, 44, 59-70. [CrossRef]
- Pagotto, C.; Legret, M. and Le Cloirec, P. Comparison of the hydraulic behaviour and the quality of highway runoff water according to the type of pavement. Water Res. 2000, 34, 4446-4454. [CrossRef]
- Legret, M.; Colandini, V. and Le Marc, C. Effects of a porous pavement with reservoir structure on the quality of runoff water and soil. Science Total Environ. 1996, 189, 335-340. [CrossRef]
- Zhao, Y. and Zhao, C. Lead and zinc removal with storage period in porous asphalt pavement. Water Sa 2014, 40, 65-72. [CrossRef]
- Zhang, K.; Yong, F.; McCarthy, D.T. and Deletic, A. Predicting long term removal of heavy metals from porous pavements for stormwater treatment. Water Res. 2018, 142, 236-245. [CrossRef]
- Weiss, P.T.; Kayhanian, M.; Gulliver, J.S. and Khazanovich, L. Permeable pavement in northern North American urban areas: research review and knowledge gaps. Intl J. Pavement Engr. 2019, 20, 143-162. [CrossRef]
- Legret, M. and Colandini, V. Effects of a porous pavement with reservoir structure on runoff water: Water quality and fate of heavy metals. Water Sci. and Technol. 1999, 39, 111-117. [CrossRef]
- Dierkes, C.; Kuhlmann, L.; Kandasamy, J. and Angelis, G. Pollution Retention Capability and Maintenance of Permeable Pavements. In Proceedings of the 9th International Conference on Urban Drainage, Portland, OR, USA, 8–13 September 2002; p. 444.
- Klenzendorf, J.B.; Eck, B.J.; Charbeneau, R.J. and Barrett, M.E. Quantifying the behavior of porous asphalt overlays with respect to drainage hydraulics and runoff water quality. Environ. & Engr. Geoscience 2012, 18, 99-111. [CrossRef]
- He, J.; Huang, J.; Valeo, C. and Chu, A. Water Quality Treatment Efficacy Model of Porous Concrete Pavement. J. Water Res. and Hydraul. Engr. 2015, 4, 159-168. [CrossRef]
- Poor, C.; Kaye, J.; Struck, R. and Gonzalez, R. Permeable Pavement in the Northwestern United States: Pollution Source or Treatment Option? Sustainability 2023, 15, 12926. [CrossRef]
- Boving, T.B.; Stolt, M.H.; Augenstern, J. and Brosnan, B. Potential for localized groundwater contamination in a porous pavement parking lot setting in Rhode Island. Environ. Geol. 2008, 55, 571-582. [CrossRef]
- Selvakumar, A. and O’Connor, T.P. Organism Detection in Permeable Pavement Parking Lot Infiltrates at the Edison Environmental Center, New Jersey. Water Environ. Res. 2018, 90, 21-29. [CrossRef]
- Tota-Maharaj, K. and Scholz, M. Efficiency of permeable pavement systems for the removal of urban runoff pollutants under varying environmental conditions. Environ. Prog. & Sustain. Energy 2010, 29, 358-369. [CrossRef]
- United States Geological Survey (USGS). City of Portland HYDRA Rainfall Network. USGS Oregon Water Science Center: Reston, VA, USA, 2024. Available online: https://or.water.usgs.gov/non-usgs/beshttps://www.census.gov/newsroom/blogs/random-samplings/2022/12/redefining-urban-areas-following-2020-census.html (accessed on 1 July 2024).
- Rice, E.W.; Baird, R.B.; Eaton, A.D.; Clesceri, L.S. Standard Methods for the Examination of Water and Wastewater, 22nd ed.; American Public Health Association: Washington, DC, USA, 2012.
- Washington Department of Ecology. Technology Assessment Protocol – Ecology (TAPE) Process Overview; Washington Department of Ecology: Olympia, WA, USA, 2018.
- Kayhanian, M., Singh, A., and Meyer, S. Impact of non-detects in water quality data on estimation of constituent mass loading. Water Sci. and Technol. 2002, 45, 219-225. [CrossRef]
- Helsel, D.R., and Hirsch, R.M. Techniques of Water-Resources Investigations of the United States Geological Survey: Statistical Methods in Water Resources. United States Geological Survey: Reston, VA, 2002.
- Coupe, S.J., Smith, H.G., Newman, A.P., and Puehmeier, T. Biodegredation and microbial diversity within permeable pavements. Euro. J. of Protistology 2003, 39, 495-498. [CrossRef]
- Fathollahi, A., Coupe, S.J., El-Sheikh, A.H., and Sañudo-Fontaneda, L.A. The biosorption of mercury by permeable pavement biofilms in stormwater attenuation. Sci. of the Tot. Environ. 2020, 741, 140411. [CrossRef]
- Mbanaso, F.U., Coupe, S.J., Charlesworth, S.M., Nnadi, E.O., and Ifelebuegu, A.O. Potential microbial toxicity and non-target impact of different concentrations of glyphosate-containing herbicide (GCH) in a model pervious paving system. Chemosphere 2014, 100, 34-41. http://dx.doi.org/10.1016/j.chemosphere.2013.12.091.
- Clary, J., Pitt, R, and Steets, B. Pathogens in Urban Stormwater. Urban Water Resources Research Council Technical Report, Water Resources Institute, American Society of Civil Engineers: Reston, VA, USA, 2014.
- Snoeyink, V.L, and and Jenkins, D. Water Chemistry; Wiley: New York, NY, USA, 1980.
- Mitchell, C. J., and Jayakaran, A. D. Mitigating tire wear particles and tire additive chemicals in stormwater with permeable pave-ments. Sci. of the Total Environ 2024, 908, 168236. [CrossRef]
- Tian, Z., Gonzalez, M., Rideout, C.A., Zhao, H.N., Hu, X., Wetzel, J., Mudrock, E., James, C.A., McIntyre, J.K. and Kolodziej, E.P. 6PPD-quinone: Revised toxicity assessment and quantification with a commercial standard. Environ. Sci & Technol. Letters 2022, 9, 140-146. [CrossRef]
- Lo, B.P., Marlatt, V.L., Liao, X., Reger, S., Gallilee, C., Ross, A.R. and Brown, T.M.. Acute toxicity of 6PPD-quinone to early life stage juvenile chinook (Oncorhynchus tshawytscha) and coho (Oncorhynchus kisutch) salmon. Environ. Toxicol and Chem 2023, 42, 815-822. [CrossRef]
- Hiki, K. and Yamamoto, H. The tire-derived chemical 6PPD-quinone is lethally toxic to the white-spotted char Salvelinus leuco-maenis pluvius but not to two other salmonid species. Environ. Sci & Technol. Letters 2022, 9, 1050-1055. [CrossRef]
- Brinkman, M., Montgomery, D., Selinger, S., Miller, J.G., Stock, E., Alcaraz, A.J., Challis, J.K., Weber, L., Janz, D., Hecker, M. and Wiseman, S. Acute toxicity of the tire rubber-derived chemical 6PPD-quinone to four fishes of commercial, cultural, and ecological importance. Environ. Sci & Technol. Letters 2022, 9, 333-338. [CrossRef]
- Hua, X. and Wang, D. Tire-rubber related pollutant 6-PPD quinone: A review of its transformation, environmental distribution, bioavailability, and toxicity. Jour. of Haz. Mat. 2023, 459, 132265. [CrossRef]
Figure 1.
Site Locations on Kane Drive. Polygons delineate the drainages which drain to the sampling points, shown as circles.
Figure 1.
Site Locations on Kane Drive. Polygons delineate the drainages which drain to the sampling points, shown as circles.
Figure 2.
Samples from storm events of varying intensities at the 3 sampling sites. A) Low intensity storm (~1.3-mm/hr, or 0.05-in/hr), B) Medium intensity storm (~3.8-mm/hr, or 0.15-in/hr), and C) High intensity storm (~10.2-mm/hr, or 0.40-in/hr). In each photo the bottles, from left to right, are: control, porous asphalt overlay, and full-depth porous asphalt.
Figure 3.
Box plots of water quality samples for particles in runoff from conventional asphalt (Control), porous asphalt overlay (Por. Overl.), and full-depth porous asphalt (Full-Dep. Por.). Boxes represent the 25th, 50th, and 75th percentiles. The dashed line indicates a water quality runoff benchmark.
Figure 4.
Box plots of water quality samples for nutrients, biochemical oxygen demand (BOD), and E. coli in runoff from conventional asphalt (Control), porous asphalt overlay (Por. Overl.), and full-depth porous asphalt (Full-Dep. Por.). Boxes represent the 25th, 50th, and 75th percentiles.
Figure 4.
Box plots of water quality samples for nutrients, biochemical oxygen demand (BOD), and E. coli in runoff from conventional asphalt (Control), porous asphalt overlay (Por. Overl.), and full-depth porous asphalt (Full-Dep. Por.). Boxes represent the 25th, 50th, and 75th percentiles.
Figure 5.
Box plots of water quality samples for metals in runoff from conventional asphalt (Control), porous asphalt overlay (Por. Overl.), and full-depth porous asphalt (Full-Dep. Por.). Boxes represent the 25th, 50th, and 75th percentiles. Dashed lines indicate applicable water quality standards or benchmarks.
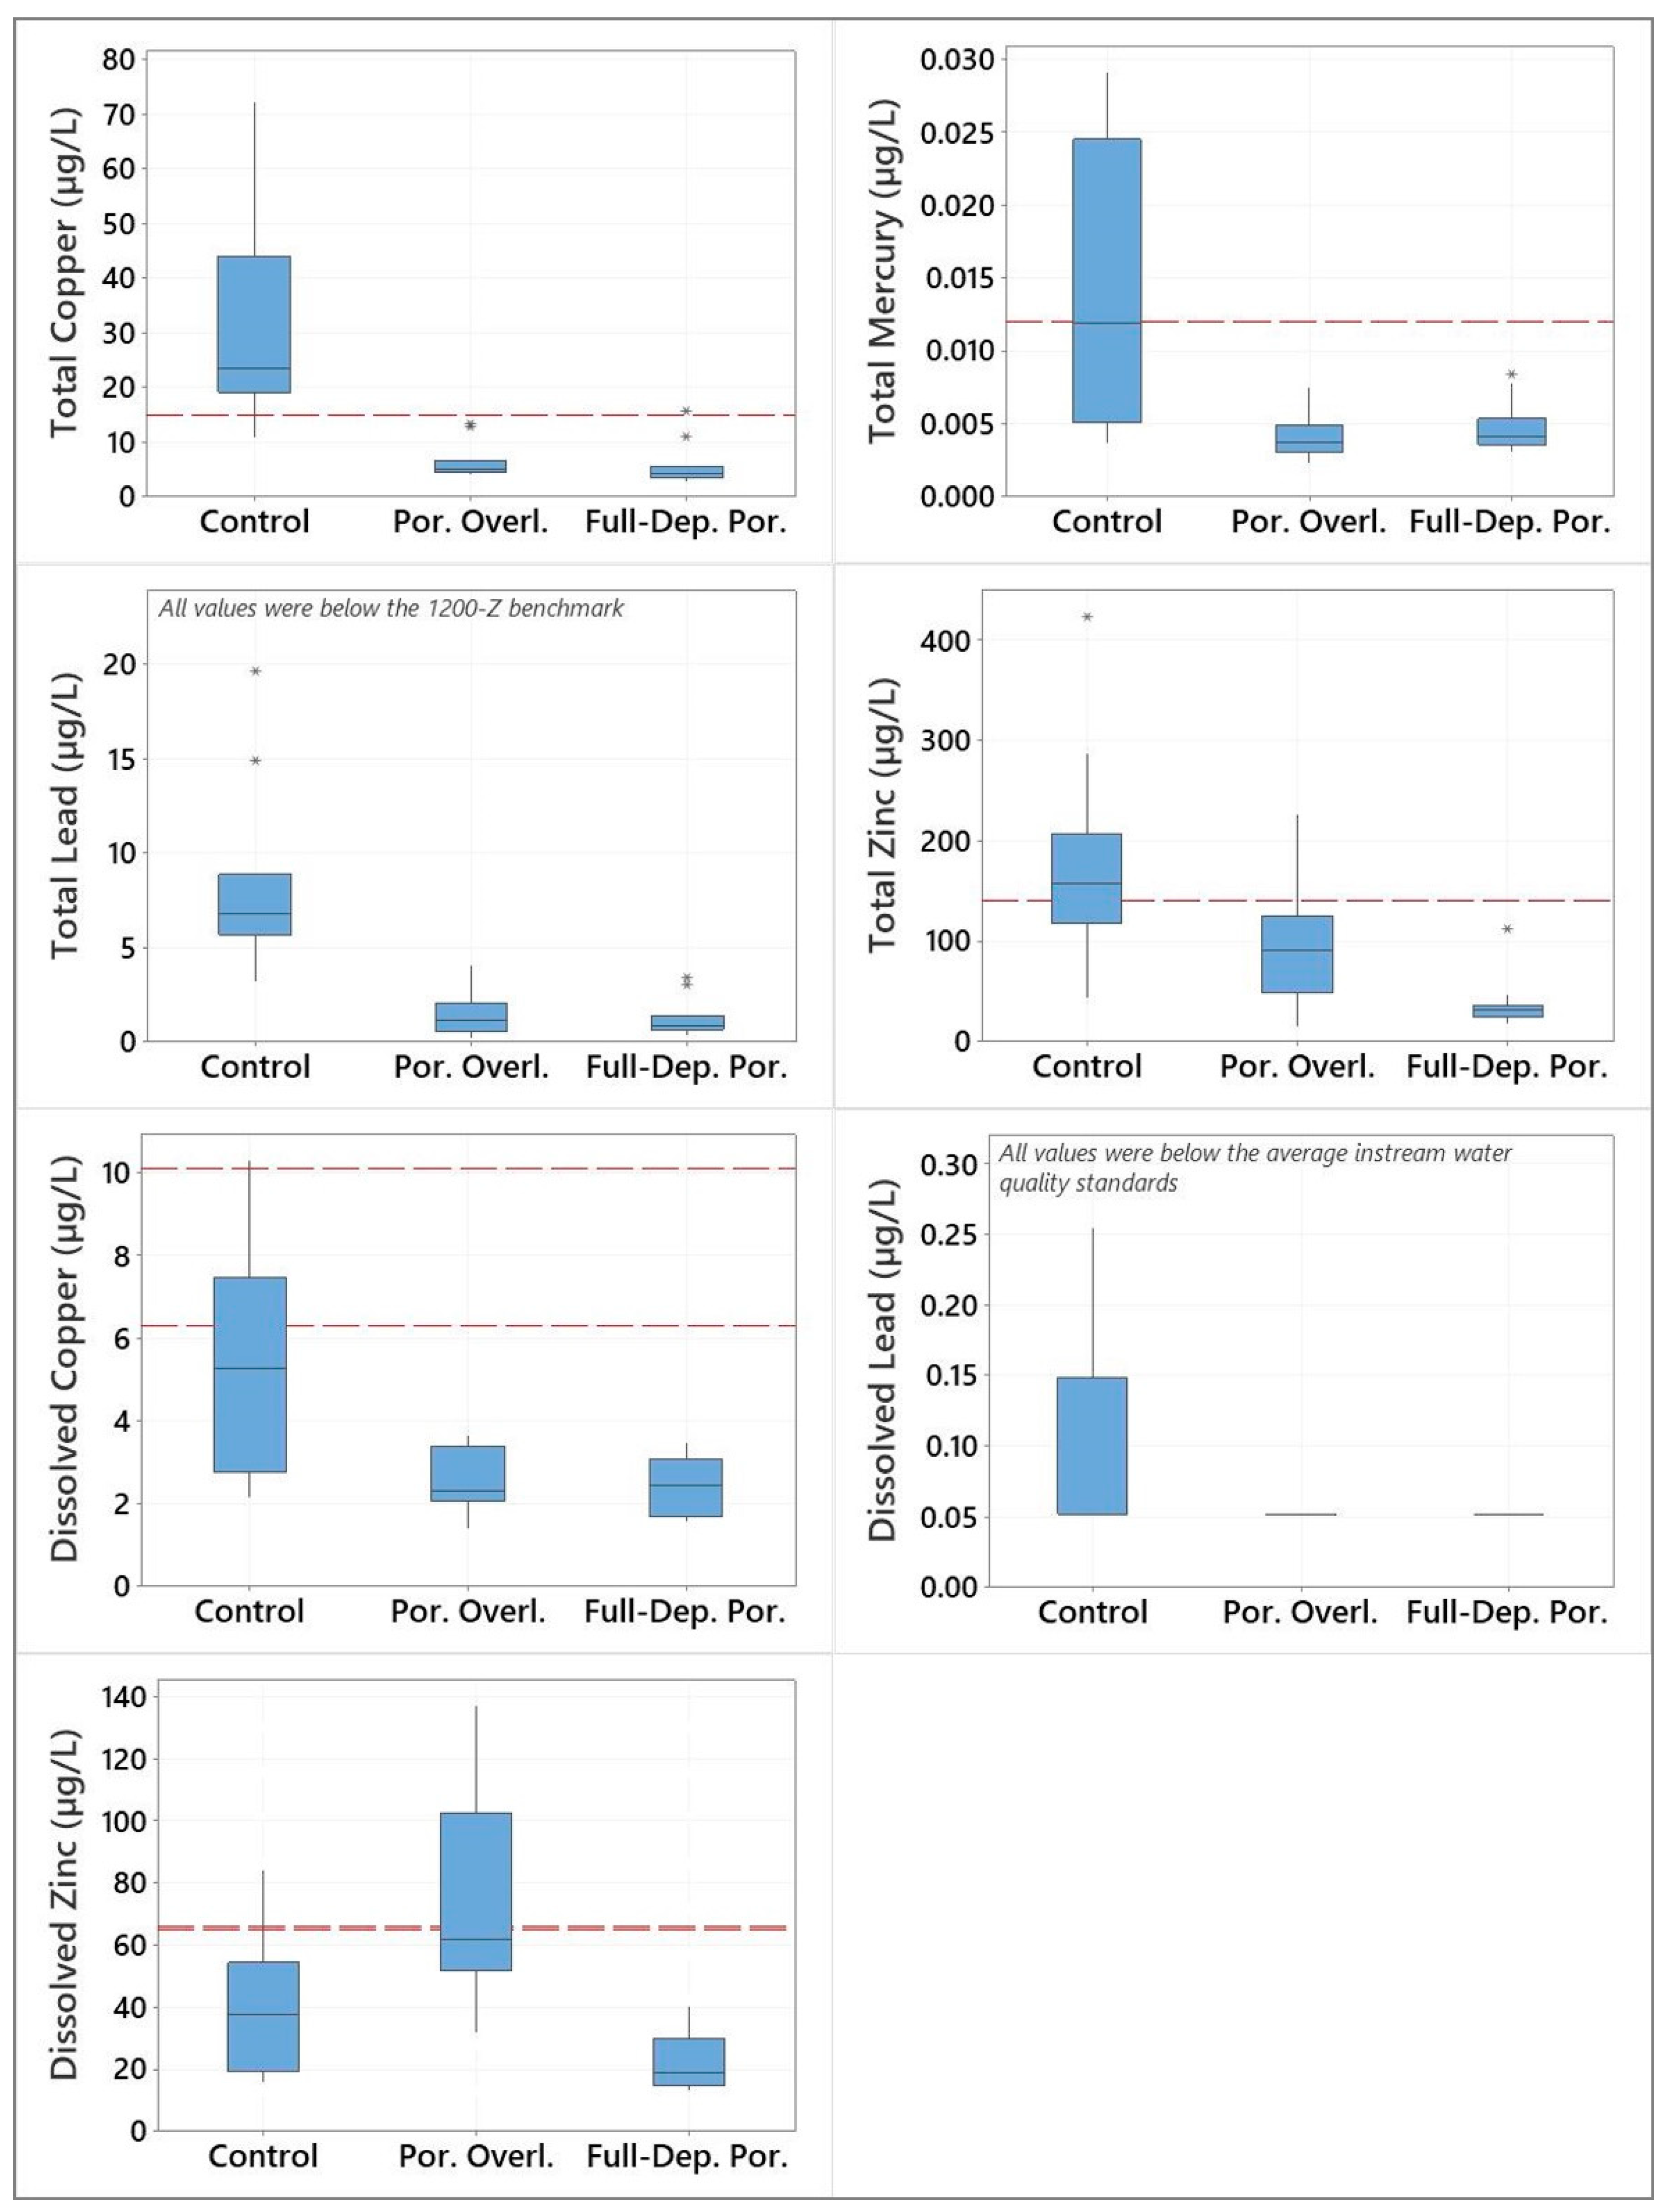
Figure 6.
Box plots of water quality samples for organic compounds in runoff from conventional asphalt (Control), porous asphalt overlay (Por. Overl.), and full-depth porous asphalt (Full-Dep. Por.). Boxes represent the 25th, 50th, and 75th percentiles. The dashed line indicates a water quality standard.
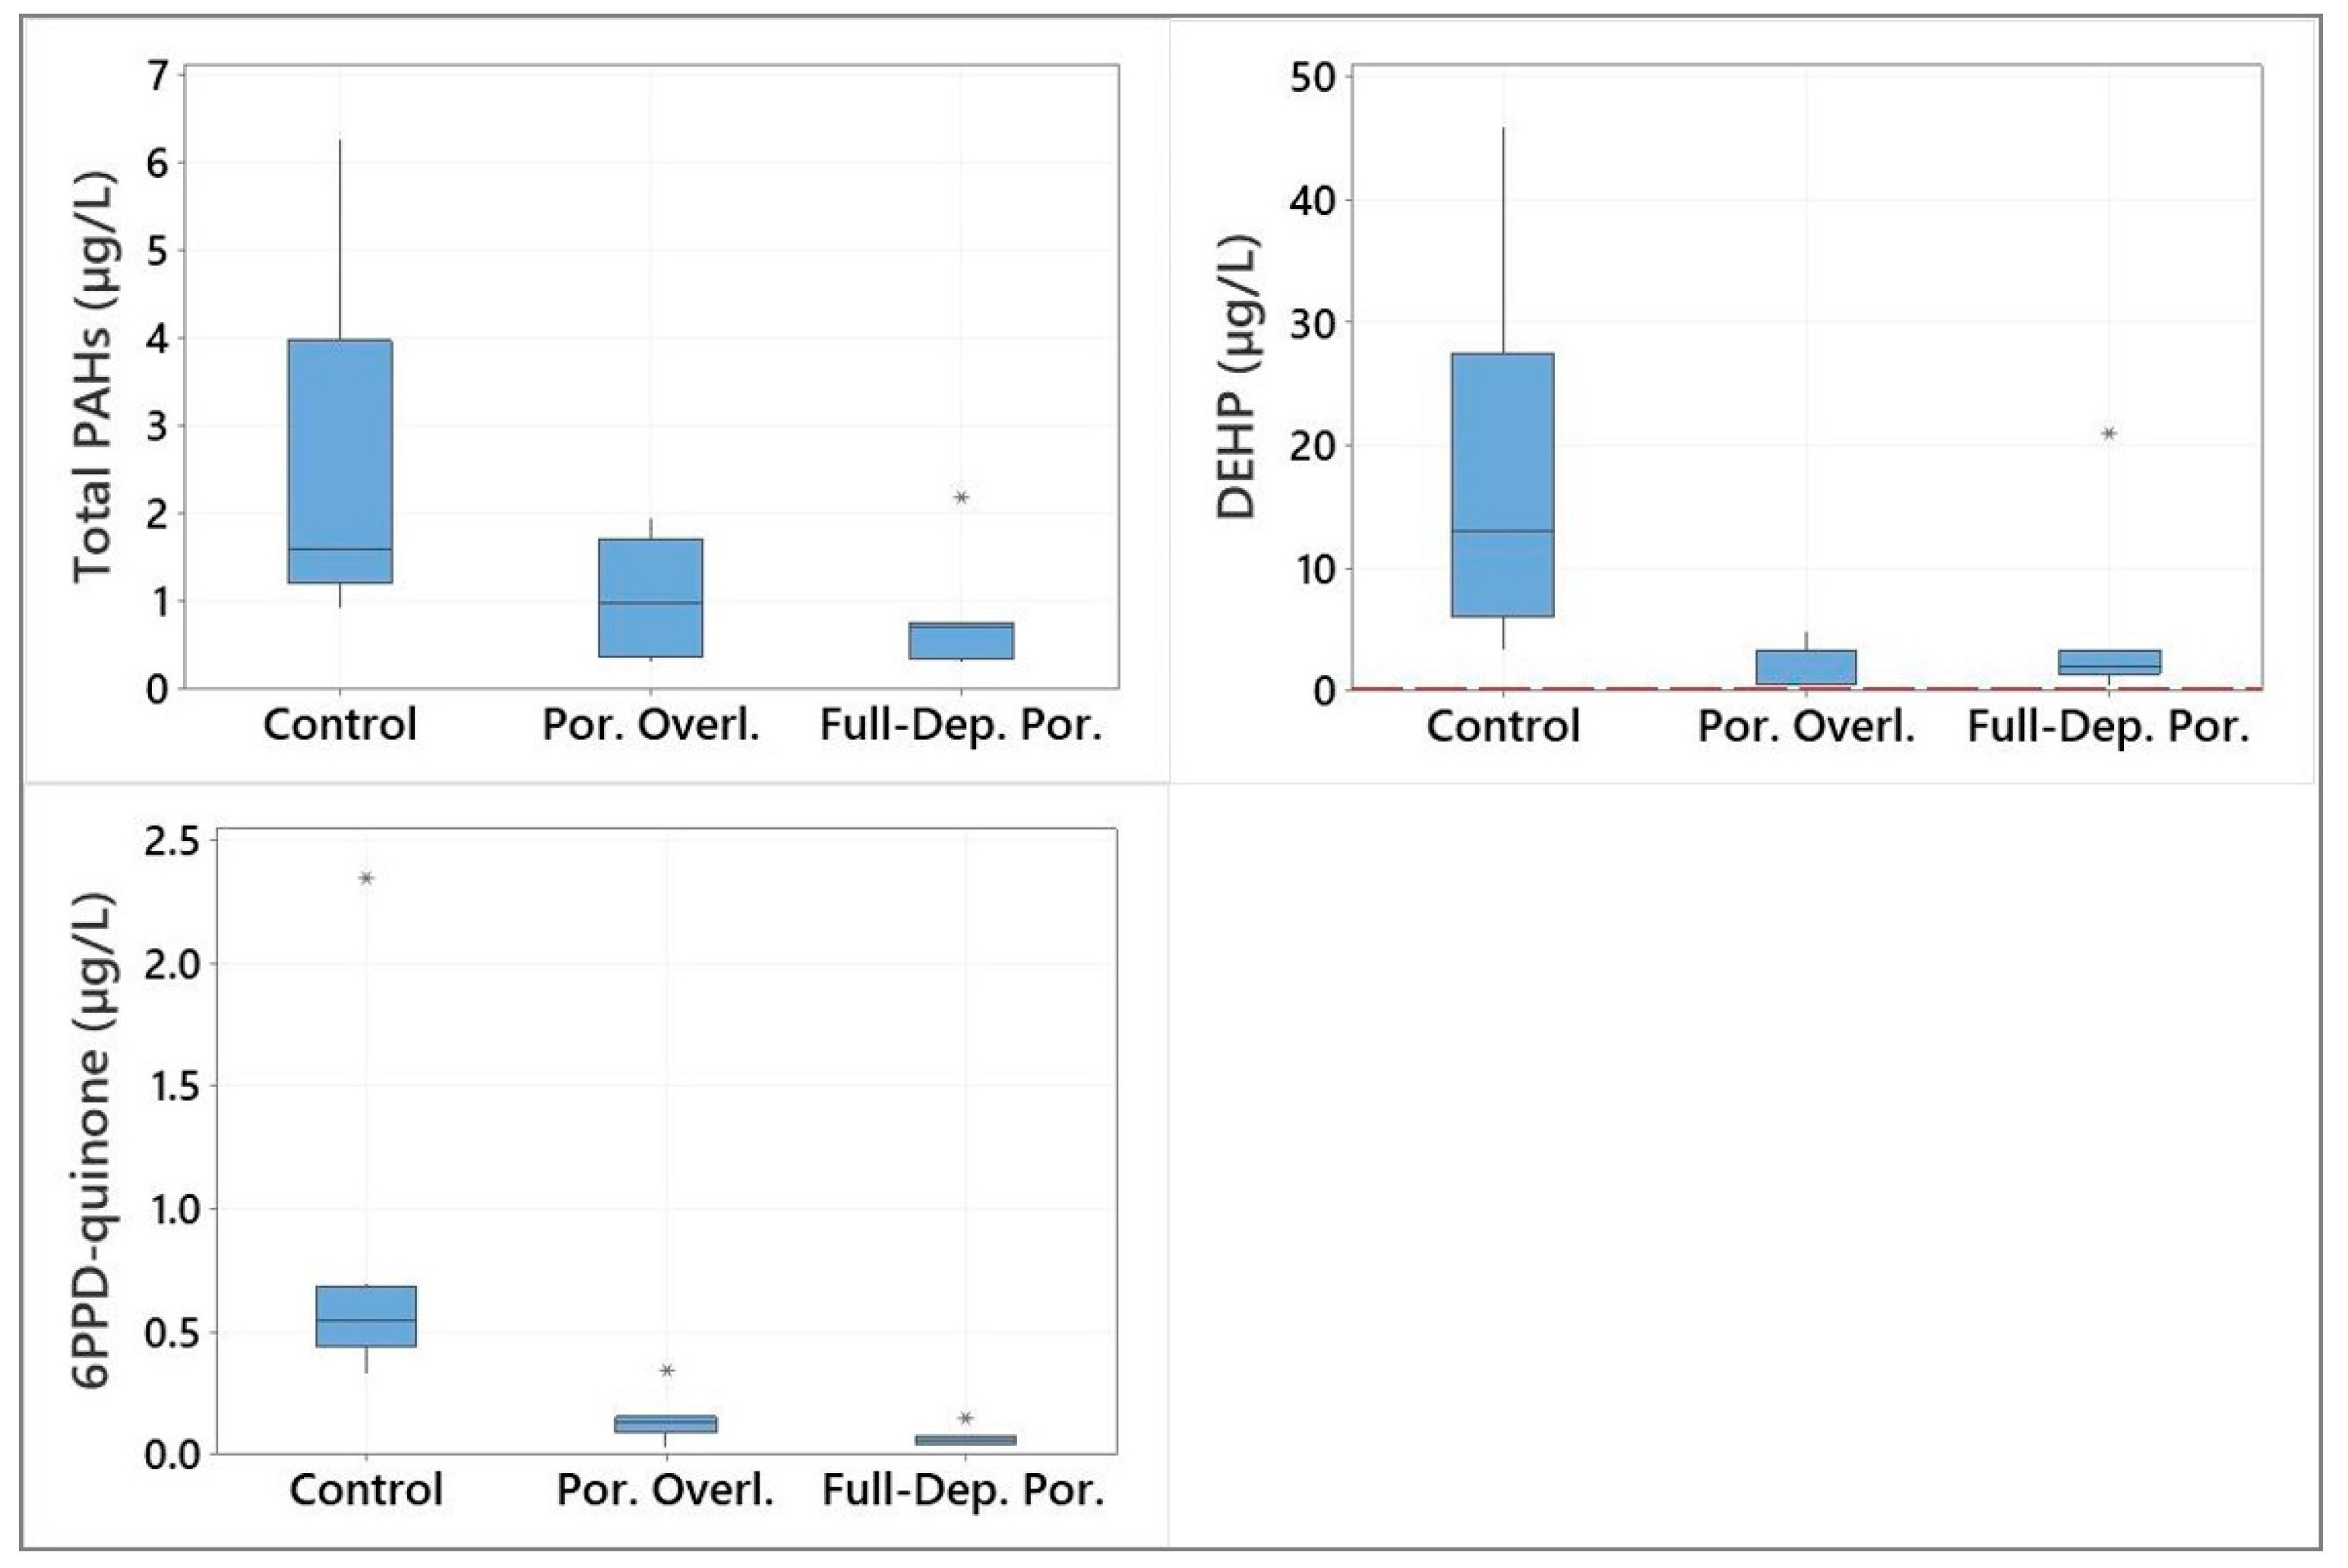

Table 1.
Analysis methods for each water quality analyte.
| Analyte | Method |
|---|---|
| Turbidity | Hach 2100Q Turbidimeter |
| pH, conductivity, temperature, dissolved oxygen | YSI Pro Plus Multi-Meter Probe |
| Ammonia, nitrate | EPA 300.0 |
| Phosphate | EPA 365.1 |
| Total Kjeldahl Nitrogen (TKN) | EPA 351.2 |
| Total Phosphorus | EPA 365.4 |
| 5-Day Biochemical Oxygen Demand (BOD) | SM 5210B |
| Total Suspended Solids (TSS) | SM 2540D |
| Total mercury, lead, copper, zinc | EPA 200.8 |
| Dissolved lead, copper, zinc | EPA 200.8 |
| E. coli | SM 9223B |
| PAHs and phthalates | EPA 8270-SIM |
| 6PPD-quinone | ALS Environmental Laboratories In-House Method |
Table 2.
Average Percent Reduction in Pollutants.
| Category | Analyte | Porous Overlay | Full-Depth Porous |
|---|---|---|---|
| Particles | Total Suspended Solids | 82 | 87 |
| Turbidity | 83 | 90 | |
| Nutrients, BOD, and E. coli | Total Kjeldahl Nitrogen | 59 | 64 |
| Ammonia | 64 | 76 | |
| Nitrate | -231 | -113 | |
| Total Phosphorus | 61 | 64 | |
| Orthophosphate | -78 | -39 | |
| Biochemical Oxygen Demand | 69 | 60 | |
| E. coli | 4 | 44 | |
| Metals | Total Copper | 76 | 81 |
| Total Lead | 82 | 85 | |
| Total Mercury | 60 | 56 | |
| Total Zinc | 44 | 70 | |
| Dissolved Copper | 50 | 52 | |
| Dissolved Lead | 35 | 35 | |
| Dissolved Zinc | -108 | 38 | |
| Organic Compounds | Total PAHs | 55 | 69 |
| Di-2-ethylhexyl phthalate | 77 | 68 | |
| 6PPD-quinone | 80 | 90 |
Disclaimer/Publisher’s Note: The statements, opinions and data contained in all publications are solely those of the individual author(s) and contributor(s) and not of MDPI and/or the editor(s). MDPI and/or the editor(s) disclaim responsibility for any injury to people or property resulting from any ideas, methods, instructions or products referred to in the content. |
© 2024 by the authors. Licensee MDPI, Basel, Switzerland. This article is an open access article distributed under the terms and conditions of the Creative Commons Attribution (CC BY) license (http://creativecommons.org/licenses/by/4.0/).
Copyright: This open access article is published under a Creative Commons CC BY 4.0 license, which permit the free download, distribution, and reuse, provided that the author and preprint are cited in any reuse.


