
Submitted:
03 August 2024
Posted:
05 August 2024
You are already at the latest version
Abstract
Nutrient profiling (NP) models that assess nutrient density of foods can help remedy micronutrient deficiencies. We used NP methods to identify the most nutrient-rich foods in the 2019 FAO/INFOODS Western Africa Food Composition Table (WAFCT). The WAFCT had complete data for 909 foods. Three versions of the well-established Nutrient Rich Food (NRF) model were used: 1) the original NRF9.3; 2) a new NRF6.3 based on 6 priority micronutrients (iron, zinc, calcium, folate, vitamin A, vitamin B12); and 3) NRF 15.3, based on 15 nutrients to encourage (NRF6.3 nutrients + vitamin D, vitamin E, vitamin C, vitamin B1, vitamin B2, vitamin B3, vitamin B6, copper, and magnesium). Data analyses used one-way ANOVAs and independent t-tests, with significance at α=0.05. Animal-source foods were rated higher by NRF6.3 priority micronutrient and NRF15.3 NP models than by the NRF9.3 model. African indigenous vegetables had higher protein content and higher nutrient density compared to non-indigenous vegetables. African indigenous grains had higher nutrient density compared to non-indigenous grains. Though animal-source foods received some of the highest scores, NP models adapted to the West African context showed that African indigenous vegetables and grains were also nutrient rich. Indigenous foods could be important sources of priority micronutrients for the region.
Keywords:
nutrient profiling
; nutrient rich foods (NRF index)
; priority micronutrients
; African indigenous vegetables
; African indigenous grains
; animal-source foods
1. Introduction
Starchy diets commonly consumed in Sub-Saharan Africa often lack iron, zinc, calcium, folate, vitamin A, and vitamin B12 [1,2,3]. One reason for micronutrient deficits might be limited dietary diversity [4], a proxy measure for micronutrient adequacy [5,6]. Studies using the United Nations Food and Agriculture Organization (FAO) Minimum Dietary Diversity Score for Women (MDDW) [7] showed that increasing dietary diversity can prevent multiple micronutrient deficiencies [8,9]. Regional dietary guidelines for West Africa have likewise stressed the importance of diverse diets, promoting the consumption of grains, vegetables, and fruit along with animal products such as eggs, dairy, fish, and organ meats [10]. However, to this date, only 4 out of the 16 countries in Western Africa have developed food-based dietary guidelines [11,12,13,14].
Nutrient profiling (NP) methods can help in the implementation of food-based dietary guidelines. NP methods are designed to identify nutrient-rich foods that best fulfil population nutrient requirements and address identified health needs and [15]. For example, the WHO African Region NP model, designed to prevent childhood obesity, penalizes foods high in calories, saturated fat, added sugar, and salt but does not include any micronutrients at all [16]. While many NP models are based on nutrients to limits (fat, sugar, salt), they can also include nutrients to encourage (protein, fiber, vitamins, and minerals) or some combination of both.. NP models that include micronutrients might be the best option for West Africa,, where micronutrient deficiencies remain a significant concern.
New NP models, sensitive to local contexts and health needs, need to be based on local and regional nutrient composition databases [17,18]. This study applied variants of the well-established Nutrient Rich Food Index (NRF) [19] to regional foods in the Food Composition Table for Western Africa (WAFCT 2019) [20], maintained by the FAO and the International Network of Food Data Systems (INFOODS). The WAFCT contains nutrient values for more than 1,000 foods frequently consumed in this region [20].
Our goal was to identify the most nutrient-rich foods in the WAFCT, using three different NRF models. We sought to investigate whether foods rich in the region’s priority micronutrients could be identified among African indigenous vegetables and grains.
2. Materials and Methods
2.1. Nutrient Composition Database
The FAO/INFOODS Food Composition Table for Western Africa 2019 (WAFCT) [20] lists 1,028 foods and beverages, their names in English and French, along with energy and nutrient content. The original WAFCT had multiple missing nutrient values. Where possible, nutrient values for the same raw foods were obtained from the USDA Food and Nutrient Database for Dietary Studies 2017-18 [21]. Foods with missing values that could not be matched were excluded. Values for added sugars were imputed using standard procedures [22]. For mixed dishes, added sugars for each ingredient were calculated and summed, following WAFCT recipes provided. After excluding 119 items, the 909 foods with complete information were analyzed using the WAFCT 14 food categories. The categories were cereals (18.6%), meat and poultry (13%), legumes (12.7%), vegetables (12.4%), fish and seafood (11.7%), starchy roots and tubers (9.8%), fruits (4.8%), fats and oils (3.9%), soups and sauces (3.7%), nuts and seeds (3.3%), milk and dairy (2.5%), eggs (1.5%), beverages (1.3%), and miscellaneous foods (0.8%).
The present analyses added categories to align with the FAO Minimum Dietary Diversity for Women Indicator [7]. Vegetables (n=113) were divided into dark green leafy vegetables (52.2%), vitamin A-rich vegetables (10.6%), and other vegetables (37.2%). Fruits (n=44) were divided into vitamin A-rich fruits (18.2%) and other fruits (81.8%).
Vegetables and grains in WAFCT were further classified into African Indigenous Vegetables (AIV, n=43) and African Indigenous Grains (AIG, n=55). Vegetables were classified as AIV if they were in their raw or minimally processed state, or as AIV preparations if they were incorporated into mixed meals or recipes. There were 10 basic AIV items: amaranth leaves, spider plant, jute mallow, cowpea leaves, native eggplant, pumpkin leaves, moringa, sweet potato leaves, okra, and okra leaves. AIGs were raw or minimally processed grains, as well as flours derived from these grains. There were 5 AIGs: fonio, pearl millet, teff, sorghum, and native rice. Non-indigenous grains included maize, wheat, rice, and oats. Mixed dishes using indigenous and non-indigenous grains were excluded from the AIG analyses.
Foods were manually classified into animal-source or plant-source foods based on protein content. Animal source foods included meat and poultry protein; milk, eggs, and dairy protein; and fish and seafood protein. For mixed dishes, recipe ingredients were used to determine the percentage of protein of each of the types in the dish. For nutrient profiling, food items with energy density of <10kcal/g, such as water, diet beverages, and coffee and tea were excluded. Also excluded were alcoholic beverages, herbs, and spices.
2.2. Nutrient Rich Food Indicies
The Nutrient Rich Food Index (NRF) has two sub scores that are based on a variable number of nutrients to encourage (NRn) (equation 1) and nutrients to limit (equation 2) [19,23]. This study used three variants of the NRF: NRF9.3 (standard version), NRF6.3 (priority micronutrients), and NRF15.3 (extended priority nutrients). The NRF9.3 includes nine nutrients to encourage, including protein, fiber, calcium, iron, potassium, magnesium, vitamin A, vitamin C, and vitamin D. The NRF6.3 Priority Micronutrients score adds 6 further nutrients to encourage commonly lacking in the West African region [3]: iron, zinc, calcium, vitamin A (RAE), vitamin B12, and folate. The NRF15.3 Extended Priority Nutrients score adds 15 additional nutrients to encourage: vitamin A, vitamin D, vitamin E, vitamin C, vitamin B1, vitamin B2, vitamin B3, vitamin B6, vitamin B12, folate, copper, calcium, iron, magnesium, and zinc. All three models use the same three nutrients to limit (LIM): sodium, saturated fats, and added sugars.
Nutrient standards were taken from the Codex Alimentarius [24] (Table 1). The final NRFn.k scores (equation 3) are calculated as the sum of percent daily values for n nutrients to encourage (Nut_inci) minus the sum of percent daily values for the 3 nutrients to limit (Nut_limi). Percent daily values (%DV) were calculated per 100 kcal (energy density; ED) of food and were capped at 100%: The mathematical expressions are given below.
2.3. Statistical Analysis
Mean, standard deviation, and median values of energy density, NRF9.3, NRF6.3, and NRF15.3 were calculated for each food group. Sensitivity analyses were conducted to evaluate the robustness of the findings, with and without the inclusion of outliers.
One-way ANOVAs and independent t-tests were used to conduct multiple comparisons of nutrient density and protein content across food groups. The Bonferroni correction was used to adjust for multiple testing, and any significant differences were indicated. The significance level for all tests was set at α=0.05. SPSS 28 statistical software (IBM) was used to perform all statistical analyses.
3. Results
3.1. Nutrient Density
Table 2 shows means, standard deviations, and medians for NRF9.3 by the 14 WAFCT food groups. Based on the NRF9.3, the vegetable group (263.0) had the highest score of all food groups, having a significant difference to the next highest food group score (fruits: 89.56). Fish and seafood, and legumes were the next food groups with the highest scores. Fats and oils, and miscellaneous foods (containing mostly sugars and marmalades) were the food groups with lowest NRF9.3 scores. Figure 1a shows the distribution of NRF9.3 scores and energy density by WAFCT food groups.
Table 3 shows scores of the NRF6.3 by the 14 WAFCT food groups. Vegetables were the food group with the highest NRF6.3 score, followed by fish and seafood, meat and poultry, eggs, and legumes. Fruits were found to be in the ninth place out of the 14 food groups based on NRF6.3. Moreover, miscellaneous foods, fats and oils, and beverages were the food groups with the lowest NRF6.3 scores. Figure 1b shows the distribution of NRF6.3 (priority micronutrients) scores and energy density by WAFCT food groups.
Table 4 shows mean, standard deviation, and median scores of the NRF15.3 (extended priority nutrients) by the 14 WAFCT food groups. Based on the NRF15.3 scores, the ranking of food groups also changed. Since more nutrients were used in the model, the overall scores were higher in value. Like the previous NRF versions, vegetables were the food group with the highest NRF15.3 scores. Moreover, animal-source foods received some of the highest NRF15.3 scores, compared to the NRF9.3. Fish and seafood was the second food group with highest scores, just as with the NRF6.3. The next food groups with the highest scores were meat and poultry; eggs; fruits; and soups and sauces. Figure 1c shows the distribution of NRF15.3 (extended priority nutrients) scores and energy density by WAFCT food groups.
Table 5 shows a list of the top 20 foods with the highest scores for each of the NRF versions. Dark green leafy vegetables, both raw and boiled, lead all lists, as they were the most nutrient-dense foods. However, while the top NRF9.3 foods are only leafy vegetables, the top NRF6.3 and NRF15.3 lists also contain poultry, meat, fish, and organ foods.
3.1.1. Nutrient Density of African Indigenous Vegetables (AIV)
Nutrient density and protein content of AIV and mixed AIV dishes were analyzed and compared with the rest of the vegetables. Table 6 shows that all three NRF models gave higher nutrient density scores to AIV than to non-indigenous vegetables; the differences were more pronounced with the NRF6.3 and NRF15.3 (better adapted to West African needs), than with NRF9.3. The predominance of AIV on the top 20 NRF scores list can also be observed in Table 5. Protein content of mixed dishes was also assessed. Overall, preparations with AIV had more protein mainly because various local AIV preparations also contained some fish and meat.
3.1.2. Nutrient Density of African Indigenous Grains (AIG)
AIG were compared to non-indigenous grains using different NRF models as shown in Table 6. AIGs scored higher than non-indigenous grains; however, only the NRF9.3 scores were significantly different. After removing 10 fortified flours, comparing AIGs and non-fortified non-indigenous grains showed that the three NRF scores were significantly higher for AIG compared to non-indigenous grains.
4. Discussion
The present study applied NP methods to evaluate nutrient density of more than 900 foods in the FAO West Africa database. The NP models were adapted to the West Africa context, taking differences in micronutrient nutrition into account. For instance, while the United States identifies dietary fiber, calcium, potassium, iron, and vitamin D as nutrients of public health concern [25], LMICs commonly face deficiencies in iron, zinc, folate, vitamin A, calcium, and vitamin B12 [3]. Many existing nutrient profiling tools, including the NRF, may need to be adapted for use in LMICs by incorporating priority micronutrients of interest [17,18].
Three NRF versions were used to assess nutrient density of West Africa foods. Only the original NRF9.3 model included protein and fiber as nutrients to encourage; the other NP models did not. The NRF6.3 model featured priority micronutrients known to be missing from some overly starchy West African diets. These were iron, zinc, calcium, folate, vitamin A, vitamin B12. The more comprehensive NRF15.3 score that included vitamin A, vitamin D, vitamin E, vitamin C, vitamin B1, vitamin B2, vitamin B3, vitamin B6, vitamin B12, folate, copper, calcium, iron, magnesium, and zinc.
All three NRF models rated vegetables as the most nutrient rich food group. Within the vegetable group, dark green leafy vegetables had the highest nutrient density scores, followed by vitamin A-rich vegetables. The FAO Minimum Dietary Diversity for Women (MDD-W) specifically features dark green leafy vegetables and vitamin A-rich vegetables as important sources of micronutrients [7]. The MDD-W food groups represent the main sources of priority micronutrients that are essential for women of childbearing age. Dietary diversity is a proxy measure for micronutrient adequacy [5,6].
Based on NRF scores, African indigenous vegetables (AIV) had higher nutrient density and higher protein content compared to non-indigenous vegetables. Various AIV were also classified as dark green leafy vegetables. Similarly, African Indigenous Grains (AIG) presented substantially higher nutrient density scores than non-fortified non-indigenous grains. These findings emphasize the vital role of African indigenous vegetables and grains in providing essential micronutrients. Thus, advocating for the consumption of local foods should be prioritized when developing strategies and programs aimed at addressing malnutrition in the Western Africa region. Other studies have also identified AIVs as a potential solution to malnutrition [26] and even as climate resilient foods due to their tolerance to high temperatures and precipitation [27]. However, various challenges, such as inadequate progress in agronomic techniques and limited access to AIVs in the market place, have been identified [28]. An increase in the consumption of AIVs could improve micronutrient deficiencies within at-risk populations in Western Africa.
West African diets can be high in carbohydrate content, incorporating grains, cereals, legumes, roots, tubers, and plantains [29]. The present analyses pointed to specific AIGs as important sources of micronutrients. The nutritional advantages of AIGs have been previously documented [30], and more recent evidence indicates a growing interest in these foods [31,32,33].
Micronutrient centered NRF6.3 and NRF15.3 models gave higher ratings to animal-source foods compared to plant foods, even though protein was not a component of those two models. Animal proteins are rich in multiple priority micronutrients and can play a pivotal role in LMIC nutrition [34]. The FAO has emphasized the importance of meat, eggs, and milk as critical sources of vital nutrients that are not readily obtainable from plant-based food sources [35]. The significance of fish and seafood has also been underscored [36]. However, livestock, including both meat and dairy, has been linked to higher greenhouse gas emissions and a negative planetary impact [37]. Consequently, there has been a push to reduce the consumption of animal-source food to mitigate the impacts of climate change [38,39,40]. While reducing meat consumption is advocated as a means of improving health and reducing the impacts of climate change, most of the evidence comes from high income countries that may already be at peak meat consumption [37,41]. That is not the case across most LMICs. Priority micronutrients in LMICs are predominantly found in organs, meats, dark green leafy vegetables, seafood, and eggs [3]. Higher consumption of animal-source foods can lead to improved nutrient intake and reduced malnutrition among many populations in sub-Saharan Africa [34]. Moreover, reducing meat consumption in LMICs could adversely affect the livelihoods of many low-income populations who rely on livestock, poultry, and fishing [42]. Therefore, dietary recommendations in LMICs should carefully consider these trade-offs.
Our study had some limitations. First, having access to accurate local nutrient composition data is the first step in NP modeling [17]. The WAFCT [20] had to be updated, revised, and checked for missing data before it could be used as proxy for the regional food supply. The published WAFCT still had a significant number of missing nutrient values that needed to be cross referenced with other data and/or imputed based on the existing literature. Data from the USDA was utilized to fill the gaps in nutrient composition; however, nutrient profiles of foods may differ across different regions [43]. Significant effort went into quality control, leading to the development of a cleaned and coded WAFCT database for 909 items. Second, the WAFCT database primarily consists of minimally processed foods along with some processed foods. Not all foods within a given food group are of equivalent nutritional value. Nutrient profiling models can help to identify and rank locally available nutrient-rich foods within each food group [44]. There is a need for a comprehensive database of branded processed and ultra-processed foods in the West Africa region that has both nutrient content and an electronic ingredient list [45]. The WAFCT may no longer represent the totality of the West Africa food supply and does not include many of the packaged processed foods currently consumed by the population. Lastly, micronutrient deficiencies often stem from the high cost of a nutrient rich diet [46,47,48]. High rates of micronutrient deficiencies in the Western Africa region [49] can be remedied by improved access to nutrient-rich and affordable foods [50]. We were not able to assess food costs due to the absence of food price data in West Africa.
5. Conclusions
To the best of our knowledge, the present analyses represent the first application of NP methods to the WAFCT 2019 dataset. Demonstrating high nutrient density of African indigenous vegetables (AIV) and African indigenous grains (AIG) was a finding of particular interest. Local agriculture has the potential to improve the population’s diet quality by supplying nutrient rich foods at an affordable cost. Those foods could be included in food-based dietary guidelines for the region.
Author Contributions
Conceptualization, J.L.A. and A.D.; methodology, J.L.A.; formal analysis, J.L.A.; investigation, J.L.A.; data curation, J.L.A.; writing—original draft preparation, J.L.A.; writing—review and editing, J.L.A., A.L., M.P.C., and A.D.; visualization, J.L.A.; supervision, A.L., M.P.C., and A.D. All authors have read and agreed to the published version of the manuscript.
Funding
This research received no external funding.
Data Availability Statement
Publicly available datasets were analyzed in this study. This data can be found at: https://www.fao.org/3/ca7779b/CA7779B.PDF (Accessed February 26, 2024). The original contributions presented in the study are included in the article, further inquiries can be directed to the corresponding author.
Acknowledgments
Contents of the manuscript have been previously published on an academic repository as part of the masters’ thesis of the primary author. The thesis report can be found at: http://libproxy.lib.unc.edu/login?url=https://www.proquest.com/dissertations-theses/nutrient-rich-foods-western-african-food-supply/docview/2836698376/se-2?accountid=14244.
Conflicts of Interest
A.D. is the original developer of the Naturally Nutrient Rich (NNR) and the Nutrient Rich Food (NRF) nutrient profiling models and is a member of scientific advisory panels for National Pork Board, Nestlé, FrieslandCampina, and BEL. AD has worked with Ajinomoto, Carbohydrate Quality Panel supported by Potatoes USA, dsm-firmenich, FoodMinds, KraftHeinz, Meiji, MS-Nutrition, Nutrition Impact LLC, Nutrition Institute, PepsiCo, Samsung, and Soremartec on quantitative ways to assess nutrient density of foods. The other authors declare that the research was conducted in the absence of any commercial or financial relationships that could be construed as a potential conflict of interest.
References
- von Grebmer, K.; Saltzman, A.; Birol, E.; Wiesmann, D.; Prasai, N.; Yin, S.; Yohannes, Y.; Menon, P.; Thompson, J.; Sonntag, A. 2014 Global Hunger Index: The Challenge of Hidden Hunger; Welthungerhilfe, International Food Policy Research Institute, and Concern Worldwide: Bonn, Washington, D.C., and Dublin, 2014. Available online: https://ebrary.ifpri.org/utils/getfile/collection/p15738coll2/id/128360/filename/128571.pdf (accessed on 1 August 2024).
- Stevens, G.A.; Beal, T.; Mbuya, M.N.N.; Luo, H.; Neufeld, L.M.; Addo, O.Y.; Adu-Afarwuah, S.; Alayón, S.; Bhutta, Z.; Brown, K.H.; et al. Micronutrient Deficiencies among Preschool-Aged Children and Women of Reproductive Age Worldwide: A Pooled Analysis of Individual-Level Data from Population-Representative Surveys. Lancet Glob Health 2022, 10, e1590–e1599. [Google Scholar] [CrossRef] [PubMed]
- Beal, T.; Ortenzi, F. Priority Micronutrient Density in Foods. Front Nutr 2022, 9. [Google Scholar] [CrossRef] [PubMed]
- Beal, T.; Massiot, E.; Arsenault, J.E.; Smith, M.R.; Hijmans, R.J. Global Trends in Dietary Micronutrient Supplies and Estimated Prevalence of Inadequate Intakes. PLOS ONE 2017, 12, e0175554. [Google Scholar] [CrossRef] [PubMed]
- Nair, M.K.; Augustine, L.F.; Konapur, A. Food-Based Interventions to Modify Diet Quality and Diversity to Address Multiple Micronutrient Deficiency. Front Public Health 2016, 3. [Google Scholar] [CrossRef] [PubMed]
- Lowe, N.M. The Global Challenge of Hidden Hunger: Perspectives from the Field. Proc Nutr Soc 2021, 80, 283–289. [Google Scholar] [CrossRef] [PubMed]
- Food and Agriculture Organization of the United Nations. Minimum Dietary Diversity for Women: An Updated Guide to Measurement - from Collection to Action; FAO: Rome, Italy, 2021; ISBN 978-92-5-133993-0. [Google Scholar]
- Gómez, G.; Nogueira Previdelli, Á.; Fisberg, R.M.; Kovalskys, I.; Fisberg, M.; Herrera-Cuenca, M.; Cortés Sanabria, L.Y.; Yépez García, M.C.; Rigotti, A.; Liria-Domínguez, M.R.; et al. Dietary Diversity and Micronutrients Adequacy in Women of Childbearing Age: Results from ELANS Study. Nutrients 2020, 12, 1994. [Google Scholar] [CrossRef] [PubMed]
- Adubra, L.; Savy, M.; Fortin, S.; Kameli, Y.; Kodjo, N.E.; Fainke, K.; Mahamadou, T.; Le Port, A.; Martin-Prevel, Y. The Minimum Dietary Diversity for Women of Reproductive Age (MDD-W) Indicator Is Related to Household Food Insecurity and Farm Production Diversity: Evidence from Rural Mali. Curr Dev Nutr 2019, 3, nzz002. [Google Scholar] [CrossRef]
- Food and Agriculture Organization of the United Nations. Food-Based Dietary Guidelines. Available online: http://www.fao.org/nutrition/education/food-dietary-guidelines/home/en/ (accessed on 1 August 2024).
- Ministry of Food and Agriculture; University of Ghana School of Public Health. Food-Based Dietary Guidelines; Accra, Ghana, 2023. Available online: https://res.cloudinary.com/dltpgmjmq/image/upload/q_auto:good/user-media-prod/Ghana_Food-Based_Dietary_Guidelines_2023_tcaeqt (accessed on 1 August 2024).
- Ministry of Agriculture, Forestry and Food Security; Ministry of Health and Sanitation Sierra Leone. Food-Based Dietary Guidelines for Healthy Eating. Available online: http://www.fao.org/nutrition/education-nutritionnelle/food-dietary-guidelines/regions/sierra-leone/fr/ (accessed on 1 August 2024).
- Federal Ministry of Health. Food-Based Dietary Guidelines for Nigeria. Available online: http://www.fao.org/nutrition/educacion-nutricional/food-dietary-guidelines/regions/nigeria/es/ (accessed on 1 August 2024).
- Regional Institute of Public Health of Ouidah. Guide Alimentaire Du Bénin. Available online: http://www.fao.org/nutrition/education/food-dietary-guidelines/regions/benin/en/ (accessed on 1 August 2024).
- Drewnowski, A.; Maillot, M.; Darmon, N. Testing Nutrient Profile Models in Relation to Energy Density and Energy Cost. Eur J Clin Nutr 2009, 63, 674–683. [Google Scholar] [CrossRef] [PubMed]
- WHO Regional Office for Africa Nutrient Profile Model for the WHO African Region: a tool for implementing WHO recommendations on the marketing of foods and non-alcoholic beverages to children; WHO: Brazzaville, 2018. Available online: https://www.who.int/publications-detail-redirect/9789290234401 (accessed on 1 August 2024).
- Drewnowski, A.; Amanquah, D.; Gavin-Smith, B. Perspective: How to Develop Nutrient Profiling Models Intended for Global Use: A Manual. Adv Nutr 2021, 12, 609–620. [Google Scholar] [CrossRef] [PubMed]
- World Health Organization Nutrient Profiling: Report of a WHO/IASO Technical Meeting, London, United Kingdom 4-6 October 2010; World Health Organization, 2011.
- Fulgoni, V.L.; Keast, D.R.; Drewnowski, A. Development and Validation of the Nutrient-Rich Foods Index: A Tool to Measure Nutritional Quality of Foods. J Nutr 2009, 139, 1549–1554. [Google Scholar] [CrossRef] [PubMed]
- Vincent, A.; Grande, F.; Campaoré, E.; Amponsah Annor, G.; Addy, P.; Chinelo Aburime, L.; Ahmed, D.; Bih Loh, A.M.; Dahdouh Cabia, S.; Deflache, N.; et al. FAO/INFOODS Food Composition Table for Western Africa (2019) User Guide & Condensed Food Composition Table; FAO: Rome, Italy, 2020; Available online: https://www.fao.org/3/ca7779b/CA7779B.PDF (accessed on 1 August 2024).
- U.S. Department of Agriculture. USDA Food and Nutrient Database for Dietary Studies 2017-2018; 2018. Available online: https://www.ars.usda.gov/ARSUserFiles/80400530/pdf/fndds/2017_2018_FNDDS_Doc.pdf (accessed on 1 August 2024).
- Wanselius, J.; Axelsson, C.; Moraeus, L.; Berg, C.; Mattisson, I.; Larsson, C. Procedure to Estimate Added and Free Sugars in Food Items from the Swedish Food Composition Database Used in the National Dietary Survey Riksmaten Adolescents 2016–17. Nutrients 2019, 11, 1342. [Google Scholar] [CrossRef] [PubMed]
- Drewnowski, A. The Nutrient Rich Foods Index Helps to Identify Healthy, Affordable Foods. Am J Clin Nutr 2010, 91, 1095S–1101S. [Google Scholar] [CrossRef] [PubMed]
- Lewis, J. Codex Nutrient Reference Values; FAO and WHO: Rome, Italy, 2019; ISBN 978-92-5-131957-4. [Google Scholar]
- Linus Pauling Institute. Micronutrient Inadequacies in the US Population: An Overview. Available online: https://lpi.oregonstate.edu/mic/micronutrient-inadequacies/overview (accessed on 1 August 2024).
- Merchant, E.V.; Odendo, M.; Ndinya, C.; Nyabinda, N.; Maiyo, N.; Downs, S.; Hoffman, D.J.; Simon, J.E. Barriers and Facilitators in Preparation and Consumption of African Indigenous Vegetables: A Qualitative Exploration From Kenya. Front Sustain Food Syst 2022, 6. [Google Scholar] [CrossRef]
- Chivenge, P.; Mabhaudhi, T.; Modi, A.T.; Mafongoya, P. The Potential Role of Neglected and Underutilised Crop Species as Future Crops under Water Scarce Conditions in Sub-Saharan Africa. Int J Environ Res Public Health 2015, 12, 5685–5711. [Google Scholar] [CrossRef] [PubMed]
- Simon, J.; Weller, S.; Hoffman, D.; Govindasamy, R.; Morin, X.; Merchant, E.; Dinssa, F.; Wyk, E.V.; Byrnes, D.; Odendo, M.; et al. Improving Income and Nutrition of Smallholder Farmers in Eastern Africa Using a Market-First Science-Driven Approach to Enhance Value Chain Production of African Indigenous Vegetables. J Med Act Plants 2020, 9, 289–309. [Google Scholar] [CrossRef]
- Galbete, C.; Nicolaou, M.; Meeks, K.A.; de-Graft Aikins, A.; Addo, J.; Amoah, S.K.; Smeeth, L.; Owusu-Dabo, E.; Klipstein-Grobusch, K.; Bahendeka, S.; et al. Food Consumption, Nutrient Intake, and Dietary Patterns in Ghanaian Migrants in Europe and Their Compatriots in Ghana. Food Nutr Res 2017, 61, 1341809. [Google Scholar] [CrossRef] [PubMed]
- National Research Council. Lost Crops of Africa: Volume I: Grains; National Academies Press: Washington, D.C, 1996; ISBN 978-0-309-04990-0. [Google Scholar]
- Held, L. Is Fonio the Ancient Grain of the Future? Available online: https://civileats.com/2021/01/04/is-fonio-the-ancient-grain-of-the-future/ (accessed on 1 August 2024).
- Whole Grains Council. Whole Grains and the African Heritage Diet. Available online: https://wholegrainscouncil.org/blog/2018/02/whole-grains-and-african-heritage-diet (accessed on 1 August 2024).
- Samuels, R. Different Types of African Indigenous Grains. Available online: https://crushmag-online.com/different-types-of-african-indigenous-grains/ (accessed on 1 August 2024).
- Beal, T.; Gardner, C.D.; Herrero, M.; Iannotti, L.L.; Merbold, L.; Nordhagen, S.; Mottet, A. Friend or Foe? The Role of Animal-Source Foods in Healthy and Environmentally Sustainable Diets. J Nutr 2023, 153, 409–425. [Google Scholar] [CrossRef]
- Food and Agriculture Organization of the United Nations. Contribution of Terrestrial Animal Source Food to Healthy Diets for Improved Nutrition and Health Outcomes: An Evidence and Policy Overview on the State of Knowledge and Gaps; FAO: Rome, Italy, 2023; Available online: http://www.fao.org/documents/card/en/c/cc3912en (accessed on 1 August 2024).
- Tigchelaar, M.; Leape, J.; Micheli, F.; Allison, E.H.; Basurto, X.; Bennett, A.; Bush, S.R.; Cao, L.; Cheung, W.W.L.; Crona, B.; et al. The Vital Roles of Blue Foods in the Global Food System. Glob Food Secur 2022, 33, 100637. [Google Scholar] [CrossRef]
- Xu, X.; Sharma, P.; Shu, S.; Lin, T.-S.; Ciais, P.; Tubiello, F.N.; Smith, P.; Campbell, N.; Jain, A.K. Global Greenhouse Gas Emissions from Animal-Based Foods Are Twice Those of Plant-Based Foods. Nat Food 2021, 2, 724–732. [Google Scholar] [CrossRef] [PubMed]
- Hedenus, F.; Wirsenius, S.; Johansson, D.J.A. The Importance of Reduced Meat and Dairy Consumption for Meeting Stringent Climate Change Targets. Clim Change 2014, 124, 79–91. [Google Scholar] [CrossRef]
- Milman, O. Why Eating Less Meat Is the Best Thing You Can Do for the Planet in 2019. Available online: https://www.theguardian.com/environment/2018/dec/21/lifestyle-change-eat-less-meat-climate-change (accessed on 1 August 2024).
- Greenpeace. Eating Less Meat, More Plants Helps the Environment. Available online: https://www.greenpeace.org/usa/sustainable-agriculture/eco-farming/eat-more-plants/#:~:text=But%20we%20all%20must%20develop,caused%20by%20industrial%20livestock%20production (accessed on 1 August 2024).
- Willett, W.; Rockström, J.; Loken, B.; Springmann, M.; Lang, T.; Vermeulen, S.; Garnett, T.; Tilman, D.; DeClerck, F.; Wood, A.; et al. Food in the Anthropocene: The EAT–Lancet Commission on Healthy Diets from Sustainable Food Systems. The Lancet 2019, 393, 447–492. [Google Scholar] [CrossRef] [PubMed]
- Haddad, L. Eat Less Meat: If Only It Were That Simple. Available online: https://www.rural21.com/english/opinion-corner/detail/article/eat-less-meat-if-only-it-were-that-simple.html (accessed on 1 August 2024).
- de Bruyn, J.; Ferguson, E.; Allman-Farinelli, M.; Darnton-Hill, I.; Maulaga, W.; Msuya, J.; Alders, R. Food Composition Tables in Resource-Poor Settings: Exploring Current Limitations and Opportunities, with a Focus on Animal-Source Foods in Sub-Saharan Africa. Br J Nutr 2016, 116, 1709–1719. [Google Scholar] [CrossRef] [PubMed]
- Drewnowski, A. Uses of Nutrient Profiling to Address Public Health Needs: From Regulation to Reformulation. Proc Nutr Soc 2017, 76, 220–229. [Google Scholar] [CrossRef] [PubMed]
- Reardon, T.; Tschirley, D.; Liverpool-Tasie, L.S.O.; Awokuse, T.; Fanzo, J.; Minten, B.; Vos, R.; Dolislager, M.; Sauer, C.; Dhar, R.; et al. The Processed Food Revolution in African Food Systems and the Double Burden of Malnutrition. Glob Food Secur 2021, 28, 100466. [Google Scholar] [CrossRef] [PubMed]
- Masters, W.A.; Bai, Y.; Herforth, A.; Sarpong, D.B.; Mishili, F.; Kinabo, J.; Coates, J.C. Measuring the Affordability of Nutritious Diets in Africa: Price Indexes for Diet Diversity and the Cost of Nutrient Adequacy. Am J Agric Econ 2018, 100, 1285–1301. [Google Scholar] [CrossRef] [PubMed]
- Bai, Y.; Alemu, R.; Block, S.A.; Headey, D.; Masters, W.A. Cost and Affordability of Nutritious Diets at Retail Prices: Evidence from 177 Countries. Food Policy 2021, 99, 101983. [Google Scholar] [CrossRef] [PubMed]
- Mendoza-Velázquez, A.; Guzmán-Rodríguez, M.; Lara-Arévalo, J.; Drewnowski, A. The Nutrient Rich Food Price Index: A Nutrition-Relevant Adaptation of the Laspeyres Price Index to Track the Cost of Affordable Nutrient Density. Front Nutr 2023, 10. [Google Scholar] [CrossRef] [PubMed]
- Han, X.; Ding, S.; Lu, J.; Li, Y. Global, Regional, and National Burdens of Common Micronutrient Deficiencies from 1990 to 2019: A Secondary Trend Analysis Based on the Global Burden of Disease 2019 Study. eClinicalMedicine 2022, 44. [Google Scholar] [CrossRef] [PubMed]
- UN Network for SUN Compendium of Actions for Nutrition - UNSCN. Available online: https://www.unscn.org/en/unscn-publications?idnews=1384 (accessed on 1 August 2024).
Figure 1.
Nutrient Rich Foods Index scores per 100kcal. for each WAFCT food category plotted against energy density per 100g. (a) NRF9.3; (b) NRF6.3 for priority micronutrients; (c) NRF15.3 extended priority nutrients. The size of the circles represents the number of foods in each food category.
Figure 1.
Nutrient Rich Foods Index scores per 100kcal. for each WAFCT food category plotted against energy density per 100g. (a) NRF9.3; (b) NRF6.3 for priority micronutrients; (c) NRF15.3 extended priority nutrients. The size of the circles represents the number of foods in each food category.
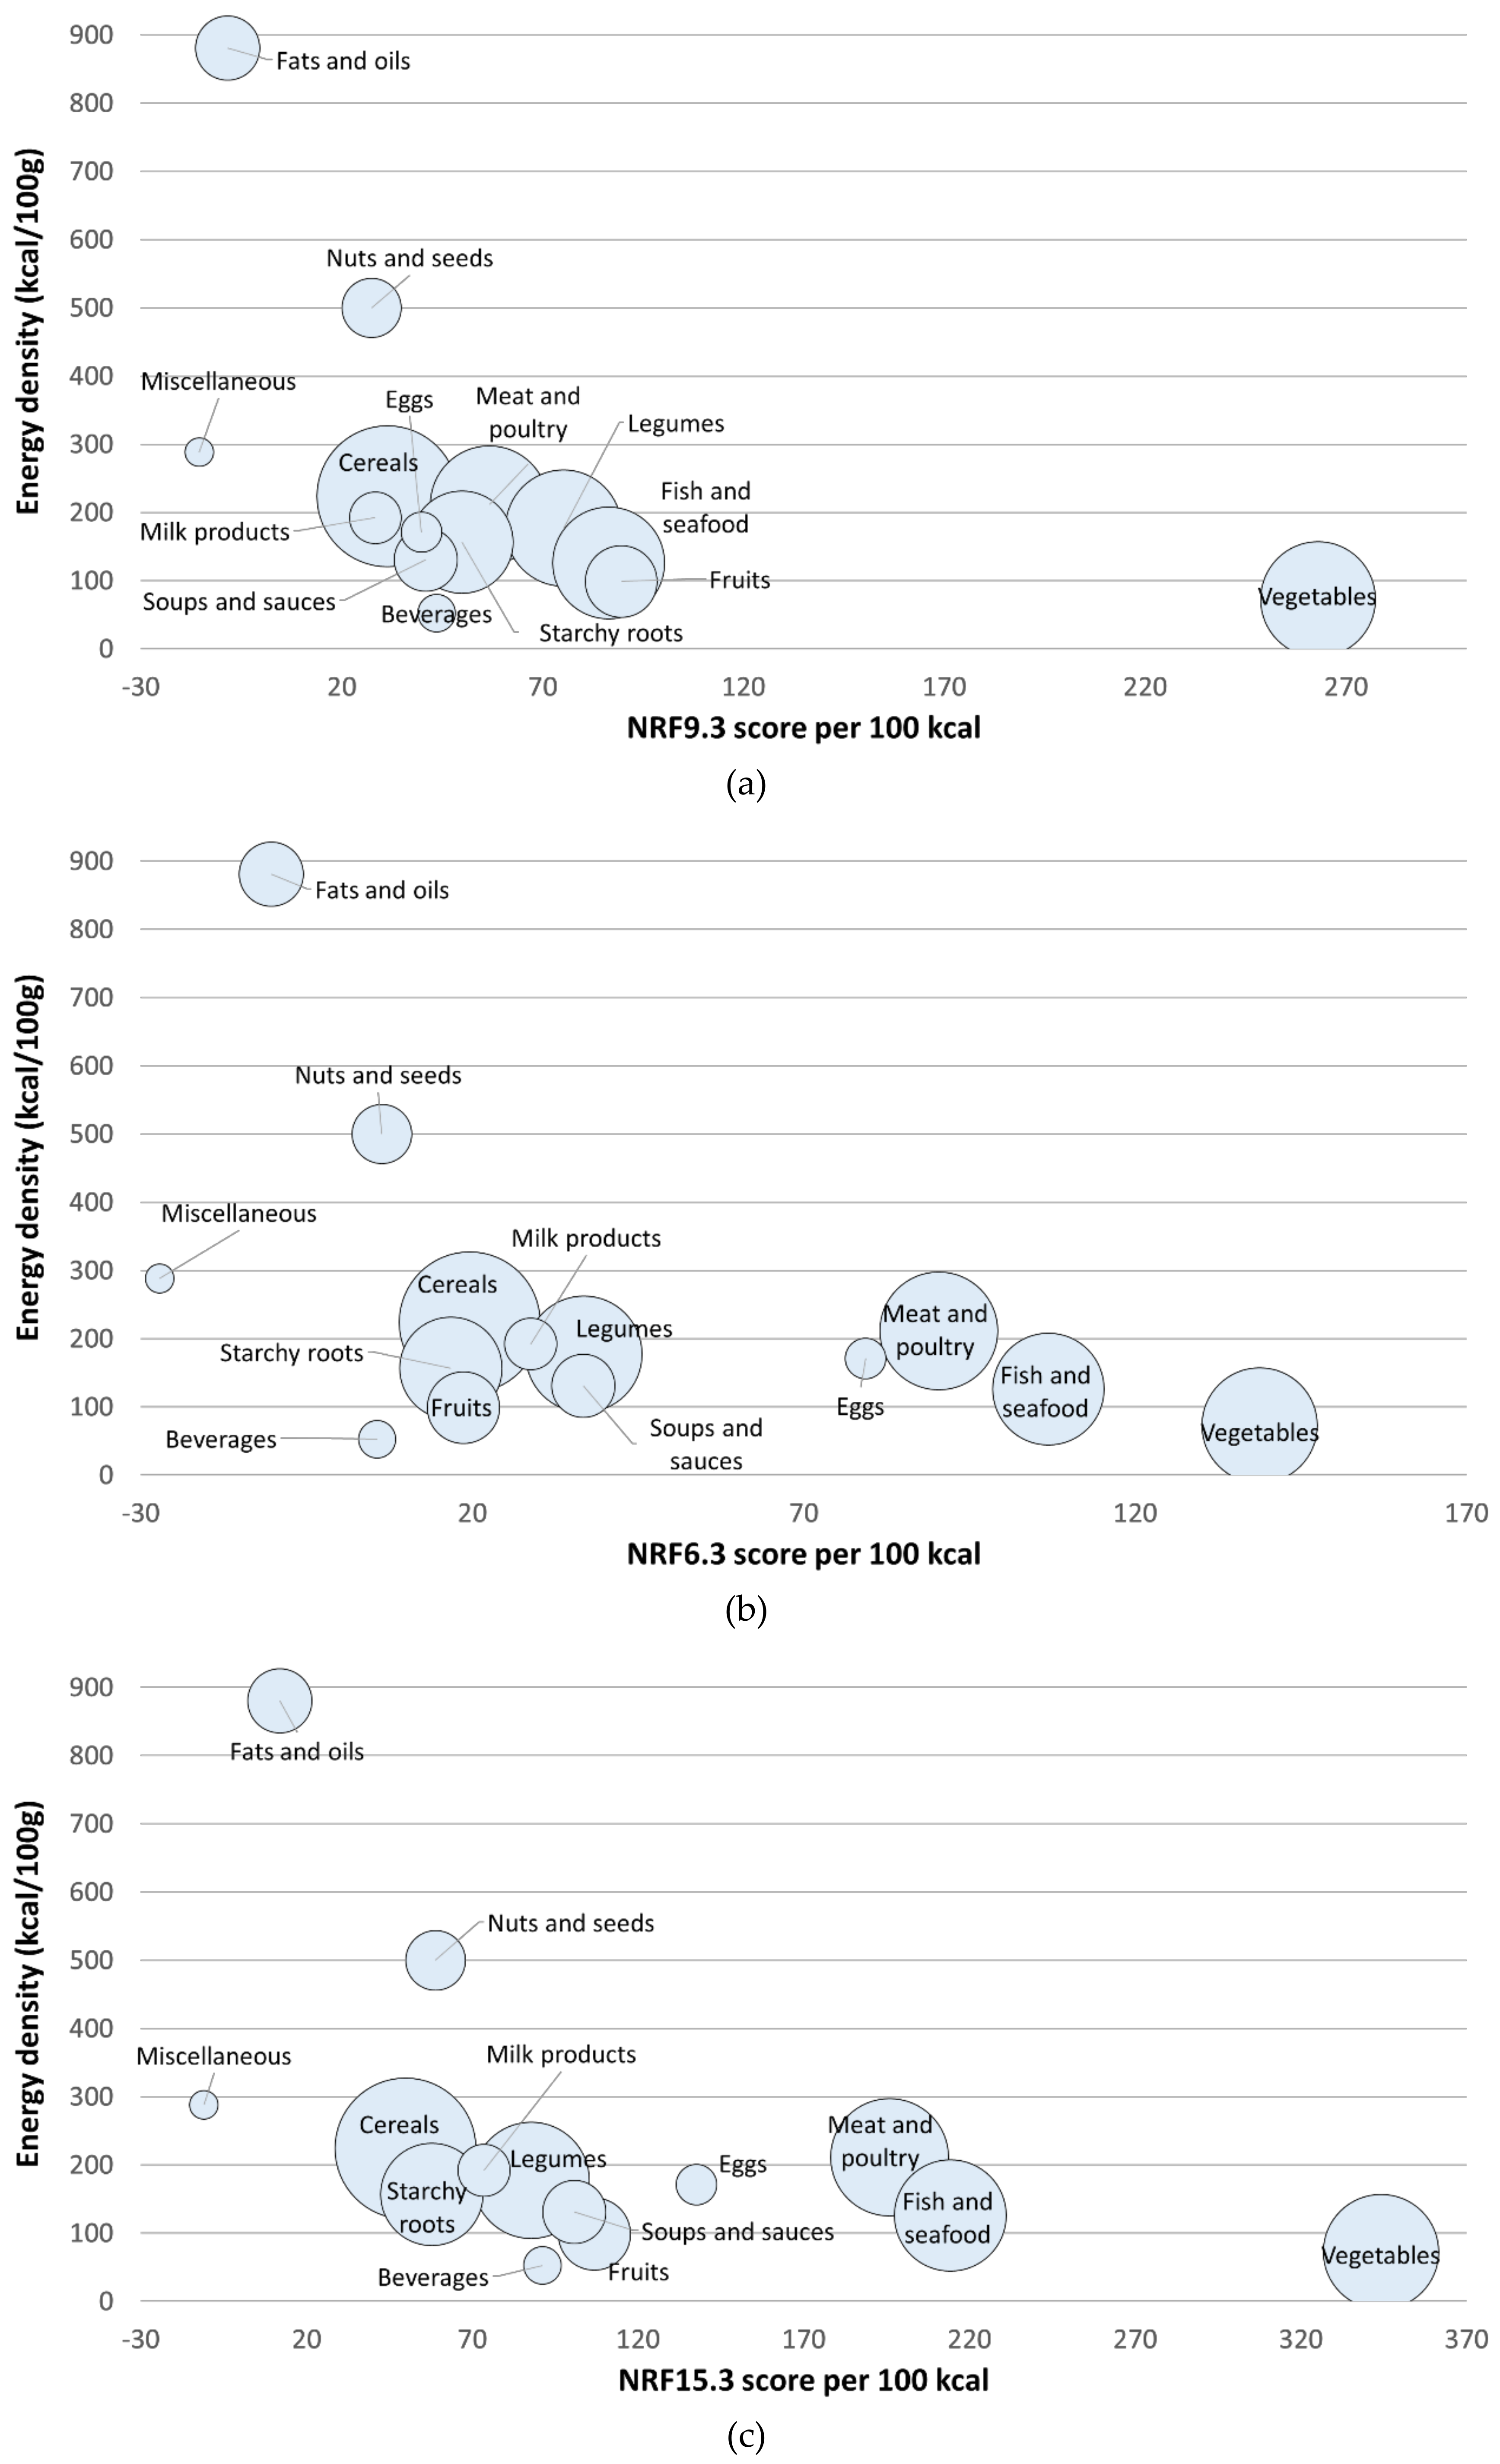

Table 1.
Reference Daily Values (DV) for micronutrients of interest.
| Nutrients to encourage | Reference Daily Values | Nutrients to limit | Maximum Recommended Values |
|---|---|---|---|
| Protein (g) | 50 | Saturated fat (g) | 20 |
| Fiber (g) | 25 | Added sugars (g) | 50 |
| Vitamin A (RAE) | 800 | Sodium (mg) | 2000 |
| Vitamin C (mg) | 100 | ||
| Vitamin D (mcg) | 15 | ||
| Calcium (mg) | 1000 | ||
| Iron (mg) | 14 | ||
| Potassium (mg) | 3500 | ||
| Magnesium (mg) | 310 | ||
| Zinc (mg) | 11 | ||
| Folate (mcg) | 400 | ||
| Copper (mcg) | 900 | ||
| Vitamin B1 (mg) | 1.2 | ||
| Vitamin B2 (mg) | 1.2 | ||
| Vitamin B3 (mg NE) | 15 | ||
| Vitamin B6 (mg) | 1.3 | ||
| Vitamin B12 (mcg) | 2.4 |
* Daily Values were taken from the Codex Alimentarius [24].
Table 2.
NRF9.3 scores by WAFCT food groups per 100 kcal.
| WAFCT Food Groups | No. of foods |
Kcal/ 100 g | NRF9.3 scores | ||
|---|---|---|---|---|---|
| Mean1 | SD | Median | |||
| Vegetables | 113 | 72.57 | 263.00a | 122.69 | 234.10 |
| Dark green leafy vegetables | 59 | 62.25 | 344.12 | 105.28 | 360.28 |
| Other vit. A-rich vegetables | 12 | 37.00 | 186.91 | 38.04 | 194.37 |
| Other vegetables | 42 | 97.21 | 170.80 | 71.96 | 161.75 |
| Fruits | 44 | 98.82 | 89.56b | 58.32 | 88.11 |
| Vit. A-rich fruits | 8 | 59.13 | 118.87 | 46.66 | 125.92 |
| Other fruits | 36 | 107.64 | 83.04 | 59.19 | 65.35 |
| Fish and seafood | 106 | 126.11 | 86.41b | 41.47 | 77.67 |
| Legumes | 115 | 177.25 | 75.21c | 11.40 | 76.87 |
| Meat and poultry | 118 | 211.29 | 56.74d | 57.06 | 41.39 |
| Starchy roots, and tubers | 89 | 156.66 | 49.89d | 28.17 | 46.78 |
| Beverages | 12 | 52.67 | 43.66d,e | 47.94 | 60.41 |
| Soups and sauces | 34 | 130.97 | 40.96d | 29.92 | 35.46 |
| Eggs | 14 | 171.24 | 39.86d | 8.06 | 39.81 |
| Cereals | 169 | 224.10 | 31.32e | 23.93 | 32.82 |
| Milk and its products | 23 | 192.22 | 28.37e | 24.76 | 28.69 |
| Nuts and seeds | 30 | 499.93 | 27.40e | 20.40 | 27.89 |
| Fats and oils | 35 | 880.71 | -8.39f | 21.37 | -7.93 |
| Miscellaneous | 7 | 288.29 | -15.49f | 26.84 | -15.26 |
| P | <0.001 | ||||
Mean, standard deviation, and median NRF9.3 scores per 100 kcal by WAFCT food groups. SD: Standard deviation. 1 Means annotated with same-letter superscripts are not significantly different from each other.
Table 3.
NRF6.3 scores by WAFCT food groups per 100 kcal.
| WAFCT Food Groups | No.of foods | Kcal/ 100 g | Mean NRF6.3 scores1 | ||
|---|---|---|---|---|---|
| Mean1 | SD | Median | |||
| Vegetables | 113 | 72.57 | 138.73a | 92.13 | 120.98 |
| Dark green leafy vegetables | 59 | 62.25 | 201.62 | 76.43 | 206.47 |
| Other vit. A-rich vegetables | 12 | 37.00 | 79.63 | 32.77 | 65.28 |
| Other vegetables | 42 | 97.21 | 67.26 | 51.87 | 51.86 |
| Fish and seafood | 106 | 126.11 | 106.88b | 56.35 | 111.03 |
| Meat and poultry | 118 | 211.29 | 90.39c | 100.11 | 61.01 |
| Eggs | 14 | 171.24 | 79.34c | 34.50 | 67.22 |
| Legumes | 115 | 177.25 | 36.82d | 13.16 | 35.89 |
| Soups and sauces | 34 | 130.97 | 36.74d,e | 36.81 | 33.91 |
| Milk and its products | 23 | 192.22 | 28.79e,f,j | 26.94 | 26.06 |
| Cereals | 169 | 224.10 | 19.63f,j | 22.13 | 15.83 |
| Fruits | 44 | 98.82 | 18.67f | 24.13 | 19.80 |
| Vit. A-rich fruits | 8 | 59.13 | 45.32 | 15.83 | 42.85 |
| Other fruits | 36 | 107.64 | 12.74 | 21.60 | 12.33 |
| Starchy roots, and tubers | 89 | 156.66 | 16.77f,j | 22.04 | 13.91 |
| Nuts and seeds | 30 | 499.93 | 6.35g | 16.86 | 7.12 |
| Beverages | 12 | 52.67 | 5.64g,j | 49.63 | -3.69 |
| Fats and oils | 35 | 880.71 | -10.32h | 17.69 | -7.93 |
| Miscellaneous | 7 | 288.29 | -27.18i | 27.34 | -27.69 |
| P | <0.001 | ||||
Mean, standard deviation, and median NRF6.3 scores per 100 kcal by WAFCT food groups. SD: Standard deviation. 1 Means annotated with same-letter superscripts are not significantly different from each other.
Table 4.
NRF15.3 scores by WAFCT food groups per 100 kcal.
| WAFCT Food Groups | No. of foods | Kcal/ 100 g | Mean NRF15.3 scores | ||
|---|---|---|---|---|---|
| Mean1 | SD | NRF15.3 | |||
| Vegetables | 113 | 72.57 | 344.19a | 178.59 | 295.99 |
| Dark green leafy vegetables | 59 | 62.25 | 451.96 | 163.40 | 445.86 |
| Other vit. A-rich vegetables | 12 | 37.00 | 250.68 | 55.05 | 265.70 |
| Other vegetables | 42 | 97.21 | 219.51 | 115.53 | 218.55 |
| Fish and seafood | 106 | 126.11 | 214.24b | 73.46 | 210.97 |
| Meat and poultry | 118 | 211.29 | 195.91b,c | 159.64 | 151.01 |
| Eggs | 14 | 171.24 | 137.60c,d,j | 32.26 | 126.10 |
| Fruits | 44 | 98.82 | 106.83d,e,j | 73.67 | 97.98 |
| Vit. A-rich fruits | 8 | 59.13 | 147.63 | 41.95 | 153.82 |
| Other fruits | 36 | 107.64 | 97.76 | 76.49 | 83.48 |
| Soups and sauces | 34 | 130.97 | 100.81e,j | 47.32 | 93.58 |
| Beverages | 12 | 52.67 | 91.13j | 90.29 | 87.91 |
| Legumes | 115 | 177.25 | 87.71f,j | 21.40 | 87.58 |
| Milk and its products | 23 | 192.22 | 73.48g,j | 46.52 | 65.56 |
| Nuts and seeds | 30 | 499.93 | 58.89g,h,j | 32.78 | 69.01 |
| Starchy roots, and tubers | 89 | 156.66 | 57.84g,h | 29.59 | 52.38 |
| Cereals | 169 | 224.10 | 49.84h | 33.90 | 47.20 |
| Fats and oils | 35 | 880.71 | 11.90i | 33.19 | 12.24 |
| Miscellaneous | 7 | 288.29 | -10.98i | 31.81 | -13.63 |
| P | <0.001 | ||||
Mean, standard deviation, and median NRF15.3 scores per 100 kcal by WAFCT food groups. SD: Standard deviation. 1 Means annotated with same-letter superscripts are not significantly different from each other.
Table 5.
List of top 20 foods with the highest NRF scores.*.
| Ranking | Highest NRF9.3 scores | Highest NRF6.3 scores | Highest NRF15.3 scores |
|---|---|---|---|
| 1 | Amaranth, leaves, raw | Chicken liver, raw | Spinach, leaves, raw |
| 2 | Amaranth, leaves, boiled | Chicken liver, stewed | Cowpea, leaves, raw |
| 3 | Spinach, leaves, raw | Chicken liver, boiled | Spinach, leaves, boiled |
| 4 | Spider plant, leaves, raw | Chicken liver, grilled (without salt or fat) | Cowpea, leaves, boiled |
| 5 | Spinach, leaves, boiled | Spider plant, leaves, raw | Spider plant, leaves, raw |
| 6 | Cowpea, leaves, raw | Spider plant, leaves, boiled | Spider plant, leaves, boiled |
| 7 | Spider plant, leaves, boiled | Amaranth, leaves, raw | Chicken liver, raw |
| 8 | Jute mallow (bush-okra), leaves, raw | Chicken giblets, grilled (without salt or fat) | Amaranth, leaves, fresh, raw |
| 9 | Mint, leaves, raw | Beef liver, raw | Jute mallow (bush-okra), leaves, raw |
| 10 | Cowpea, leaves, boiled | Mint, leaves, raw | Chicken liver, stewed |
| 11 | Moringa (drumstick), leaves, boiled | Chicken giblets, raw | Amaranth, leaves, boiled |
| 12 | Moringa (drumstick), leaves, raw | Amaranth, leaves, fresh, boiled | Chicken liver, grilled (without salt or fat) |
| 13 | Jute mallow (bush-okra), leaves, boiled | Eggplant, leaves, raw | Moringa (drumstick), leaves, raw |
| 14 | Eggplant, leaves, raw | Spider plant, leaves, boiled | Moringa (drumstick), leaves, boiled |
| 15 | Eggplant, leaves, boiled | Cowpea, leaves, raw | Beef liver, raw |
| 16 | Green leafy vegetable, average, raw | Beef liver, grilled (without salt or fat) | Chicken liver, boiled (without salt) |
| 17 | Pumpkin, leaves, raw | Beef liver, stewed | Spinach, leaves, boiled |
| 18 | Moringa (drumstick), leaves, boiled (without salt) | Chicken giblets, boiled | Eggplant, leaves, raw |
| 19 | Parsley, raw | Spinach, leaves, raw | Cowpea, leaves, fresh, boiled |
| 20 | Pumpkin, leaves, boiled | Mola carplet, small whole fish, raw | Beef liver, stewed |
*Foods highlighted in green are classified as African Indigenous Vegetables (AIV) and foods highlighted in blue are animal-source foods.
Table 6.
Nutrient density of African Indigenous Vegetables (AIV), non-indigenous vegetables, African Indigenous Grains (AIG), and non-indigenous grains.
Table 6.
Nutrient density of African Indigenous Vegetables (AIV), non-indigenous vegetables, African Indigenous Grains (AIG), and non-indigenous grains.
| African Indigenous food groups | No. of foods | Kcal/ 100 g | Mean (SD) NRF score | Protein g/100gMean (SD) | ||
|---|---|---|---|---|---|---|
| NRF9.3 | NRF6.3 | NRF15.3 | ||||
| African Indigenous vegetables (AIV) | 25 | 46.28 | 339.14 (110.57) | 198.17 (85.22) | 451.43 (168.10) | 3.81 (1.81) |
| Preparations with AIV | 18 | 73.22 | 227.78 (186.87) | 132.90 (108.21) | 324.33 (233.89) | 4.19 (1.80) |
| Non-indigenous vegetables |
68 | 54.29 | 227.49 (109.73) | 111.27 (82.93) | 292.43 (157.77) | 2.90 (2.10) |
| P-value | <0.001* | <0.001* | 0.001* | <0.001* | ||
| African Indigenous Grains | 55 | 260.07 | 42.69 (19.20) | 28.86 (11.39) | 61.64 (19.96) | — |
| Non-indigenous Grains | 55 | 277.65 | 30.00 (21.19) | 23.21 (25.01) | 56.46 (42.53) | — |
| P-value | 0.604 | 0.001* | 0.327 | 0.415 | — | |
| Non-indigenous grains (without fortified flours) | 45 | 261.04 | 29.63 (22.66) | 13.04 (7.68) | 44.01 (31.68) | — |
| P-value | 0.965 | 0.002* | <0.001* | 0.001* | — | |
* Difference was statistically significant. NRF: Nutrient-Rich Food Index. SD: standard deviation.
Disclaimer/Publisher’s Note: The statements, opinions and data contained in all publications are solely those of the individual author(s) and contributor(s) and not of MDPI and/or the editor(s). MDPI and/or the editor(s) disclaim responsibility for any injury to people or property resulting from any ideas, methods, instructions or products referred to in the content. |
© 2024 by the authors. Licensee MDPI, Basel, Switzerland. This article is an open access article distributed under the terms and conditions of the Creative Commons Attribution (CC BY) license (http://creativecommons.org/licenses/by/4.0/).
Copyright: This open access article is published under a Creative Commons CC BY 4.0 license, which permit the free download, distribution, and reuse, provided that the author and preprint are cited in any reuse.


