Submitted:
07 January 2025
Posted:
07 January 2025
Read the latest preprint version here
Abstract
This study tackles waste management challenges in Costa Rica, where urban-rural disparities limit access to recycling facilities, posing barriers to national sustainability goals. By analyzing optimal facility placements, this research aims to improve accessibility and streamline waste management using Agent-Based Modeling (ABM) and Reinforcement Learning (RL). Integrating geospatial and demographic data, it forecasts recycling behaviors across Costa Rican provinces, with RL identifying cost-effective facility locations to boost recycling rates. Findings reveal notable accessibility gaps—urban centers like San José achieve a 56% accessibility rate, whereas rural areas, such as Puntarenas, fall below 30%. Strategic placements could elevate Cartago’s recycling rate to 27.38%, and RL optimization indicates a 53.4% potential rise in recycling and a 12% decrease in landfill reliance in accessible areas. These outcomes underscore the need for region-specific investments in waste infrastructure, suggesting that AI-enhanced waste categorization and community engagement could further progress Costa Rica’s sustainable waste management.
Keywords:
Introduction
2. Literature Review
2.1. Current State of Waste Management
2.2. Landfill Capacities and Regional Waste Management Practices
2.3. Costa Rica's Recycling Challenge: A Global Perspective
2.4. Government Initiatives and Policies
2.5. Waste Management Innovation Index
2.5. Innovative Waste and Water Management Initiatives in Costa Rica
3. Methodology
3.1. Data Collection
3.2. Distance Calculations and Household Count in Distance Ranges
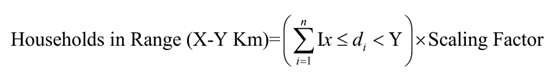
- di represents the distance of household i to its nearest facility.
- IX≤di<Y is an indicator function equal to 1 if did_idi is within the range [X,Y], and 0 otherwise.
- n is the total number of sampled households.
- The scaling factor is applied in provinces where household samples were used, to approximate the total population within each distance range.
3.3. Expanded Agent-Based Model for Recycling Rate Prediction
3.3.1. Simulation Approach
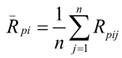
- Ṝpi represents the average recycling rate for province i,
- n is the number of simulations,
- Rpij is the recycling rate from the j-th simulation for province i.
3.3.2. Validation Against Real Data
3.3.2. Recycling Rate Calculation
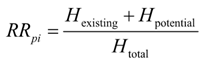
- Hexisting Households within a certain radius of existing facilities,
- Hpotential Households within a certain radius of potential facilities,
- Htotal is Total number of households in the province.
3.4. Sensitivity Analysis of Recycling Accessibility Model
4. Q-Learning Approach for Waste Management Optimization
4.1. Waste Management Optimization Model and Architecture
- Action 0: Increase the recycling rate by 5%.
- Action 1: Improve waste-to-energy (WtE) technology, increasing WtE investment by 10% and reducing landfill dependence by 2%.
4.2. Dataset and Model Initialization
4.3. Q-Learning Configuration
- Q(s,a) is the expected cumulative reward for taking action a in state s,
- α controls how quickly the model updates beliefs,
- γ factors future rewards, and
 is the maximum expected reward for the next state.

4.3. Cost Simulation Methodology for Provincial Waste Management
5. Results
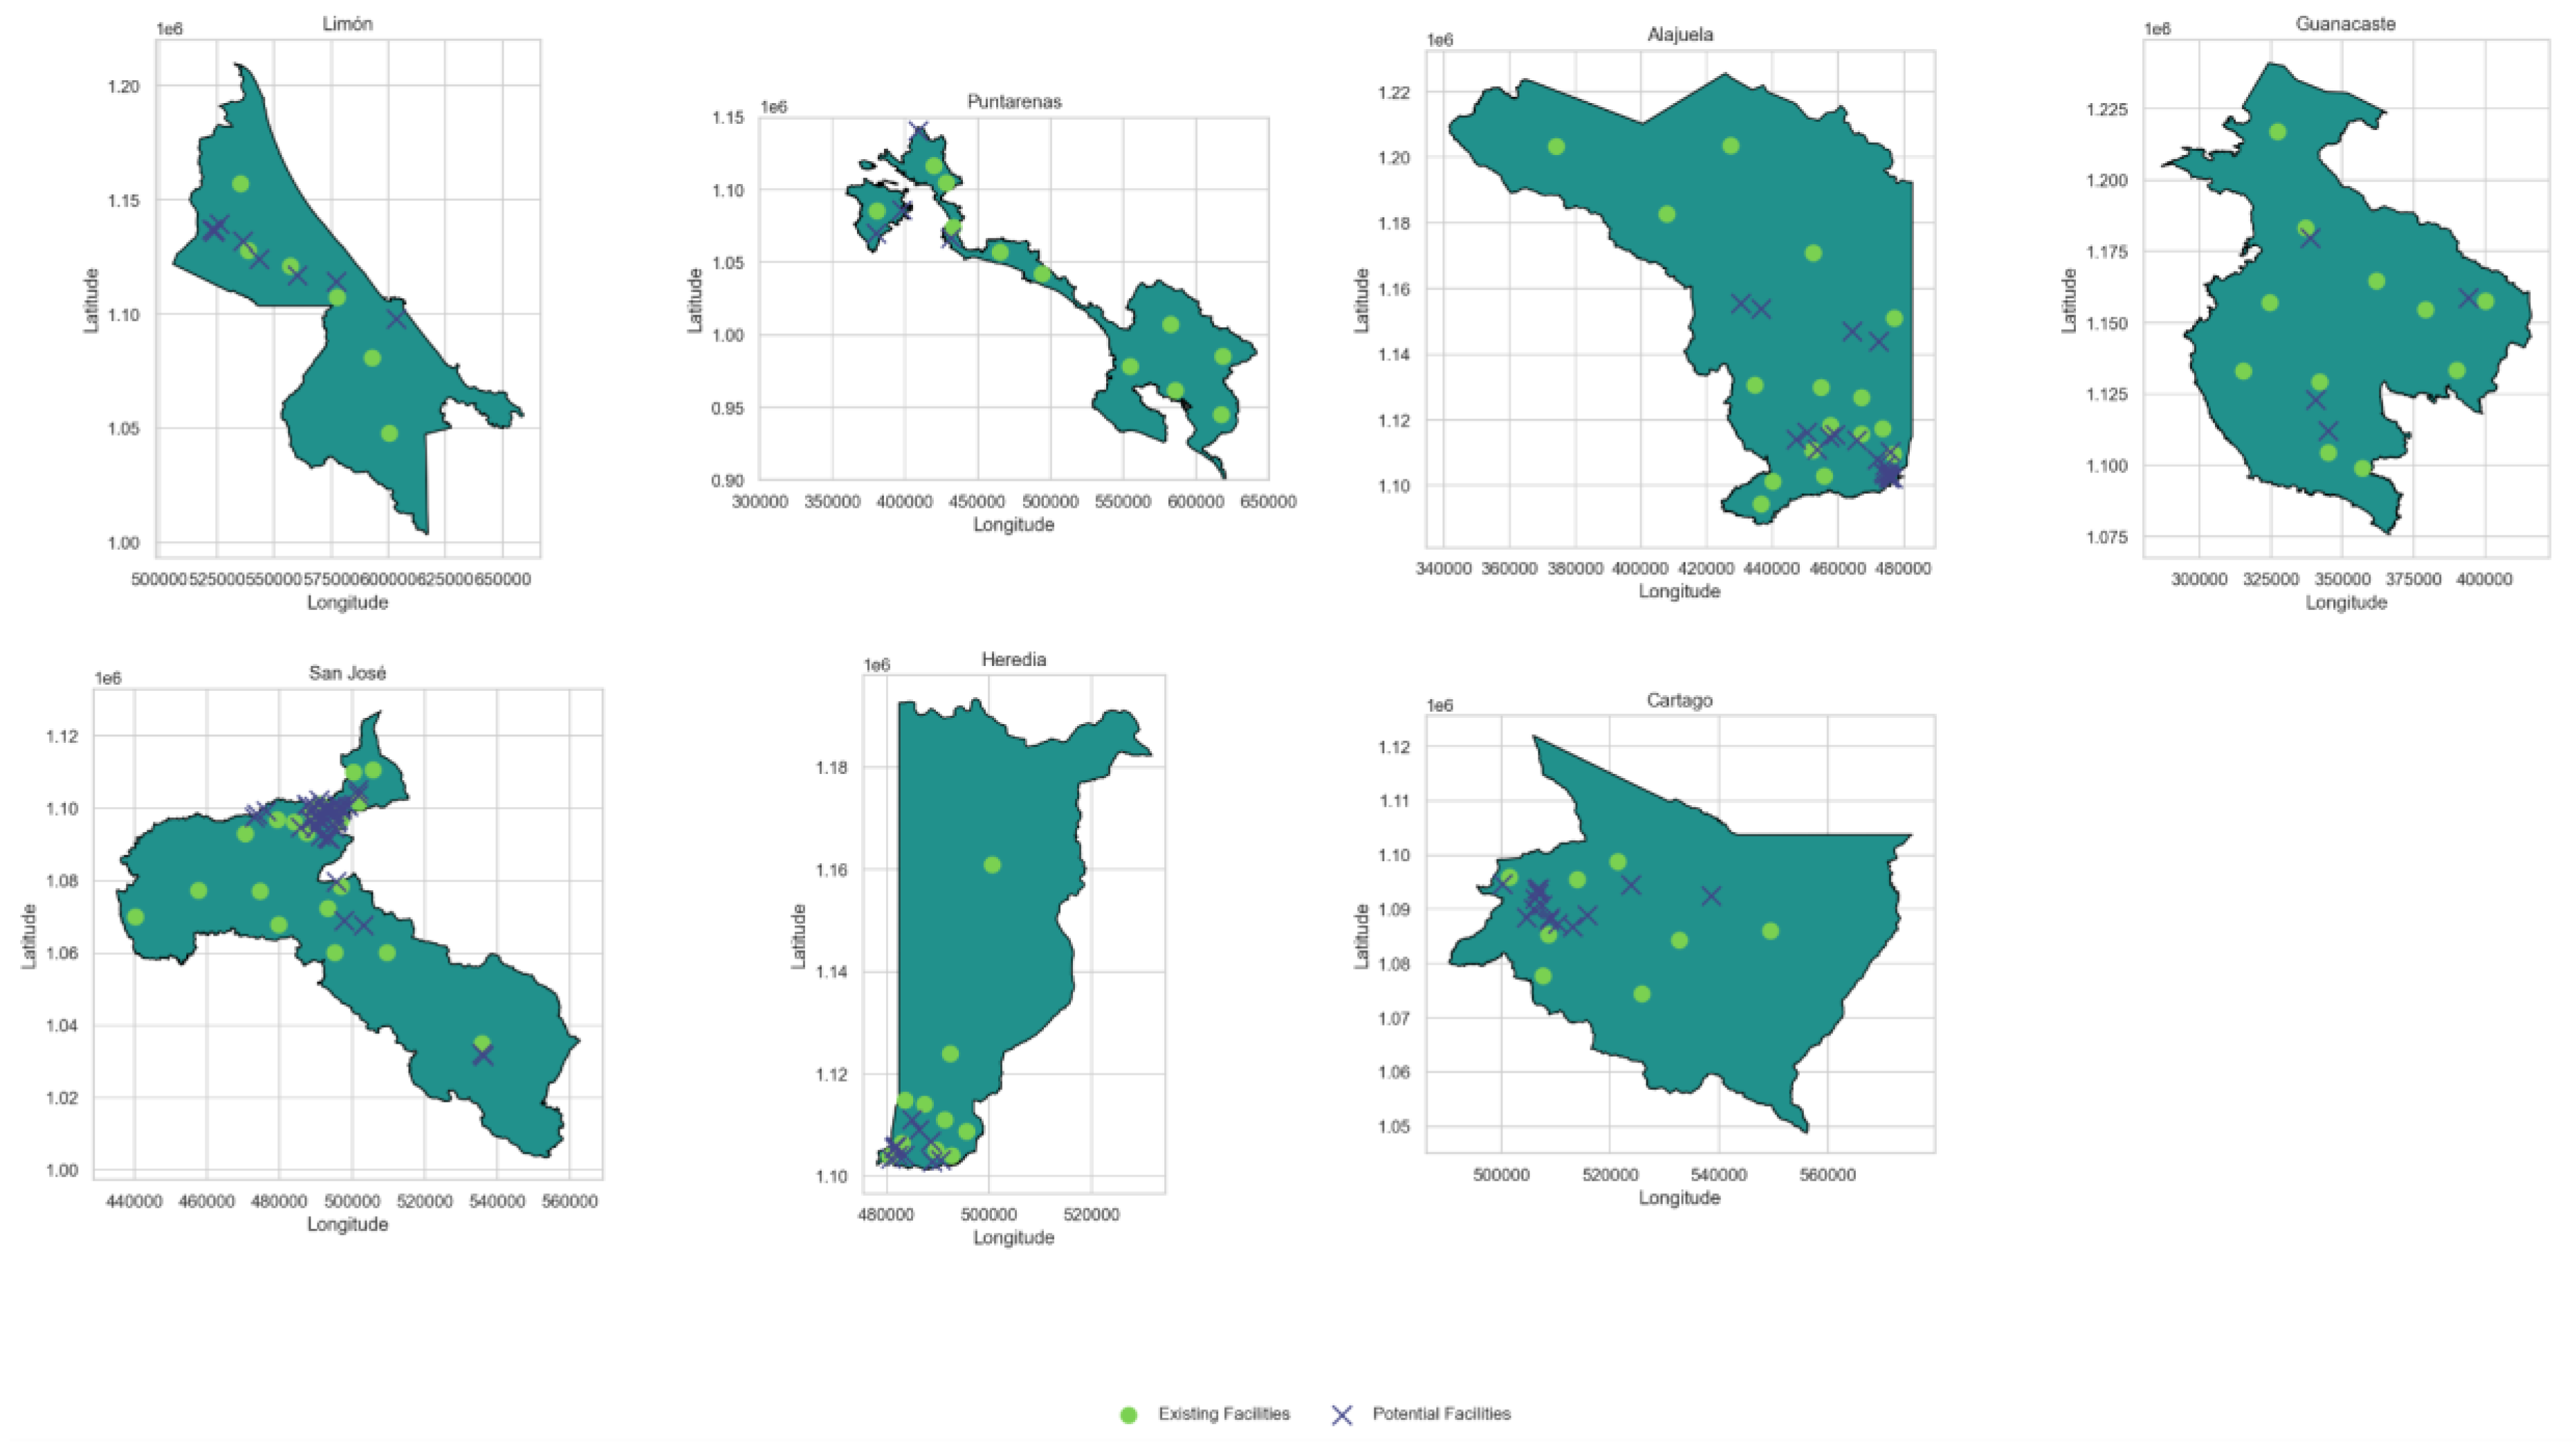
5.1. Accessibility of Households to Recycling Facilities Across Provinces
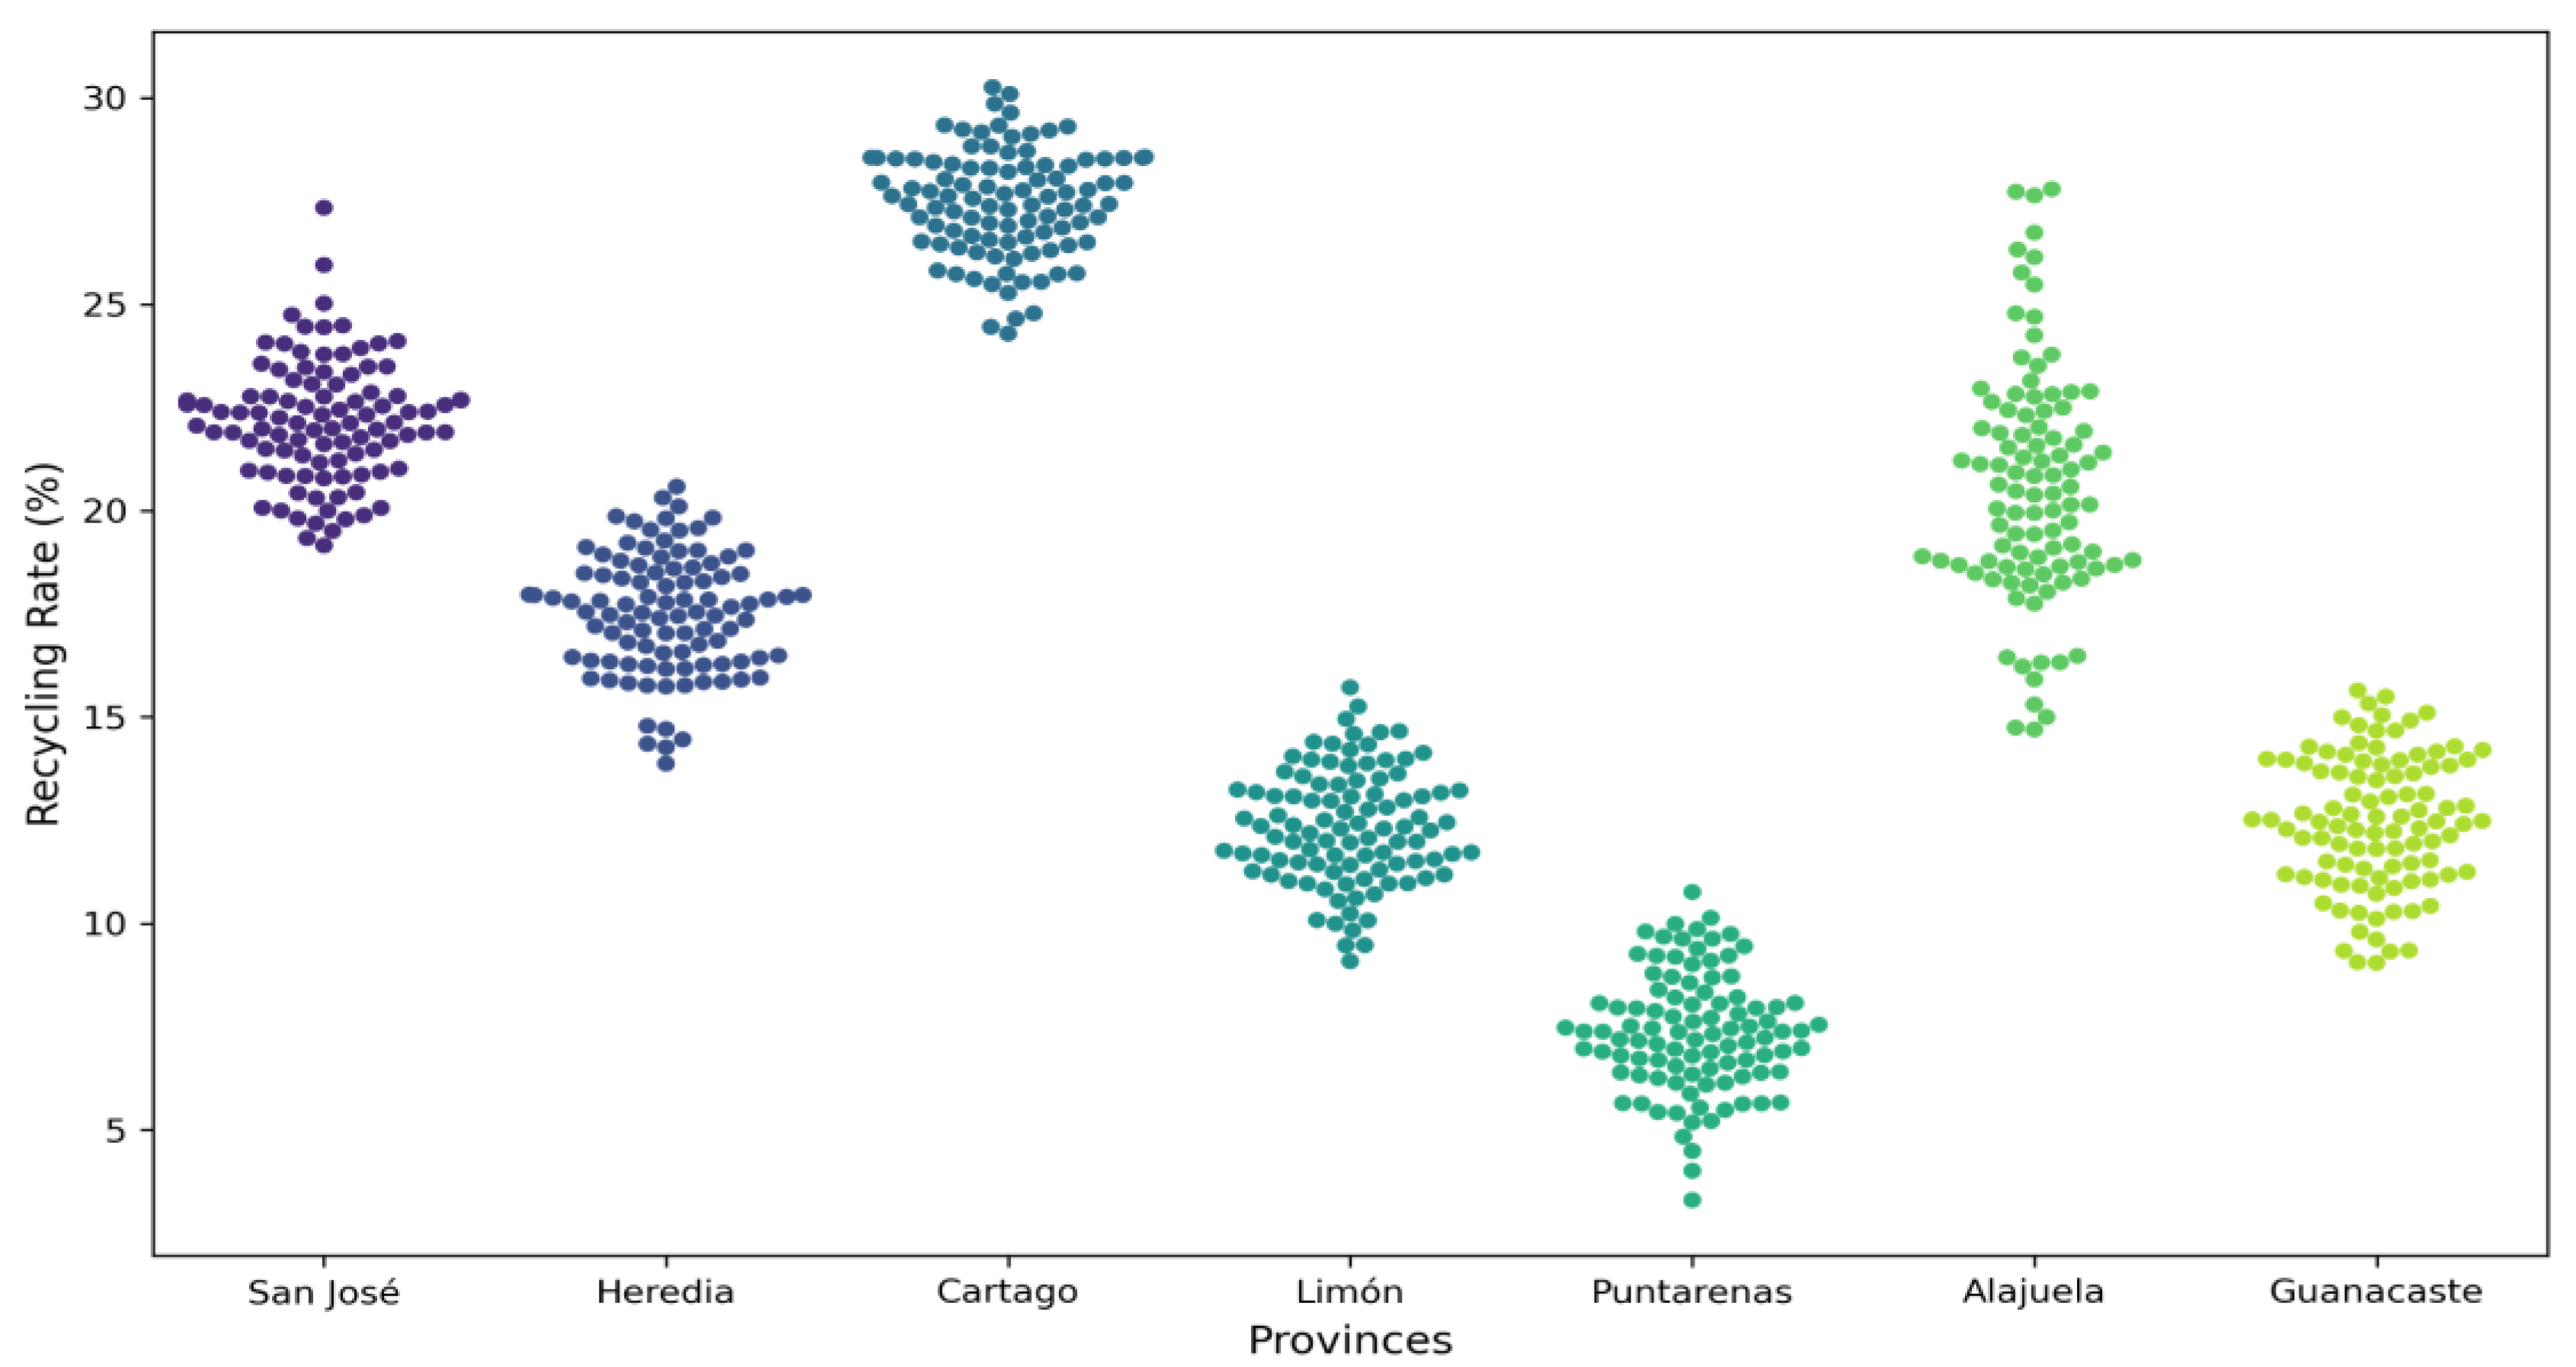
5.2. Simulated Recycling Rates Across Provinces
5.4. Sensitivity Analysis for Accessibility-Based Model (ABM)
5.3. Reinforcement Learning Model for Optimizing Waste Management
5.4. Sensitivity Analysis of the RL-Based Waste Management Model
5.5. Provincial Cost Simulation for Waste Management
6. Discussion
7. Conclusion
Supplementary Materials
Author Contributions
Funding
Ethics Statement
Data Availability Statement
Conflict of Interest Declaration
Declaration of Generative AI and AI-assisted Technologies in the Writing Process
References
- United Nations. (2023). Transforming our world: The 2030 agenda for sustainable development. Available online: https://sustainabledevelopment.un.org/post2015/transformingourworld.
- Javed, M. W., Saleem, F., Aslam, F., & Ullah, K. (2024). Urban-rural sustainability challenges and infrastructure disparities in developing countries: Policy perspectives for inclusive growth. Journal of Environmental Management, 317, 115721.
- Ferronato, N., Torretta, V., Gullo, S., & Chiavola, A. (2024). Challenges and perspectives of waste management and circular economy in developing countries. Sustainable Cities and Society, 67, 105919.
- Graham, C. C. (2024a). The role of Geographic Information Systems in mitigating plastics pollution in the Global South—A spatial analysis of recycling facilities in Costa Rica. Science of the Total Environment, 937, 173396. [CrossRef]
- Bravo, L. M. R., Cosio Borda, R. F., Quispe, L. A. M., Rodríguez, J. A. P., Ober, J., & Khan, N. A. (2024). The role of internet and social interactions in advancing waste sorting behaviors in rural communities. Resources, 13(4), 57. [CrossRef]
- Baltodano-Goulding, R., & Poveda-Montoya, A. (2023). Unsaturated seepage analysis for an ordinary solid waste sanitary landfill in Costa Rica. E3S Web of Conferences. [CrossRef]
- Bhattacharya, S., Kalita, H., & Kumar, R. (2024). Fuzzy synthetic evaluation approach for economic risk assessment in waste management systems. Journal of Environmental Management, 325, 116807.
- Le Page, C., Becu, N., Bommel, P., & Bousquet, F. (2013). Agent-based modeling and simulation applied to environmental management. Agricultural Systems, 116, 10-15. [CrossRef]
- Sert, E., Bar-Yam, Y., & Morales, A. J. (2020). Segregation dynamics with reinforcement learning and agent-based modeling. Scientific Reports, 10(1), 11771. [CrossRef]
- Herrera-Murillo, J., Rojas-Marín, J. F., & Anchía-Leitón, D. (2016). Tasas de generación y caracterización de residuos sólidos ordinarios en cuatro municipios del Área Metropolitana Costa Rica. [CrossRef]
- Campos Rodríguez, R., & Soto Córdoba, S. M. (2014). Estudio de generación y composición de residuos sólidos en el cantón de Guácimo, Costa Rica. Tecnología en Marcha, 27.
- Chaves Brenes, K. (2024, February 14). San José: ecoins – promoting the circular economy and decarbonisation through public-private partnerships. International Institute for Environment and Development. Available online: https://www.iied.org/san-jose-ecoins-promoting-circular-economy-decarbonisation-through-public-private-partnerships.
- OECD. (2023). OECD Environmental Performance Reviews: Costa Rica 2023. OECD Publishing. [CrossRef]
- Becerra, E. (2021, March 18). Waste management ‘one of biggest environmental problems,’ Costa Rica says. The Tico Times. Available online: https://ticotimes.net/2021/03/18/waste-management-one-of-biggest-environmental-problems-costa-rica-says.
- Quesada Cordero, M. (2024, April 8). How many Costa Ricans participate in recycling? El Colectivo 506. Available online: https://elcolectivo506.com.
- Ministerio de Ambiente y Energía, Costa Rica. (2023). Estrategias sostenibles de gestión de residuos. Gobierno de Costa Rica. Available online: https://www.ministeriodesalud.go.cr/index.php/prensa/43-noticias-2021/866-gobierno-presenta-plan-de-accion-para-la-gestion-integral-de-residuos.
- European Environment Agency. (2023). Waste recycling in Europe. Available online: https://www.eea.europa.eu/en/analysis/indicators/waste-recycling-in-europe.
- Landgeist. (2024). Germany: Recycling Rate. Available online: https://landgeist.com/2024/04/06/recycling-rate/.
- Recycling Partnership. (2024). State of Residential Recycling in the U.S. Retrieved from the uploaded document. Available online: recyclingpartnership.org.
- Klein, C. (2024). Recycling rate of waste Japan FY 2013-2022. Statista. Available online: https://www.statista.com/statistics/1127509/japan-recycling-rate-waste/.
- Gerden, E. (2024). Brazil’s recycling best is yet to come. Available online: https://recyclinginternational.com/latest-articles/brazils-recycling-best-is-yet-to-come/57145/.
- Seoul Metropolitan Government. (2023). Seoul to increase recycling rate to 79% by 2026. Available online: https://english.seoul.go.kr/seoul-to-increase-recycling-rate-to-79-by-2026/.
- Swedish Environmental Protection Agency. (2024). Swedish recycling and beyond. Available online: https://sweden.se/climate/sustainability/swedish-recycling-and-beyond.
- Ministerio de Salud de Costa Rica. (2023). Informe Anual de Gestión Ambiental 2023. Available online: https://www.ministeriodesalud.go.cr/index.php/informes-de-gestion.
- Gómez, C. C. (2023). Circular economy plastic policies in Costa Rica: A critical policy analysis. Circular Innovation Lab. ISBN 978-87-94507-05-9.
- Holland Circular Hotspot. (2021). Waste Management Country Report: Costa Rica . Available online: https://hollandcircularhotspot.nl/wp-content/uploads/2021/04/Report_Waste_Management_Costa_Rica_20210329.pdf.
- Procuradoria de la Republica de Costa Rica: "Ley para Combatir la Contaminación por Plástico y Proteger el Ambiente, N° 9786." Sistema Costarricense de Información Jurídica. Available online: http://www.pgrweb.go.cr/scij/Busqueda/Normativa/Normas/nrm_texto_completo.aspx?nValor1=1&nValor2=90187 (accessed on 13 August 2024).
- Federal Ministry for the Environment, Nature Conservation, Nuclear Safety, and Consumer Protection (BMUV). (2023). Waste management in Germany 2023: Facts, data, figures . Available online: https://www.bmuv.de/.
- World Intellectual Property Organization. (2024). Global Innovation Index 2024: Unlocking the Promise of Social Entrepreneurship. Geneva: WIPO. [CrossRef]
- Lino, F. A. M., Ismail, K. A. R., & Castañeda-Ayarza, J. A. (2023). Municipal solid waste treatment in Brazil: A comprehensive review. Energy Nexus, 11, 100232. [CrossRef]
- Kwon, Y., Lee, S., Bae, J., Park, S., Moon, H., Lee, T., Kim, K., Kang, J., & Jeon, T. (2024). Evaluation of incinerator performance and policy framework for effective waste management and energy recovery: A case study of South Korea. Sustainability, 16(1), 448. [CrossRef]
- Sandhi, A., & Rosenlund, J. (2024). Municipal solid waste management in Scandinavia and key factors for improved waste segregation: A review. Cleaner Waste Systems, 8, 100144. [CrossRef]
- Arias. (2024). Challenges and opportunities in waste management: Perspectives from Costa Rica for the world recycling day. Arias Knowledge Center. Available online: https://ariasknowledgecenter.com.
- Tico Times. (2024, November 1). ICE unveils biogas plan to combat Costa Rica’s growing waste management crisis. The Tico Times. Available online: https://ticotimes.net/2024/11/01/ice-unveils-biogas-plan-to-combat-costa-ricas-growing-waste-management-crisis.
- Graham, H. (2024b). GIS-based approaches in managing plastic pollution: A case study of the Global South. Journal of Environmental Mapping and Assessment, 21(2), 113-130.
- Instituto Nacional de Estadística y Censos. (2022). Estimación de población y vivienda: Provincias de Costa Rica. INEC. Available online: https://inec.cr.
- Mitchell, A. (1999). The ESRI guide to GIS analysis volume 1: Geographic patterns & relationships. ESRI Press.
- Devore, J. L. (2011). Probability and statistics for engineering and the sciences (8th ed.). Cengage Learning. Available online: https://faculty.ksu.edu.sa/.
- Miller, H. J., & Shaw, S. (2001). Geographic information systems for transportation: Principles and applications. Oxford University Press.
- Zhang, H., Liu, P., Guo, X., Wang, J., Qin, S., Qi, L., & Zhao, J. (2022). An improved Q-learning algorithm for solving disassembly line balancing problem considering carbon emission. In 2022 IEEE International Conference on Systems, Man, and Cybernetics (SMC) (pp. 872-877). Prague, Czech Republic: IEEE. [CrossRef]
- Liu, Y., Zhou, M., & Guo, X. (2022). An improved Q-learning algorithm for human-robot collaboration two-sided disassembly line balancing problems. In 2022 IEEE International Conference on Systems, Man, and Cybernetics (SMC) (pp. 568-573). Prague, Czech Republic: IEEE. [CrossRef]
- Fernandez, I. (2024, July 17). Costa Rica on the brink of a garbage crisis. The Tico Times. Available online: https://ticotimes.net/2024/07/17/costa-rica-on-the-brink-of-a-garbage-crisis.
- Espinosa-Aquino, B., Gabarrell Durany, X., & Quirós Vargas, R. (2023). The role of informal waste management in urban metabolism: A review of eight Latin American countries. Sustainability, 15(1826). [CrossRef]
- Estado de la Nación. (2010). Data on CO₂ emissions from Costa Rican landfills. Available online: https://estadonacion.or.cr/.
- Hidalgo Arroyo, I. (2021, July 2). Ahora podrá adquirir ecoins cada vez que deposite residuos ordinarios de forma correcta. Delfino CR. Available online: https://delfino.cr.
- Instituto Costarricense de Electricidad (ICE) (2022), Biogas Project. Available online: https://www.grupoice.com/.
- Vega, L. P., Bautista, K. T., Campos, H., Daza, S., & Vargas, G. (2024). Biofuel production in Latin America: A review for Argentina, Brazil, Mexico, Chile, Costa Rica, and Colombia. Energy Reports, 11, 28-38. [CrossRef]
- Messina, G., Tiezzi, E., Marchettini, N., & Bastianoni, S. (2023). ‘Pay as you own’ or ‘pay as you throw’? A counterfactual evaluation of alternative financing schemes for waste services. Ecological Economics, 207, 107701.
- Instituto Costarricense de Electricidad. (2024). Tarifas enero 2024: Alcance N°257 Gaceta N°237. Available online: https://www.tarifas.cr.
- GlobalPetrolPrices.com. (2024). Costa Rica Precios de la gasolina. Available online: https://es.globalpetrolprices.com/Costa-Rica/gasoline_prices/.
- Banco Interamericano de Desarrollo. (2021). Solid waste management in Latin America and the Caribbean. Available online: https://publications.iadb.org.
- Ministerio de Salud de Costa Rica. (2021). Report waste management Costa Rica. Available online: https://www.wastemanagementcostarica.cr.
- Ministerio de Salud de Costa Rica. (2022). Política Nacional de Gestión Integral de Residuos 2022-2032: Línea base para la gestión integral de residuos. Available online: https://www.ministeriodesalud.go.cr/.
- Ding, L., Zheng, Y., Wang, X., & Lu, W. (2018). System dynamics versus agent-based modeling: A review of complexity simulation in construction waste management. Sustainability, 10(7), 2484. [CrossRef]
- Qiao, Z., Li, J., & Huang, X. (2024). Incorporating decentralized facilities into the food waste treatment infrastructure in megacity: A locational optimization in Beijing. Journal of Cleaner Production, 427, 135981.
- Esteves, F., Molina-Perez, E., Kalra, N., Syme, J., & Vogt-Schilb, A. (2024). Job creation and decarbonization synergies in Latin America: A simulation-based exploratory modeling analysis. Frontiers in Climate, 6, 1339877. [CrossRef]
- Elsheekh, K. M., Kamel, R. R., Elsherif, D. M., & Shalaby, A. M. (2021). Achieving sustainable development goals from the perspective of solid waste management plans. Journal of Engineering and Applied Science, 68(5). [CrossRef]
- Giraldo-Almario, I., Rueda-Saa, G., & Uribe-Ceballos, J. R. (2024). Wasteaware adaptation to the context of a Latin American country: Evaluation of the municipal solid waste management in Cali, Colombia. Journal of Material Cycles and Waste Management, 26(3), 908-922. [CrossRef]
- Spirito, C. (2024). Artificial intelligence applications in reverse logistics: How technology could improve return and waste management creating value (Master's thesis, Politecnico di Torino). Available online: https://https://webthesis.biblio.polito.it/.
- DelaPaz-Ruíz, N., Augustijn, E.-W., Farnaghi, M., & Zurita-Milla, R. (2023). Modeling spatiotemporal domestic wastewater variability: Implications for measuring treatment efficiency. Journal of Environmental Management, 351, 119680. [CrossRef]
- Ram, M., & Bracci, E. (2024). Waste management, waste indicators, and the relationship with Sustainable Development Goals (SDGs): A systematic literature review. Sustainability, 16(8486). [CrossRef]
- Fontaine, M., Wang, C., & Boulanger, P. (2024). Sustainability and environmental performance in selective collection of residual materials: Impact of modulating citizen participation through policy and incentive implementation. Resources, 13, 151.
- Paes, M. X., Puppim de Oliveira, J. A., Mancini, S. D., & Rieradevall, J. (2024). Waste management intervention to boost circular economy and mitigate climate change in cities of developing countries: The case of Brazil. Habitat International, 143, 102990. [CrossRef]
- Abedi, S., Nozarpour, A., & Tavakoli, O. (2023). Evaluation of biogas production rate and leachate treatment in landfill through a water-energy nexus framework for integrated waste management. Energy Nexus, 11, 100218. [CrossRef]

| Region | Waste Generation Rate (kg/person/day) | Organic Waste (%) | Recyclable Waste (%) | Landfill-bound Waste (%) |
| Metropolitan Area | 0.59 | 55.9 | - | - |
| Guácimo | 0.55 | 45 | 35 | 20 |
| Year | Total Waste (Tonnes) | Recoverable (%) | Recycling (%) | Composting (%) | Co-Processing (%) |
| 2021 | 1,282,057 | 9.6 | 3.9 | 2.7 | 2.4 |
| Region/Country | Recycling Rate (%) | Key Contributing Factors | References |
| European Union | 46% (2020) | Varies across member states; strong policies and infrastructure | [17] |
| Germany | 69.3% (2024) | Stringent waste separation, strong regulations | [18] |
| United States | 21% (2024) | State-level variations, mixed public participation | [19] |
| Japan | 20% (2023) | Meticulous waste sorting, but lower recycling infrastructure | [20] |
| Brazil | 4% (2024) | Driven by informal sector, lack of formal infrastructure | [21] |
| South Korea | 69% (2023) | Public involvement, advanced waste sorting systems | [22] |
| Sweden | 50% (2024) | High integration of Waste-to-Energy (WtE) technologies | [23] |
| Costa Rica | 9.6% | High landfill dependency, minimal recycling infrastructure | [13] |
| Initiative | Goal | Target Year | Reference |
| Environmental Health Route Policy | Increase recycling rate to 25% | 2033 | [24] |
| Environmental Health Route Policy | Ensure regular garbage collection in 34% of the territory | 2023 | [24] |
| Environmental Health Route Policy | Reduce per capita waste generation by 10% | 2025 | [24] |
| National Circular Economy Strategy | Promote circular economy practices | Ongoing | [25,26] |
| Law No. 9786 (Law to Combat Plastic Pollution and Protect the Environment) | Drastically reduce single-use plastic usage and promote sustainable alternatives | 2019 | [27] |
| Country | Technological Advancements | Policy Innovation | Public Engagement | Infrastructure Development | Sustainability Impact | Overall Index Score | References |
| Germany | High | High | High | High | High | 9/10 | [28] |
| United States | High | High | High | High | Moderate | 9/10 | [29] |
| Japan | High | High | High | Moderate | Moderate | 8/10 | [20] |
| Brazil | Low | Low | Low | Low | Low | 3/10 | [30] |
| South Korea | High | High | High | High | High | 9/10 | [31] |
| Sweden | High | High | High | High | High | 9/10 | [32] |
| Costa Rica | Low | Moderate | Moderate | Low | Low | 4/10 | [33] |
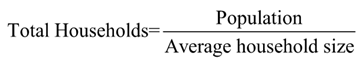
| Province | Population | Average Household Size |
| Guanacaste | 412,808 | 3.3 |
| Alajuela | 1,035,464 | 3.13 |
| Cartago | 545,092 | 3.2 |
| Heredia | 479,117 | 3.1 |
| Limón | 470,383 | 3.2 |
| San José | 1,601,167 | 3.1 |
| Puntarenas | 500,166 | 3.4 |
| Data Category | Variable | Value/Range | Source/Notes |
| Waste Generation | Total Waste Generated (Urban) | 47% of national waste from San José | [42] |
| Total Waste Generation Rate (Urban) | 0.59 kg per person per day | [10] | |
| Total Waste Generation Rate (Rural) | 0.55 kg per person per day | [11] | |
| Daily Solid Waste Generation | 3,982 tons per day | [413 | |
| Landfill Capacity | Landfill Dependence | 94% of solid waste to landfills | [15] |
| Recovery Rate from Landfills | 9.6% | [12] | |
| Landfill Emissions | 1,195,300 - 1,502,700 tonnes CO₂e | [44] | |
| Plastic Waste | Annual Plastic Waste | 1.45 million tons (12% plastic) | [35] |
| Daily Plastic Waste Generation | 50 tons per day | [34] | |
| Plastic Bottle Production | 600 million annually | [35] | |
| Recycling and Recovery | Recycling Rate (Current) | 1% | [13] |
| National Recycling Target | 25% by 2033 | [24] | |
| CO₂e Emissions Avoided by Recycling | -17,500 to -21,600 tonnes CO₂e | [13] | |
| Public Engagement | Ecoins Program Registered Users | 46,162 (2023) | [45] |
| Ecoins Program Collection Sites | 520 (2023), projected 1,127 by 2030 | [13] | |
| Bioenergy | Biogas Production Capacity | 140 kW from organic waste | [46] |
| Daily Biogas Production | 412.5 cubic meters | [47] | |
| Economic Indicators | PAYT (Pay-as-You-Throw) Effectiveness | 13% waste reduction | [48] |
| Parameter | Values |
| Learning Rate (α) | 0.05, 0.1, 0.2 |
| Discount Factor (γ) | 0.9, 0.95, 0.99 |
| Exploration Rate (ε) | 1.0, 0.5, 0.1 |
| Epsilon Decay Rate | 0.99, 0.995, 0.999 |
| Recycling Weight | 1.5, 2.0, 2.5 |
| Landfill Weight | -0.3, -0.5, -0.7 |
| Cost Category | Cost (USD) | Source/Notes |
| Electricity (Industrial Rate) | $0.1088 per kWh | Based on ICE tariff for industrial consumption of up to 8,100 kW [49] |
| Gasoline Price | $1.39 per liter | [50] |
| Unit Collection Costs | $22.65 per ton | [51] |
| Final Disposal Costs | $18.81 per ton | [51] |
| Recycling Transportation (General) | $14.50 per ton (approx.) | [52] |
| Operational Costs for Recycling | $27.00 per ton | [53] |
| Recycling Facility Setup Costs | $300,000 - $500,000 | [53] |
| Maintenance Costs (Annual) | $10,000 - $15,000 | [53] |
| Labor Costs (General Workers) | $500 - $800 per month | Average salary for workers at recycling centers (estimated). |
| Waste Processing Costs | $32.00 per ton | [51] |
| Province | Average Recycling Rate (%) | Standard Deviation (%) | Key Observations |
| San José | 22.29 | 1.52 | Dense urban infrastructure supports high recycling rates; outskirts less covered. |
| Heredia | 17.82 | 1.34 | Concentrated in urban areas; peripheral regions underserved. |
| Cartago | 27.38 | 1.50 | Highest recycling rate, with well-distributed facilities supporting broad engagement. |
| Limón | 12.83 | 1.46 | Coastal focus leaves inland areas significantly underserved. |
| Puntarenas | 7.69 | 1.42 | Lowest rate; elongated geography complicates facility distribution. |
| Alajuela | 19.64 | 2.88 | High variability due to urban-rural divide. |
| Guanacaste | 12.50 | 1.38 | Sparse infrastructure limits access outside major towns. |
| Province | Recycling Rate (%) | Landfill Dependence (%) | Biogas Production Capacity (%) | Total Reward |
| Alajuela | 32.24 | 62.88 | 15.9 | 92.02 |
| Limón | 41.67 | 64.16 | 14.8 | 120.35 |
| Cartago | 53.38 | 67.76 | 16.3 | 119.99 |
| Heredia | 47.59 | 56.73 | 16.2 | 118.15 |
| San José | 45.43 | 81.14 | 15.0 | 87.34 |
| Guanacaste | 41.09 | 74.08 | 14.5 | 80.92 |
| Puntarenas | 48.63 | 74.98 | 14.8 | 113.87 |
| Province | Recycling Rate | Landfill Dependence | Biogas Production Capacity | Total Reward |
| Alajuela | 0.4224 | 0.6488 | 0.159 | 138.67 |
| Limón | 0.1667 | 0.7416 | 0.148 | 70.01 |
| Cartago | 0.1338 | 0.6976 | 0.163 | 76.84 |
| Heredia | 0.6759 | 0.6873 | 0.162 | 102.89 |
| San José | 0.3543 | 0.7714 | 0.150 | 83.62 |
| Guanacaste | 0.4109 | 0.7008 | 0.145 | 98.93 |
| Puntarenas | 0.3863 | 0.7098 | 0.148 | 80.90 |
| Province | Setup and Maintenance Cost (USD) | Operational and Processing Cost (USD) | Cost Savings from RL Optimization (USD) | Monte Carlo Mean Cost (USD) | Monte Carlo Cost Variability (Std Dev) (USD) |
| Alajuela | 1,980,336.08 | 660,387.84 | 82.43 | 422,926.03 | 59,531.99 |
| Limón | 2,085,531.98 | 655,145.98 | -43.32 | 406,433.17 | 60,453.92 |
| Cartago | 2,201,058.92 | 658,597.18 | -48.32 | 408,693.67 | 57,919.93 |
| Heredia | 1,995,344.42 | 662,215.84 | 223.24 | 419,162.98 | 58,209.73 |
| San José | 2,227,606.01 | 657,152.83 | 5.87 | 422,432.36 | 57,938.49 |
| Guanacaste | 2,317,055.49 | 661,884.07 | 62.11 | 406,928.24 | 53,972.15 |
| Puntarenas | 2,009,982.72 | 662,021.60 | 46.63 | 414,057.32 | 58,227.71 |
Disclaimer/Publisher’s Note: The statements, opinions and data contained in all publications are solely those of the individual author(s) and contributor(s) and not of MDPI and/or the editor(s). MDPI and/or the editor(s) disclaim responsibility for any injury to people or property resulting from any ideas, methods, instructions or products referred to in the content. |
© 2025 by the authors. Licensee MDPI, Basel, Switzerland. This article is an open access article distributed under the terms and conditions of the Creative Commons Attribution (CC BY) license (http://creativecommons.org/licenses/by/4.0/).


