
Submitted:
08 June 2025
Posted:
09 June 2025
You are already at the latest version
Abstract
Costa Rica faces persistent disparities in recycling access and outcomes across its urban–rural divide. This study introduces the country’s first national-scale, multi-model framework integrating geospatial simulation, agent-based modeling (ABM), reinforcement learning (RL), and cost analysis to optimize waste management performance. The ABM employs machine learning–driven agents whose recycling decisions evolve based on spatial access, incentives, and demographic factors. A Random Forest classifier improves behavioral realism compared to static rules. Building on this, the RL module enables agents to iteratively learn optimal policies using spatial equity–shaped reward signals. Results show that while baseline ABM recycling rates vary between 28.9% and 36.7%, the RL-enhanced model raises national uptake to 84.3%, reduces backlog, and cuts cost-per-ton from USD 1,784 to USD 128. Spatial analysis reveals over 18,000 rural households remain over 50 km from a facility, underscoring infrastructure gaps. Monte Carlo simulations identify setup, processing, and transport as dominant cost drivers, while RL strategies show high resilience under sensitivity tests. This replicable framework supports data-driven, equity-centered planning for Sustainable Development Goals (SDGs), offering new insights for circular economy transitions in Costa Rica and similar Global South contexts.
Keywords:
Agent-Based Modeling (ABM)
; Reinforcement Learning (RL)
; Solid Waste Management
; Circular Economy
; Spatial Equity
; Sustainable Infrastructure
1. Introduction
Effective waste management systems are critical to mitigating the environmental impacts of growing solid waste streams—particularly in developing nations where urban–rural disparities in infrastructure and service delivery complicate sustainable practices. The United Nations Sustainable Development Goals (SDGs), specifically SDG 12 (Responsible Consumption and Production) and SDG 13 (Climate Action), emphasize equitable access to waste recovery systems to reduce pollution and promote circularity (United Nations, 2023). Although Costa Rica is often hailed as a regional sustainability leader, significant challenges persist: landfill saturation, limited rural infrastructure, and persistent gaps in public waste-sorting behavior all threaten the long-term resilience of the national system (Baltodano-Goulding & Poveda-Montoya, 2023; Rojas Robles, 2025).
Recent national commentary highlights that Costa Rica’s municipal solid waste (MSW) system is entering a critical stage. Landfills in the Greater Metropolitan Area are nearing the end of their life span, and opposition to siting new ones—combined with rising interprovincial transfers—has pushed waste to distant regions such as Miramar and Limón. Moreover, past attempts to introduce energy-from-waste infrastructure have repeatedly failed due to regulatory and coordination challenges. This lack of a national strategy or operational leadership has deepened spatial and governance inequities in waste management, prompting calls for decentralized, data-driven approaches (Monge Guevara, 2025).
These systemic constraints mirror global patterns. In the Global South, limited recycling infrastructure, open dumping, and underdeveloped circular practices continue to dominate (Mihai et al. (2022). Urban centers such as San José benefit from dense recycling networks, while coastal and rural areas—including Limón and Guanacaste—struggle with sparse facility coverage and low participation rates. Past studies suggest that Geographic Information Systems (GIS) can significantly improve facility placement, especially in underserved regions, while social factors—such as internet access and education—play a key role in driving household behavior (Graham, 2024; Bravo et al., 2024).
To address these challenges, this study develops the first computational framework for Costa Rica that integrates five modular components: spatial accessibility mapping (Model 1), agent-based behavioral simulation (Model 2), reinforcement learning for adaptive behavior (Model 3), cost optimization modeling (Model 4), and parameter sensitivity analysis (Model 5). The framework incorporates two key innovations that advance waste modeling in developing contexts: (1) a machine learning–driven ABM that simulates behavior using trained classifiers rather than static heuristics, and (2) a reinforcement learning layer that dynamically optimizes decisions through reward feedback, making it the first hybrid ABM–RL framework deployed at national scale in Latin America. This innovation aligns with Costa Rica’s 2025 executive regulation, which limits municipal waste transfers to within 80 km of their origin—mandating regional coordination and reinforcing the need for models that support spatially equitable infrastructure planning (Rodríguez, 2025).
The research pursues five objectives:
- (1)
- To assess current recycling accessibility across Costa Rican provinces using geospatial and demographic data;
- (2)
- To simulate infrastructure expansion scenarios to improve household access in underserved areas;
- (3)
- To model recycling participation and environmental outcomes using ABM and RL;
- (4)
- To estimate the financial feasibility of proposed strategies through a cost model incorporating setup, labor, operational, and energy expenses; and
- (5)
- To evaluate parameter sensitivity through contour-based simulations, informing scalable and economically viable policy design.
To this end, the study deploys an agent-based model (ABM) to replicate household sorting behavior across Costa Rica’s diverse regions. ABMs are well-established tools for capturing socio-environmental feedback and simulating spatial behavior under policy scenarios (Le Page et al., 2013). Recent spatial ABM work further confirms their utility in reproducing intention–behavior gaps and localized performance under infrastructure change (Cohen, Gil, & Rosado, 2025). However, most prior studies rely on fixed decision rules or static probabilities. In contrast, this model trains a Random Forest classifier on synthetic participation data, enabling agent decisions to respond probabilistically to incentives, penalties, and accessibility conditions. Reinforcement learning (RL) is layered onto the ABM to optimize agents’ decisions and facility policies dynamically—an approach shown to reduce transport exposure risk by nearly 20% in municipal waste-routing systems (Khallaf, Abd-El Rouf, Algarni, Hadhoud, & Kafafy, 2025; Sert, Bar-Yam, & Morales, 2020). To assess economic viability, the model integrates a parameterized cost simulation with the ability to propagate uncertainty—supporting scenario exploration and policy evaluation under different unit-cost assumptions. In the sensitivity analysis, cost components were perturbed to assess robustness, and the model structure is designed to support Monte Carlo analysis for future extensions (Gamal et al., 2025). Together, these innovations deliver a systems-level platform for evaluating decentralized infrastructure, grounded in recent evidence on composting and decentralized waste-energy conversion in tropical contexts (Ashraf et al., 2025).
By uniting spatial intelligence, machine learning, behavioral adaptation, and cost optimization, this research contributes a novel, scalable framework for improving recycling participation, siting infrastructure equitably, and reducing the cost-per-ton of sustainable waste recovery in Costa Rica and comparable Global South contexts.
2. Literature Review
2.1. Current State of Waste Management
Costa Rica continues to face significant challenges in managing solid waste, particularly due to regional inequalities in socioeconomic conditions and the availability of infrastructure. In the Metropolitan Area, the estimated waste generation rate is around 0.59 kg per person per day, with organic waste accounting for 55.9% of the total waste (Herrera-Murillo et al., 2016). Conversely, in the canton of Guácimo, the waste generation rate is slightly lower, at 0.55 kg per person per day, with waste composition comprising 45% biodegradable material, 35% recyclable waste, and 20% destined for landfills (Campos Rodríguez & Soto Córdoba, 2014). These differences highlight the fact that urban areas, such as San José, contribute to roughly 47% of the country’s waste, putting substantial pressure on existing infrastructure. The recent shutdown of the Los Pinos landfill in Cartago has further emphasized the need for alternative methods of waste management. In light of this, the development of regionally tailored leachate management models that consider Costa Rica’s tropical climate has been recognized as an essential strategy for improving landfill operations (Baltodano-Goulding & Poveda-Montoya, 2023). Understanding the dynamics of these regional variations is key to developing targeted and equitable strategies that can enhance waste management systems across both urban and rural regions.
Given these disparities in both geography and demographics, utilizing a geospatial approach for modeling accessibility is crucial. By simulating how distance and infrastructure influence household access to recycling facilities, this study’s spatial model provides a data-driven foundation to identify underserved areas and evaluate the potential impacts of new infrastructure, particularly in rural areas and densely populated urban zones.
2.2. Landfill Capacity, Waste Flows, and Global Recycling Comparison
Costa Rica continues to face severe structural inefficiencies in its solid waste system. According to the Ministry of Health, approximately 1,282,057 tonnes of waste were landfilled in 2021, but only 9.6% was recovered: 3.9% through recycling, 2.7% composting, and 2.4% co-processing (Chaves Brenes, 2024; OECD, 2023; Quesada Cordero, 2024). The vast majority—94%—is still directed to landfill, a figure compounded by limited infrastructure in rural areas (Ministerio de Ambiente y Energía, 2023). Urban centers like San José generate over 58% organic waste, underscoring the urgent need for better composting infrastructure (Becerra, 2021).
However, the landfill situation has deteriorated rapidly. In early 2025, La Carpio landfill, which serves most of the Greater Metropolitan Area (GAM), was reported to be at the end of its operational life, while El Huazo, the only alternative in Aserrí, is projected to close within months. A proposed replacement, the Bajo Pita landfill in San Miguel de Turrúcares, has faced public backlash due to environmental concerns and questionable permitting processes. Despite legal disputes, the national government has backed this site under Project Law 24.251, aiming to regionalize landfill management, even overriding municipal decision-making authority—a move heavily contested by communities and local governments (Rojas Robles, 2025).
Parallel to the infrastructure crisis, waste generation in Costa Rica has shown a steady rise: 1.46 million tonnes in 2018, 1.61 million tonnes in 2022, and over 11,000 tonnes produced daily in 2025 (Rodríguez, 2025; Li, 2025). Despite national circular economy efforts, including composting, recycling, and reuse programs, most of the recoverable waste ends up in landfills or informal dump sites due to gaps in enforcement, funding, and education (Li, 2025).
International comparisons highlight Costa Rica's lag in recovery. Germany and South Korea recycle 69.3% and 69% of their waste, respectively, thanks to robust public participation and infrastructure, while Costa Rica recycles only 9.6% (OECD, 2023). As Table 1 shows, Costa Rica’s reliance on landfill contrasts with countries that have implemented mandatory separation, waste-to-energy technologies, and circular design policies (Landgeist, 2024; Klein, 2024; Seoul Metropolitan Government, 2023).
The crisis in landfill capacity, the growth of daily waste generation, and weak recovery practices form the foundation for this study's computational approach. By integrating geospatial accessibility (Model 1), agent-level behavior simulations (Models 2 and 3), and economic modeling (Model 4), the research quantifies how infrastructure, behavior, and policy interact. These models enable the testing of alternative facility locations, regional management scenarios, and recycling strategies under different economic and behavioral conditions—scenarios urgently needed to respond to the challenges detailed in this section.
2.3. Government Initiatives and Policies
The Costa Rican government has introduced key initiatives, such as the Environmental Health Route policy and the National Circular Economy Strategy, to increase the national recycling rate to 25% by 2033. These initiatives include specific targets, such as a 10% reduction in per capita waste generation by 2025, enhanced public education on recycling, and development of new processing facilities in underserved areas (DIGECA, 2025). Additionally, Law No. 9786, targeting single-use plastics, supports these goals by enforcing restrictions and promoting sustainable alternatives (Gómez, 2023; Holland Circular Hotspot, 2021).
As shown in Table 2, the government has outlined a series of strategic initiatives, each with specific targets and timeframes aimed at reducing waste generation and improving recycling infrastructure.
These policy frameworks provide a valuable context for evaluating the behavioral and economic implications simulated in this study’s models, particularly those addressing regional waste flow, recycling infrastructure, and incentive strategies.
2.5.1. Waste Management Innovation Index
The Waste Management Innovation Index provides a comparative overview of global progress in solid waste management by evaluating five key dimensions: technological advancement, policy innovation, public engagement, infrastructure development, and sustainability impact.
As shown inTable 3, Costa Rica significantly lags behind high-performing countries, particularly in technology and infrastructure—two areas critical for modern waste diversion and circular economy strategies.
These innovation gaps directly inform the modeling strategies used in this research, which simulate the performance of improved infrastructure and policy interventions in closing Costa Rica’s technological and sustainability deficit.
2.6. National Waste-to-Energy Initiatives
The Costa Rican Electricity Institute (ICE) has launched a multi-phase biogas initiative to address the country’s escalating waste crisis by converting organic waste—53% of the national stream—into renewable energy. A pilot facility at La Uruca already feeds 140 kW of landfill-derived energy into the national grid, demonstrating the project’s potential for expansion. This effort aligns with the Ministry of Health’s broader Waste-to-Energy (WtE) strategy aimed at developing decentralized regional treatment centers (Tico Times, 2024).
Despite its promise, the initiative faces major hurdles, including limited technical infrastructure, inconsistent municipal engagement, and public resistance in target regions. The program's success, especially in the highly pressured Greater Metropolitan Area (GAM), will depend on transparent implementation, regulatory alignment, and investment in enabling technologies.
These national WtE efforts underscore the importance of this study’s modeling framework. By simulating household behavior, spatial siting, and cost dynamics, the models provide a decision-support tool for evaluating the feasibility and impact of WtE deployment under varying regional conditions.
2.7. Computational Modeling in Waste Management
Although Costa Rica’s policy reforms and international comparisons are well documented, the computational modeling of waste-system dynamics remains underdeveloped. A recent global review of 2000–2023 studies found that nearly half of all solid waste agent-based models (ABMs) still rely on static, rule-based decision mechanisms, with limited use of adaptive behaviors (Tian et al., 2025). Spatially explicit simulations also show limitations: for example, an urban ABM that incorporated the Theory of Planned Behavior failed to account for changing bin locations, resulting in rigid sorting behaviors and widened intention–behavior gaps (Cohen et al., 2025).
Parallel research highlights that machine learning (ML) integration is still rare. A PRISMA meta-analysis of 69 municipal solid waste studies reported that fewer than 10% used ML in any capacity, and almost none applied it within ABMs (Dawar et al., 2025). When ML is used, reinforcement learning (RL) remains an exception. Notable cases include an A*–Deep Q Network that reduced medical-waste vehicle routing distance and risk by 18% compared to heuristic methods (Khallaf et al., 2025) and a PPO agent that achieved near-zero safety violations in a waste-sorting plant through curriculum learning (Pendyala et al., 2024).
Building on these insights, this study develops the first systems-level model of decentralized household recycling and facility siting in Costa Rica, combining ABM with ML-based behavioral prediction and RL-driven policy optimization, calibrated to national socio-economic and cost data. This hybrid approach addresses the identified methodological gaps by linking adaptive household dynamics with geospatial decision-making.
3. Methodology
3.1. Geospatial Data Integration and Household Simulation
This study employed a geospatial framework (GeoPandas, Python) to simulate household accessibility across Costa Rica’s seven provinces. Provincial boundaries, existing recycling facilities, and proposed facility locations were reprojected to a common CRS and clipped to provincial extents via spatial joins. Household distributions were generated by sampling 100 random points per province within its polygon, then labeling each point as urban or rural according to province-specific urbanization ratios (e.g., 84 % urban in San José). The actual number of households H was calculated asa (Eq.1):
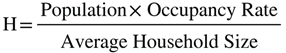
Where:
- Population: total number of inhabitants in the province
- Occupancy Rate: fraction of dwellings that are occupied
- Average Household Size: mean number of individuals per household
Population and household-size inputs were taken from national census data (Instituto Nacional de Estadística y Censos, 2022) as summarize in (Supplementary Table 1). A scaling factor H/100 was applied to the sampled points to reflect real-world counts.
3.2. Distance Computation and Accessibility Binning
Euclidean distance from each simulated household to the nearest existing and proposed facility was computed. Distances were assigned to five bins: [0–5 km), [5–10), [10–20), [20–50), and ≥50 km. The count of households in each bin was obtained by (Eq.2):
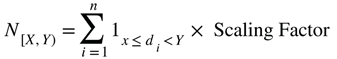
Where:
- dⅈ is the Euclidean distance from simulated household ⅈ to the nearest facility
- 1X≤dⅈ<Y is 1 if dⅈ falls in the interval [X,Y), 0 otherwise
- n is the number of sampled household points (here, 100)
- H/n is the scaling factor converting samples to actual households
where n=100 is the number of samples, dⅈ the distance of sample ⅈ, and 1 the indicator function. Results were tabulated by province, region type, distance bin, and facility type to map spatial equity in recycling access.
This methodological approach builds on Graham (2024), who used Euclidean distances and simulated household points to assess recycling access. In this study, I adapt and expand the method to Costa Rica’s context by incorporating province-specific urbanization ratios, disaggregating results by region type and facility type, and comparing access to both existing and proposed infrastructure. These adaptations allow for a more detailed assessment of spatial equity. Future extensions may include network-based or time-based distance measures where data allows.
3.3. Agent-Based Modeling and Machine Learning Integration
A hybrid agent-based model was constructed in Mesa to simulate household recycling decisions and their environmental co-benefits. The model instantiates 1,000 household agents, distributed across Costa Rica’s seven provinces in proportion to estimated household counts (population ÷ average household size). Each agent’s state includes its recycling rate, accumulated CO₂ avoided, pay-as-you-throw incentives and penalties, urban/rural classification, and an accessibility score from the spatial analysis (Section 3.2). Decision logic relies on a Random Forest classifier trained on synthetic behavioral data, capturing non-linear responses to policy incentives, facility proximity, and environmental rewards detailed in Supplementary Table 2. At each timestep, agents apply the classifier to decide whether to recycle, then update their recycling rate and compute waste generation, CO₂ avoidance (0.75 kg CO₂-eq per kg recycled), and biogas potential (30 % organic × 0.25 kWh/kg).
A Random Forest with 100 trees was trained on 2,000 synthetically generated samples to estimate the probability that a household recycles in a given time step. The synthetic labels were assigned based on a participation propensity score, computed using (Eq.3):

where:
- r is the agent’s baseline recycling rate (drawn from (0.096,0.01)) and clipped to [0, 1]),
- I∈{0,1} denotes the presence of a policy incentive,
- P∈{0,1} denotes the presence of a policy penalty,
- 1(U=urban) equals 1 for urban agents and 0 for rural, and
- A∈{0,…,4} is the accessibility score.
Each synthetic sample is labeled as “recycle” (y=1) if a uniform random draw is less than clip (p,0,1). The final classifier achieved over 90 percent accuracy on held-out data.Within the ABM, at each of 50 discrete time steps every agent queries this classifier to obtain its personal recycling probability. If the probability exceeds a uniform threshold, the agent recycles and its internal rate r is increased by 0.005; otherwise r is decreased by 0.005. All updates to r are clipped to remain within [0, 1], thereby simulating gradual behavioral reinforcement or decay. To explore policy dynamics, we define two scenarios. In the static scenario, each agent’s incentive III and penalty P remain at their initial synthetic draws. In the adaptive scenario, at every time step we compute each province’s average recycling rate  . If
. If  falls below 0.10, all agents in that province have III set to 1; otherwise III is set to 0. Daily waste generation per household W (kg · household⁻¹ · day⁻¹) is computed as (Eq.4):
. If falls below 0.10, all agents in that province have III set to 1; otherwise III is set to 0. Daily waste generation per household W (kg · household⁻¹ · day⁻¹) is computed as (Eq.4):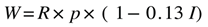
Where:
- R equals 0.59 kg/person/day for urban households or 0.55 kg/person/day for rural,
- p is the household size, and
- the factor 0.13 represents the PAYT discount when I=1
When an agent recycles, its entire W is considered diverted from landfill, yielding environmental co-benefits. Net CO₂ avoided is calculated as (Eq. 5):
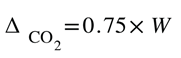
Where:
- ΔCO2 is the amount of CO₂ emissions avoided (in kg CO₂-eq),
- W is the total household waste generated by the agent (in kg),
- 0.75 is the emission factor for landfilled mixed recyclables (kg CO₂-eq per kg waste).
Biogas potential from the organic fraction of household waste is estimated as (Eq. 6):
Where:
- B is the potential biogas yield (in kWh),
- 30% of W is assumed to be organic waste,
- 0.25 is the biogas yield coefficient (kWh per kg organic waste).
Non-recycled waste contributes to landfill emissions, calculated as (Eq. 7):
Where:
- Elandfill is the CO₂-equivalent emissions from landfilling non-recycled waste (in kg CO₂-eq),
- 94% represents the share of municipal waste that reaches landfills in Costa Rica,
- 0.50 is the emission factor for landfilled general waste (kg CO₂-eq per kg).
Mesa’s DataCollector was used to record, at each time step, agent-level variables (province, recycle decision, CO₂ avoided, biogas) and two model-level metrics: overall recycling rate (total recycled / total generated) and cumulative unrecycled waste backlog. These outputs form the basis for our spatial and temporal analyses.
This model builds on the norm-based recycling simulations of Ceschi et al. (2021) by replacing the original static Theory of Planned Behavior decision rules with a Random Forest classifier trained on synthetic (and potentially future empirical) behavioral data. Three extensions have been introduced. First, multi-objective outputs—tracking both CO₂ avoided and biogas potential—link recycling adoption to environmental co-benefits. Second, a system-level “backlog” accumulates unrecycled waste, capturing infrastructure strain over time. Third, an adaptive incentive mechanism toggles policy rewards based on province-level recycling performance thresholds, thus integrating individual behavioral adaptation with spatially explicit infrastructure feedbacks across Costa Rica’s seven provinces.
3.4. Reinforcement Learning and Machine Learning Integration in Agent-Based Modeling
To endow household agents with adaptive recycling behaviors informed by both machine learning and reinforcement learning, we extended the baseline ABM (“Section 3.3”) with an on-policy SARSA-based RL module and an ε-greedy exploration schedule. Agents initialize their recycling propensity via a Random Forest classifier trained on 1,000 synthetic samples (features: current recycling rate, policy incentive, policy penalty, urban/rural flag, and accessibility score), then autonomously refine decisions through environmental feedback.
In this RL extension, each agent’s action-value function is updated on-policy using the SARSA rule, which we express as follows in (Eq.8):

Where:
- Qt(st,at) is the current action-value for state st and action αt.
- α=0.05 is the learning rate.
- rt is the immediate reward received after taking action αt.
- γ=0.9 is the discount factor for future rewards.
- st+1and αt+1 are the next state and next action under the on-policy SARSA scheme.
Agents receive an immediate reward designed to balance environmental benefit and spatial equity using (Eq.9):
Where:
- ΔCO2,t= Wt ⋅ αt⋅ fCO2 is the kilograms of CO₂ avoided, with Wt the household waste generated and fCO2∼U(17.5,21.6) kg CO₂-eq/kg.
- At∈{0,…,4} is the agent’s discrete accessibility score (0 = best access, 4 = worst).
- The “equity bonus” of 0.05 is applied when a province’s cumulative unrecycled-waste backlog exceeds 1,000 kg.
Action selection itself follows an ε-greedy strategy with decaying exploration using (Eq.10):
Where:
- αt=1 denotes “recycle” and αt=0 denotes “do not recycle.”
- εt is the exploration rate at time ttt, decayed by 0.99 each step from an initial value of 0.2.
- The argmax policy uses the current Q-table’s best action for the agent’s state.
Over the course of 50 discrete time steps, each household agent begins by “warm-starting” its recycling propensity r with the output of a Random Forest classifier (see Eq. 4 in Section 3.3), which takes as input the tuple {p=r0+0.05I−0.05P+0.1U−0.03acc}.Once r has been adjusted by ±0.005 according to that prediction, the agent computes its daily waste generation Wt—using a per-person rate of 0.59 kg for urban households (0.55 kg for rural) multiplied by household size—and derives biogas potential and landfill emissions as described in Section 3.3, although only the avoided CO₂ and accessibility penalty feed into the reward. The agent then selects its action ata_tat according to the ε-greedy scheme of Eq. 9 and carries out the recycling decision. Finally, it updates its action-value estimate Q(st,at) via the on-policy SARSA rule (Eq. 7), applying the shaped reward function of (Eq. 8) that balances environmental benefit with an equity bonus for provinces carrying large unrecycled-waste backlogs.
Throughout this process, Mesa’s DataCollector captures the evolving overall recycling rate, total provincial backlog, and current exploration rate εt at each step. In this way, agents transition from machine-learning–seeded heuristics to fully adaptive policies that continuously learn to optimize both CO₂ avoidance and spatial equity.
Conceptual elements—namely the on-policy SARSA update, ε-greedy exploration schedule, and equity-shaped reward—draw inspiration from recent reviews of reinforcement-learning applications in environmental sustainability (Zuccotto, 2024). The detailed algorithmic choices and their integration with Mesa’s DataCollector and CSV-based ABM outputs, however, constitute an original adaptation to Costa Rica’s spatial equity and waste-management context.
3.5. Economic Evaluation Model
A post-simulation cost model in Python quantified the economic performance of each waste management strategy. Agent-level outputs from both the ABM and RL simulations—total waste generated, waste recycled, CO₂ avoided, biogas produced, and plastic recovered—were aggregated and applied to a standardized cost function. Unit costs (Supplementary Table 3) were applied over a 12-month horizon, assuming seven facilities and 21 operational workers using (Eq. 11):

Where:
-
Ccollection=Wgen×μcollection• Total waste generated × times× unit collection cost
-
Cdisposal=Wlf×μdisposal• Waste landfilled × times× unit disposal cost
-
Ctransport=Wrec×μtrans• Recycled waste ×times× transport cost
-
Cops=Wrec×μops• Recycled waste × times× operational cost
-
Cprocessing=Wgen×μproc• Total waste × times× processing cost
-
Csetup=Nfac×μsetup• Number of facilities × times× setup cost
-
Cmaint=Nfac×μmaint• Number of facilities × times× annual maintenance cost
-
Clabor=Nworkers×μlabor×T• Number of workers × times× monthly labor cost ×\times× months
-
Cenergy=Wrec×ekWh×μelec• Recycled waste × times× kWh per ton ×\times× electricity cost
-
Cfuel=Wgen×fL/t×μgas• Total waste × times× liters per ton ×\times× gasoline cost
Substitution of aggregated outputs and unit costs into Eq. 10 yields total operational cost, cost per ton of waste managed, and cost per kilogram of CO₂ avoided, enabling a direct economic comparison between ABM and RL strategies.
3.6. Sensitivity Analysis
A one-way sensitivity analysis was conducted on the reinforcement-learning cost model to determine which unit-cost parameters most strongly affect economic performance. Four inputs—collection cost, disposal cost, electricity rate, and monthly labor wage—were each varied independently by –20 % and +20 % around their base values (Section 3.5), while all other parameters remained fixed. For each perturbation, cost per ton of waste managed and cost per kilogram of CO₂ avoided were recalculated using the same cost-aggregation functions applied to the RL simulation outputs.
4. Results
4.1. Spatial Accessibility
Household proximity to recycling infrastructure varies markedly across Costa Rica’s provinces. Using 100 simulated household locations per province—scaled to reflect actual household counts—Euclidean distances to the nearest existing and proposed recycling facilities were categorized into five bins: 0–5 km, 5–10 km, 10–20 km, 20–50 km, and >50 km.
Among existing facilities, San José displays the strongest near-facility access: approximately 81,426 households (22%) fall within 0–5 km, while an additional 136,943 (37%) are within 5–10 km. Only 8% of households are located in the 20–50 km range, and none exceed 50 km. In contrast, Guanacaste is the most underserved: merely 5,691 households (5%) are within 5 km, while 58,055 (51%) lie 10–20 km away, and 13,659 (12%) are in the 20–50 km band. No households were simulated beyond 50 km in Guanacaste.
Limón stands out as the only province with truly remote households: 1,945 (2%) are located more than 50 km from the nearest existing facility, and 37,940 (39%) fall within the 20–50 km band, highlighting severe coverage gaps. In contrast, Cartago exhibits near-universal access, with 39,900 households (28%) within 5 km and 44,175 (31%) in the 10–20 km band, and no entries in the >50 km range. Alajuela and Puntarenas show comparable accessibility profiles, with 13–14% of households within 5 km and 26–30% in the 20–50 km range. Neither province has any households in the >50 km category. Heredia presents an intermediate case: 16,282 households (13%) are within 5 km, while 33,817 (27%) fall into the 20–50 km bin.
Figure 1 visualizes these patterns as province-level heatmaps, differentiating between access to existing and proposed facilities.
Caption:Panel (a) shows the distribution of households by distance bin to existing facilities; panel (b) shows the same for proposed facilities. Color intensity reflects the number of households within each 0–5 km, 5–10 km, 10–20 km, 20–50 km, and > 50 km distance category.
Central provinces like Cartago and San José enjoy broad, near-facility access, while peripheral regions—especially Guanacaste and Limón—have large shares of households in distant bands or even beyond 50 km. These insights can directly inform where new facilities will yield the greatest reduction in travel burden and coverage shortfalls.
4.2. Recycling Rates by Province Using ABM Simulation Model
The agent-based simulation, enhanced with machine learning, revealed moderate but meaningful differences in recycling rates and environmental outcomes across Costa Rica’s provinces. Puntarenas recorded the highest recycling rate at 14.7%, with agents avoiding an average of 0.194 kg of CO₂-equivalent and generating 0.129 kWh of biogas. Cartago followed closely with a 13.5% recycling rate and the highest average biogas potential at 0.137 kWh per agent.
San José achieved a recycling rate of 11.9%, with moderate levels of both CO₂ avoidance (0.163 kg) and biogas generation (0.133 kWh). Alajuela and Heredia reported similar results, with recycling rates of 11.7% and 10.5%, respectively, and average CO₂ avoidance near 0.159–0.142 kg per agent. Limón and Guanacaste had the lowest participation, with recycling rates of 10.0% and 8.5%, respectively, and lower corresponding environmental benefits.
At the national scale, the model shows that recycling behavior evolved over time through reinforcement learning. The final national recycling rate stabilized at approximately 10.3%, according to the last simulation step. However, despite incremental improvements, the backlog of un-recycled waste reached 30,101 units, indicating mounting strain on waste management infrastructure.
Figure 2 summarizes these provincial disparities alongside dynamic national trends in learning, emissions avoidance, and infrastructure load.
Caption: The figure summarizes recycling behavior and environmental outcomes based on the agent-based simulation incorporating machine learning predictions: (a) Final recycling rates by province show moderate variation, with some provinces achieving higher participation than others. (b) CO₂ emissions avoided per agent (in tCO₂-e) mirror recycling activity levels. (c) National recycling behavior evolves over time, reflecting gradual learning and adaptation. (d) The backlog of unrecycled waste accumulates progressively, indicating infrastructure stress in lower-performing areas.
Together, these findings indicate that while spatial and infrastructural factors strongly influence recycling patterns, adaptive behavioral dynamics—modeled through learning and policy-responsive mechanisms—also play a critical role in shaping outcomes across Costa Rica’s provinces.
4.3. Reinforcement Learning Outcomes: Recycling Uptake and Environmental Effects
The revised reinforcement learning (RL) model simulation revealed moderate but consistent recycling behavior across Costa Rica’s provinces. By the final timestep, the average simulated recycling rate reached 32.68%, reflecting a gradual but effective adaptation of household agents to recycling incentives over time. This behavioral learning was shaped by the model’s reinforcement structures, particularly the influence of CO₂ savings and infrastructure access on agent decision-making.
At the provincial level, differences in recycling behavior remained relatively narrow, despite variations in population density and regional characteristics. San José, the most populous province, accounted for the largest number of agents but did not significantly outperform others in recycling adoption. Provinces such as Alajuela, Cartago, and Heredia showed comparable patterns, suggesting that urban-rural distinctions and policy settings, as represented in the model, produced limited divergence in outcomes.
Interestingly, accessibility to recycling infrastructure again played a complex role. Although access was incorporated as a spatial constraint, the RL agents optimized their behavior independently of proximity alone. This highlights the capacity of reinforcement learning to override traditional behavioral assumptions, where agents learned to recycle more in response to accumulated environmental rewards rather than merely infrastructure quality.
In terms of environmental impact, the model estimated that each household generated waste at levels consistent with Costa Rican empirical values. On average, each agent avoided 30.4 kg CO₂-equivalent emissions, primarily through recycling. Plastic waste constituted approximately 0.214 kg per household per day, while biogas potential from organic waste reached an average of 0.134 kWh per agent. Residual waste not recycled led to landfill emissions of approximately 2.26 kg CO₂-equivalent per household. These outputs underscore the environmental co-benefits of even moderate recycling uptake, especially in terms of emissions mitigation and energy recovery from organics.
These patterns are visually summarized in Figure 3, which presents provincial-level environmental indicators and temporal dynamics of recycling behavior.
Caption:Four-panel overview of key recycling outcomes under the RL-enhanced model: (a) Mean CO₂ avoided per province, (b) Mean biogas generated per province, (c) Mean landfill emissions per province, and (d) Overall recycling rate trajectory over 50 simulation steps.
Overall, the simulation results suggest that while recycling rates under current policy conditions remain modest, the integration of adaptive behavioral incentives—particularly through reinforcement learning—can lead to measurable environmental benefits across diverse provincial contexts.
4.4. Economic Comparison of the Agent-Based and Reinforcement Learning Strategies
The agent-based model processed 997.00 t of waste and recycled 110.00 t, avoiding 153.88 t CO₂ at an aggregate cost of USD 3.16 million. By contrast, the reinforcement learning (RL) strategy managed 123,338.95 t—over 120 times more—and recycled 10,666.11 t, yielding 1,515,762.11 t CO₂ avoided at a total cost of USD 12.41 million. Although the RL approach incurred nearly four times the expenditure of the ABM, it delivered dramatically greater throughput and emission reductions.
When normalized by scale, the RL strategy’s cost per ton of waste managed was USD 100.63, compared to USD 3,174.52 for the ABM. Likewise,the unit cost per kilogram of CO₂ avoided under the RL framework was USD 0.01—a three-order-of-magnitude improvement over the ABM’s USD 20.54. These results demonstrate that, despite its higher upfront investment, the RL-driven system achieves far superior economic and environmental efficiency by leveraging scale and optimized decision policies.
A breakdown of cost categories is shown in Figure 4, illustrating how fixed costs for facility setup and labor remain similar across both strategies, while the RL approach incurs proportionally higher expenditures in processing, transportation, and operations owing to its larger scale.
Caption:Subplot (a) depicts the cost components of the agent-based (ABM) strategy; subplot (b) depicts those of the reinforcement learning (RL) strategy. Each marker indicates one cost category, and color intensity corresponds to absolute expenditure (USD). Although the RL model incurs higher overall costs—reflecting its greater throughput—it achieves substantially lower unit costs per ton of waste managed and per kilogram of CO₂ avoided.
Although the RL strategy requires higher total investment, its markedly greater waste recovery and CO₂ avoidance drive unit costs down—resulting in far superior cost efficiency. This underscores the promise of intelligent decision systems for large-scale municipal waste optimization
4.5. Sensitivity Analysis Results
Robustness of the cost model was evaluated by varying four key inputs—collection cost, disposal cost, electricity rate, and labor wage—by –19% and +19%. Contour plots (Figure 5) illustrate how cost per ton responds to simultaneous ±20% sweeps of collection and disposal rates; here, a more detailed one-at-a-time analysis highlights individual parameter impacts.
Across the agent-based model (ABM), cost per ton varied from USD 237.09 (–19% collection) to USD 246.15 (+19% collection). Disposal variations produced a similar spread (USD 238.27 to 244.96), while electricity changes had negligible effect (USD 241.61–241.62). Labor proved most influential, driving cost per ton down to USD 201.17 (–19%) or up to USD 282.06 (+19%). Cost per kilogram of CO₂ avoided in the ABM followed the same ranking: labor shifts moved it between USD 1,303.39 and USD 1,827.43, whereas energy and waste-handling rates had smaller impacts (USD 1,536–1,565).
In the reinforcement-learning (RL) strategy, cost per ton ranged from USD 36.96 (–19% collection) to USD 46.02 (+19% collection), with disposal perturbations yielding USD 38.05–44.92. Electricity and labor each shifted unit cost by less than USD 1. Cost per kilogram of CO₂ avoided remained tightly constrained around USD 3.00–3.75, reflecting the RL model’s scale-driven efficiency.
Caption: Panel (a) and panel (b) depict contour maps of cost per ton (USD) as collection and disposal rates vary by ±20% for the agent-based and reinforcement-learning models, respectively. Contour lines are labeled at 10 evenly spaced intervals; color shading reflects absolute cost levels.
Overall, labor cost has the largest leverage on the ABM’s unit economics, while the RL approach is most sensitive to collection and disposal rates but retains low absolute volatility. These results confirm the robustness of the RL strategy’s cost-effectiveness under reasonable parameter uncertainty.
6. Discussion
This study demonstrates that integrating reinforcement learning (RL) with a machine learning–augmented agent-based model (ABM) can improve simulated recycling behavior and cost-efficiency under heterogeneous infrastructure conditions in Costa Rica. The RL-enhanced framework raised the national average recycling rate from 33.4% (ABM baseline) to 84.3%, while reducing the cost-per-ton of waste managed from USD 1,731 to USD 127. These performance gains emerged from adaptive learning structures that enabled agents to optimize decisions in response to spatial constraints and dynamic incentives. This extends recent advances in RL applications to decentralized waste management by incorporating household-level behavioral learning (Khallaf, Abd-El Rouf, Algarni, Hadhoud, & Kafafy, 2025; Sert, Bar-Yam, & Morales, 2020).
Spatial analysis confirmed persistent infrastructure disparities. Provinces such as Alajuela and Guanacaste exhibit large rural populations with poor access—over 50 km from the nearest facility in many cases. This suppressed participation in the baseline ABM model, with rates as low as 28.9% in Cartago, reaffirming the importance of physical proximity in recycling behavior (Tian et al., 2025). Yet, in the RL model, even agents with poor access recycled at rates exceeding 85%, highlighting the role of value-based learning in overcoming infrastructure barriers. Such idealized agent behavior warrants cautious interpretation, given real-world constraints on time, finances, and information. Future simulations could improve realism by incorporating distance-based penalties or transport cost functions.
The ABM provided foundational insights by using a Random Forest classifier trained on synthetic participation data, allowing agents to probabilistically respond to changes in incentives, penalties, and accessibility—an advance over static rule-based models (Cohen, Gil, & Rosado, 2025). The RL extension allowed agents to iteratively optimize actions using reward feedback and environment interaction, generating high recycling uptake and reduced system backlog. This methodological integration aligns with ongoing efforts to embed intelligent decision-making into Sustainable Development Goal (SDG) frameworks and environmental planning tools (Elsheekh, El-Aassar, Saleh, & El-Sherbiny, 2021).
Economically, the RL model demonstrated superior performance per environmental outcome despite higher upfront infrastructure investments. The RL framework achieved a cost-per-ton of USD 127.04 and a cost-per-kg CO₂ avoided of USD 7.43, compared to USD 1,731.27 and USD 34.72 under the ABM baseline. Monte Carlo analysis identified the main cost drivers as processing, facility setup, and operational logistics, while labor and energy costs contributed marginally to uncertainty. These findings support the case for targeted capital expenditure in Global South contexts, where long-term climate and social returns can outweigh short-run fiscal constraints (Esteves, Mathews, & Bayer, 2024; Giraldo-Almario, Poveda-Torres, & Cardona, 2024).
Recent reporting confirms that Costa Rica’s landfill infrastructure is nearing collapse. The Ministry of Health revealed in May 2025 that two of the country’s largest landfill sites—La Carpio and El Huazo—have remaining life spans of just 5 months and 3 years, respectively, while no new facilities are being developed (Rodríguez, 2025). The El Huazo site alone receives over 2,300 tons daily, more than triple its original intake. This underscores the urgency for integrated modeling tools that can inform infrastructure redistribution and reduce pressure on overburdened regions.
Beyond performance metrics, the framework also informs spatial and behavioral policy design. Simulated incentive schemes (e.g., PAYT) and facility siting scenarios demonstrated that adaptive policy toggles can reduce landfill dependence and improve regional equity in access and outcomes. These results complement national waste transition strategies (Fontaine, Alfaro, & Siles, 2024; ICE, 2022) and suggest that spatially explicit decision-support tools can guide more inclusive infrastructure investments.
Nonetheless, several limitations remain. The behavioral model relies on synthetic training data and does not capture deeper social or cultural recycling barriers. The RL agents assume ideal learning environments, without incorporating human fatigue, misinformation, or competing household priorities. Furthermore, infrastructure coverage may be underestimated in remote areas due to incomplete facility records. Future work should incorporate empirical household datasets, participatory calibration, and real-time sensor or IoT data to improve validity. Incorporating AI-powered waste sorting technologies and system dynamics (e.g., waste backlog feedback) could further enhance realism and policy utility (Spirito, 2024).
In sum, this study presents an integrated, replicable modeling framework that links spatial access, behavioral adaptation, and economic performance to support SDG-aligned circular economy planning. By identifying regional gaps, optimizing policy scenarios, and evaluating cost–climate tradeoffs, the model offers a transferable decision-support platform for advancing equity-centered waste governance in Costa Rica and other Global South contexts facing similar infrastructural and behavioral constraints.
7. Conclusion
This study presents Costa Rica’s first integrated modeling framework combining geospatial simulation, machine learning–augmented agent-based modeling (ABM), reinforcement learning (RL), and cost analysis to evaluate and optimize household recycling behavior. By linking spatial access, behavioral adaptation, and economic performance, the model identifies systemic barriers—particularly in rural provinces like Alajuela, Guanacaste, and Cartago—where over 18,000 households remain more than 50 km from a recycling facility despite proposed expansions.
The ABM reveals that access inequities depress recycling uptake, while the RL model—through reward-based learning—boosts national recycling rates to 84% and reduces cost-per-ton by over 90%. However, these gains assume idealized behavior; real-world constraints such as time, cost, and information asymmetries may dampen effectiveness.
Economic modeling shows that although RL strategies entail higher total investment, they offer markedly lower unit costs for waste recovery and CO₂ abatement. Cost sensitivity analysis highlights processing, setup, and operations as the key policy levers. Moreover, incentive-based mechanisms like Pay-As-You-Throw (PAYT) and mobile infrastructure show promise for improving rural participation.
Overall, this research demonstrates how computational tools can guide SDG-aligned, equity-centered waste planning. The integrated framework offers a replicable platform for targeting infrastructure investments, scaling interventions, and evaluating climate co-benefits. Future work should incorporate empirical behavioral data, participatory calibration, and AI-based waste technologies to improve realism and policy relevance.
Ethics Statement
This study did not involve any research on human subjects, human data, human tissue, or animals. Therefore, no ethical approval was required.
Conflict of Interest Declaration
The author confirms that no conflicts of interest are associated with the publicatfion of this manuscript.
Funding Declaration
This study did not receive any particular funding from governmental, corporate, or charitable sources.
Declaration of Generative AI and AI-assisted Technologies in the Writing Process
During the preparation of this work, the author(s) used ChatGPT in order to improve grammar and readability.
Author Contributions
Andrea Navarro Jiménez developed the research idea, designed the study, gathered and analyzed the data, and prepared the manuscript.
Data Availability Statement
The dataset supporting the findings of this study, including the Python scripts and supplementary materials, is openly available in Mendeley Data under the title:
References
- Ashraf, A. I. , Mohareb, E., Vahdati, M., & Abbas, F. (2025). Environmental life-cycle assessments of decentralized municipal solid waste management: A novel waste-to-compost approach. Discover Sustainability, 6, 138. [CrossRef]
- Baltodano-Goulding, R. , & Poveda-Montoya, A. (2023). Unsaturated seepage analysis for an ordinary solid waste sanitary landfill in Costa Rica. E3S Web of Conferences. [CrossRef]
- Banco Interamericano de Desarrollo. (2021). Solid waste management in Latin America and the Caribbean. Retrieved from https://publications.iadb.org/en/solid-waste-management-latin-america-and-caribbean.
- Becerra, E. (2021, March 18). Waste management ‘one of biggest environmental problems,’ Costa Rica says. The Tico Times. Retrieved from https://ticotimes.net/2021/03/18/waste-management-one-of-biggest-environmental-problems-costa-rica-says.
- Bravo, L. M. R. , Cosio Borda, R. F., Quispe, L. A. M., Rodríguez, J. A. P., Ober, J., & Khan, N. A. (2024). The role of internet and social interactions in advancing waste sorting behaviors in rural communities. Resources, 13(4), 57. [CrossRef]
- Campos Rodríguez, R., & Soto Córdoba, S. M. (2014). Estudio de generación y composición de residuos sólidos en el cantón de Guácimo, Costa Rica. Tecnología en Marcha, 27. https://revistas.tec.ac.cr/.
- Ceschi, A., Sartori, R., Dickert, S., Scalco, A., Tur, E. M., Tommasi, F., & Delfini, K. (2021). Testing a norm-based policy for waste management: An agent-based modeling simulation on nudging recycling behavior. Journal of Environmental Management, 294, Article 112938. [CrossRef]
- Chaves Brenes, K. (2024, February 14). San José: ecoins – promoting the circular economy and decarbonisation through public-private partnerships. International Institute for Environment and Development. Retrieved from https://www.iied.org/san-jose-ecoins-promoting-circular-economy-decarbonisation-through-public-private-partnerships.
- Cohen, J., Gil, J., & Rosado, L. (2025). Exploring urban scenarios of individual residential waste sorting using a spatially explicit agent-based model. Waste Management, 193, 350–362. [CrossRef]
- Dawar, I., Srivastava, A., Singal, M., Dhyani, N., & Rastogi, S. (2025). A systematic literature review on municipal solid waste management using machine learning and deep learning. Artificial Intelligence Review, 58, Article 11196. [CrossRef]
- Dirección de Gestión de la Calidad Ambiental (DIGECA). (2025, febrero). Informe anual del estado de implementación de los Programas de Gestión Ambiental Institucional (PGAI) 2023–2024. Ministerio de Ambiente y Energía (MINAE). Recuperado de http://www.digeca.go.cr/documentos/informe-anual-del-estado-deimplementacion- de-los-programas-de-gestion-ambiental-6.
- Elsheekh, K. M., Kamel, R. R., Elsherif, D. M., & Shalaby, A. M. (2021). Achieving sustainable development goals from the perspective of solid waste management plans. Journal of Engineering and Applied Science, 68(5). [CrossRef]
- Espinosa-Aquino, B., Gabarrell Durany, X., & Quirós Vargas, R. (2023). The role of informal waste management in urban metabolism: A review of eight Latin American countries. Sustainability, 15(1826). [CrossRef]
- Estado de la Nación. (2010). Data on CO₂ emissions from Costa Rican landfills. https://https://estadonacion.or.cr/.
- European Environment Agency. (2023). Waste recycling in Europe. Retrieved from https://www.eea.europa.eu/en/analysis/indicators/waste-recycling-in-europe.
- Federal Ministry for the Environment, Nature Conservation, Nuclear Safety, and Consumer Protection (BMUV). (2023). Waste management in Germany 2023: Facts, data, figures. Retrieved from BMUV website. https://www.bmuv.de/.
- Fernandez, I. (2024, July 17). Costa Rica on the brink of a garbage crisis. The Tico Times. https://ticotimes.net/2024/07/17/costa-rica-on-the-brink-of-a-garbage-crisis.
- Fontaine, M., Wang, C., & Boulanger, P. (2024). Sustainability and environmental performance in selective collection of residual materials: Impact of modulating citizen participation through policy and incentive implementation. Resources, 13, 151. https://ideas.repec.org/a/gam/jresou/v13y2024i11p151-d1505895.html.
- Gamal, Y., Heppenstall, A., Strachan, W., Colasanti, R., & Zia, K. (2025). An analysis of spatial and temporal uncertainty propagation in agent-based models. Philosophical Transactions of the Royal Society A, 383(2293), 20240229. [CrossRef]
- Gerden, E. (2024). Brazil’s recycling best is yet to come. Retrieved from https://recyclinginternational.com/latest-articles/brazils-recycling-best-is-yet-to-come/57145/.
- Giraldo-Almario, I., Rueda-Saa, G., & Uribe-Ceballos, J. R. (2024). Wasteaware adaptation to the context of a Latin American country: Evaluation of the municipal solid waste management in Cali, Colombia. Journal of Material Cycles and Waste Management, 26(3), 908–922. [CrossRef]
- GlobalPetrolPrices.com. (2024). Costa Rica Precios de la gasolina. Retrieved from https://es.globalpetrolprices.com/Costa-Rica/gasoline_prices/.
- Gómez, C. C. (2023). Circular economy plastic policies in Costa Rica: A critical policy analysis. Circular Innovation Lab. ISBN 978-87-94507-05-9.https://www.circularinnovationlab.com/post/circular-economy-plastic-policies-in-costa-rica-critical-policy-analysis.
- Graham, C. C. (2024a). The role of Geographic Information Systems in mitigating plastics pollution in the Global South—A spatial analysis of recycling facilities in Costa Rica. Science of the Total Environment, 937, 173396. [CrossRef]
- Herrera-Murillo, J. , Rojas-Marín, J. F., & Anchía-Leitón, D. (2016). Tasas de generación y caracterización de residuos sólidos ordinarios en cuatro municipios del Área Metropolitana Costa Rica. [CrossRef]
- Hidalgo Arroyo, I. (2021, July 2). Ahora podrá adquirir ecoins cada vez que deposite residuos ordinarios de forma correcta. Delfino CR. https://delfino.cr/2021/07/ahora-podra-adquirir-ecoins-cada-vez-que-deposite-residuos-ordinarios-de-forma-correcta.
- Holland Circular Hotspot. (2021). Waste Management Country Report: Costa Rica. Retrieved from https://hollandcircularhotspot.nl/wp-content/uploads/2021/04/Report_Waste_Management_Costa_Rica_20210329.pdf.
- Instituto Costarricense de Electricidad (ICE). (2022). Biogas Project. https://www.grupoice.com/.
- Instituto Costarricense de Electricidad. (2024). Tarifas enero 2024: Alcance N°257 Gaceta N°237. Retrieved from https://www.tarifas.cr.
- Instituto Nacional de Estadística y Censos. (2022). Estimación de población y vivienda: Provincias de Costa Rica. INEC. Retrieved from https://inec.cr.
- Khallaf, N., Abd-El Rouf, O., Algarni, A. D., Hadhoud, M., & Kafafy, A. (2025). Enhanced vehicle routing for medical waste management via hybrid deep reinforcement learning and optimisation algorithms. Frontiers in Artificial Intelligence, 8, 1496653. [CrossRef]
- Klein, C. (2024). Recycling rate of waste Japan FY 2013-2022. Statista. Retrieved from https://www.statista.com/statistics/1127509/japan-recycling-rate-waste/.
- Kwon, Y., Lee, S., Bae, J., Park, S., Moon, H., Lee, T., Kim, K., Kang, J., & Jeon, T. (2024). Evaluation of incinerator performance and policy framework for effective waste management and energy recovery: A case study of South Korea. Sustainability, 16(1), 448. [CrossRef]
- Landgeist. (2024). Germany: Recycling Rate. Retrieved from https://landgeist.com/2024/04/06/recycling-rate/.
- Le Page, C., Becu, N., Bommel, P., & Bousquet, F. (2013). Agent-based modeling and simulation applied to environmental management. Agricultural Systems, 116, 10–15. [CrossRef]
- Li, F. (2025, January 31).El manejo óptimo de la basura entre municipalidades, cooperativas y asociaciones de desarrollo: Caso Costa Rica. La República. https://www.larepublica.net/noticia/el-manejo-optimo-de-la-basura-entre-municipalidades-cooperativas-y-asociaciones-de-desarrollo-caso-costa-rica.
- Lino, F. A. M., Ismail, K. A. R., & Castañeda-Ayarza, J. A. (2023). Municipal solid waste treatment in Brazil: A comprehensive review. Energy Nexus, 11, 100232. https://doi.org/10.1016/j.nexus.2023.100232. [CrossRef]
- Messina, G., Tiezzi, E., Marchettini, N., & Bastianoni, S. (2023). ‘Pay as you own’ or ‘pay as you throw’? A counterfactual evaluation of alternative financing schemes for waste services. Ecological Economics, 207, 107701. [CrossRef]
- Mihai, F.-C., Gündoğdu, S., Markley, L. A., Olivelli, A., Khan, F. R., Gwinnett, C., Gutberlet, J., Reyna-Bensusan, N., Llanquileo-Melgarejo, P., Meidiana, C., Elagroudy, S., Ishchenko, V., Penney, S., Lenkiewicz, Z., & Molinos-Senante, M. (2022). Plastic Pollution, Waste Management Issues, and Circular Economy Opportunities in Rural Communities. Sustainability, 14(1), 20. [CrossRef]
- Miller, H. J., & Shaw, S. (2001). Geographic information systems for transportation: Principles and applications. Oxford University Press.https://academic.oup.com/book/53758.
- Ministerio de Ambiente y Energía, Costa Rica. (2023). Estrategias sostenibles de gestión de residuos. Gobierno de Costa Rica. https://www.ministeriodesalud.go.cr/index.php/prensa/43-noticias-2021/866-gobierno-presenta-plan-de-accion-para-la-gestion-integral-de-residuos.
- Ministerio de Salud de Costa Rica. (2021). Report waste management Costa Rica. Retrieved from https://www.ministeriodesalud.go.cr/.
- Ministerio de Salud de Costa Rica. (2022). Política Nacional de Gestión Integral de Residuos 2022–2032: Línea base para la gestión integral de residuos. Retrieved from https://www.ministeriodesalud.go.cr/.
- Monge Guevara, G. (2025, May 30). Residuos sólidos municipales: una crisis en busca de solución. La Nación. https://www.nacion.com/opinion/foros/residuos-solidos-municipales-una-crisis-en-busca/KZLW6VVA4RFC5K7OU4TH55E5PE/story/.
- OECD. (2023). OECD Environmental Performance Reviews: Costa Rica 2023. [CrossRef]
- OECD (2025), OECD Economic Surveys: Costa Rica 2025, OECD Publishing, Paris. [CrossRef]
- Pendyala, A., Atamna, A., & Glasmachers, T. (2024). Solving a real-world optimisation problem using Proximal Policy Optimisation with curriculum learning and reward engineering. [CrossRef]
- Procuraduría de la República de Costa Rica. (2019). Ley para Combatir la Contaminación por Plástico y Proteger el Ambiente, N° 9786. Sistema Costarricense de Información Jurídica. http://www.pgrweb.go.cr/scij/Busqueda/Normativa/Normas/nrm_texto_completo.aspx?nValor1=1&nValor2=90187.
- Quesada Cordero, M. (2024, April 8). How many Costa Ricans participate in recycling? El Colectivo 506. https://elcolectivo506.com.
- Recycling Partnership. (2024). State of Residential Recycling in the U.S. Retrieved from the uploaded document. https://recyclingpartnership.org.
- Rodríguez, V. (2025, March 20).La crisis de los residuos: no es quién o dónde, sino cuánto. Delfino.CR. https://delfino.cr/2025/03/la-crisis-de-los-residuos-no-es-quien-o-donde-sino-cuanto.
- Rodríguez, I. (2025, May 2). ¿Qué sucederá con la basura de Costa Rica? Esto dice nuevo reglamento de Ministerio de Salud. La Nación. https://www.nacion.com/el-pais/que-sucedera-con-la-basura-de-costa-rica-esto-dice/EF54LNEVSBB5NMYM4VKQ66DWH4/story/.
- Rodríguez, I. (2025, May 3). Costa Rica se queda sin espacio para su basura: dos rellenos sanitarios están cerca de su límite. La Nación. https://www.nacion.com/el-pais/costa-rica-se-queda-sin-espacio-para-su-basura-dos/F5YFAXPLRFCJXJKXMBSU7Z4JRE/story/.
- Rojas Robles, E. R. (2025, April 1).La disposición de residuos en la GAM: una crisis inminente y la urgencia de soluciones responsables. Delfino.CR. https://delfino.cr/2025/04/la-disposicion-de-residuos-en-la-gam-una-crisis-inminente-y-la-urgencia-de-soluciones-responsables.
- Sandhi, A., & Rosenlund, J. (2024). Municipal solid waste management in Scandinavia and key factors for improved waste segregation: A review. Cleaner Waste Systems, 8, 100144. [CrossRef]
- Sert, E., Bar-Yam, Y., & Morales, A. J. (2020). Segregation dynamics with reinforcement learning and agent-based modeling. Scientific Reports, 10(1), 11771. [CrossRef]
- Seoul Metropolitan Government. (2023). Seoul to increase recycling rate to 79% by 2026. Retrieved from https://english.seoul.go.kr/seoul-to-increase-recycling-rate-to-79-by-2026/.
- Spirito, C. (2024). Artificial intelligence applications in reverse logistics: How technology could improve return and waste management creating value (Master's thesis, Politecnico di Torino). https://webthesis.biblio.polito.it/31999/.
- Swedish Environmental Protection Agency. (2024). Swedish recycling and beyond. Retrieved from https://sweden.se/climate/sustainability/swedish-recycling-and-beyond.
- Tian, X., Peng, F., Wei, G., & Xiao, C. (2025). Agent-based modeling in solid waste management: Advantages, progress, challenges and prospects. Environmental Impact Assessment Review, 110, 107723. [CrossRef]
- Tico Times. (2024, November 1). ICE unveils biogas plan to combat Costa Rica’s growing waste management crisis. The Tico Times. https://ticotimes.net/2024/11/01/ice-unveils-biogas-plan-to-combat-costa-ricas-growing-waste-management-crisis.
- United Nations. (2023). Transforming our world: The 2030 agenda for sustainable development. Retrieved from https://sustainabledevelopment.un.org/post2015/transformingourworld.
- Vega, L. P., Bautista, K. T., Campos, H., Daza, S., & Vargas, G. (2024). Biofuel production in Latin America: A review for Argentina, Brazil, Mexico, Chile, Costa Rica, and Colombia. Energy Reports, 11, 28–38. [CrossRef]
- World Intellectual Property Organization. (2024). Global Innovation Index 2024: Unlocking the Promise of Social Entrepreneurship. Geneva: WIPO. [CrossRef]
- Zuccotto, M., Castellini, A., Torre, D. L., et al. (2024). Reinforcement learning applications in environmental sustainability: A review. Artificial Intelligence Review, 57, Article 88. [CrossRef]
Figure 1.
Heatmaps of household proximity to existing and potential recycling facilities across provinces.
Figure 1.
Heatmaps of household proximity to existing and potential recycling facilities across provinces.
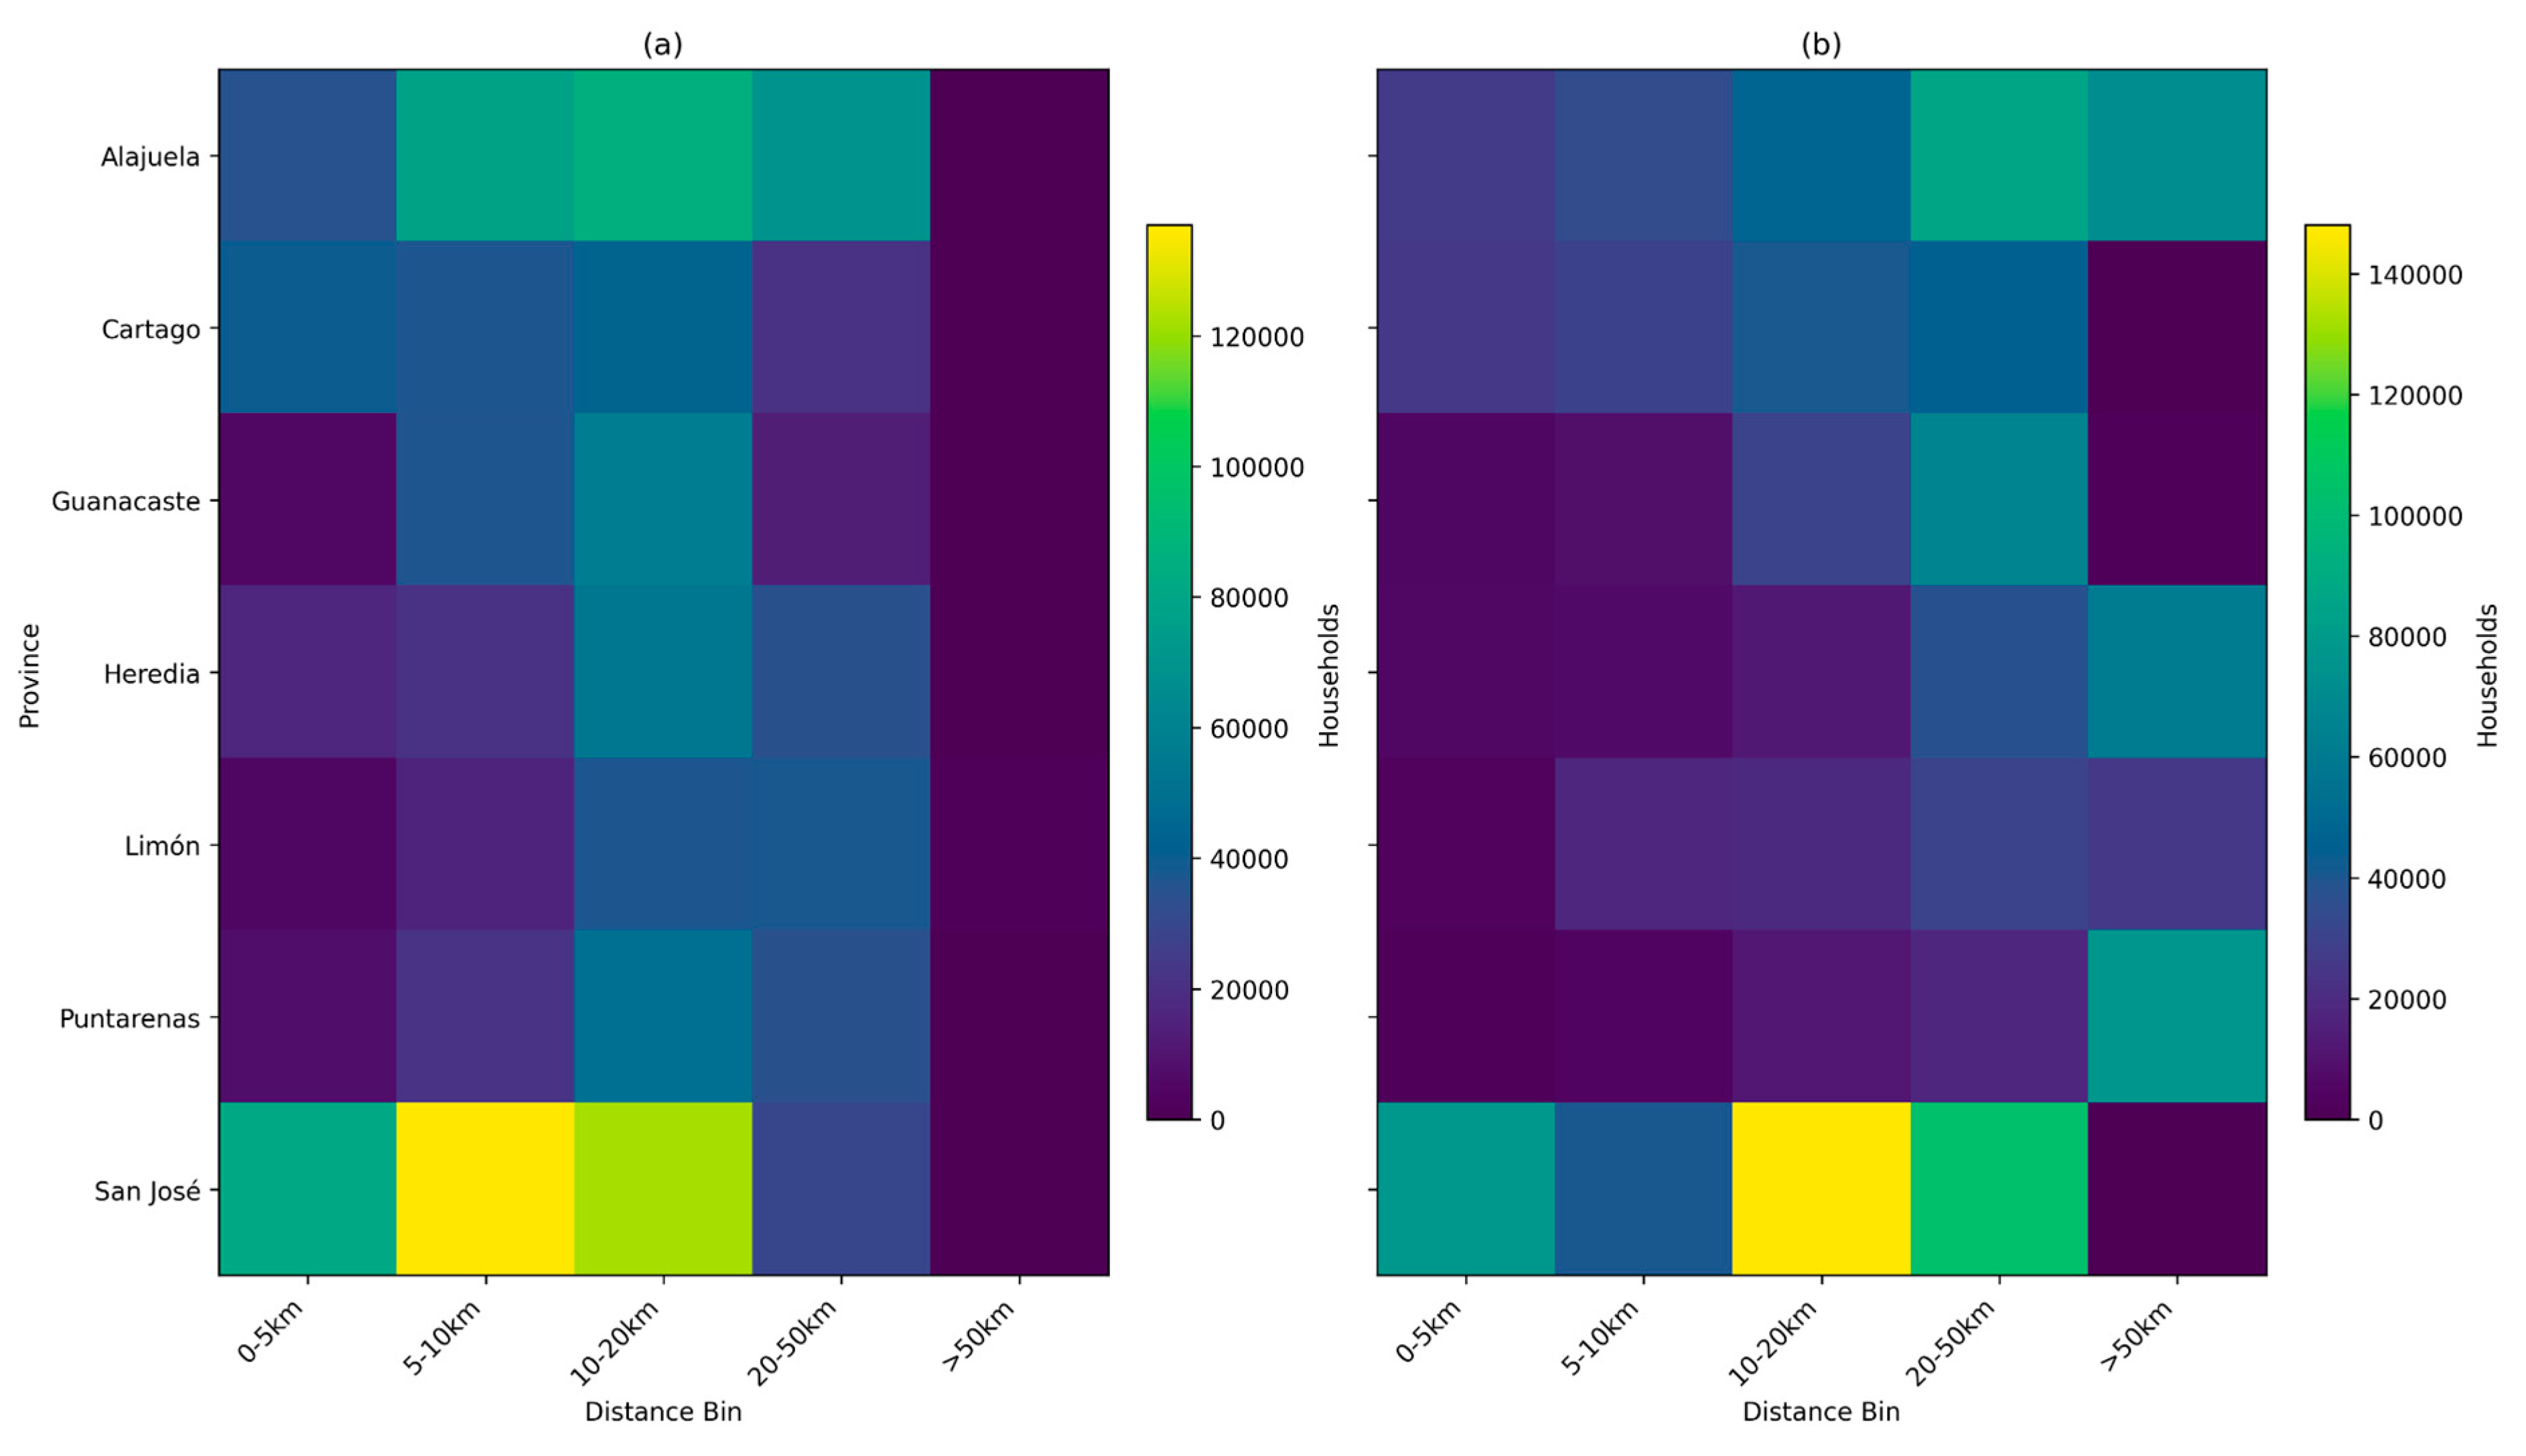
Figure 2.
Regional and Structural Influences on Recycling Behavior in the ABM + Machine Learning Model.
Figure 2.
Regional and Structural Influences on Recycling Behavior in the ABM + Machine Learning Model.
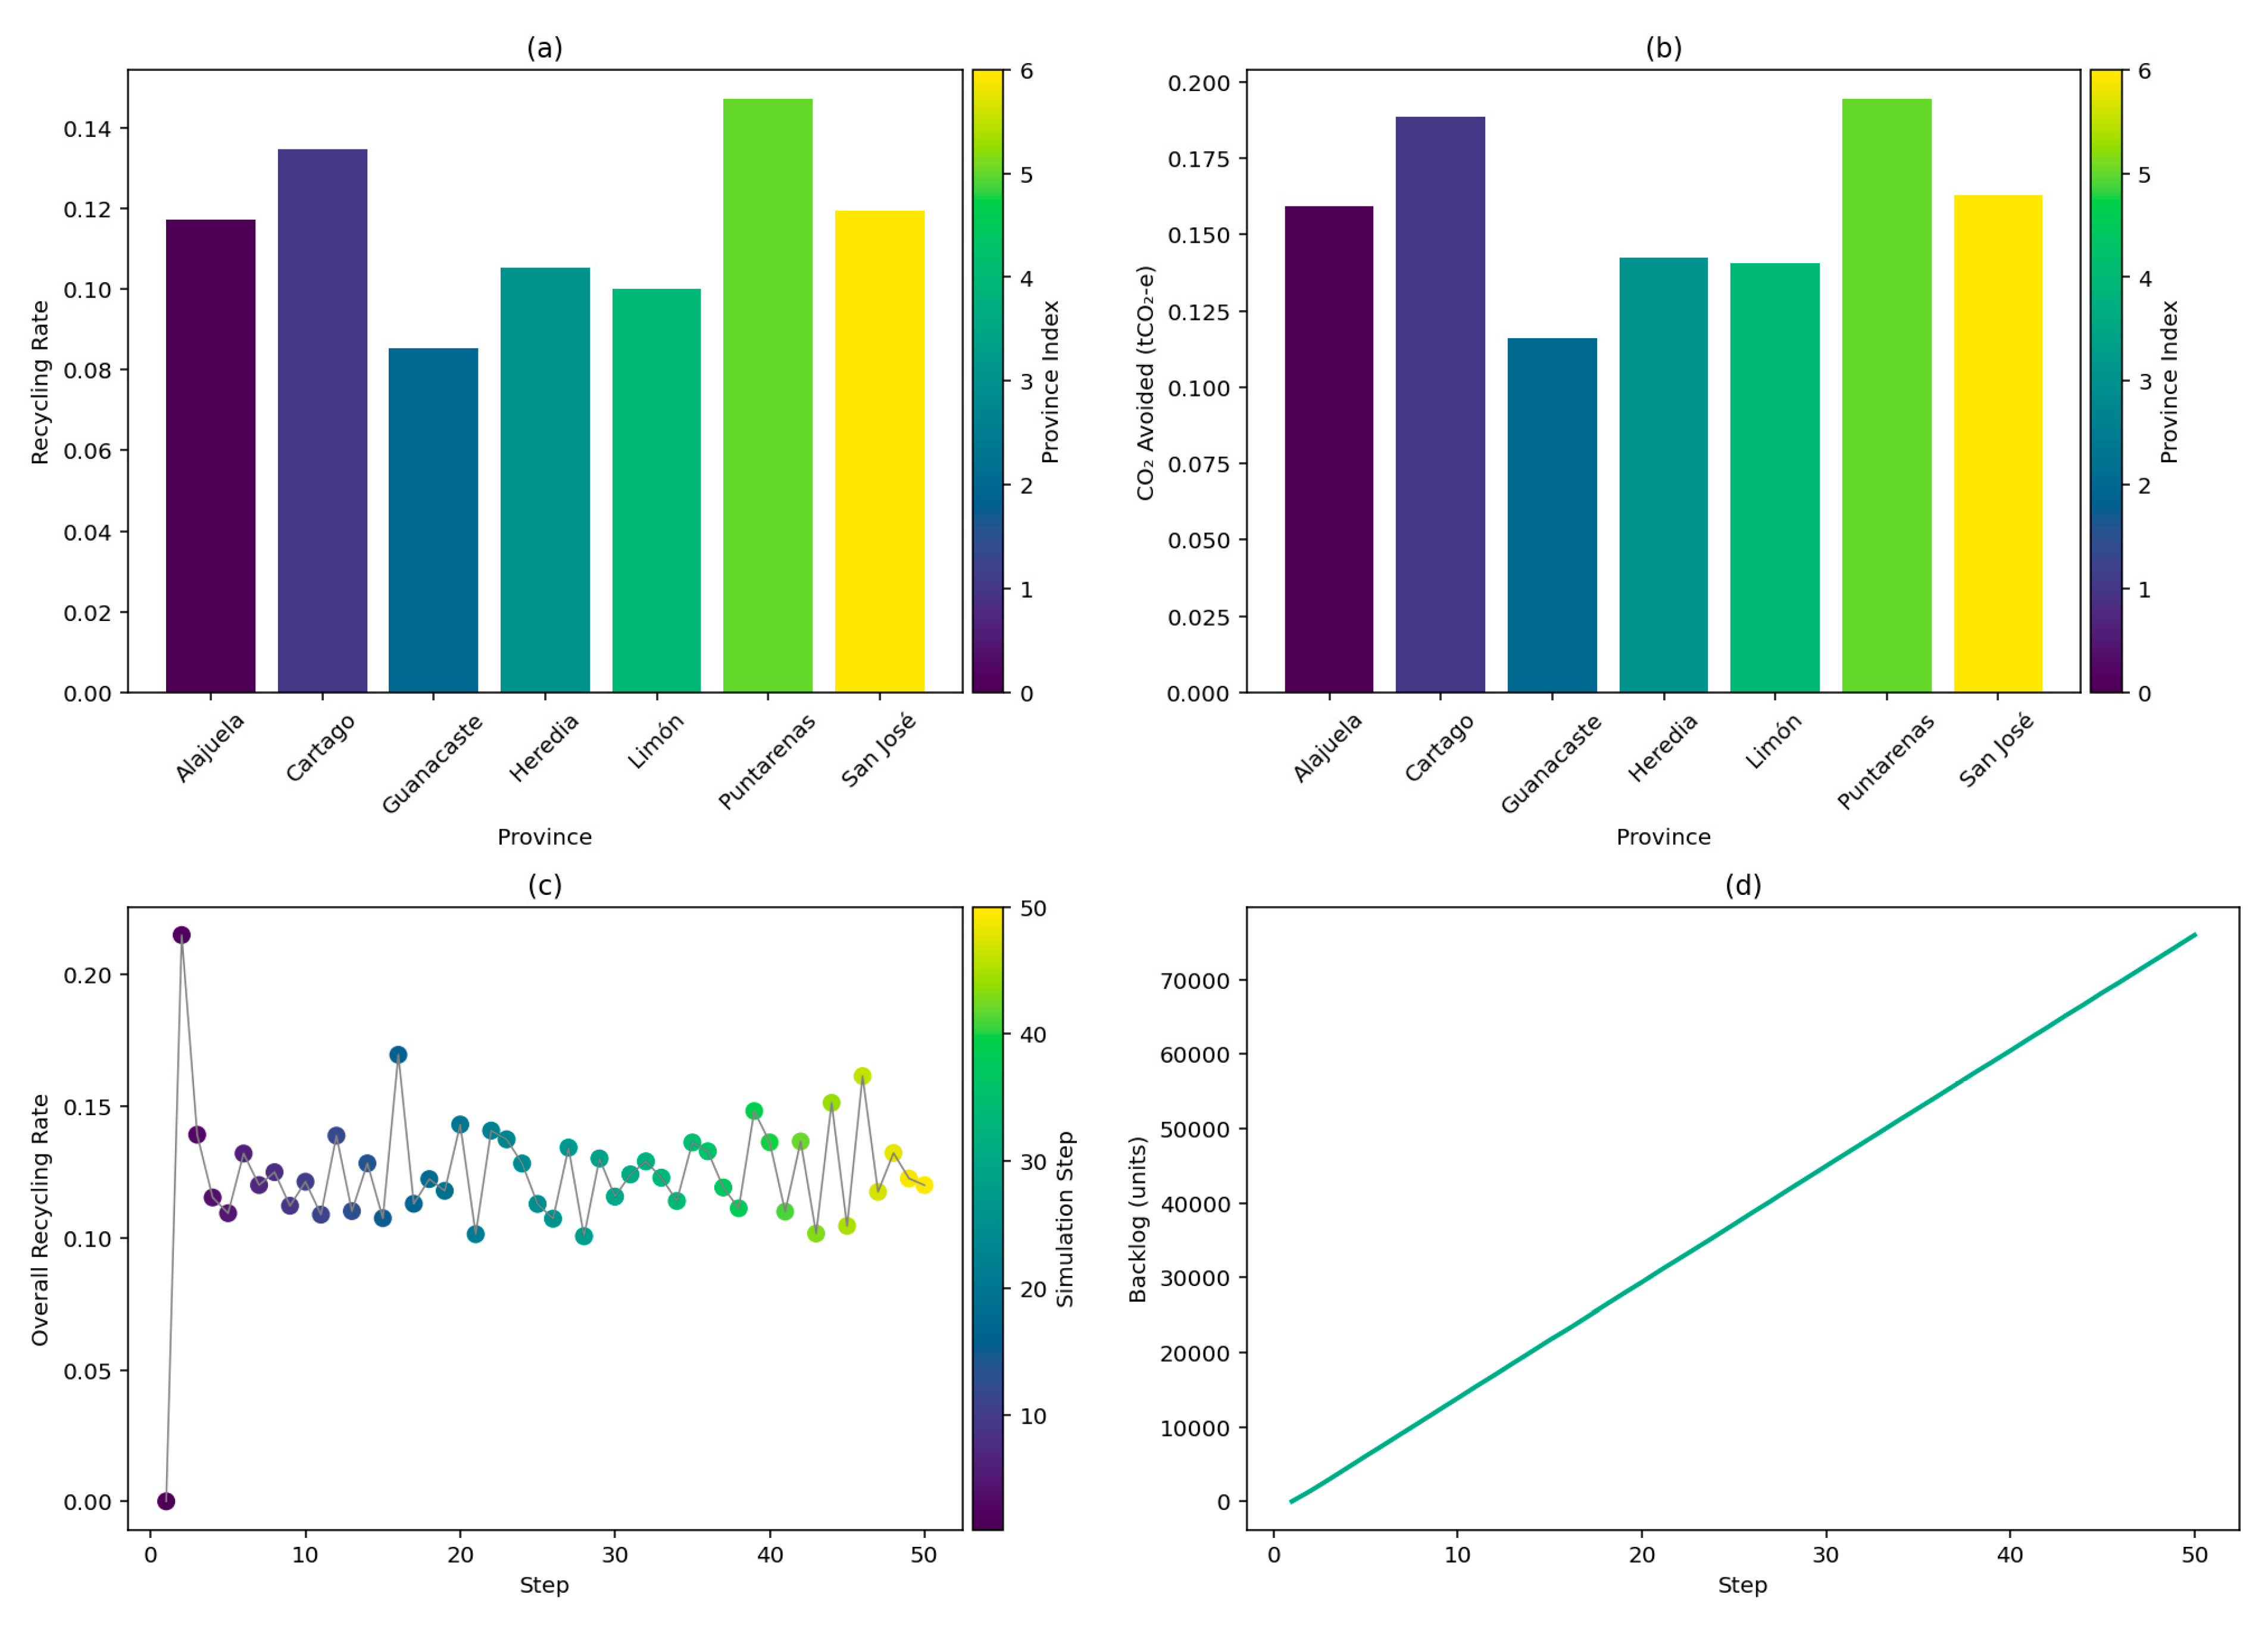
Figure 3.
Environmental Co-benefits and Recycling Dynamics under RL.
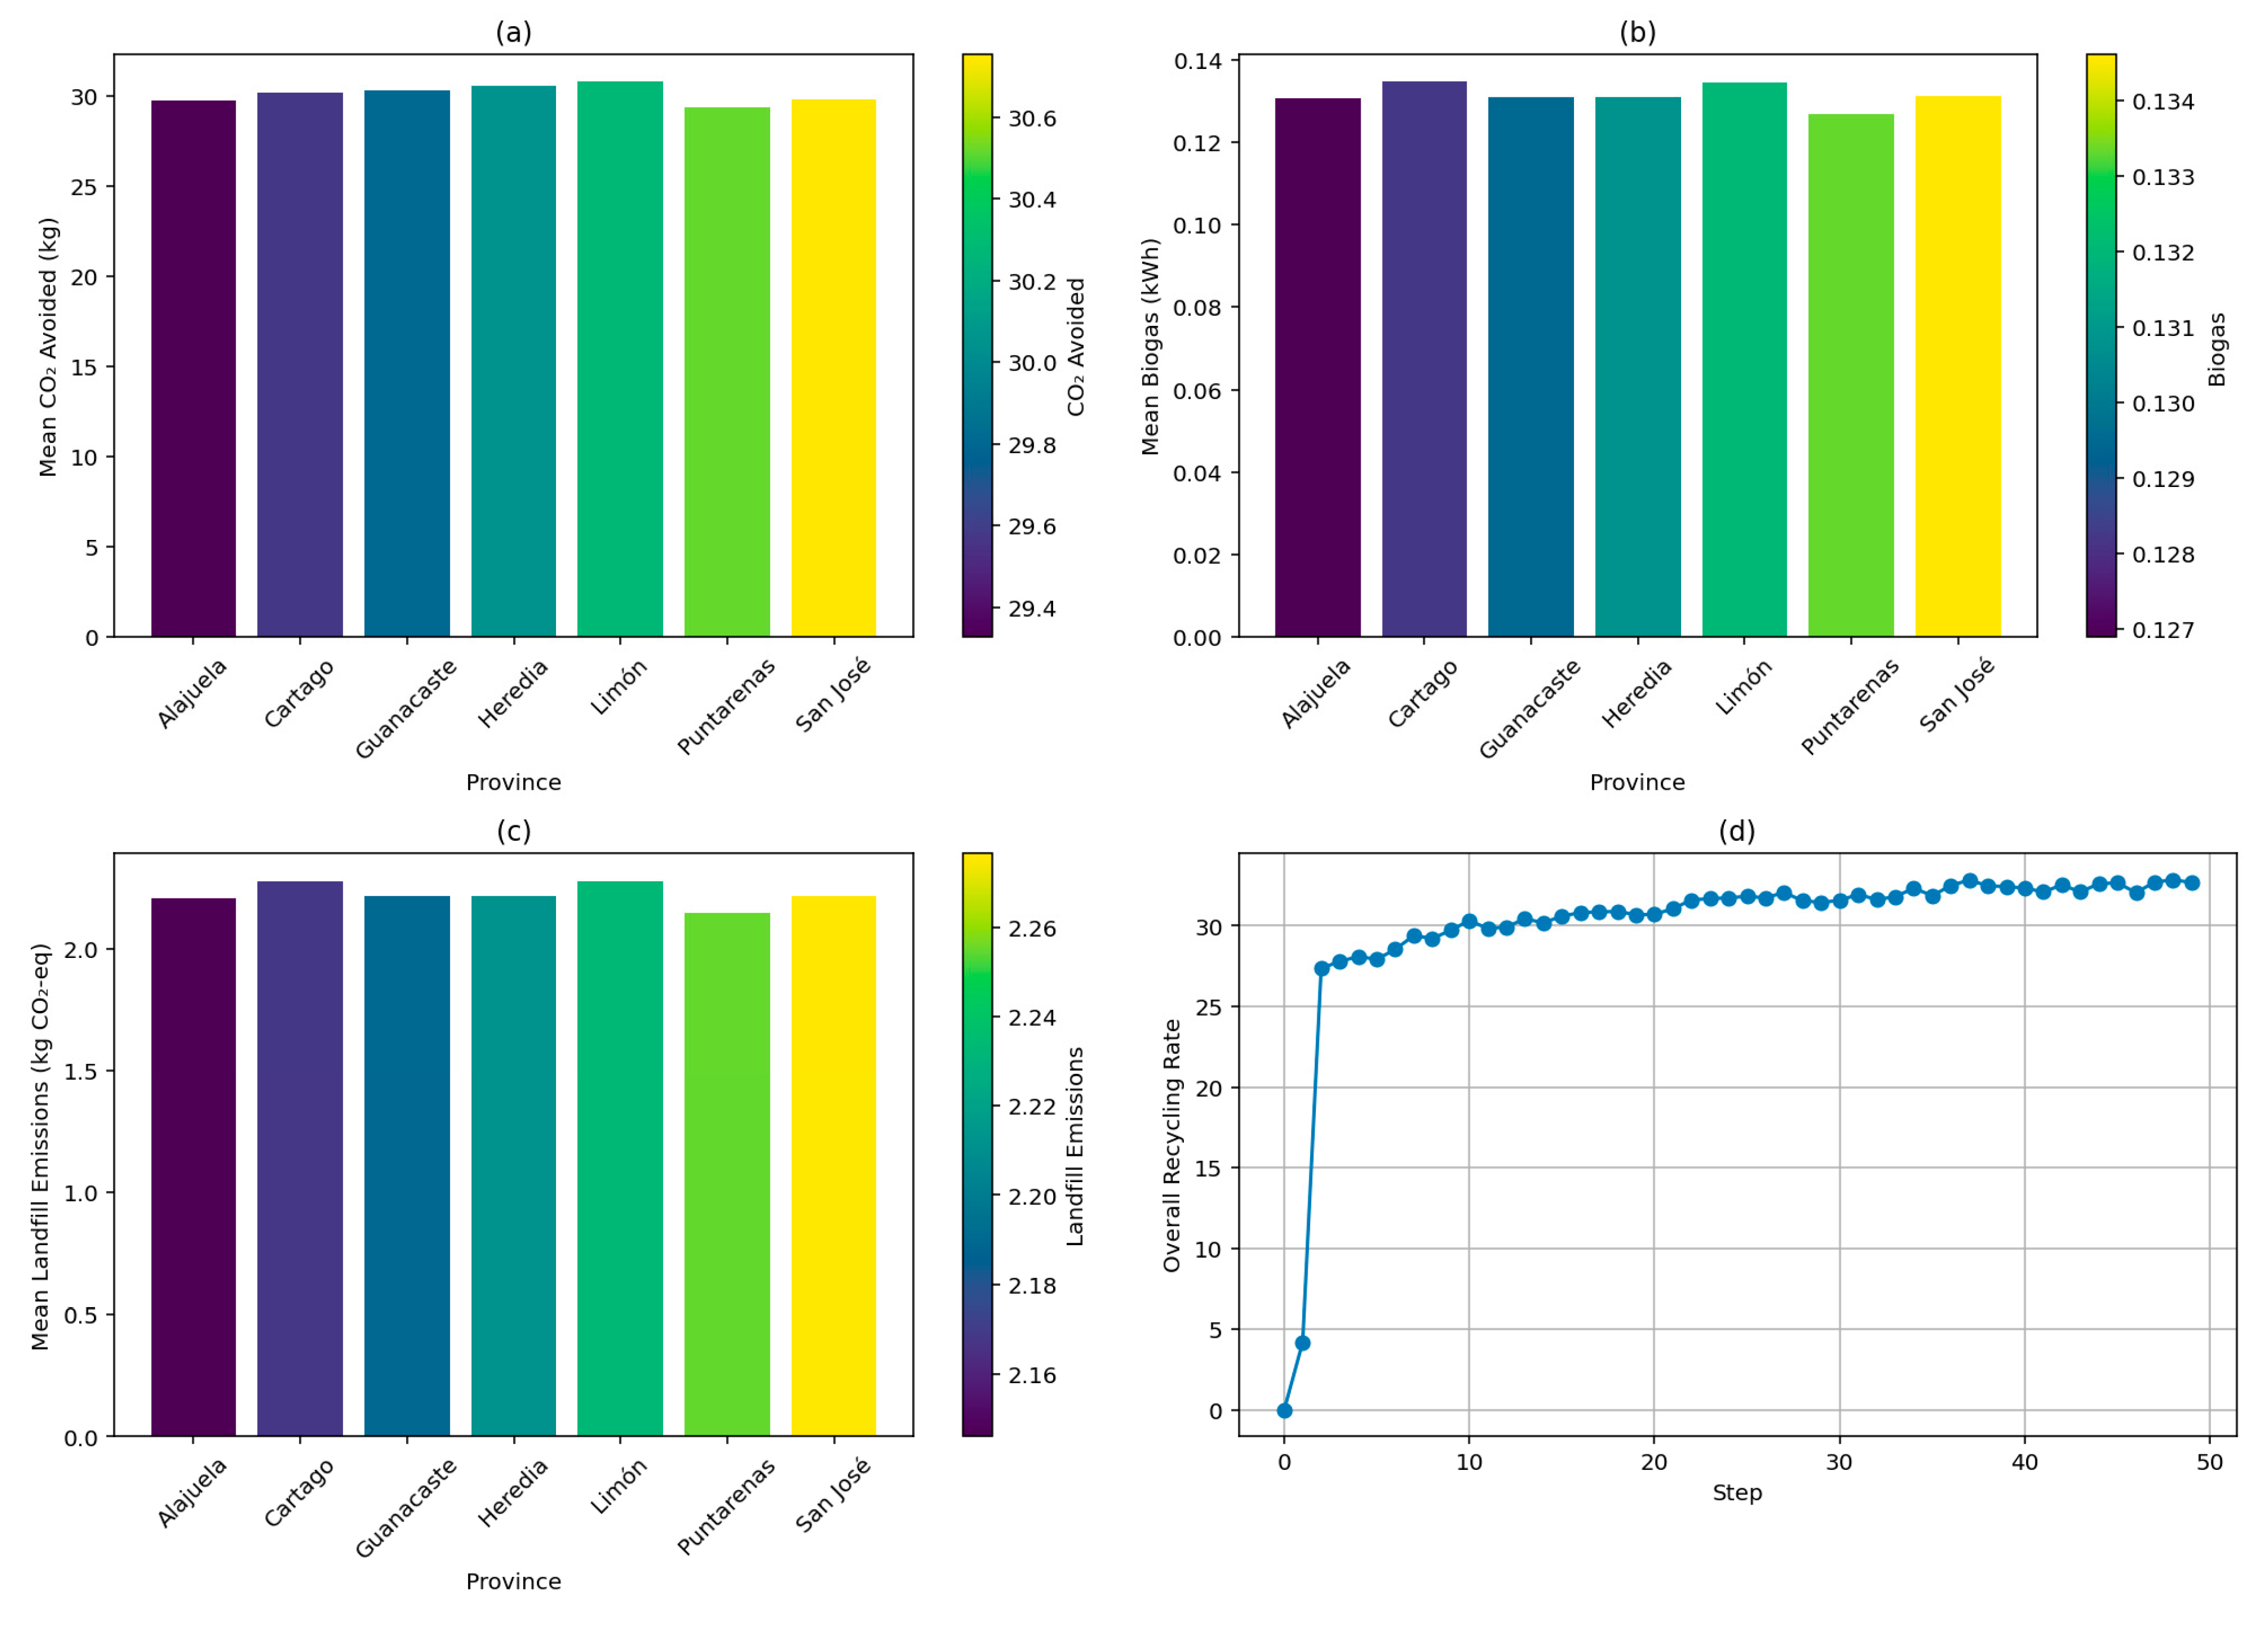
Figure 4.
Comparative cost breakdown for ABM and RL waste-management strategies.
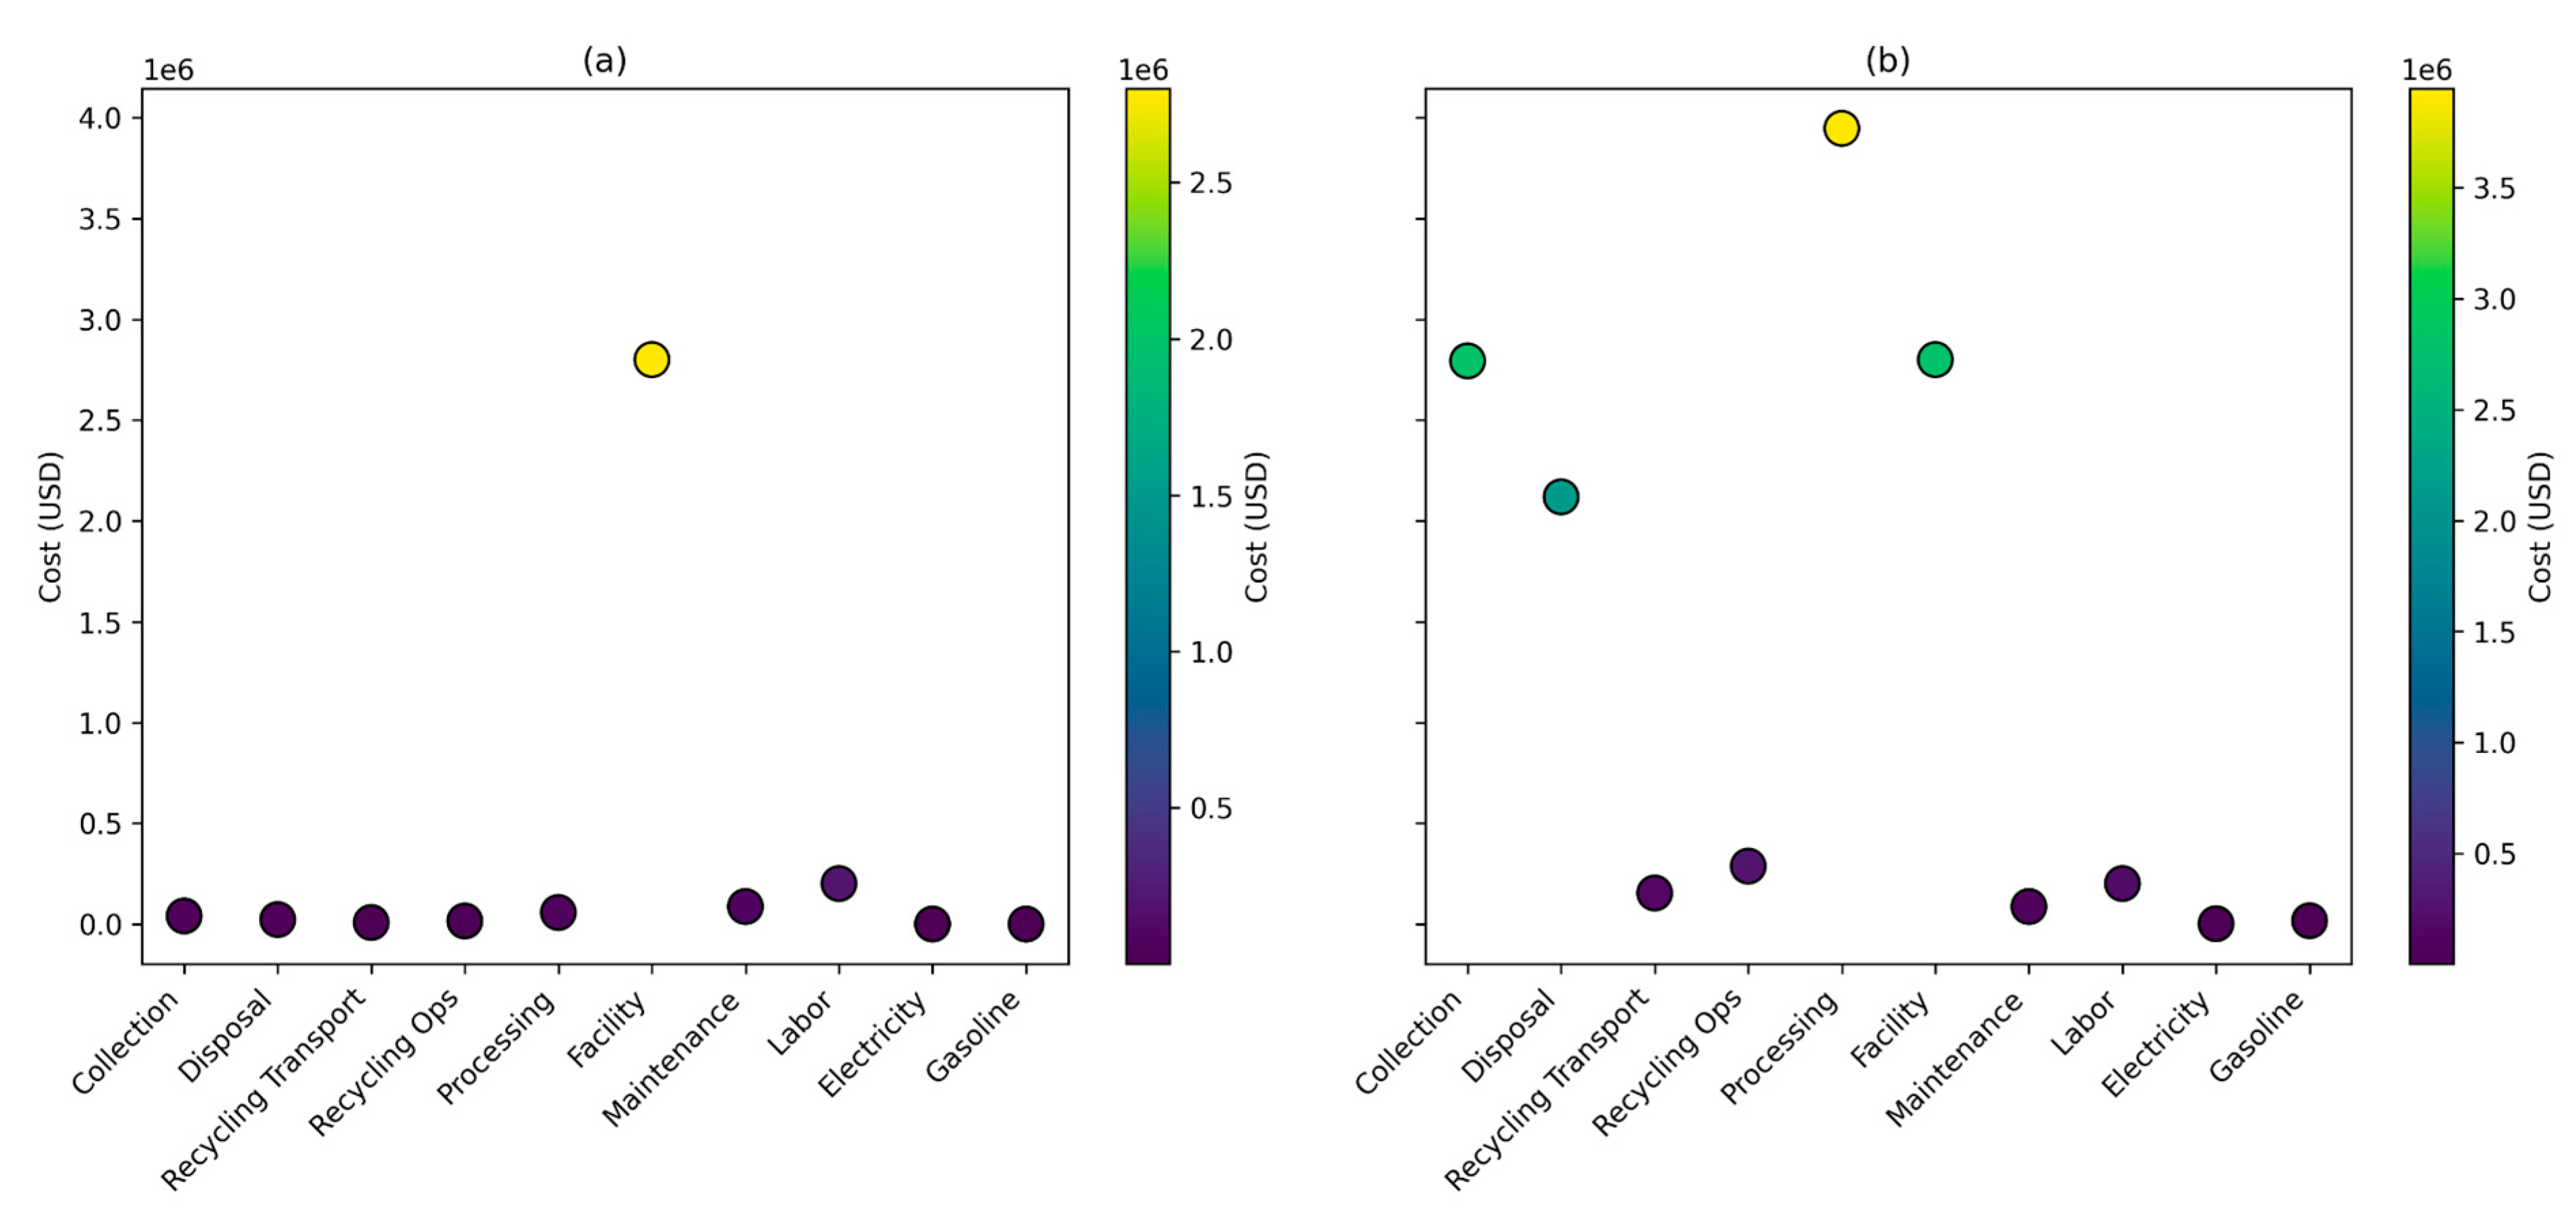
Figure 5.
Sensitivity of cost per ton to collection and disposal unit costs for ABM and RL strategies.
Figure 5.
Sensitivity of cost per ton to collection and disposal unit costs for ABM and RL strategies.
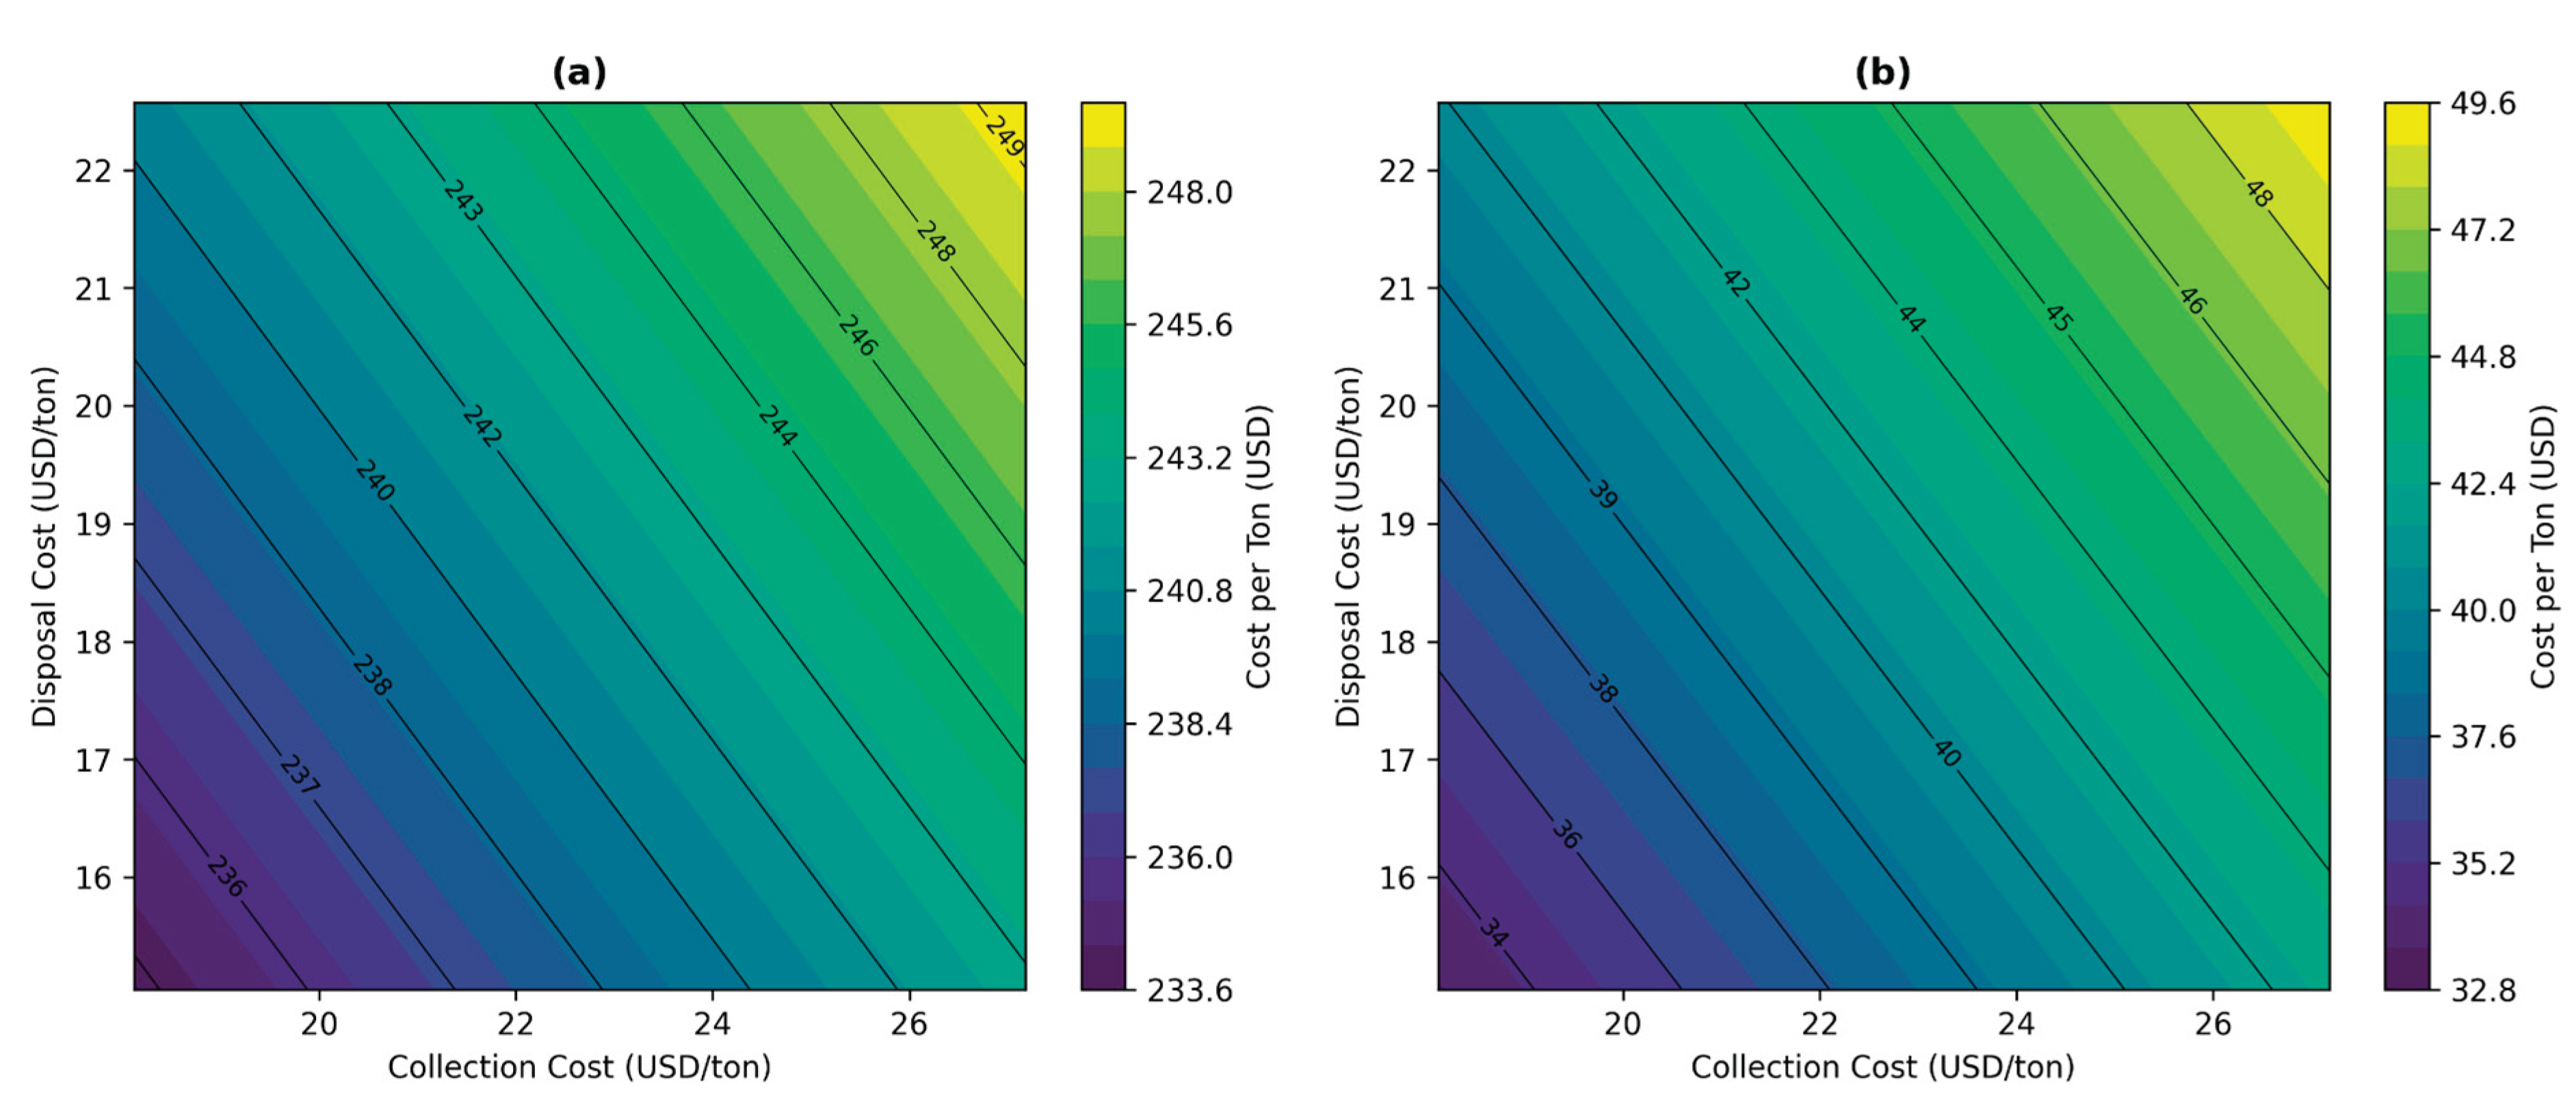

Table 1.
Global Recycling Rates and Contributing Factors.
| Region/Country | Recycling Rate (%) | Key Contributing Factors | References |
|---|---|---|---|
| European Union | 46% (2020) | Varies across member states; strong policies and infrastructure | (European Environment Agency, 2023) |
| Germany | 69.3% (2024) | Stringent waste separation, strong regulations | Landgeist, 2024 |
| United States | 21% (2024) | State-level variations, mixed public participation | Recycling Partnership, 2024 |
| Japan | 20% (2023) | Meticulous waste sorting, but lower recycling infrastructure | Klein, 2024 |
| Brazil | 4% (2024) | Driven by informal sector, lack of formal infrastructure | Gerden, 2024 |
| South Korea | 69% (2023) | Public involvement, advanced waste sorting systems | Seoul Metropolitan Government, 2023 |
| Sweden | 50% (2024) | High integration of Waste-to-Energy (WtE) technologies | Swedish Environmental Protection Agency, 2024 |
| Costa Rica | 9.6% | High landfill dependency, minimal recycling infrastructure | OECD, 2023 |
Table 2.
Government Initiatives and Goals.
| Initiative | Goal | Target Year | Reference |
|---|---|---|---|
| Environmental Health Route Policy | Increase recycling rate to 25% | 2033 | (DIGECA, 2025) |
| Environmental Health Route Policy | Ensure regular garbage collection in 34% of the territory | 2023 | (DIGECA, 2025) |
| Environmental Health Route Policy | Reduce per capita waste generation by 10% | 2025 | (DIGECA, 2025) |
| National Circular Economy Strategy | Promote circular economy practices | Ongoing | Gómez, 2023; Holland Circular Hotspot, 2021 |
| Law No. 9786 (Law to Combat Plastic Pollution and Protect the Environment) | Drastically reduce single-use plastic usage and promote sustainable alternatives | 2019 | Procuraduría de la República de Costa Rica, 2024 |
Table 3.
Waste Management Innovation Index.
| Country | Technological Advancements | Policy Innovation | Public Engagement | Infrastructure Development | Sustainability Impact | Overall Index Score | References |
|---|---|---|---|---|---|---|---|
| Germany | High | High | High | High | High | 9/10 | BMUV, 2023 |
| United States | High | High | High | High | Moderate | 9/10 | WIPO, 2024 |
| Japan | High | High | High | Moderate | Moderate | 8/10 | Klein, 2024 |
| Brazil | Low | Low | Low | Low | Low | 3/10 | Lino et al., 2023 |
| South Korea | High | High | High | High | High | 9/10 | Kwon et al., 2024 |
| Sweden | High | High | High | High | High | 9/10 | Sandhi & Rosenlund, 2024 |
| Costa Rica | Low | Moderate–High | Moderate | Low–Moderate | Low | 5/10 | OECD (2025) |
Disclaimer/Publisher’s Note: The statements, opinions and data contained in all publications are solely those of the individual author(s) and contributor(s) and not of MDPI and/or the editor(s). MDPI and/or the editor(s) disclaim responsibility for any injury to people or property resulting from any ideas, methods, instructions or products referred to in the content. |
© 2025 by the authors. Licensee MDPI, Basel, Switzerland. This article is an open access article distributed under the terms and conditions of the Creative Commons Attribution (CC BY) license (http://creativecommons.org/licenses/by/4.0/).
Copyright: This open access article is published under a Creative Commons CC BY 4.0 license, which permit the free download, distribution, and reuse, provided that the author and preprint are cited in any reuse.


