

Submitted:
04 August 2024
Posted:
05 August 2024
You are already at the latest version
Abstract
This study examines a new approach to hybdrid neuromorphic devices by studying the impact of omeprazole-proteinoid complexes on Izhikevich neurone models. We investigate the influence of these metabolic structures on five specific patterns of neuronal firing: accommodation, chattering, triggered spiking, phasic spiking, and tonic spiking. By combining omeprazole, a proton pump inhibitor, with proteinoids, we create a unique substrate that interfaces with neuromorphic models. The Izhikevich neurone model is used because it is computationally efficient and can accurately simulate various behaviours of cortical neurones. The results of our simulations show that omeprazole-proteinoid complexes have the ability to affect neuronal dynamics in different ways. This suggests that they could be used as adjustable components in bio-inspired computer systems. We have noticed a notable alteration in the frequency of spikes, patterns of bursts, and rates of adaptation, especially in chattering and triggered spiking behaviours. The findings indicate that omeprazole-proteinoid complexes have the potential to serve as adaptable elements in neuromorphic systems, presenting novel opportunities for information processing and computation that have origins in neurobiological principles. This study makes a valuable contribution to the expanding field of biochemical neuromorphic devices and establishes a basis for the development of hybrid bio-synthetic computational systems.
Keywords:
Neuromorphic computing
; omeprazole
; proteinoids
; Izhikevich neuron model
; bio-inspired computing
; neuromodulation
; pharmacological computing
; adaptive systems
; neuron firing patterns
1. Introduction
Unconventional computing is a field that investigates different ways of processing information and performing computations, going beyond the use of classic silicon-based technologies [1]. Bio-inspired computing systems have attracted considerable attention in this field because of their promise for energy economy, versatility, and parallel processing capabilities [2]. Recent progress in the field has resulted in the examination of several biological and chemical materials for use in computation. These include DNA-based computing [3], reaction-diffusion systems [4], and neuromorphic computing [5]. The latter, which draws inspiration from the form and function of biological neural networks, has demonstrated significant potential in tasks such as pattern recognition and adaptive learning [6]. Our research specifically examines the relationship between omeprazole-proteinoid complexes and Izhikevich neurone models. Omeprazole, a widely used proton pump inhibitor for gastric disorders [7], is combined with proteinoids, which are thermal proteins capable of forming microspheres and have been extensively explored in the field of artificial cells [8]. The Izhikevich neurone model, known for its computational efficacy and capacity to replicate a diverse array of neuronal firing patterns [9], serves as our framework for exploring the computational characteristics of these biochemical complexes. We analyse five specific neuronal behaviours: accommodation, chattering, triggered spiking, phasic spiking, and tonic spiking. These behaviours indicate diverse ways in which biological neural networks do computations [10]. Our objective is to discover new methods for information processing and computing by studying the effects of omeprazole-proteinoid complexes on neuronal dynamics. This technique connects the fields of pharmacology, proteinoid chemistry, and neuromorphic computing, potentially creating opportunities for the advancement of adaptive, bio-inspired computational systems [11,12,13]. Our research adds to the expanding field of neuromorphic substrates and could impact the development of future hybrid bio-synthetic computational architectures. Moreover, it offers valuable information about the possible neuromodulatory impacts of pharmacological drugs when paired with proteinoids, which could have significant implications for the fields of computing and neuropharmacology. To fully understand the spiking behaviour and signal processing abilities of the omeprazole-proteinoid complex, it is essential to have a solid foundation of the molecular structures of the proteinoid (L-Glu:L-Asp:L-Phe) and omeprazole. Figure 1 depicts these structures and their possible interactions. The amino acid composition of the proteinoid offers a range of functional groups that can engage in hydrogen bonding and other non-covalent interactions with omeprazole. These interactions are highly likely to have a crucial impact on the voltage-sensitive conformational changes and charge redistribution pathways that are described in our mechanistic model (Figure 10). The precise configuration of atoms and chemical bonds in omeprazole, specifically its sulfoxide group and benzimidazole ring, could potentially impact the electrical characteristics of the proteinoid. This influence may arise from the modulation of local pH gradients or the modification of conductive pathways within the complex.
The Izhikevich neuron model is described by a system of two differential equations:
with the auxiliary after-spike resetting:
Here, v represents the membrane potential of the neuron, u is a recovery variable, and I is the input current. The parameters a, b, c, and d are dimensionless parameters that can be adjusted to produce various types of neuronal behavior:
- a: the time scale of the recovery variable u
- b: the sensitivity of the recovery variable u to the subthreshold fluctuations of the membrane potential v
- c: the after-spike reset value of the membrane potential v
- d: after-spike reset of the recovery variable u
Figure 2 illustrates the conceptual framework of our unconventional computing approach, showing how omeprazole-proteinoid complexes interact with the Izhikevich neuron model to potentially modulate various neuronal behaviours.
Proton pump inhibitors (PPIs) are a type of drug that decreases the production of acid in the gut by permanently blocking the hydrogen/potassium adenosine triphosphatase enzyme system in the cells of the stomach lining [15]. Omeprazole, the subject of this investigation, is among a number of Proton Pump Inhibitors (PPIs) presently being used in clinical practice. Table 1 displays a comparison of omeprazole and other prevalent PPIs, emphasising their chemical formulae, half-lives, and pKa values. Although these medications have a similar way of working, they have slight variations in their pharmacokinetic and pharmacodynamic characteristics [16,17,18,19]. We selected omeprazole for this work due to its extensive usage and well-established characteristics, which make it an excellent candidate for investigating potential neuromodulatory effects in conjunction with proteinoid structures.
2. Materials and Methods
2.1. Synthesis of Omeprazole-Proteinoid Complex
The omeprazole-proteinoid complex was created by combining separately prepared solutions of omeprazole and proteinoid. Three distinct omeprazole solutions were formulated by dissolving varying quantities of omeprazole (7.2 mg, 8.3 mg, and 13 mg) in 5 ml of dimethyl sulfoxide (DMSO) sourced from Sigma Aldrich (CAS: 67-68-5, EC: 200-664-3, MW: 78.13 g/mol). Omeprazole (Merck, CAS: 73590-58-6, MW: 345.42 g/mol) was precisely weighed using an analytical balance and transferred to clean and dry beakers. These mixtures were then agitated with a magnetic stirrer at room temperature until complete dissolution of the omeprazole was achieved. During the course of the study, a 5 ml proteinoid solution comprising L-Glutamic Acid (L-Glu), L-Phenylalanine (L-Phe) and L-Aspartic Acid (L-Asp) was prepared in a separate beaker, ensuring thorough dissolution in the aqueous medium. The DMSO-based omeprazole solutions were then gradually introduced into the aqueous proteinoid solution. The resulting mixtures were gently stirred using a magnetic stirrer for 5-10 minutes to ensure complete and uniform blending of the omeprazole-proteinoid complexes. Following this process, the synthesized omeprazole-proteinoid complexes were ready for subsequent characterization and analysis.
2.2. Electrochemical Analysis of the Proteinoid-Omeprazole Complex
The experimental setup to assess the electrochemical properties of the proteinoid-omeprazole complex is shown in Figure 3. This arrangement employs two needle electrodes constructed from platinum and iridium-coated stainless steel wires (Spes Medica S.r.l., Italy). These electrodes are immersed in the proteinoid-omeprazole solution, maintained at a fixed distance of 10 mm apart. To capture voltage responses with high precision, the electrodes are connected to a 24-bit ADC data recorder (Pico Technology), enabling the detection of minute voltage fluctuations in the microvolt range. The sample solution is contained within a vessel placed on a temperature-controlled heating block, allowing for precise thermal regulation throughout the experiment. The heating block is synchronized with the data logger to enable simultaneous recording of thermal and electrical characteristics. Electrical stimuli mimicking Izhikevich neurons are applied to the proteinoid-omeprazole solution via the electrodes using a BK Precision 4053 MHz dual channel waveform generator (Figure 3). Data acquisition is accomplished through a combination of instruments: a Rigol oscilloscope (2 Channel 100 MHz–1GSa/s), PicoLog ADC–24, and Picoscope. Additionally, a Keithley 2450 Sourcemeter is utilized for electrical measurements. This comprehensive setup facilitates visualization and analysis of voltage responses within the proteinoid-omeprazole system. It provides crucial insights into the electrochemical behaviour and potential alterations of this novel complex under various experimental conditions.
3. Results
3.1. Accommodation Spiking Modulation by Omeprazole-Proteinoid Complex
The interaction between the Izhikevich neuron model exhibiting accommodation spiking and the omeprazole-proteinoid complex reveals significant modulation of neuronal behaviour, as illustrated in Figure 4 and quantified in Table 2. The input Izhikevich neuron signal demonstrates a wide voltage range (Figure 4A, blue):
In contrast, the omeprazole-proteinoid output exhibits marked attenuation (Figure 4A, red):
This attenuation is further quantified by the difference in mean potentials:
The standard deviation reduction from 15.30 mV to 0.43 mV indicates a significant smoothing effect of the omeprazole-proteinoid complex on the signal variability. Despite this attenuation, a moderate positive correlation persists between input and output:
The cross-correlation analysis (Figure 4C) reveals a time lag of msec, suggesting that the output precedes the input:
where f represents the complex transfer function of the omeprazole-proteinoid system. The root mean square error (RMSE) quantifies the overall difference between input and output:
The maximum instantaneous difference occurs at msec:
The Q-Q plot (Figure 4D) and Kolmogorov-Smirnov test results (Table 2) confirm that the input and output distributions are significantly different (p < 0.0001, KS statistic = 0.9709). This implies that the omeprazole-proteinoid complex is transforming the signal in an irregular way.
The findings suggest that the omeprazole-proteinoid complex functions as a sophisticated filter on the accommodation spiking pattern of the Izhikevich neurone. The moderate positive correlation shows that it greatly reduces the signal amplitude while maintaining some temporal properties. This observed temporal lag points to possible anticipatory behaviour in the system and may have consequences for information processing in neural networks that use such complexes. The notable variations in signal properties suggest that the omeprazole-proteinoid interaction has a significant neuromodulatory impact on accommodation spiking patterns. This modulation may change how a neurone responds to long-term inputs, which could have an impact on synaptic plasticity and sensory adaptation. It is necessary to conduct more research into the mechanisms underlying this modulation and the functional effects it has on brain networks [21].
3.1.1. Proposed Mechanism of Omeprazole-Proteinoid Modulation
We suggest a mechanism by which the omeprazole-proteinoid complex regulates the Izhikevich neurones’ accommodation spiking based on our observations. This process includes the complex interacting with ion channels and altering the characteristics of the membrane. The Izhikevich neuron model is described by the following equations [9]:
with the auxiliary after-spike resetting:
We propose the following mechanisms by which the omeprazole-proteinoid mixture alters these dynamics:
- Membrane Capacitance Modification: The complex may alter the effective membrane capacitance, , leading to a rescaling of the voltage dynamics [22]:where is the conductance introduced by the omeprazole-proteinoid complex, and is its associated reversal potential.
- Ion Channel Modulation: Omeprazole, known for its proton pump inhibition [15], may interact with voltage-gated ion channels. We propose a modification to the recovery variable dynamics:where represents the rate of recovery variable attenuation due to the complex.
- Threshold Modification: The complex may alter the spiking threshold, affecting the after-spike resetting mechanism:where , , and are threshold and reset modifications induced by the complex.
These modifications account for the observed attenuation and time lag. The improved recovery dynamics and the extra conductance lead to the lower amplitude. The changed threshold and reset mechanisms could be the cause of the temporal lag, which could cause the spiking behaviour to shift in phase. We suggest the following transfer function in the frequency domain to measure the filtering effect:
where is the time constant introduced by the complex, is the gain factor, and is the membrane time constant. Studies on the impact of proteinoids on membrane characteristics [23] and drug-induced modulation of neuronal activity [24] are consistent with this mechanism. Our results (Figure 4D) show a non-linear transformation that may be explained by the interaction between the additional conductance and the quadratic term in Equation (14). To confirm this suggested mechanism, additional experimental validation would be required, such as patch-clamp investigations of neurones exposed to the omeprazole-proteinoid combination. Further insights into the complex’s impacts on larger neural networks and the implications for information processing in neural systems [25] exposed to this compound may also come from computer modelling including these modifications.
3.2. Izhikevich Model Simulations of Chattering Behaviour in Omeprazole Proteinoid Systems
The chattering spiking stimulation of the omeprazole-proteinoid sample revealed significant differences between the input signal and the sample’s output response, as shown in Figure 5 and Table 3. The input signal exhibited a mean potential of mV with a standard deviation of mV, ranging from a minimum of mV to a maximum of 72.50 mV. In contrast, the omeprazole-proteinoid output displayed markedly different characteristics, with a mean potential of mV and a standard deviation of mV. The output signal ranged from mV to 4.24 mV, indicating a substantial attenuation and transformation of the input signal. Despite these differences, a moderate positive correlation was observed between the input and output signals, with a correlation coefficient of . This suggests that while the omeprazole-proteinoid sample significantly modifies the input signal, it still preserves some of the underlying temporal patterns. The root mean square error (RMSE) between the input and output signals was calculated as:
where represents the input signal values and represents the output signal values. The maximum difference between input and output signals was 75.71 mV, occurring at ms, further highlighting the significant signal transformation by the omeprazole-proteinoid sample. Lag analysis revealed a time difference of ms between the input and output signals, indicating a substantial phase shift in the response of the omeprazole-proteinoid sample. To assess the statistical similarity between the input and output signal distributions, a Kolmogorov-Smirnov test was performed. The test yielded a test statistic of with a p-value < 0.0001, resulting in the rejection of the null hypothesis. This confirms that the input and output signals follow significantly different distributions, as visually represented in the Q-Q plot in Figure 5d. The Kolmogorov-Smirnov test statistic is defined as:
where and are the cumulative distribution functions of the input and output signals, respectively. These results collectively demonstrate that the omeprazole-proteinoid sample exhibits complex signal processing characteristics under chattering spiking stimulation, significantly altering the amplitude, distribution, and temporal properties of the input signal while maintaining a moderate correlation with the input patterns.
3.3. Induced-Mode Spiking in Omeprazole-Proteinoid Samples: Characterization and Analysis
The induced-mode spiking behaviour of omeprazole-proteinoid samples was characterized by a comparative analysis of input and output signals, as illustrated in Figure 6 and summarized in Table 4. The input signal, modeled after the Izhikevich neuron dynamics, exhibited a mean potential of mV with a standard deviation of 14.20 mV (Figure 6a, Table 4). This input ranged from mV to 72.21 mV, simulating the typical membrane potential fluctuations of a neuron. In contrast, the omeprazole-proteinoid output displayed markedly different characteristics, with a mean potential of 0.34 mV and a standard deviation of 0.40 mV, ranging from mV to 3.14 mV (Figure 6b, Table 4). The substantial difference in signal properties suggests a complex signal processing mechanism within the omeprazole-proteinoid sample. The reduced amplitude and narrower range of the output signal indicate significant attenuation and compression of the input signal. This behavior could be attributed to the molecular structure and interactions within the proteinoid, which could potentially involve voltage-sensitive ion channels or charge transfer mechanisms that modulate the response to electrical stimuli. Despite the apparent differences, a moderate positive correlation (r = 0.6644) was observed between the input and output signals (Table 4). This correlation suggests that, while the omeprazole-proteinoid sample significantly transforms the input signal, it still preserves some of the underlying temporal patterns. The preservation of temporal patterns, although with modifications, indicates that the proteinoid structure may possess memory-like properties or frequency-dependent response characteristics. The root mean square error (RMSE) of 62.8671 mV and the maximum difference of 71.91 mV at 2.00 ms (Table 4) further quantify the extent of signal transformation. These metrics highlight the substantial modification of the input signal by the omeprazole-proteinoid sample, potentially due to complex interactions between the proteinoid molecules and the applied electrical field. Interestingly, the cross-correlation analysis revealed a time lag of 1590 msec between the input and output signals (Figure 6c, Table 4). This significant delay suggests the presence of slow, possibly biochemical or conformational changes within the proteinoid structure in response to electrical stimulation. Such a delay could be indicative of cascading molecular events or the gradual buildup of charge within the proteinoid matrix before a response is generated. The results of the Kolmogorov-Smirnov test (KS statistic = 0.9844, p < 0.0001) confirm that the input and output signals follow significantly different distributions (Figure 6d, Table 4). This statistical difference underscores the non-linear nature of the signal processing occurring within the omeprazole-proteinoid sample. The transformation of the signal distribution suggests that the proteinoid may act as a complex filter, potentially enhancing certain frequency components while suppressing others.
3.4. Phasic Spiking Dynamics in Proteinoid-Omeprazole Complexes: Characterization of Stimulus-Response Patterns
The phasic spiking dynamics of proteinoid-omeprazole complexes were analyzed and compared to previously observed spiking modes. Figure 7 and Table 5 summarize the key findings of this analysis. The input signal for phasic spiking exhibited a mean potential of mV with a standard deviation of 8.23 mV (Figure 7a, Table 5). This input range ( mV to 62.46 mV) was narrower compared to the induced-mode spiking, suggesting a more focused stimulation pattern. The proteinoid-omeprazole output showed a mean potential of 0.54 mV and a standard deviation of 0.33 mV, ranging from mV to 3.17 mV (Figure 7b, Table 5). Notably, the correlation coefficient between input and output signals (0.4503) was lower than in the induced-mode spiking (0.6644), indicating a weaker linear relationship in the phasic mode. This suggests that the proteinoid-omeprazole complex exhibits more complex, possibly non-linear, response characteristics under phasic stimulation. In induced mode, the RMSE was 62.8671 mV, whereas in phasic spiking it was 55.9366 mV, indicating a slightly closer overall match between the input and output signals. However, the maximum difference (67.00 mV at 2.00 ms) remained substantial, indicating significant signal transformation. A key distinction in the phasic spiking mode was the time lag of msec between input and output signals (Figure 7c, Table 5). This negative lag contrasts with the positive lag observed in induced-mode spiking, suggesting that the proteinoid-omeprazole complex exhibits anticipatory behaviour under phasic stimulation. This anticipatory response could be indicative of rapid, possibly preemptive, molecular rearrangements within the complex in response to phasic input patterns. The Kolmogorov-Smirnov test results (KS statistic = 0.9945, p < 0.0001) confirmed significantly different distributions between input and output signals (Figure 7d, Table 5). The higher KS statistic in the phasic mode compared to the induced mode (0.9844) suggests an even more pronounced transformation of the signal distribution. The phasic spiking mode demonstrates distinct characteristics compared to previously observed spiking patterns. The narrower input range, lower correlation coefficient, and negative time lag all point to a unique processing mechanism activated by phasic stimulation. These findings suggest that the proteinoid-omeprazole complex may possess multiple operational modes, each triggered by different stimulation patterns. The observed anticipatory behaviour in phasic mode is particularly intriguing, as it implies a predictive capacity within the molecular structure of the complex. This could be attributed to rapid conformational changes or charge redistribution processes that are specifically sensitive to phasic input patterns.
3.5. Tonic Spiking Behaviour in Omeprazole-Proteinoid Complexes: Sustained Response Characteristics and Signal Processing
The tonic spiking behaviour of omeprazole-proteinoid complexes reveals distinct characteristics compared to previously observed spiking modes, as illustrated in Figure 8 and summarized in Table 6. The input signal for tonic spiking exhibited a mean potential of mV with a standard deviation of 20.55 mV (Figure 8a, Table 6). This input range ( mV to 62.17 mV) was wider than that observed in phasic spiking but narrower than in induced-mode spiking, suggesting an intermediate level of stimulation variability. In particular, the omeprazole proteinoid output under tonic stimulation showed a higher mean potential (0.80 mV) compared to the phasic (0.54 mV) and induced (0.34 mV) modes. This elevated mean output suggests a more sustained and robust response characteristic of tonic spiking. The correlation coefficient between input and output signals (0.6823) was higher than in phasic mode (0.4503) and comparable to induced mode (0.6644). This indicates that tonic spiking maintains a stronger linear relationship between input and output, possibly due to the sustained nature of the stimulation. The root mean square error (RMSE) of 43.2821 mV for tonic spiking was lower than both phasic (55.9366 mV) and induced (62.8671 mV) modes, suggesting a closer overall match between input and output signals in the tonic mode. This could be attributed to the more consistent and sustained nature of tonic stimulation. A distinctive feature of tonic spiking was the time lag of msec between input and output signals (Figure 8c, Table 6). This substantial negative lag, larger in magnitude than in phasic mode ( msec), suggests an even more pronounced anticipatory behaviour. This could indicate that under sustained tonic stimulation, the omeprazole-proteinoid complex develops a stronger predictive response mechanism. The Kolmogorov-Smirnov test results (KS statistic = 0.9276, p < 0.0001) confirmed significantly different distributions between input and output signals (Figure 8d, Table 6). Interestingly, the KS statistic for tonic mode was lower than both phasic (0.9945) and induced (0.9844) modes, suggesting that while still significantly different, the output distribution in tonic mode may be slightly closer to the input distribution. Finally, in contrast to induced and phasic spiking, the tonic spiking mode exhibits its own set of distinctive features. Increased mean output, improved correlation, decreased root-mean-square error, and noticeable anticipatory behaviour are all indicators that continuous tonic stimulation activates a separate processing system. According to these results, omeprazole-proteinoid complexes can change their signal processing properties according on the input stimulus, and tonic spiking could be the best way for them to encode and transmit data consistently and for long periods of time.
Figure 9 provides a visual comparison of the spiking patterns across all five modes studied. The distinct temporal and intensity patterns observed in each mode further underscore the complex, mode-dependent signal processing capabilities of the omeprazole-proteinoid complexes. Of particular note is the clear differentiation between the sustained, high-frequency spiking in tonic mode (Figure 9e) and the clustered, burst-like activity in chattering mode (Figure 9b). These visualisations reinforce our quantitative findings and emphasise the capacity of these complexes to encode and process information using several modes at the molecular level.
4. Discussion
The detailed examination of omeprazole-proteinoid complexes using several spiking modes demonstrates a complex and adaptable signal processing system. The results of our study indicate that these complexes have unique responses to various input patterns, indicating the possibility of processing many types of information at the molecular level.
4.1. Comparative Analysis of Spiking Modes
We detected considerable signal attenuation and change in all spiking modes, including accommodation, chattering, induced, phasic, and tonic. Nevertheless, the extent and characteristics of this change differed significantly among different modes:
- Amplitude Modulation: All modes showed a significant decrease in signal amplitude, with output ranges constantly falling within a range of ±4 mV, whereas input ranges often exceeded ±60 mV. This implies the presence of a strong buffering mechanism that could protect molecular fluctuations downstream from extreme fluctuations in voltage.
- Temporal Dynamics: The temporal delay between the input and output signals exhibited significant variation across different modes, ranging from ms in the chattering mode to 1590 milliseconds in the induced mode. The negative lag found in accommodation ( ms), phasic ( ms), and tonic ( ms) modes is particularly remarkable. This suggests the presence of anticipatory behaviour, which could have important consequences for information processing and response preparation in biological systems.
- Signal Correlation: The correlation between the input and output signals varied from moderate (0.4503 in phasic mode) to strong (0.7937 in chattering mode). This suggests that the complexes effectively modify the input signal while retaining different levels of the original signal properties.
- Distribution Transformation: The Kolmogorov-Smirnov tests consistently revealed significant differences between the distributions of the input and output data in all modes. The KS statistics ranged from 0.9276 (tonic) to 0.9945 (phasic). This implies the use of non-linear processing techniques that have the potential to amplify specific signal characteristics while simultaneously reducing the prominence of others.
4.2. Implications for Molecular Computing
The behaviours shown by omeprazole-proteinoid complexes when subjected to various spiking regimes have significant implications for molecular computing and bio-inspired signal processing.
- Multi-modal Processing: The diverse reactions to various spiking patterns indicate that these complexes have the ability to function as versatile molecular processors, adjusting their behaviour according to input parameters.
- Non-linear Transformation: The persistent non-linear alteration of input signals, as indicated by the results of the KS test and Q-Q plots, suggests that these complexes perform complex signal processing procedures that go beyond mere filtering or amplification.
- Anticipatory Behaviour: The presence of negative time delays in several modes indicates the occurrence of predictive processing at the molecular level. These findings could have important consequences for the development of molecular systems that can anticipate events or for understanding biological reactions that occur before an event.
4.3. Potential Mechanisms and Future Directions
The observed behaviours are most likely a result of complex interactions among the omeprazole molecules, the proteinoid structure, and the electrical fluctuations that were applied. Possible mechanisms encompass voltage-dependent alterations in the proteinoid structure, emergence and disintegration of transient conductive pathways within the complex, accumulation and redistribution of charges with distinct time constants, and interactions between omeprazole’s inhibition of proton pumps and local pH gradients. Future research should prioritise conducting molecular dynamics simulations to uncover the underlying structural mechanisms of the observed behaviours. In addition, it should investigate the frequency-dependent responses of these complexes, explore potential applications in molecular-scale signal processing and computing, and examine how these properties can be adjusted or changed through chemical modifications. Our analysis concludes that omeprazole-proteinoid complexes possess diverse signal processing capacities that vary depending on the mode. These findings not only improve our understanding of molecular-scale information processing but also create new opportunities for the advancement of bio-inspired computing systems and smart drug delivery mechanisms.
The complex behaviours observed in various spiking modes are presumably the result of a combination of molecular-level mechanisms within the omeprazole-proteinoid complexes. Figure 10 depicts many suggested mechanisms that could potentially contribute to the observed signal processing capabilities. These factors include changes in the proteinoid structure that are sensitive to voltage (Fig. 10A), which could explain the different responses depending on the mode; the creation and breakdown of temporary pathways for conducting signals (Figure 10B), which may account for the non-linear transformation of the signal; processes of accumulating and redistributing charges (Figure 10C), which could explain the observed delays and anticipatory behaviours; and the interaction between omeprazole’s inhibition of proton pumps and local differences in pH (Figure 10D), which may contribute to the consistent normalisation of the signal across all modes. The interaction of these mechanisms could elucidate the diverse and flexible behaviour of the omeprazole-proteinoid system under different patterns of stimulation. Additional research into these processes at the molecular level will be essential for gaining a complete understanding and perhaps utilising these capabilities in molecular computing [28] and smart drug delivery systems [29].
The study of the proteinoid-omeprazole complex unveils a complex mechanism [30] for spike emergence, as depicted in Figure 11. The scanning electron microscope (SEM) image (Figure 11a) depicts a complex network structure that serves as the foundation for the observed electrical behaviour. Our hypothesis suggests that the process of spike formation consists of a sequence of stages, starting with the attachment of omeprazole molecules to the proteinoid network (Figure 11a). The occurrence of this binding event can be mathematically represented by the equation [15]:
where P represents the proteinoid binding site, O represents omeprazole, and PO is the bound complex. Omeprazole binding modifies the local distribution of electric charge inside the complex. This alteration can be represented as a disturbance to the nearby electric field:
where is the initial electric field and is the change induced by the omeprazole binding. The modified electric field stimulates the activation of ion channels [31] located near the binding site. The probability of an ion channel opening can be described by a Boltzmann distribution:
where z is the gating charge, V is the membrane potential, is the half-activation voltage, k is the Boltzmann constant, and T is the temperature.
The activation of these channels results in a fast movement of ions, which in turn generates a spike potential. The membrane potential during a spike can be represented using the Hodgkin-Huxley equations [22], which have been simplified in this context for the sake of simplicity.
where is the membrane capacitance, represents the sum of ionic currents, and is any external current.
The resulting spike potential over time is depicted in Figure 11c, showing the characteristic rapid rise and fall of the membrane potential.
The network structure of the proteinoid-omeprazole complex, as observed in the SEM image, plays a crucial role in facilitating the propagation of these spikes. The interconnected nature of the complex allows for the spread of the electrical signal, which can be modeled as a reaction-diffusion process [32]:
where D is the diffusion coefficient and represents the non-linear reaction terms that account for the spike generation and propagation dynamics.
This proposed process establishes a connection between the structural characteristics exhibited in the SEM image and the functional electrical properties of the proteinoid-omeprazole mixture. The observed spiking behaviour is a result of the interaction between omeprazole binding, ion channel kinetics, and the network topology of the complex. This suggests a new method for bio-inspired signal processing [33] and possible uses in neuromorphic computing [34].
5. Conclusions
This study has shown the complex and mode-specific signal processing capacities of omeprazole-proteinoid complexes in different spiking regimes. The results of our study demonstrate that these molecular assemblies possess exceptional flexibility in their response to various input patterns, such as accommodation, chattering, induced, phasic, and tonic spiking modes. The main findings include a notable decrease in signal strength, a non-linear shift in form, and time-dependent patterns that are specific to each mode, with certain modes exhibiting interesting predictive tendencies. The distinctive characteristics of these omeprazole-proteinoid systems indicate possible uses in molecular computing, bio-inspired signal processing, and intelligent drug delivery systems. The reported ability to process several modes of information and the strong ability to normalise signals could lead to new methods in processing information at the nanoscale and in developing sensor systems at the molecular level. Future study should prioritise investigating the fundamental foundations of these behaviours using molecular dynamics simulations and examining responses that are reliant on frequency. Furthermore, exploring the ways in which these features can be adjusted by chemical alterations could result in customised molecular computer components. Overall, this study not only enhances our understanding of molecular-level information processing but also connects the fields of pharmacology and computational neuroscience, creating opportunities for interdisciplinary research and technological advancements in the areas of bio-inspired computing and drug delivery systems.
Funding
The research was supported by EPSRC Grant EP/W010887/1 “Computing with proteinoids”.
Data Availability Statement
The data for the paper is available online and can be accessed at.
Acknowledgments
Authors are grateful to David Paton for helping with SEM imaging and to Neil Phillips for helping with instruments.
Conflicts of Interest
“The authors declare no conflicts of interest.”
References
- Adamatzky, A. Unconventional Computing: A Volume in the Encyclopedia of Complexity and Systems Science; Springer Publishing Company, Incorporated, 2018.
- Ziegler, M.; Mussenbrock, T.; Kohlstedt, H. Bio-inspired information pathways: From neuroscience to neurotronics; Springer Nature, 2024.
- Woods, D.; Doty, D.; Myhrvold, C.; Hui, J.; Zhou, F.; Yin, P.; Winfree, E. Diverse and robust molecular algorithms using reprogrammable DNA self-assembly. Nature 2019, 567, 366–372. [Google Scholar] [CrossRef]
- Adamatzky, A. A brief history of liquid computers. Philos. Trans. R. Soc. B 2019, 374, 20180372. [Google Scholar] [CrossRef]
- Schuman, C.D.; Potok, T.E.; Patton, R.M.; Birdwell, J.D.; Dean, M.E.; Rose, G.S.; Plank, J.S. A survey of neuromorphic computing and neural networks in hardware. arXiv preprint, arXiv:1705.06963 2017. [CrossRef]
- Indiveri, G.; Liu, S.C. Memory and information processing in neuromorphic systems. Proc. IEEE 2015, 103, 1379–1397. [Google Scholar] [CrossRef]
- Strand, D.S.; Kim, D.; Peura, D.A. 25 years of proton pump inhibitors: A comprehensive review. Gut Liver 2017, 11, 27. [Google Scholar] [CrossRef] [PubMed]
- Fox, S.W.; Harada, K. Thermal copolymerization of amino acids to a product resembling protein. Science 1958, 128, 1214–1214. [Google Scholar] [CrossRef]
- Izhikevich, E.M. Simple model of spiking neurons. IEEE Trans. Neural Networks 2003, 14, 1569–1572. [Google Scholar] [CrossRef]
- Izhikevich, E.M. Which model to use for cortical spiking neurons? IEEE Trans. Neural Networks 2004, 15, 1063–1070. [Google Scholar] [CrossRef]
- Kendon, V.; Sebald, A.; Stepney, S. Heterotic computing: Exploiting hybrid computational devices, 2015.
- Banzhaf, W.; Baumgaertner, B.; Beslon, G.; Doursat, R.; Foster, J.A.; McMullin, B.; De Melo, V.V.; Miconi, T.; Spector, L.; Stepney, S.; others. Defining and simulating open-ended novelty: Requirements, guidelines, and challenges. Theory Biosci. 2016, 135, 131–161. [Google Scholar] [CrossRef] [PubMed]
- Adamatzky, A. Advances in unconventional computing: Volume 1: Theory; Vol. 22, Springer, 2016.
- Pettersen, E.F.; Goddard, T.D.; Huang, C.C.; Couch, G.S.; Greenblatt, D.M.; Meng, E.C.; Ferrin, T.E. UCSF Chimera—a visualization system for exploratory research and analysis. J. Comput. Chem. 2004, 25, 1605–1612. [Google Scholar] [CrossRef]
- Shin, J.M.; Sachs, G. Pharmacology of proton pump inhibitors. Curr. Gastroenterol. Rep. 2008, 10, 528–534. [Google Scholar] [CrossRef]
- Andersson, T.; Röhss, K.; Bredberg, E.; Hassan-Alin, M. Pharmacokinetics and pharmacodynamics of esomeprazole, the S-isomer of omeprazole. Aliment. Pharmacol. Ther. 2001, 15, 1563–1569. [Google Scholar] [CrossRef] [PubMed]
- Langtry, H.D.; Wilde, M.I. Lansoprazole: An update of its pharmacological properties and clinical efficacy in the management of acid-related disorders. Drugs 1997, 54, 473–500. [Google Scholar] [CrossRef] [PubMed]
- Cheer, S.M.; Prakash, A.; Faulds, D.; Lamb, H.M. Pantoprazole: An update of its pharmacological properties and therapeutic use in the management of acid-related disorders. Drugs 2003, 63, 101–132. [Google Scholar] [CrossRef] [PubMed]
- Prakash, A.; Faulds, D. Rabeprazole. Drugs 1998, 55, 261–267. [Google Scholar] [CrossRef]
- Wu, F.; Gaohua, L.; Zhao, P.; Jamei, M.; Huang, S.M.; Bashaw, E.D.; Lee, S.C. Predicting Nonlinear Pharmacokinetics of Omeprazole Enantiomers and Racemic Drug Using.
- Pessoa, L. Understanding brain networks and brain organization. Phys. Life Rev. 2014, 11, 400–435. [Google Scholar] [CrossRef] [PubMed]
- Hodgkin, A.L.; Huxley, A.F. A quantitative description of membrane current and its application to conduction and excitation in nerve. J. Physiol. 1952, 117, 500. [Google Scholar] [CrossRef] [PubMed]
- Mougkogiannis, P.; Adamatzky, A. Proto-Neurons from Abiotic Polypeptides. Encyclopedia 2024, 4, 512–543. [Google Scholar] [CrossRef]
- Poolos, N.P.; Migliore, M.; Johnston, D. Pharmacological upregulation of h-channels reduces the excitability of pyramidal neuron dendrites. Nat. Neurosci. 2002, 5, 767–774. [Google Scholar] [CrossRef]
- Coolen, A.C.; Kühn, R.; Sollich, P. Theory of neural information processing systems; OUP Oxford, 2005.
- Göpel, W. Chemical sensing, molecular electronics and nanotechnology: Interface technologies down to the molecular scale. Sensors Actuators B: Chem. 1991, 4, 7–21. [Google Scholar] [CrossRef]
- Van Drongelen, W. Signal processing for neuroscientists; Academic press, 2018.
- Stojanovic, M.N.; Stefanovic, D.; Rudchenko, S. Exercises in molecular computing. Accounts Chem. Res. 2014, 47, 1845–1852. [Google Scholar] [CrossRef] [PubMed]
- Alvarez-Lorenzo, C.; Concheiro, A. Smart drug delivery systems: From fundamentals to the clinic. Chem. Commun. 2014, 50, 7743–7765. [Google Scholar] [CrossRef] [PubMed]
- Stellbrink, J.; Willner, L.; Jucknischke, O.; Richter, D.; Lindner, P.; Fetters, L.J.; Huang, J.S. Self-assembling behavior of living polymers. Macromolecules 1998, 31, 4189–4197. [Google Scholar] [CrossRef]
- Hille, B. Ionic channels in excitable membranes. Current problems and biophysical approaches. Biophys. J. 1978, 22, 283–294. [Google Scholar] [CrossRef] [PubMed]
- Murray, J.D.; Murray, J.D. Mathematical biology: II: Spatial models and biomedical applications; Vol. 18, Springer, 2003.
- Itzhaki, E.; Elias, Y.; Moskovits, N.; Stemmer, S.M.; Margel, S. Proteinoid polymers and nanocapsules for cancer diagnostics, therapy and theranostics: In vitro and in vivo studies. J. Funct. Biomater. 2023, 14, 215. [Google Scholar] [CrossRef]
- Indiveri, G.; Linares-Barranco, B.; Hamilton, T.J.; Schaik, A.v.; Etienne-Cummings, R.; Delbruck, T.; Liu, S.C.; Dudek, P.; Häfliger, P.; Renaud, S.; others. Neuromorphic silicon neuron circuits. Front. Neurosci. 2011, 5, 73. [Google Scholar] [CrossRef]
Figure 1.
Molecular structures of the proteinoid and omeprazole. Left: The proteinoid composed of L-Glutamic acid (L-Glu), L-Aspartic acid (L-Asp), and L-Phenylalanine (L-Phe). Right: The omeprazole molecule. Atoms are color-coded: blue (nitrogen), red (oxygen), brown (carbon), yellow (sulfur), and white (hydrogen). Potential hydrogen bonding is highlighted, illustrating the possible interactions between the proteinoid and omeprazole. These molecular structures and their interactions are key to understanding the complex signal processing behaviour observed in the omeprazole-proteinoid system. (Visualization created using UCSF Chimera [14].)
Figure 1.
Molecular structures of the proteinoid and omeprazole. Left: The proteinoid composed of L-Glutamic acid (L-Glu), L-Aspartic acid (L-Asp), and L-Phenylalanine (L-Phe). Right: The omeprazole molecule. Atoms are color-coded: blue (nitrogen), red (oxygen), brown (carbon), yellow (sulfur), and white (hydrogen). Potential hydrogen bonding is highlighted, illustrating the possible interactions between the proteinoid and omeprazole. These molecular structures and their interactions are key to understanding the complex signal processing behaviour observed in the omeprazole-proteinoid system. (Visualization created using UCSF Chimera [14].)
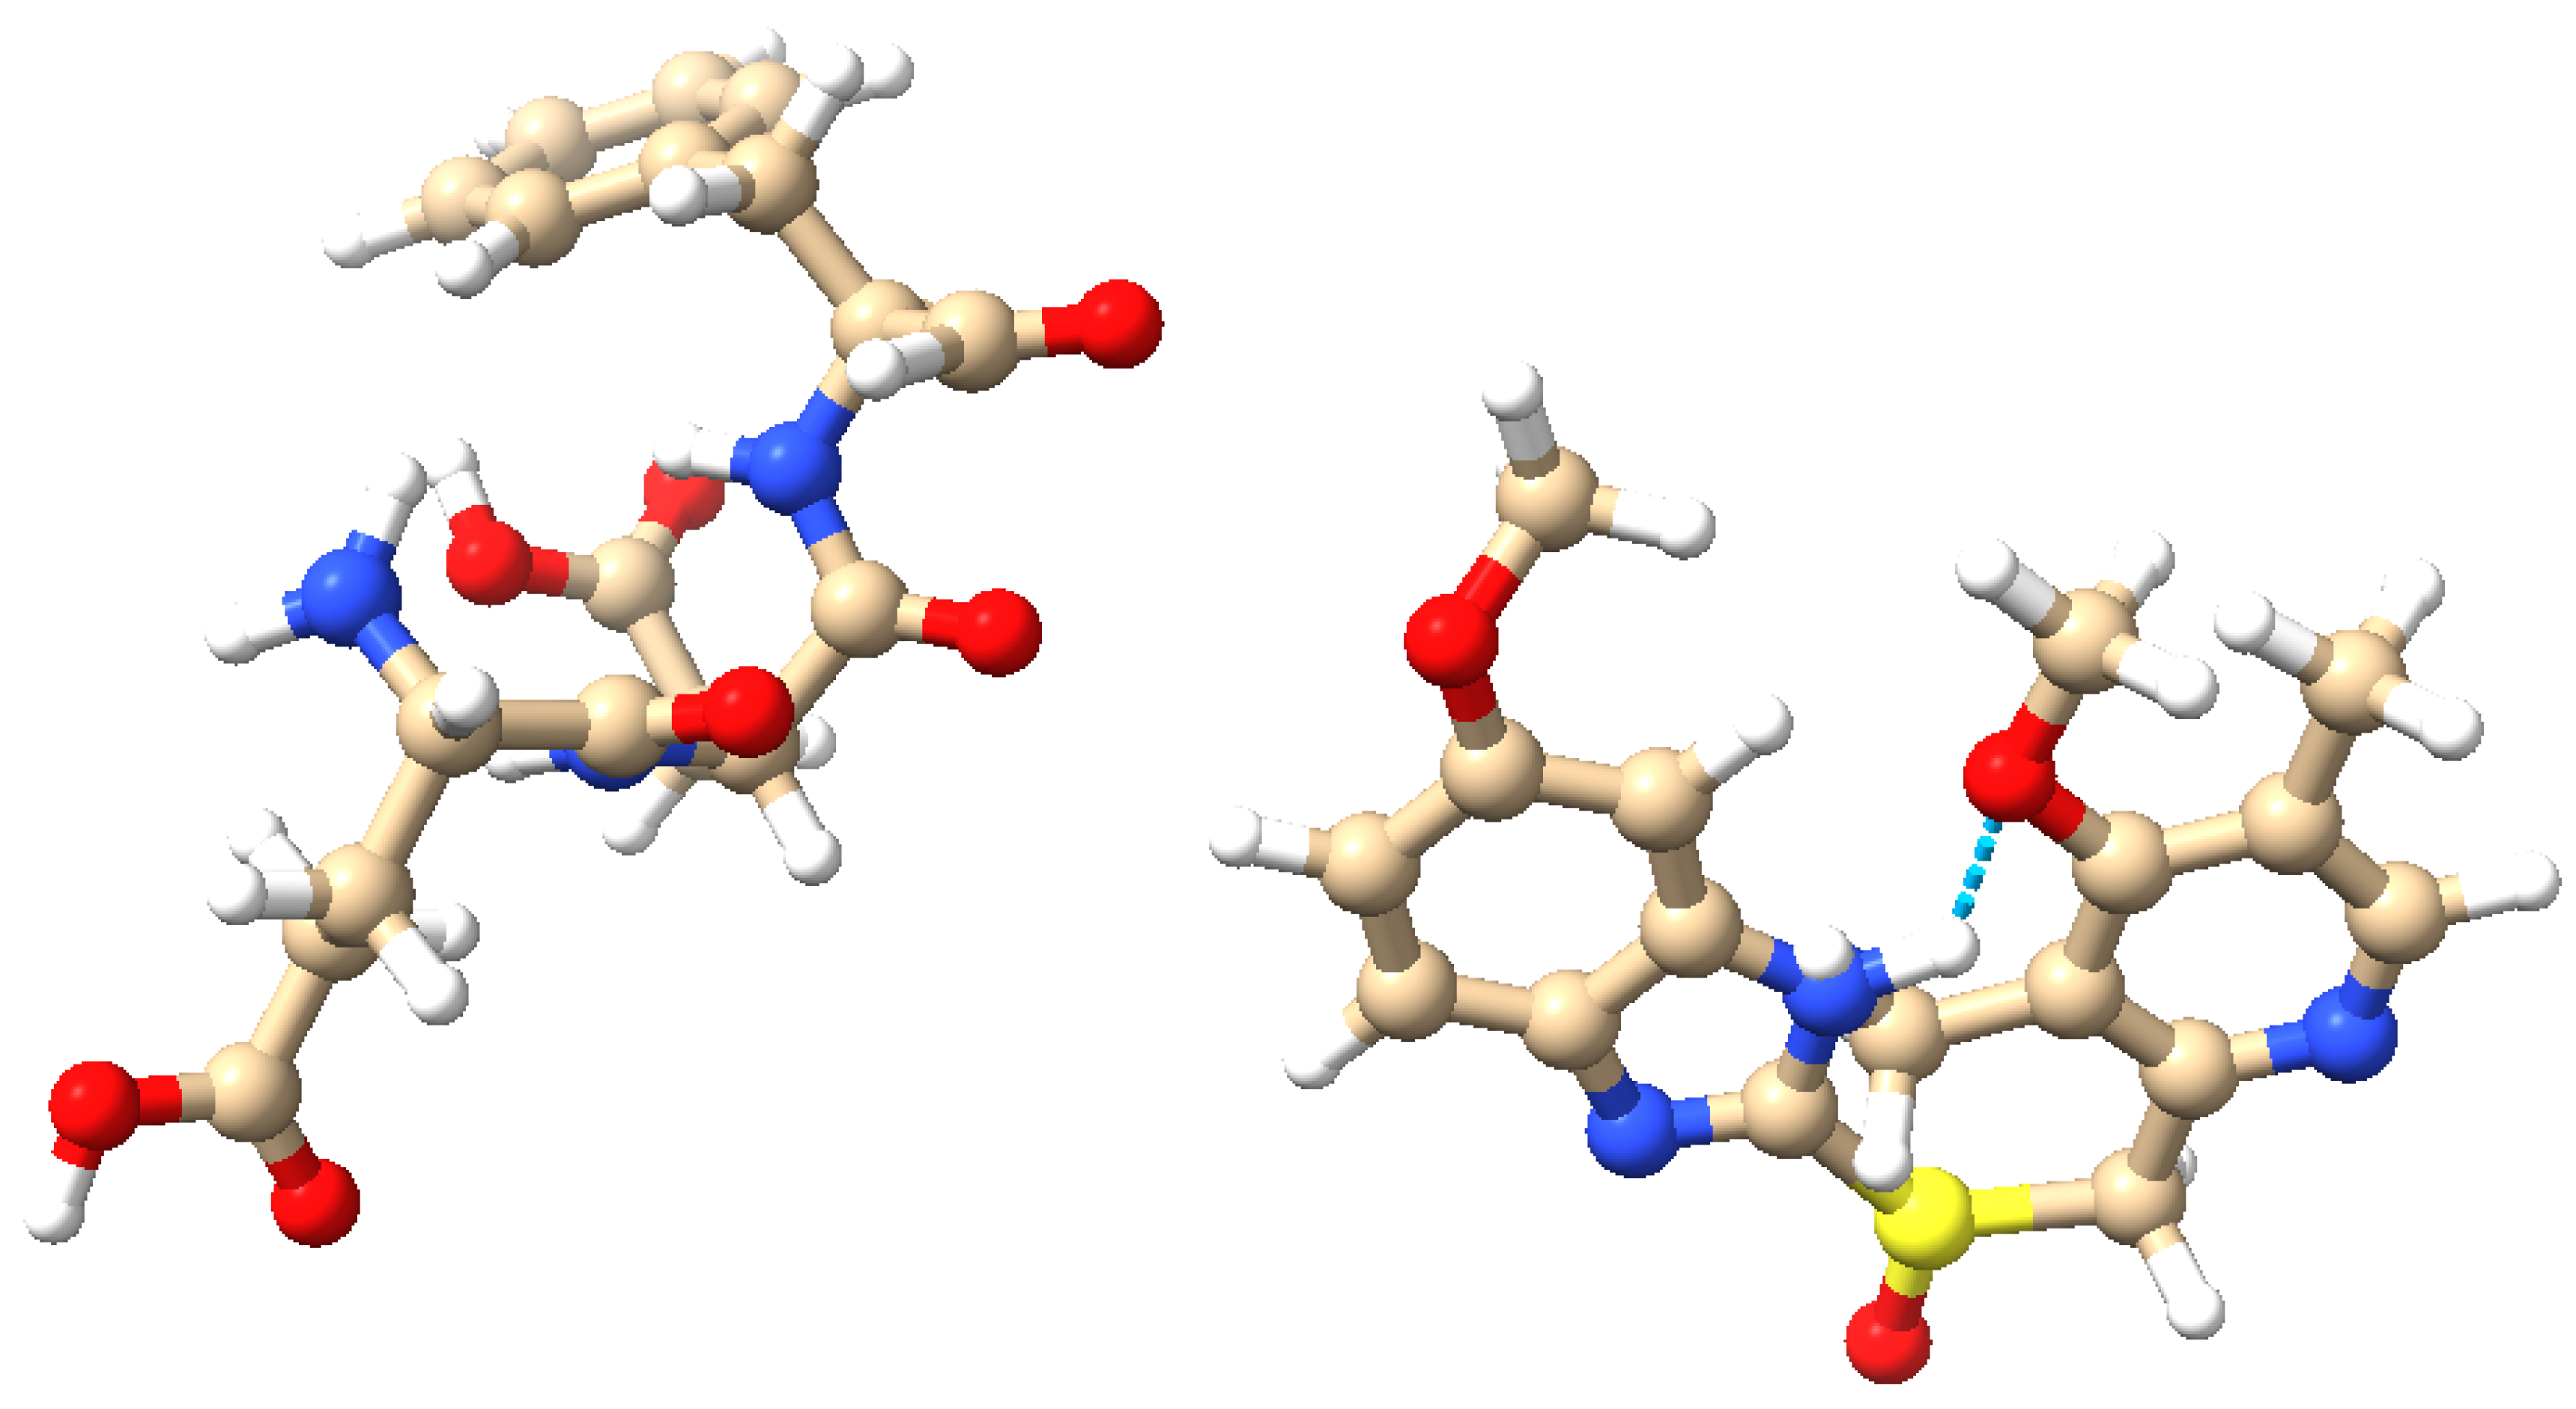
Figure 2.
A conceptual diagram illustrating the unconventional computing strategy involving omeprazole-proteinoid complexes and Izhikevich neurone models. The graphic depicts the combination of chemical components (shown by ellipses) with computational components (represented by rectangles) to regulate different neural behaviours.
Figure 2.
A conceptual diagram illustrating the unconventional computing strategy involving omeprazole-proteinoid complexes and Izhikevich neurone models. The graphic depicts the combination of chemical components (shown by ellipses) with computational components (represented by rectangles) to regulate different neural behaviours.
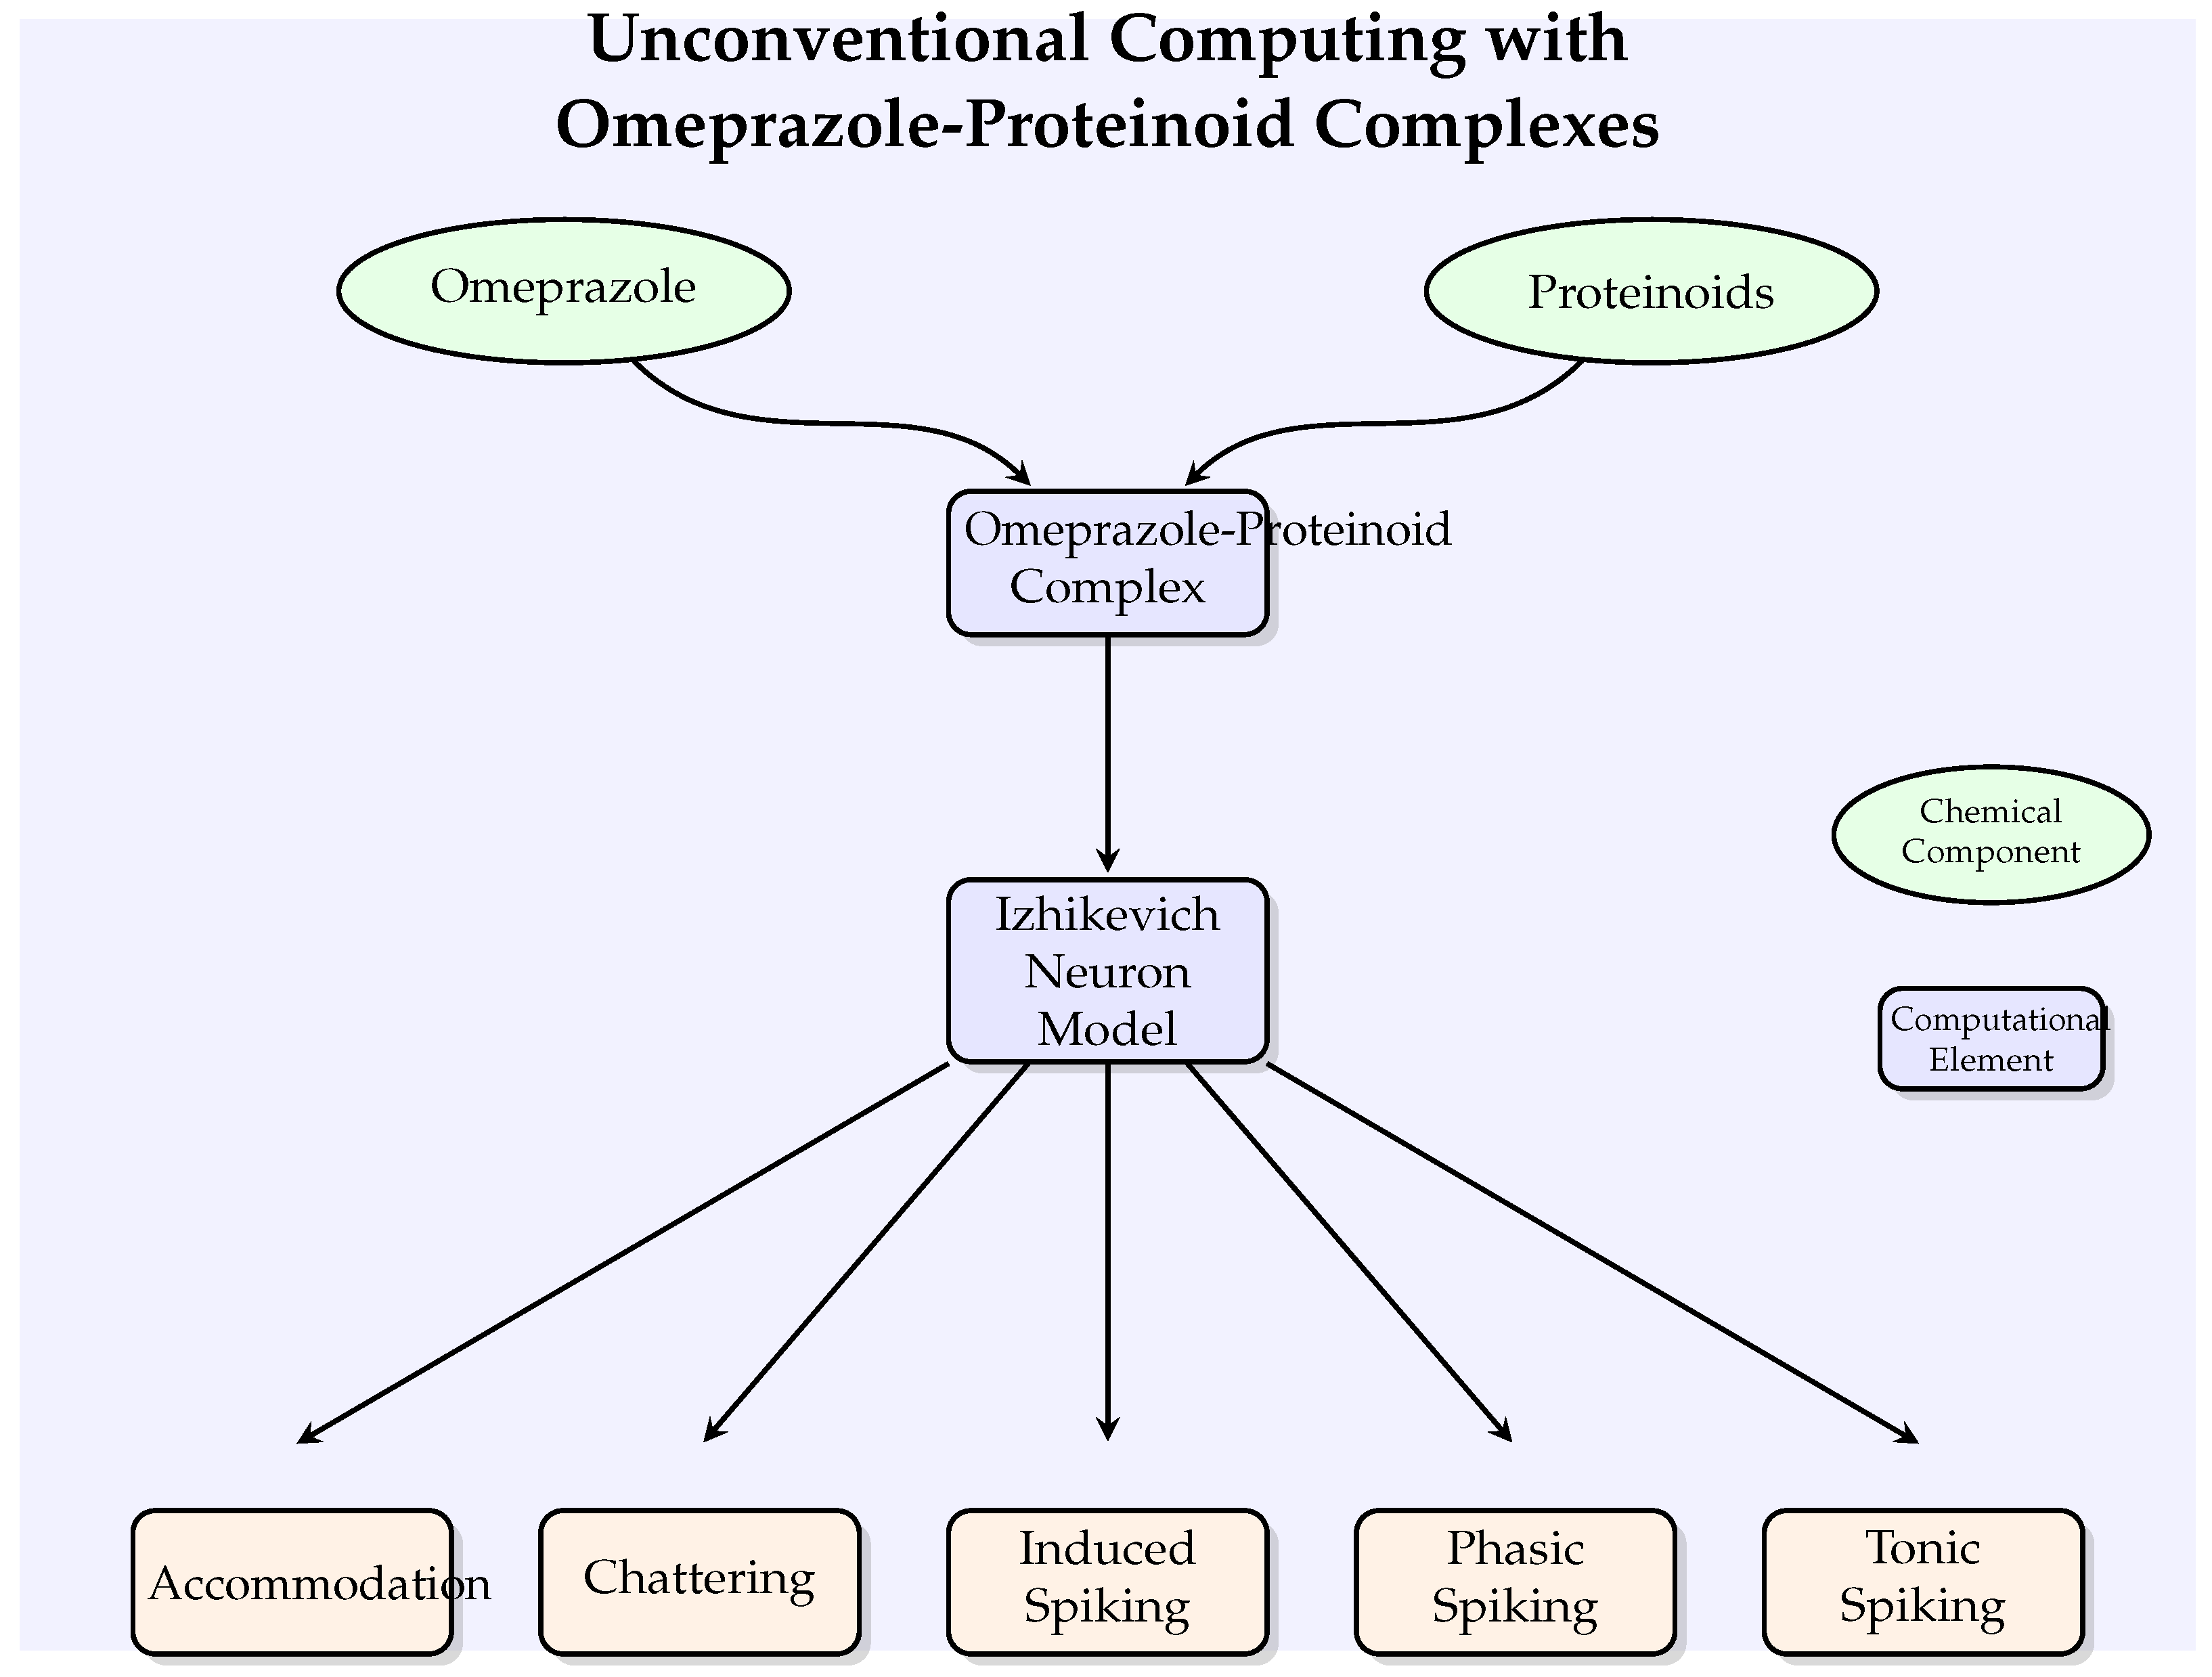
Figure 3.
Diagram illustrating the setup used for electrochemical characterisation of the proteinoid-omeprazole complex. The proteinoid-omeprazole solution is stored within the central container, which is equipped with two needle electrodes coated with platinum (Pt) and iridium (Ir) respectively. These electrodes are positioned 10 mm apart. A high-precision 24-bit ADC data recorder captures voltage responses, while a heating block regulates temperature. A waveform generator produces stimuli that resemble those experienced by neurones, while an oscilloscope displays the response of the system. This sophisticated setup allows for the identification of very small changes in voltage (in the range of microvolts) and a thorough analysis of the spatial and temporal patterns of voltage responses in the proteinoid-omeprazole system.
Figure 3.
Diagram illustrating the setup used for electrochemical characterisation of the proteinoid-omeprazole complex. The proteinoid-omeprazole solution is stored within the central container, which is equipped with two needle electrodes coated with platinum (Pt) and iridium (Ir) respectively. These electrodes are positioned 10 mm apart. A high-precision 24-bit ADC data recorder captures voltage responses, while a heating block regulates temperature. A waveform generator produces stimuli that resemble those experienced by neurones, while an oscilloscope displays the response of the system. This sophisticated setup allows for the identification of very small changes in voltage (in the range of microvolts) and a thorough analysis of the spatial and temporal patterns of voltage responses in the proteinoid-omeprazole system.
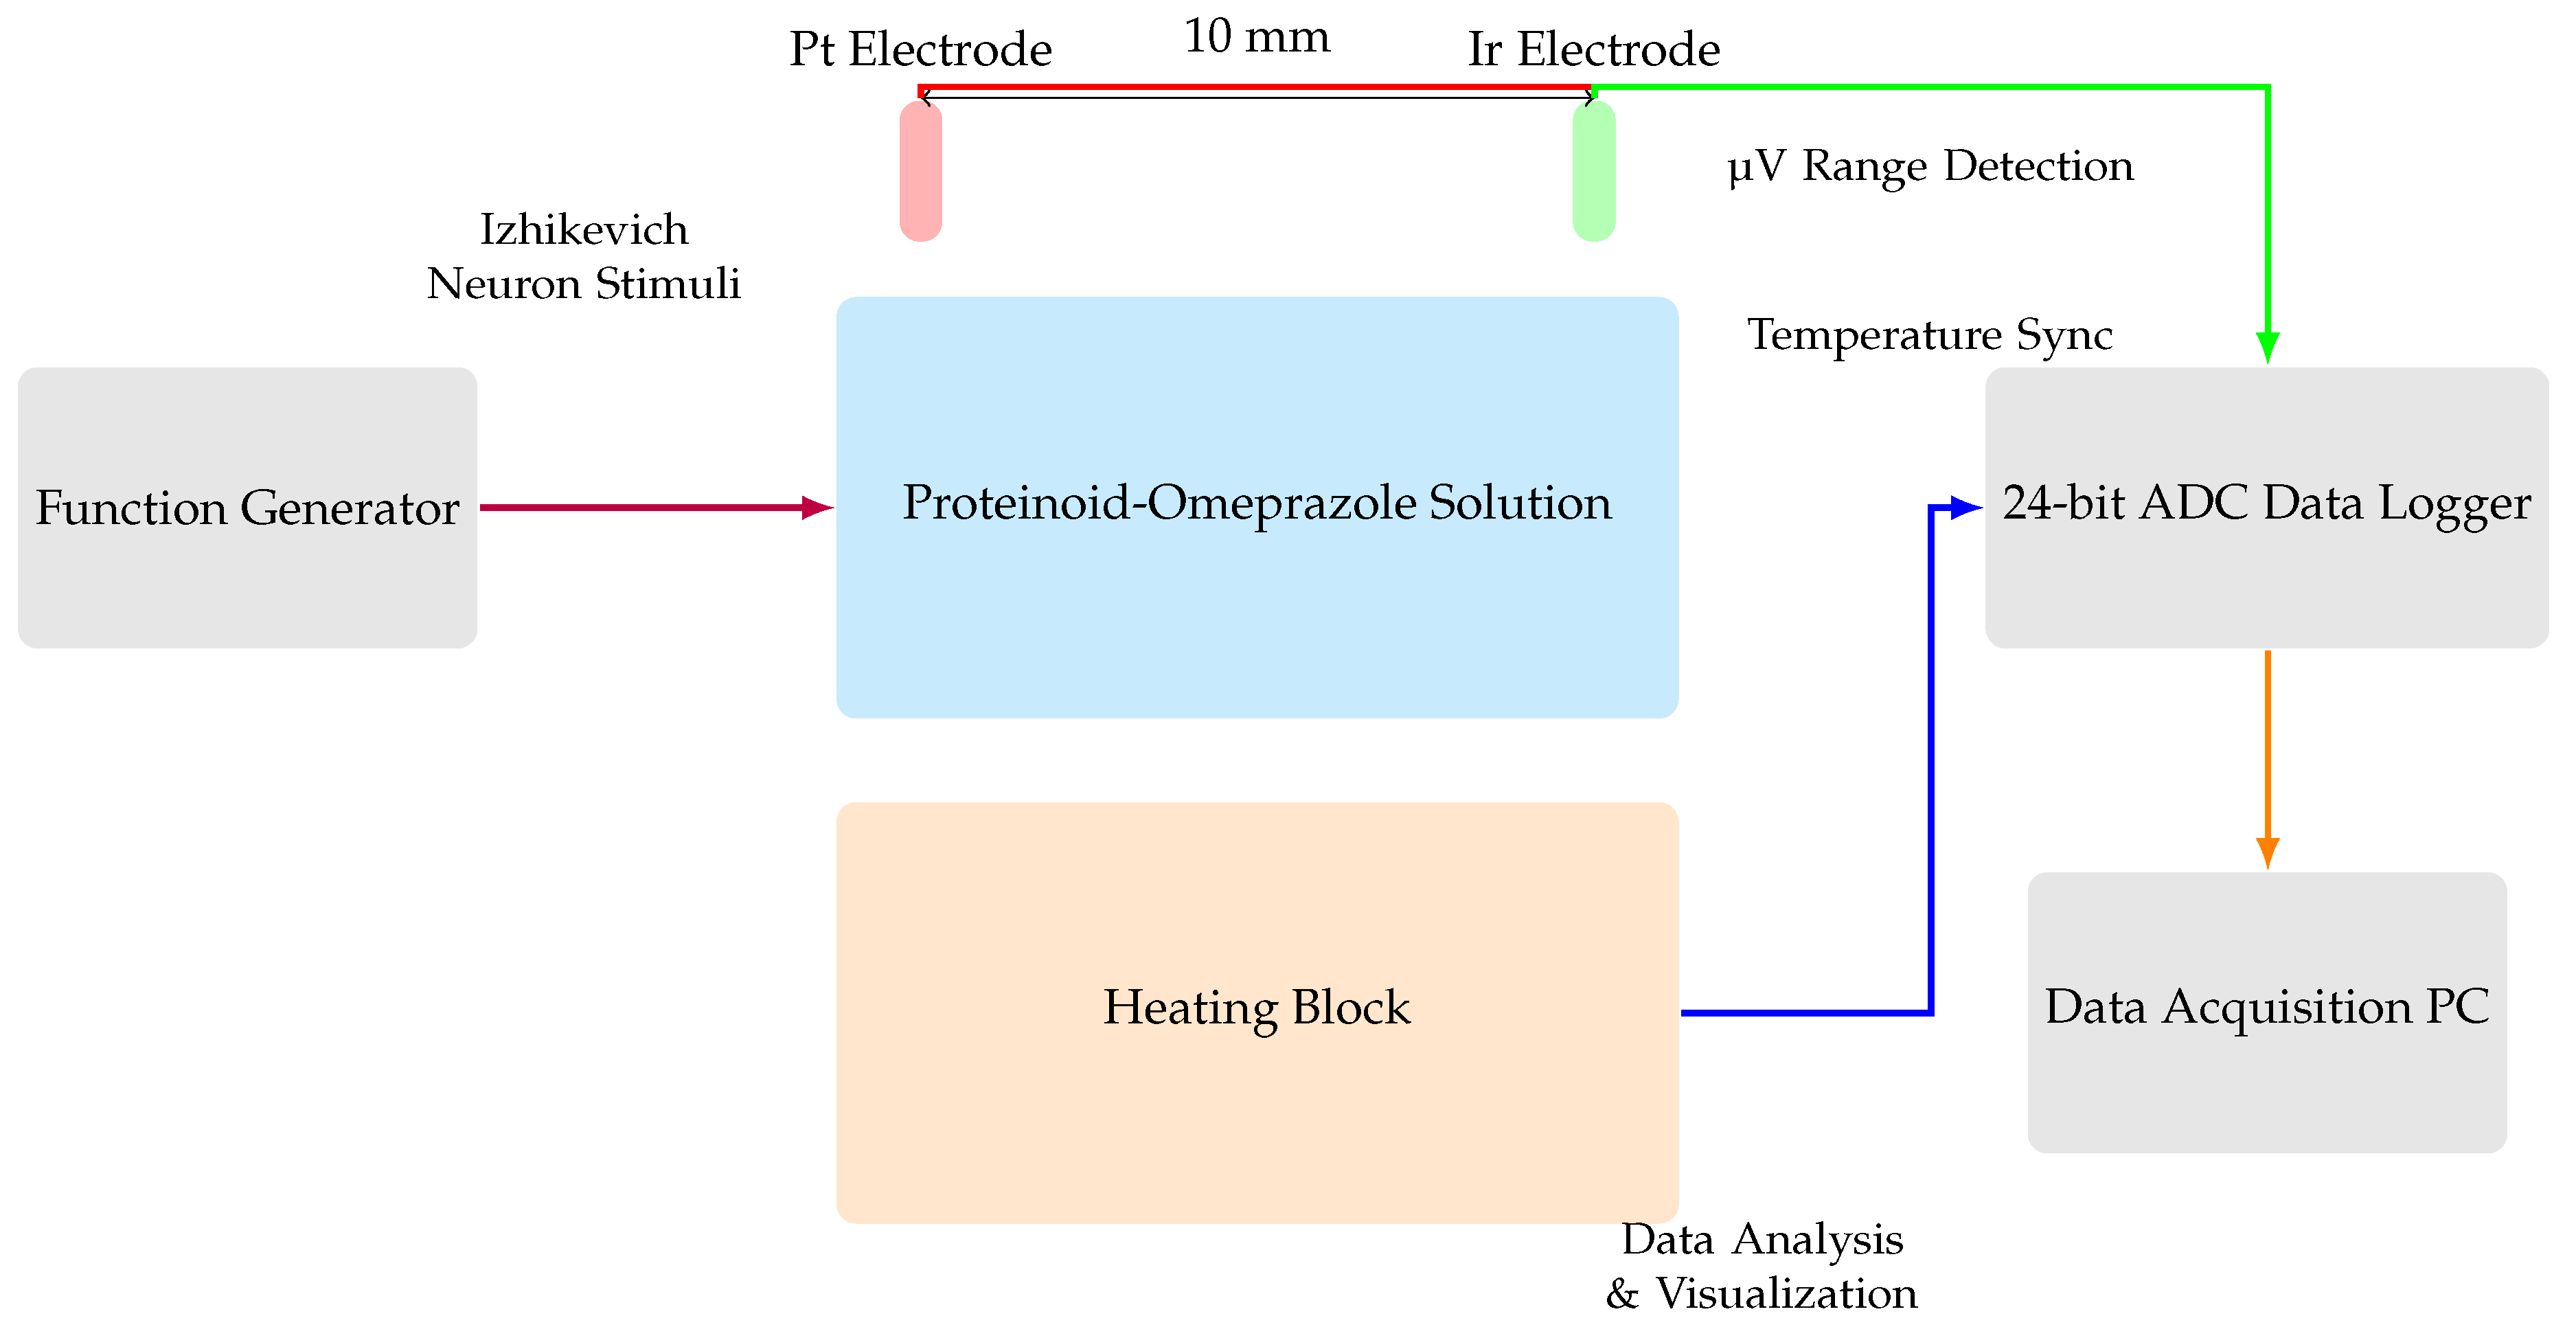
Figure 4.
Analysis of Izhikevich neuron accommodation spiking and omeprazole-proteinoid complex interaction. (A) Comparison of input Izhikevich neuron signal (blue, range: to 72.50 mV) and omeprazole-proteinoid output (red, range: to 3.99 mV), showing significant amplitude attenuation. (B) Isolated omeprazole-proteinoid output, revealing subtle voltage fluctuations (mean: 0.60 mV, SD: 0.43 mV) in response to input. (C) Cross-correlation between input and output, indicating a time lag of msec and a moderate positive correlation (r = 0.6841). (D) Q-Q plot demonstrating substantial deviation from the identity line, confirming significantly different distributions (Kolmogorov-Smirnov test: p < 0.0001, KS statistic: 0.9709). The omeprazole-proteinoid complex exhibits a marked filtering effect, reducing signal amplitude while preserving some temporal characteristics of the input. The RMSE of 50.4592 mV and maximum difference of 71.92 mV (at 1.39 ms) further quantify the substantial transformation of the signal. This analysis suggests complex neuromodulatory effects of the omeprazole-proteinoid interaction on accommodation spiking patterns.
Figure 4.
Analysis of Izhikevich neuron accommodation spiking and omeprazole-proteinoid complex interaction. (A) Comparison of input Izhikevich neuron signal (blue, range: to 72.50 mV) and omeprazole-proteinoid output (red, range: to 3.99 mV), showing significant amplitude attenuation. (B) Isolated omeprazole-proteinoid output, revealing subtle voltage fluctuations (mean: 0.60 mV, SD: 0.43 mV) in response to input. (C) Cross-correlation between input and output, indicating a time lag of msec and a moderate positive correlation (r = 0.6841). (D) Q-Q plot demonstrating substantial deviation from the identity line, confirming significantly different distributions (Kolmogorov-Smirnov test: p < 0.0001, KS statistic: 0.9709). The omeprazole-proteinoid complex exhibits a marked filtering effect, reducing signal amplitude while preserving some temporal characteristics of the input. The RMSE of 50.4592 mV and maximum difference of 71.92 mV (at 1.39 ms) further quantify the substantial transformation of the signal. This analysis suggests complex neuromodulatory effects of the omeprazole-proteinoid interaction on accommodation spiking patterns.
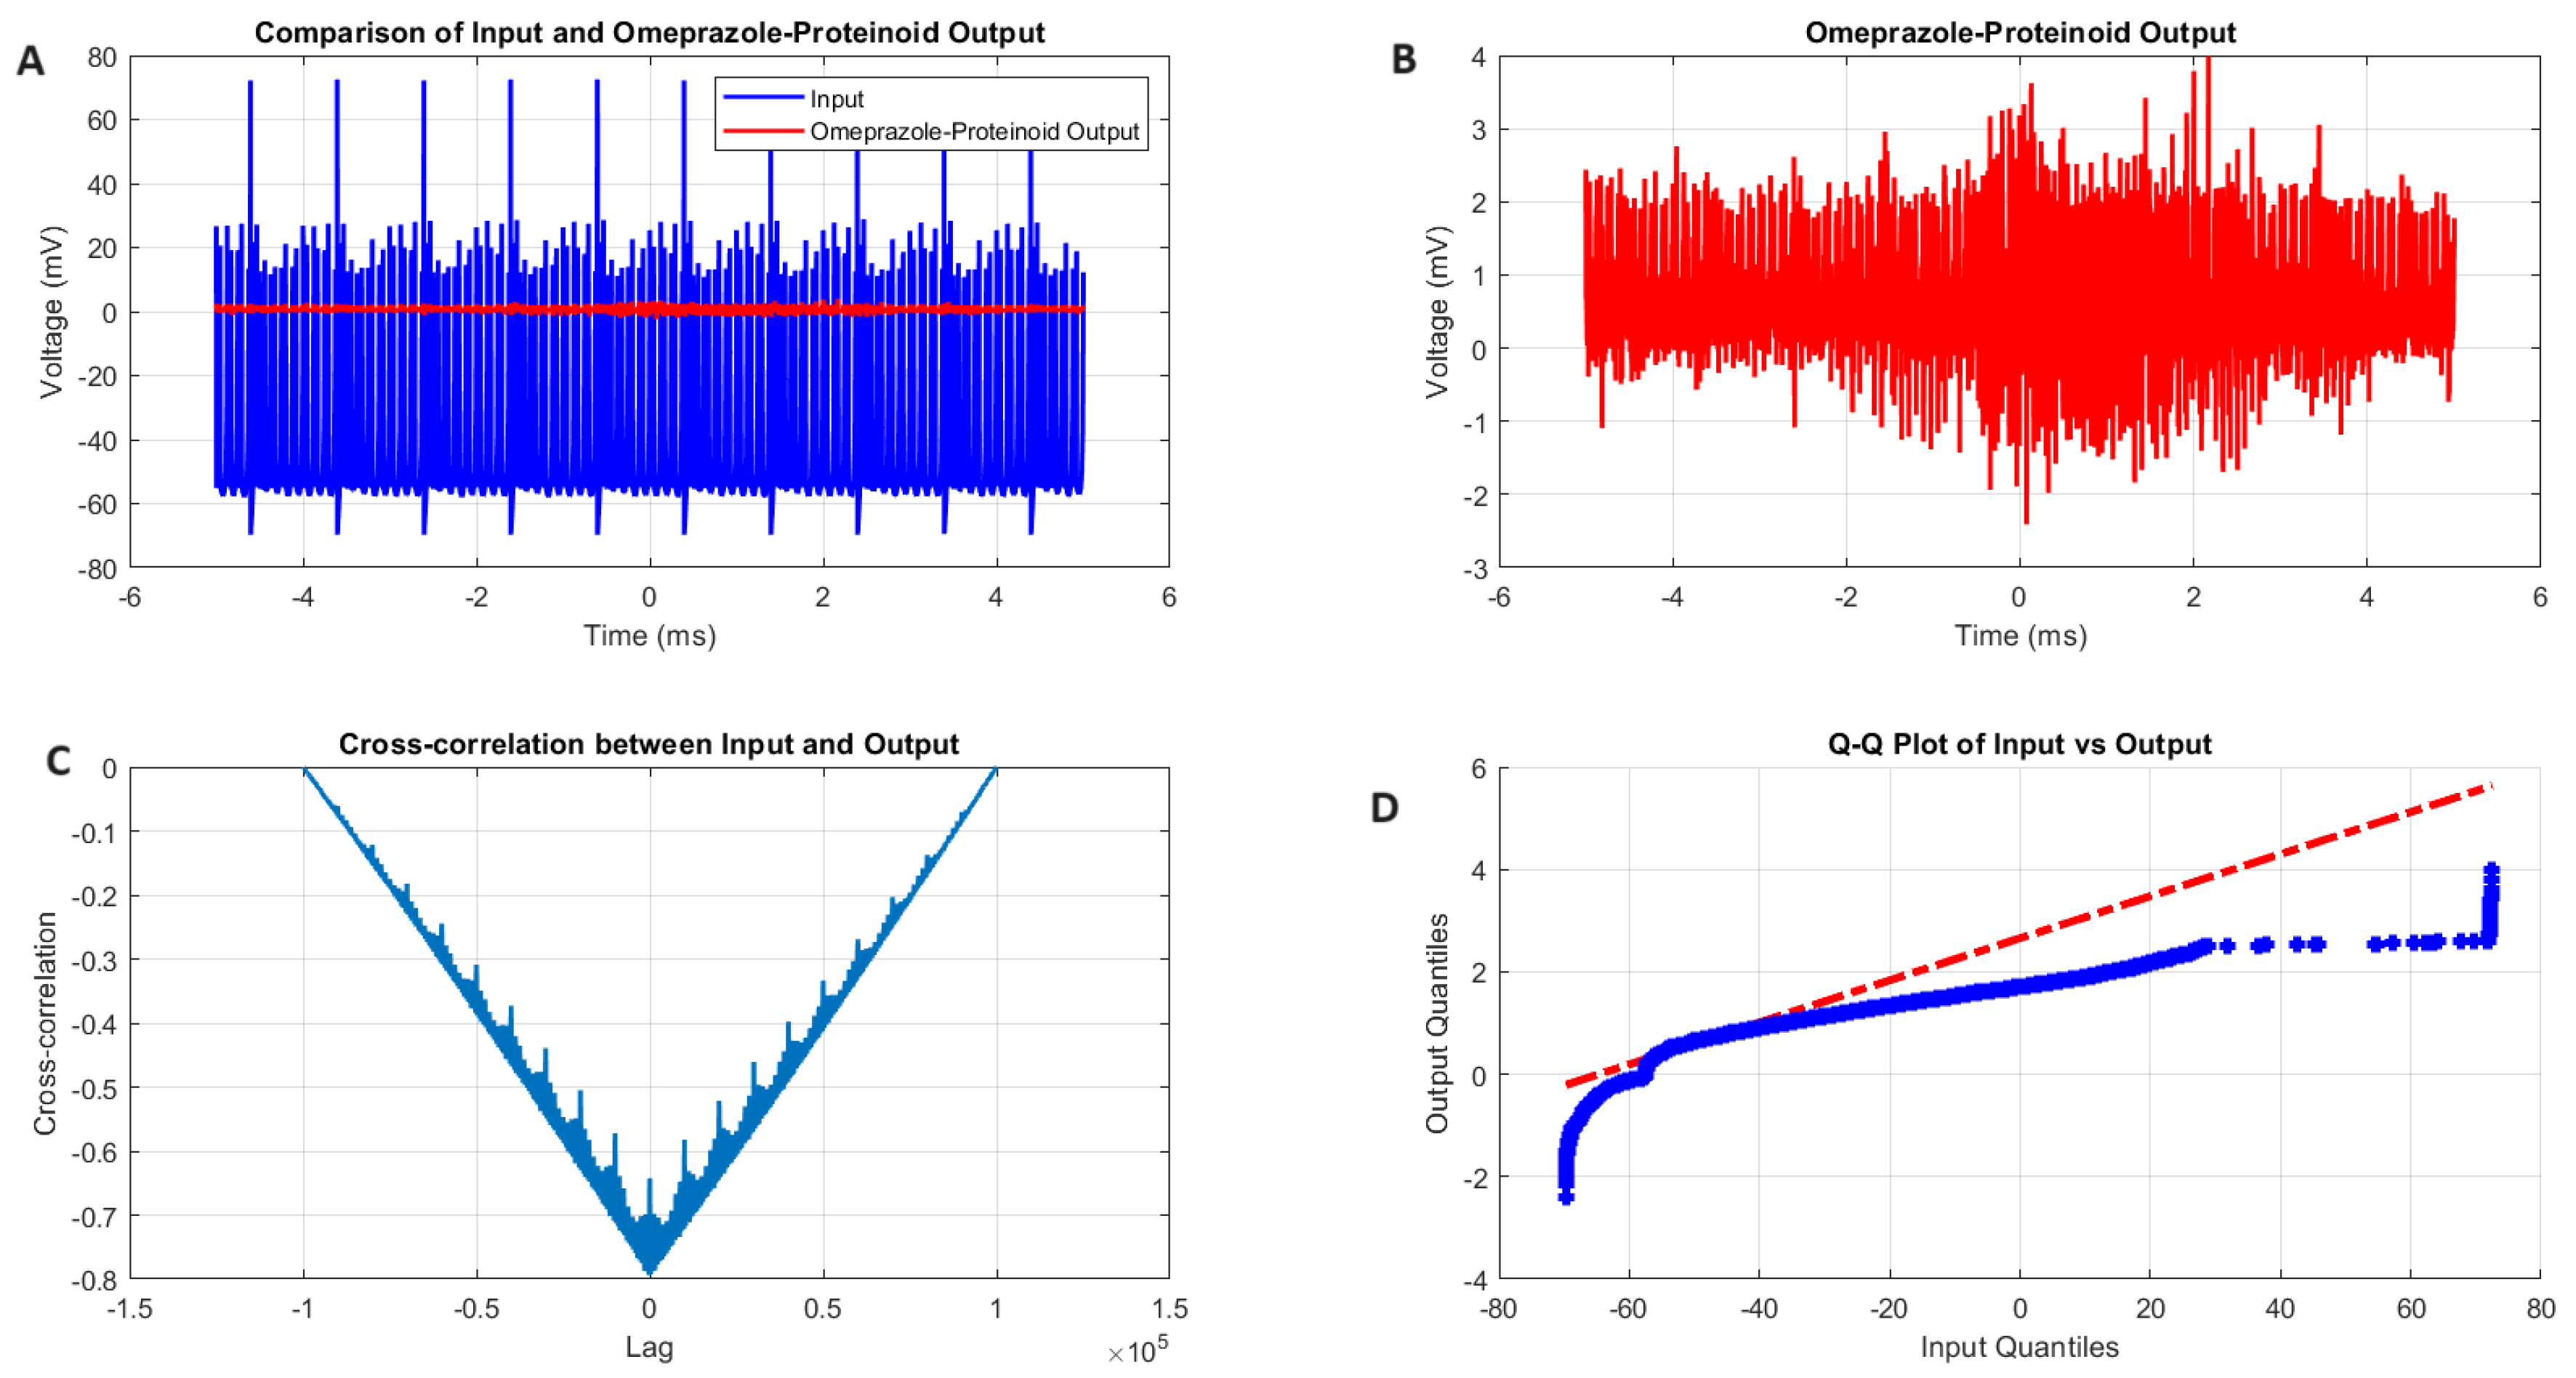
Figure 5.
Chattering spiking stimulation analysis of omeprazole-proteinoid sample. (a) Input-output comparison showing the input signal (mean: mV, SD: 19.72 mV) and the omeprazole-proteinoid output (mean: 0.48 mV, SD: 0.51 mV). Correlation coefficient: 0.7937, RMSE: 59.2964 mV. (b) Output plot highlighting the response characteristics of the omeprazole-proteinoid sample. (c) Cross-correlation lag plot demonstrating a time difference of msec between input and output signals. (d) Q-Q plot comparing input and output distributions (Kolmogorov-Smirnov test: H=1, p<0.0001, KS statistic=0.9717).
Figure 5.
Chattering spiking stimulation analysis of omeprazole-proteinoid sample. (a) Input-output comparison showing the input signal (mean: mV, SD: 19.72 mV) and the omeprazole-proteinoid output (mean: 0.48 mV, SD: 0.51 mV). Correlation coefficient: 0.7937, RMSE: 59.2964 mV. (b) Output plot highlighting the response characteristics of the omeprazole-proteinoid sample. (c) Cross-correlation lag plot demonstrating a time difference of msec between input and output signals. (d) Q-Q plot comparing input and output distributions (Kolmogorov-Smirnov test: H=1, p<0.0001, KS statistic=0.9717).
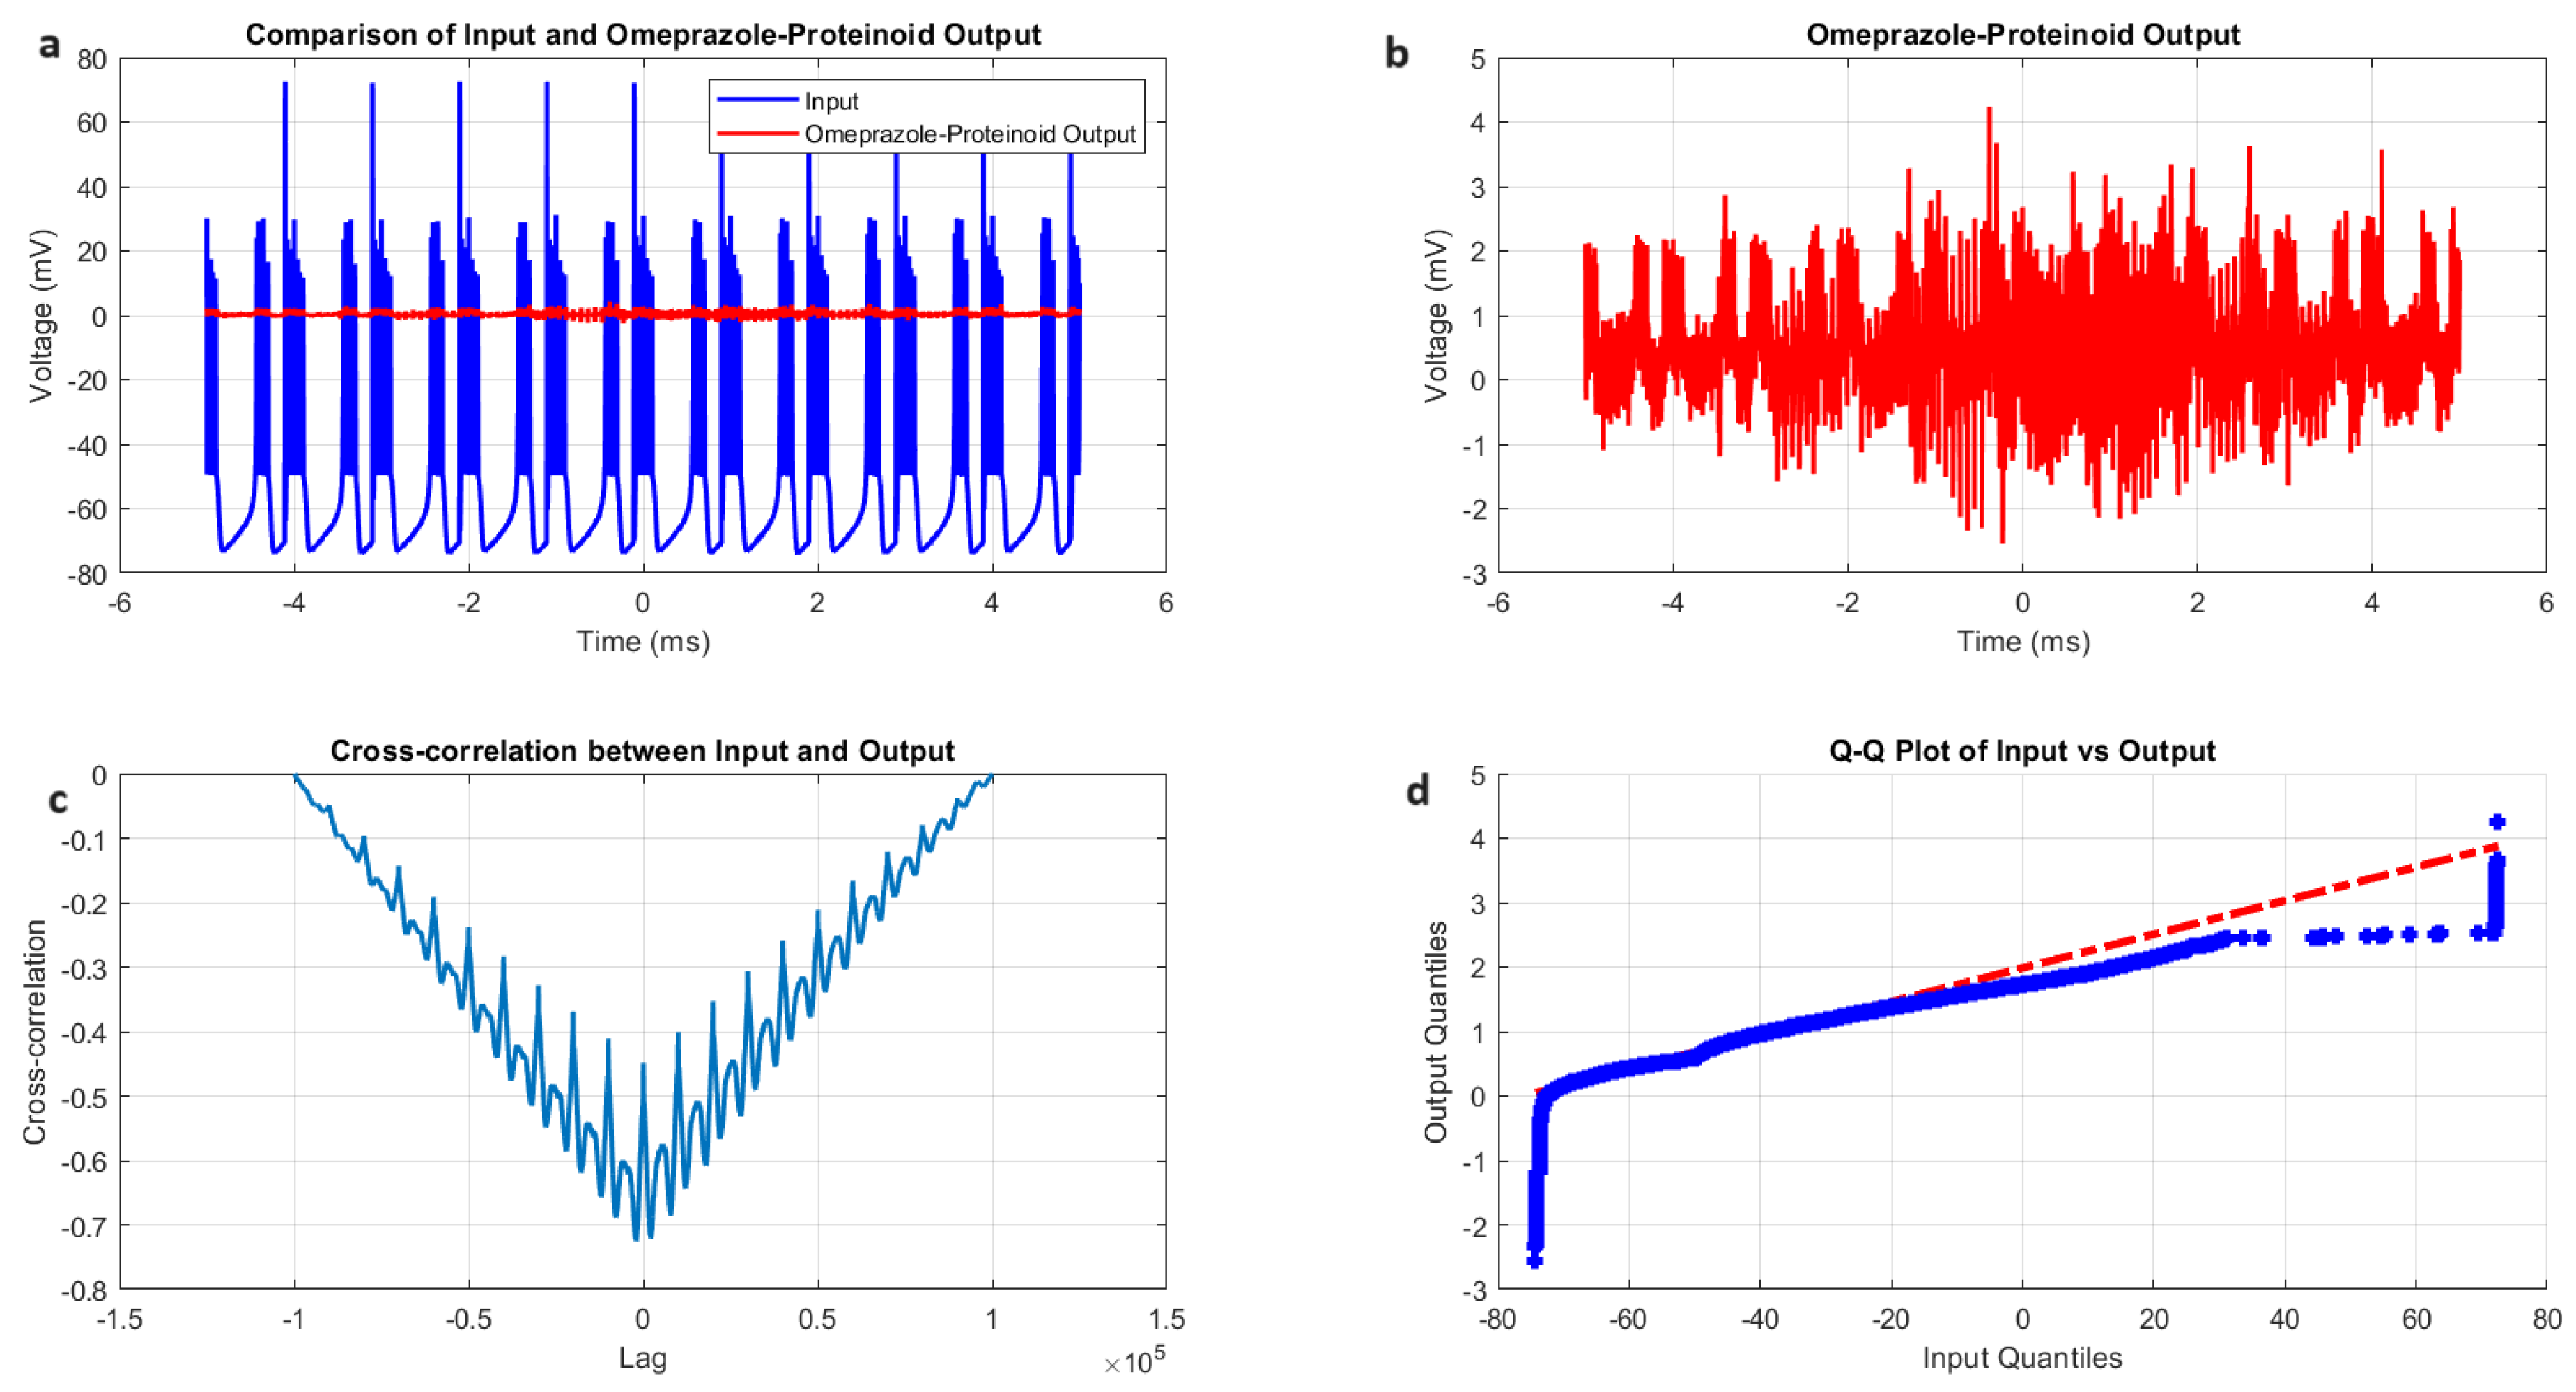
Figure 6.
Characterization of induced-mode spiking in omeprazole-proteinoid samples. (a) Input-output comparison: Input signal (mean: mV, SD: 14.20 mV) and omeprazole-proteinoid output (mean: 0.34 mV, SD: 0.40 mV). Correlation coefficient: 0.6644, RMSE: 62.8671 mV. (b) Detailed output plot showing the response characteristics of the omeprazole-proteinoid sample (range: mV to 3.14 mV). (c) Cross-correlation analysis revealing a time lag of 1590 msec between input and output signals. Maximum difference: 71.91 mV at 2.00 ms. (d) Q-Q plot comparing input and output distributions (Kolmogorov-Smirnov test: KS statistic = 0.9844, p < 0.0001), indicating significantly different signal distributions.
Figure 6.
Characterization of induced-mode spiking in omeprazole-proteinoid samples. (a) Input-output comparison: Input signal (mean: mV, SD: 14.20 mV) and omeprazole-proteinoid output (mean: 0.34 mV, SD: 0.40 mV). Correlation coefficient: 0.6644, RMSE: 62.8671 mV. (b) Detailed output plot showing the response characteristics of the omeprazole-proteinoid sample (range: mV to 3.14 mV). (c) Cross-correlation analysis revealing a time lag of 1590 msec between input and output signals. Maximum difference: 71.91 mV at 2.00 ms. (d) Q-Q plot comparing input and output distributions (Kolmogorov-Smirnov test: KS statistic = 0.9844, p < 0.0001), indicating significantly different signal distributions.
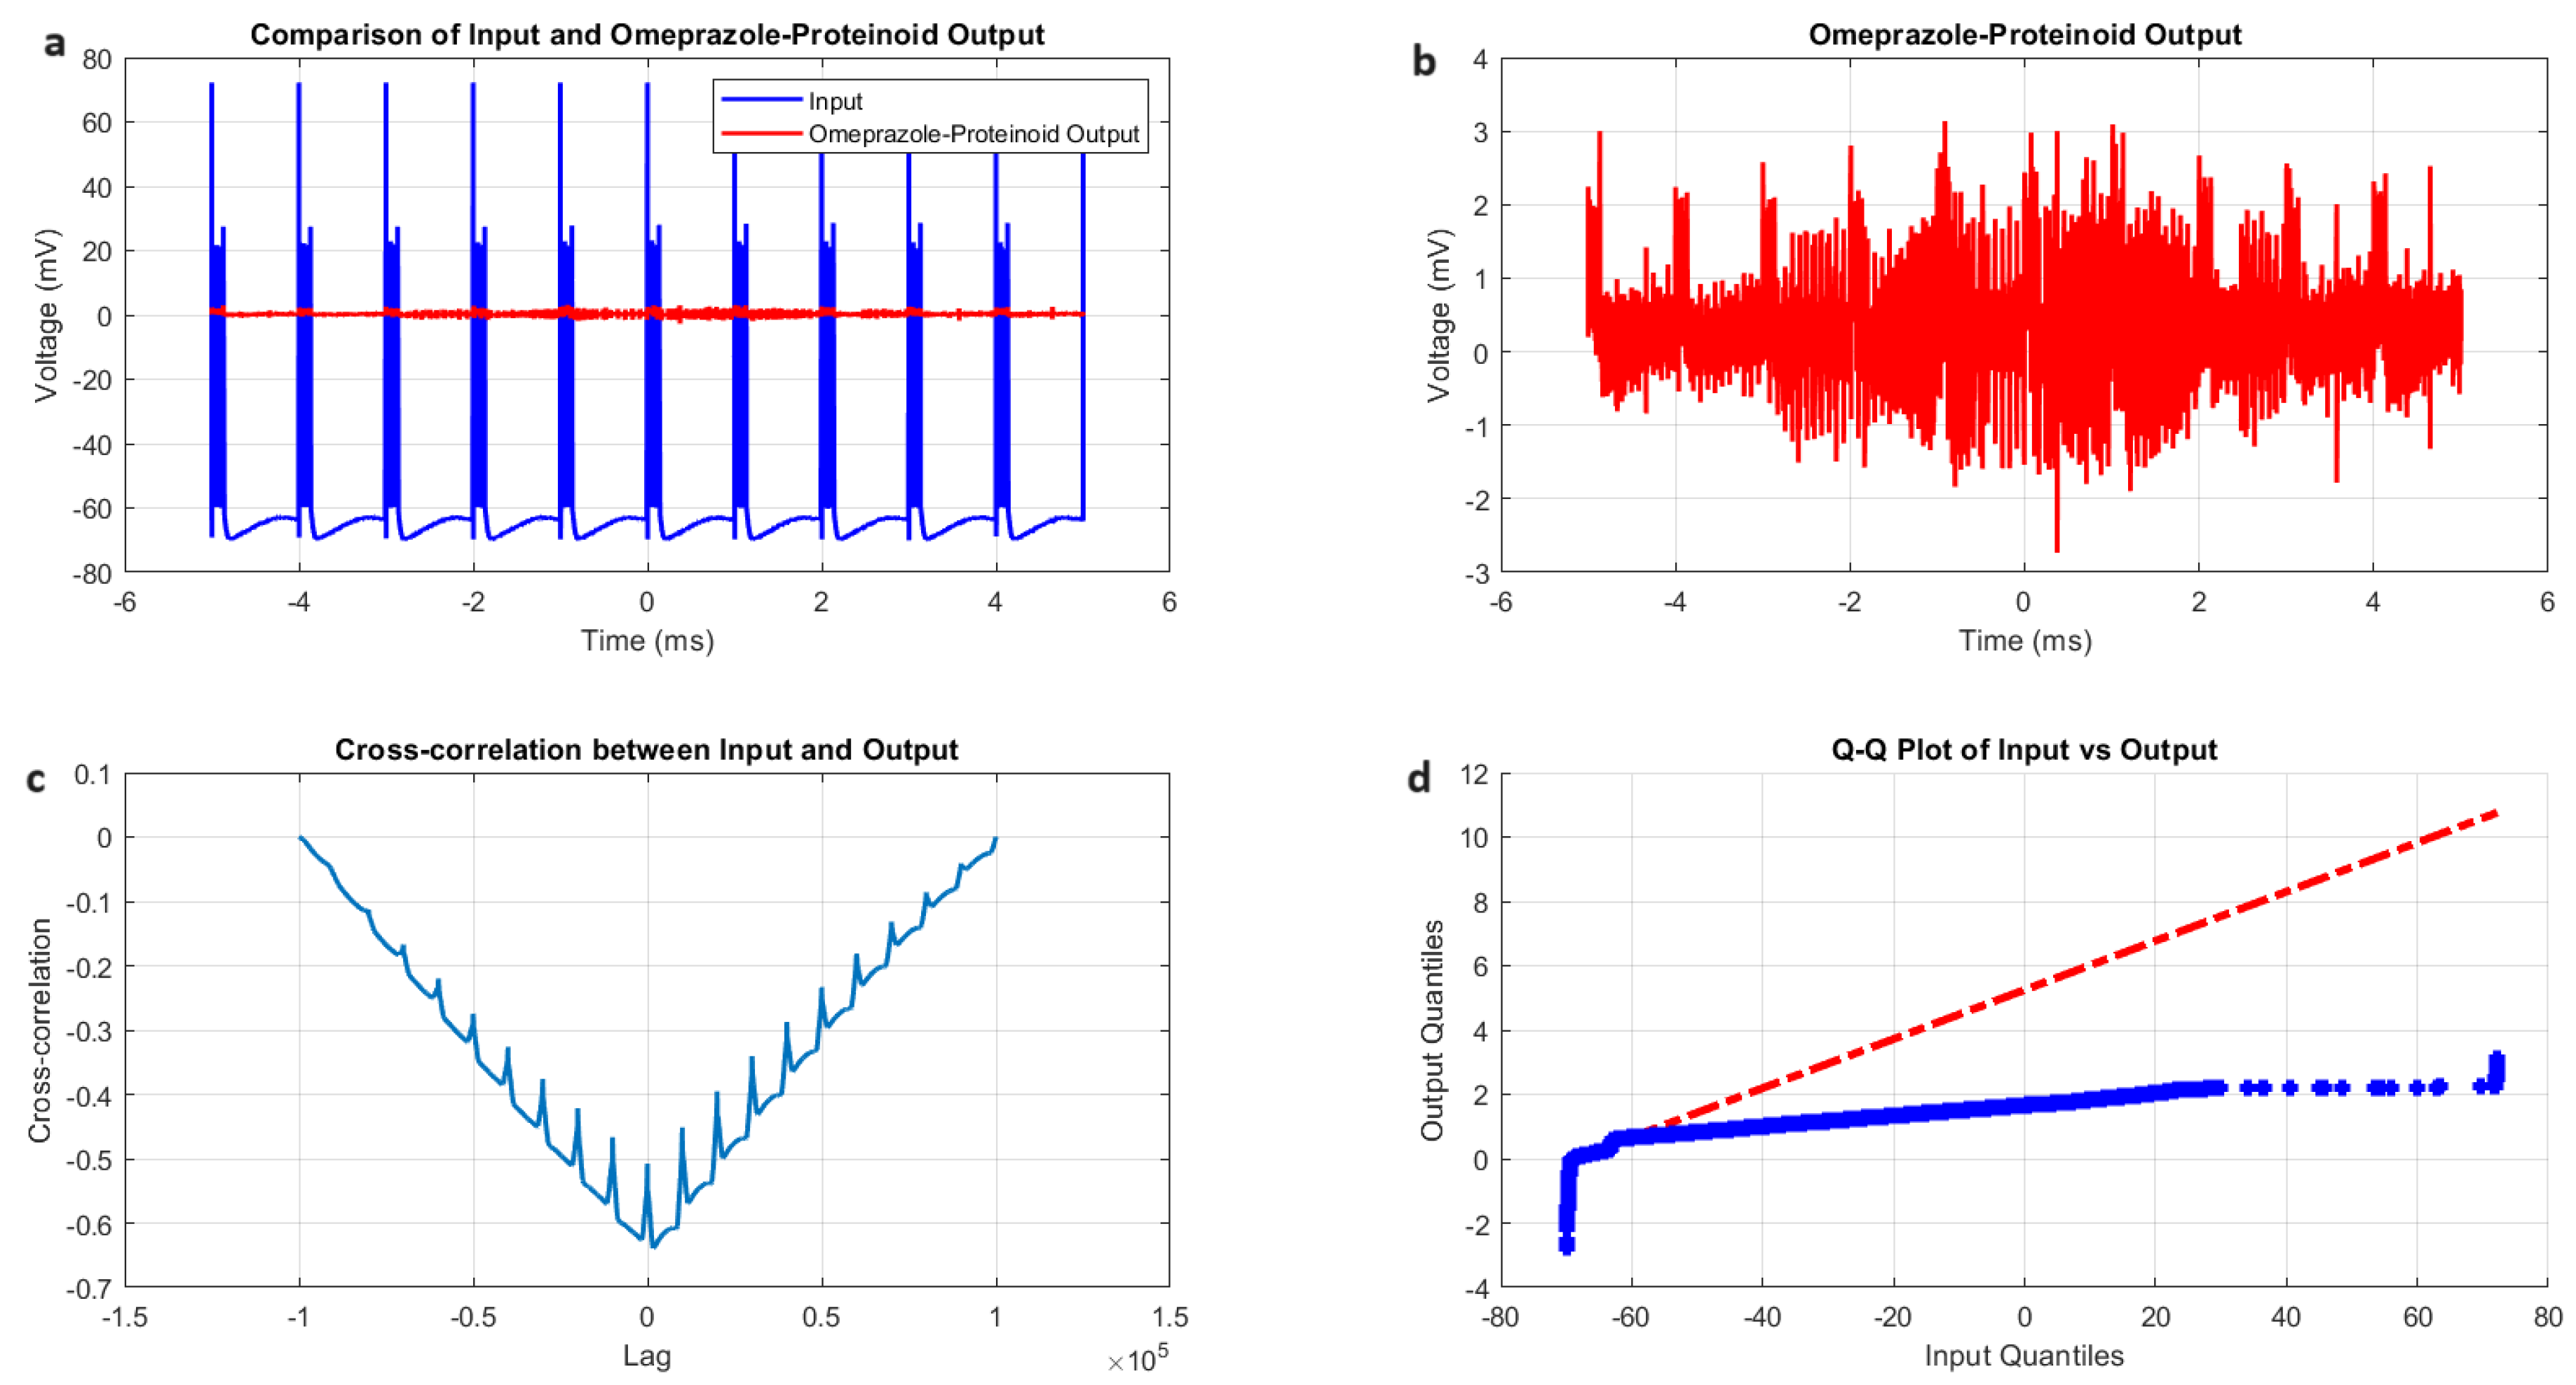
Figure 7.
Characterization of phasic spiking dynamics in proteinoid-omeprazole complexes. (a) Input-output comparison: Input signal (mean: mV, SD: 8.23 mV) and proteinoid-omeprazole output (mean: 0.54 mV, SD: 0.33 mV). Correlation coefficient: 0.4503, RMSE: 55.9366 mV. (b) Detailed output plot illustrating the response characteristics of the proteinoid-omeprazole complex (range: mV to 3.17 mV). (c) Cross-correlation analysis revealing a time lag of msec between input and output signals. Maximum difference: 67.00 mV at 2.00 ms. (d) Q-Q plot comparing input and output distributions (Kolmogorov-Smirnov test: KS statistic = 0.9945, p < 0.0001), demonstrating significantly different signal distributions and non-linear response properties.
Figure 7.
Characterization of phasic spiking dynamics in proteinoid-omeprazole complexes. (a) Input-output comparison: Input signal (mean: mV, SD: 8.23 mV) and proteinoid-omeprazole output (mean: 0.54 mV, SD: 0.33 mV). Correlation coefficient: 0.4503, RMSE: 55.9366 mV. (b) Detailed output plot illustrating the response characteristics of the proteinoid-omeprazole complex (range: mV to 3.17 mV). (c) Cross-correlation analysis revealing a time lag of msec between input and output signals. Maximum difference: 67.00 mV at 2.00 ms. (d) Q-Q plot comparing input and output distributions (Kolmogorov-Smirnov test: KS statistic = 0.9945, p < 0.0001), demonstrating significantly different signal distributions and non-linear response properties.
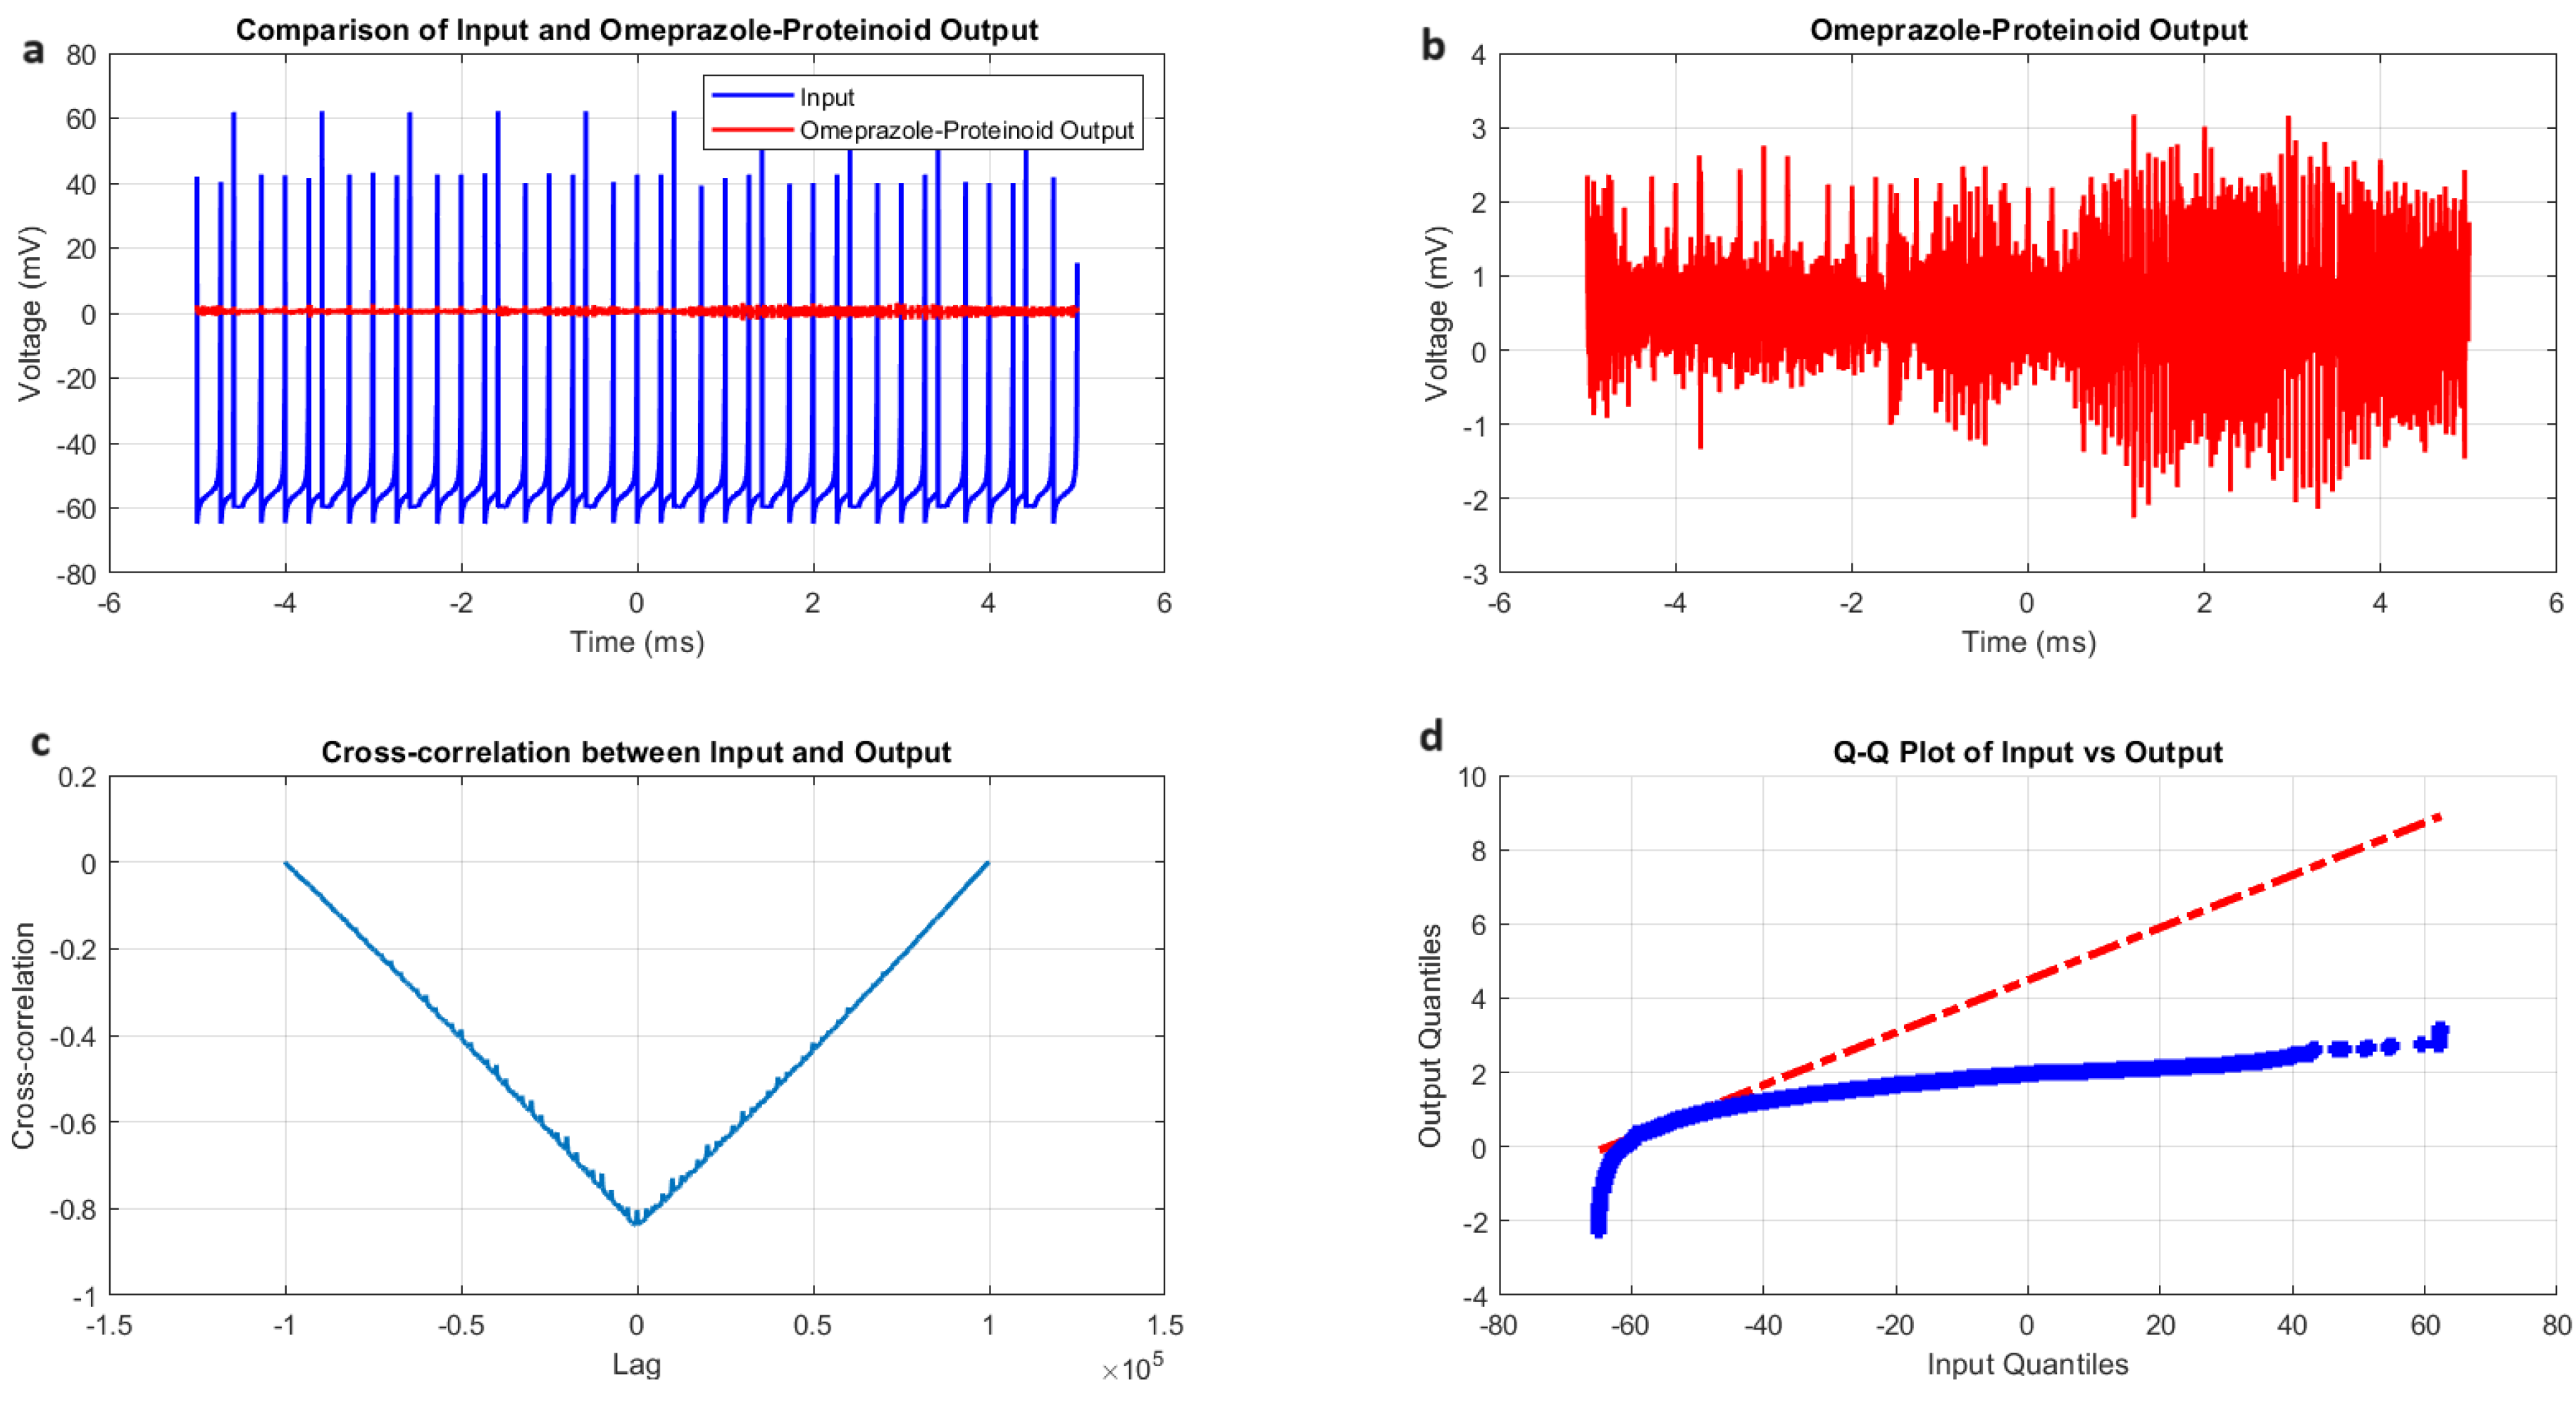
Figure 8.
Characterization of tonic spiking dynamics in omeprazole-proteinoid complexes. (a) Input-output comparison: Input signal (mean: mV, SD: 20.55 mV) and omeprazole-proteinoid output (mean: 0.80 mV, SD: 0.48 mV). Correlation coefficient: 0.6823, RMSE: 43.2821 mV. (b) Detailed output plot illustrating the sustained response characteristics of the omeprazole-proteinoid complex (range: mV to 3.63 mV). (c) Cross-correlation analysis revealing a time lag of -1231 samples between input and output signals. Maximum difference: 62.11 mV at 0.56 ms. (d) Q-Q plot comparing input and output distributions (Kolmogorov-Smirnov test: KS statistic = 0.9276, p < 0.0001), demonstrating significantly different signal distributions and non-linear response properties in tonic spiking mode.
Figure 8.
Characterization of tonic spiking dynamics in omeprazole-proteinoid complexes. (a) Input-output comparison: Input signal (mean: mV, SD: 20.55 mV) and omeprazole-proteinoid output (mean: 0.80 mV, SD: 0.48 mV). Correlation coefficient: 0.6823, RMSE: 43.2821 mV. (b) Detailed output plot illustrating the sustained response characteristics of the omeprazole-proteinoid complex (range: mV to 3.63 mV). (c) Cross-correlation analysis revealing a time lag of -1231 samples between input and output signals. Maximum difference: 62.11 mV at 0.56 ms. (d) Q-Q plot comparing input and output distributions (Kolmogorov-Smirnov test: KS statistic = 0.9276, p < 0.0001), demonstrating significantly different signal distributions and non-linear response properties in tonic spiking mode.
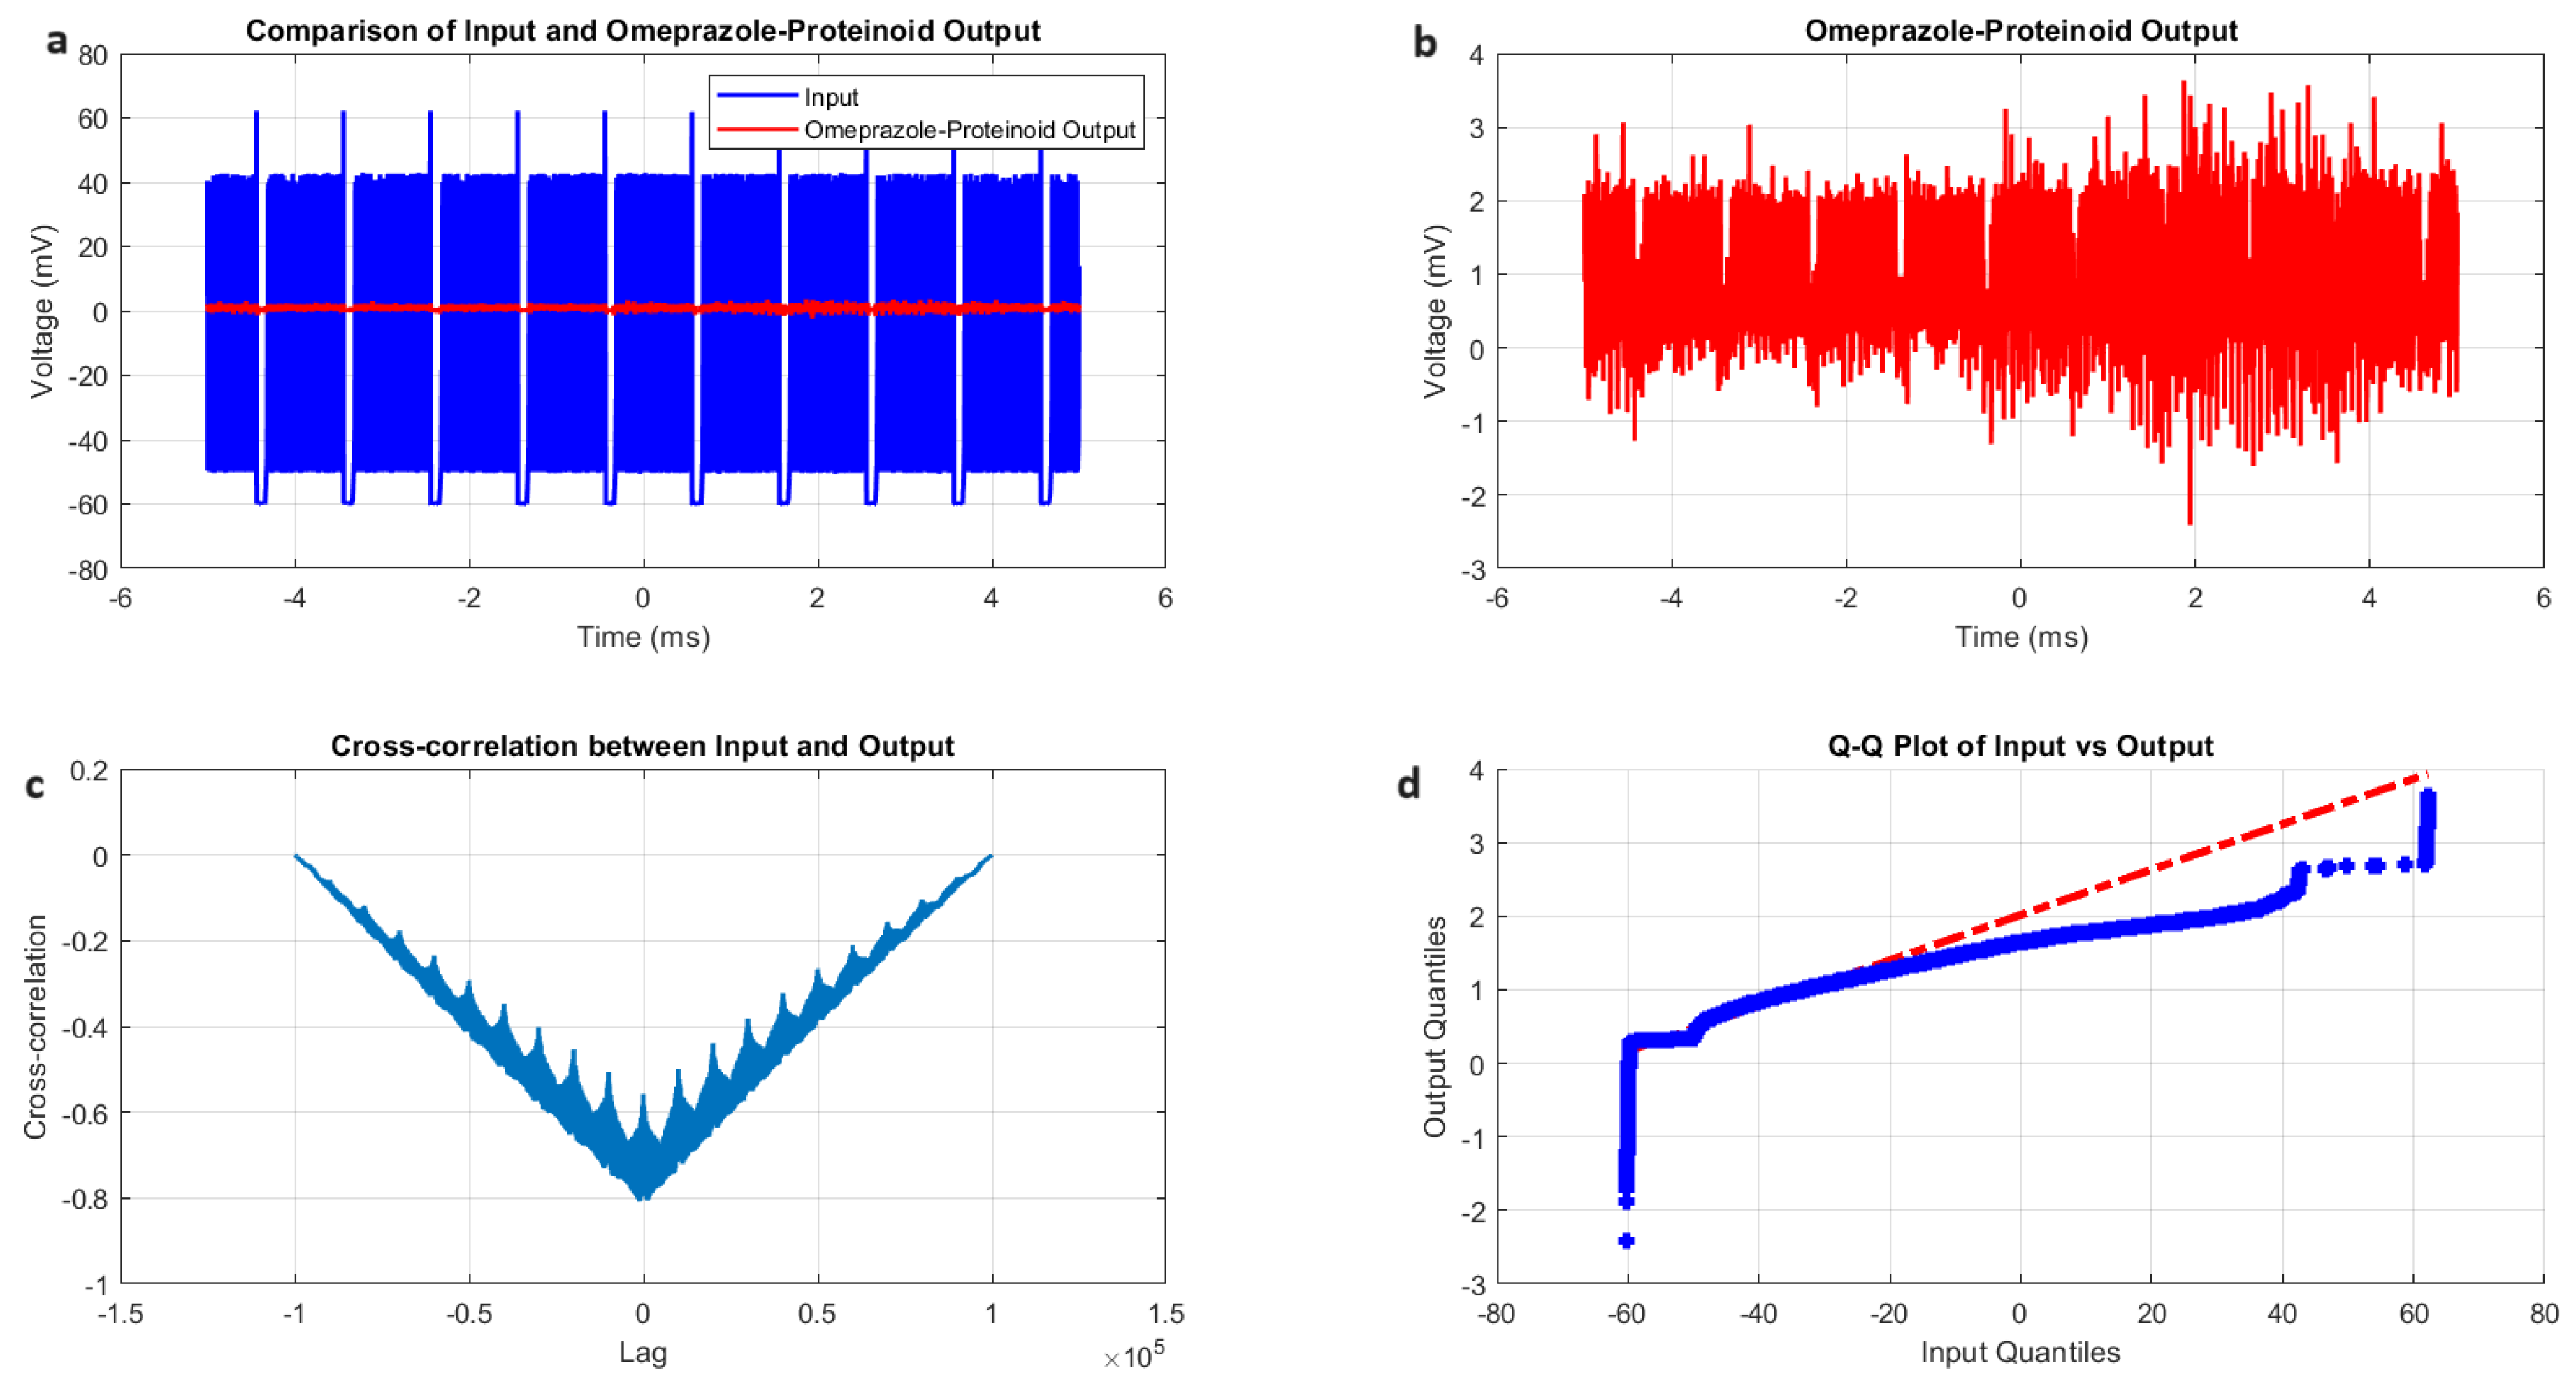
Figure 9.
Heatmap visualization of spike patterns across different spiking modes in omeprazole-proteinoid complexes. (a) Accommodation, (b) Chattering, (c) Induced, (d) Phasic, and (e) Tonic spiking modes. Color intensity represents the membrane potential, with warmer colors indicating higher potentials. The heatmap reveals distinct temporal patterns and intensity distributions characteristic of each spiking mode, highlighting the complex and mode-specific signal processing capabilities of the omeprazole-proteinoid system.
Figure 9.
Heatmap visualization of spike patterns across different spiking modes in omeprazole-proteinoid complexes. (a) Accommodation, (b) Chattering, (c) Induced, (d) Phasic, and (e) Tonic spiking modes. Color intensity represents the membrane potential, with warmer colors indicating higher potentials. The heatmap reveals distinct temporal patterns and intensity distributions characteristic of each spiking mode, highlighting the complex and mode-specific signal processing capabilities of the omeprazole-proteinoid system.
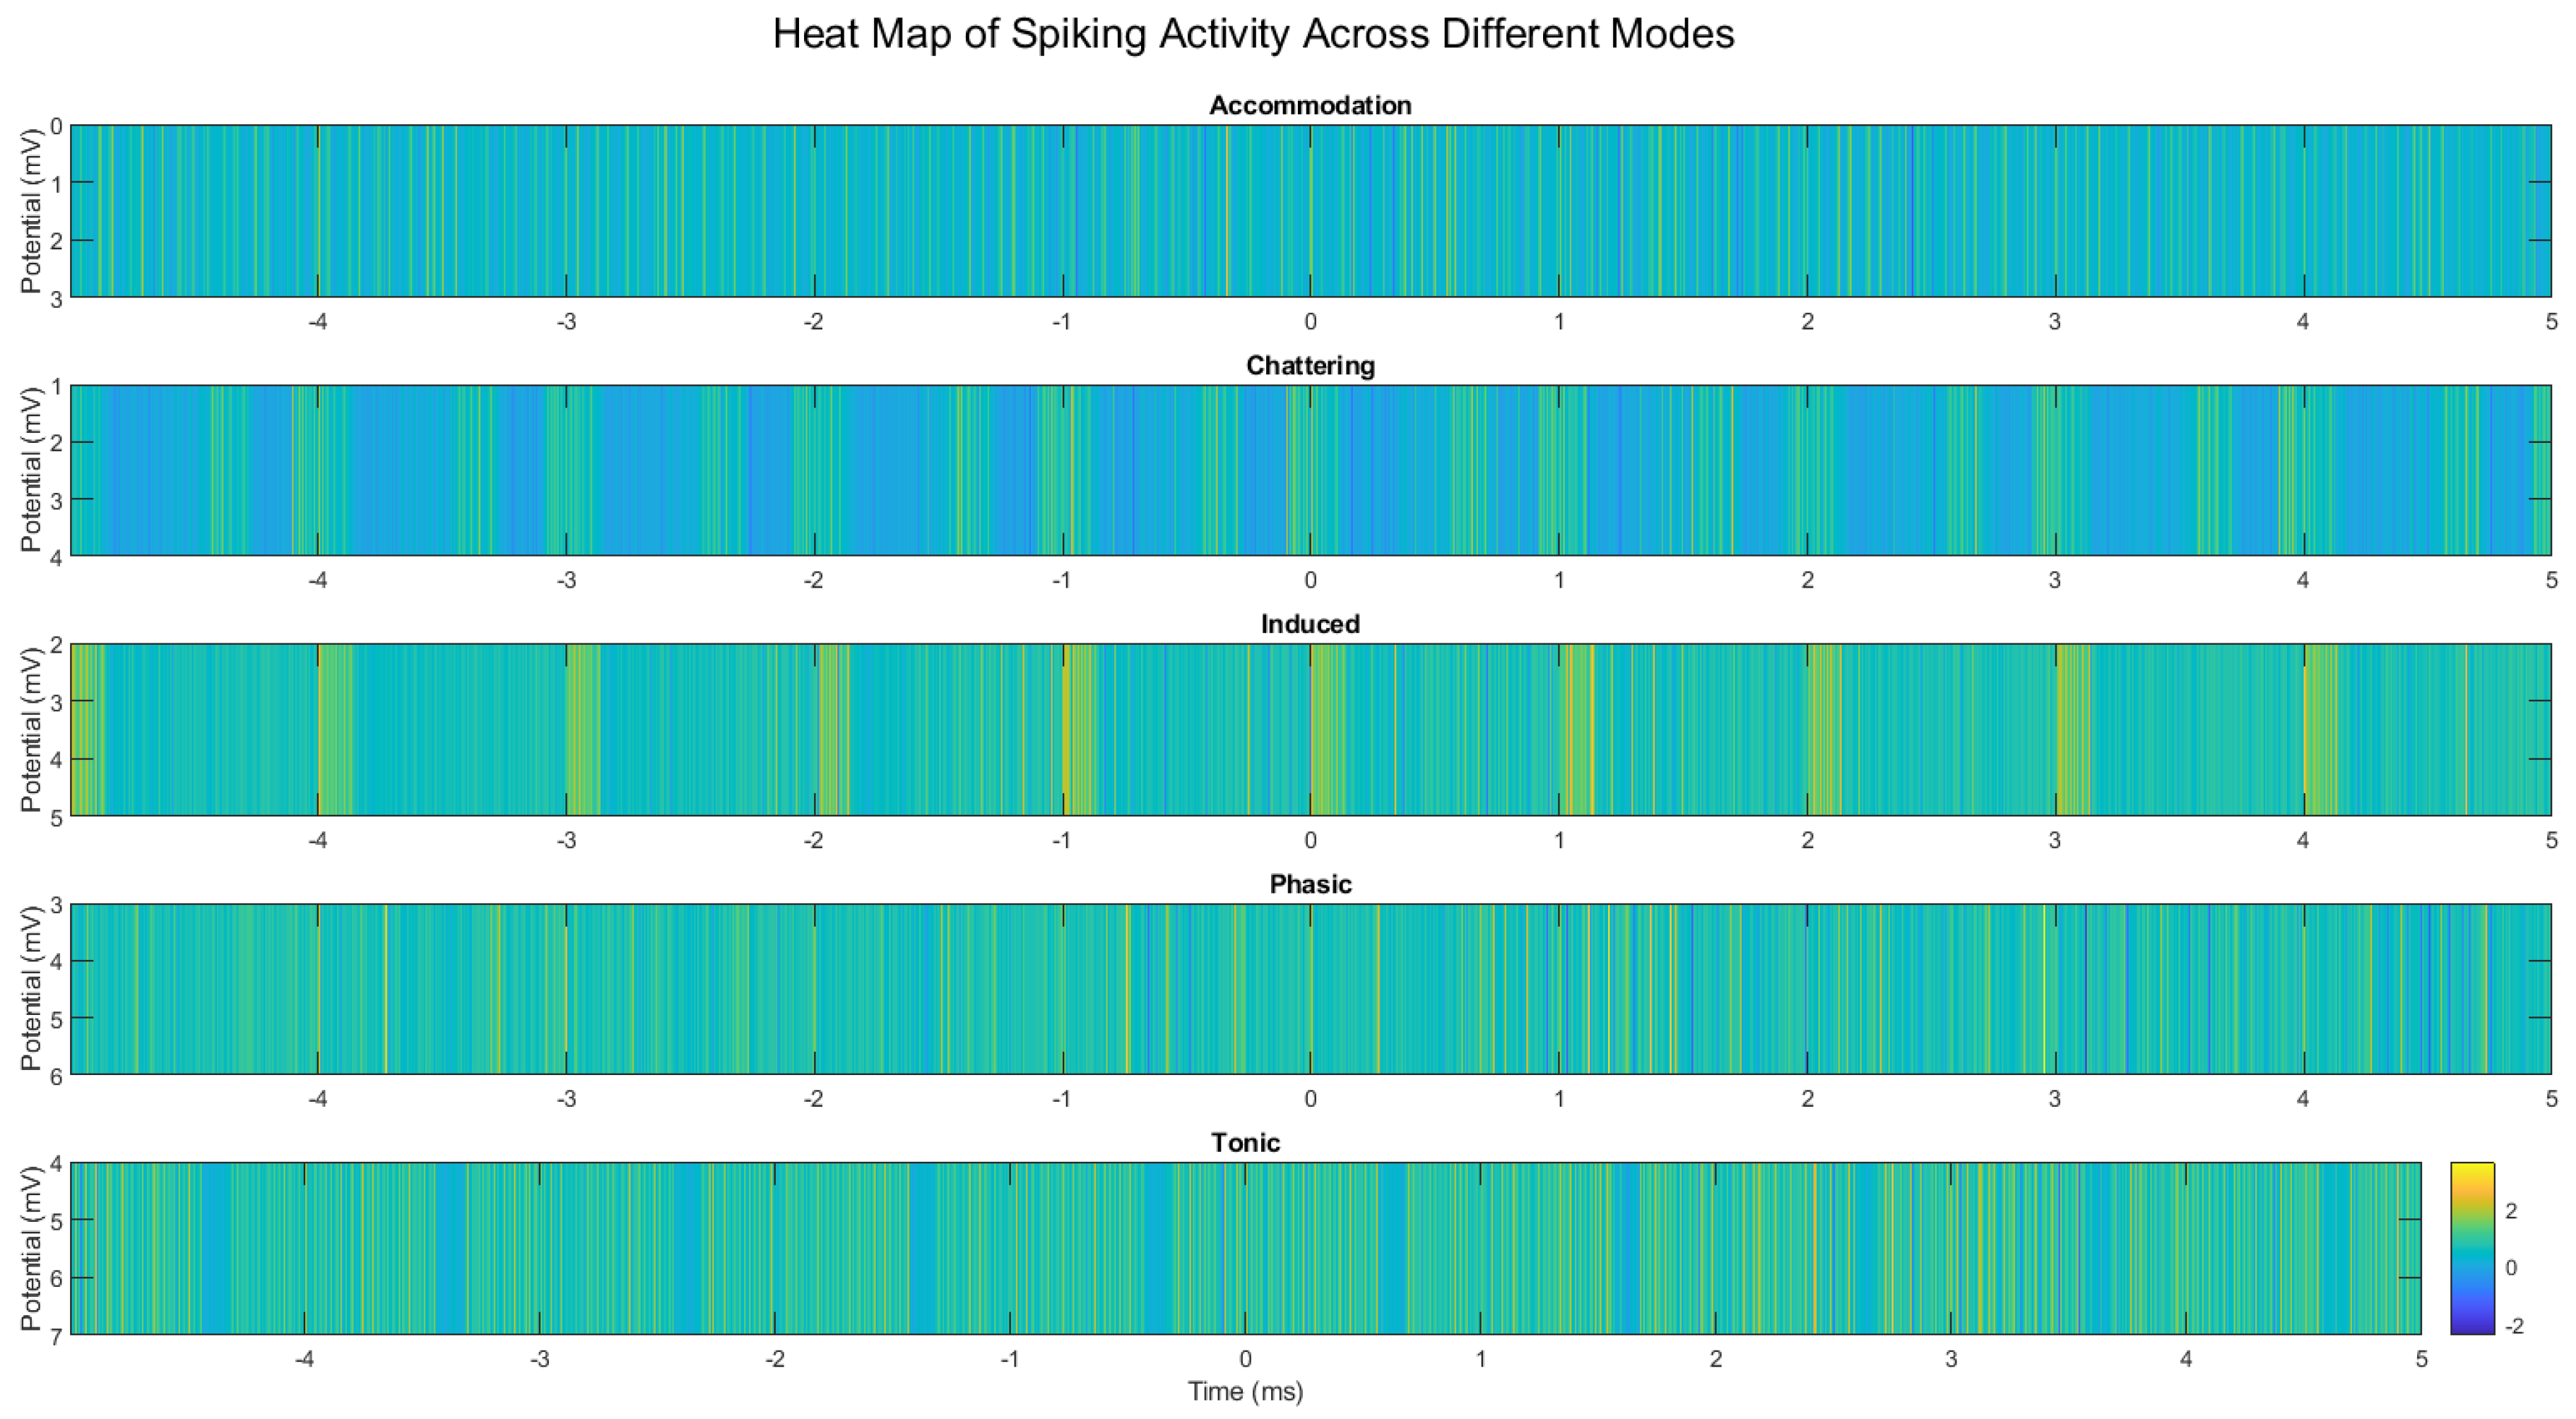
Figure 10.
Proposed mechanisms underlying the observed spiking behaviour in omeprazole-proteinoid complexes. (A) Voltage-sensitive conformational changes in the proteinoid structure. (B) Formation and breakdown of temporary conductive pathways. (C) Charge accumulation and redistribution processes. (D) Interactions between omeprazole’s proton pump inhibition and local pH gradients. The interplay of these mechanisms likely contributes to the complex, mode-dependent signal processing observed across different spiking regimes.
Figure 10.
Proposed mechanisms underlying the observed spiking behaviour in omeprazole-proteinoid complexes. (A) Voltage-sensitive conformational changes in the proteinoid structure. (B) Formation and breakdown of temporary conductive pathways. (C) Charge accumulation and redistribution processes. (D) Interactions between omeprazole’s proton pump inhibition and local pH gradients. The interplay of these mechanisms likely contributes to the complex, mode-dependent signal processing observed across different spiking regimes.
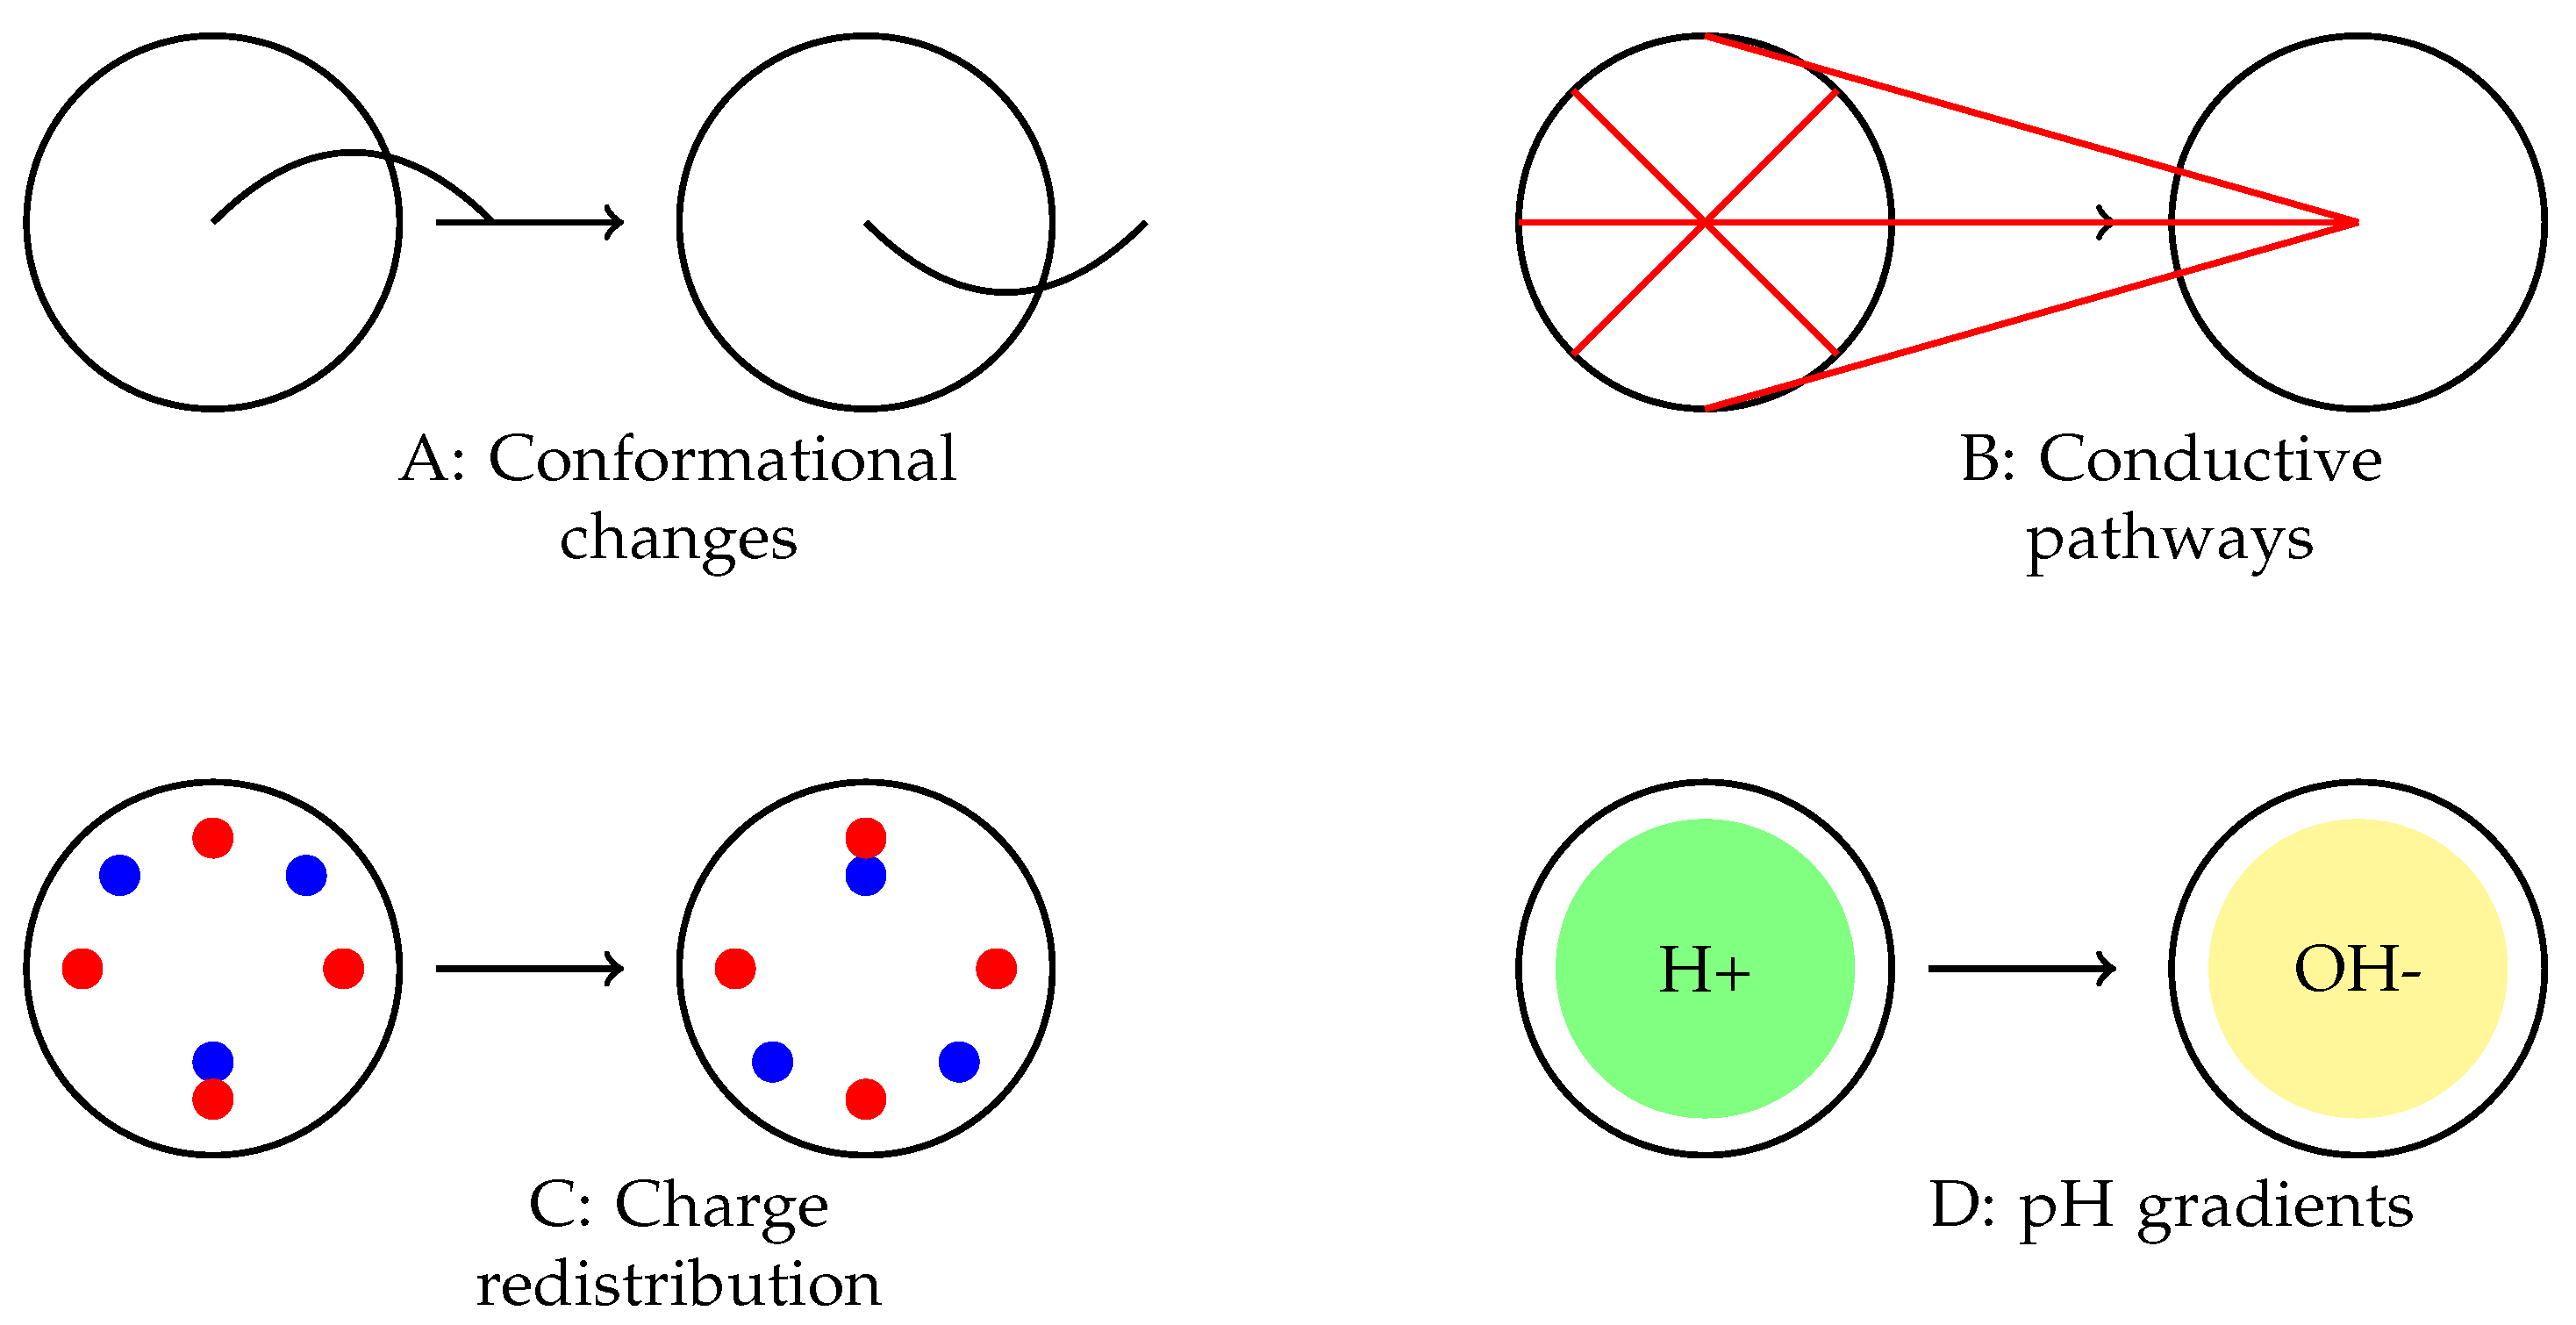
Figure 11.
Proposed mechanism for the generation of spikes in complexes formed by proteinoids and omeprazole. (a) SEM image showing the complex network structure. Schematic representation of the spike generation mechanism, illustrating omeprazole binding sites (red), ion channels (blue), and charge movement (orange arrows). (b) Graph illustrating the temporal evolution of the spike potential.
Figure 11.
Proposed mechanism for the generation of spikes in complexes formed by proteinoids and omeprazole. (a) SEM image showing the complex network structure. Schematic representation of the spike generation mechanism, illustrating omeprazole binding sites (red), ion channels (blue), and charge movement (orange arrows). (b) Graph illustrating the temporal evolution of the spike potential.
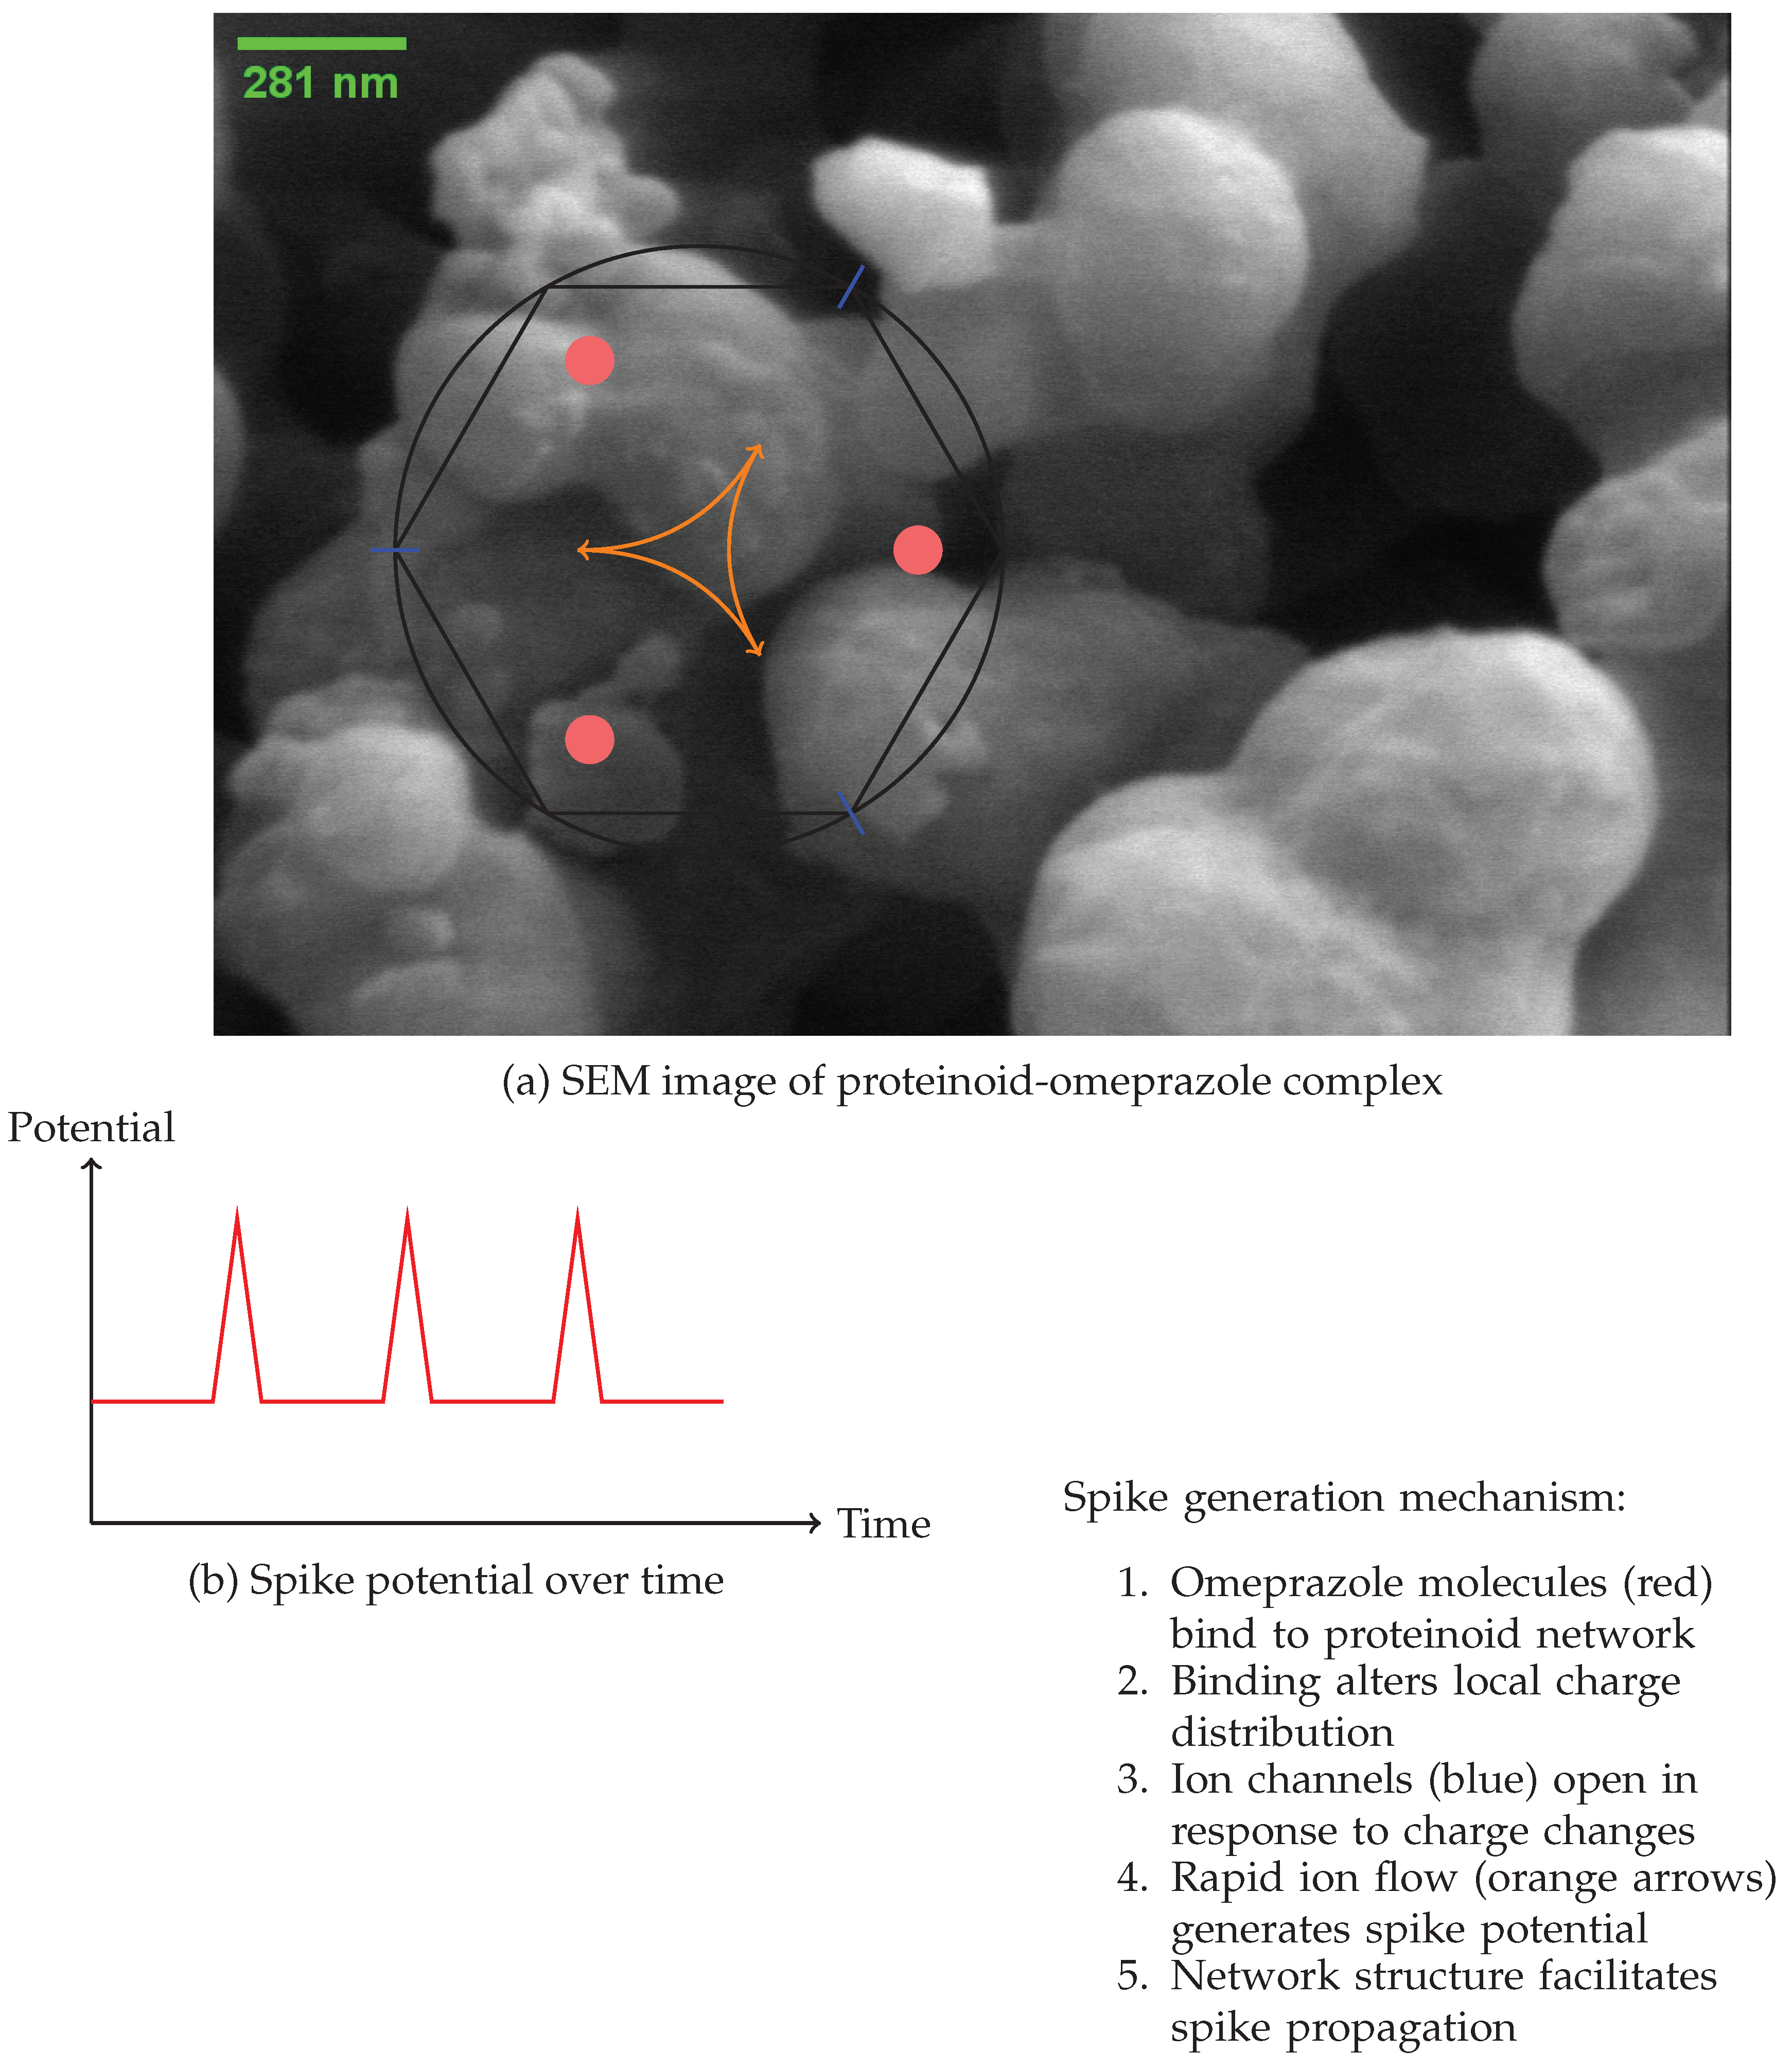

Table 1.
Comparison of Proton Pump Inhibitors
| PPI | Chemical Formula | Half-life (h) | pKa | Reference |
|---|---|---|---|---|
| Omeprazole | C17H19N3O3S | 1.0 | 4.0 | [15] |
| Esomeprazole | C17H19N3O3S | 1.5 | 4.0 | [16,20] |
| Lansoprazole | C16H14F3N3O2S | 1.5 | 4.0 | [17] |
| Pantoprazole | C16H15F2N3O4S | 1.0 | 3.9 | [18] |
| Rabeprazole | C18H21N3O3S | 1.0 | 4.9 | [19] |
Table 2.
Summary of Izhikevich Neuron Input and Omeprazole-Proteinoid Output Characteristics for Accommodation Spiking Model. This table presents key metrics comparing the input signal generated by the Izhikevich neuron model configured for accommodation spiking and the corresponding output from the omeprazole-proteinoid complex. Accommodation spiking is characterized by a gradual increase in interspike intervals in response to sustained stimulation. The significant differences in mean, standard deviation, and range between input and output highlight the complex signal processing occurring within the omeprazole-proteinoid system. Comparative metrics, including correlation coefficient and time lag, provide insights into the temporal relationship between input and output signals. The Kolmogorov-Smirnov test results confirm the statistically significant difference in signal distributions, underscoring the non-linear transformation induced by the omeprazole-proteinoid complex on the accommodation spiking pattern.
Table 2.
Summary of Izhikevich Neuron Input and Omeprazole-Proteinoid Output Characteristics for Accommodation Spiking Model. This table presents key metrics comparing the input signal generated by the Izhikevich neuron model configured for accommodation spiking and the corresponding output from the omeprazole-proteinoid complex. Accommodation spiking is characterized by a gradual increase in interspike intervals in response to sustained stimulation. The significant differences in mean, standard deviation, and range between input and output highlight the complex signal processing occurring within the omeprazole-proteinoid system. Comparative metrics, including correlation coefficient and time lag, provide insights into the temporal relationship between input and output signals. The Kolmogorov-Smirnov test results confirm the statistically significant difference in signal distributions, underscoring the non-linear transformation induced by the omeprazole-proteinoid complex on the accommodation spiking pattern.
| Metric | Input Signal | Omeprazole-Proteinoid Output |
|---|---|---|
| Mean (mV) | 0.60 | |
| Standard Deviation (mV) | 15.30 | 0.43 |
| Maximum (mV) | 72.50 | 3.99 |
| Minimum (mV) | ||
| Comparative Metrics | ||
| Correlation Coefficient | 0.6841 | |
| Root Mean Square Error (mV) | 50.4592 | |
| Maximum Difference (mV) | 71.92 at 1.39 ms | |
| Time Lag (msec) | ||
| Kolmogorov-Smirnov Test | ||
| H-value | 1 (distributions are different) | |
| p-value | < 0.0001 | |
| KS statistic | 0.9709 | |
Table 3.
Comparative analysis of input signal and omeprazole-proteinoid output characteristics under chattering spiking stimulation. The table displays important statistical parameters for the omeprazole-proteinoid sample’s input signal and output response. The results showed that the correlation coefficient between the input and output was 0.79, the time lag was msec, the greatest variance was 75.71 mV (at time ms), and the root mean square error (RMSE) was 59.3 mV. A Kolmogorov-Smirnov test revealed that the input and output signals had significantly different distributions (KS statistic = 0.9717, p < 0.0001). These findings show that the omeprazole-proteinoid sample significantly changed the signal while retaining a moderate correlation with the input patterns.
Table 3.
Comparative analysis of input signal and omeprazole-proteinoid output characteristics under chattering spiking stimulation. The table displays important statistical parameters for the omeprazole-proteinoid sample’s input signal and output response. The results showed that the correlation coefficient between the input and output was 0.79, the time lag was msec, the greatest variance was 75.71 mV (at time ms), and the root mean square error (RMSE) was 59.3 mV. A Kolmogorov-Smirnov test revealed that the input and output signals had significantly different distributions (KS statistic = 0.9717, p < 0.0001). These findings show that the omeprazole-proteinoid sample significantly changed the signal while retaining a moderate correlation with the input patterns.
| Metric | Input Signal | Omeprazole-Proteinoid Output |
|---|---|---|
| Mean (mV) | 0.48 | |
| Standard Deviation (mV) | 19.72 | 0.51 |
| Maximum (mV) | 72.50 | 4.24 |
| Minimum (mV) |
Table 4.
Summary of Izhikevich Neuron Input and Omeprazole-Proteinoid Output Characteristics for Induced Spiking Mode. This table presents a comparison between the input signal generated by the Izhikevich neuron model configured for induced spiking and the corresponding output from the omeprazole-proteinoid complex. The input signal’s wide voltage range ( mV to 72.21 mV) is dramatically compressed in the output ( mV to 3.14 mV), indicating a powerful attenuation effect. The positive mean of the output (0.34 mV) compared to the negative input mean ( mV) suggests a baseline shift in the signal processing. The moderate correlation coefficient (0.6644) implies that while the output preserves some characteristics of the input, substantial non-linear processing occurs. The large time lag of 1590 ms points to complex internal dynamics within the omeprazole-proteinoid complex, possibly involving slow chemical or conformational changes. The high RMSE (62.8671 mV) and maximum difference (71.91 mV) further quantify the extent of signal transformation. The Kolmogorov-Smirnov test results (KS statistic = 0.9844, p < 0.0001) confirm that the input and output signals follow significantly different distributions, underscoring the non-linear nature of the signal processing in the omeprazole-proteinoid system during induced spiking stimulation.
Table 4.
Summary of Izhikevich Neuron Input and Omeprazole-Proteinoid Output Characteristics for Induced Spiking Mode. This table presents a comparison between the input signal generated by the Izhikevich neuron model configured for induced spiking and the corresponding output from the omeprazole-proteinoid complex. The input signal’s wide voltage range ( mV to 72.21 mV) is dramatically compressed in the output ( mV to 3.14 mV), indicating a powerful attenuation effect. The positive mean of the output (0.34 mV) compared to the negative input mean ( mV) suggests a baseline shift in the signal processing. The moderate correlation coefficient (0.6644) implies that while the output preserves some characteristics of the input, substantial non-linear processing occurs. The large time lag of 1590 ms points to complex internal dynamics within the omeprazole-proteinoid complex, possibly involving slow chemical or conformational changes. The high RMSE (62.8671 mV) and maximum difference (71.91 mV) further quantify the extent of signal transformation. The Kolmogorov-Smirnov test results (KS statistic = 0.9844, p < 0.0001) confirm that the input and output signals follow significantly different distributions, underscoring the non-linear nature of the signal processing in the omeprazole-proteinoid system during induced spiking stimulation.
| Metric | Input Signal | Omeprazole-Proteinoid Output |
|---|---|---|
| Mean (mV) | 0.34 | |
| Standard Deviation (mV) | 14.20 | 0.40 |
| Maximum (mV) | 72.21 | 3.14 |
| Minimum (mV) | ||
| Comparative Metrics | ||
| Correlation Coefficient | 0.6644 | |
| Root Mean Square Error (mV) | 62.8671 | |
| Maximum Difference (mV) | 71.91 at 2.00 ms | |
| Time Lag (msec) | 1590 | |
| Kolmogorov-Smirnov Test | ||
| H-value | 1 (distributions are different) | |
| p-value | < 0.0001 | |
| KS statistic | 0.9844 | |
Table 5.
Summary of Phasic Spiking Characteristics in Proteinoid-Omeprazole Complexes. This table presents a detailed comparison between the input signal from the Izhikevich neuron model configured for phasic spiking and the output from the proteinoid-omeprazole complex. The results reveal significant signal transformation by the proteinoid-omeprazole system. The input signal’s wide voltage range ( mV to 62.46 mV) is markedly compressed in the output ( mV to 3.17 mV), demonstrating strong attenuation. The shift from a negative input mean ( mV) to a positive output mean (0.54 mV) suggests a fundamental change in signal characteristics. The reduced standard deviation in the output (0.33 mV vs. 8.23 mV input) indicates a smoothing effect. The low correlation coefficient (0.4503) implies substantial non-linear processing, more pronounced than in other spiking modes. The negative time lag of ms is particularly noteworthy, suggesting anticipatory behaviour in the proteinoid-omeprazole complex. This contrasts with the positive lag observed in induced spiking, highlighting mode-specific processing. The high RMSE (55.9366 mV) and maximum difference (67.00 mV) further quantify the extent of signal transformation. The Kolmogorov-Smirnov test results (KS statistic = 0.9945, p < 0.0001) indicate the most significant distributional difference among all spiking modes studied, emphasizing the unique processing characteristics of the proteinoid-omeprazole system during phasic spiking stimulation.
Table 5.
Summary of Phasic Spiking Characteristics in Proteinoid-Omeprazole Complexes. This table presents a detailed comparison between the input signal from the Izhikevich neuron model configured for phasic spiking and the output from the proteinoid-omeprazole complex. The results reveal significant signal transformation by the proteinoid-omeprazole system. The input signal’s wide voltage range ( mV to 62.46 mV) is markedly compressed in the output ( mV to 3.17 mV), demonstrating strong attenuation. The shift from a negative input mean ( mV) to a positive output mean (0.54 mV) suggests a fundamental change in signal characteristics. The reduced standard deviation in the output (0.33 mV vs. 8.23 mV input) indicates a smoothing effect. The low correlation coefficient (0.4503) implies substantial non-linear processing, more pronounced than in other spiking modes. The negative time lag of ms is particularly noteworthy, suggesting anticipatory behaviour in the proteinoid-omeprazole complex. This contrasts with the positive lag observed in induced spiking, highlighting mode-specific processing. The high RMSE (55.9366 mV) and maximum difference (67.00 mV) further quantify the extent of signal transformation. The Kolmogorov-Smirnov test results (KS statistic = 0.9945, p < 0.0001) indicate the most significant distributional difference among all spiking modes studied, emphasizing the unique processing characteristics of the proteinoid-omeprazole system during phasic spiking stimulation.
| Metric | Input Signal | Proteinoid-Omeprazole Output |
|---|---|---|
| Mean (mV) | 0.54 | |
| Standard Deviation (mV) | 8.23 | 0.33 |
| Maximum (mV) | 62.46 | 3.17 |
| Minimum (mV) | ||
| Comparative Metrics | ||
| Correlation Coefficient | 0.4503 | |
| Root Mean Square Error (mV) | 55.9366 | |
| Maximum Difference (mV) | 67.00 at 2.00 ms | |
| Time Lag (msec) | ||
| Kolmogorov-Smirnov Test | ||
| H-value | 1 (distributions are different) | |
| p-value | < 0.0001 | |
| KS statistic | 0.9945 | |
Table 6.
Summary of Tonic Spiking Characteristics in Omeprazole-Proteinoid Complexes. This table presents an analysis of the input signal from the Izhikevich neuron model configured for tonic spiking and the corresponding output from the omeprazole-proteinoid complex. The results reveal significant and unique signal processing by the omeprazole-proteinoid system under tonic stimulation. The input signal’s broad voltage range ( mV to 62.17 mV) is substantially compressed in the output ( mV to 3.63 mV), demonstrating potent signal attenuation. Notably, the mean potential shifts from a negative input ( mV) to a positive output (0.80 mV), the highest positive shift observed among all spiking modes, suggesting a robust baseline alteration in signal characteristics. The dramatic reduction in standard deviation (from 20.55 mV to 0.48 mV) indicates a strong smoothing effect, potentially filtering out high-frequency components of the input signal. The correlation coefficient (0.6823) is higher than in phasic mode but comparable to induced mode, implying a more linear relationship between input and output while still preserving significant non-linear processing. The negative time lag of ms is the largest among all modes, suggesting a highly pronounced anticipatory behaviour in the omeprazole-proteinoid complex under tonic stimulation. This could indicate the development of a strong predictive response mechanism during sustained, regular input. The root mean square error (43.2821 mV) is the lowest among all modes, suggesting that tonic spiking may induce the most consistent and predictable response in the complex. The Kolmogorov-Smirnov test results (KS statistic = 0.9276, p < 0.0001), while still indicating significantly different distributions, show the lowest KS statistic among all modes. This suggests that the output distribution in tonic mode, while distinct, may be closer to the input distribution compared to other spiking patterns.
Table 6.
Summary of Tonic Spiking Characteristics in Omeprazole-Proteinoid Complexes. This table presents an analysis of the input signal from the Izhikevich neuron model configured for tonic spiking and the corresponding output from the omeprazole-proteinoid complex. The results reveal significant and unique signal processing by the omeprazole-proteinoid system under tonic stimulation. The input signal’s broad voltage range ( mV to 62.17 mV) is substantially compressed in the output ( mV to 3.63 mV), demonstrating potent signal attenuation. Notably, the mean potential shifts from a negative input ( mV) to a positive output (0.80 mV), the highest positive shift observed among all spiking modes, suggesting a robust baseline alteration in signal characteristics. The dramatic reduction in standard deviation (from 20.55 mV to 0.48 mV) indicates a strong smoothing effect, potentially filtering out high-frequency components of the input signal. The correlation coefficient (0.6823) is higher than in phasic mode but comparable to induced mode, implying a more linear relationship between input and output while still preserving significant non-linear processing. The negative time lag of ms is the largest among all modes, suggesting a highly pronounced anticipatory behaviour in the omeprazole-proteinoid complex under tonic stimulation. This could indicate the development of a strong predictive response mechanism during sustained, regular input. The root mean square error (43.2821 mV) is the lowest among all modes, suggesting that tonic spiking may induce the most consistent and predictable response in the complex. The Kolmogorov-Smirnov test results (KS statistic = 0.9276, p < 0.0001), while still indicating significantly different distributions, show the lowest KS statistic among all modes. This suggests that the output distribution in tonic mode, while distinct, may be closer to the input distribution compared to other spiking patterns.
| Metric | Input Signal | Omeprazole-Proteinoid Output |
|---|---|---|
| Mean (mV) | 0.80 | |
| Standard Deviation (mV) | 20.55 | 0.48 |
| Maximum (mV) | 62.17 | 3.63 |
| Minimum (mV) | ||
| Comparative Metrics | ||
| Correlation Coefficient | 0.6823 | |
| Root Mean Square Error (mV) | 43.2821 | |
| Maximum Difference (mV) | 62.11 at 0.56 ms | |
| Time Lag (msec) | ||
| Kolmogorov-Smirnov Test | ||
| H-value | 1 (distributions are different) | |
| p-value | < 0.0001 | |
| KS statistic | 0.9276 | |
Disclaimer/Publisher’s Note: The statements, opinions and data contained in all publications are solely those of the individual author(s) and contributor(s) and not of MDPI and/or the editor(s). MDPI and/or the editor(s) disclaim responsibility for any injury to people or property resulting from any ideas, methods, instructions or products referred to in the content. |
© 2024 by the authors. Licensee MDPI, Basel, Switzerland. This article is an open access article distributed under the terms and conditions of the Creative Commons Attribution (CC BY) license (http://creativecommons.org/licenses/by/4.0/).
Copyright: This open access article is published under a Creative Commons CC BY 4.0 license, which permit the free download, distribution, and reuse, provided that the author and preprint are cited in any reuse.


