
Submitted:
02 August 2024
Posted:
06 August 2024
You are already at the latest version
Abstract
A sustainable low cost activated carbon substitute was produced based on pretreated lignocellulosic biomass, especially spruce sawdust. A harmful liquid waste, desalination brine was used for the treatment of a solid wood industry waste, spruce sawdust. This approach is in the circular economy theory and aims to the decarbonization of the economy. The pretreated sawdust was tested as an adsorbent appropriate for the removal of a commonly used pollutant, methylene blue, from industrial wastewater. The adsorption capacity of the pretreated material was found to increased four times comparing to the untreated one in the case that the Freundlich equation was fitted to the isotherms’ data. The treatment experimental conditions with desalination brine that gave maximum adsorption capacity correspond to 1.97 combined severity factor in logarithmic form value. The same adsorption capacity was found to increase five to six times comparing to the untreated spruce sawdust in the case that the Langmuir isotherm model was applied at the same data. Moreover, kinetic experiment was cried out as regards the methylene blue adsorption process. The desalination brine pretreated sawdust adsorption capacity increased 1.4 times comparing to the untreated one, in the case of the Lagergren kinetic equation fitting. Furthermore, the adsorption capacity of the same material was increased 1.6 times when the second order kinetic model was applied to the same data. Industrial scale applications can be based on the kinetic data findings as they have to do with a very shorter adsorption period comparing to the isotherm data.
Keywords:
methylene blue
; adsorption
; spruce
; pretreatment
; brine
1. Introduction
New ecofriendly technologies and renewable sustainable materials for wastewater treatment are necessary, among them, adsorption is low-cost procedure. New adsorbents can be developed, based on highly available lignocellulosic biomass, composed of lignin, cellulose, and hemicelluloses, appropriate to adsorb dyes from wastewater [1,2]. Lignocellulosic biomass can be pretreated to produce low-cost, environmentally friendly, efficient and reusable adsorption materials [3]. Moreover, lignin makes up to 10–25% of lignocellulosic biomass and is appropriate to remove dyes from wastewater effluents utilizing green techniques [4]. Numerous methods have been investigated for the removal of dyes from wastewater, including biological, chemical, and physical treatments [5]. Biological approaches use algae, bacteria, fungi, and isolated enzymes, operate under aerobic or anaerobic conditions, and they are cost-effective and non-toxic. On the other hand, they require specific environmental conditions for microbial growth [6].
Chemical procedures encompass processes such as oxidation, electrochemical destruction and chemisorption. They are generally more effective comparing to the biological methods, but they necessitate specific equipment and chemical reagents while they usually produce other harmful pollutants [7]. Physical methods, like physisorption, coagulation, screening, irradiation, membrane technologies and ion exchange, are often employed prior to biological and chemical treatments due to their simplicity and efficiency. They use minimal additional chemicals, are easy to regenerate, and demonstrate high dye removal efficiency [8]. Physisorption is generally reversible and non-selective because is depending on weak interactions such as dipole-dipole interactions, polar inter-actions, hydrogen bonding and van der Waals forces. In contrast, chemisorption is usually irreversible and selective, depending on the formation of strong ionic bonds [9]. Among these techniques, adsorption, particularly physisorption, has easier operation, lower energy requirements, higher efficiency and higher resistance to toxic substances. It can adsorb most of the dyes and generates no polluting substances [10].
Numerous adsorbents have been extensively studied for dye removal, including metal–organic frameworks [11], polymeric materials [12], clay-organic composites [13] and various carbon materials [14]. Methylene blue (MB), a dye used in the paper, textile, and leather industries, is an organic dye with a complex molecular structure. Its release into the environment poses both aesthetic and toxicological issues due to its synthetic nature, complex aromatic structure, and resistance to biodegradation [15,16,17]. Among advanced antipollution methods, adsorption is the most common, low cost, simple design, and environmentally friendly. Adsorption involves the attachment of the adsorbate-adsorbent. The effectiveness of method depends on the precursor materials and the adsorbent development. The adsorbents quality depends on their specific surface area, surface morphology, porosity, composition, multifunctional groups, and structural stability [18,19]. However, developing an ideal adsorbent capable of removal of multiple polluting substances for wastewater continues to be a substantial challenge [20].
Saline wastewater also known as desalination brine from salt lakes and industrial activities has negative environmental impact. Brine from seawater desalination plants is a major environmental threat and the efforts are focused to discharge zero liquid from such installations and furthermore to reuse brine and brine components [21]. Concentrated seawater desalination, like common seawater desalination is expected to be more favorable in recent decades [22]. Brine treatment and valorization could decrease brine wastewater and increase the regain of pure water, salts, and energy. Minimal/zero liquid discharge desalination systems are developed rot this purpose. Novel techniques like membrane distillation and forward osmosis are favorable for brine of high salinity treatment with high recovery rates [23]. Thermal and membrane treatment technologies for desalination brine, can lead to the discharge of nearly zero liquid [24]. To begin a sustainable, decarbonized (CO2-free) circular economy, brine valorization is necessary [25]. The development of the desalination industry and the increasing need for brine management strategies can make the adsorption a new brine management strategy [26].
In the present work we focused on the production of an efficient ecological adsorbent based on spruce sawdust modification (lignocellulosic biomass) to be used as an inexpensive activated carbon alternative. The process under investigation was the pretreatment of spruce sawdust, in a batch reactor with a harmful liquid waste, i.e., desalination brine. This approach was in accordance with the zero-waste circular economy theory, i.e. use a waste (desalination brine) to pretreat another waste (spruce sawdust) and then use the pretreated waste to clean a third waste (dye, e.g. methylene blue). Specifically, the solid residue of the sawdust treated with brine, was utilized as an adsorbent to eliminate MB, a widely used basic dye, from wastewater. Brine pretreatment of spruce sawdust was performed in a 4-L batch reactor. Brine was prepared as simulated seawater according to international standards. The sawdust pretreatment time was 0, 25 and 50 min (these values refer to isothermal period, the preheating and the cooling periods which are non-isothermal should be considered). The temperature values of reaction’s isothermal period were 160, 200 and 240°C. The produced low-cost solid residue, i.e., modified sawdust, was used as adsorbent. The removal of MB, as a pollutant representative for basic dyes, via adsorption process from simulated wastewater was investigated. Freundlich, Langmuir and Sips isotherm equations were fitted to the adsorption isotherm’s experiments. Lagergren (1st order), 2nd order and intraparticle diffusion kinetic models were fitted to the adsorption kinetics’ experimental data. The novelty of this research is the application of a harmful liquid waste (desalination brine) for the sawdust (a solid residue) pretreatment.
2. Materials and Methods
2.1. Material Development
A local wood manufacturing company provided as with the spruce sawdust with humidity 9% w/w. Material with particle sizes 0.2 - 1 mm was separated by screening. Spruce sawdust was 44.2% cellulose, 24.8% hemicelluloses (14.6% manan, 6.2% xylan, 2.6% galactan and 1.4% arabinan), 28.2% acid-insoluble lignin (Klason), 0.2% ash, and 2.6% extractives etc. (% w/w on a dry basis). These experimental values are like those presented at all scientific and technical sources as regards spruce wood/sawdust.
Desalination brine was initially prepared as simulated seawater according to the ASTM D 1141 – 98(2021) [27] Simulated seawater consists of the followings: 24.53 g L-1 NaCl, 5.2 g L-1 MgCl2, 4.09 g L-1 Na2SO4, 1.16 g L-1 CaCl2, 0.695 g L-1 KCl, 0.201 g L-1 NaHCO3, 0.101 g L-1 KBr, 0.027 g L-1 H3BO3, 0.025 g L-1 SrCl2, and 0.003 g L-1 NaF. The concentrated brine solutions were prepared by increasing x1, x4 and x7 times the above concentrations. The simulated desalination brine wastewater is referred below by giving only the concentration of NaCl, due to simplicity.
2.2. Sawdust-Brine Treatment Process
A 4-L PARR batch reactor (autoclave) was used for the spruce sawdust with brine treatment process (see Figure 1). The isothermal sawdust-brine treatment time was 0, 25 and 50 min (to these values must be added preheating and the cooling periods which are non-isothermal). Brine and organic acids produced from the spruce sawdust through the treatment acted as catalysts. The brine solution volume in the autoclave was 1000 mL, and the sawdust quantity was 100 g, resulting to a liquid-to-solid ratio equal to 10:1. The stirring speed was 100 rpm. The temperature was 160°, 200°C and 240°C and corresponds to the isothermal period’s temperature. The liquid phase was separated from the solid phase at the end of the reaction by filtering with Munktell paper sheet (grade 34/N) in a Buchner filter. Then the solid phase was water washed to achieve neutral pH and dried at 110 oC for 24 h to achieve the humidity of the untreated sawdust. Then this solid was used as the adsorbent in the isotherm and the kinetic experiments with methylene blue.
2.3. Adsorbate
MB provided by Merck (CI 52015: C16H18ClN3S.xH2O x=2-3, molecular weight=319.86 10-3 kg mol-1 anhydrous) was used as adsorbate in the adsorption isotherm and kinetic experiments. MB solutions concentration was measured by a HACH DR4000U UV-VIS spectrophotometer at λ=664 nm. The solutions pH was near to 8.0 during the adsorption experiments.
2.4. Adsorption Isotherms Studies
Discrete batch experiments were carried for the estimation of the adsorption isotherms. The adsorbate solution was V = 0.5 L, the adsorbent was 0.5 g and each experiment was carried in 1 L bottles at 23 oC and pH=8. The initial MB concentration was C0 = 1.6 - 156 mg L-1. The experimental system was mechanically stirred at 600 rpm for seven days, time necessary to ensure that almost equilibrium conditions are done. After this, a 0.1 mm nylon filter was used to separate solid from the liquid phase, i.e., the spruce sawdust adsorbent from the MB solution. Solution concentration of each bottle was measured to represent one point of each adsorption isotherm.
2.5. Kinetics of Adsorption
Adsorption kinetic experiments performed in a 2-L glass reactor with stirring at 600 rpm. The aqueous phase volume was V = 1 L and the adsorbent mass was m = 1 g. The experiments took place at 23 o C. The initial MB concentration was C0 = 12 mg L-1. Samples of 10 mL were taken from the aqueous phase every 5 min, using a pipette. A 0.1 mm nylon filter was used to separate solid phase (sawdust) from the liquid phase (MB).
2.6. Experimental Design
Box- Behnken design, was utilized, to determine the combinations of the pretreatment variables (temperature, time and brine concentration) [28]. This method requires a relatively small number of experiments comparing to other common experimental or optimization methods [29,30]. Quantum XL (SigmaZone) software was used for the planning of the experiments. This planning is presented in Table 1.
2.7. Combined Severity Factor
The pretreatment time, temperature, and brine concentration effects into a single variable were incorporated into a combined severity factor (CSF), based on the introduced by Brasch and Free [31] 1965, P-factor, for the case of the lignocellulosic biomass isothermal prehydrolysis and Kraft pulping. Later, this factor was applied by Overend and Chornet [32] in the case of fractionation of lignocellulosics and called ‘reaction ordinate’. The P-factor was:
where t is the time (in min) and T is the temperature in oC.
P-factor = t.exp[(T-100)/14.75]
Chum et al. [33] and Abatzoglou et al. [34] incorporated pH of the acidic or alkaline liquid phase effect as follows:
R’0=10-pH.t.exp[(T-100)/14.75]
Various isothermal pretreatments can be simulated using the CSF. Lloyd and Wyman [35], used CSF to simulate dilute-acid pretreatment, in the case of softwood and corn stover feedstock. Kabel et al. [36] used CSF to simulate wheat straw pretreatment.
In the case of desalination brine pretreatment of spruce sawdust, we will use the CSF similarly as in other non-isothermal pretreatment cases [37,38,39], as follows:
where pH refers to the liquor after the desalination brine pretreatment. Equation (3) is different than equation (2), because is expressing the variation of the pretreatment temperature over time, considering not only the isothermal period (as usual), but also the non-isothermal preheating and cooling periods.
2.8. Other Analytical Techniques
The quantitative saccharification method [40] was applied to all pretreated and untreated spruce sawdust samples to analyze the formed liquid phase for glucose, mannose, xylose and arabinose. For this analysis, HPLC, Agilent 1200 equipped with Aminex HPX-87H Column, refractive index detector and 5 mM H2SO4 in water as the mobile phase, was used according to the high-performance liquid chromatography method. According to the quantitative saccharification method, glucan was produced from cellulose, and mannan, xylan and arabinan was produced from the hemicelluloses. Tappi T222 (2002) method “Acid insoluble lignin in wood and pulp” was applied for the determination of the acid-insoluble lignin (Klason lignin) of all pretreated and untreated spruce sawdust samples. A MultiLab model 540 digital pH meter was utilized for the pH measurements.
Brunauer, Emmett and Teller (BET) method [41], assumes that gas adsorption assesses the surface area of all materials with accessible porosity, depending on the chosen adsorptive. The ISO 9277:2022 “Determination of the specific surface area of solids by gas adsorption - BET method” was applied herein using liquid nitrogen (N2) at 77 K using a Micrometrics, Model Tristar II 3030 Plus Kr. BET multi-point equation for the N2 adsorption-desorption isotherm was fitted to the experimental points to predict the specific surface area of the spruce sawdust untreated and pretreated samples, dried by freeze-drying for 1 h before testing.
The scanning electron microscopy (SEM) examination of the untreated and pretreated spruce sawdust samples was performed using an FEI INSPECT SEM equipped with an EDAX super ultra-thin window analyzer for energy dispersive X-ray spectroscopy (EDS) at the Institute of Materials Science of the National Center for Scientific Research ‘Demokritos’.
Fourier transform infrared (FTIR) spectra of the untreated and pretreated spruce sawdust samples was performed using a spectroscope (MAGNA-IR 750 Spectrometer, Series II, Nicolet) at the Institute of Materials Science of the National Center for Scientific Research ‘Demokritos’. Diffuse reflectance sampling technique was used herein scanning for wavenumber 650–3500 cm−1 the powder sawdust samples.
Powder X-ray diffraction (XRD) patterns of the untreated and the pretreated spruce sawdust samples were determined using a Bruker Model D2 Phaser diffractometer with Ni-filtered Cu Kα radiation (λ = 1.54056 Å), working in θ–2θ geometry, 30 kV / 10 mA, continuous scan mode, using a Plexiglas-based sample holder at room temperature. The scan range was 2θ=5-70. Cellulose crystallinity index (CrI) of the was estimated by the equation CrI=(I200-Ia)/I200, where I₂₀₀ was the cellulose total intensity peak at 2θ=22.40, and Iₐ was the amorphous cellulose intensity peak at 2θ=18.50 [42,43].
3. Results and Discussion
3.1. Severity Factor and Combined Severity Factor Calculations
The profile of the temperature of some of the spruce sawdust desalination brine pretreatment experiments in the autoclave is given in Figure 2, while the corresponding pressure profile is given in Figure 3, as a function of the time of the spruce sawdust desalination brine treatment batch experiments. In Figure 2 is obvious the separation of the reaction time to (i) preheating period, (ii) isothermal period and (iii) cooling period.
In Table 2 are given the estimated values for spruce sawdust desalination brine pretreatment experiments as regards the Severity Factor R0, calculated according to equation (3) without the factor 10-pH, the Combined Severity Factor R0* calculated according to equation (3) and the logarithm of the Combined Severity Factor logR0*.
The resulting spruce sawdust desalination brine pretreatment liquid phase pH values are presented in Figure 4 vs. the logarithm of the combined severity factor which was presented in Table 2.
Spruce brine pretreatment’s solid residue yield (SRY) values are given in Figure 5 vs. the logarithm of the combined severity factor. Moreover, the corresponding BET values of these solid samples are shown in Figure 6 also vs. the combined severity factor logarithm. BET increases 10.2 times, i.e., from 0.703 m2/g for the untreated spruce sawdust to 7.19 m2/g for the pretreated material with CSF logR0*=1,808. At the same severity pretreatment conditions SRY reduces from 100% w/w (untreated spruce sawdust) to 39.8% w/w (pretreated material).
3.2. Adsorption Isotherms
The isotherm models that analyzed are three: Freundlich [44], Langmuir [45] Sips [46]. The are widely applied to fit the experimental data of the dye’s adsorption on activated carbons and untreated and pretreated lignocellulosic materials.
The Freundlich isotherm [44] can be expressed as follows:
where q is the adsorbed amount per adsorbent mass unit (mg g1), Ce is the adsorbate equilibrium concentration (mg L-1) and KF [(mg g-1)(L mg-1)1/n], n are constants related to adsorption capacity and adsorption intensity, respectively. Equation (4) in logarithmic form is formed as follows:
Linear and non-linear regression analysis (NLRA) was applied to calculate the KF and n parameter values by simulating the MB adsorption experimental data.
The standard error of estimates (SEE) was determined as follows:
where: yi is the depended variable experimental value, yi,theor is the theoretical value of the depended variable, n’ is the experimental points number, p’ is the parameters number, and (n’ – p’) are the degrees of freedom.
The Freundlich isotherm model fitting on MB adsorption on untreated and pretreated (240 oC, 25 min, 178,71 mg/L NaCl) spruce sawdust is presented in Figure 7 as (a) logq vs. logCe and (b) q vs. Ce. The pretreatment was with brine concentrated seven times comparing to the simulated seawater.
Langmuir isotherm model [45] refers to the ‘pseudo-monolayer’ adsorption theory and is formed as follows:
or
where KL is the related to the adsorption energy constant (L mg-1) and qm is the saturation adsorbed dye amount (mg g-1). These parameters can be assessed by plotting 1/q versus 1/Ce or by NLRA. In this case a dimensionless constant called ‘equilibrium parameter’ or ‘separation factor’ RL, can be formed by the following equation:
where C0 is the initial dye concentration (mg L-1) and KL is the Langmuir constant in L mg-1. Moreover, RL > 1 means unfavorable adsorption, RL = 1 means linear adsorption, 0 < RL < 1 means favorable adsorption, and RL = 0 means irreversible adsorption.
In Figure 8 is presented the Langmuir isotherm equation fitting for MB adsorption on untreated and pretreated (240 oC, 25 min, 178,71 mg/L NaCl) spruce sawdust, as (a) 1/q vs. 1/Ce and (b) q vs. Ce. The pretreatment was achieved with brine concentrated seven times comparing to the simulated seawater, i.e., with 178.71 mg/L NaCl and other salts.
Sips isotherm model, also called Langmuir – Freundlich isotherm equation [46], can be stated as follows:
where KL, qm are the Langmuir constants and n is the Freundlich constant. NLRA was applied to determine these parameters.
In Figure 9 is presented the Sips isotherm model for MB adsorption on pretreated (240 oC, 25 min, 178.71 mg/L NaCl) and untreated spruce sawdust. The desalination brine solution was concentrated seven times compared to the simulated seawater.
The Freundlich isotherm model’s capacity KF parameter is presented in Figure 10 vs. the logarithm of the combined severity factor. According to the capacity parameter KF value for brine pretreated material (240 oC, 25 min, 178.71 mg/L NaCl) an increase was noticed up to 14.8 (mg g-1)(L mg-1)1/n, comparing to that of the untreated spruce sawdust, which was 3.8 (mg g-1)(L mg-1)1/n.
Capacity KF parameter increased approximately four times and the corresponding combined severity factor (in logarithmic form) logRo* was equal to 1.964 provided the theoretically maximum capacity parameter KF value. Moreover, the intensity n parameter of the Freundlich isotherm model is shown in Figure 11 vs. the logarithm of the combined severity factor. Parameter n deceasing means increasing of the power of this equation 1/n, and consequently improvement of the adsorptivity of the desalination brine modified spruce sawdust.
3.3. Kinetics of Adsorption
The most widely used kinetic models for dyes adsorption on lignocellulosics are: Lagergren’ s model or 1st order kinetic model [47], 2nd order kinetic model [48] and Intraparticle diffusion kinetic model [49].
The Lagergren equation [47] is as follows:
where q is the amount of MB adsorbed per unit mass of the adsorbent (in mg g-1) at equilibrium time (t→∞) and qt is the amounts of MB adsorbed per unit mass of the adsorbent at random adsorption time t. Parameter k is the adsorption pseudo-first order rate constant. Additionally
and
where C is the concentration of MB in the bulk solution at time t, C0 is the concentration of MB in the solution at zero time, and Ce is the concentrations of MB in the solution at ∞ time. The mass of the adsorbent (in g) is m is and the solution volume (in mL) is V. The logarithmic form of equation (13) is:
The intra-particle diffusion model [49] can be formed as follows:
where qt the amount of MB adsorbed at time t, c an empirical parameter (mg g-1) and kp the intra-particle diffusion rate constant in mg g-1 min-0.5
Pretreated and untreated sawdust first order adsorption kinetics for the is presented in Figure 12. The adsorption kinetic rate parameter k of the Lagergren (first order) kinetic model for MB adsorption on treated and untreated spruce sawdust vs. the logarithm of the combined severity factor presented in Figure 13.
Lagergren (first order) kinetic model capacity parameter qe for MB adsorption on pretreated and untreated spruce sawdust vs. the logarithm of the combined severity factor is shown in Figure 14. Second order kinetics are given in Figure 15 for MB adsorption on pretreated and untreated spruce sawdust.
Intra-particle diffusion model shown in Figure 16 confirms the existence of intra-particle diffusion. This means a multistage adsorption including mass transfer of adsorbate molecules to the adsorbent external surface, then, mass transfer to the internal adsorbent surface, and finally adsorbate molecules sorption on the adsorbent active sites [46].
SEE-values for the 2nd order model were decreased compared to those of the first-order kinetic model and the intra-particle diffusion model. This fact indicates the better fitting of the second-order kinetic equation to the adsorption of MB on untreated and pretreated spruce sawdust.
Intraparticle diffusion model can find the rate that determines the diffusion mechanism. Equation (17) expresses the Webber’s pore diffusion model. Intraparticle diffusion was the rate limiting step because q versus t0.5 was linear, but the intercept c was not equal to zero. This means that film diffusion along with intraparticle diffusion probably is present. According to Figure 16, two steps define the adsorption. Probably the first part of the line relates to film diffusion while the second part relates to inside adsorbent diffusion. External mass transfer relates to the first part of the line while intraparticle diffusion or pore diffusion relates to the second part [50,51].
Adsorption is an appropriate technique for elimination of dyes from wastewater, and cleaning of polluted wastewater groundwater and surface water [52]. Forest or agricultural waste-based sorbents, like desalination brine pretreated spruce sawdust have increased adsorption capacities, especially in the case of dyes. These sorbents have analogous adsorption capacities to the conventional commercial adsorbents like activated carbon. The pretreatment improves the dyes adsorption capacity. Nevertheless, there are still research to be done for novel, cost-effective multi-function adsorbents before to replace the traditional adsorbents [53]. Adsorbents like desalination brine pretreated spruce sawdust can be proved low cost with high efficiency, regeneration capability, and low environmental impact.
3.4. SEM, FTIR and XRD of Untreated and Modified Spruce Sawdust
Untreated spruce sawdust SEM micrographs are shown in Figure 17 while Figure 18 shows those of the pretreated one using desalination brine containing 178,71 g L-1 NaCl etc. at 200 oC for 50min, with magnification (a) 750 ×, (b) 7500 × and (c) 30,000 ×. The greater roughness of the surface of the pretreated sawdust compared to the untreated spruce is more obvious at 30,000 × magnification. The roughness of the brine treated material surface facilitates the adsorption of MB resulting in enhanced up to four times capacity values KF. According to the literature, numerous other physical and chemical pretreatments affect significantly the lignocellulosic materials walls. The spruce sawdust surface is smooth and compacted before pretreatment but afterwards is loosed, separated and broken. The present results support previous reports that pretreatment techniques have a considerable impact on the structural configuration of the lignocellulosic materials [54]. The morphological changes in the cell wall structure of untreated and pretreated sawdust are clearly demonstrated in the SEM images. Lignin coating over cellulose and hemicellulose fibers makes the surface formation of untreated sawdust smooth, compact, rigid, and highly ordered. Lignin and hemicelluloses degradation disrupts the cell surface [55]. Untreated spruce sawdust exhibits a complex structure with highly fibrillar morphology of strongly clustered wood fragments. Rougher, irregular and more porous particles were produced due to the pretreatment [56].
In Figure 19 is presented the FTIR spectra of untreated and pretreated spruce sawdust while in Table 3 are given the corresponding peaks of these FTIR spectra and their assignment as regards untreated and pretreated spruce sawdust. It can be mentioned that the peak at wavenumber 3465 cm−1 of the untreated spruce, allocated to O-H stretching of bonded hydroxyl groups, decreased by 115 units due to cellulose/hemicellulose/lignin changes during the desalination brine pretreatment process. On the other hand, the peat at 2910 cm−1 of the untreated spruce, allocated to symmetric aromatic methoxyl groups and in methyl and methylene groups of side chains C-H stretching, increased by 30 units due to the lignocellulosic complex changes during pretreatment. Hemicellulose decomposition during pretreatment is responsible is responsible for the decrease of the peak at 1735 cm-1, assigned to C=O stretching in unconjugated xylans, to 1710 cm-1. Moreover, structural changes in lignin explain the increase of the peak at 1435 cm-1, appointed to C-H deformation in methyl and methylene, by 22 units. The peak at 1335 cm-1 decreases by 21 units and is assigned to spruce cellulose, hemicellulose and lignin C5 substituted aromatic units C-O stretching and CH2 wagging. In addition, the peak at 1042 cm-1 increased by 17 units and is assigned to the lignocellulosic matrix C-OH stretching vibration and C-O deformation. Finaly, the 902 cm-1 peak allocated to C-O-C stretching decreased 35 units due to cellulose/hemicelluloses degradation, while the 805 cm-1 peak assigned to C-H aromatic out of plane bending, increased by 47 units due to the lignin structure modification during the pretreatment with brine. These findings are comparable to FTIR analysis findings by numerus researchers regarding chemical changes in wood induced by various pretreatments [57,58,59].
In Figure 20 are shown the XRD patterns of untreated and pretreated spruce sawdust. The pretreatment was using desalination brine (containing 178,71 g L-1 NaCl etc.) at 200 oC for 50min. The XRD pattern peaks were noticed at 2θ of approximately 22.4° for crystalline cellulose and 18.5°for amorphous cellulose. The effect on the crystallinity of desalination brine pretreated spruce sawdust was expressed by the crystallinity index CrI who increased from 44% from the untreated sawdust to 58% for the above-mentioned pretreated material. I general, the pretreated materials had CrI increasing from 44% to 58% due to the resistance of the crystalline fraction to the brine pretreatment as is presented in Figure 21. XRD examines the microstructure of cellulose in the material, by diffracting and forming graphic patterns in crystalline cellulose. Lignocellulosic materials are composed crystalline (cellulose) and non-crystalline or amorphous (hemicellulose and lignin) structures. The principal peak was detected at approximately 22.40° for 2θ. The cellulose crystallinity of the lignocellulosic materials can be affected by the various pretreatment methods used [54,55,60,61].
4. Conclusions
The novelty of this research is to use a harmful waste, i.e., desalination brine, for spruce sawdust pretreatment to produce an ecofriendly adsorbate. BET, SEM, FTIR and XRD techniques were applied to investigate the structure of the novel material. According to the Freundlich isotherm model the capacity parameter KF for desalination brine pretreated material (240 oC, 25 min, containing 178,71 g L-1 NaCl etc.) increased up to 14.8 (mg g-1)(L mg-1)1/n, comparing to that of untreated spruce sawdust, which was 3.8 (mg g-1)(L mg-1)1/n, i.e., increased approximately four times. The experimental conditions corresponding to combined severity factor in logarithmic form logRo* equal to 1.964, provided the theoretically maximum capacity parameter KF value. Langmuir isotherm capacity qm for pretreated material (240 oC, 25 min, containing 178,71 g L-1 NaCl etc.) increased up to 142.4 mg g-1 comparing to that of the untreated spruce sawdust, which was 26.0 mg g-1, i.e., increased approximately 5.5 times. Lagergren kinetic capacity parameter qe for pretreated material (200 oC, 25 min, containing 98.12 g L-1 NaCl etc.) increased up to 8.8 mg g-1 comparing to that of the untreated spruce sawdust, which was 6.3 mg g-1, i.e., increased approximately 140%. Adsorption capacity of pretreated spruce sawdust increased 1,6 times according to the second order kinetic model simulation. The conditions corresponding combined severity factor in logarithmic form logRo* equal to -1.049 provided the theoretically maximum capacity parameter qe value. Industrial scale applications can preferably be based on the kinetic data findings because they refer to less than 200 min adsorption period comparing to the isotherms which are concerning to seven days adsorption period. According to these findings autoclave desalination brine pretreated spruce sawdust is an environmentally friendly low cost activated carbon substitute produced within the circular economy approach.
Author Contributions
Conceptualization, D.P. and D.S.; methodology, D.P.; software, D.P. and E.S.; validation, D.P. and D.S.; formal analysis, D.P.; investigation, D.P.; resources, E.S.; writing—original draft preparation, D.P. and D.S.; writing—review and editing, D.P. and D.S.; visualization, D.P. and E.S.; supervision, D.S. All authors have read and agreed to the published version of the manuscript.
Funding
This research received no external funding.
Institutional Review Board Statement
The study did not require ethical approval. Not applicable for studies not involving humans or animals.
Informed Consent Statement
Not applicable. for studies not involving humans.
Data Availability Statement
Data will be available on demand.
Acknowledgments
This work has been partly supported by the University of Piraeus Research Center.
Conflicts of Interest
The authors declare no conflicts of interest.
References
- Roa, K.; Oyarce, E.; Boulett, A.; ALSamman, M.; Oyarzún, D.; Del, G.; Pizarro, C.; Sánchez, J. Lignocellulose-based materials and their application in the removal of dyes from water: A review. Sustain Mater Techno 2021, 29, e00320. [Google Scholar] [CrossRef]
- Dehghani, H.; Ahmadi, S.; Ghosh, S.; Othmani, A.; Osagie, C.; Meskini, M.; AlKafaas, S.S.; Malloum, A.; Khanday, W.A.; Oluwaseun Jacob, A.; Gökkuş, O.; Oroke, A.; Chineme, O.M.; Karri, R.R.; Lima, E.C. Recent advances on sustainable adsorbents for the remediation of noxious pollutants from water and wastewater: A critical review. Arab. J. Chem. 2023, 16, 105303. [Google Scholar] [CrossRef]
- Mujtaba, M.; Fraceto, L.F.; Fazeli, M.; Mukherjee, S.; Savassa, S.M.; Araujo de Medeiros, G.; Pereira, A.E.S.; Mancini, S.D.; Lipponen, J.; Vilaplana, F. Lignocellulosic biomass from agricultural waste to the circular economy: a review with focus on biofuels, biocomposites and bioplastics. J. Clean. Prod. 2023, 402, 136815. [Google Scholar] [CrossRef]
- Vedula, S.S.; Yadav, G.D. Wastewater treatment containing methylene blue dye as pollutant using adsorption by chitosan lignin membrane: Development of membrane, characterization and kinetics of adsorption. J. India Chem Soc 2021, 100263. [Google Scholar] [CrossRef]
- Bal, G.; Thakur, A. Distinct approaches of removal of dyes from wastewater: A review. Mater. Today Proc. 2022, 50, 1575–1579. [Google Scholar] [CrossRef]
- Singh, A.; Bahadur Pal, D.; Mohammad, A.; Alhazmi, A.; Haque, S.; Yoon, T.; Srivastava, N.; Gupta, V.K. Biological remediation technologies for dyes and heavy metals in wastewater treatment: New insight. Bioresour. Technol 2022, 343, 126154. [Google Scholar] [CrossRef] [PubMed]
- Katheresan, V.; Kansedo, J.; Lau, S.Y. Efficiency of various recent wastewater dye removal methods: A review. J. Environ. Chem. Eng. 2018, 6, 4676–4697. [Google Scholar] [CrossRef]
- Nachiyar, C.V.; Rakshi, A.D.; Sandhya, S., Britlin Deva Jebasta, N., Nellore, J. Developments in treatment technologies of dye-containing effluent: A review CSCEE 2023, 7, 100339.
- Mashkoor, F.; Nasar, A. Magsorbents: Potential candidates in wastewater treatment technology – A review on the removal of methylene blue dye. J. Magn. Magn. Mater, 2020, 500, 166408. [Google Scholar] [CrossRef]
- Dutta, S.; Gupta, B.; Srivastava, S.K.; Gupta, A.K. Recent advances on the removal of dyes from wastewater using various adsorbents: a critical review. Materials Advances, 2021, 14. [Google Scholar] [CrossRef]
- Gao, Q.; Xu, J.; Bu, X.-H. Recent advances about metal–organic frameworks in the removal of pollutants from wastewater. Coord. -Chem. Rev. 2019, 378, 17–31. [Google Scholar] [CrossRef]
- Subash, A.; Naebe, M.; Wang, X.; Kandasubramanian, B. Biopolymer – A sustainable and efficacious material system for effluent removal. J. Hazard. Mater. 2023, 443, 130168. [Google Scholar] [CrossRef] [PubMed]
- Ozola-Davidane, R.; Burlakovs, J.; Tamm, T.; Zeltkalne, S.; Krauklis, A.E.; Klavins, M. Bentonite-ionic liquid composites for Congo red removal from aqueous solutions. J.Mol.Liq, 2021, 337, 116373. [Google Scholar] [CrossRef]
- Santoso, E.; Ediati, R.; Kusumawati, Y.; Bahruji, H.; Sulistiono, D.O.; Prasetyoko, D. Review on recent advances of carbon based adsorbent for methylene blue removal from waste water. Mater. Today Chem, 2020, 16, 100233. [Google Scholar] [CrossRef]
- Oladoye, O.; Ajiboye, T.O.; Omotola, E.O.; Oyewola, O.J. Methylene blue dye: Toxicity and potential elimination technology from wastewater. Results in Engineering, 2022, 16, 100678. [Google Scholar] [CrossRef]
- Modi, S.; Yadav, V.K.; Gacem, A.; Ali, I.H.; Dave, D.; Khan, S.H.; Yadav, K.K.; Rather, S.-U. Ahn, Y.; Son, C.T.; Jeon, B.-H. Recent and Emerging Trends in Remediation of Methylene Blue Dye from Wastewater by Using Zinc Oxide Nanoparticles. Water, 2022, 14, 1749. [Google Scholar] [CrossRef]
- Dominguez, M.; Mendoza, J.; Figueroa, K. Adsorption of methylene blue dye using common walnut shell (juglans regia) like biosorbent: implications for wastewater treatment. GCLR 2024, 17, 2362257. [Google Scholar] [CrossRef]
- Fito, J.; Abewaa, M.; Mengistu, A.; Angassa, K.; Ambaye, A.D.; Moyo, W.; Nkambule, T. Adsorption of methylene blue from textile industrial wastewater using activated carbon developed from Rumex abyssinicus plant. Sci Rep 2023, 13, 5427. [Google Scholar] [CrossRef] [PubMed]
- Osman, A.I.; Abd El-Monaem, E.M.; Elgarahy, A.M.; Aniagor, C.O.; Hosny, M.; Farghali, M.; Rashad, E.; Ejimofor, M.I.; Lopez-Maldanado, E.A.; Ihara, I.; Yap, P.-S.; Rooney, D.W.; Eltaweil., A.S. Methods to prepare biosorbents and magnetic sorbents for water treatment: a review. Environ. Chem. Lett. 2023, 21, 2337–2398. [Google Scholar] [CrossRef]
- Luo, D.; Wang, L.; Nan, H.; Cao, Y. Phosphorus adsorption by functionalized biochar: a review. Environ. Chem. Lett. 2023, 21, 497–524. [Google Scholar] [CrossRef]
- Panagopoulos, A. Beneficiation of saline effluents from seawater desalination plants: Fostering the zero liquid discharge (ZLD) approach - A techno-economic evaluation. J. Environ. Chem. Eng. 2021, 9, 105338. [Google Scholar] [CrossRef]
- Sharkh, B.A.; Al-Amoudi, A.A.; Farooque, M.; Fellows, C.M.; Ihm, S.; Lee, S.; Li, S.; Voutchkov, N. Seawater desalination concentrate—a new frontier for sustainable mining of valuable minerals. npj Clean Water, 2022, 5, 9. [Google Scholar] [CrossRef]
- Panagopoulos, A.; Giannika, V. Decarbonized and circular brine management/valorization for water & valuable resource recovery via minimal/zero liquid discharge (MLD/ZLD) strategies J. Environ Manage 2022, 324, 116239. [Google Scholar]
- Panagopoulos, A.; Haralambous, K.-J.; Loizidou, M. Desalination brine disposal methods and treatment technologies - A review. Sci.Total Environment, 2019, 693, 133545. [Google Scholar] [CrossRef]
- Panagopoulos, A. Brine management (saline water & wastewater effluents): Sustainable utilization and resource recovery strategy through Minimal and Zero Liquid Discharge (MLD & ZLD) desalination systems. Chem. Eng. Process. 2022, 176, 108944. [Google Scholar]
- Al-Absi, R.S.; Abu-Dieyeh, M.; Al-Ghouti, M.A. Brine management strategies, technologies, and recovery using adsorption processes. Environmental Technology & Innovation 2021, 22, 101541. [Google Scholar]
- ASTM D1141 - 98(2021) Standard Practice for Preparation of Substitute Ocean Water Active Standard ASTM D1141 | Developed by Subcommittee: D19.02 Book of Standards Volume: 11.02S.
- Ferreira, S.L.C.; Bruns, R.E.; Ferreira, H.S.; Matos, G.D.; David, J.M.; Brandão, G.C.; da Silva, E.G.P.; Portugal, L.A.; dos Reis, P.S.; Souza, A.S.; dos Santos, W.N.L. Box- Behnken design: an alternative for the optimization of analytical methods. Anal Chim Acta. 2007, 597, 179–186. [Google Scholar] [CrossRef]
- Bezerra, M.A.; Santelli, R.E.; Oliveira, E.P.; Villar, L.S.; Escaleira, L.A. Response surface methodology (RSM) as a tool for optimization in analytical chemistry. Talanta, 2008, 76, 965–977. [Google Scholar] [CrossRef]
- Box, G. E. P.; Wilson, K. B. On the experimental attainment of optimum conditions. J. R. Stat. Soc. Series B, 1951, 13, 1–45. [Google Scholar] [CrossRef]
- Brasch, D.J.; Free, K.W. Prehydrolysis-kraft pulping of Pinus radiata grown in New Zealand. Tappi 1965, 48, 245–248. [Google Scholar]
- Overend, R.; Chornet, E. Fractionation of lignocellulosics by steam-aqueous pretreatments. Philos. Trans. R. Soc. Lond. B Biol. Sci., 1987, 131, 523–536. [Google Scholar]
- Chum, H.H.; Johnson, D.K.; Black, S.K.; Overend, R.P. Pretreatment- catalyst effects and the combined severity parameter. Appl. Biochem. Biotechnol. 1990, 13, 24–25. [Google Scholar] [CrossRef]
- Abatzoglou, N.; Chornet, E.; Belkacemi, K.; Overend, R.P. Phenomenological kinetics of complex systems: the development of a generalized severity parameter and its application to lignocellulosics fractionation. Chem. Eng. Sci. 1992, 47, 1109–1122. [Google Scholar] [CrossRef]
- Lloyd, T.A.; Wyman, C.E. Combined sugar yields for dilute sulfuric acid pretreatment of corn stover followed by enzymatic hydrolysis of the remaining solids. Bioresour Technol. 2005, 96, 1967–1977. [Google Scholar] [CrossRef]
- Kabel, M.A.; Bos, G.; Zeevalking, J.; Voragen, A.G.J.; Schols, H.A. Effect of pretreatment severity on xylan solubility and enzymatic breakdown of the remaining cellulose from wheat straw. Bioresour. Technol. 2007, 98, 2034–2042. [Google Scholar] [CrossRef]
- Sidiras, D.; Batzias, F.; Ranjan, R.; Tsapatsis, M. Simulation and optimization of batch autohydrolysis of wheat straw to monosaccharides and oligosaccharides. Bioresour. Technol. 2011, 102, 10486–10492. [Google Scholar] [CrossRef]
- Weinwurm, F.; Turk, T.; Denner, J.; Whitmore, K.; Friedl, A. Combined liquid hot water and ethanol organosolv treatment of wheat straw for extraction and reaction modeling. J. Clean. Prod. 2017, 165, 1473–1484. [Google Scholar] [CrossRef]
- Sidiras, D.K.; Nazos, A.G.; Giakoumakis, G.E.; Politi, D.V. Simulating the Effect of Torrefaction on the Heating Value of Barley Straw. Energies, 2020, 13, 736. [Google Scholar] [CrossRef]
- Saeman, J.F.; Bubl, J.L.; Harris, E.E. Quantitative saccharification of wood and cellulose. Ind. Eng. Chem. Anal. Ed., 1945, 17, 35–37. [Google Scholar] [CrossRef]
- Brunauer, S.; Emmett, P.H.; Teller, E. Adsorption of gases in multimolecular layers. J Am Chem Soc 1938, 60, 309–319. [Google Scholar] [CrossRef]
- Segal, L.; Creely, J.J.; Martin, A.E.; Conrad, C.M. An empirical method for estimating the degree of crystallinity of native cellulose using X-ray diffractometer. Textile Research Journal, 1959, 29, 786–794. [Google Scholar] [CrossRef]
- Nam, S.; French, A.D.; Condon, B.D.; Concha, M. Segal crystallinity index revisited by the simulation of X-ray diffraction patterns of cotton cellulose Iβ and cellulose II. Carbohydr. Polym., 2016, 135, 1–9. [Google Scholar] [CrossRef] [PubMed]
- Freundlich, H.M.F. Über die adsorption in lösungen, Zeitschrift für Physikalische Chemie.1906, 57, 385-471.
- Langmuir, I. The constitution and fundamental properties of solids and liquids. Journal of American Chemical Society, 1916, 38, 2221–2295. [Google Scholar] [CrossRef]
- Sips, R. Structure of a catalyst surface. Journal of Chemical Physics, 1948, 16, 490–495. [Google Scholar] [CrossRef]
- Lagergren, S. Zur theorie der sogenannten adsorption gelöster stoffe. Kungliga Svenska Vetenskapsakademiens, Handlingar 1898, 24, 1–39. [Google Scholar]
- Ho, Y.S.; Ng, J.C.Y.; McKay, G. Kinetics of pollutants sorption by biosorbents: review. Sep Purif Methods, 2000, 29, 189–232. [Google Scholar] [CrossRef]
- Weber, W.J.; Morris, J.C. Kinetics of adsorption on carbon from solution. J. Sanit. Eng. Div. Am. Soc. Civ. Eng. 1963, 89, 31–60. [Google Scholar] [CrossRef]
- Bouaziz, F.; Koubaa, M.; Kallel, F.; Chaari, F.; Driss, D.; Ghorbel, R.E.; Chaabouni, S.E. Efficiency of almond gum as a low-cost adsorbent for methylene blue dye removal from aqueous solutions. Ind. Crops prod. 2015, 74, 903–911. [Google Scholar] [CrossRef]
- Karthikeyan, T.; Rajgopal, S.; Miranda, L.R. Chromium(VI) adsorption from aqueous solution by Hevea Brasilinesis sawdust activated carbon. J. Hazard. Mater. 2005, 124, 192–199. [Google Scholar] [CrossRef]
- Albadarina, A.B.; Al-Muhtasebb, A.H.; Al-laqtaha, N.A.; Walker, G.M.; Allena, S.J.; Ahmada, M.N.M. Biosorption of toxic chromium from aqueous phase by lignin: Mechanism, effect of other metal ions and salts. Chem. Eng. J. 2011, 169, 20–30. [Google Scholar] [CrossRef]
- Bhattachatjee, C.; Dutta, S.; Saxena, V.K. A review on biosorptive removal of dyes and heavy metals from wastewater using watermelon rind as biosorbent. Environmental Advances 2020, 2, 100007. [Google Scholar] [CrossRef]
- Olatunji, K.O.; Madyira, D.M. Comparative Analysis of the Effects of Five Pretreatment Methods on Morphological and Methane Yield of Groundnut Shells. Waste Biomass Valor 2024, 15, 469–486. [Google Scholar] [CrossRef]
- Bala, R.; Mondal, M.K. Exhaustive characterization on chemical and thermal treatment of sawdust for improved biogas production. Biomass Conv. Bioref. 2018, 8, 991–1003. [Google Scholar] [CrossRef]
- Auxenfans, T.; Buchoux, S.; Larcher, D.; Husson, G.; Husson, E.; Sarazin, C. Enzymatic saccharification and structural properties of industrial wood sawdust: Recycled ionic liquids pretreatments, Energy Conversion and Management, 2014, 88, 1094–1103.
- González-Peña, M.M.; Hale, M.D.C. Rapid assessment of physical properties and chemical composition of thermally modified wood by mid-infrared spectroscopy. Wood Sci Technol 2011, 45, 83–102. [Google Scholar] [CrossRef]
- Báder, M., Németh, R., Sandak, J. et al. FTIR analysis of chemical changes in wood induced by steaming and longitudinal compression. Cellulose 2020, 27, 6811–6829.
- Javier-Astete, R., Melo, J., Jimenez-Davalos, J. et al. Classification of Amazonian fast-growing tree species and wood chemical determination by FTIR and multivariate analysis (PLS-DA, PLS). Sci Rep 2023, 13, 7827.
- Julia Kruyeniski, Paulo J.T. Ferreira, Maria da Graça Videira Sousa Carvalho, María E. Vallejos, Fernando E. Felissia, María C. Area, Physical and chemical characteristics of pretreated slash pine sawdust influence its enzymatic hydrolysis, Industrial Crops and Products, Volume 130, 2019, Pages 528-536, ISSN 0926-6690.
- Ahamad, Z.; Nasar, A. Design and evaluation of a polyaniline-Azadirachta indica composite for efficient dye removal: insights from experimental and theoretical simulations. Mater Today Sustain, 2024, 100926.
Figure 1.
Brine pretreatment process was done in a 4-L PARR batch reactor (autoclave), (a) open and (b) closed in operation.
Figure 1.
Brine pretreatment process was done in a 4-L PARR batch reactor (autoclave), (a) open and (b) closed in operation.
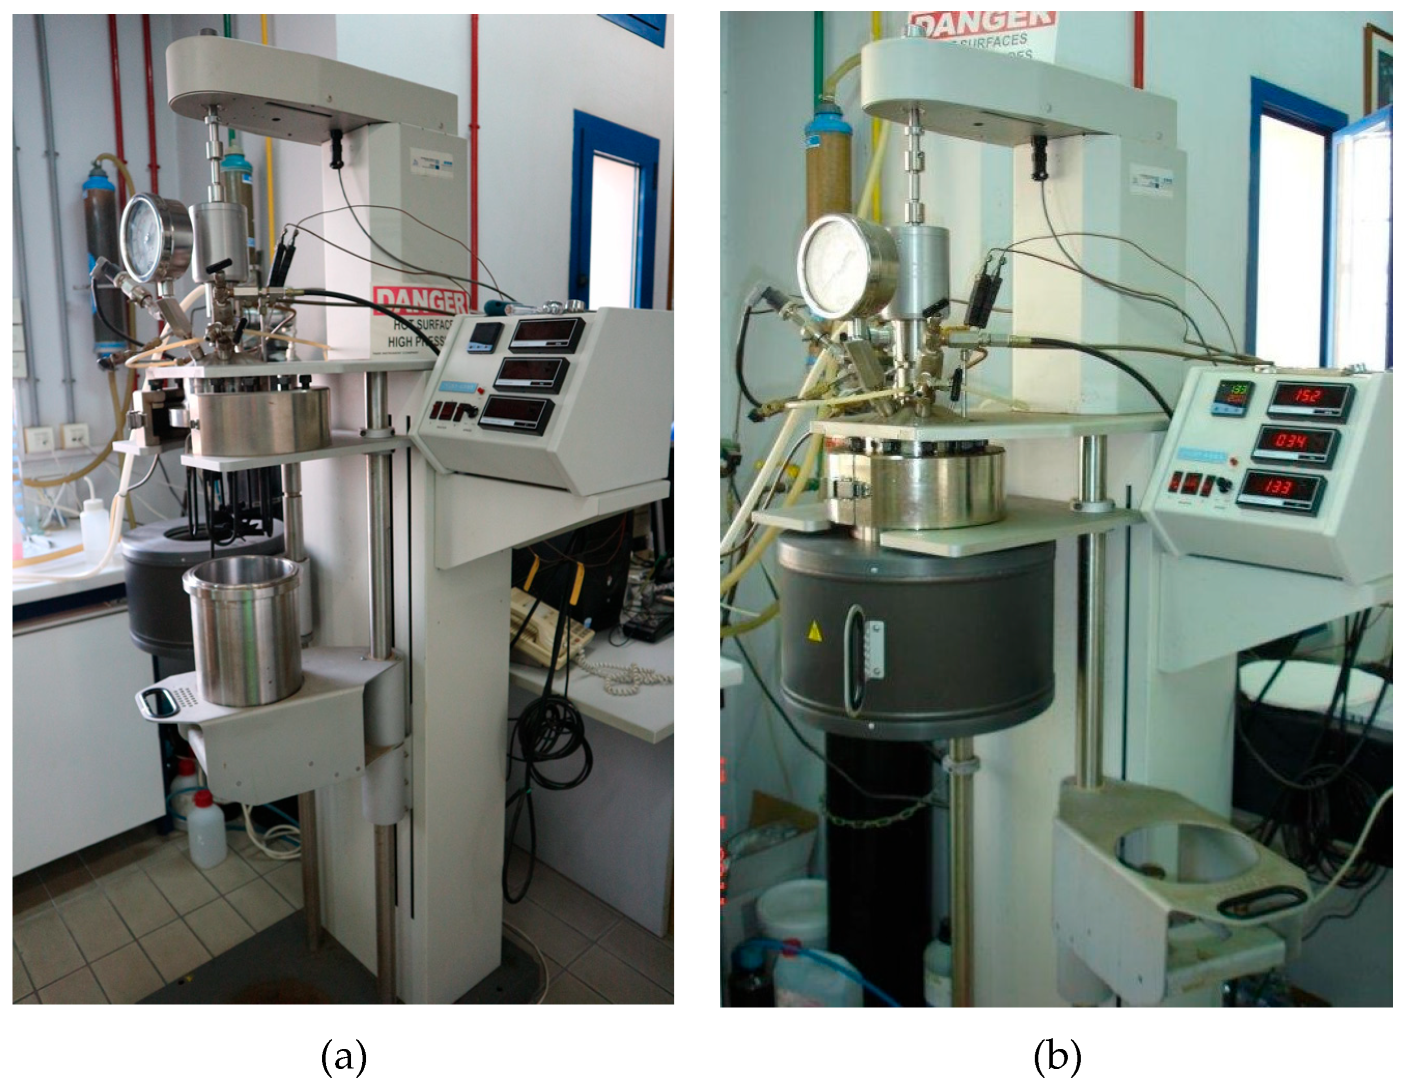
Figure 2.
Temperature vs. time of the spruce sawdust desalination brine pretreatment experiments using a 4-L autoclave for 180, 200 and 240 oC ending temperatures.
Figure 2.
Temperature vs. time of the spruce sawdust desalination brine pretreatment experiments using a 4-L autoclave for 180, 200 and 240 oC ending temperatures.
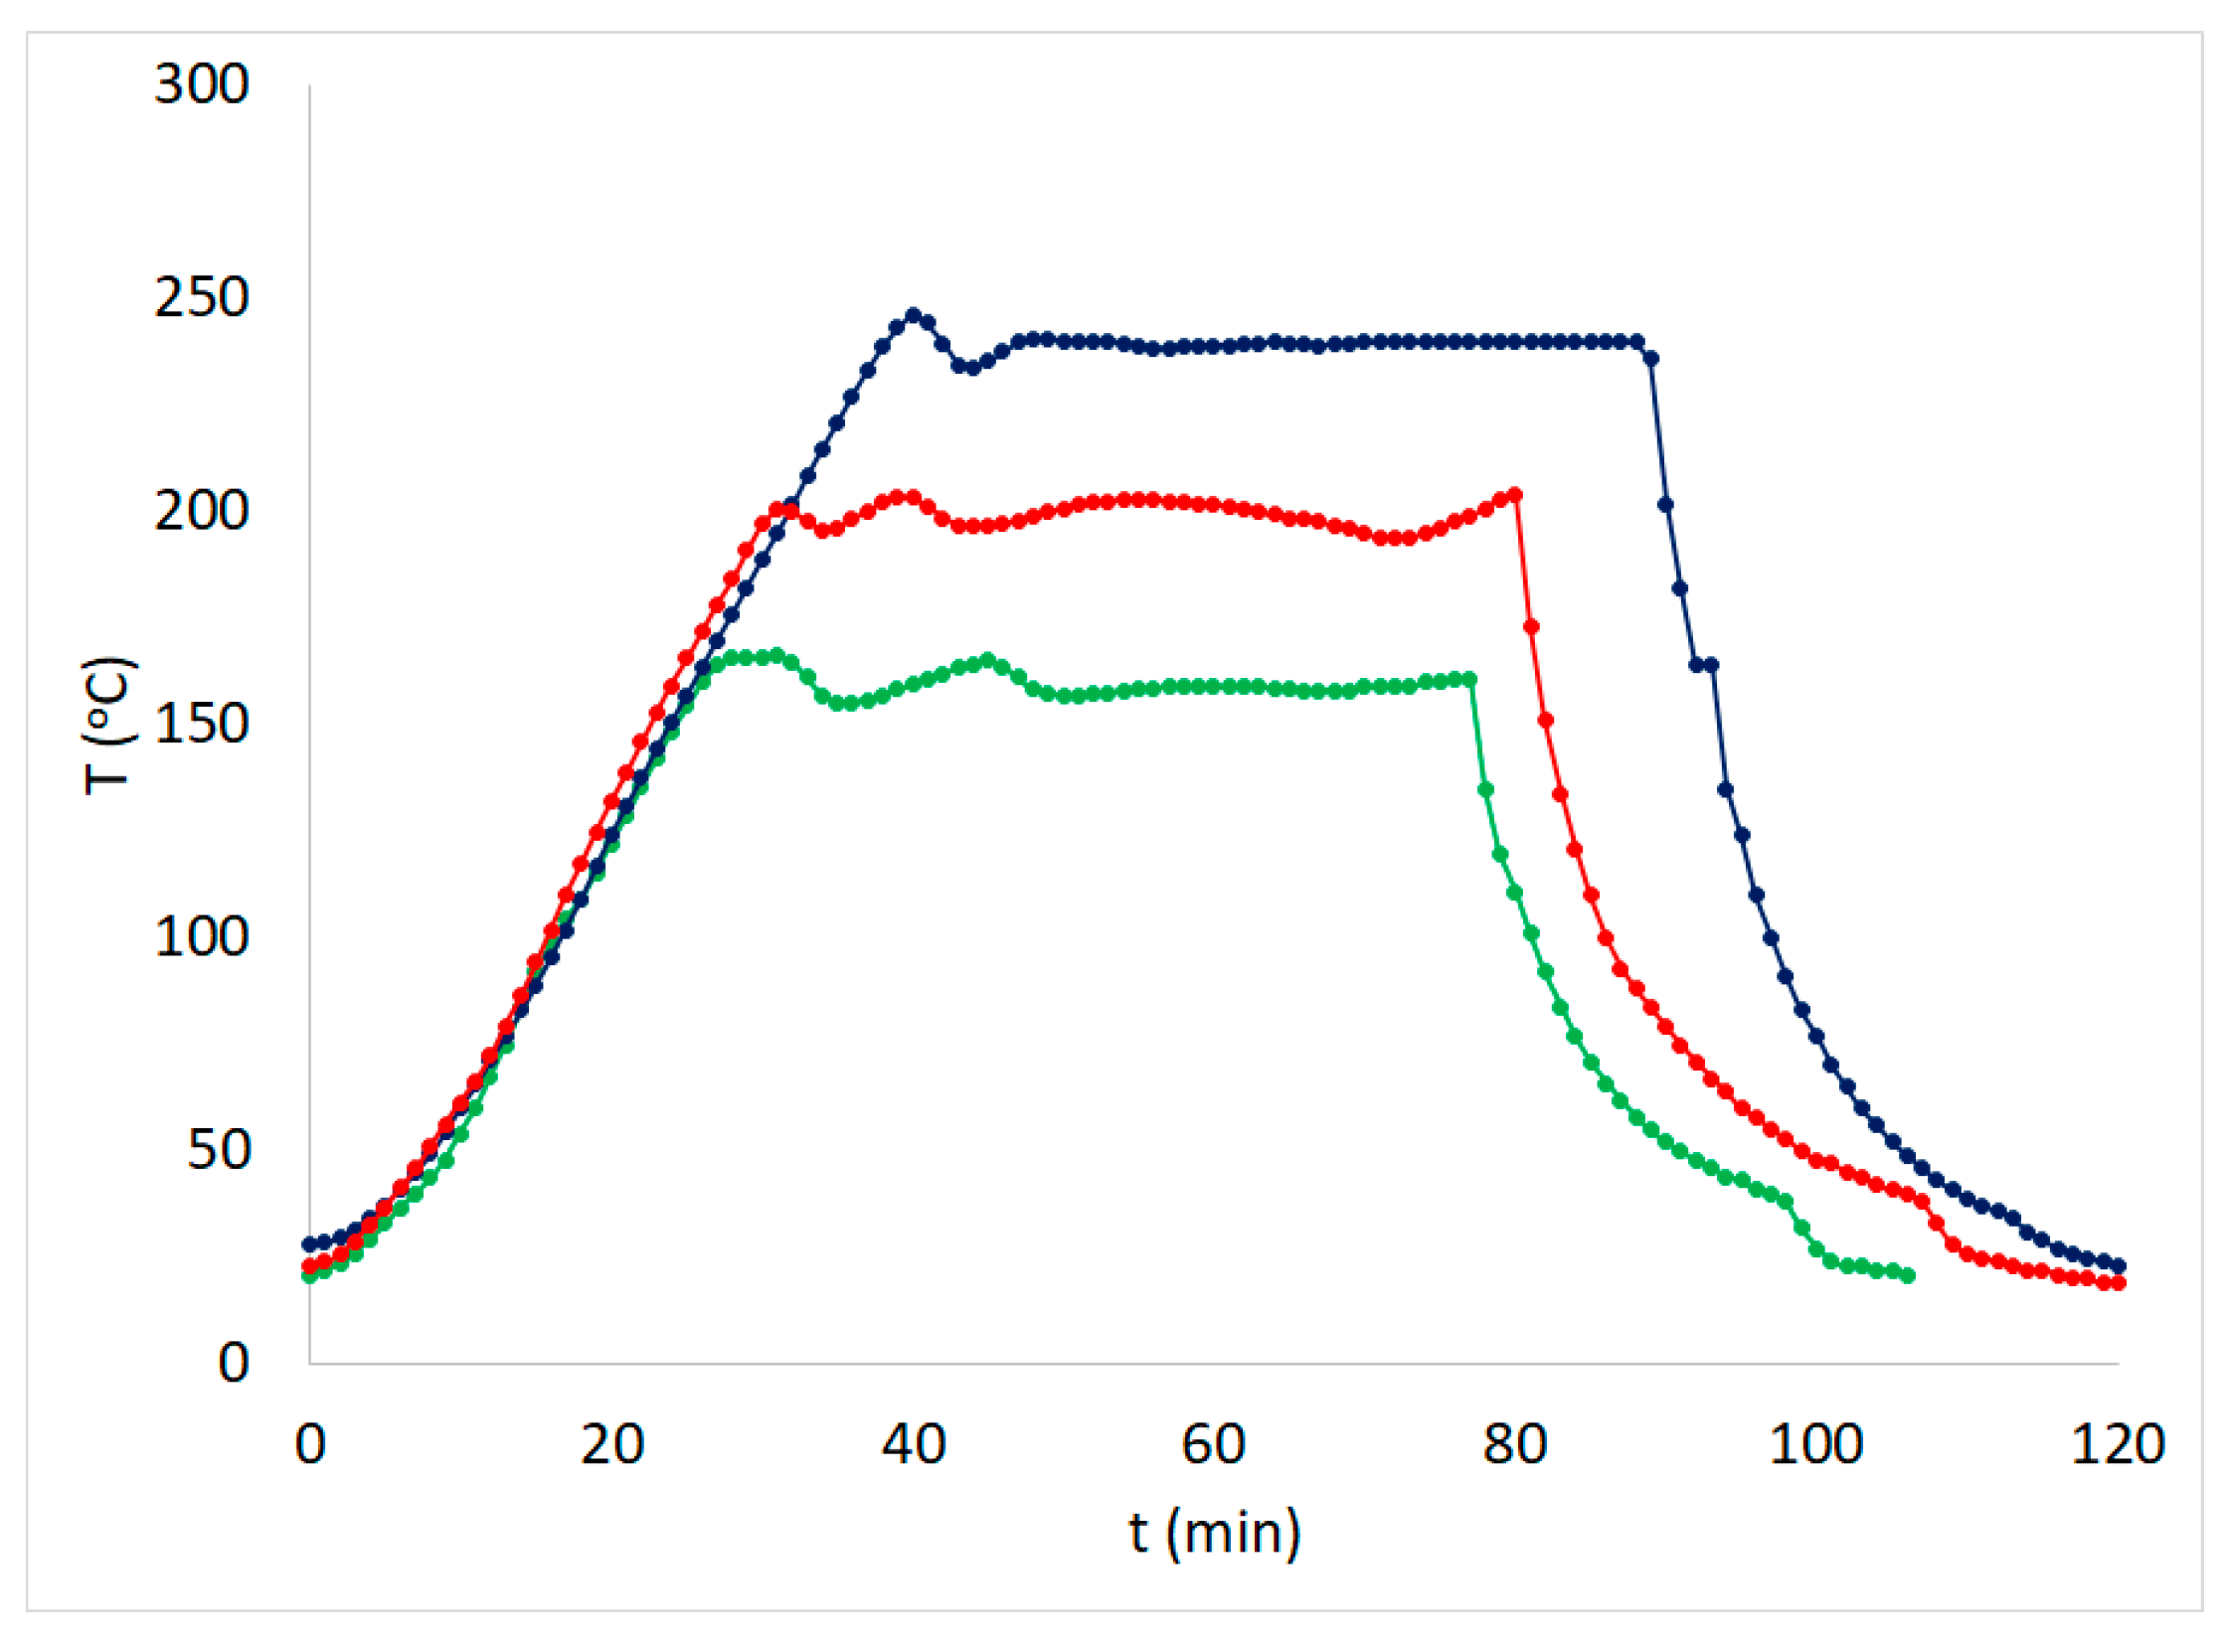
Figure 3.
Autoclave pressure profile vs. time of the spruce sawdust desalination brine pretreatment experiments at 180, 200 and 240 oC ending temperatures.
Figure 3.
Autoclave pressure profile vs. time of the spruce sawdust desalination brine pretreatment experiments at 180, 200 and 240 oC ending temperatures.
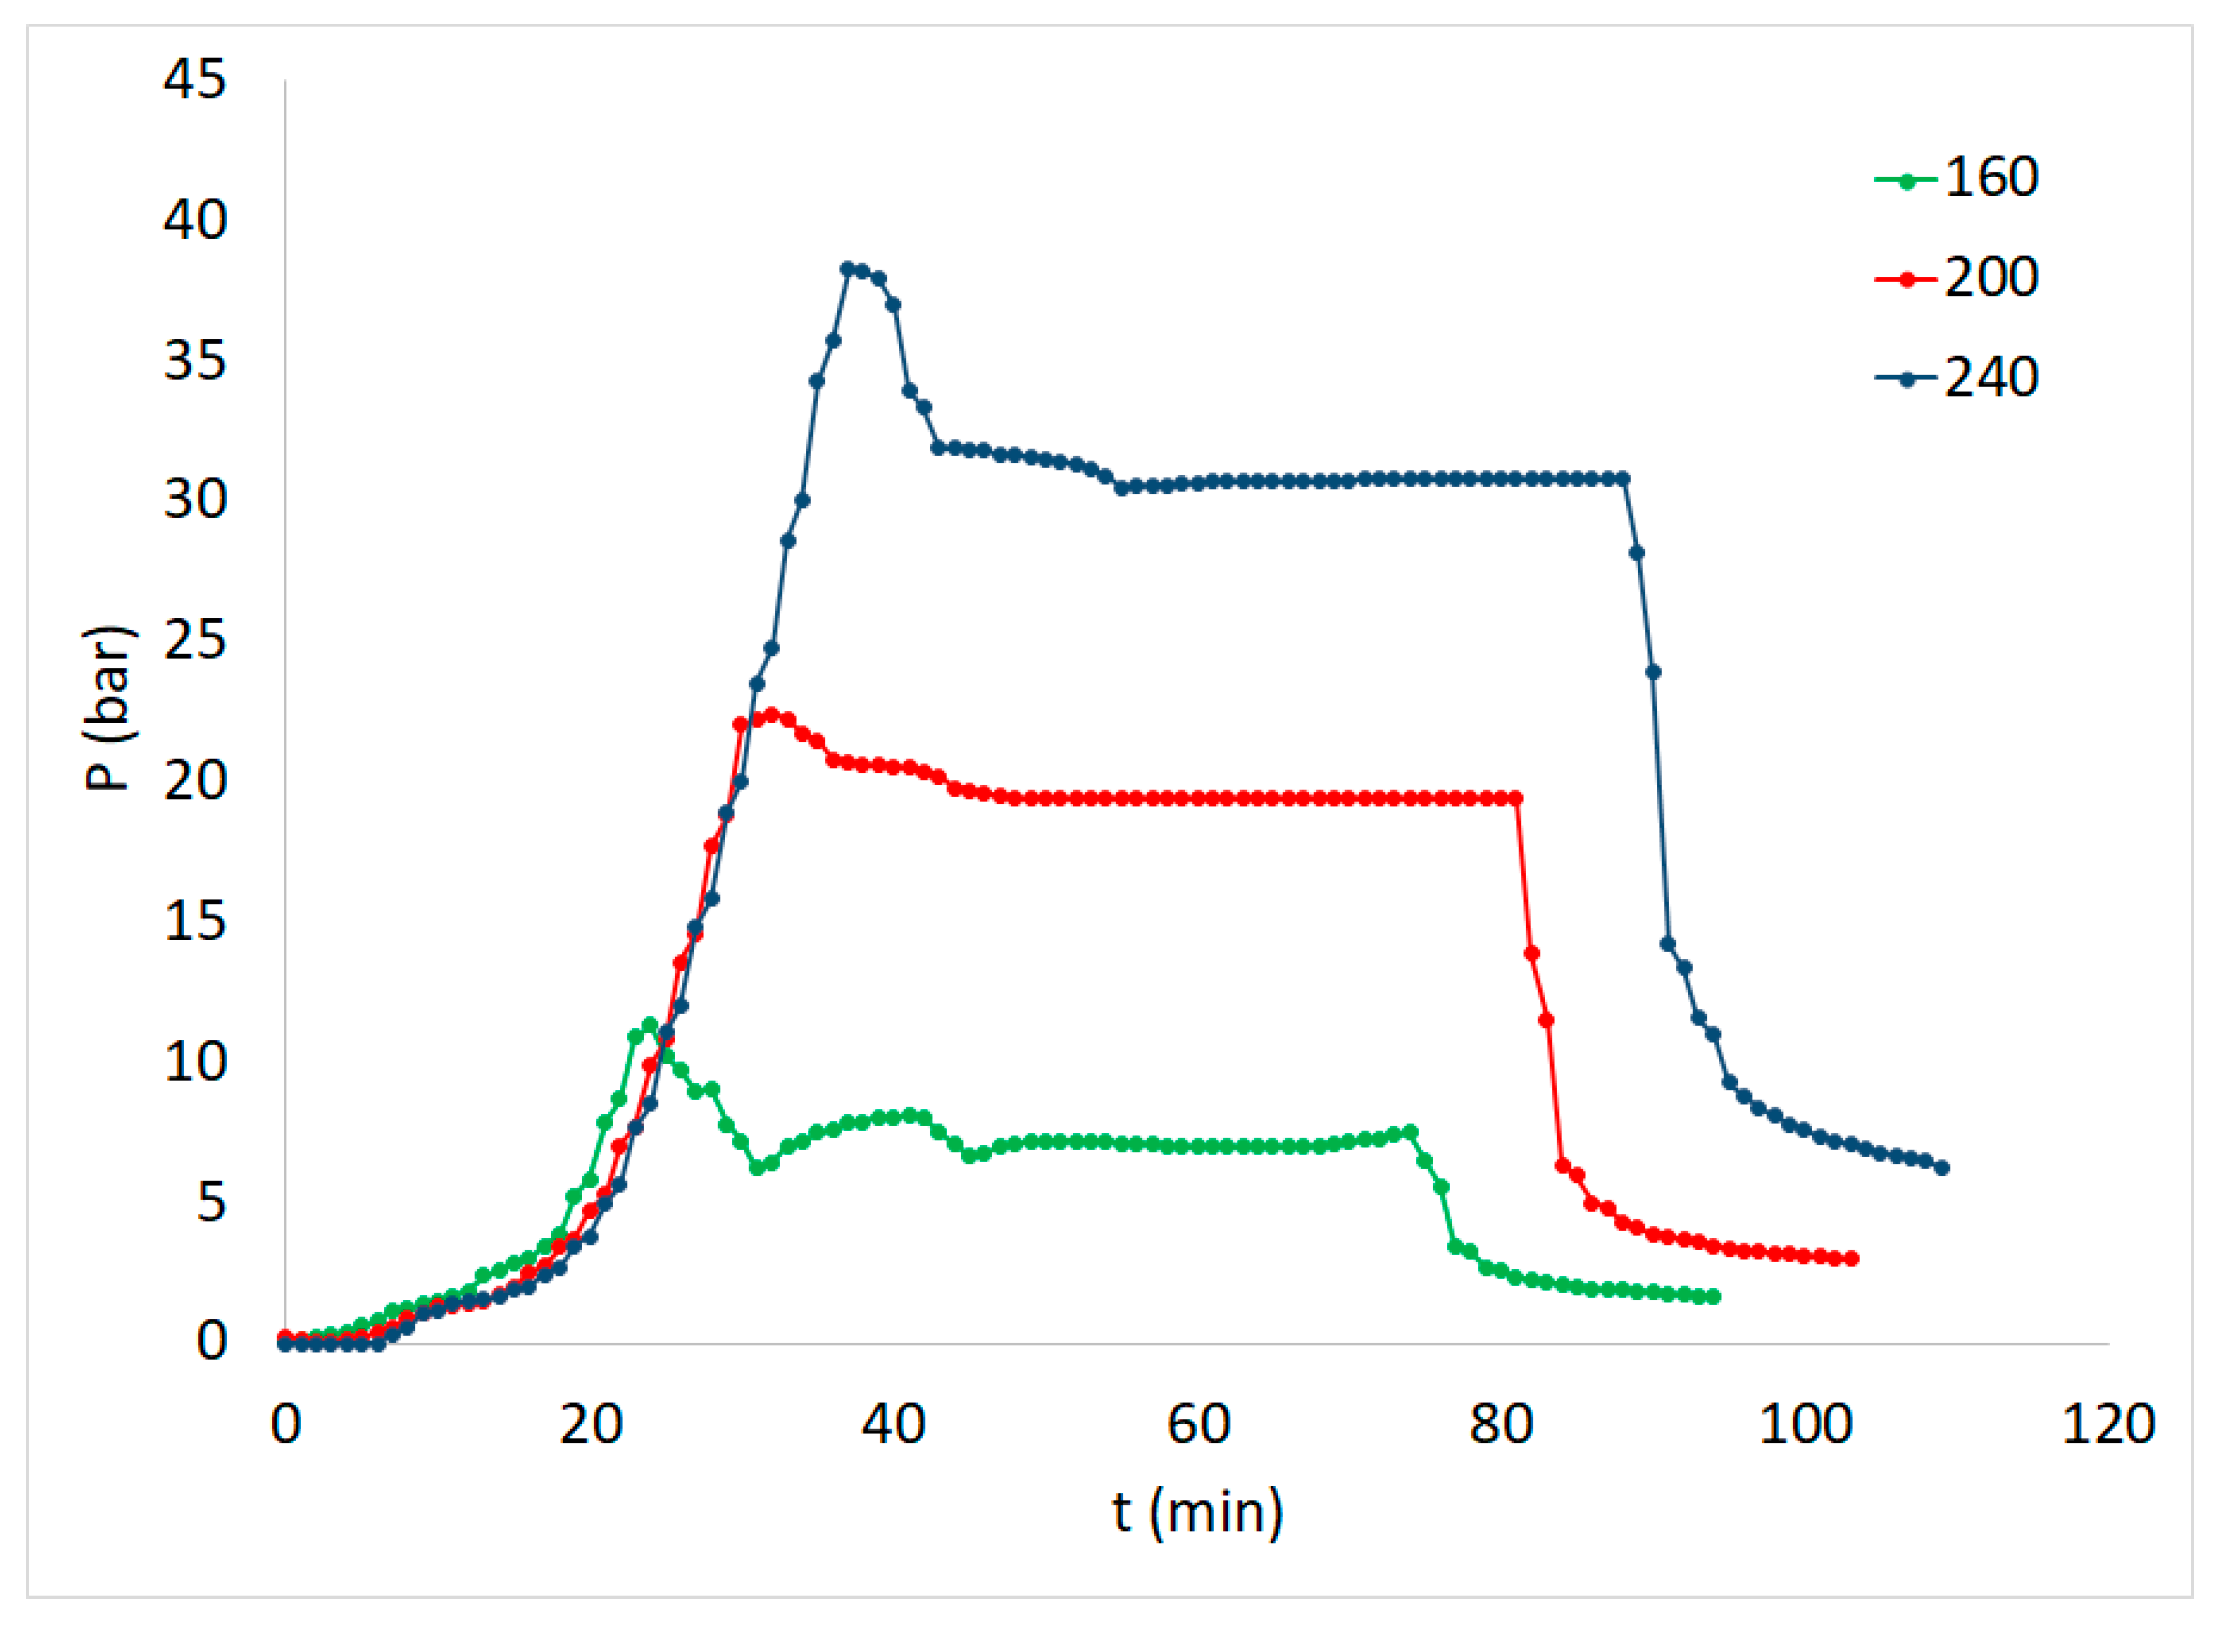
Figure 4.
Spruce brine pretreatment’s liquid phase pH vs. the combined severity factor logarithm.

Figure 5.
Spruce sawdust desalination brine pretreatment experiments solid residue yield (SRY) vs. the combined severity factor logarithm.
Figure 5.
Spruce sawdust desalination brine pretreatment experiments solid residue yield (SRY) vs. the combined severity factor logarithm.
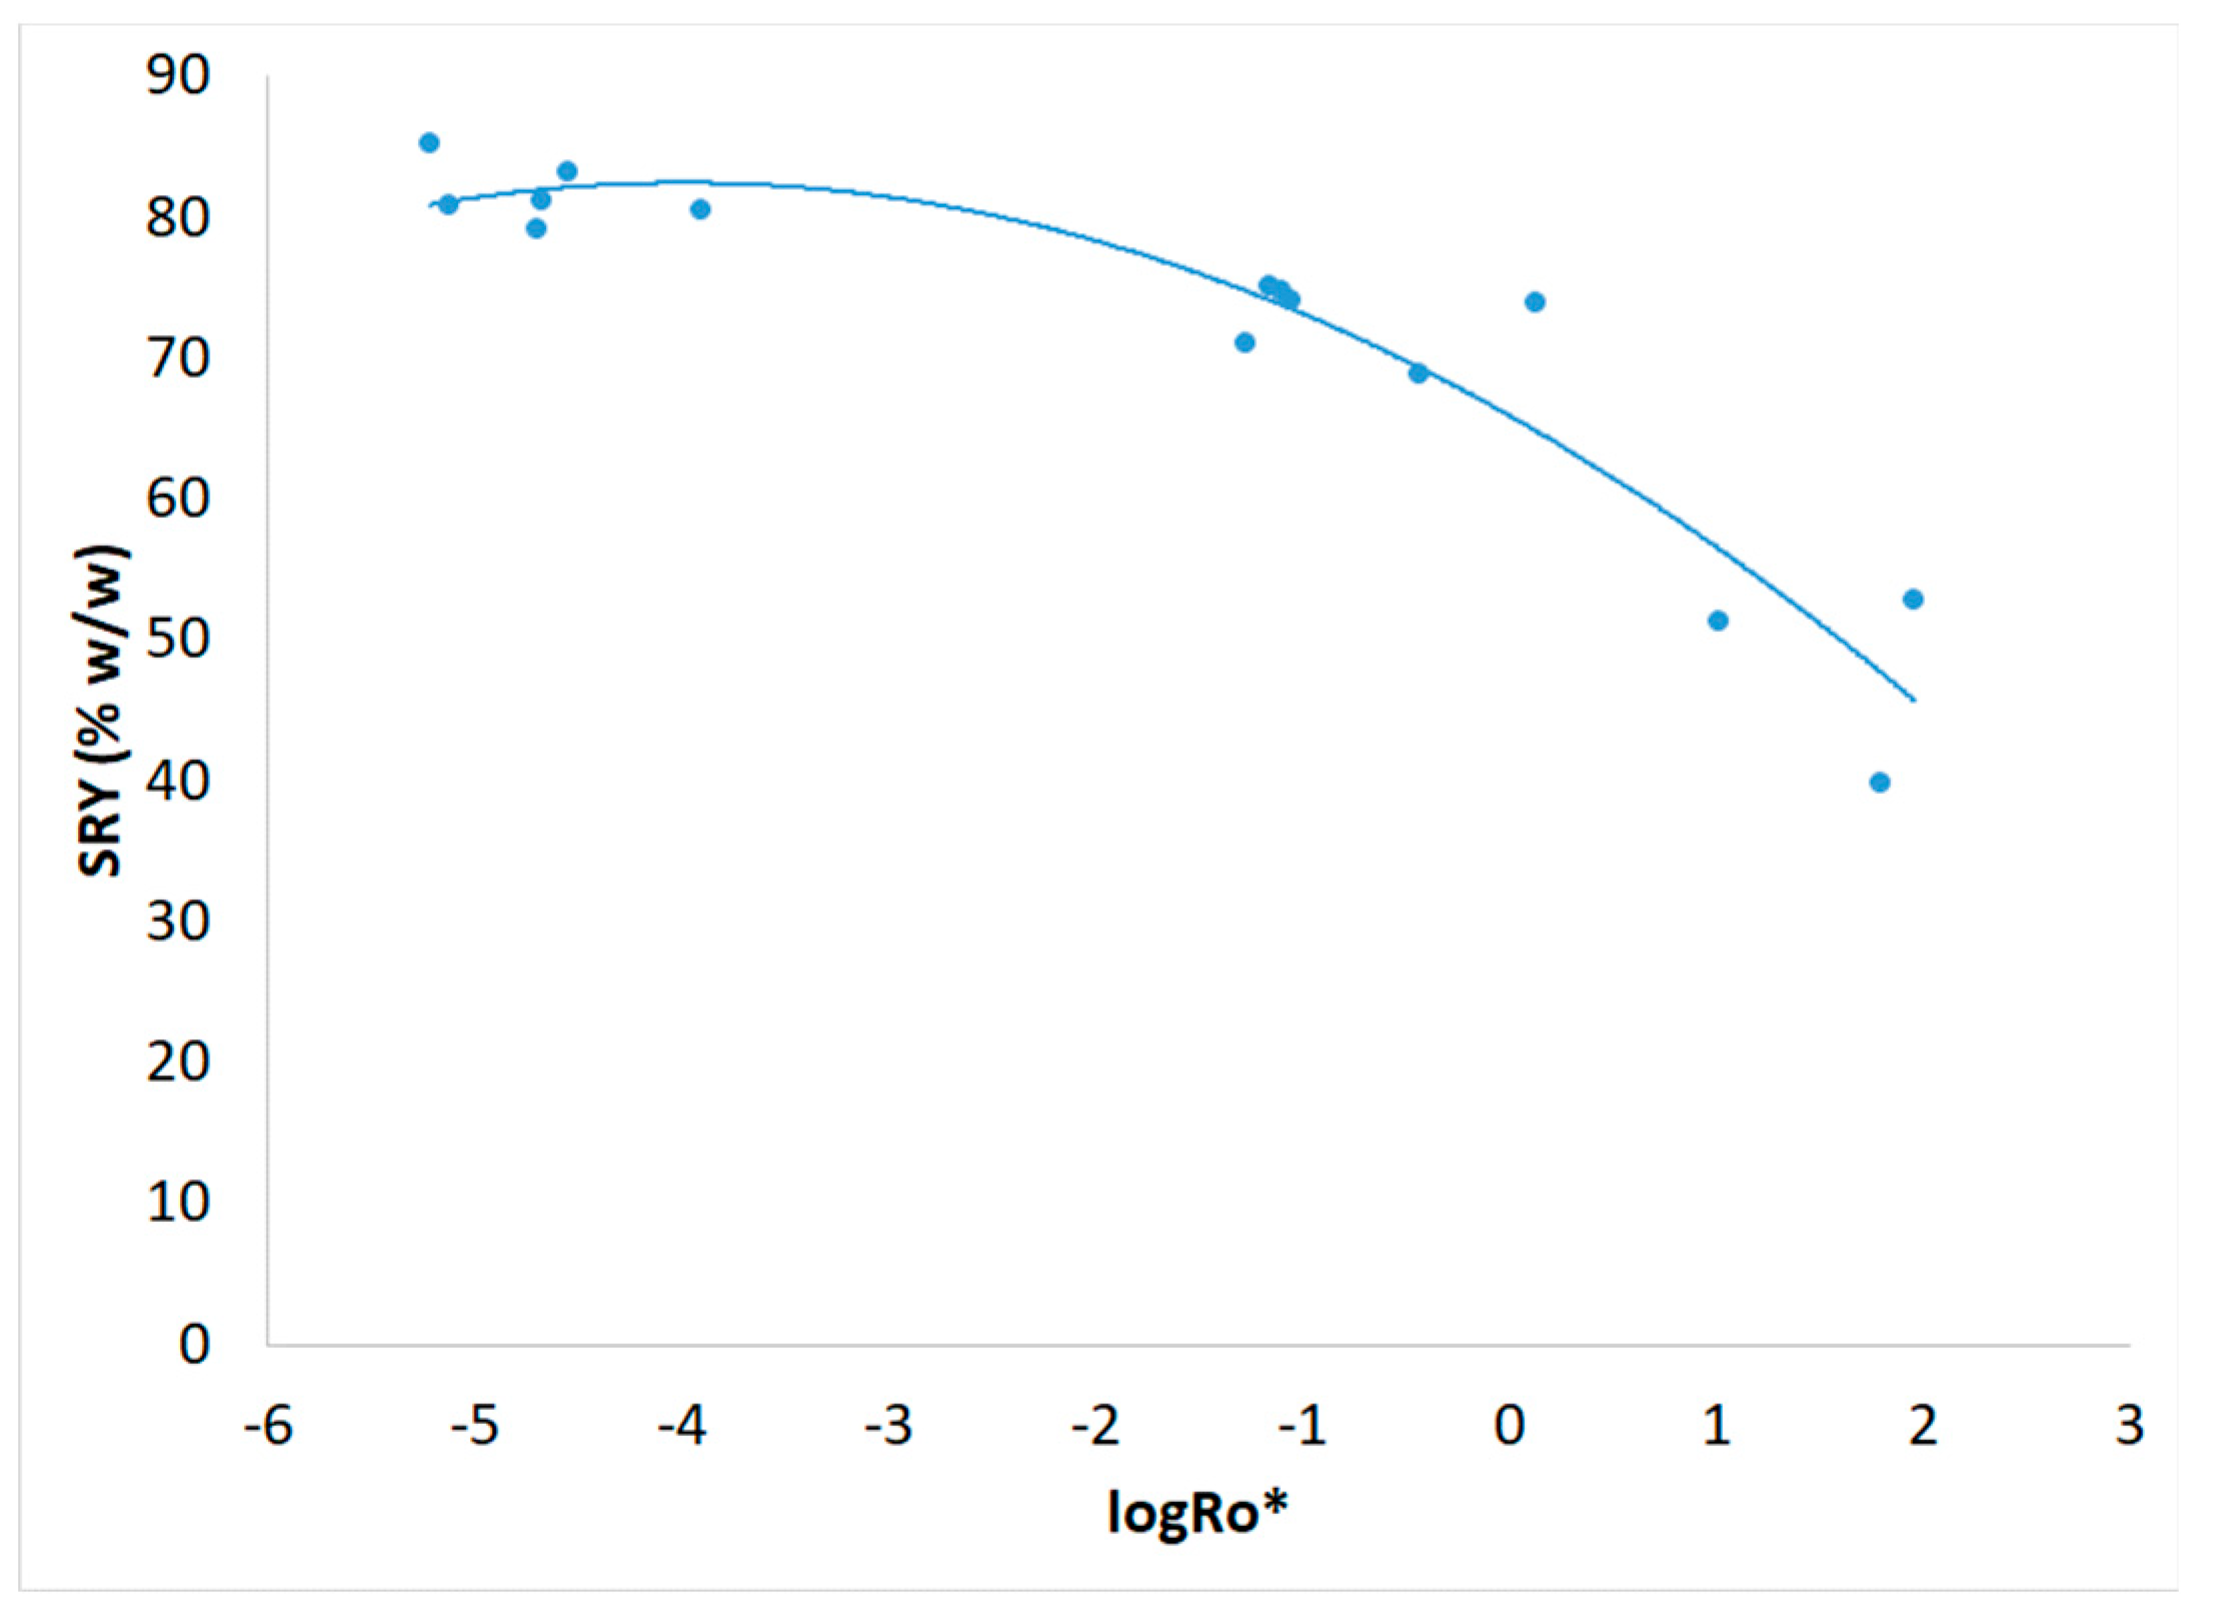
Figure 6.
Spruce sawdust desalination brine pretreatment experiments solid residue BET values vs. the combined severity factor logarithm.
Figure 6.
Spruce sawdust desalination brine pretreatment experiments solid residue BET values vs. the combined severity factor logarithm.
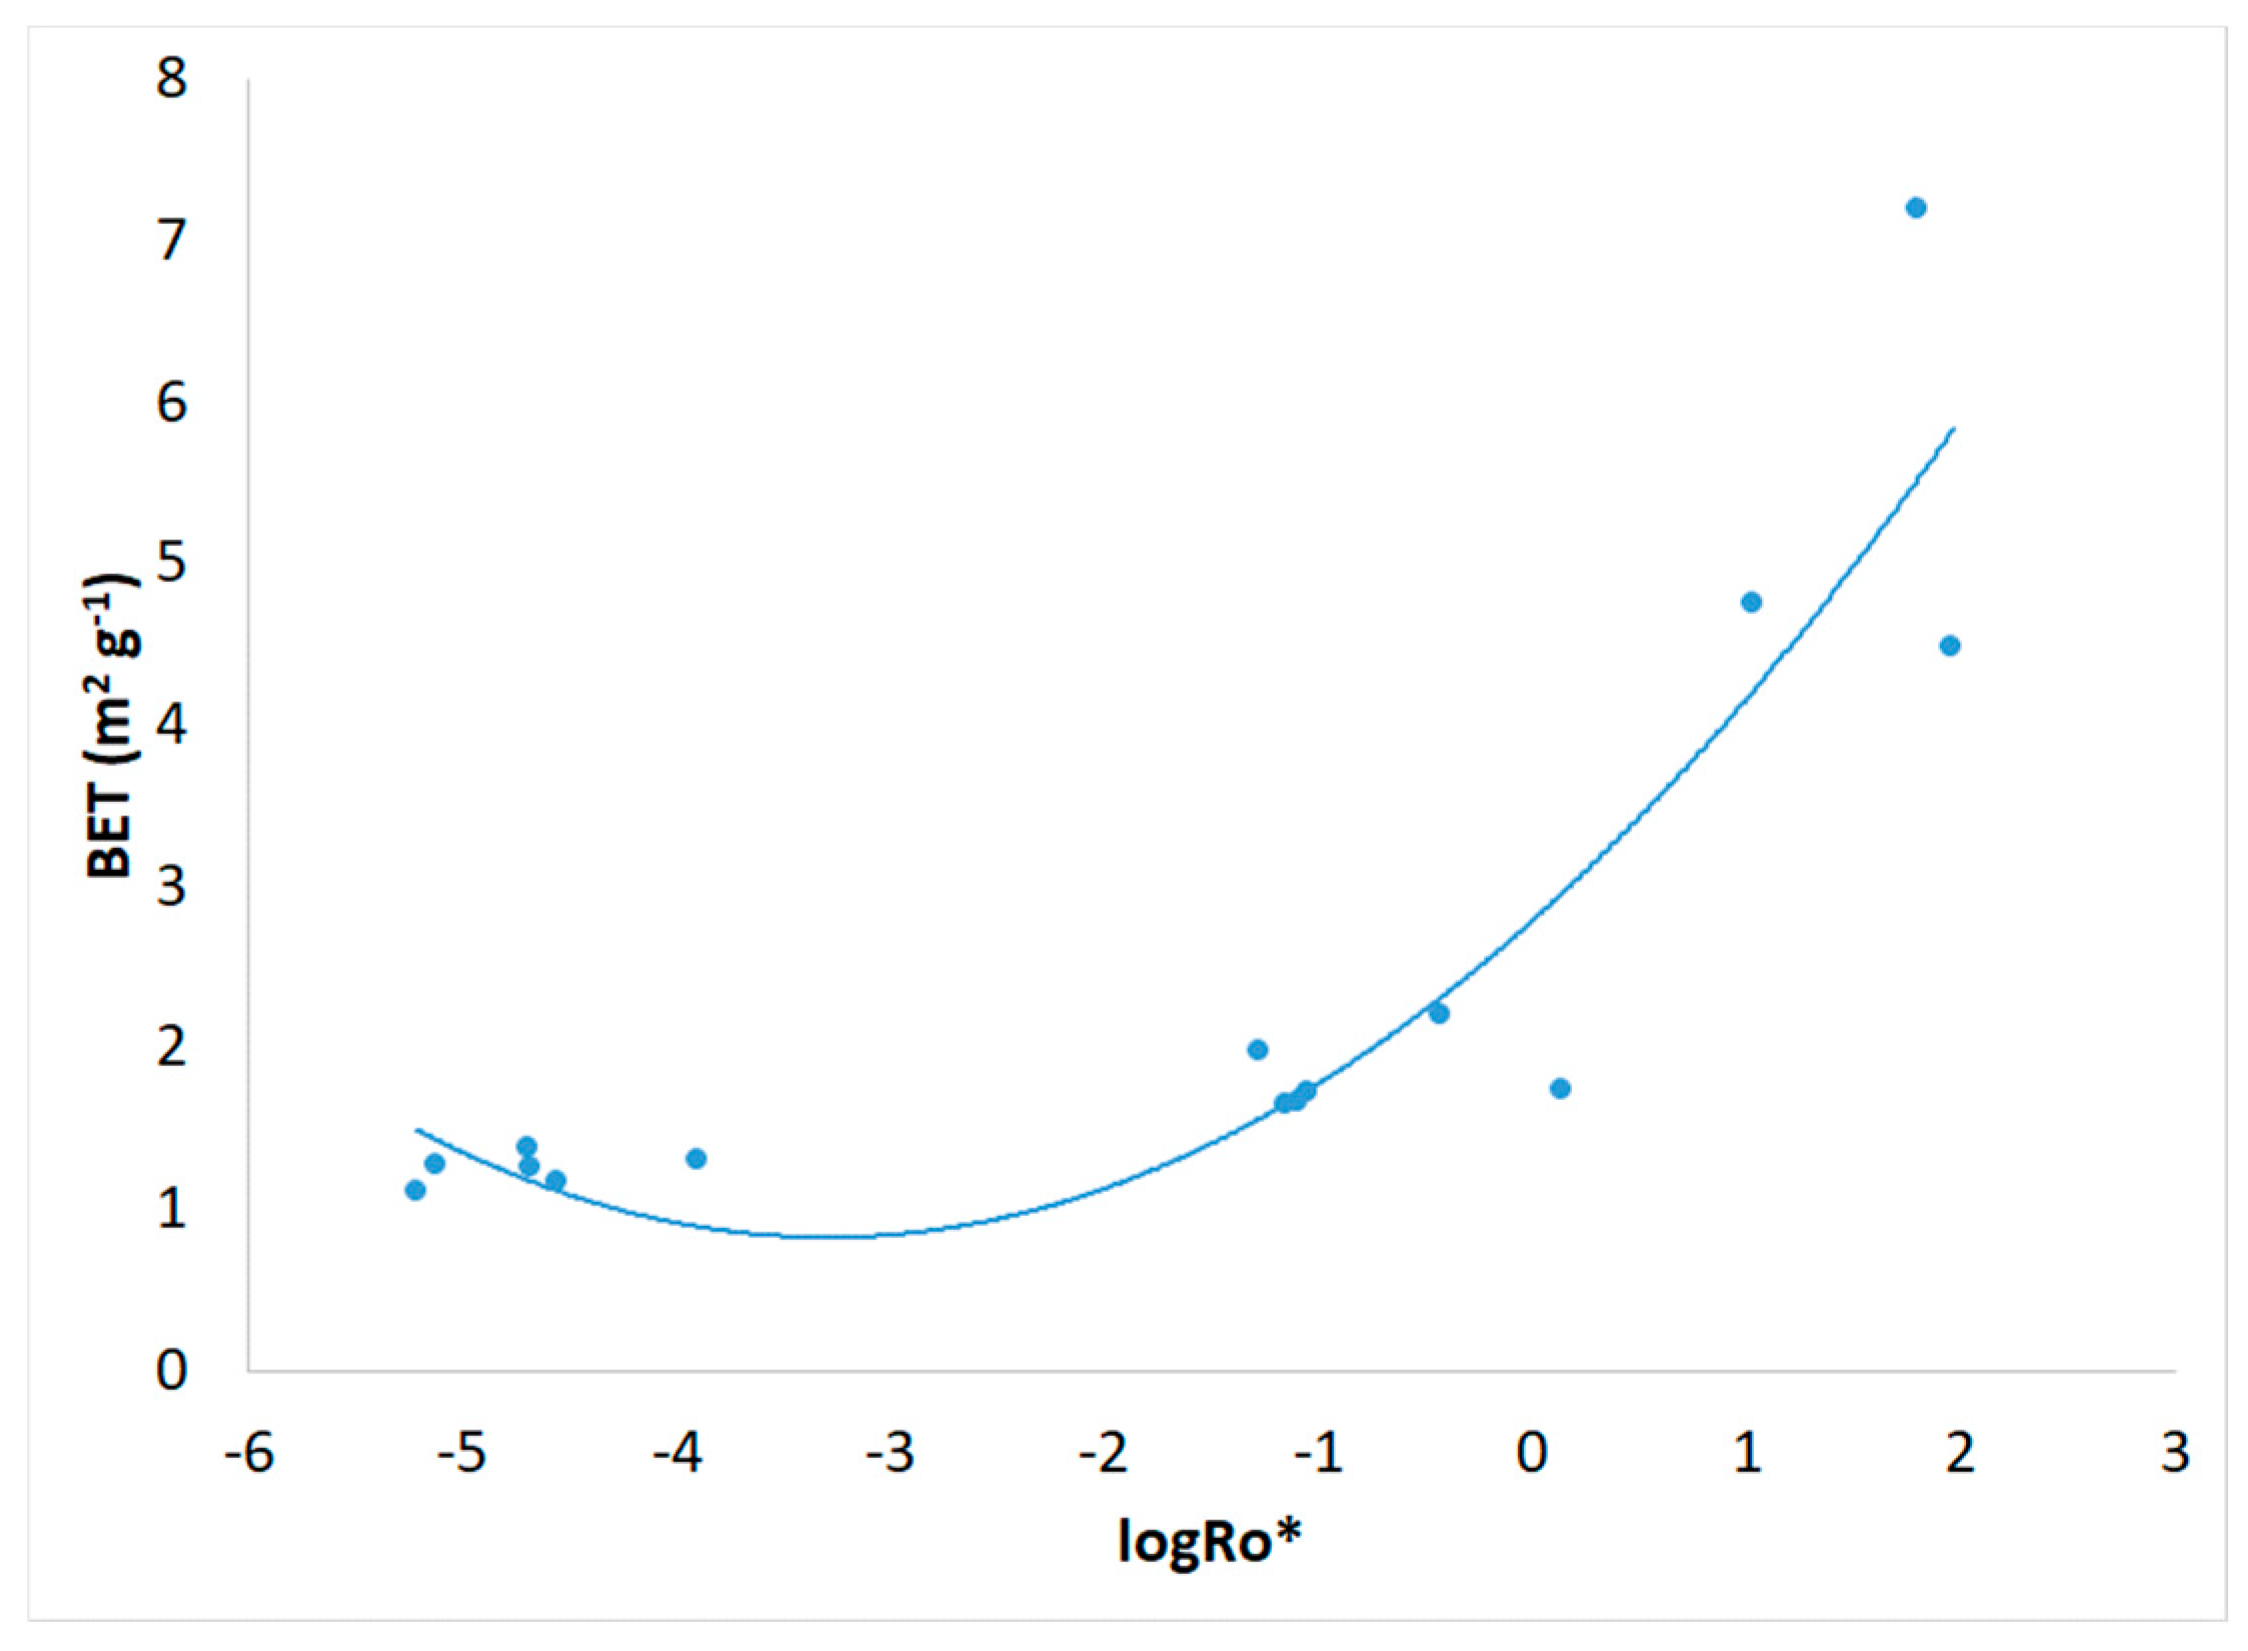
Figure 7.
Freundlich isotherm model for Methylene Blue adsorption on pretreated (240 oC, 25 min, 178.71 mg/L NaCl) and untreated spruce sawdust (a) logq vs. logCe and (b) q vs. Ce. Brine concentrated seven times compared to the simulated seawater.
Figure 7.
Freundlich isotherm model for Methylene Blue adsorption on pretreated (240 oC, 25 min, 178.71 mg/L NaCl) and untreated spruce sawdust (a) logq vs. logCe and (b) q vs. Ce. Brine concentrated seven times compared to the simulated seawater.
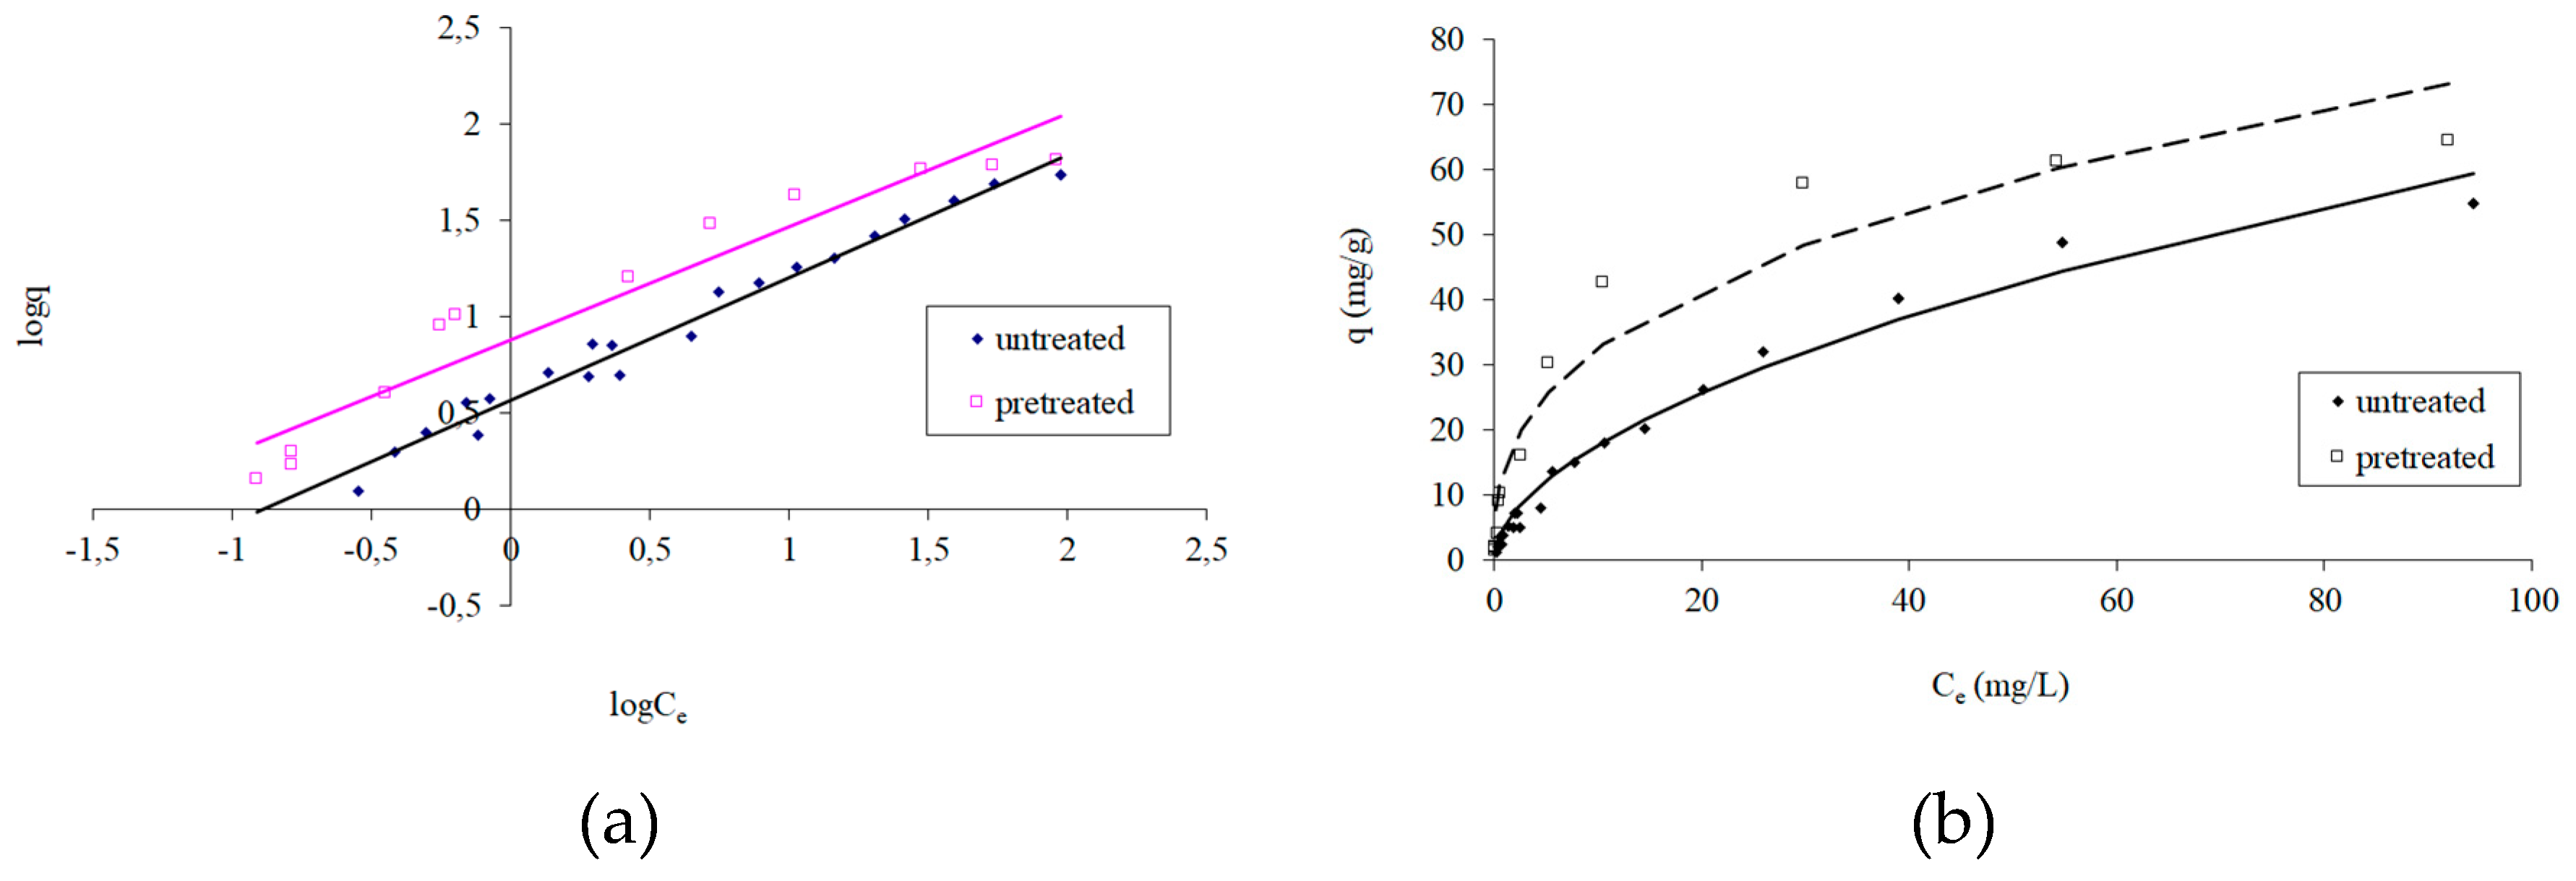
Figure 8.
Langmuir isotherm equation for Methylene Blue adsorption on pretreated (240 oC, 25 min, 178.71 mg/L NaCl) and untreated spruce sawdust (a) 1/q vs. 1/Ce and (b) q vs. Ce. Brine concentrated seven times compared to the simulated seawater.
Figure 8.
Langmuir isotherm equation for Methylene Blue adsorption on pretreated (240 oC, 25 min, 178.71 mg/L NaCl) and untreated spruce sawdust (a) 1/q vs. 1/Ce and (b) q vs. Ce. Brine concentrated seven times compared to the simulated seawater.
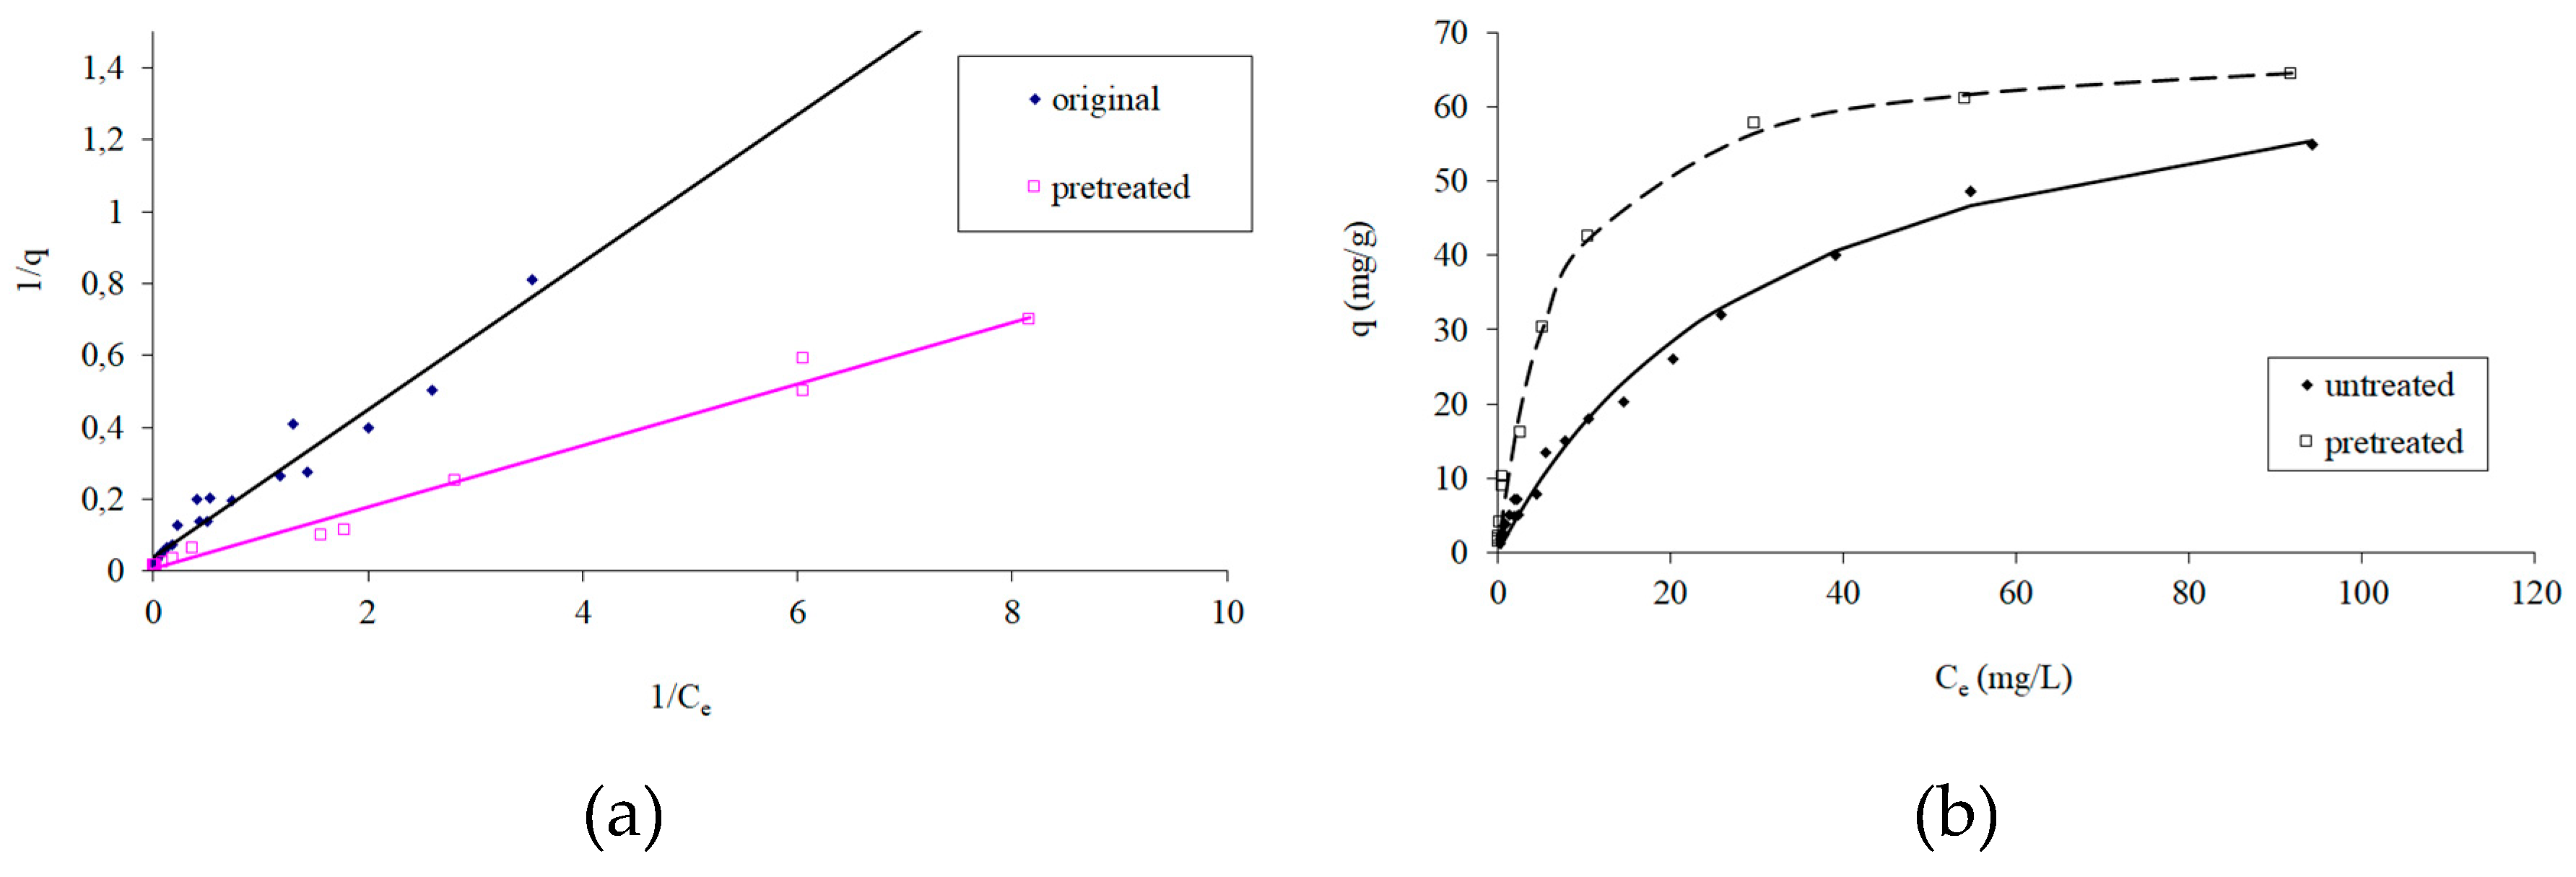
Figure 9.
Sips isotherm model for Methylene Blue adsorption on pretreated (240 oC, 25 min, 178.71 mg/L NaCl) and untreated spruce sawdust, q vs. Ce. Brine concentrated seven times compared to the simulated seawater.
Figure 9.
Sips isotherm model for Methylene Blue adsorption on pretreated (240 oC, 25 min, 178.71 mg/L NaCl) and untreated spruce sawdust, q vs. Ce. Brine concentrated seven times compared to the simulated seawater.
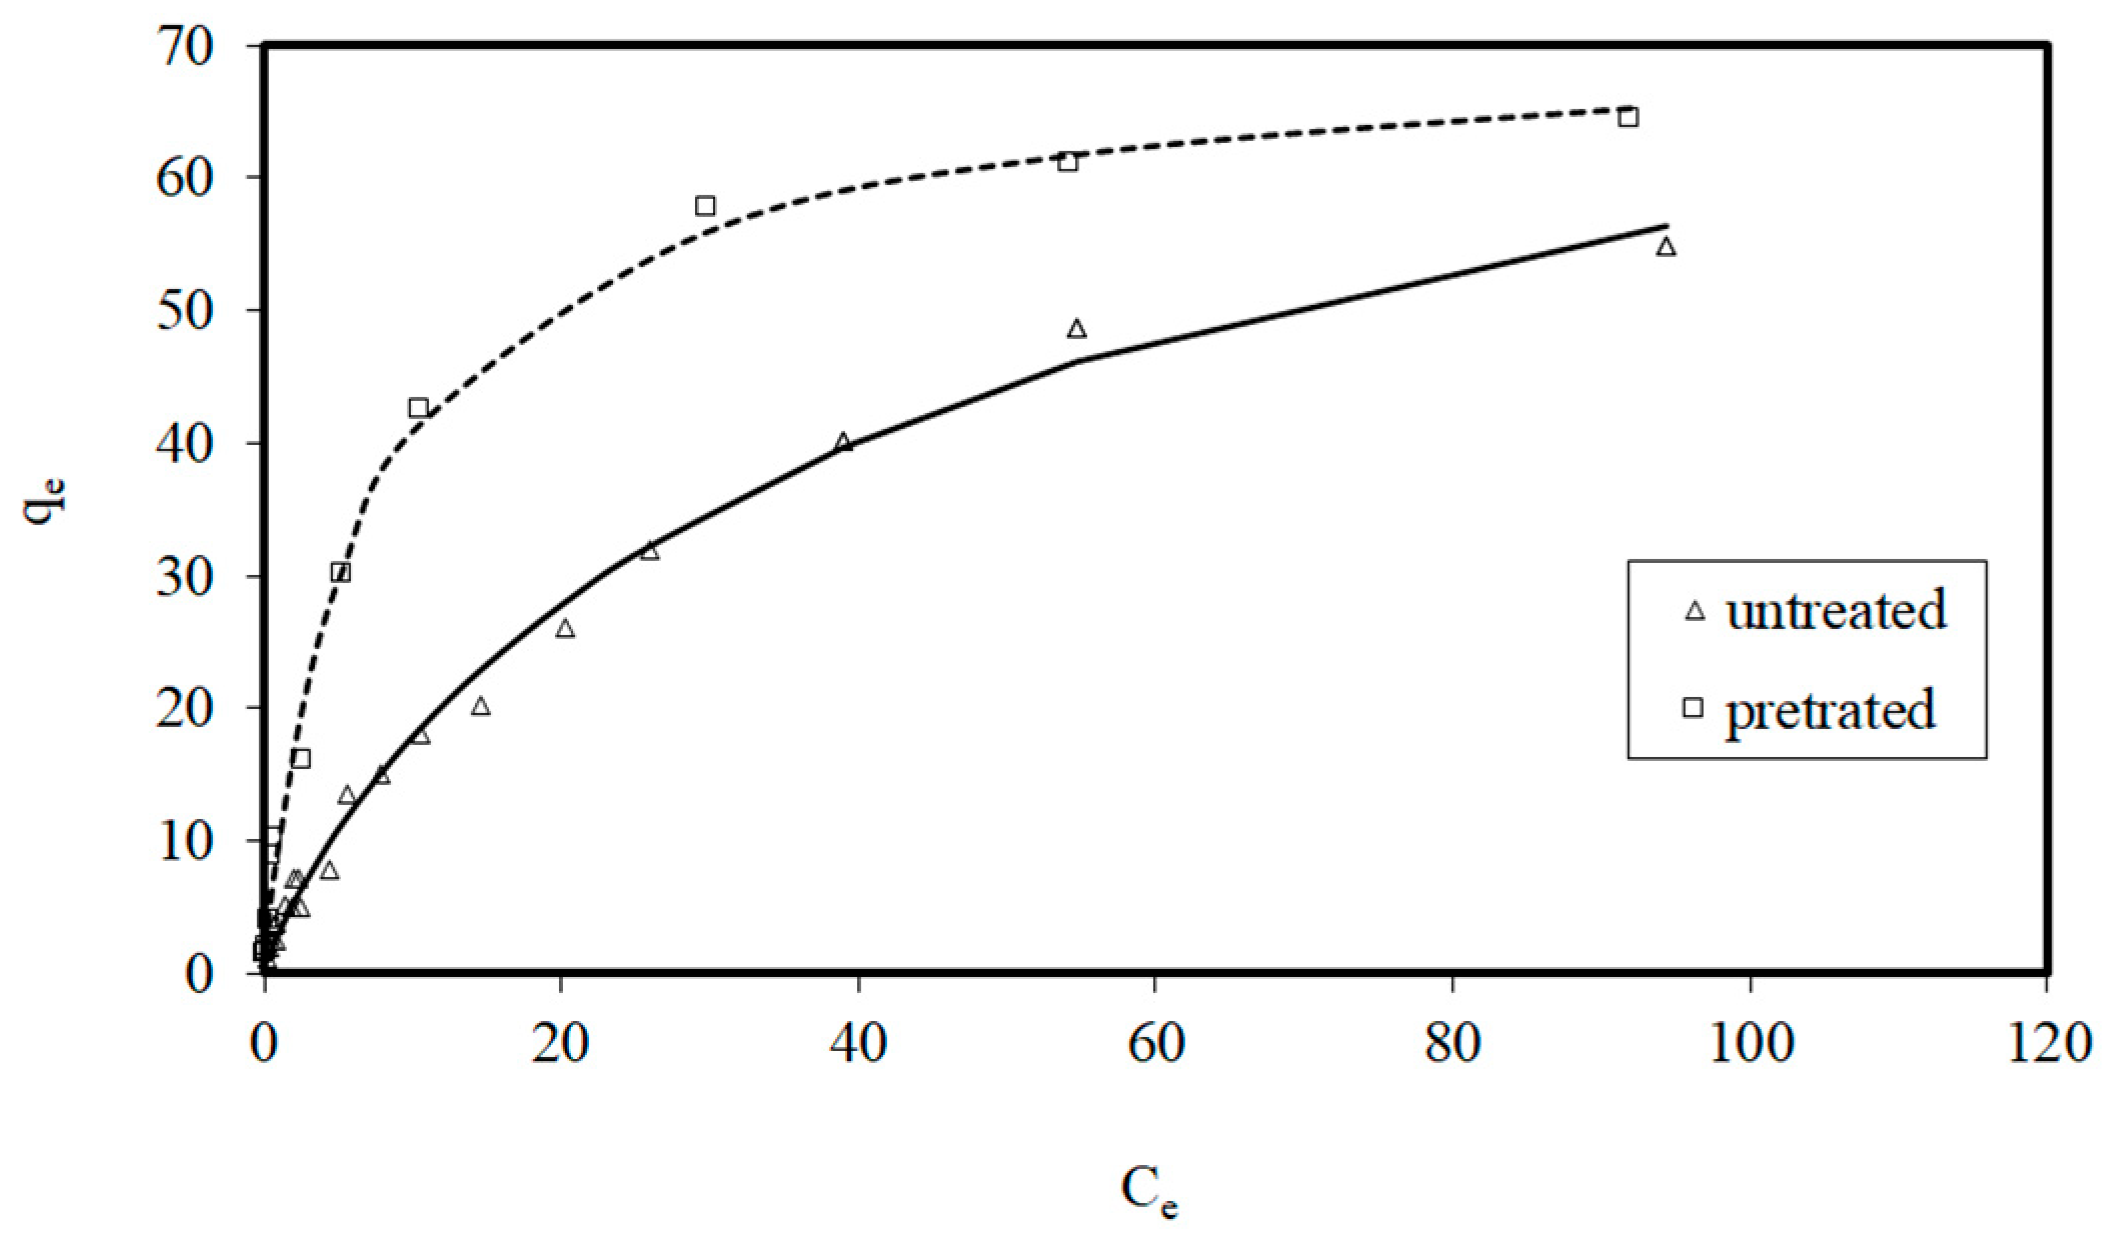
Figure 10.
Capacity KF parameter of the Freundlich isotherm model vs. combined severity factor logarithm.
Figure 10.
Capacity KF parameter of the Freundlich isotherm model vs. combined severity factor logarithm.
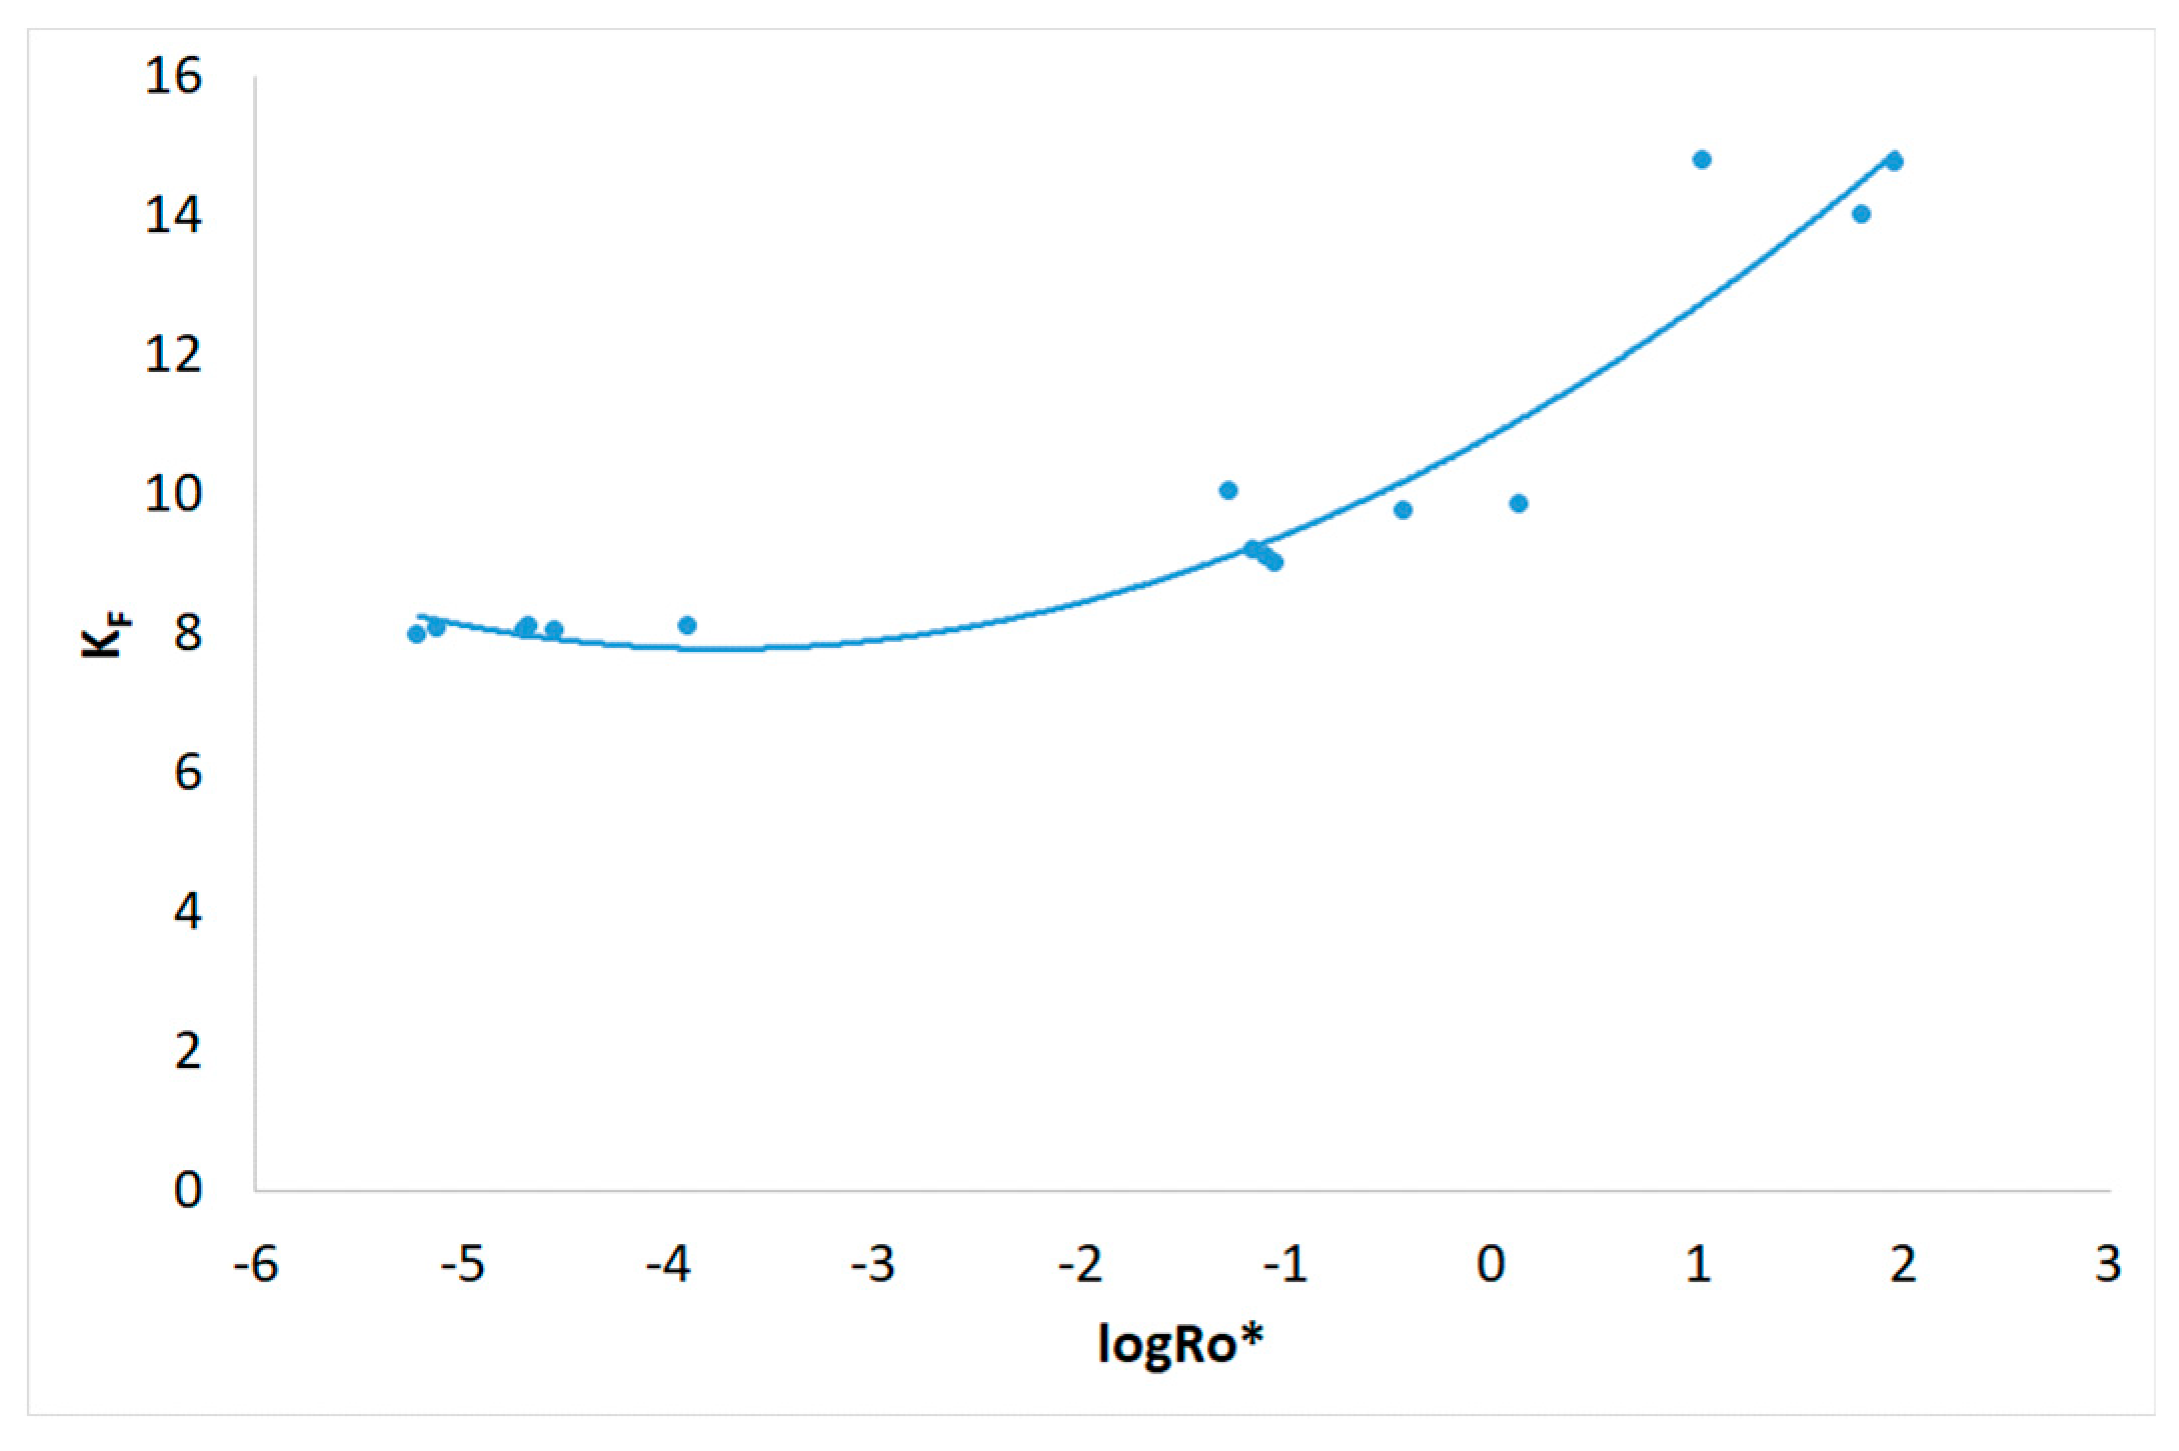
Figure 11.
Intensity n parameter of the Freundlich isotherm model vs. combined severity factor logarithm.
Figure 11.
Intensity n parameter of the Freundlich isotherm model vs. combined severity factor logarithm.
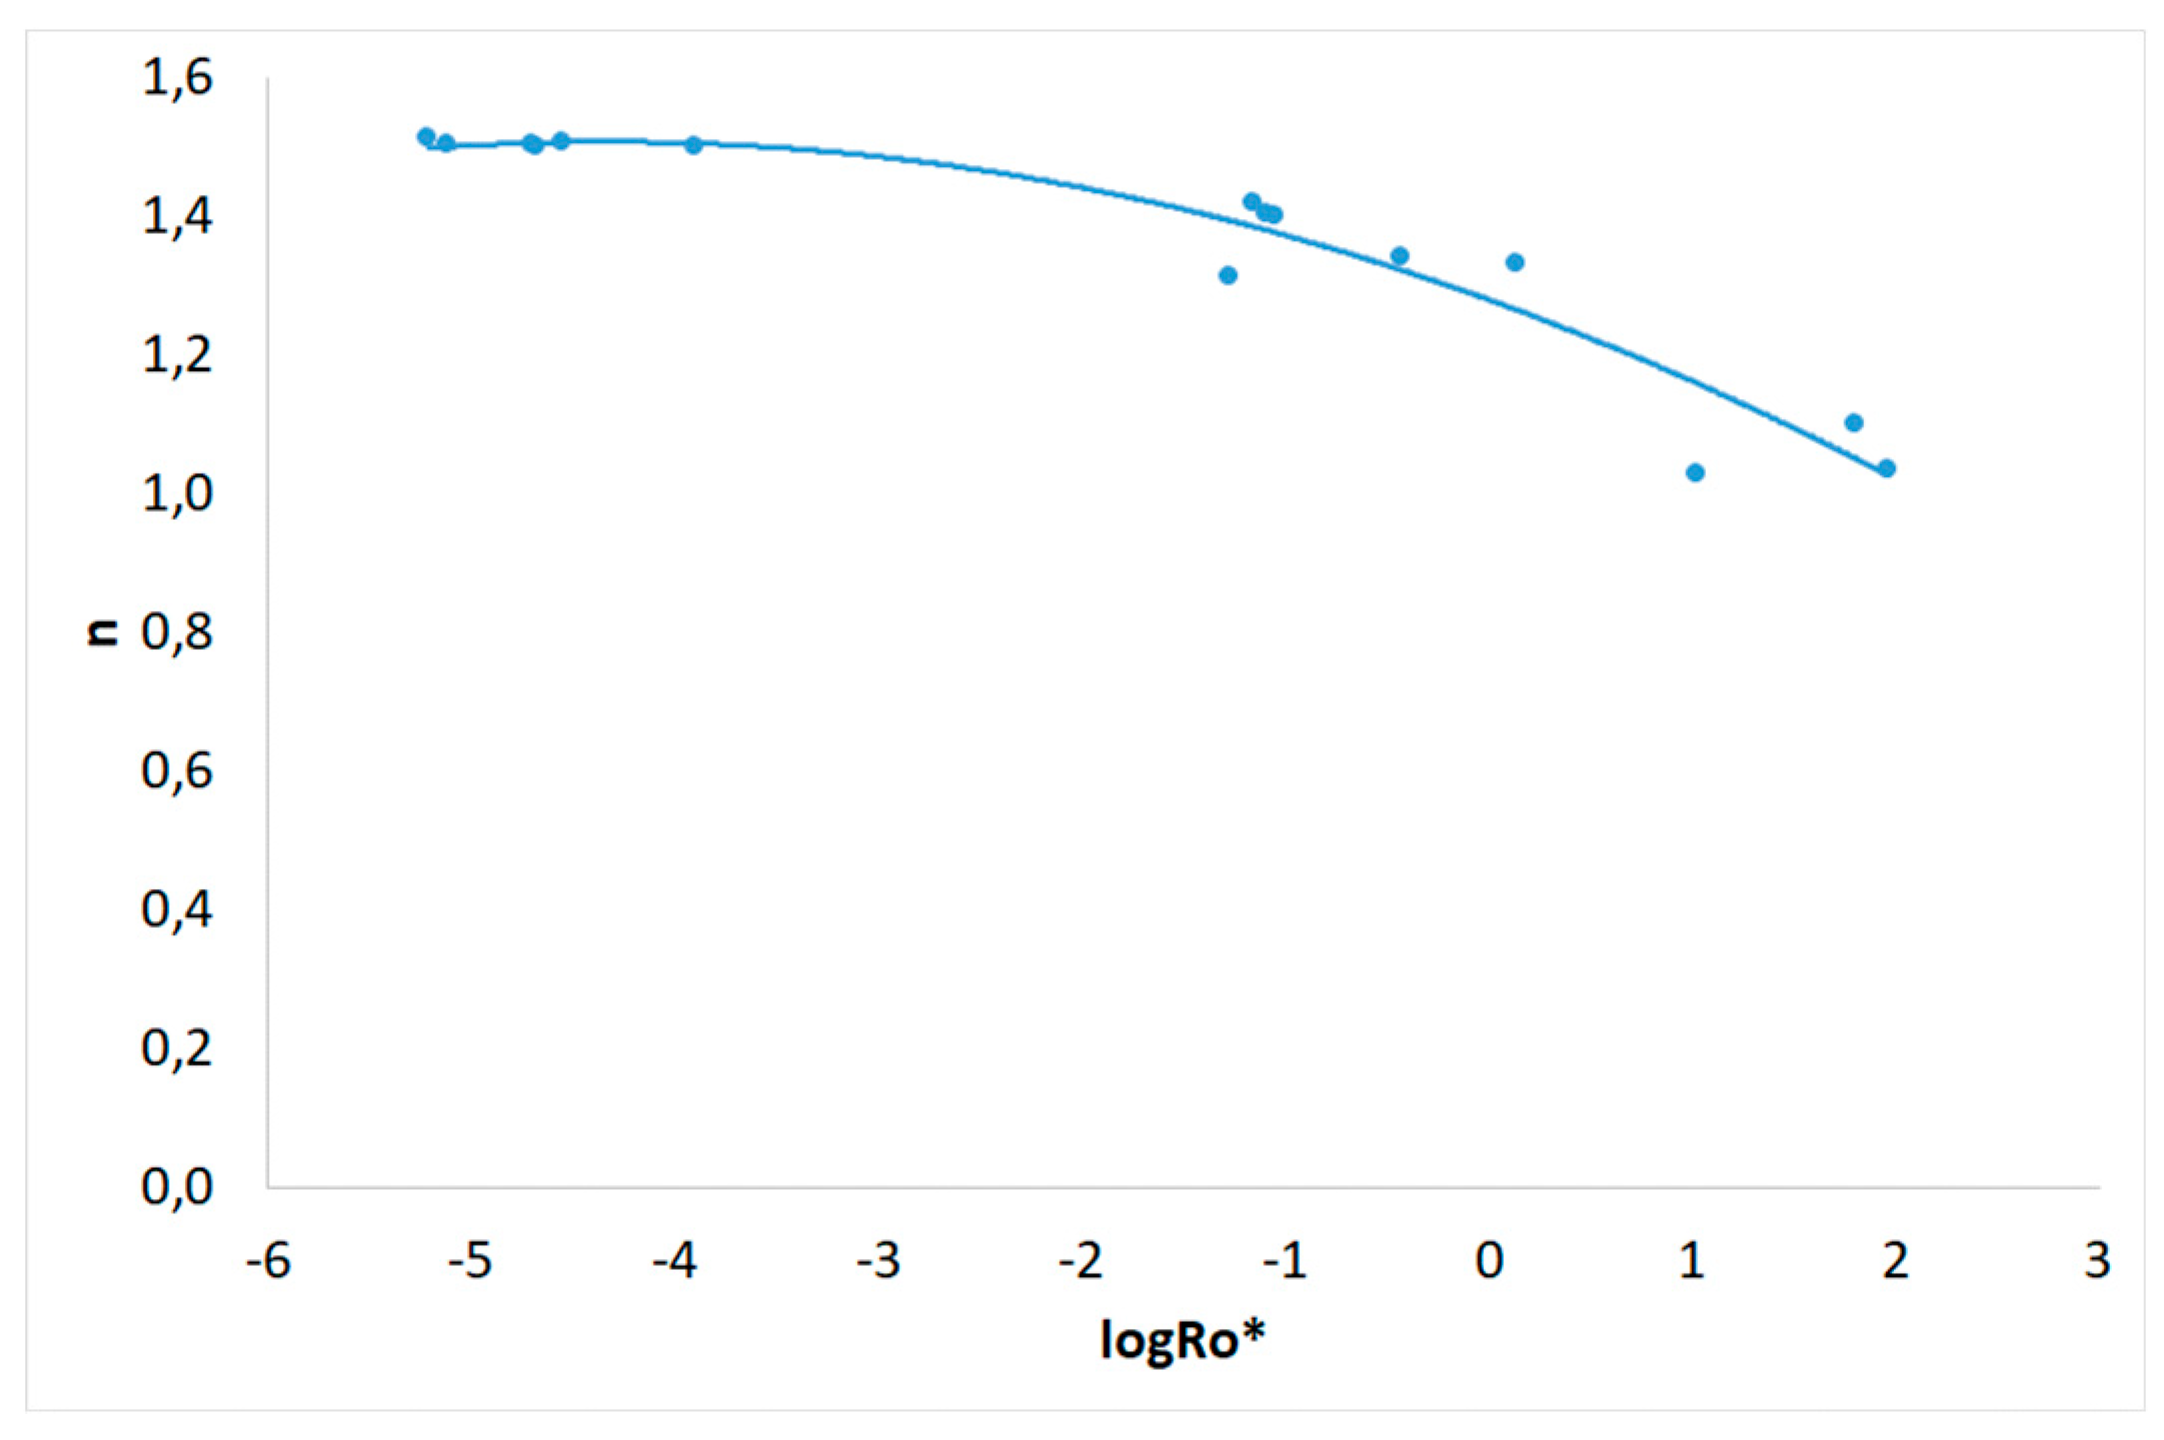
Figure 12.
The Lagergren (first order) kinetics of Methylene Blue adsorption on pretreated (200 oC, 25 min, 98.12 mg/L NaCl) and untreated spruce sawdust. Adsorption temperature 23 oC, initial Methylene Blue concentration C0=12 mg L-1, m/V=1 g L-1.
Figure 12.
The Lagergren (first order) kinetics of Methylene Blue adsorption on pretreated (200 oC, 25 min, 98.12 mg/L NaCl) and untreated spruce sawdust. Adsorption temperature 23 oC, initial Methylene Blue concentration C0=12 mg L-1, m/V=1 g L-1.
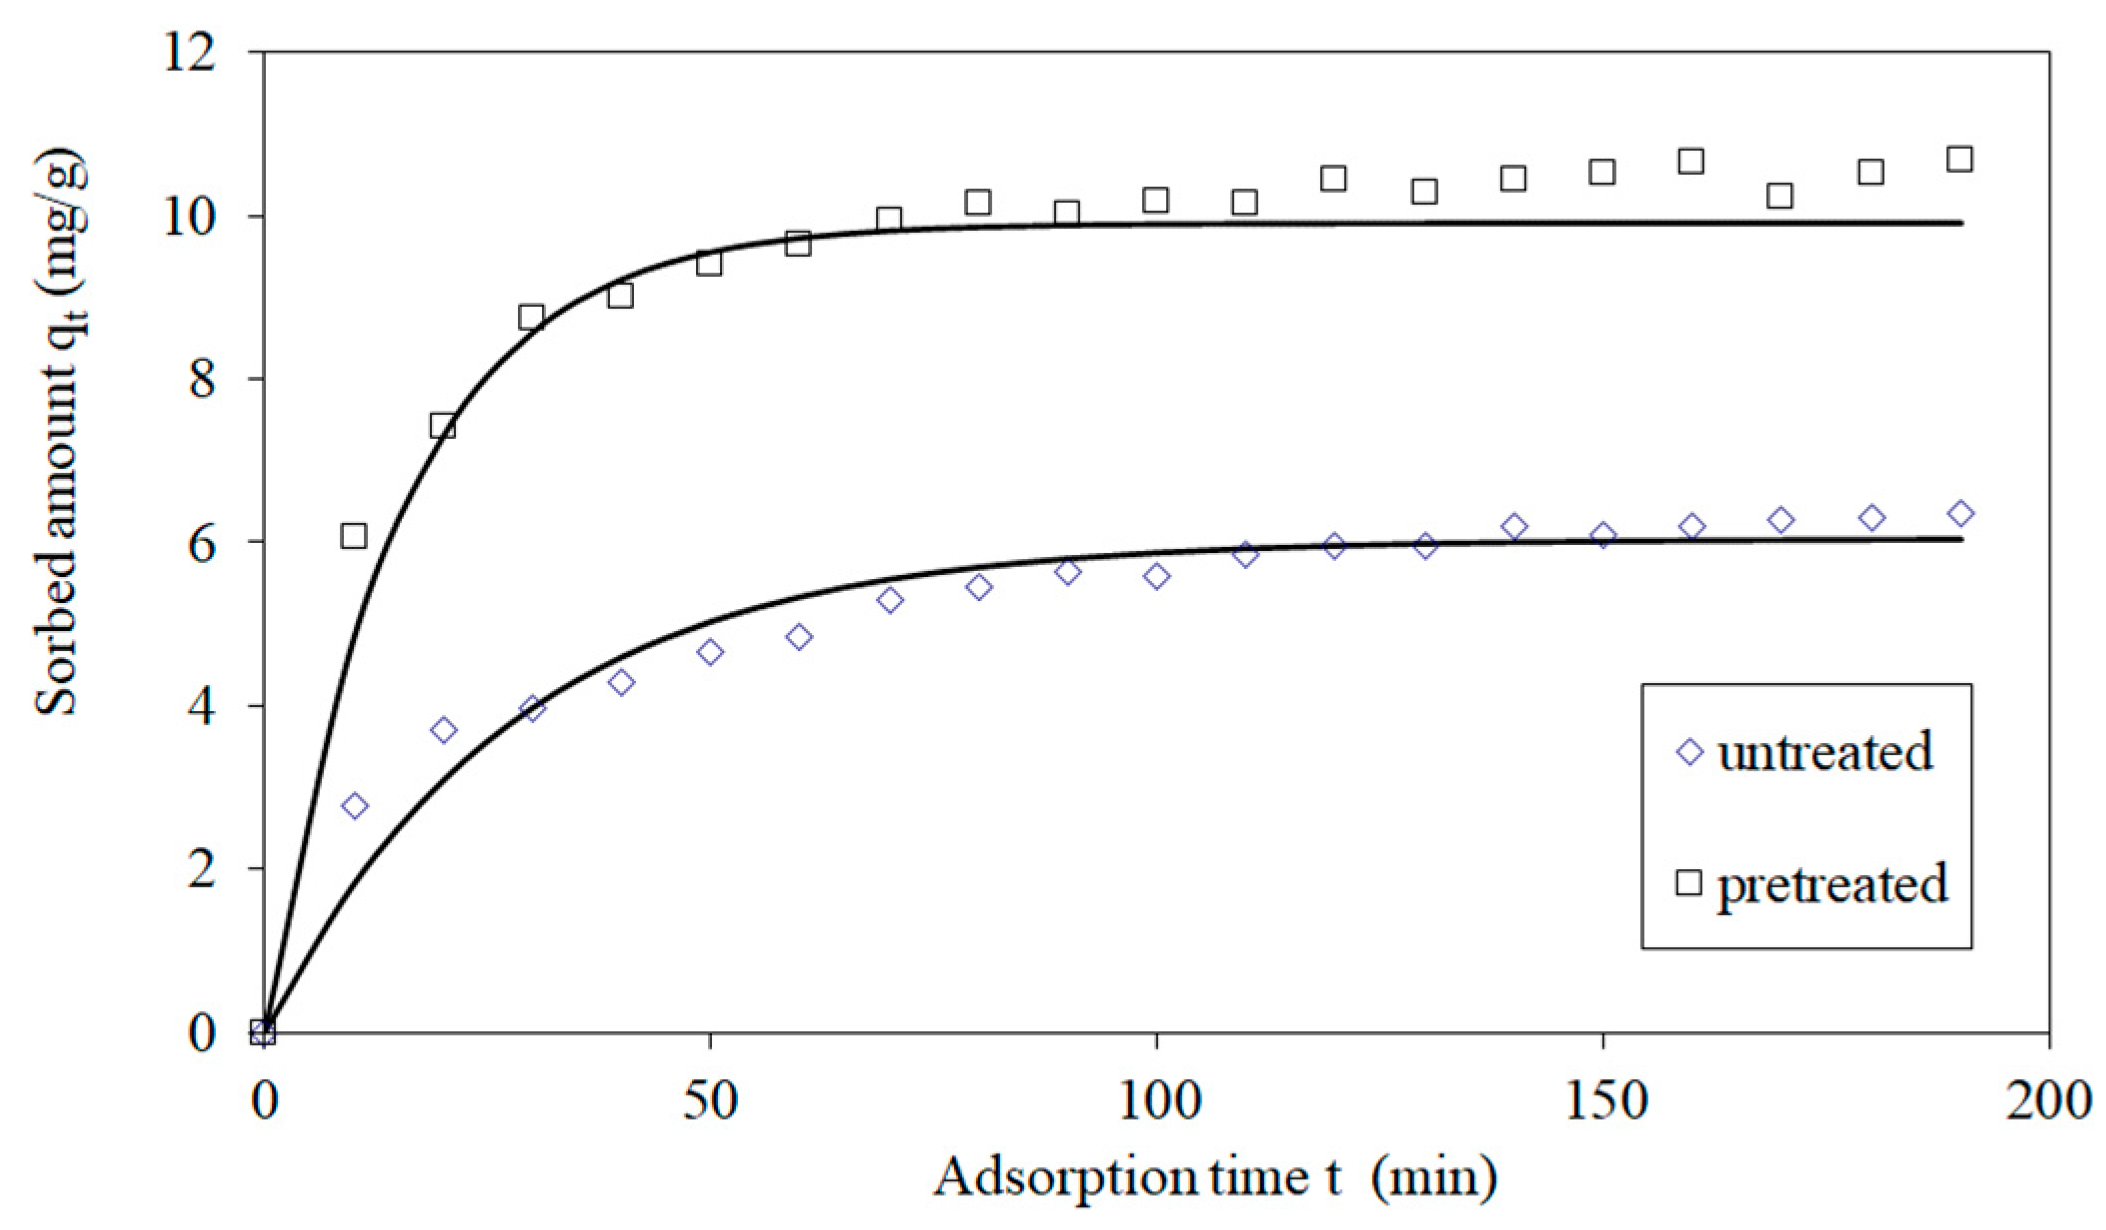
Figure 13.
Lagergren adsorption kinetic rate parameter k for Methylene Blue adsorption on pretreated and untreated spruce vs. the logarithm of the combined severity factor.
Figure 13.
Lagergren adsorption kinetic rate parameter k for Methylene Blue adsorption on pretreated and untreated spruce vs. the logarithm of the combined severity factor.
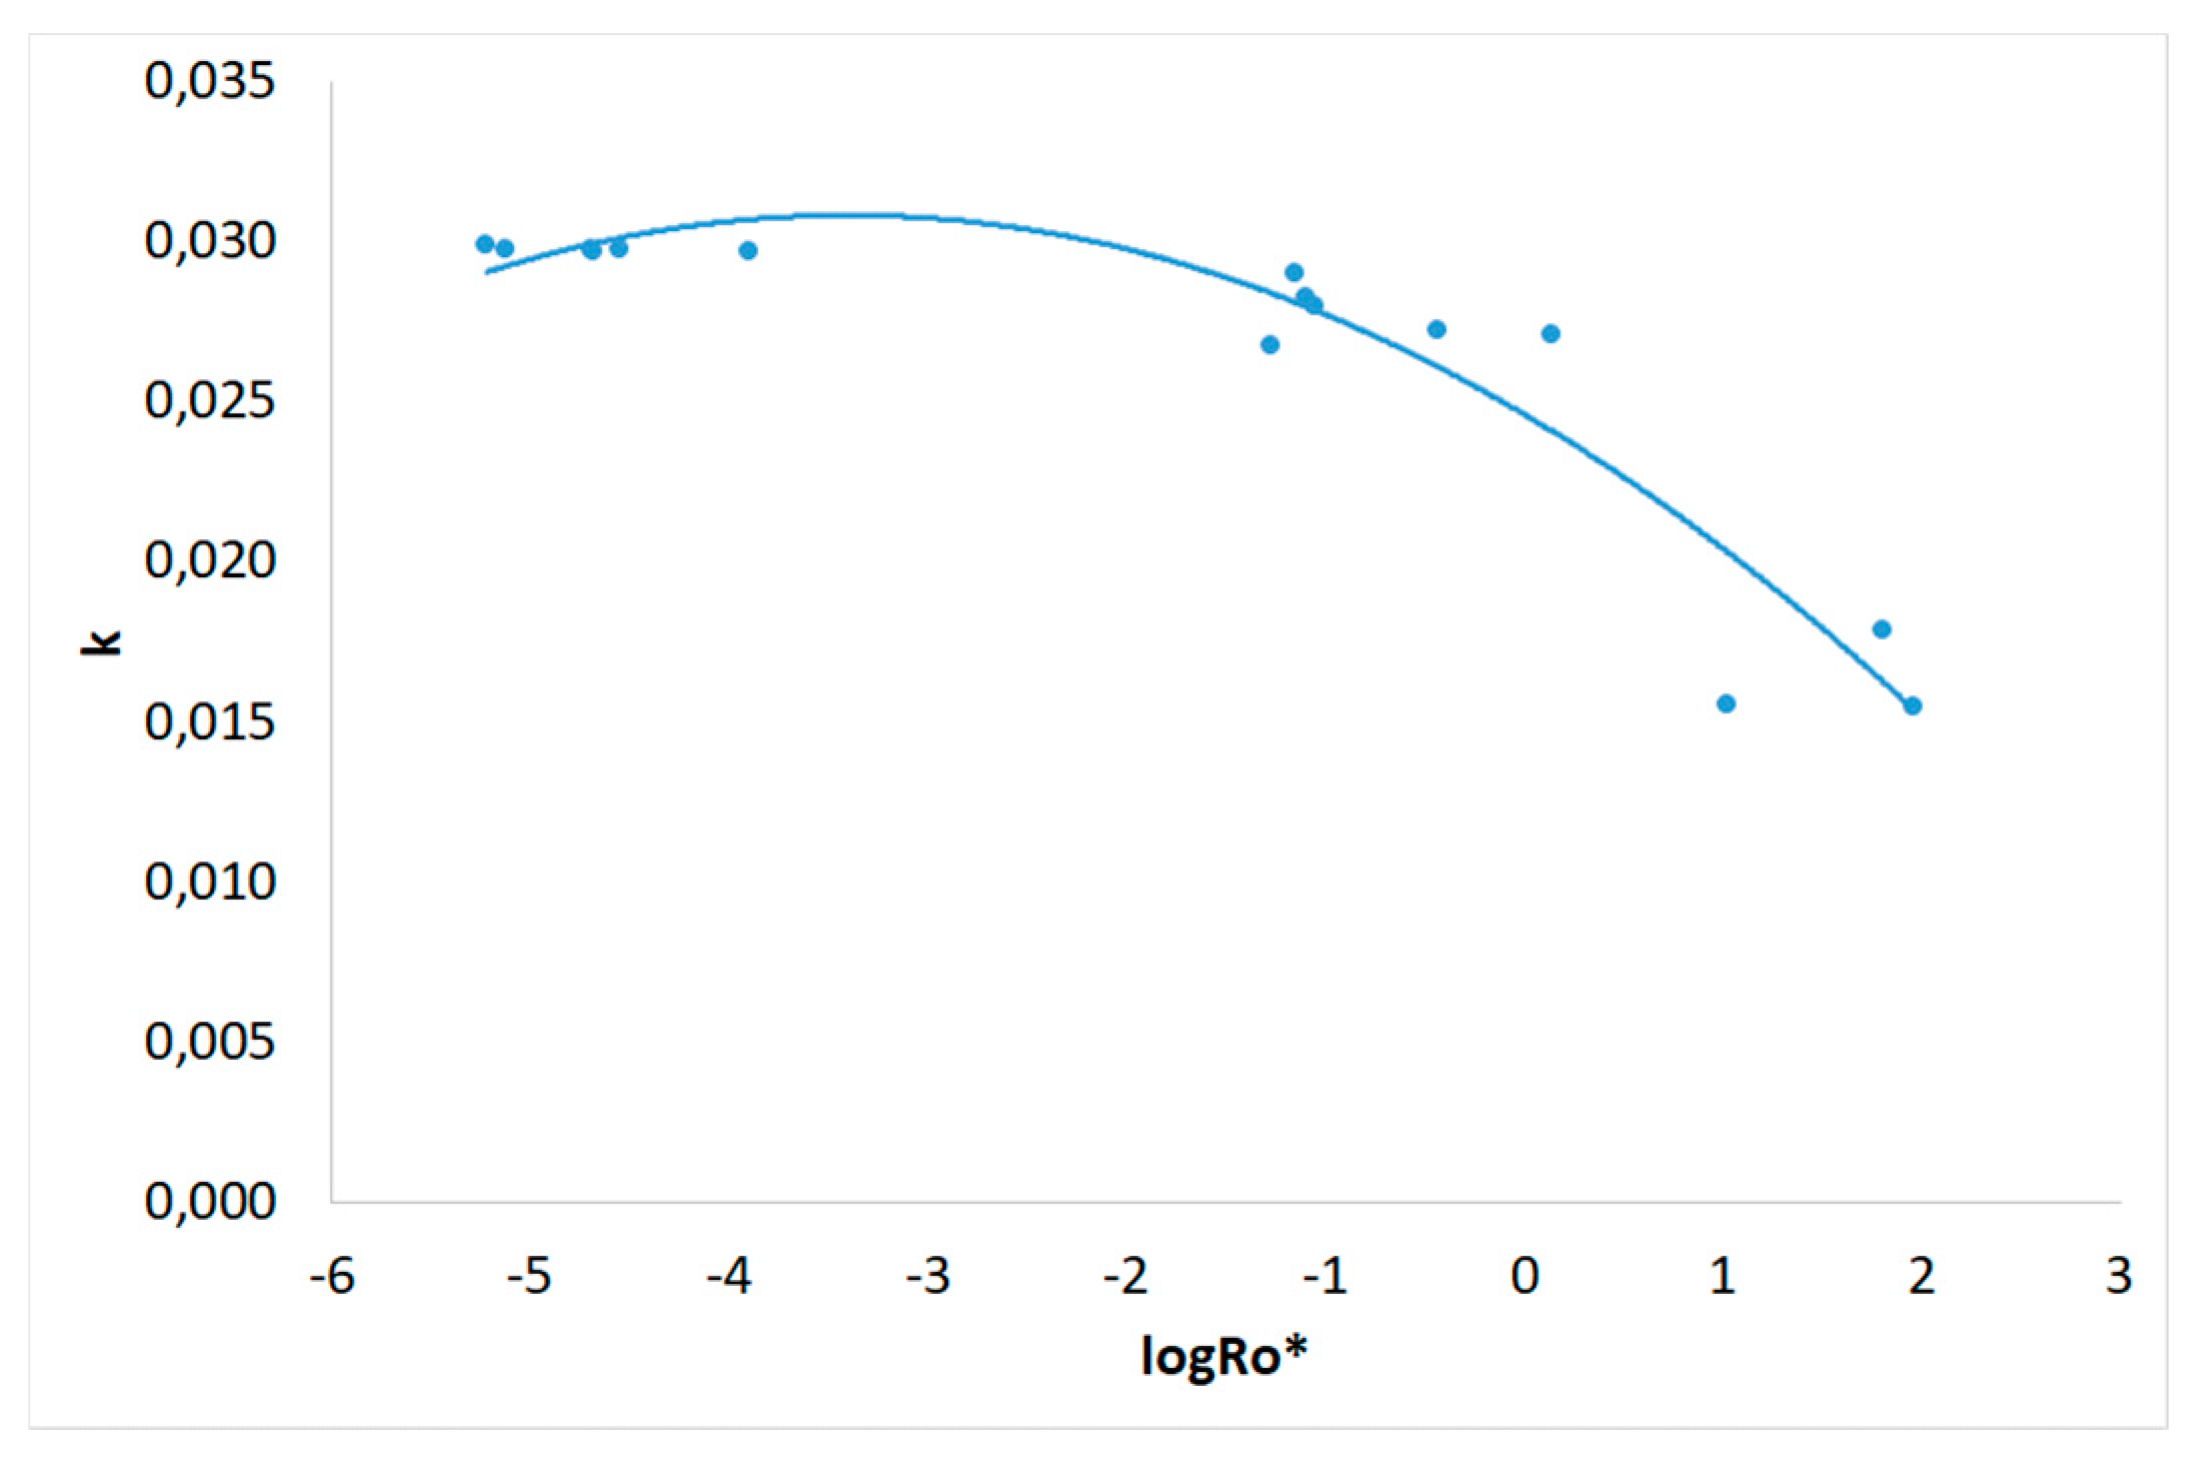
Figure 14.
Lagergren adsorption capacity parameter qe for Methylene Blue adsorption on pretreated and untreated spruce vs. the logarithm of the combined severity factor.
Figure 14.
Lagergren adsorption capacity parameter qe for Methylene Blue adsorption on pretreated and untreated spruce vs. the logarithm of the combined severity factor.
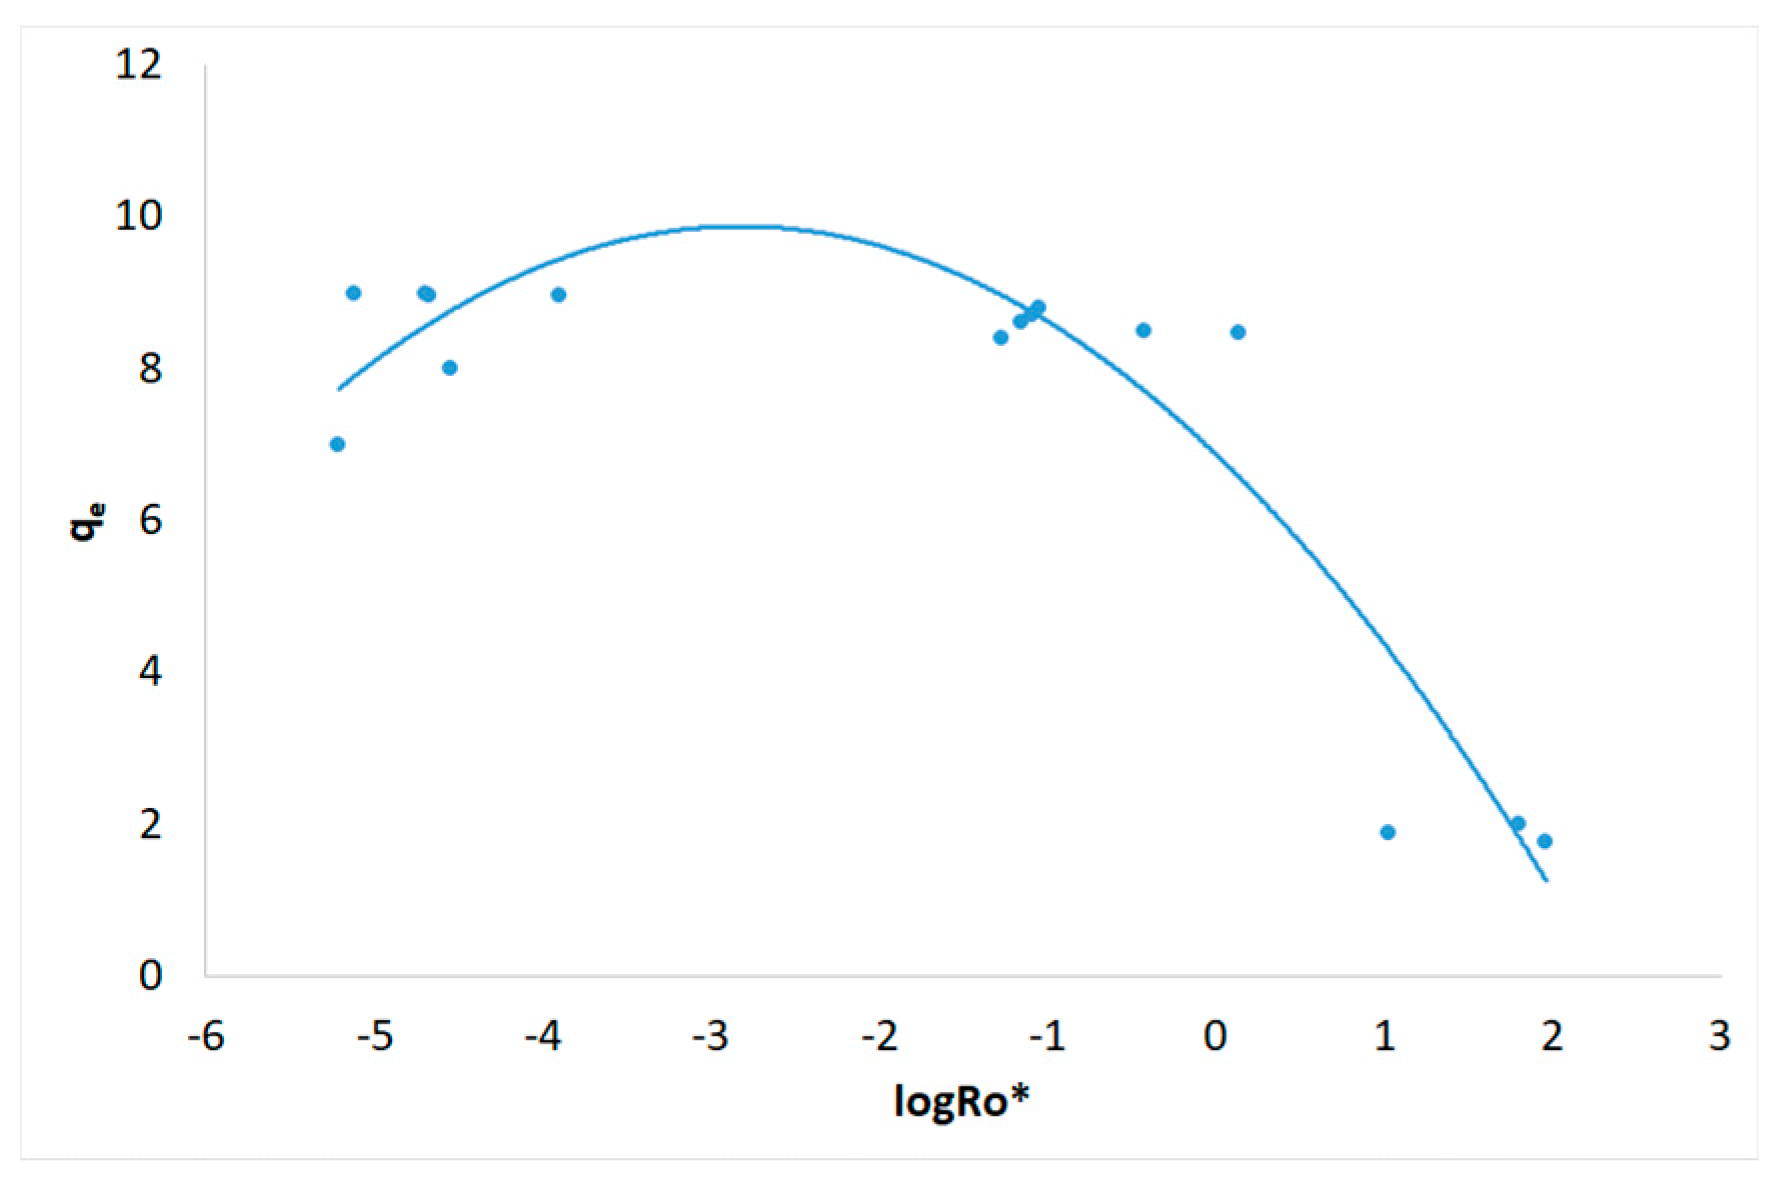
Figure 15.
Second order kinetics of Methylene Blue adsorption on pretreated (240 oC, 25 min, 178.71 mg/L NaCl) untreated and spruce sawdust. Adsorption temperature 23 oC, Methylene Blue initial concentration Co=12 mg L-1, m/V=1 gL-1.
Figure 15.
Second order kinetics of Methylene Blue adsorption on pretreated (240 oC, 25 min, 178.71 mg/L NaCl) untreated and spruce sawdust. Adsorption temperature 23 oC, Methylene Blue initial concentration Co=12 mg L-1, m/V=1 gL-1.
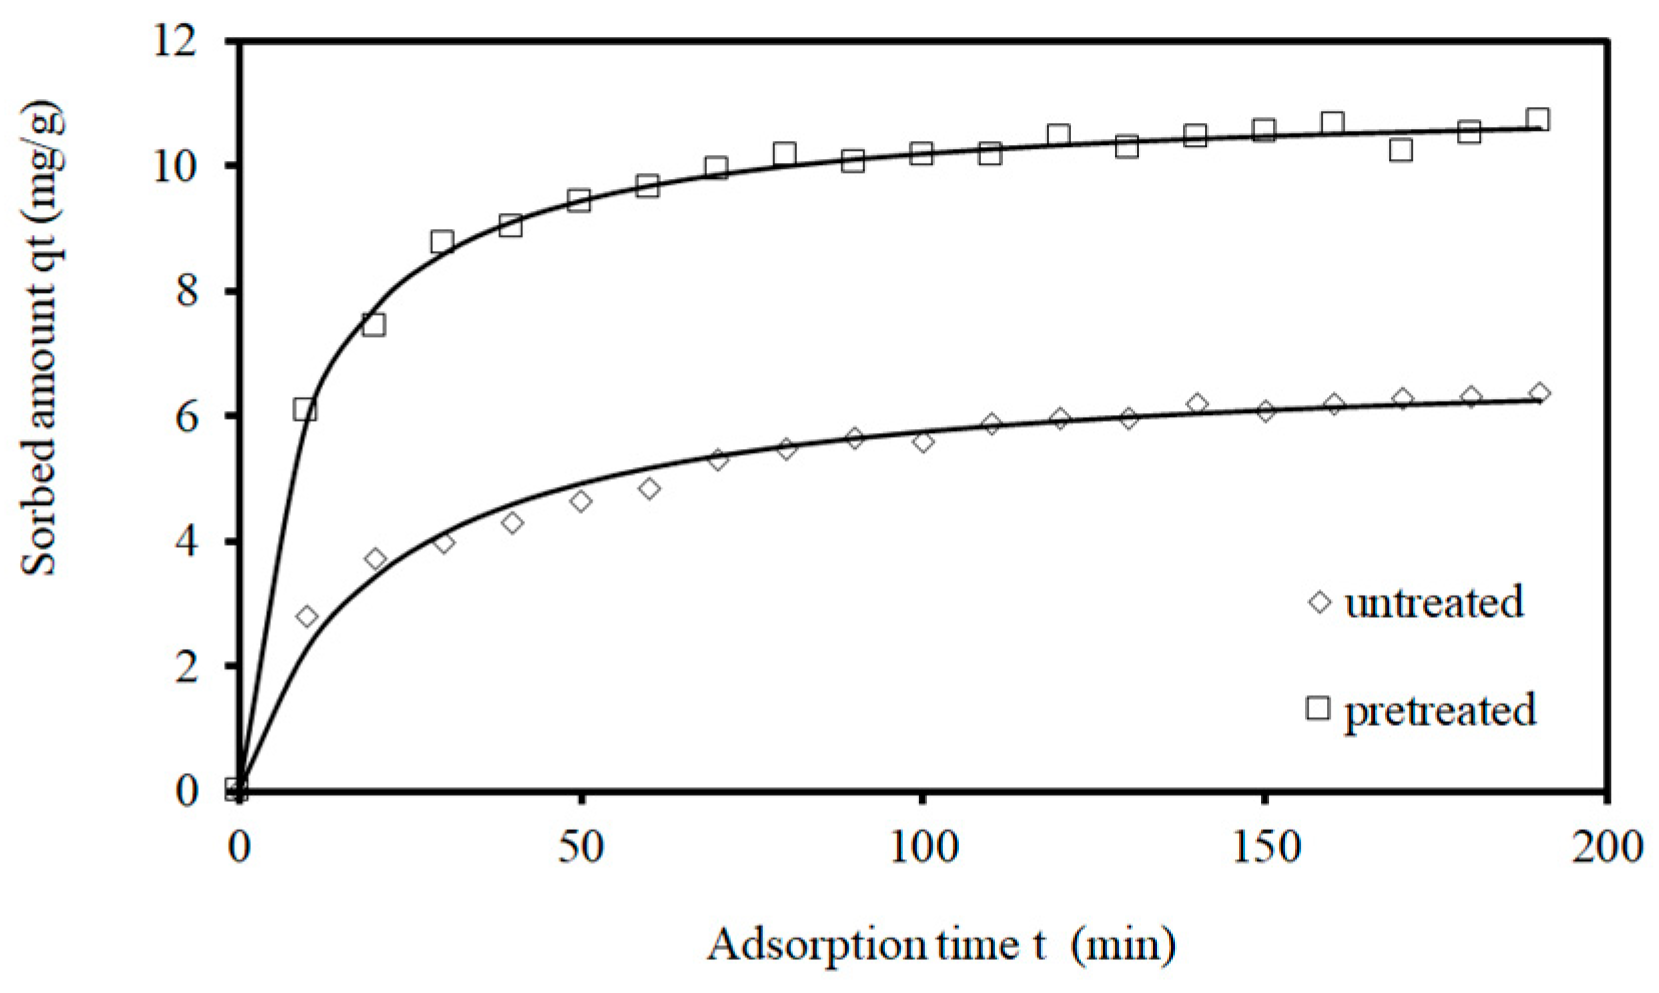
Figure 16.
Intraparticle kinetics of Methylene Blue adsorption on untreated and brine treated (200 oC, 25 min, ×4) spruce sawdust (a) qt vs t0.5 and (b) qt vs t. Adsorption temperature 23 oC, MB initial concentration Co=12 mg L-1, m/V=1 gL-1.
Figure 16.
Intraparticle kinetics of Methylene Blue adsorption on untreated and brine treated (200 oC, 25 min, ×4) spruce sawdust (a) qt vs t0.5 and (b) qt vs t. Adsorption temperature 23 oC, MB initial concentration Co=12 mg L-1, m/V=1 gL-1.
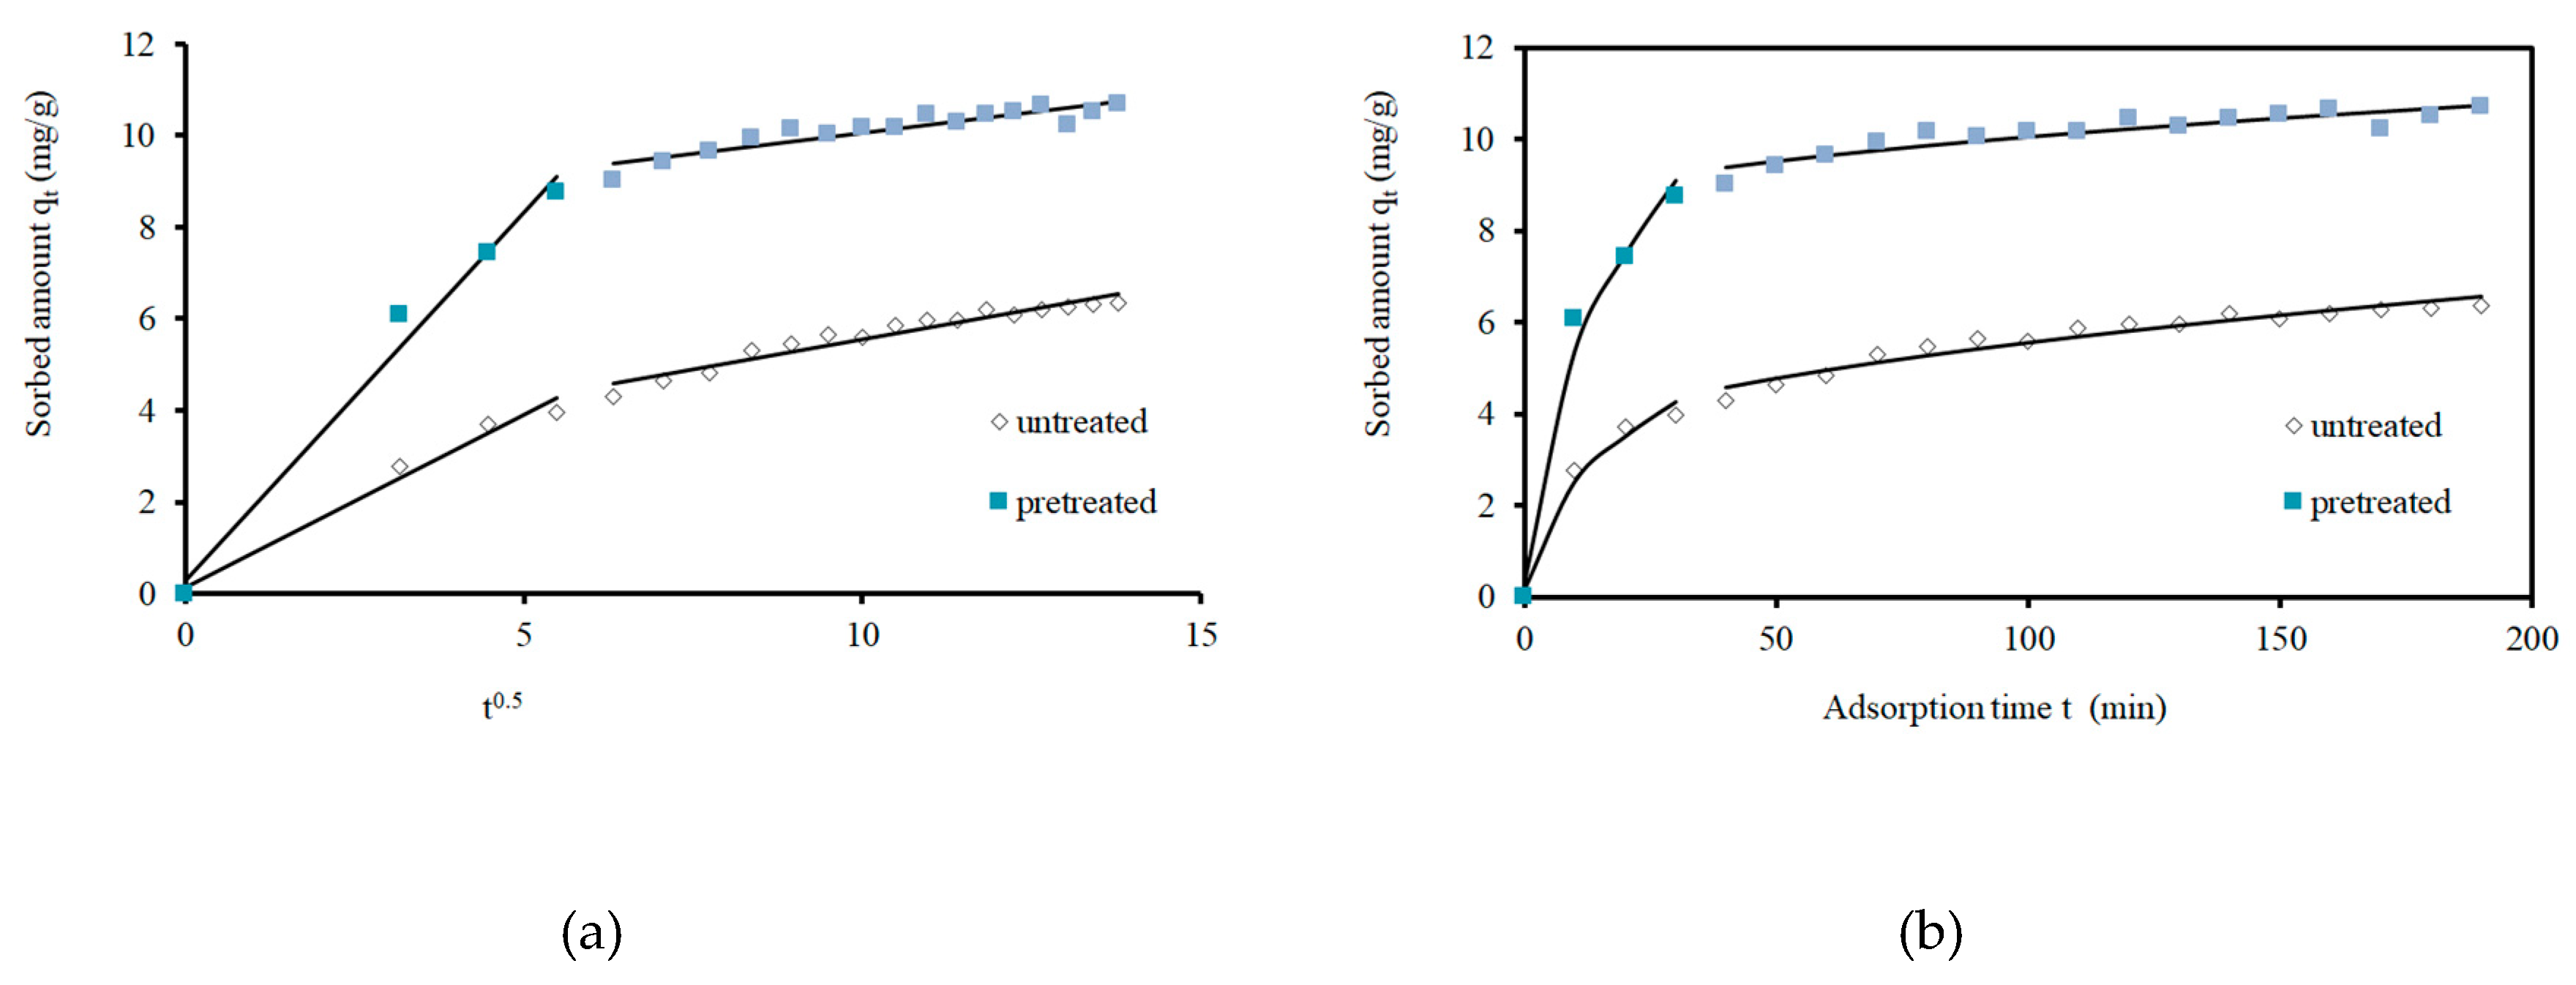
Figure 17.
SEM of untreated spruce sawdust with magnification (a) 750 ×, (b) 7500 × and (c) 30,000 ×.
Figure 17.
SEM of untreated spruce sawdust with magnification (a) 750 ×, (b) 7500 × and (c) 30,000 ×.
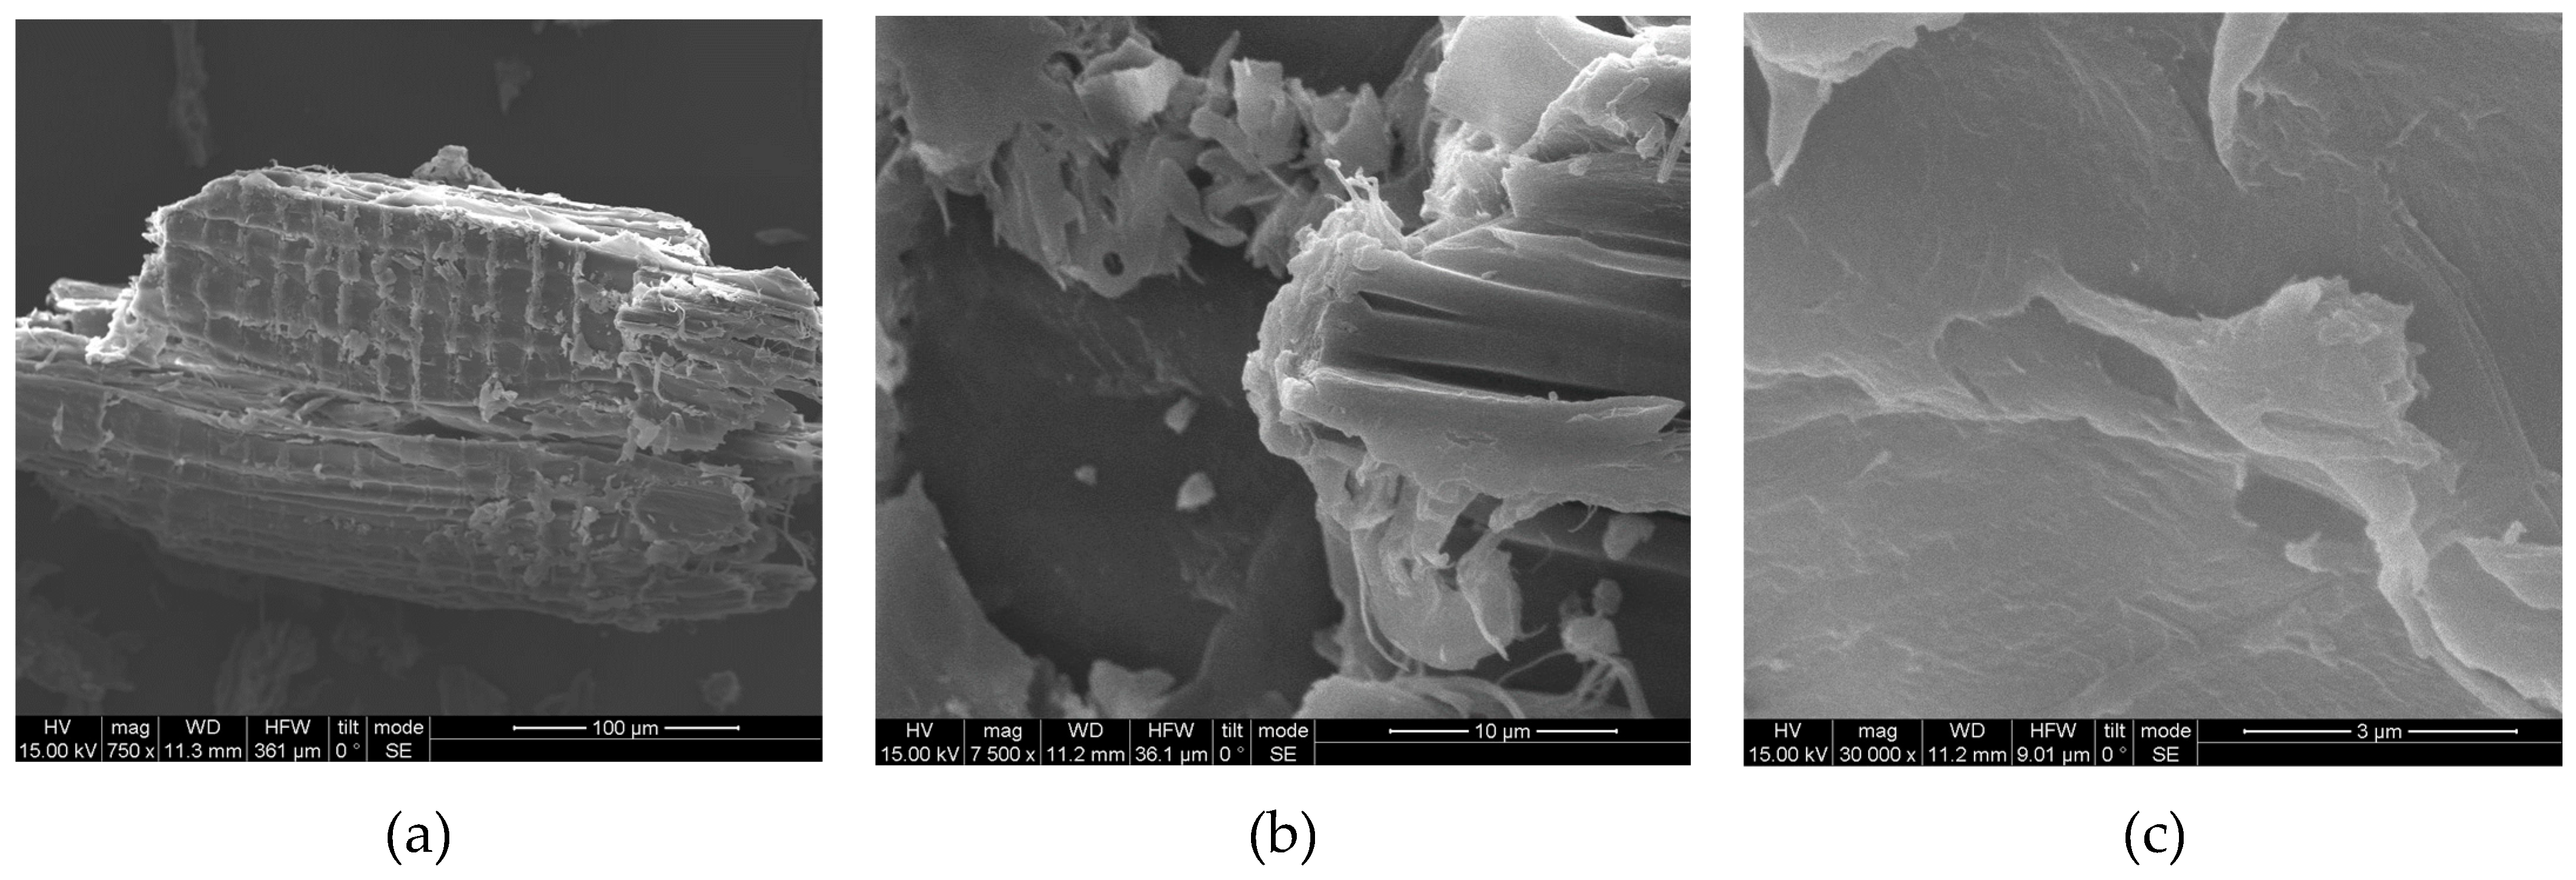
Figure 18.
SEM of pretreated spruce sawdust. The pretreatment was using desalination brine (containing 178,71 g L-1 NaCl etc.) at 200 oC for 50min. The magnification was (a) 750 ×, (b) 7500 × and (c) 30,000 ×.
Figure 18.
SEM of pretreated spruce sawdust. The pretreatment was using desalination brine (containing 178,71 g L-1 NaCl etc.) at 200 oC for 50min. The magnification was (a) 750 ×, (b) 7500 × and (c) 30,000 ×.
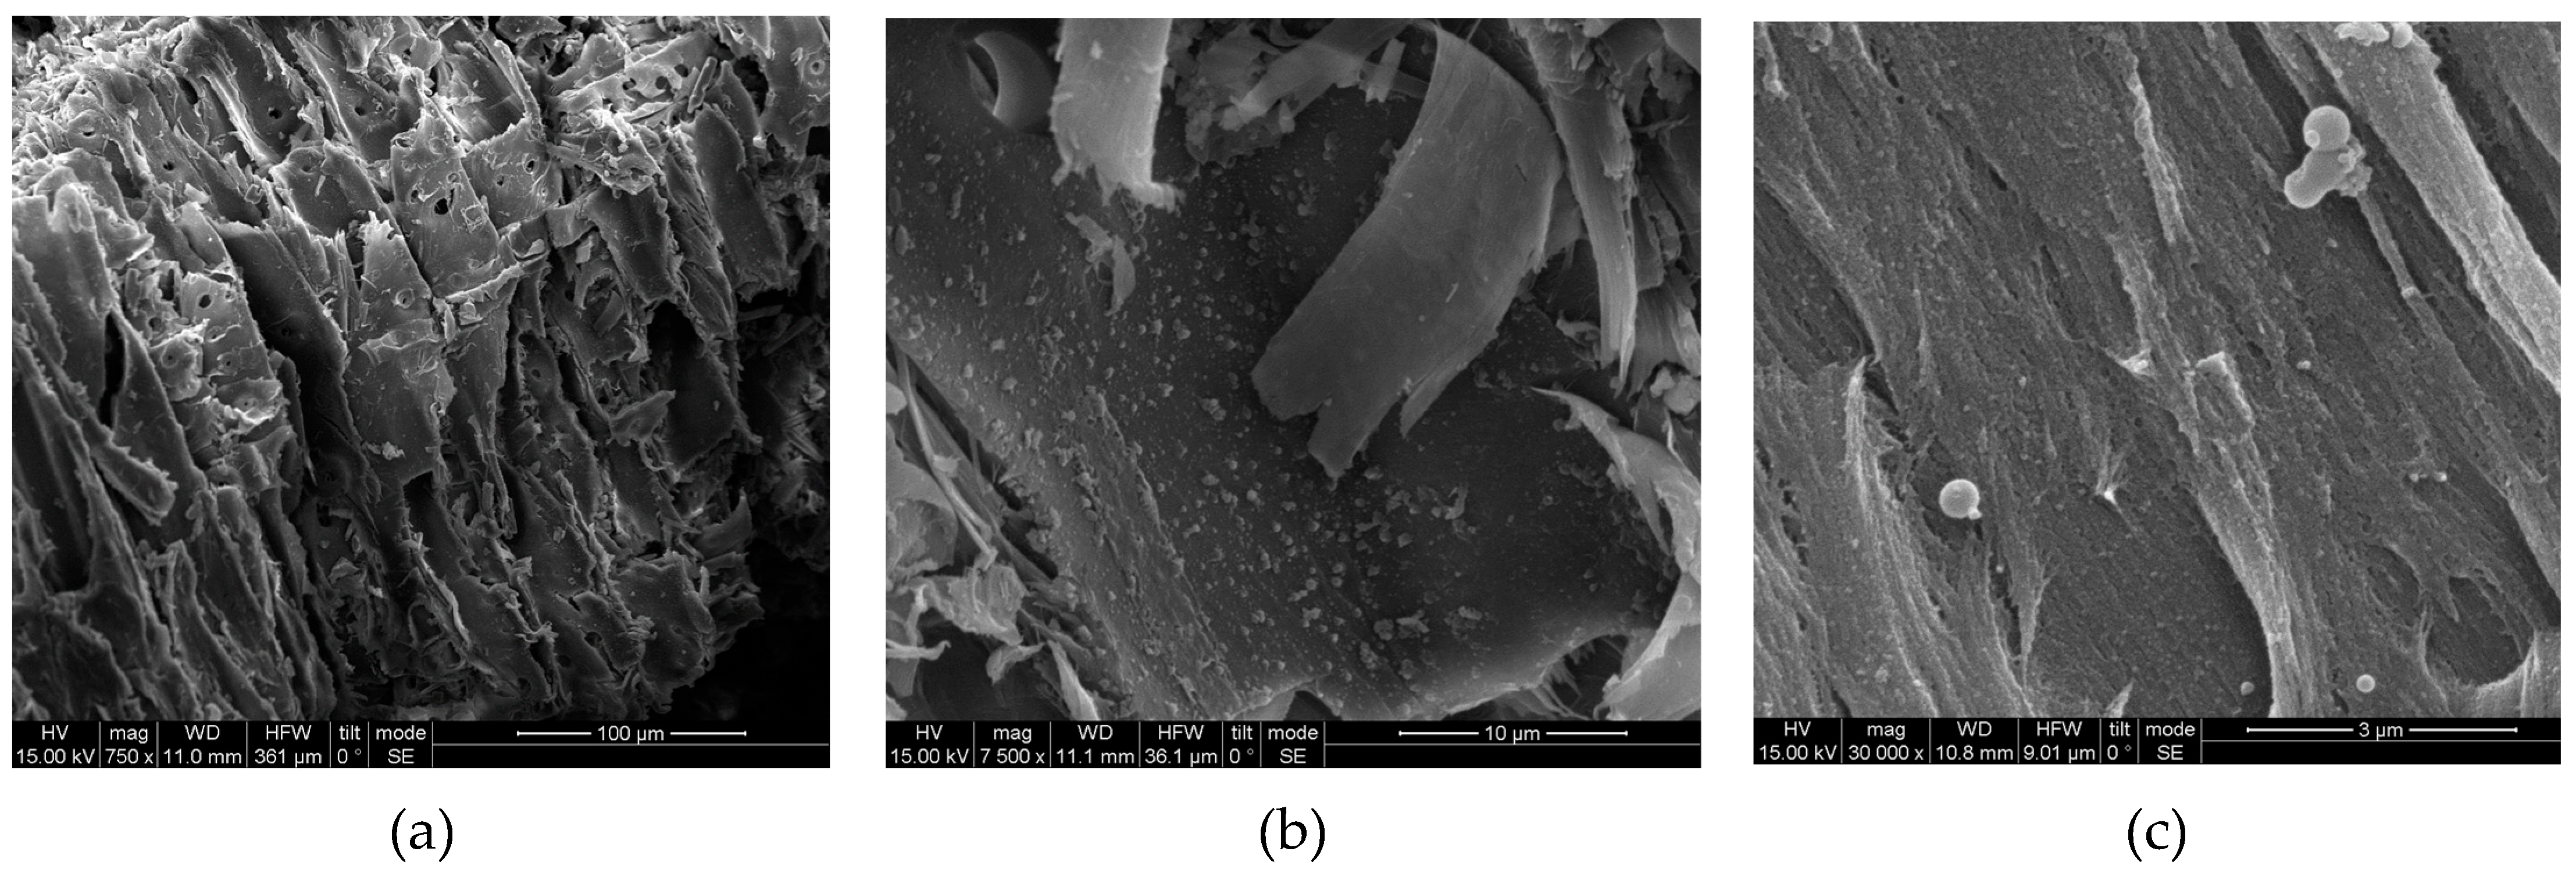
Figure 19.
FTIR spectra of (a) untreated and (b) desalination brine pretreated spruce sawdust.
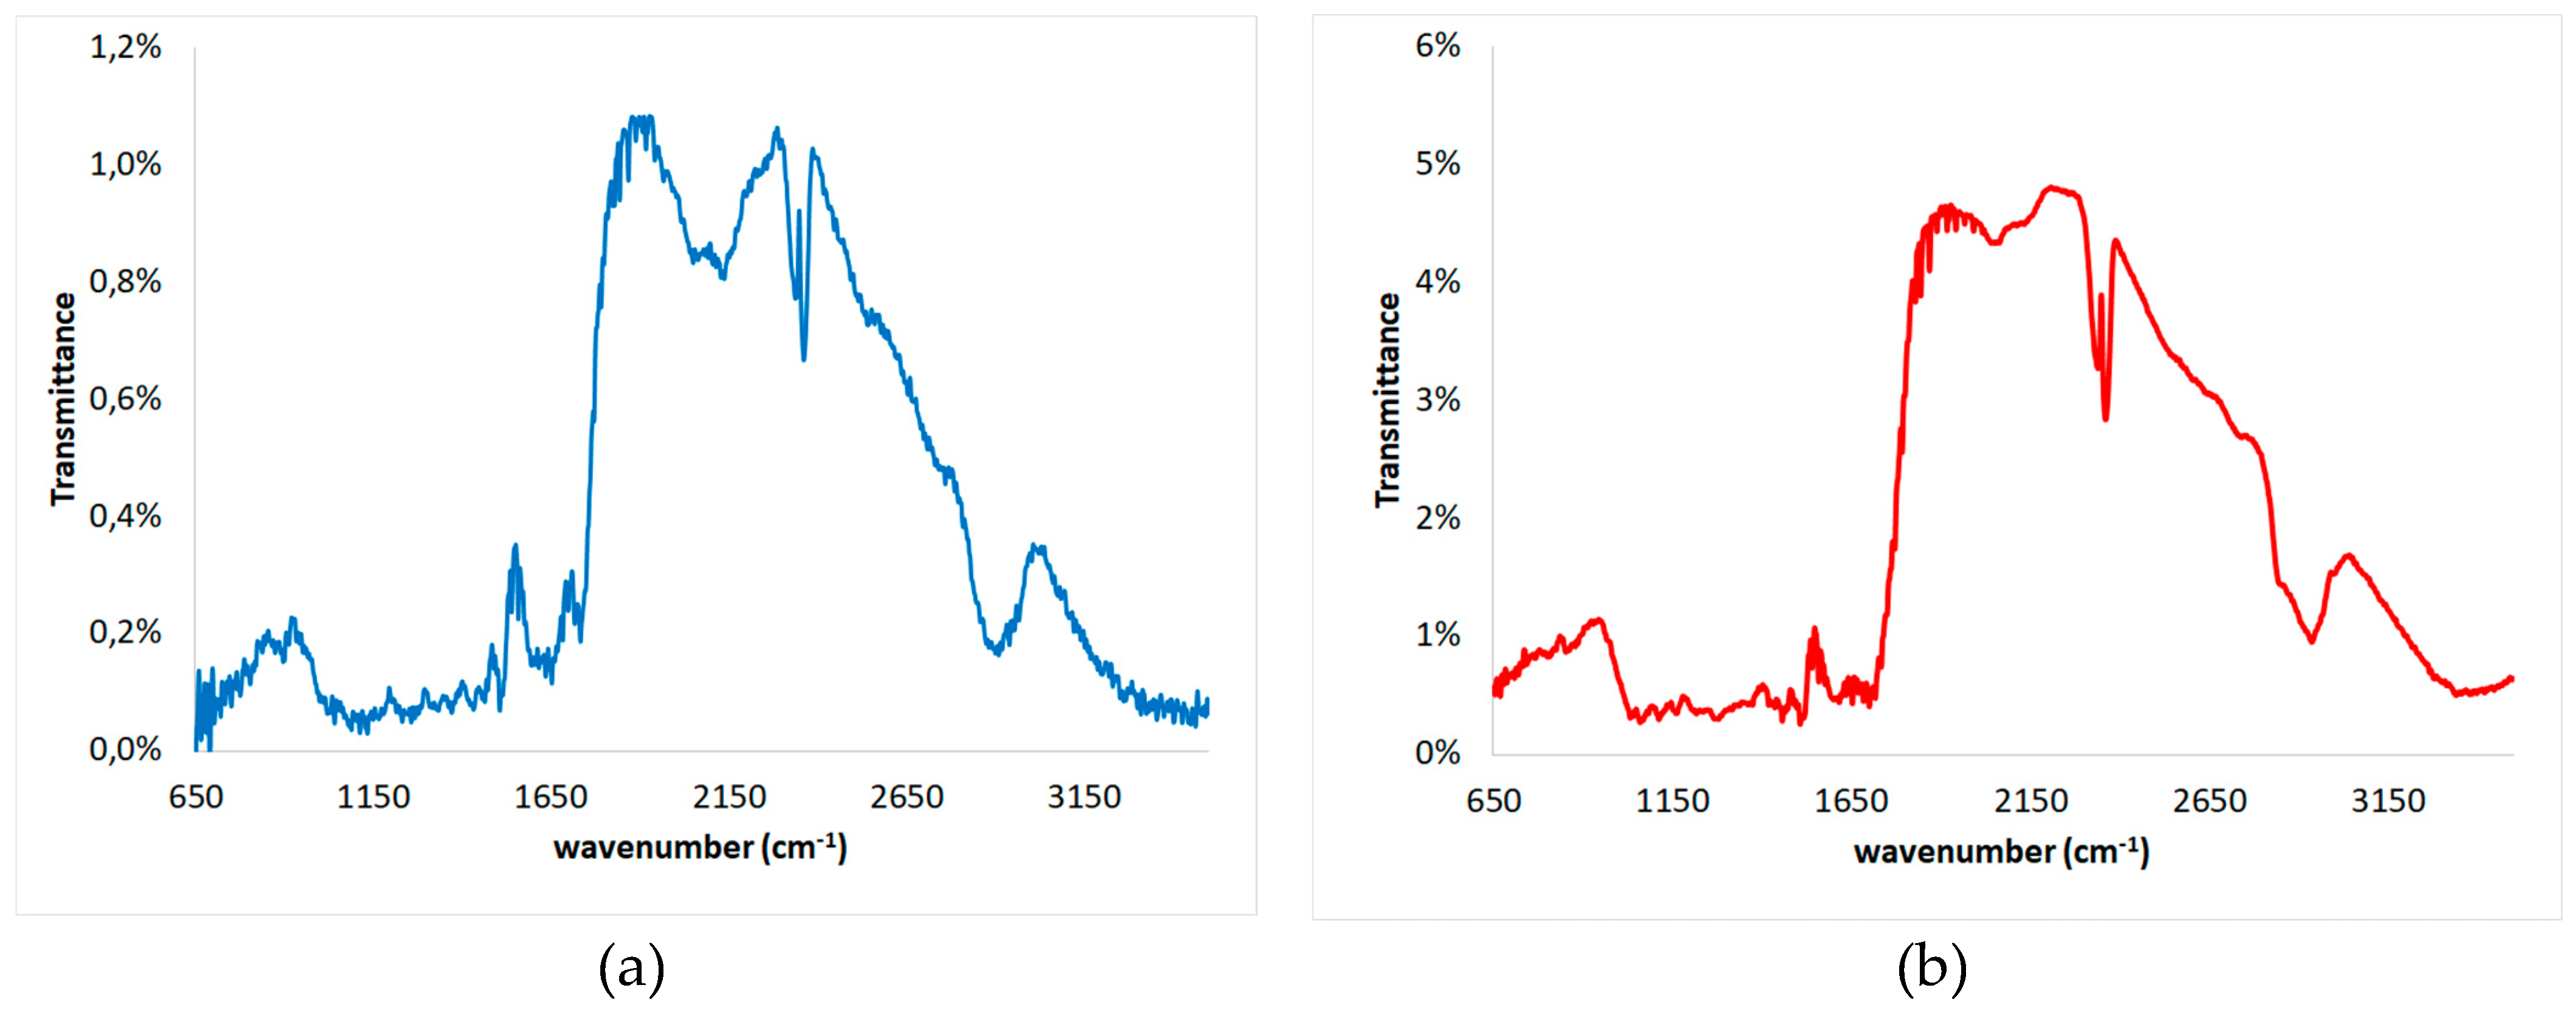
Figure 20.
XRD patterns of desalination brine pretreated and untreated spruce sawdust. The pretreatment was using desalination brine (containing 178,71 g L-1 NaCl etc.) at 200 oC for 50min.
Figure 20.
XRD patterns of desalination brine pretreated and untreated spruce sawdust. The pretreatment was using desalination brine (containing 178,71 g L-1 NaCl etc.) at 200 oC for 50min.
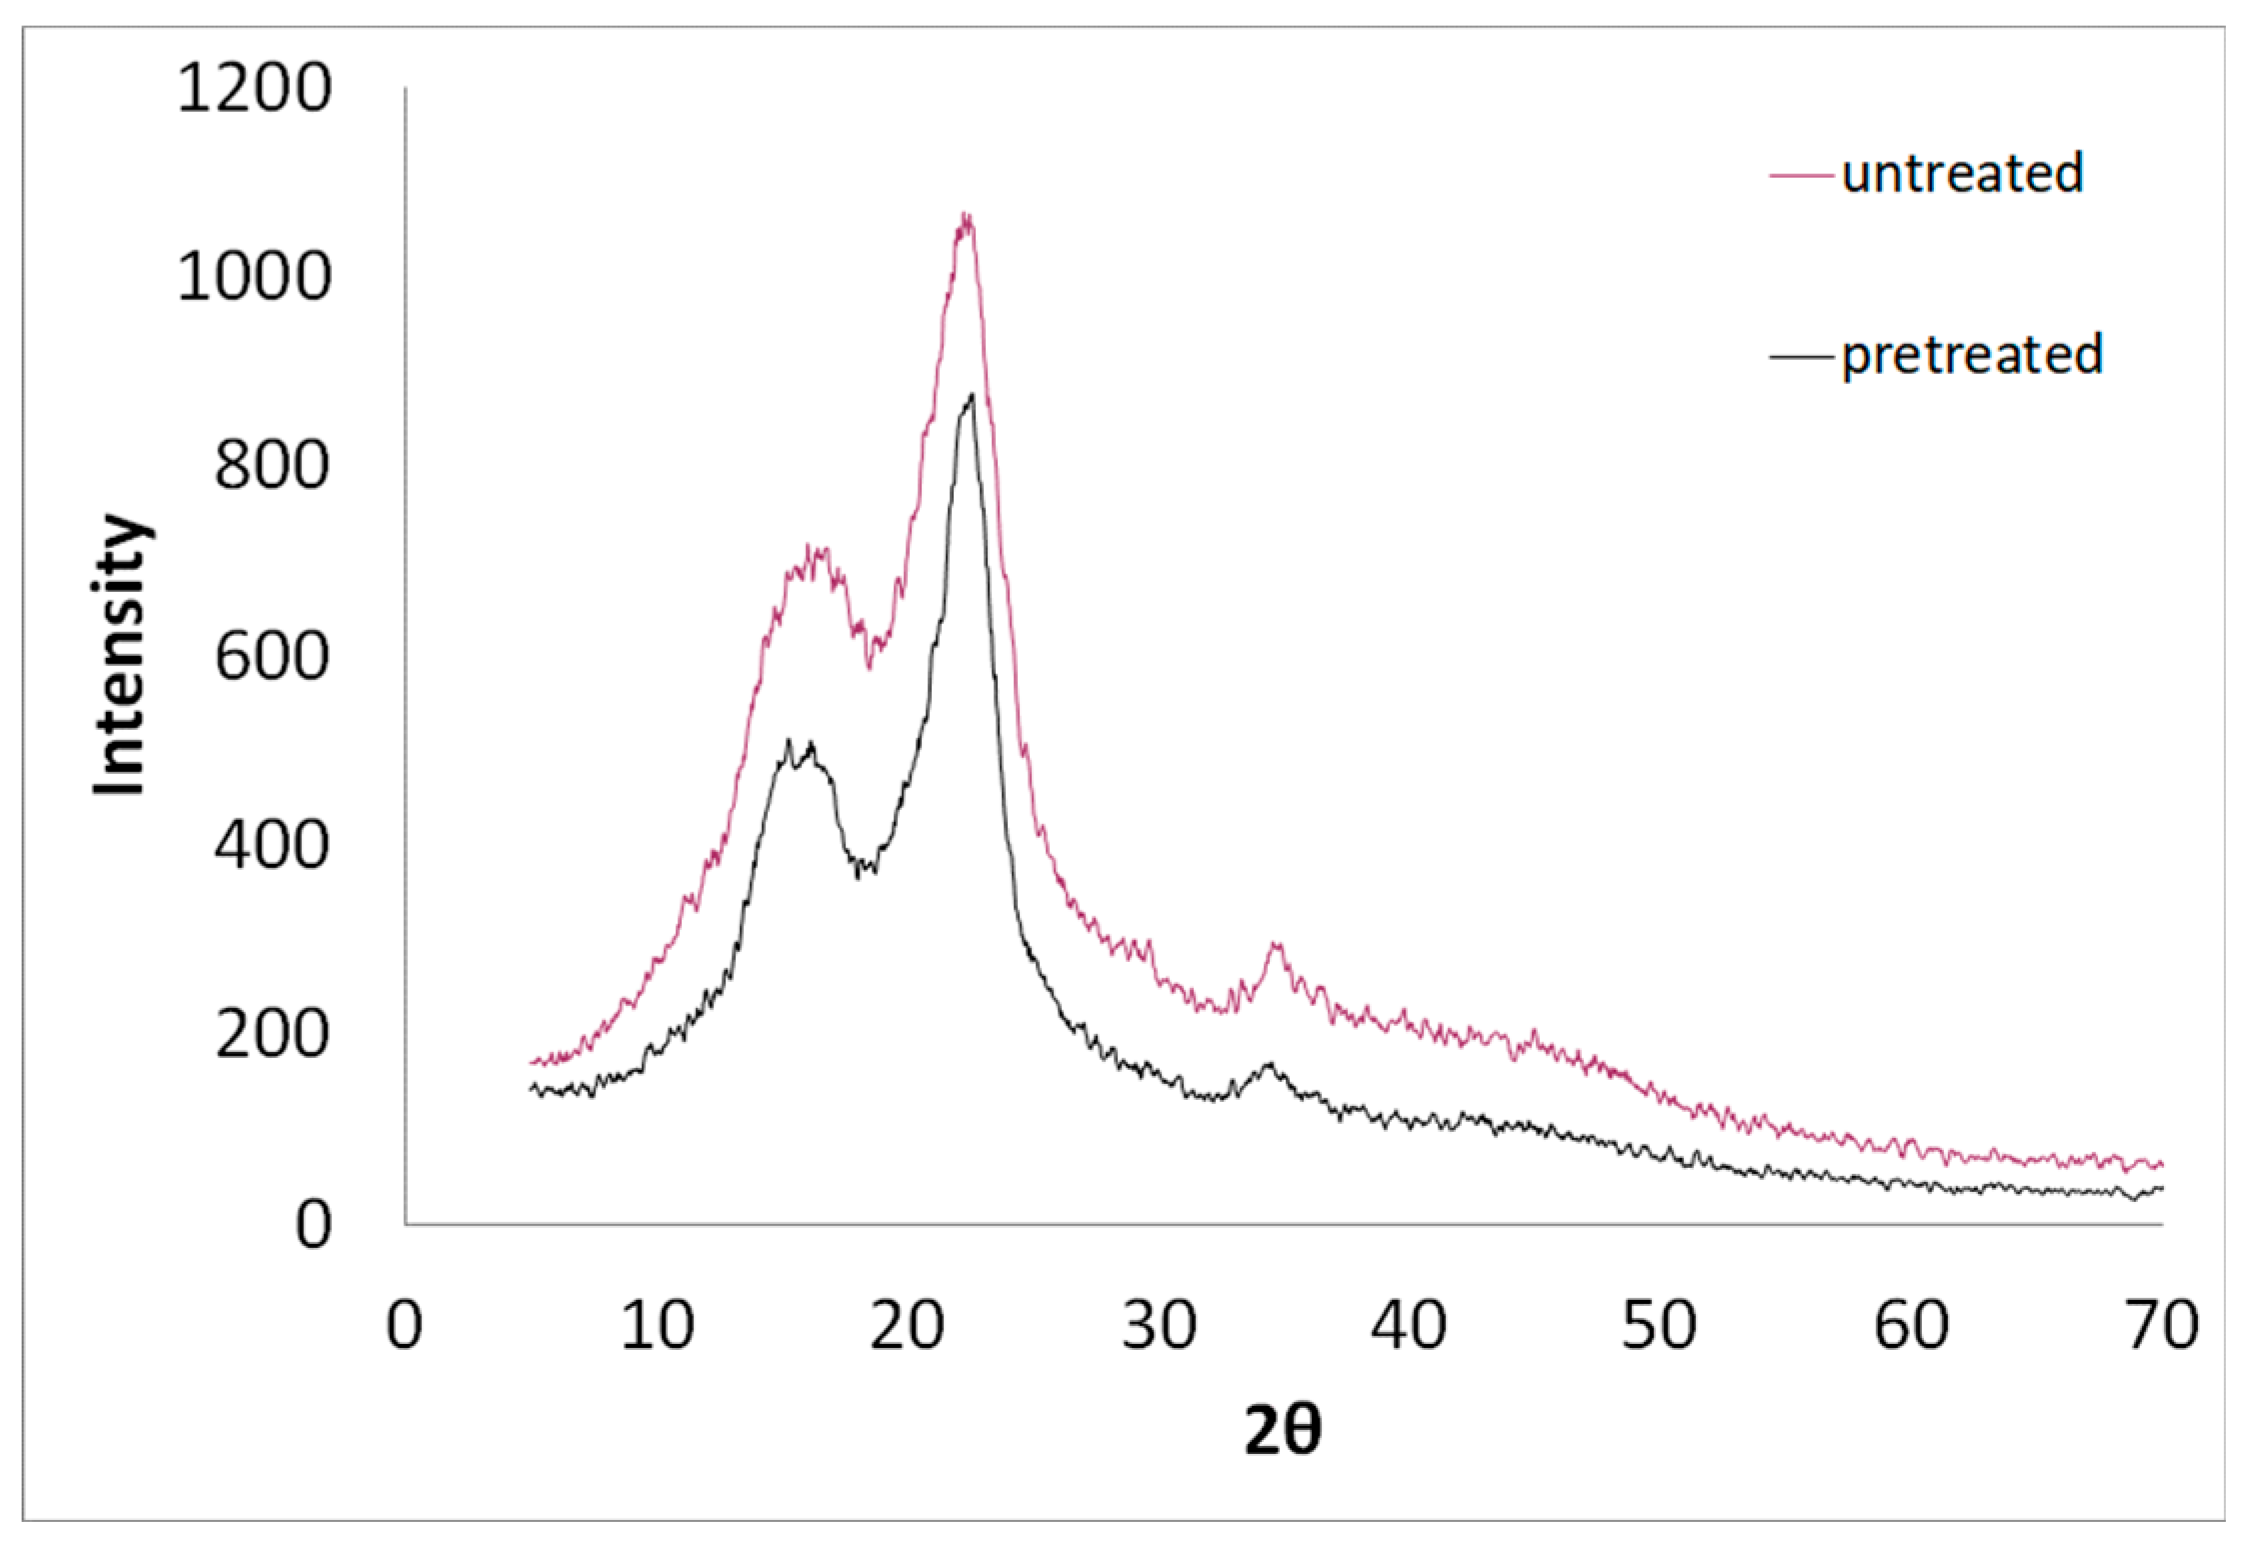
Figure 21.
Crystallinity Index (CrI) of desalination brine pretreated spruce sawdust vs the logarithm of the combined severity factor (logR0*).
Figure 21.
Crystallinity Index (CrI) of desalination brine pretreated spruce sawdust vs the logarithm of the combined severity factor (logR0*).
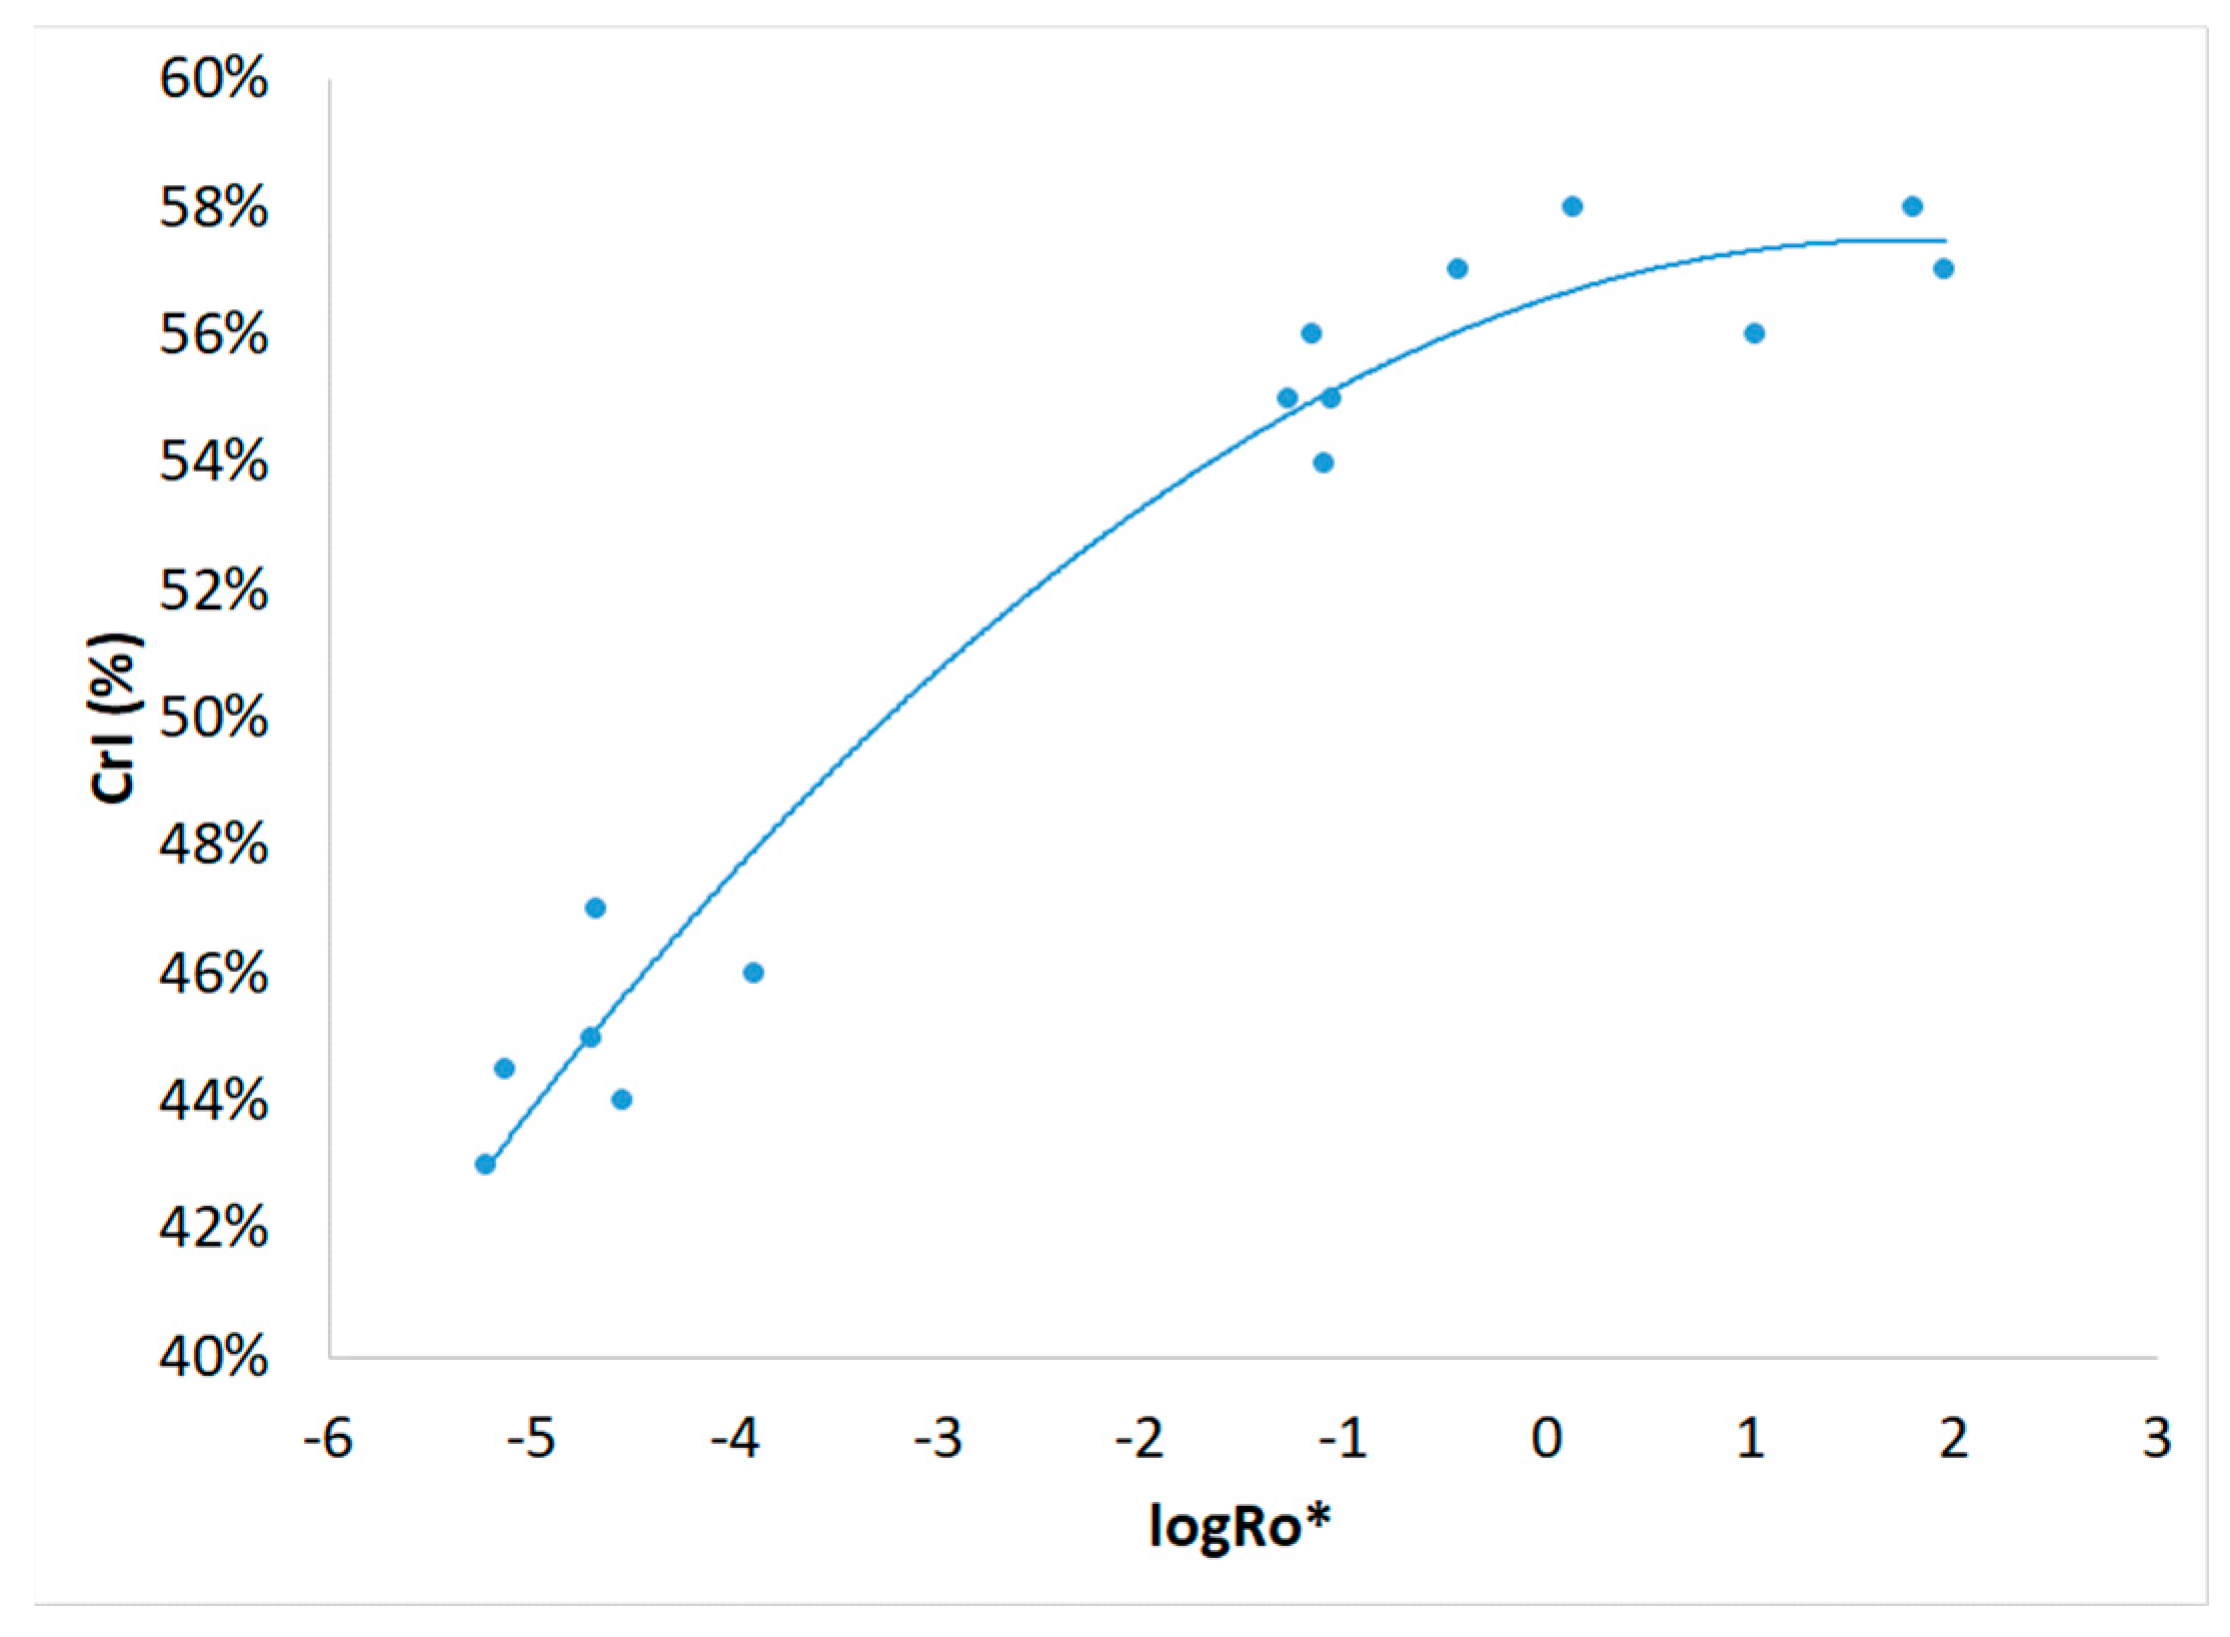

Table 1.
Box Behnken Design of Experiments.
| Experiment | Temperature T (oC) | Time t (min) | Brine concentration (NaCl in g L-1) |
| 1 | 160 | 0 | 98.12 |
| 2 | 240 | 0 | 98.12 |
| 3 | 160 | 50 | 98.12 |
| 4 | 240 | 50 | 98.12 |
| 5 | 200 | 0 | 24.53 |
| 6 | 200 | 0 | 178.71 |
| 7 | 200 | 50 | 24.53 |
| 8 | 200 | 50 | 178.71 |
| 9 | 160 | 25 | 24.53 |
| 10 | 160 | 25 | 178.71 |
| 11 | 240 | 25 | 24.53 |
| 12 | 240 | 25 | 178.71 |
| 13 | 200 | 25 | 98.12 |
| 14 | 200 | 25 | 98.12 |
| 15 | 200 | 25 | 98.12 |
Table 2.
Severity Factor R0, Combined Severity Factor R0* and logarithm of the Combined Severity Factor logR0* estimated values for spruce sawdust desalination brine pretreatment experiments.
Table 2.
Severity Factor R0, Combined Severity Factor R0* and logarithm of the Combined Severity Factor logR0* estimated values for spruce sawdust desalination brine pretreatment experiments.
| Experiment | R0 | R0* | logR0* |
| 1 | 198 | 6.12.10-6 | -5.213 |
| 2 | 5.51.104 | 5.39.10-2 | -1.269 |
| 3 | 3.28.103 | 2.12.10-5 | -4.674 |
| 4 | 7.21.105 | 64.3 | 1.808 |
| 5 | 2.97.103 | 1.27.10-4 | -3.897 |
| 6 | 2.46.103 | 7.60.10-6 | -5.119 |
| 7 | 4.62.104 | 0.376 | -0.425 |
| 8 | 4.92.104 | 1.39 | 0.142 |
| 9 | 1.81.103 | 2.03.10-5 | -4.693 |
| 10 | 1.75.103 | 2.83.10-5 | -4.548 |
| 11 | 3.97.105 | 10.7 | 1.029 |
| 12 | 4.02.105 | 92.0 | 1.964 |
| 13 | 2.84.104 | 8.15.10-2 | -1.089 |
| 14 | 2.92.104 | 8.94.10-2 | -1.049 |
| 15 | 2.73.104 | 7.10.10-2 | -1.149 |
Table 3.
Assignment of spruce sawdust peaks in the FTIR spectra before and after the pretreatment.
| Wavenumber [cm−1] | Assignment | Components | ||
| untreated | pretreated | increase | ||
| 3465 | 3350 | -115 | O-H stretching of bonded hydroxyl groups | Hemicelluloses, Cellulose, Lignin |
| 2910 | 2940 | 30 | Aromatic methoxyl groups and in methyl and methylene groups of side chains symmetric C-H stretching in | Hemicelluloses, Cellulose, Lignin |
| 2362 | 2362 | 0 | N-H stretching | Hemicelluloses, Cellulose, Lignin |
| 1734 | 1710 | -24 | Unconjugated xylans C=O stretching | Hemicelluloses |
| 1699 | 1700 | 1 | R-OH aliphatic carboxyl groups | Lignin |
| 1654 | 1651 | -3 | Aromatic skeletal vibration, C=O stretching in lignin, H-O-H deformation vibration of adsorbed water | Hemicelluloses, Lignin |
| 1617 | 1616 | -1 | C=C stretching of phenol group | Hemicelluloses, Cellulose, Lignin |
| 1576 | 1576 | 0 | Aromatic skeletal vibration, C=O stretching, | Lignin |
| 1507 | 1506 | -1 | C=C stretching of the aromatic ring and aromatical skeletal vibration in Lignin | Lignin |
| 1435 | 1457 | 22 | C-H deformation in methyl and methylene | Lignin |
| 1374 | 1375 | 1 | C-H bending, C-H stretching in methylene | Hemicelluloses, Cellulose, Lignin |
| 1335 | 1314 | -21 | CH2 wagging, C5 substituted aromatic units C-O stretching | Hemicelluloses, Cellulose, Lignin |
| 1268 | 1278 | 10 | C-O stretching of guaiacyl unit | Lignin |
| 1180 | 1173 | -7 | C-H aromatic in plane deformation | Lignin |
| 1134 | 1132 | -2 | C-O-C stretching | Hemicelluloses, Cellulose |
| 1042 | 1060 | 16 | C-OH stretching vibration, C-O deformation | Hemicelluloses, Cellulose, Lignin |
| 1031 | 1038 | 7 | C-O stretching, C-H aromatic in plane deformation | Cellulose, Lignin |
| 902 | 867 | -35 | C-O-C stretching | Hemicelluloses, Cellulose |
| 805 | 852 | 47 | C-H aromatic out of plane bending | Lignin |
Disclaimer/Publisher’s Note: The statements, opinions and data contained in all publications are solely those of the individual author(s) and contributor(s) and not of MDPI and/or the editor(s). MDPI and/or the editor(s) disclaim responsibility for any injury to people or property resulting from any ideas, methods, instructions or products referred to in the content. |
© 2024 by the authors. Licensee MDPI, Basel, Switzerland. This article is an open access article distributed under the terms and conditions of the Creative Commons Attribution (CC BY) license (http://creativecommons.org/licenses/by/4.0/).
Copyright: This open access article is published under a Creative Commons CC BY 4.0 license, which permit the free download, distribution, and reuse, provided that the author and preprint are cited in any reuse.


