
Submitted:
02 August 2024
Posted:
05 August 2024
You are already at the latest version
Abstract
The aim was to evaluate the agreement between plaque detection with intraoral scanner system (IOS) and a conventional clinical method and to evaluate the inter-rater reliability for scoring 3D models with and without a disclosing agent. 14 participants were recruited from the Department of Operative Dentistry, School of Dentistry, University name blinded to reviewers, it is completed after the reviewing process. Participants eligible for inclusion were adults with good general health and a minimum of 20 teeth. Participants were clinically examined with plaque assessment according to the modified Quigley-Hein plaque index before and after using a disclosing agent (GC-Tri Plaque ID-Gel, GC). Before and after the application of the disclosing agent, all study participants were scanned using the IOS (TRIOS5, 3Shape TRIOS A/S). The clinical examiner and additional three examiners blinded to the clinical examination assessed plaque status on the acquired 3D models with and without disclosing agent using the same index to evaluate the inter-rater agreement. Intraclass coefficient correlation, one sample t-test and Cronbach’s α for inter-rater reliability were calculated. All methods showed moderate to strong correlations (Spearman’s rho ranging from 0.527 to 0.618) and Cronbach’s α ranged from 0.551 to 0.766. Level of agreement between con-ventional clinical registration and registration from 3D models was acceptable overall.
Keywords:
Level of agreement
; intraoral scanner
; plaque
; disclosing agent
; plaque index
1. Introduction
Dental plaque is a bacterial biofilm that accumulates on the tooth surfaces and is a precursor to the most prevalent oral diseases worldwide, affecting people of all ages. Usually, it accumulates at the gingival margin and in the interproximal areas. The enamel's natural, smooth, shiny appearance is lost with the accumulation, and a dull and matt effect is produced [1]. As it builds up, masses of dental plaque become more readily visible to the naked eye. After being undisturbed and for a few days of accumulation, the biofilm matures, creating a risk for dental caries and periodontal disease development [2].
Gingivitis affects over 90% of the world's population and is prevalent in all ages. Gingivitis is a precursor to periodontal disease, characterized by deep periodontal pockets, which provide an ideal environment for bacteria to grow and spread the infection, resulting in damage to the underlying bone, i.e., bone loss. If the progression of periodontitis is not halted, it can lead to tooth movement and eventually to tooth loss. Therefore, early detection of dental plaque is crucial for maintaining oral health and preventing disease development [1,3,4].
The detection of dental plaque is challenging. Methods traditionally used for clinical plaque detection and identification are visual inspection, scrubbing the tooth surface with a dental probe, or applying a disclosing agent that colors the plaque [1]. A two-tone plaque disclosing agent can be used, which colors ‘young’ plaque in a pink-purple color and ‘old’ or ‘matured’ plaque in a blueish tone [5]. The pink dye adheres to all plaque, whereas the blue dye adheres and diffuses more easily into the denser/thicker plaque. Hence, the claim is that young plaque stains pink and matured plaque stains blue-purple.
These clinical procedures are usually time-consuming, subjective, and lack reproducibility. Nowadays, 2D intraoral cameras employing fluorescence to excite the red fluorescence from porphyrins in dental plaque and their metabolites are also available. They show reliable diagnostic performance and the potential to replace disclosing agents (Quantitative light-induced fluorescence –QLF) [6,7,8].
Many clinical indices have been used to quantify the presence of plaque. Some of those indices used through the years are the Quigley-Hein index (or the modified version by Turesky), the Silness and Loe, the O’Leary, the Mandel, the Fischman, and the Navy. Nevertheless, all the indices introduce subjectivity to the process [8,9]. Computerized methods are superior in objectivity, sensitivity, and reliability [9]. Intraoral scanners (IOS) are handheld devices that capture high-resolution 3D images of the teeth and surrounding oral tissues. These images are generated through optical scanning technology, which creates detailed digital impressions. The IOS devices can also record intraoral information as photorealistic color images. IOS can also detect plaque by capturing detailed images of the tooth surfaces, highlighting areas where plaque accumulation is evident. Recent publications indicate that IOS may be suitable for plaque detection and registration [10,11,12,13]. Although all the recent research papers have different methodologies, all seem to agree that plaque scoring with an IOS correlated well with clinical examination. Also, Giese-Graft et al. (2022) conclude that 2D models can be used for plaque monitoring with adequate agreement with clinical recordings [12]. Doi et al. (2021) address the issue by examining different tooth groups, finding the more significant differences in plaque scoring for mandibular anterior teeth, but overall, there is a good agreement [10]. The studies used a disclosing agent, and the level of agreement between oral observation with and without a disclosing agent is well established [10,11,12].
The 3D models IOS produces can be shared with patients, helping them understand the extent and location of plaque buildup. This visual evidence can motivate better oral hygiene practices. Additionally, digital records are easily stored and accessed, facilitating seamless communication between different healthcare providers if needed, and can also support monitoring and evaluation of oral hygiene educational instructions to the patient. Finally, the high-resolution images allow dentists to assess a patient’s oral hygiene from a distance thoroughly. However, more information needs to be provided on how the inter-rater agreement among different examiners evaluate the 3D IOS models.
This study evaluates the agreement between an IOS and a conventional clinical visual method with a disclosing agent for dental plaque detection and registration. The aim was to evaluate the agreement between the IOS and a conventional clinical method and the inter-rater reliability for scoring 3D models with and without disclosing agent.
2. Materials and Methods
Study design and participants
The study group was a convenience sample of 14 participants (8 female, 6 male) with a mean (±SD) age of 37.5±1.2 years, recruited via oral announcements from the Department of Operative Dentistry, School of Dentistry, University name blinded to reviewers, it is completed after the reviewing process. The study was approved by the Ethics and Research Committee of the School of Dentistry (527/22.09.2022) of the University name blinded to reviewers, it is completed after the reviewing process. The study was conducted from October 2022 to March 2023.
All participants were informed about the aims and methodology of the study and a written consent was obtained.
Participants eligible for inclusion were adults with good general health and a minimum of 20 permanent teeth. Exclusion criteria were less than twenty teeth in the mouth, medical conditions that made the registration difficult or impossible, age less than 18 years, and inability to obtain informed consent.
Clinical procedures
One examiner conducted all the clinical procedures. The examiner was a dental professional calibrated for clinical plaque registration before the study and trained in using the intraoral scanner (TRIOS5, 3Shape TRIOS A/S, Copenhagen, Denmark).
At first, a scanning of the participant’s both arches was conducted using the scanner with Unite application software. A comprehensive clinical examination and plaque registration using the conventional methods was performed. The index used for the registration was the modified Quigley-Hein plaque index [14] (Table 1). All teeth were given a score buccally and lingually. Subsequently, disclosing agent on all tooth surfaces was applied (GC-Tri Plaque ID-Gel, GC Corporation, Tokyo, Japan). The agent was applied with the use of a plier and a cotton pellet, and the participant was instructed to rinse for 5 seconds with gentle moves and then spit.
Following the application of the disclosing agent, all study participants were scanned with the intraoral scanner once again. Afterwards, a thorough professional cleaning was performed on all tooth surfaces, and the stains and the disclosing agent were removed by policing using a polishing paste (Detartrine polishing paste, Septodont, Ontario, Canada) and a rubber cup.
Finally, a scan was performed, and oral hygiene instructions were demonstrated to the subject. The overview of the workflow of the study is presented in Figure 1.
After all data were obtained, the examiner (examiner 1) and additional three dental professionals (examiner 2, 3, 4) blinded to the clinical examination assessed plaque status on the acquired 3D models with and without disclosing agent using the same index to evaluate the inter-rater agreement. The 3D models were assessed in the Unite application software. In this viewer, the 3D models can be rotated in all three directions, so all areas of the dental arch are well displayed. The examiner who did the initial clinical examination, as well as examiner 4, have the most clinical experience (specialists), whereas the other two were not as experienced in plaque detection.
Statistical analysis
Statistical analyses were performed with the use of the IBM SPSS 26.0 software and included descriptive statistics as well as the calculation of interclass coefficient correlation. As the data showed no significant deviation from the Gaussian distribution (Kolmogorov-Smirnov-test), parametric procedures were used. Spearman correlation was used to examine whether the plaque registration on 3D models and plaque registrations on 3D models with disclosing agent correlated with the clinical plaque registration. Values are presented as mean ± standard deviation (SD). Bland-Altman analyses were performed to determine the extent to which the measurements obtained with clinical examination agreed with those of 3D models examination and 3D models with disclosing agent. For the inter-examiner reliability of all 4 examiners Cronbach’s α was calculated.
The level of statistical significance was set at P≤0.05.
3. Results
Images of 3D models with and without disclosing agent is showing in Figure 2. All three ways of scoring plaque (clinical examination, 3D models, and 3D models with disclosing agent) showed moderate to strong correlations (Spearman’s rho ranging from 0.527 to 0.618) with P<0.001 (Table 2). When the scoring techniques were correlated per tooth group type (upper front, lower front, upper molars and premolars, lower molars and premolars), the correlations were also good (P<0.001), with the lowest correlation for the upper front when comparing 3D models with or without disclosing agent (0.450) and the highest correlation in for the upper front when comparing 3D models with disclosing agent and clinical examination (0.763) (Table 3).
In the Bland-Altman plots (Table 4, Figure 3, Figure 4 and Figure 5), all the methods of scoring plaque show excellent agreement, as the majority of the dots is between the levels of agreement (green lines).
Cronbach’s α for the interrater reliability was found to be ranging from 0.551 to 0.766 (Table 5). The correlation was stronger between examiner 1 and examiner 4.
4. Discussion
To our knowledge, this is the first study to investigate the agreement between clinical plaque scores and plaque scores on 3D models with and without a disclosing agent, together with the agreement between several examiners. Spearman’s rho values less than 0.5 indicate poor reliability, between 0.5 and 0.75 indicate moderate agreement, values between 0.75 and 0.9 indicate good reliability, and greater than 0.90 indicate excellent reliability [15]. All three methods of scoring plaque (clinical examination, 3D models, or 3D models with disclosing agent) correlated moderate to strong. In a scoping review of 2023; it is stated that a moderate to strong positive correlation was found between the digital methods and the clinical examination for plaque detection, with comparable results for 2D and 3D image-based systems [16]. Even though we found moderate to strong correlations for all three methods of scoring plaque (clinical examination, 3D models, and 3D models with disclosing agent), the correlation between the clinical examination and the 3D models with disclosing agent was slightly higher than for the 3D models without disclosing agent, which indicates that examiners can more easily detect plaque if it is colored. A strong correlation was found between all disclosed plaque scores and the clinical scores in a study using QLF images and a two-tone disclosing agent like the one used in the present study. However, they could not correlate the mature plaque (blue color) with the clinical scores [6], and we did not also proceed with that kind of correlation. In our study, the correlation was higher when a disclosing agent was used. The latter is likely due to that the disclosing agent gives additive information on the 3D model being closest to the clinical examination. Indeed, a recent study showed a strong correlation between clinical registrations on disclosed and undisclosed 3D models [11], which aligns with our results.
Discrepancies between agreements in different groups of tooth types do not seem to deflect from bad scanning quality but from different types of plaque accumulating at different sites. In a study in 2021, the difference between plaque detected on 3D models with and without disclosing agents was found to be bigger for mandibular anterior teeth [10]. Also, in a study of QLF imaging, it was concluded that the reliability of registering images with a disclosing agent is site-dependent [17]. In addition, in another recent study, a site-specific comparison revealed that the scores obtained using the intraoral scanner were significantly higher in the posterior region in the maxilla and mandible, possibly due to difficulty in direct vision [13]. In the present study, we also found the same pattern, which can be attributed to the scanner providing better images in sites where optical observation is compromised (e.g., posterior teeth).
The intra-class correlation coefficient (ICC) provides a single measure of the extent of agreement, and the other, namely the Bland–Altman plot, provides a quantitative estimate of how closely the values from two measurements lie. The bland-Altman plot can show both the magnitude of bias and 95% limits of agreement between the two methods. In this study, most of the dots were between the lines for all the methods of scoring plaque, so we can conclude that there was a very high level of agreement between different methods for all techniques. However, the one-sample t-test for 3D models with or without disclosing agent reveals that the upper bound for the correlation of clinical examination and the 3D models was -0.0416, and for the correlation of clinical examination and 3D models with disclosing agent was -0.1368. If we consider that confidence intervals provide a way to express uncertainty and account for variability in our estimates, the higher upper bound suggests that the upper limit of the difference may be larger than initially expected. This indicates that for the 3D models with disclosing agents, the upper boundary of the interval is further from the central estimate. Conclusively, there is greater uncertainty or variability in that direction.
The inter-rater reliability in this study ranged from 0.551 to 0.766. The interpretation of the inter-rater reliability estimates should be 0.70 to be acceptable, 0.80 to be good, and 0.90 to be excellent [18]. Only inter-rater reliability between examiners #1 and #4; and #2 and #4 was above 0.70 and can be characterized as acceptable, while the reliability between examiners #3 and #4; #1 and #2; and #2 and #3 did not reach the acceptable threshold, but they were closed to that and could be characterized as “close to acceptable”. These results could be attributed to the fact that examiners 1 and 4 were specialists and more experienced than examiners 2 and 3. Previous reports showed that intra- and inter-rater reliability for digital measures was good/excellent when assessed [16]. In general, digitized plaque detection systems were reported to be reliable and valid tools for dental plaque monitoring and oral hygiene assessment [16]. Also, in a study of 2023 where different types of plaque registration were evaluated, it was found that 3D imaging had an advantage, as it allows image enlargement and rotation at all sites [19].
As previously stated, it is well-known that the use of clinical indices for the registration of plaque detection introduces subjective bias [9]. Another restriction of using the indices is that, in many cases, the same scores on teeth of equal size may be due to different amounts of plaque (different thicknesses of plaque). The opposite may also be true: using tooth segments to obtain scores effectively disregards tooth size. This means that the same amount of plaque may yield different scores on different-sized teeth (i.e., central and lateral incisors) [9].
Also, two-dimensional images have some disadvantages. One of them is that lingual surfaces and posterior teeth are assessed with mirrors and with difficulty. The difficulty of acquiring images on certain surfaces remains even for intraoral cameras. So, curvature plays a part in imaging. In addition, interproximal sites cannot be reached as well as with clinical examination [9]. One possible advantage of 3D imaging for plaque registration is that it records plaque accumulations on gums as well, which could be beneficial [9].
The limitations of this study include that few participants were included in this study. Even though we registered plaque per surface in this study and had a total of 769 surfaces included in the cross-examination, the conclusions should be taken cautiously. Only participants with very few stains were included, so we were not able to assess how stains could impact the outcome. Also, with the type of index used, it is impossible to differentiate calculus from plaque and assess the differences from the disclosing agent used, which identifies new, mature, and acid-producing biofilms in three colors. However, in a study of 2022 that compared two different 3D plaque registration methods, an intraoral camera and an IOS, the registrations obtained from the intraoral camera as well as from the intraoral scan revealed a very similar result [12]. In this specific study, there was a tendency for higher scores on both 2D and 3D images compared to the clinical examination, which was explained by the fact that teeth on the images were enlarged compared to the clinical situation, the illumination of the areas under study was usually very good compared to the clinical situation, and there were no clinical-related factors [12].
Further studies on a larger sample should be conducted. Differences in the methodology of the published papers (e.g., the indices used, the disclosing agent applied, or even the type of intraoral scanner used) could influence the results.
5. Conclusions
The overall level of agreement between conventional clinical registration and registration from 3D models was acceptable. The results suggest that the IOS could be useful for assessing oral hygiene status and aid in accurately evaluating dental plaque, especially in areas that cannot be viewed directly and require dental mirrors. The inter-rater agreement is influenced by the clinical experience.
Author Contributions
Conceptualization, C.R..; methodology, G.G, P.N..; software, P.N.; validation, G.G., C.R.; formal analysis, G.G.; investigation, G.G.; resources, P.N.; data curation, G.G., C.R.; writing—original draft preparation, G.G.; writing—review and editing, P.N., C.R.; visualization, C.R.; supervision, C.R.; project administration, C.R.; funding acquisition, C.R, P.N. All authors have read and agreed to the published version of the manuscript.
Funding
The scanner system was provided from 3Shape TRIOS A/S. No other funding was provided for this project.
Institutional Review Board Statement
The study was approved by the Ethics and Research Committee of the School of Dentistry (527/22.09.2022) of the University name blinded to reviewers, it is completed after the reviewing process.
Informed Consent Statement
Informed consent was obtained from all subjects involved in the study.
Conflicts of Interest
The authors declare no conflicts of interest.”.
References
- Marsh P.D. Dental plaque as a biofilm and a microbial community - implications for health and disease. BMC Oral Health 2006 Jun 15,6 Suppl 1(Suppl 1), S14. PMID: 16934115; PMCID: PMC2147593. [CrossRef]
- Boyens J. The diagnosis of plaque-induced periodontal diseases. J N Z Soc Periodontol. 2006, (89):5-9, PMID: 16913365.
- Pihlstrom B.L.; Michalowicz B.S.; Johnson N.W. Periodontal diseases. Lancet 2005 Nov 19;366(9499), 1809-20. PMID: 16298220. [CrossRef]
- Jakubovics N.S.; Goodman S.D.; Mashburn-Warren L.; Stafford G.P.; Cieplik F. The dental plaque biofilm matrix. Periodontol 2000 2021 Jun;86(1), 32-56. Epub 2021 Mar 10. PMID: 33690911; PMCID: PMC9413593. [CrossRef]
- Gallagher I.H.; Fussell S.J.; Cutress T.W.. Mechanism of action of a two-tone plaque disclosing agent. J Periodontol 1977, 48(7), 395–396. [CrossRef]
- .Volgenant C.M.C.; Fernandez Y.; Mostajo M.; Rosema N.A.M.; van der Weijden F.A.; Ten Cate J.M.; van der Veen M.H. Comparison of red autofluorescing plaque and disclosed plaque-a cross-sectional study. Clin Oral Investig. 2016, Dec;20(9), 2551-2558. Epub 2016 Mar 18. PMID: 26993658; PMCID: PMC5119843. [CrossRef]
- Klaus K.; Glanz T.; Glanz A.G.; Ganss C.; Ruf S. Comparison of Quantitative light-induced fluorescence-digital (QLF-D) images and images of disclosed plaque for planimetric quantification of dental plaque in multibracket appliance patients. Sci Rep 2020, Mar 11;10(1), 4478. PMID: 32161288; PMCID: PMC7066241. [CrossRef]
- Pretty I.A.; Edgar W.M.; Smith P.W.; Higham S.M. Quantification of dental plaque in the research environment. J Dent 2005, Mar;33(3), 193-207. Epub 2004 Dec 9. PMID: 15725520. [CrossRef]
- Carter K.; G. Landini, A.D. Walmsley. Automated quantification of dental plaque accumulation using digital imaging. J Dent 2004, Nov;32(8), :623-8. PMID: 15476956. [CrossRef]
- Doi K.; Yoshiga C.; Kobatake R.; Kawagoe M.; Wakamatsu K.; Tsuga K. Use of an intraoral scanner to evaluate oral health. J Oral Sci 2021, Jun 29;63(3), 292-294. Epub 2021 Jun 9. PMID: 34108300. [CrossRef]
- Jung K.; Giese-Kraft K.; Fischer M.; Schulze K.; Schlueter N.; Ganss C. Visualization of dental plaque with a 3D-intraoral-scanner-A tool for whole mouth planimetry. PLoS One 2022, Oct 26;17(10), e0276686. PMID: 36288348; PMCID: PMC9604992. [CrossRef]
- Giese-Kraft K.; Jung K.; Schlueter N.; Vach K.; Ganss C. Detecting and monitoring dental plaque levels with digital 2D and 3D imaging techniques. PLoS One 2022, Feb 15;17(2), e0263722. PMID: 35167618; PMCID: PMC8846510. [CrossRef]
- Doi K.; Yoshiga C.; Oue H;, Kobatake R.; Kawagoe M.; Umehara H.; Wakamatsu K.; Tsuga K. Comparison of plaque control record measurements obtained using intraoral scanner and direct visualization. Clin Exp Dent Res 2024, Feb;10(1), e852. PMID: 38345487; PMCID: PMC10831912. [CrossRef]
- Turesky S.; Gilmore N.D.; Glickman I. Reduced plaque formation by the chloromethyl analogue of victamine C. J Periodontol 1970, Jan;41(1), 41-3. PMID: 5264376. [CrossRef]
- Portney L.G.; Watkins M.P. Prentice Hall; New Jersey: 2000. Foundations of clinical research: applications to practice.
- La Rosa G.R.M.; Chapple I.; Polosa R.; Pedullà E. A scoping review of new technologies for dental plaque quantitation: Benefits and limitations. J Dent 2023, Dec;139, 104772. Epub 2023 Nov 7. PMID: 37939996. [CrossRef]
- Ganss C.; Glanz A.; Glanz T.; Schlueter N.; Ruf S. Red fluorescence of plaque in the dentition-a comparison of Quantitative Light-induced Fluorescence-Digital (QLF-D) images and conventional images of disclosed plaque. Photodiagnosis Photodyn Ther 2020, Dec;32, 102063. Epub 2020 Oct 14. PMID: 33068820. [CrossRef]
- Kline P. Handbook of Psychological Testing (2nd ed.). 2000 Routledge. [CrossRef]
- Meseli S.; Ekenel S.; Korkut B.; Aksu B.; Tagtekin D.; Yanikoglu F. Clinical assessment of various imaging systems for dental plaque scoring after the use of 3 different toothpastes. Imaging Sci Dent 2023, Sep;53(3), 209-216. Epub 2023 Jun 20. PMID: 37799736; PMCID: PMC10548153. [CrossRef]
Figure 1.
The overview of the methodology of the study.

Figure 2.
Images of 3D models with and without disclosing agent.
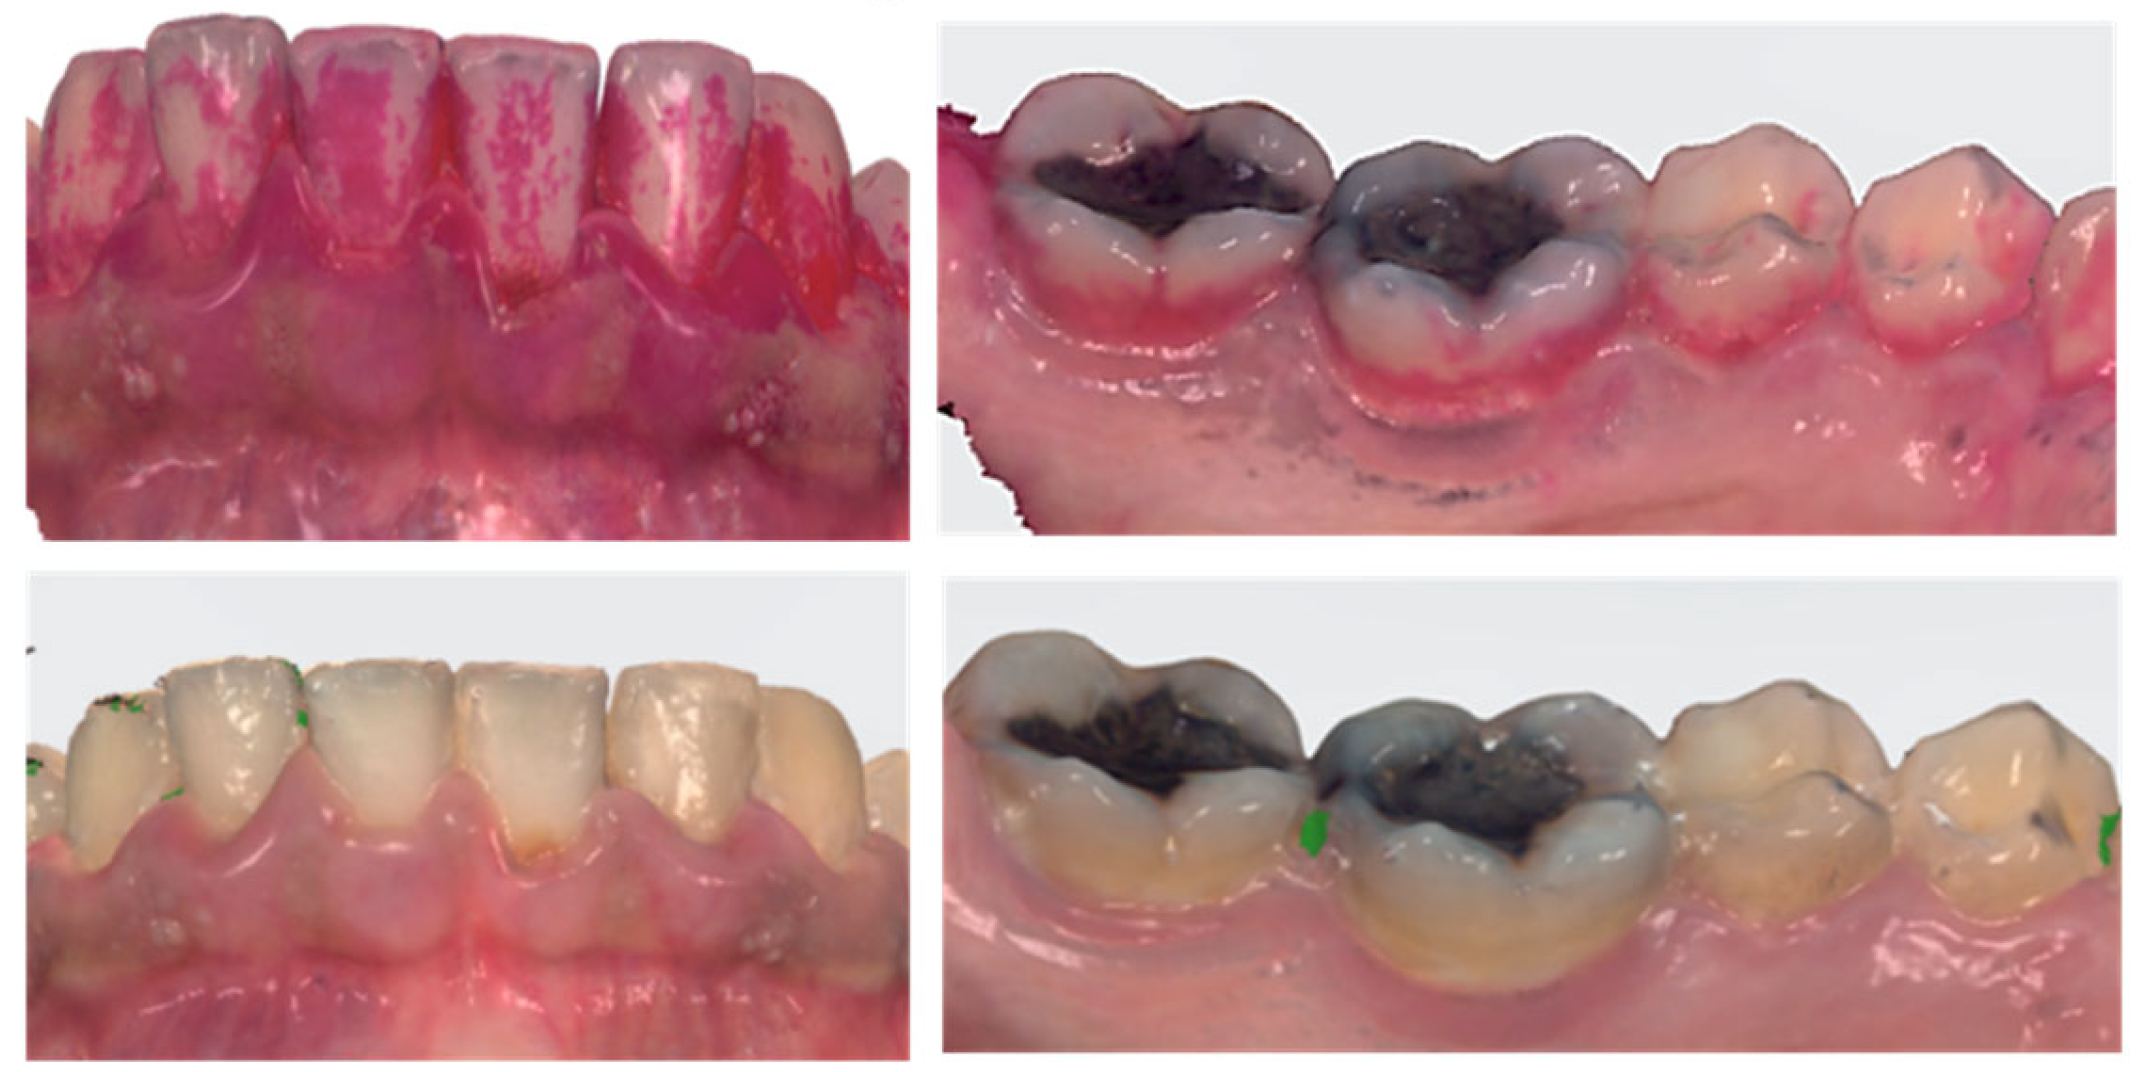
Figure 3.
Bland –Altman plot for Clinical Vs scanner.
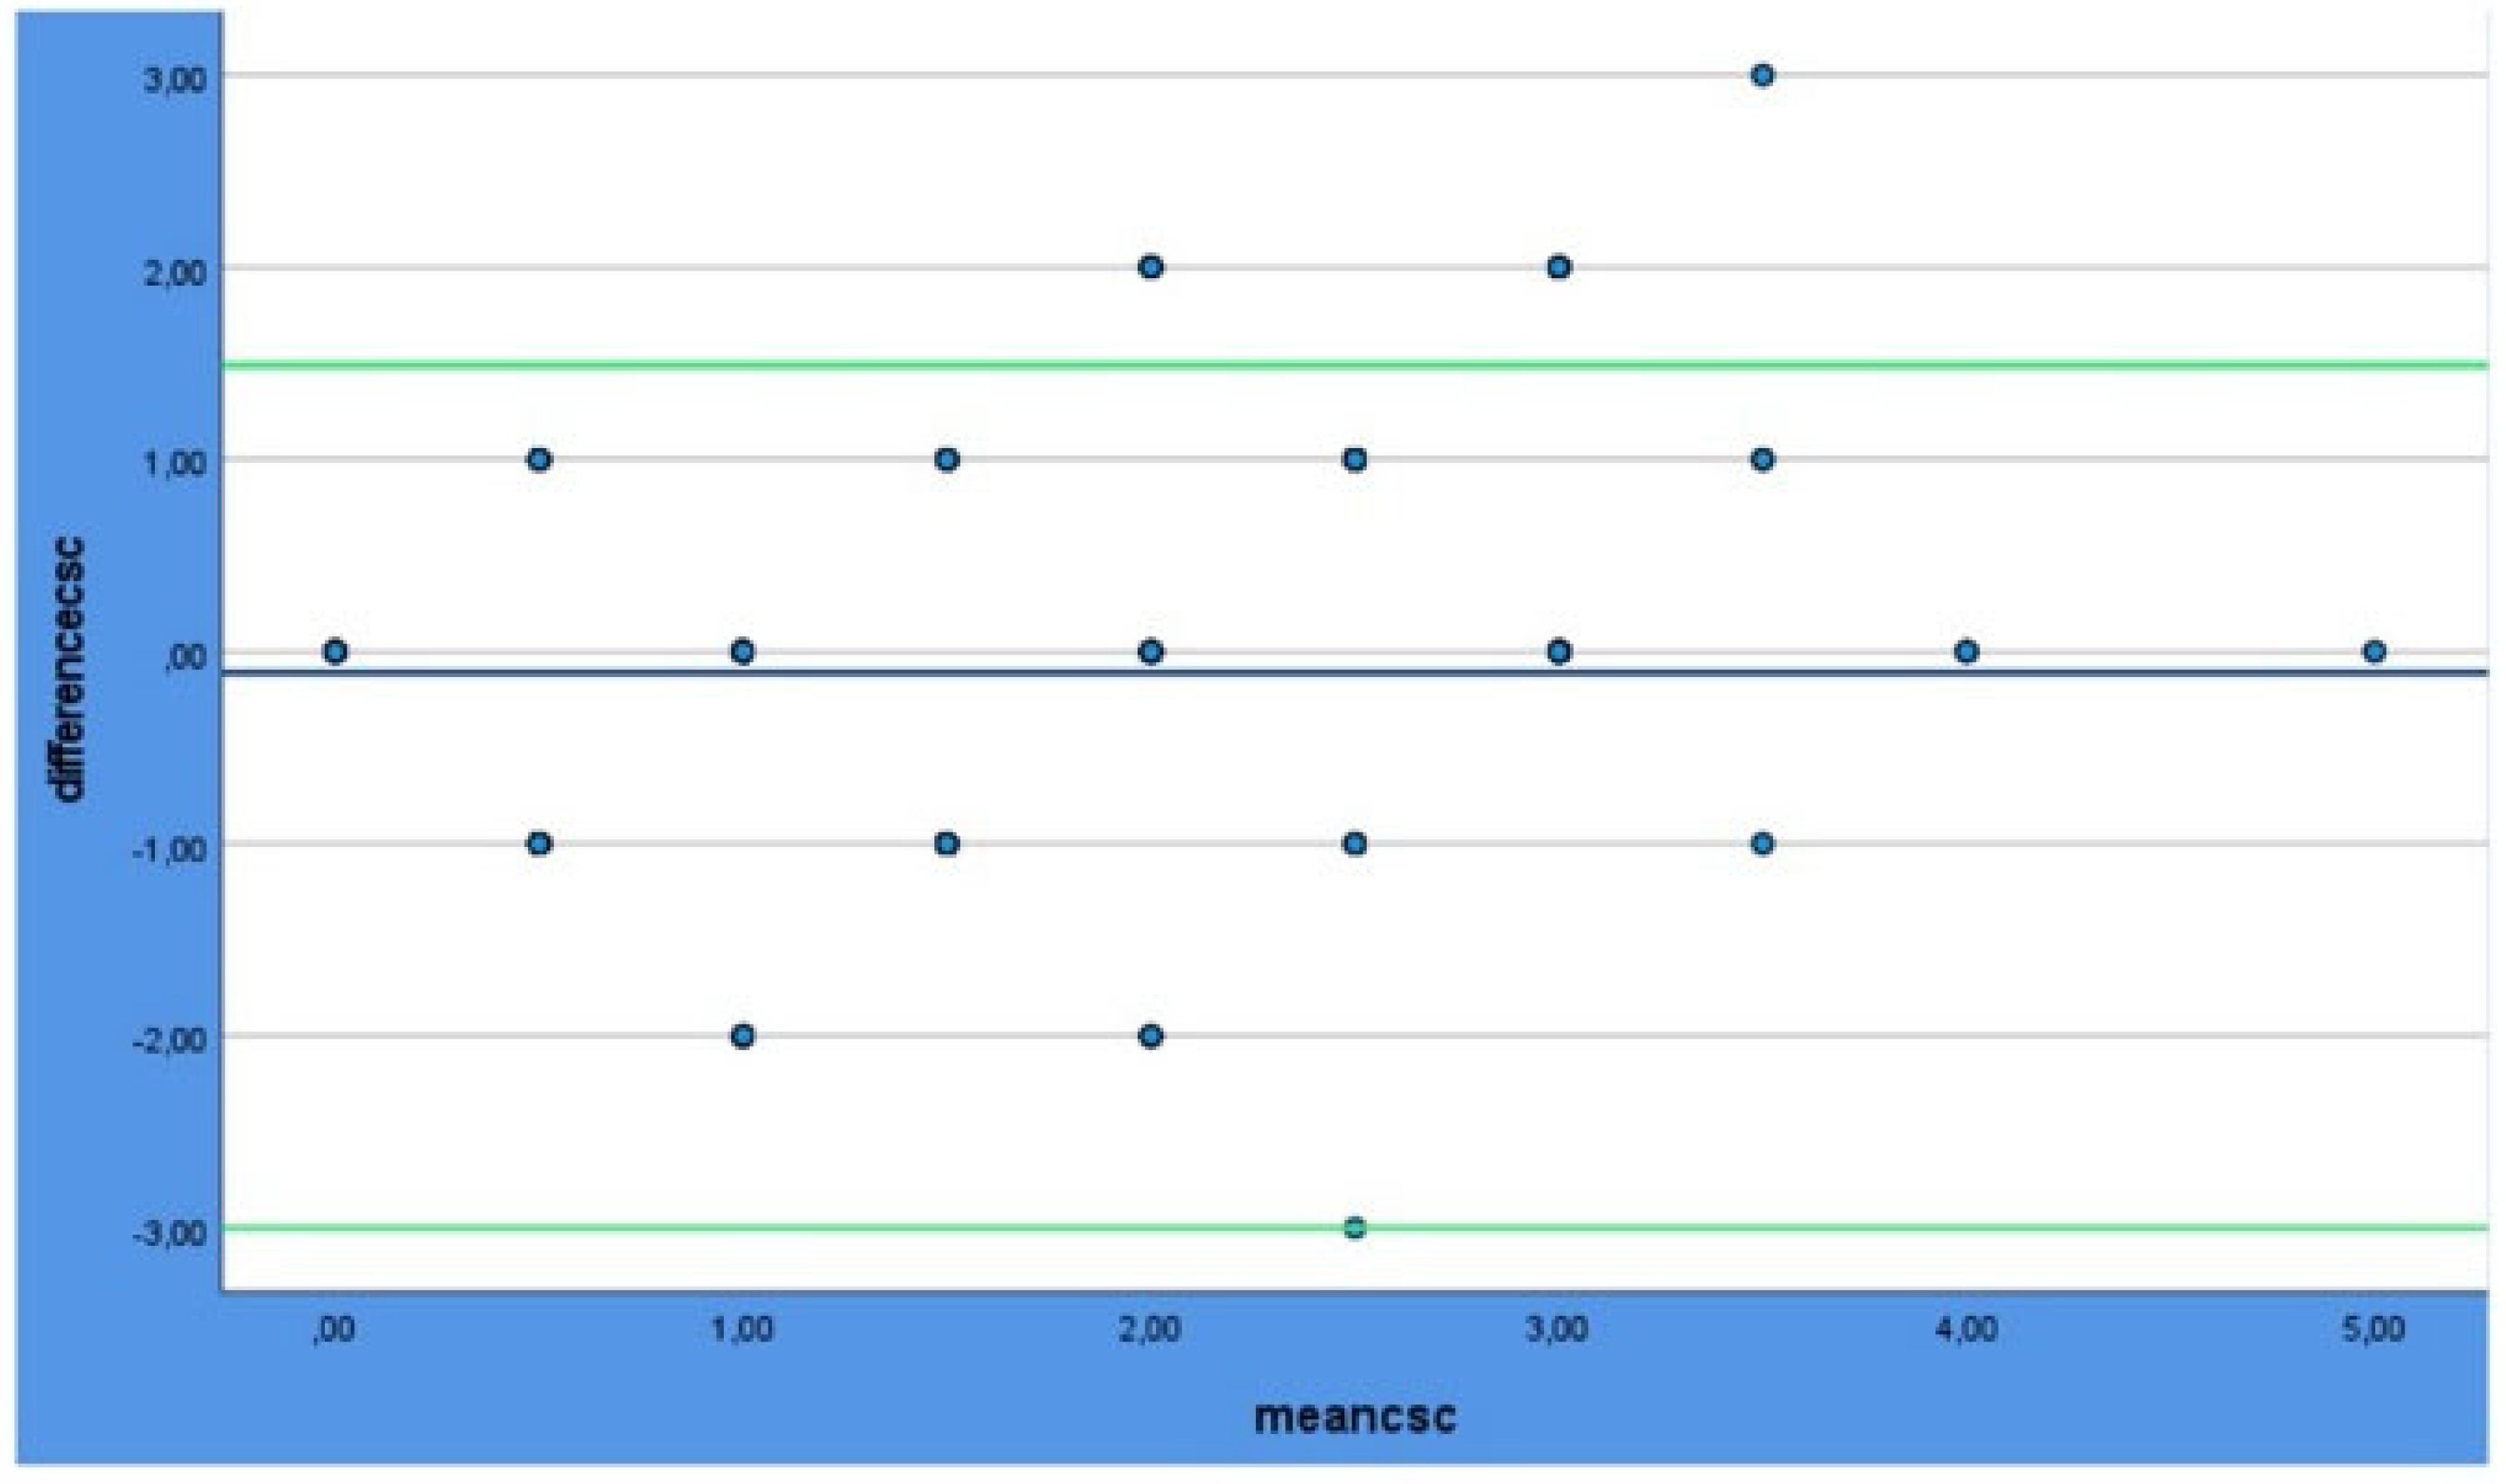
Figure 4.
Bland –Altman plot for Clinical Vs disclosing.
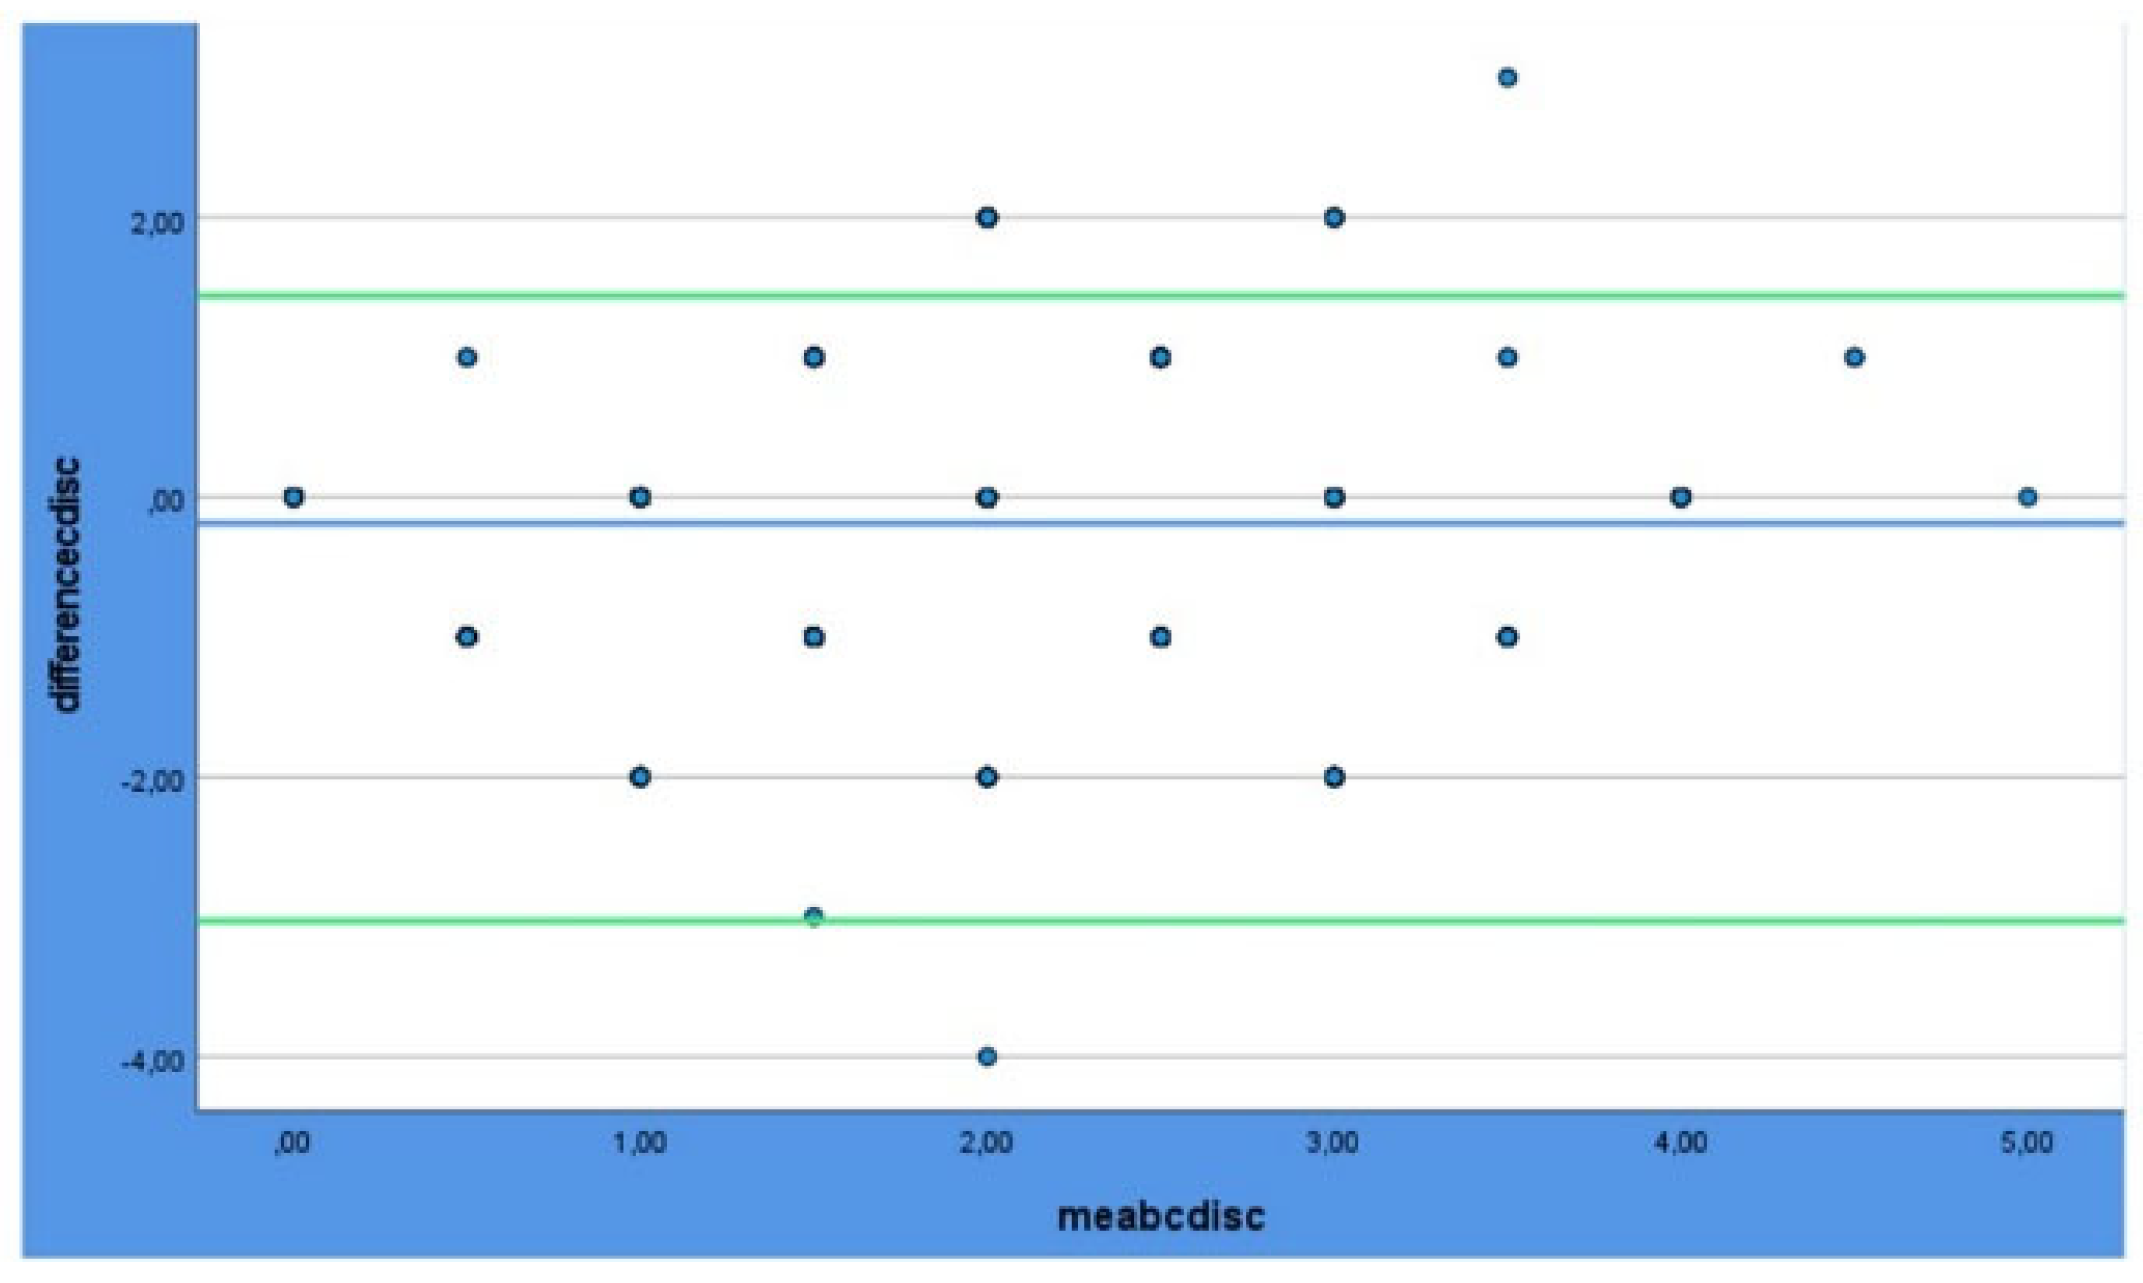
Figure 5.
Bland –Altman plot for Scanner Vs disclosing.
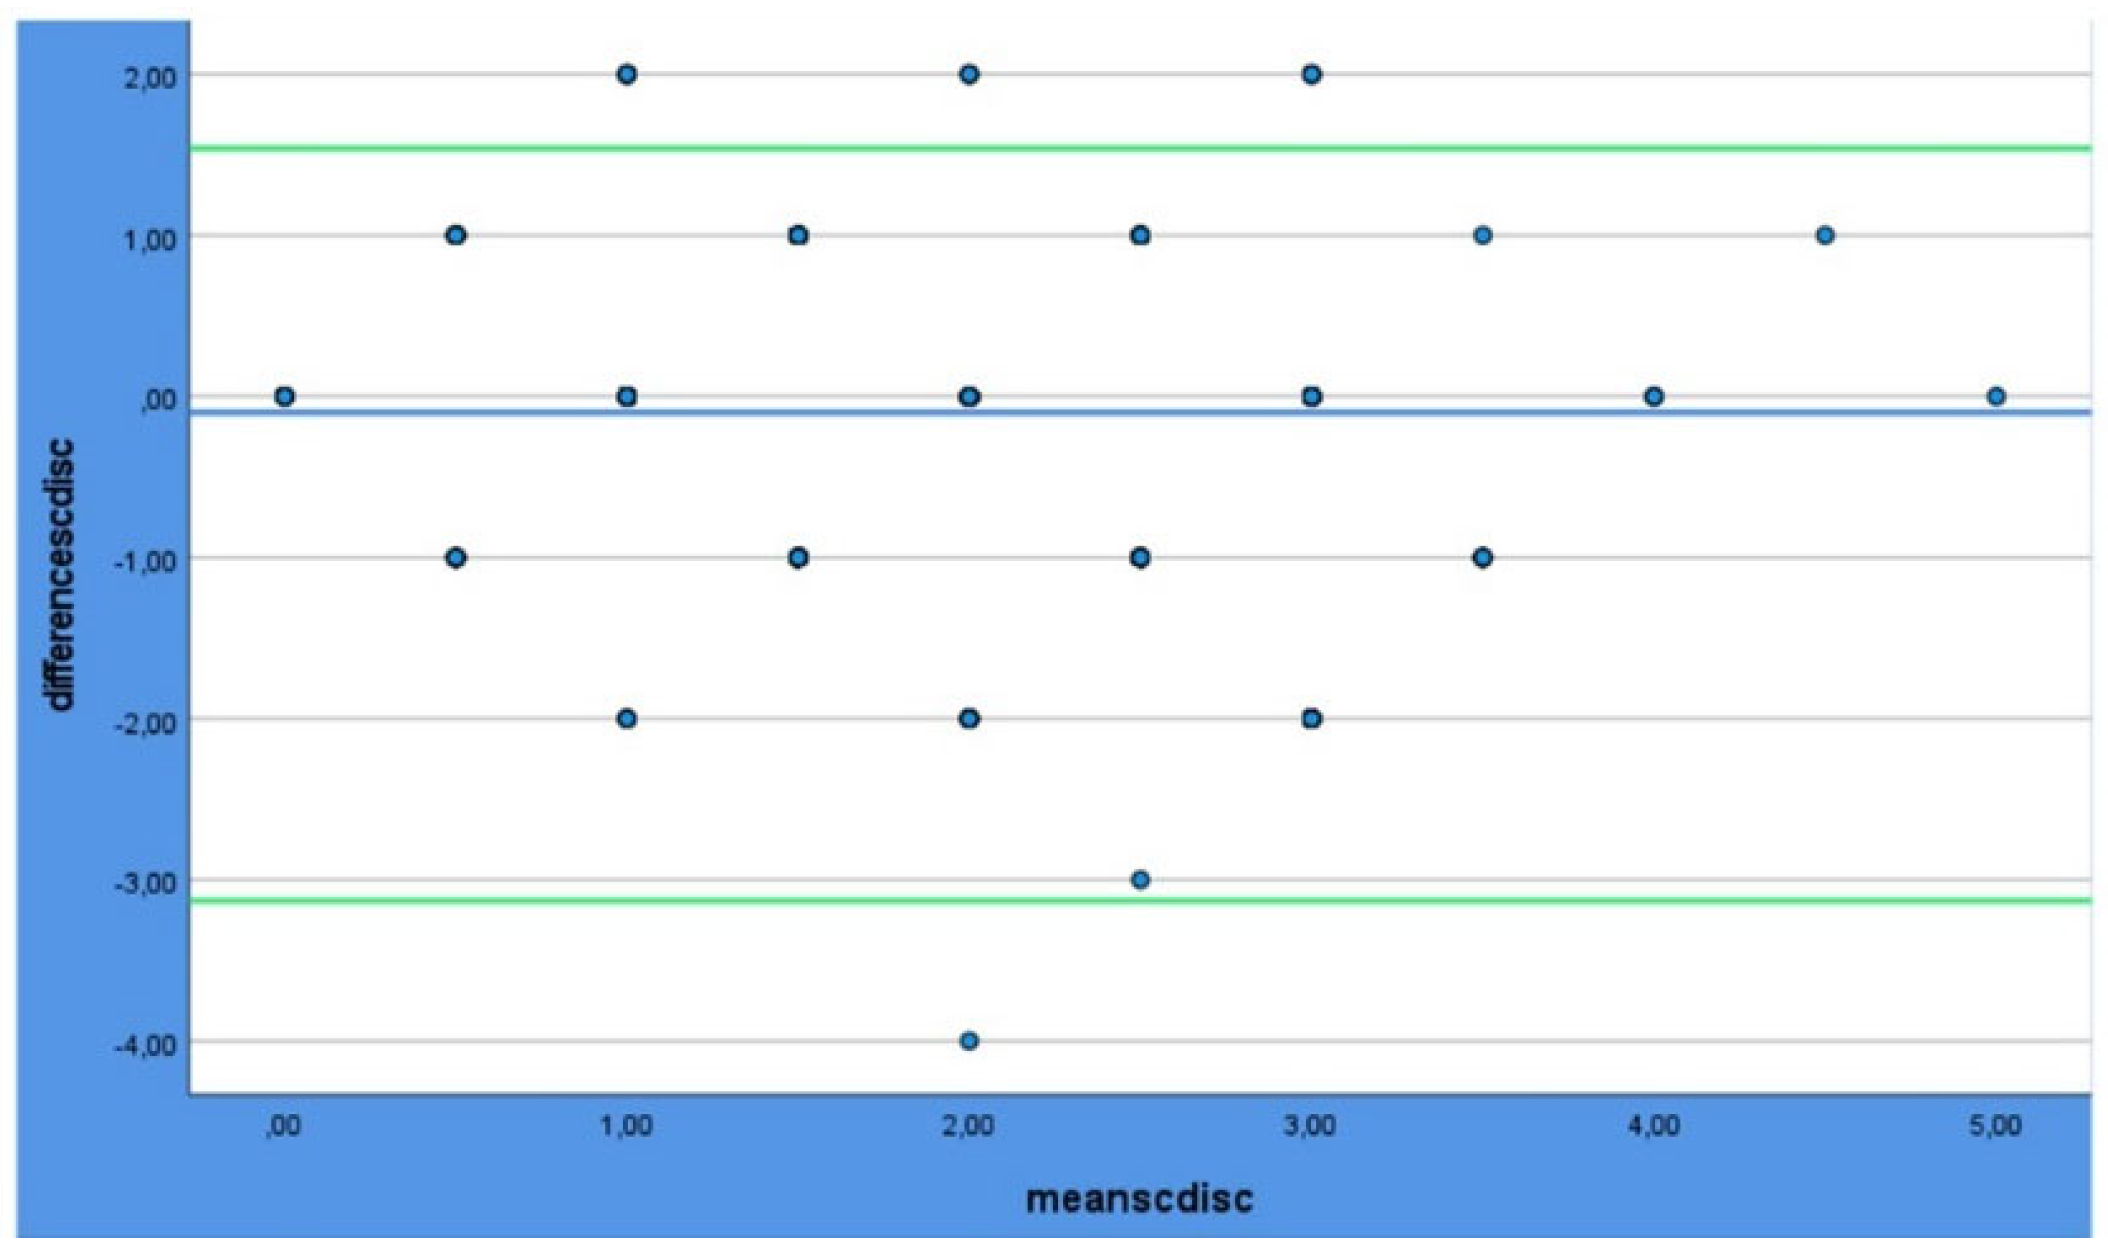

Table 1.
The Turesky modified Quigley-Hein plaque index scores and description.
| Score | Description |
|---|---|
| 0 | No plaque at the cervical margin |
| 1 | Separate flecks of plaque at the cervical margin of the tooth |
| 2 | A thin continuous band of plaque (≤1 mm) at the cervical margin of the tooth |
| 3 | A band of plaque wider than 1 mm but covering less than one-third of the crown of the tooth |
| 4 | Plaque covering at least one-third but less than two-thirds of the crown of the tooth |
| 5 | Plaque covering two-thirds or more of the crown of the tooth |
Table 2.
Correlations between the three methods of scoring plaque (clinical examination, 3D models, and 3D models with disclosing agent).
Table 2.
Correlations between the three methods of scoring plaque (clinical examination, 3D models, and 3D models with disclosing agent).
| Clinical | 3D models | 3D models + disclosing | ||
|---|---|---|---|---|
| Clinical | Correlation Coefficient | 1.000 | .573 | .618 |
| P - value | . | <.001 | <.001 | |
| 3D models | Correlation Coefficient | .573 | 1.000 | .527 |
| P - value | <.001 | . | <.001 | |
| 3D models with disclosing | Correlation Coefficient | .618 | .527 | 1.000 |
| P- value | <.001 | <.001 | . |
*Spearman’s rho.
Table 3.
Correlations between the methods of scoring plaque (clinical examination, 3D models, and 3D models with disclosing agent) per tooth group type.
Table 3.
Correlations between the methods of scoring plaque (clinical examination, 3D models, and 3D models with disclosing agent) per tooth group type.
| Clinical vs 3D models | Clinical vs 3D models with disclosing agent | 3D models vs 3D models with disclosing agent | |
|---|---|---|---|
| Upper molars and premolars | 0.563 | 0.568 | 0.647 |
| Upper front | 0.490 | 0.763 | 0.450 |
| Lower molars and premolars | 0.595 | 0.746 | 0.527 |
| Lower front | 0.616 | 0.543 | 0.526 |
*Spearman’s rho.
Table 4.
One sample t-test for inter-rater reliability.
| One-Sided p | Two-Sided p | 95% Confidence Interval of the Difference | |||||
|---|---|---|---|---|---|---|---|
| Df | Mean Difference | Lower | Upper | ||||
| 3D models | -3.204 | <.001 | 649 | .001 | -.10753 | -.1734 | -.0416 |
| 3D models with disclosing agent | -6.113 | <.001 | 650 | <.001 | -.20154 | -.2663 | -.1368 |
Table 5.
Correlations for the inter-rater reliability of plaque scored on 3D models with disclosing agent.
Table 5.
Correlations for the inter-rater reliability of plaque scored on 3D models with disclosing agent.
| Examiner 1 | Examiner 2 | Examiner 3 | Examiner 4 | |
|---|---|---|---|---|
| Examiner 1 | 1.000 | .664 | .551 | .766 |
| Examiner 2 | .664 | 1.000 | .681 | .741 |
| Examiner 3 | .551 | .681 | 1.000 | .648 |
| Examiner 4 | .766 | .741 | .648 | 1.000 |
*Cronbach’s α.
Disclaimer/Publisher’s Note: The statements, opinions and data contained in all publications are solely those of the individual author(s) and contributor(s) and not of MDPI and/or the editor(s). MDPI and/or the editor(s) disclaim responsibility for any injury to people or property resulting from any ideas, methods, instructions or products referred to in the content. |
© 2024 by the authors. Licensee MDPI, Basel, Switzerland. This article is an open access article distributed under the terms and conditions of the Creative Commons Attribution (CC BY) license (http://creativecommons.org/licenses/by/4.0/).
Copyright: This open access article is published under a Creative Commons CC BY 4.0 license, which permit the free download, distribution, and reuse, provided that the author and preprint are cited in any reuse.


