
Submitted:
21 July 2025
Posted:
22 July 2025
You are already at the latest version
Abstract
Background/objective: precise identification of occlusal contacts is important in restorative and prosthetic den-tistry to provide lasting stability and function. Although articulating paper is the standard method for evaluating occlusion, modern device like intraoral scanners (IOS) and occlusense provide digital alternative that may improve accuracy and utility.
Methods: a customized cast using an intraoral scanner and 3D printer and was mounted to semi adjustable ar-ticulator. Occlusal contact was measured utilizing articulating paper 80 μm, occluSense, and an intraoral scanner IOS under a constant force of 200 N in (MIP). Each procedure was carried out seven times. Contact areas and points have been assessed by tracing JPEG image in AutoCAD software. The surface area and number of contacts point mean value were calculated for standardized comparison. The introral scanner (3shape) data was super-imposed to occluSense.
Results: the articulating paper displayed the greatest number of contact points, whilst the IOS demonstrated the least contact number yet showed the most extensive surface area. OccluSense revealed modern contact numbers and surface area while establishing the greatest consistency. Statistical analysis indicated significant variation in contact point detection (P < 0.01), although no significant variation were seen in surface area (P=0.40). Spearman’s Correlation Matrix Between Total Surface Area and Number of Contact values demonstrated strong to positive correlation among technique.
Conclusions: while each technique has its strength and limitation, occluSense showed to be the most reliable and consistent for identifying occlusal, and the intraoral scanner demonstrated limited precision in revealing occlusal contacts when used alone. By combining and superimposing the spatial data from IOS with the functional insight from OccluSense, they could provide more efficient data to establish a comprehensive and clinically useful oc-clusal evaluation.
Keywords:
occlusal contact
; intraoral scanner
; occluSense
; articulating paper
; digital dentistry
1. Introduction
According to Ferro et al (2017), “occlusion” refers to the constant relationship that exists between the upper or lower teeth’s or tooth analogs’ incising/occlusal or chewing surfaces [1]. Dental practitioner should have an understanding of occlusion as well as occlusal contacts in order to perform an effective and efficient dental practice. The occlusal contacts are constantly changing with most dental restoration treatments [2]. Dental occlusion refers to the static and dynamic relations between the teeth in the upper and lower jaws. The teeth in both arches form stable relationships when they are at the maximum intercuspation at the end of chewing or during swallowing or clenching [3].Occlusal stability is characterized by the presence of numerous and simultaneous contacts between the teeth, the absence of toothache, the absence of periodontal disease, a satisfactory VDO (vertical dimension of occlusion), appropriate tooth wear for the person’s age, no tooth loss, and a harmonious relationship between the front teeth and the occlusal plane [4].In order to successfully create intricate oral rehabilitations, it is crucial to accurately document both the static and dynamic occlusal relationships between the teeth in order to achieve functional and harmonious dental restorations [5].
Although occlusal contacts are highly significant, there is currently no objective criterion or reliable “gold standard” for accurately capturing them. different techniques have been used to record, collect, and transmit occlusal information. However, there is a lack of precise measurements for occlusal contact [6]. Occlusal indicators are qualitative(traditional) and quantitative(digital), with traditional methods using articulation paper for contact selection. However, these paper strips are thick, easily damaged, and create pseudo contact marks [7]. Despite the plethora of available materials and means, articulating papers and foils remain the benchmark against which more advanced technologies are evaluated to.
In recent times, the advancement of digital technology has brought about significant changes in the area of dentistry, this has enabled us to assess the occlusal contacts with more accuracy, both in static and dynamic occlusion [8]. OccluSense, developed by Dr. Jean Bausch, GmbH & Co KG in Köln, Germany, is an innovative device used to accurately capture dental relationships during occlusal examination, The device comprises a sensor coated with articulating paper that is placed into the handheld. This sensor captures and communicates data to the OccluSense-iPad-App. OccluSense, unlike traditional approaches, not only captures the distribution and strength of the occlusal force but also records the exact moment of dental contact [5,8]
Over the past decade, there has been an increasing utilization of chairside intraoral scanners for obtaining digital impressions. This information is derived from the utilization of maxillary and mandibular digital models in STL format (Standard Triangle Language)[9]. The increasing utilization of digital technology in dentistry has the possibility of enhancing the recording of contact in static and dynamic occlusal relationship and can also determine the occlusal contact area. Intraoral scans provide improved time-efficiency in comparison to conventional methods and have the potential to expedite the process when the practitioner possesses adequate training [10].
Comprehending occlusion is important for effective dental treatment, nevertheless, conventional tools such as articulating paper may lack reliability. Although intraoral scanners provide rapidity and digital effectiveness. They frequently overlook important detail like pressure and timing. Occlusense introduces a novel aspect by recording not only the contact point but also the distribution of forces. The objective is to assess the reliability of static occlusal recordings and to compare the distribution of static occlusal contacts obtained from intraoral scanner, occlusense, and articulating paper.
2. Materials and Methods
Cast fabrication: The intraoral scanner is used to scan the upper and lower jaw of the patient, the data is saved to STL format and imported to the 3D printer slicing software to fabricate customized cost. The cast was mounted on semi adjustable articulator (bioart)
Articulating paper: The articulating paper U shape Two layers of 80 μm black and red color coating placed between upper and lower cast on semi adjustable articulator. The 200N force (20 kg, weight) was placed above the articulator to apply force on the cast in static occlusion during maximum intercuspal position (MIP). The mark on contact point was captured by digital 2D camera for both upper and lower cast [11]. This procedure was established for seven times. First of all, the test data in JEPG format was imported to AutoCAD then scaled the size of upper and lower jaws according to the model in centimeter, then traced the outlines of the contact point using a command in AutoCAD called Spline. The selected outline shows the area of each contact. All contact areas were recorded separately one by one, the mean of all the surface area of each contact point were calculated to get the total surface area Figure 1 this procedure was established for seven times. The final product was printed out to PDF format.
OccluSense: The occluSense (Bausch, Dr. Jean Bausch GmbH & Co KG, Koln, Germany) was calibrated in order to guarantee precises measurement and recording. The test sensor 60 nm thick, contain of a printed electronic circuity coated in red color ink was placed between the maxillary and mandibular customized casts in static occlusion during maximum intercuspal position (MIP) on a semi-adjustable articulator, the 200 200N (20 kg, weight) was submitted above the articulator to record the occlusal contact, the occlusal registration was performed according to the manufacturer instructions and two senser for each test was used to measure static occlusion. The raw data obtained during the occlusion check is stored locally on the portable equipment. Subsequently, the handle transfers the data to the OccluSense-ipad-App via a wireless connection. The data was subsequently viewed in 3D and analyzed in 2D graphs. this procedure was established for seven-time Figure 2. In estimating masticatory pressure distribution, the bars exhibit a color gradient transitioning from green to yellow to red, indicating the dispersion of masticatory pressure in a certain region. A pin point pressure is shown from red to orange, whereas a pressure across a broader surface area is represented from yellow to green. The bars display a color gradient transitioning from green to yellow to red, indicating the relative variance of a contact point in relation to its neighboring contacts.
First of all, the test data was in JEPG format was imported to photoshop to create superimposed occluSense tests image of each test with the photo of the actual customized model. These edited images were then exported to Jpeg format, then the superimposed tests were imported to AutoCAD where they were scaled to match the dimension of the customized model of each test. The same procedure as for articulating paper was performed to occluSense to get the total surface area and the number of contacts, Figure 3.
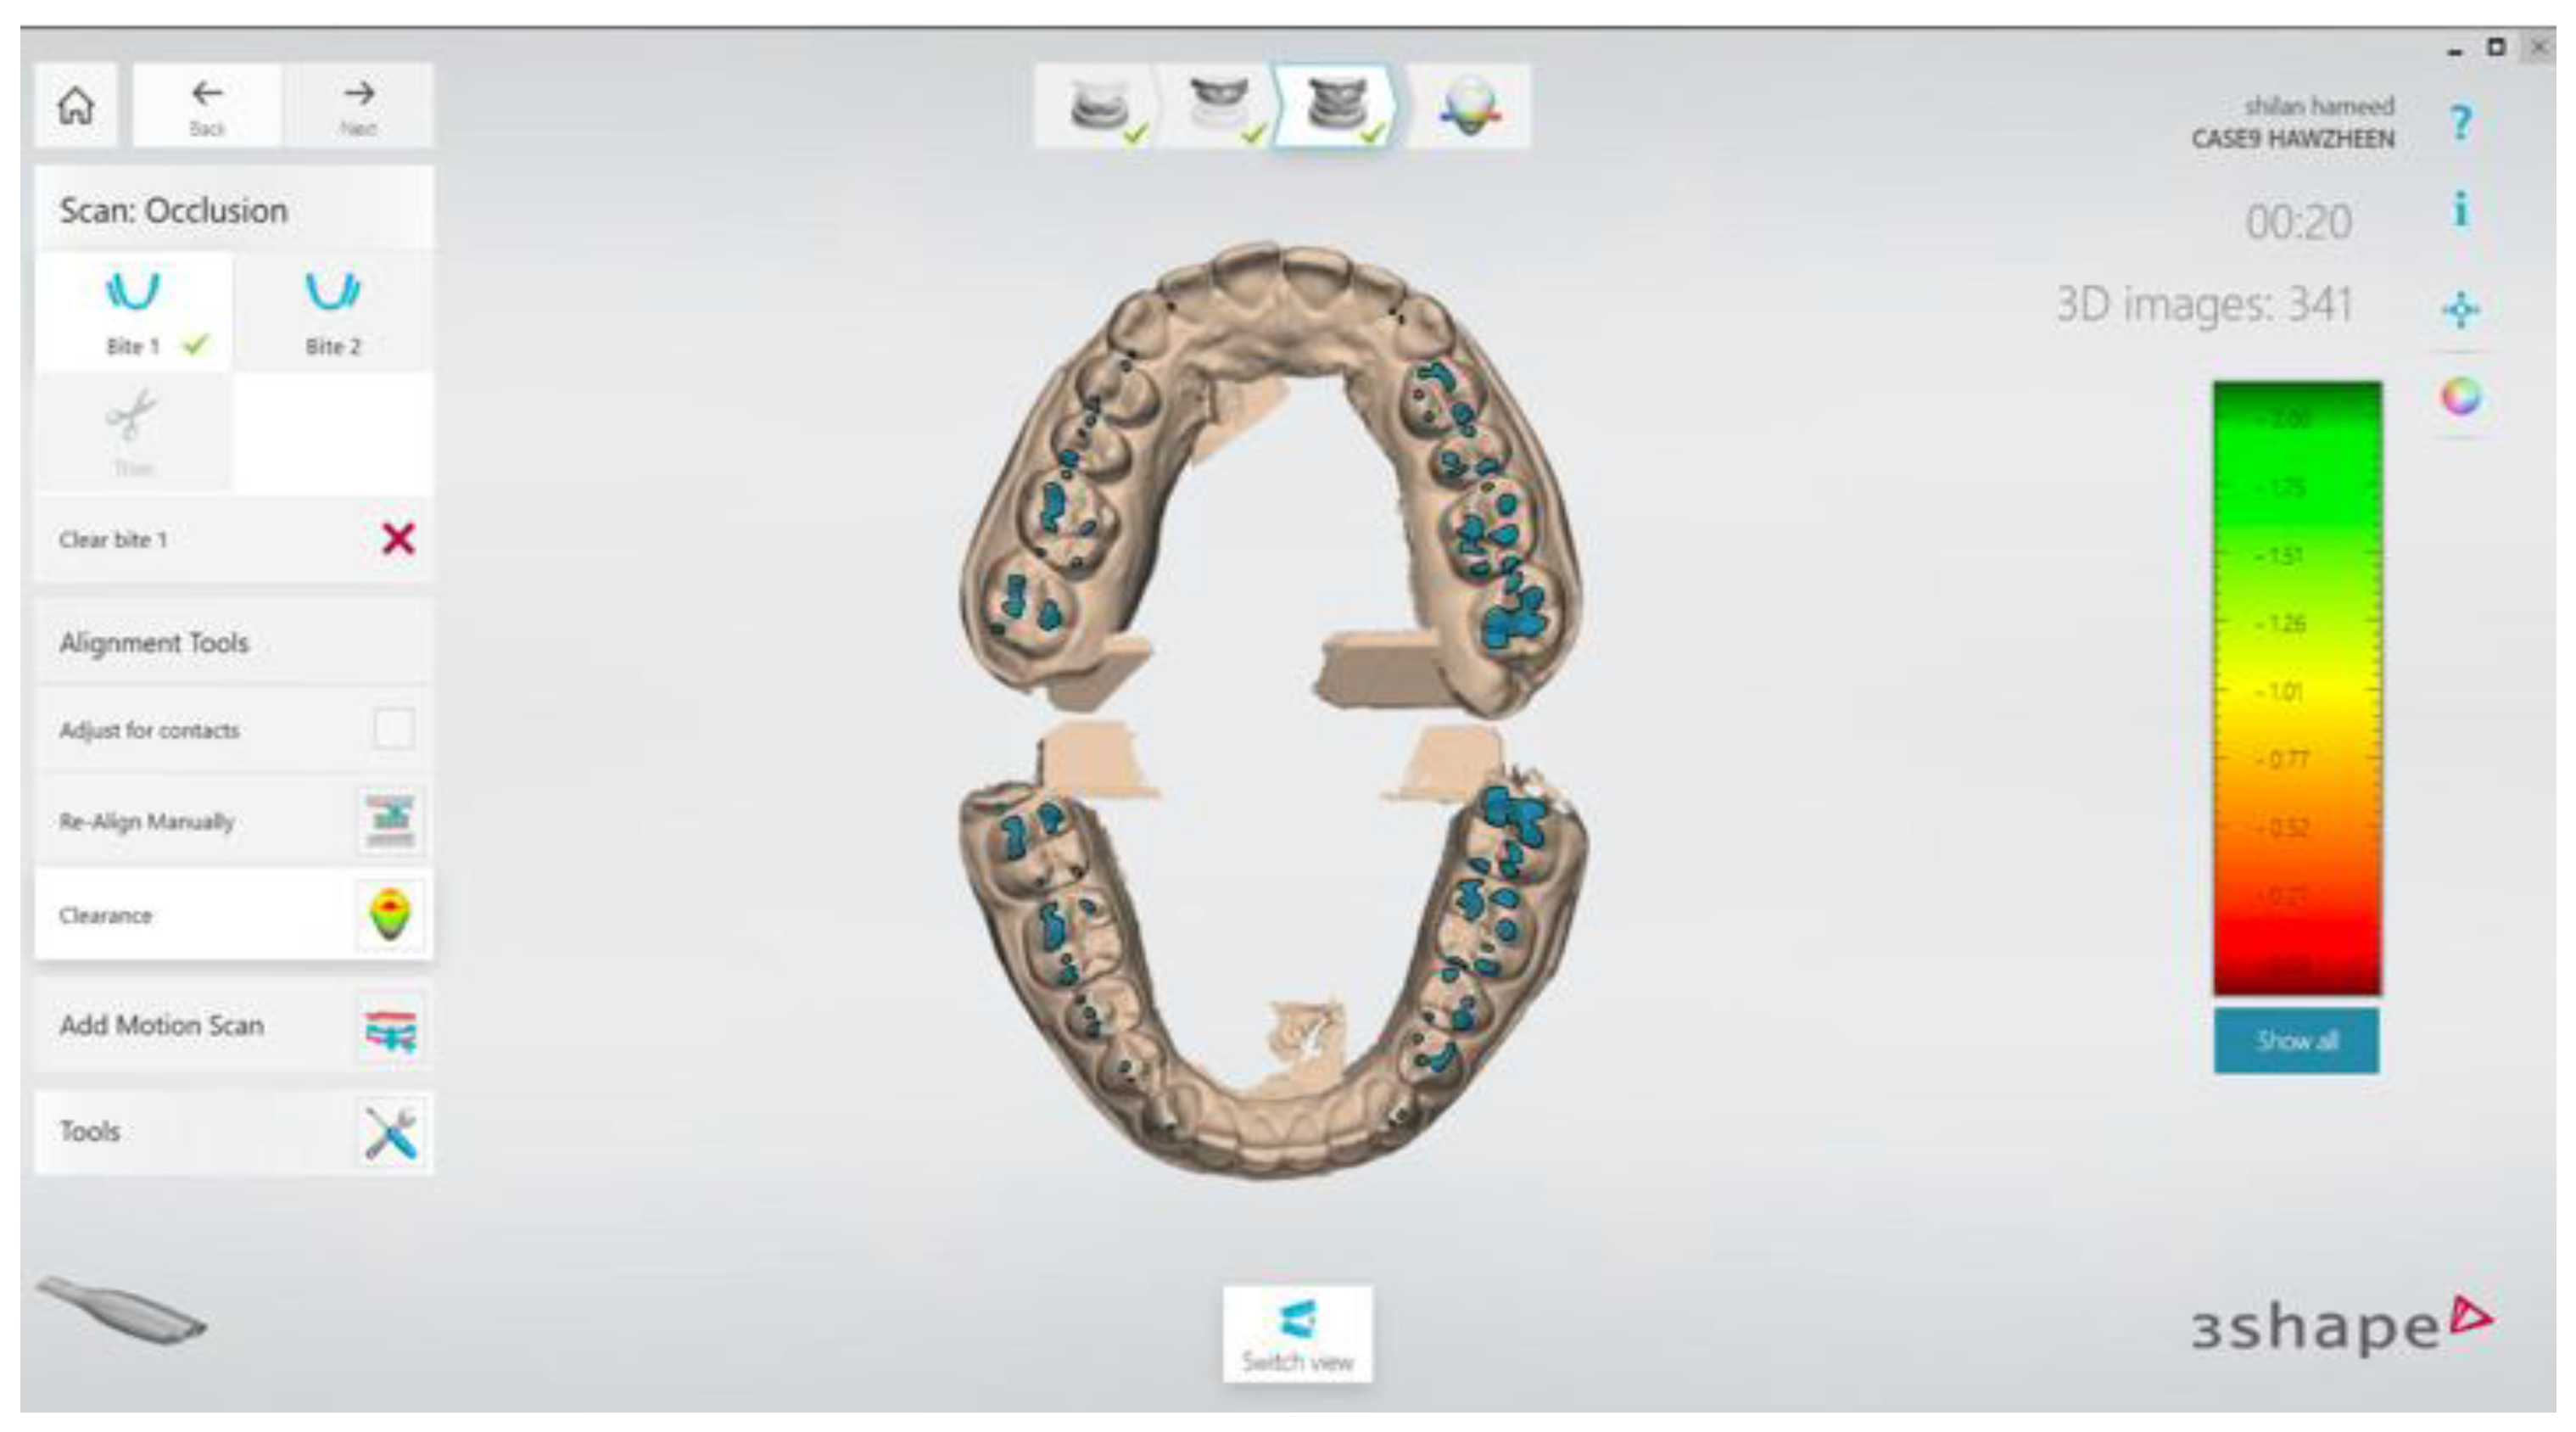
Intraoral scanner IOS (3Shape): Initially, the scanner setting was configured, followed by selecting the “Trios to Scan” setting. “Adjust for Intersection” option was chosen in the bite adjustment section. For the scanning purpose the upper cast was first detached from the semi adjustable articulator. Scanning began at the occlusal then buccal of posterior teeth. As the scan passed the central incisors a subtle wiggling motion was applied, until extending to the last molar. After that, the buccal surface, palatal surface was scanned according to the manufacture’s instruction.
The lower cast was scanned utilizing the same procedure for upper cast, following the manufacturer’s guidelines. 200N force (equivalent to 20 kg) weight was submitted above semi adjustable articulator for occlusal recording. Then the bite scan was performed from the right posterior molar to left molar, adjust for contacts was selected followed by clearance selection to display the data of occlusal recording, the data were screenshot, Figure 4.
The test data was in JEPG format was imported to AutoCAD then the same procedure was established as for the articulating paper to show the area of each contact, and all contact area were recorded separately. This technique was established for seven time. then the final product was printed out to PDF format. The same procedure as for articulating paper and occluSense was performed to IOS to get the total surface area and the number of contacts, Figure 3.
Figure 5.
using AutoCAD, then the selected outline shows the area of each contact for both upper and lower customized cast.
Figure 5.
using AutoCAD, then the selected outline shows the area of each contact for both upper and lower customized cast.
The two digital device images were superimposed together for comparison using the autocad Figure 6.
Because the occluSenese recording dese not differentiate between the maxillary and mandibular arch, data so the reading will be the considered for both upper and lower, for example, if tooth number 27-37 record five contact points, the reading of occluSense will establish the average of contact points between upper and lower customized jaw ,To ensure precise comparison analysis, the total contact surface area and the quantity of contact points for each opposing tooth pair have been averaged. This method consistently used to both the articulating paper and intraoral scanner (IOS) raw data to provide accurate and standardized comparison between the three techniques.
3. Results
The results illustrated a clear variation in occlusion measurements across the three methods Articulating Paper, OccluSense, and the Intraoral Scanner — for the 14 bilateral tooth pairs. The Intraoral Scanner recorded the highest mean surface area values in posterior teeth such as 27–37 (28.2 mm²) and 26–36 (15.08 mm²), indicating its high sensitivity to contact area. However, it detected relatively few contacts ranging between 0.0 and 6.42. Articulating Paper showed more balanced measurements, capturing both moderate surface areas and notably higher contact counts, especially in 27–37 (9.71) and 26–36 (9.36). OccluSense registered lower contact counts overall, but still highlighted notable contact areas in posterior teeth like 17–47 (8.50 mm²) and 16–46 (5.84 mm²). all three methods consistently recorded fewer contacts in anterior region (11–41 to 21–31) (Table 1).
The results showed that the greatest discrepancies in occlusion measurements occurred between the Intraoral Scanner (IOS) and the other two methods. The highest mean absolute difference in surface area was noted between AP and IOS (3.71 mm²), followed closely by OC and IOS (3.42 mm²), with the tooth pair 27–37 consistently showing the maximum surface difference in both comparisons (21.05 mm² and 22.38 mm², respectively). Similarly, in terms of contact count differences, the largest mean absolute difference occurred between AP and OC (2.58), while the highest individual contact count difference was again seen in 27–37 for both AP vs OC (6.57) and AP vs IOS (6.93) (Table 2).
The results showed that there were noticeable differences in total surface area and number of contact points among the three occlusion detection methods across the 14 tooth pairs. The Intraoral Scanner recorded the highest mean total surface area (5.29 ± 1.24 mm²), followed by Occlusense (3.22 ± 0.52 mm²), and Articulating Paper (2.50 ± 0.23 mm²). However, the Friedman test for surface area was not statistically significant (χ² = 1.86, p = 0.40), indicating no meaningful difference in surface area among the methods. In contrast, the number of contact points differed significantly (χ² = 21.71, p < 0.01), with Articulating Paper showing the highest mean (4.35 ± 2.85), compared to Intraoral Scanner (1.82 ± 0.94) and Occlusense (1.77 ± 0.31) (Table 3)
The results revealed strong and statistically significant positive correlations between total surface area and number of contact points across all occlusion detection methods (p < 0.001 for all correlations). Specifically, surface area measurements among methods were highly correlated, with Spearman’s rho values of 0.92 (AP–OC), 0.90 (AP–IOS), and 0.92 (OC–IOS), suggesting high consistency in surface detection trends across devices. Likewise, contact point counts also showed strong inter-method correlations (e.g., 0.91 between AP and OC, and 0.92 between OC and IOS). Additionally, surface area was strongly correlated with contact points within each method (e.g., r = 0.89 for AP) (Table 4)
4. Discussion
In this study the results illustrated a significant difference (p < 0.01) in occlusion measurements while surface area variation was not statistically significant (p= 0.40) across the three methods — Articulating Paper, OccluSense, and the Intraoral Scanner. the occluSense showed more reliability and consistency compared to IOS and articulating paper. This study is consistent with the research that conducted by Manziuc et al,2024 using 40 μm AP, IOS and occluSense. Even though their result showed more contact number by articulating paper, the digital device especially occluSense established superior in consistency and reliability especially in static relationship of occlusion [5]. In this study, despite registering the greatest contact number by AP, it demonstrates higher variability and it cannot deliver a precise quantitative data. This might be the ink marking is not related to occlusal force distribution but rather its due to smearing and surface irregularities. This is consistent to qader et al and ceray that this finding might be due to the size of paper marks is influenced by tooth morphology, rather than occlusal force. Thinner paper results in smaller, less pronounced markings [7,9,12]. In our study OccluSense tended to register lower contact number overall, but still highlighted notable contact areas in posterior teeth in comparison to AP and IOS. Which is in contrast to the study that conducted by gozen 2025 utilizing IOS and OccluSense on single implant which showed more contact count than IOS, nevertheless the occluSense was more consistent and reliable compare to IOS [13]. This is due to that in this study only the red bar was considered digitally which represent a high spot and initial contact rather than the 60 μm sensor mark. Across all three methods, anterior teeth showed minimal differences across all comparisons, highlighting low variability in surface and contact detection in those regions. This might be due to the simpler anatomy of anterior teeth where fewer contacts are present. Another study was conducted by Jaurigie et al, 2024 in vitro between occluSense and T scan also show similarity to our result that occluSense has high repeatability and accuracy for occlusal recording. Its capacity to measure both location and pressure during static and functional occlusion makes it a reliable tool for clinical use[14].
In our study the Intraoral Scanner was least consistent compared to other method. It recorded the highest surface area values in posterior teeth, However, despite the large surface values, the number of contact points detected by IOS remained relatively low, this result suggests that IOS evaluate occlusal contact according to the proximity between the opposing teeth. However, this method depending on optical alignment and spatial approximation does not precisely show the actual force levels in occlusal contacts. this aligns with the previous researcher by sutter and other to compare the IOS scanner occlusal force estimates with T scan on same group of subjects. the study indicated that IOS system are lack from built in force record capabilities, hence restricting its ability to record occlusal contact force data from between teeth[15]. this occurs because all scanners acquire data with all teeth separate and not in contact. Significantly, the scanning of a buccal view of the intermaxillary articulation is carried out using a mathematical algorithm rather than occlusal contact force pressure mapping data [15,16]. Another study was aligned to this study by rosa esposito (2024) on reliability of recording occlusal contacts by using intraoral scanner and articulating paper. Their result showed significant difference between the number of contact recorded by digital scan IOS and articulating paper mark [17].
According to our study there was good to excellent intre-rater agreement between the three methods in measuring both surface area and number of contacts which was consistent with the study by mariea et al 2024 conducted a comparison of 40 micron articulating paper, occluSense and medit i700. The inter-rater reliability between the three-method showed almost perfect agreement during MIP. According to the author the capacity of IOS to record the occlusal contact is still inconsistent [5]. A study conducted by kui et al, 2024 which was in contrast to our study, there research was to compare and evaluate the precision of maximum intercuspation analysis using both conventional articulating paper and three digital intraoral scanners, the study showed no significant difference between the occlusal contact point analyses acquired by the IOS scanners and AP[18]. This divergence might be due to different study design, there in vivo comparison utilizing different IOS device in clinical environment, whereas our in vitro study applied a constant force and repeated measurement on customized cast. These variation between IOS and AP may not be evident in single clinical scan. According to Revilla 2023, the use of digital technology in dental practice significantly enhances the diagnostic and design skills of prosthodontic treatment. Nonetheless, the possibility of errors, especially with full arch scans, continues to be a concern that requires more enhancement of these technologies[16].
Despite the increasing integration of IOS into daily dentistry practice, their ability to consistently and precisely capture the occlusal contact points particularly regarding force, time and reliability continue to be challenged. Most IOS systems depend entirely on surface data to stimulate contact, missing real time feedback regarding force and dynamic functional evaluation. By combining and superimposing the spatial data from IOS with the functional insight from OccluSense, they could provide more efficient data to establish a comprehensive and clinically useful occlusal evaluation.
5. Conclusions
In summary, while each technique has its strength and limitation, occluSense showed to be the most reliable and consistent for identifying occlusal contacts in this study. Articulating paper remains useful but often overestimate the number of contact points, and the intraoral scanner, although valuable in digital workflows, it demonstrated limited precision in revealing occlusal contacts when used alone. These results emphasized the significant of choosing the suitable occlusal analysis technique based on the clinical objective and support by combining and superimposing the spatial data from IOS with the functional insight from OccluSense, they could provide more efficient data to establish a comprehensive and clinically useful occlusal evaluation.
Author Contributions
This article is an original article from a master degree in prosthodontics specialty, by Hawzheen Sedeeq and supervised by Professor Dr.Bassam Amin , the contribution is as follow :Bassam Amin: conceptualization of the research, validation, review & editing and supervision. Hawzhen Sedeeq : methodology , data analysis, writing and editing and original draft preparation.
Funding
This article is self-funded and there is no external fund.
Institutional Review Board Statement
This study was conducted entirely in vitro and did not involve human or animal subject.
Informed Consent Statement
No human participants were involved in this vitro study.
Data Availability Statement
We encourage all authors of articles published in MDPI journals to share their research data. In this section, please provide details regarding where data supporting reported results can be found, including links to publicly archived datasets analyzed or generated during the study. Where no new data were created, or where data is unavailable due to privacy or ethical restrictions, a statement is still required. Suggested Data Availability Statements are available in section “MDPI Research Data Policies” at https://www.mdpi.com/ethics.
Conflicts of Interest
“The authors declare no conflicts of interest.”.
Abbreviations
The following abbreviations are used in this manuscript:
| MDPI | Multidisciplinary Digital Publishing Institute |
| DOAJ | Directory of open access journals |
| TLA | Three letter acronym |
| LD | Linear dichroism |
References
- Morgano, S.M.; VanBlarcom, C.W.; Ferro, K.J.; Bartlett, D.W. The history of The Glossary of Prosthodontic Terms. J. Prosthet. Dent. 2018, 119, 311–312. [Google Scholar] [CrossRef] [PubMed]
- Pearl, D.E.E.; Joevitson, D.M.; Sreelal, D.T.; Chandramohan, D.G.; Mohan, D.A.; Hines, D.A.J. Marking the invisible – A review of the various occlusal indicators and techniques. Int. J. Appl. Dent. Sci. 2020, 6, 377–381. [Google Scholar]
- Popa, A.D.; Vlăduțu, D.E.; Turcu, A.A.; Târtea, D.A.; Ionescu, M.; Păunescu, C.; Stan, R.S.; Mercuț, V. Aspects of Occlusal Recordings Performed with the T-Scan System and with the Medit Intraoral Scanner. Diagnostics 2024, 14, 1457. [Google Scholar] [CrossRef] [PubMed]
- Skármeta, N.P. Occlusal stability and mandibular stability: The major part of dentistry we are still neglecting. Cranio® 2017, 35, 201–203. [Google Scholar] [CrossRef] [PubMed]
- Manziuc, M.-M.; Savu, M.M.; Almăşan, O.; Leucuţa, D.-C.; Tăut, M.; Ifrim, C.; Berindean, D.; Kui, A.; Negucioiu, M.; Buduru, S. Insights into Occlusal Analysis: Articulating Paper versus Digital Devices. J. Clin. Med. 2024, 13, 4506. [Google Scholar] [CrossRef] [PubMed]
- Davies, S.J.; Gray, R.J.M.; Al-Ani, M.Z.; Sloan, P.; Worthington, H. Inter- and intra-operator reliability of the recording of occlusal contacts using 'occlusal sketch' acetate technique. Br. Dent. J. 2002, 193, 397–400. [Google Scholar] [CrossRef] [PubMed]
- Qadeer, S.; Ozcan, M.; Edelhoff, D.; VanPelt, H. Accuracy, Reliability and Clinical Implications of Static Compared to Quantifiable Occlusal Indicators. 29. [CrossRef]
- Sutter, B. Digital Occlusion Analyzers: A Product Review of T-Scan 10 and Occlusense. Adv Dent Tech 2019, 1–31. [Google Scholar]
- Fraile, C.; Ferreiroa, A.; Romeo, M.; Alonso, R.; Pradíes, G. Clinical study comparing the accuracy of interocclusal records, digitally obtained by three different devices. Clin. Oral Investig. 2021, 26, 1957–1962. [Google Scholar] [CrossRef] [PubMed]
- Patzelt, S.B.; Lamprinos, C.; Stampf, S.; Att, W. The time efficiency of intraoral scanners. J. Am. Dent. Assoc. 2014, 145, 542–551. [Google Scholar] [CrossRef] [PubMed]
- Kerstein, R.B.; Radke, J. In-vitro consistency testing of the T-Scan 10 relative force measurement system. Adv Dent Tech 2022, 47–58. [Google Scholar]
- Carey, J.P.; Craig, M.; Kerstein, R.B.; Radke, J. Determining a Relationship Between Applied Occlusal Load and Articulating Paper Mark Area. Open Dent. J. 2007, 1, 1–7. [Google Scholar] [CrossRef] [PubMed]
- Gözen, M.; Güntekin, N. Comparison of occlusal force distribution and digital occlusal analysis methods of single posterior implant restorations: an in vivo study. BMC Oral Heal. 2025, 25, 1–9. [Google Scholar] [CrossRef] [PubMed]
- Jauregi, M.; Amezua, X.; Iturrate, M.; Solaberrieta, E. Repeatability and reproducibility of 2 digital occlusal analyzers for measuring the right- and left-side balance of occlusal contact forces: An in vitro study. J. Prosthet. Dent. 2023, 132, 179–187. [Google Scholar] [CrossRef] [PubMed]
- Sutter, B.A.; Radke, J.; Robert B, K. IOS Scanner Occlusogram Occlusal Force Estimates Compared to T-Scan 10 Relative Occlusal Force Measurements. Adv Dent Tech 2025, 1–12. [Google Scholar]
- Revilla-León, M.; Kois, D.E.; Zeitler, J.M.; Att, W.; Kois, J.C. An overview of the digital occlusion technologies: Intraoral scanners, jaw tracking systems, and computerized occlusal analysis devices. J. Esthet. Restor. Dent. 2023, 35, 735–744. [Google Scholar] [CrossRef] [PubMed]
- Esposito, R.; Masedu, F.; Cicciù, M.; Tepedino, M.; Denaro, M.; Ciavarella, D. Reliabilty of recording occlusal contacts by using intraoral scanner and articulating paper - A prospective study. J. Dent. 2024, 142, 104872. [Google Scholar] [CrossRef] [PubMed]
- Kui, A.; Dumbrovca, B.; Oriot, P.; Negucioiu, M.; Taut, M.; Manziuc, M.; Fluerasu, M.; Buzatu, R.; Buduru, S. Comparative Effectiveness of Intraoral Scanners and Articulating Paper in Occlusal Contact Analysis. Med. Evol. 2024, 30. [Google Scholar] [CrossRef]
Figure 1.
Using AutoCAD, then the selected outline shows the area of each contact for both upper and lower customized cast.
Figure 1.
Using AutoCAD, then the selected outline shows the area of each contact for both upper and lower customized cast.
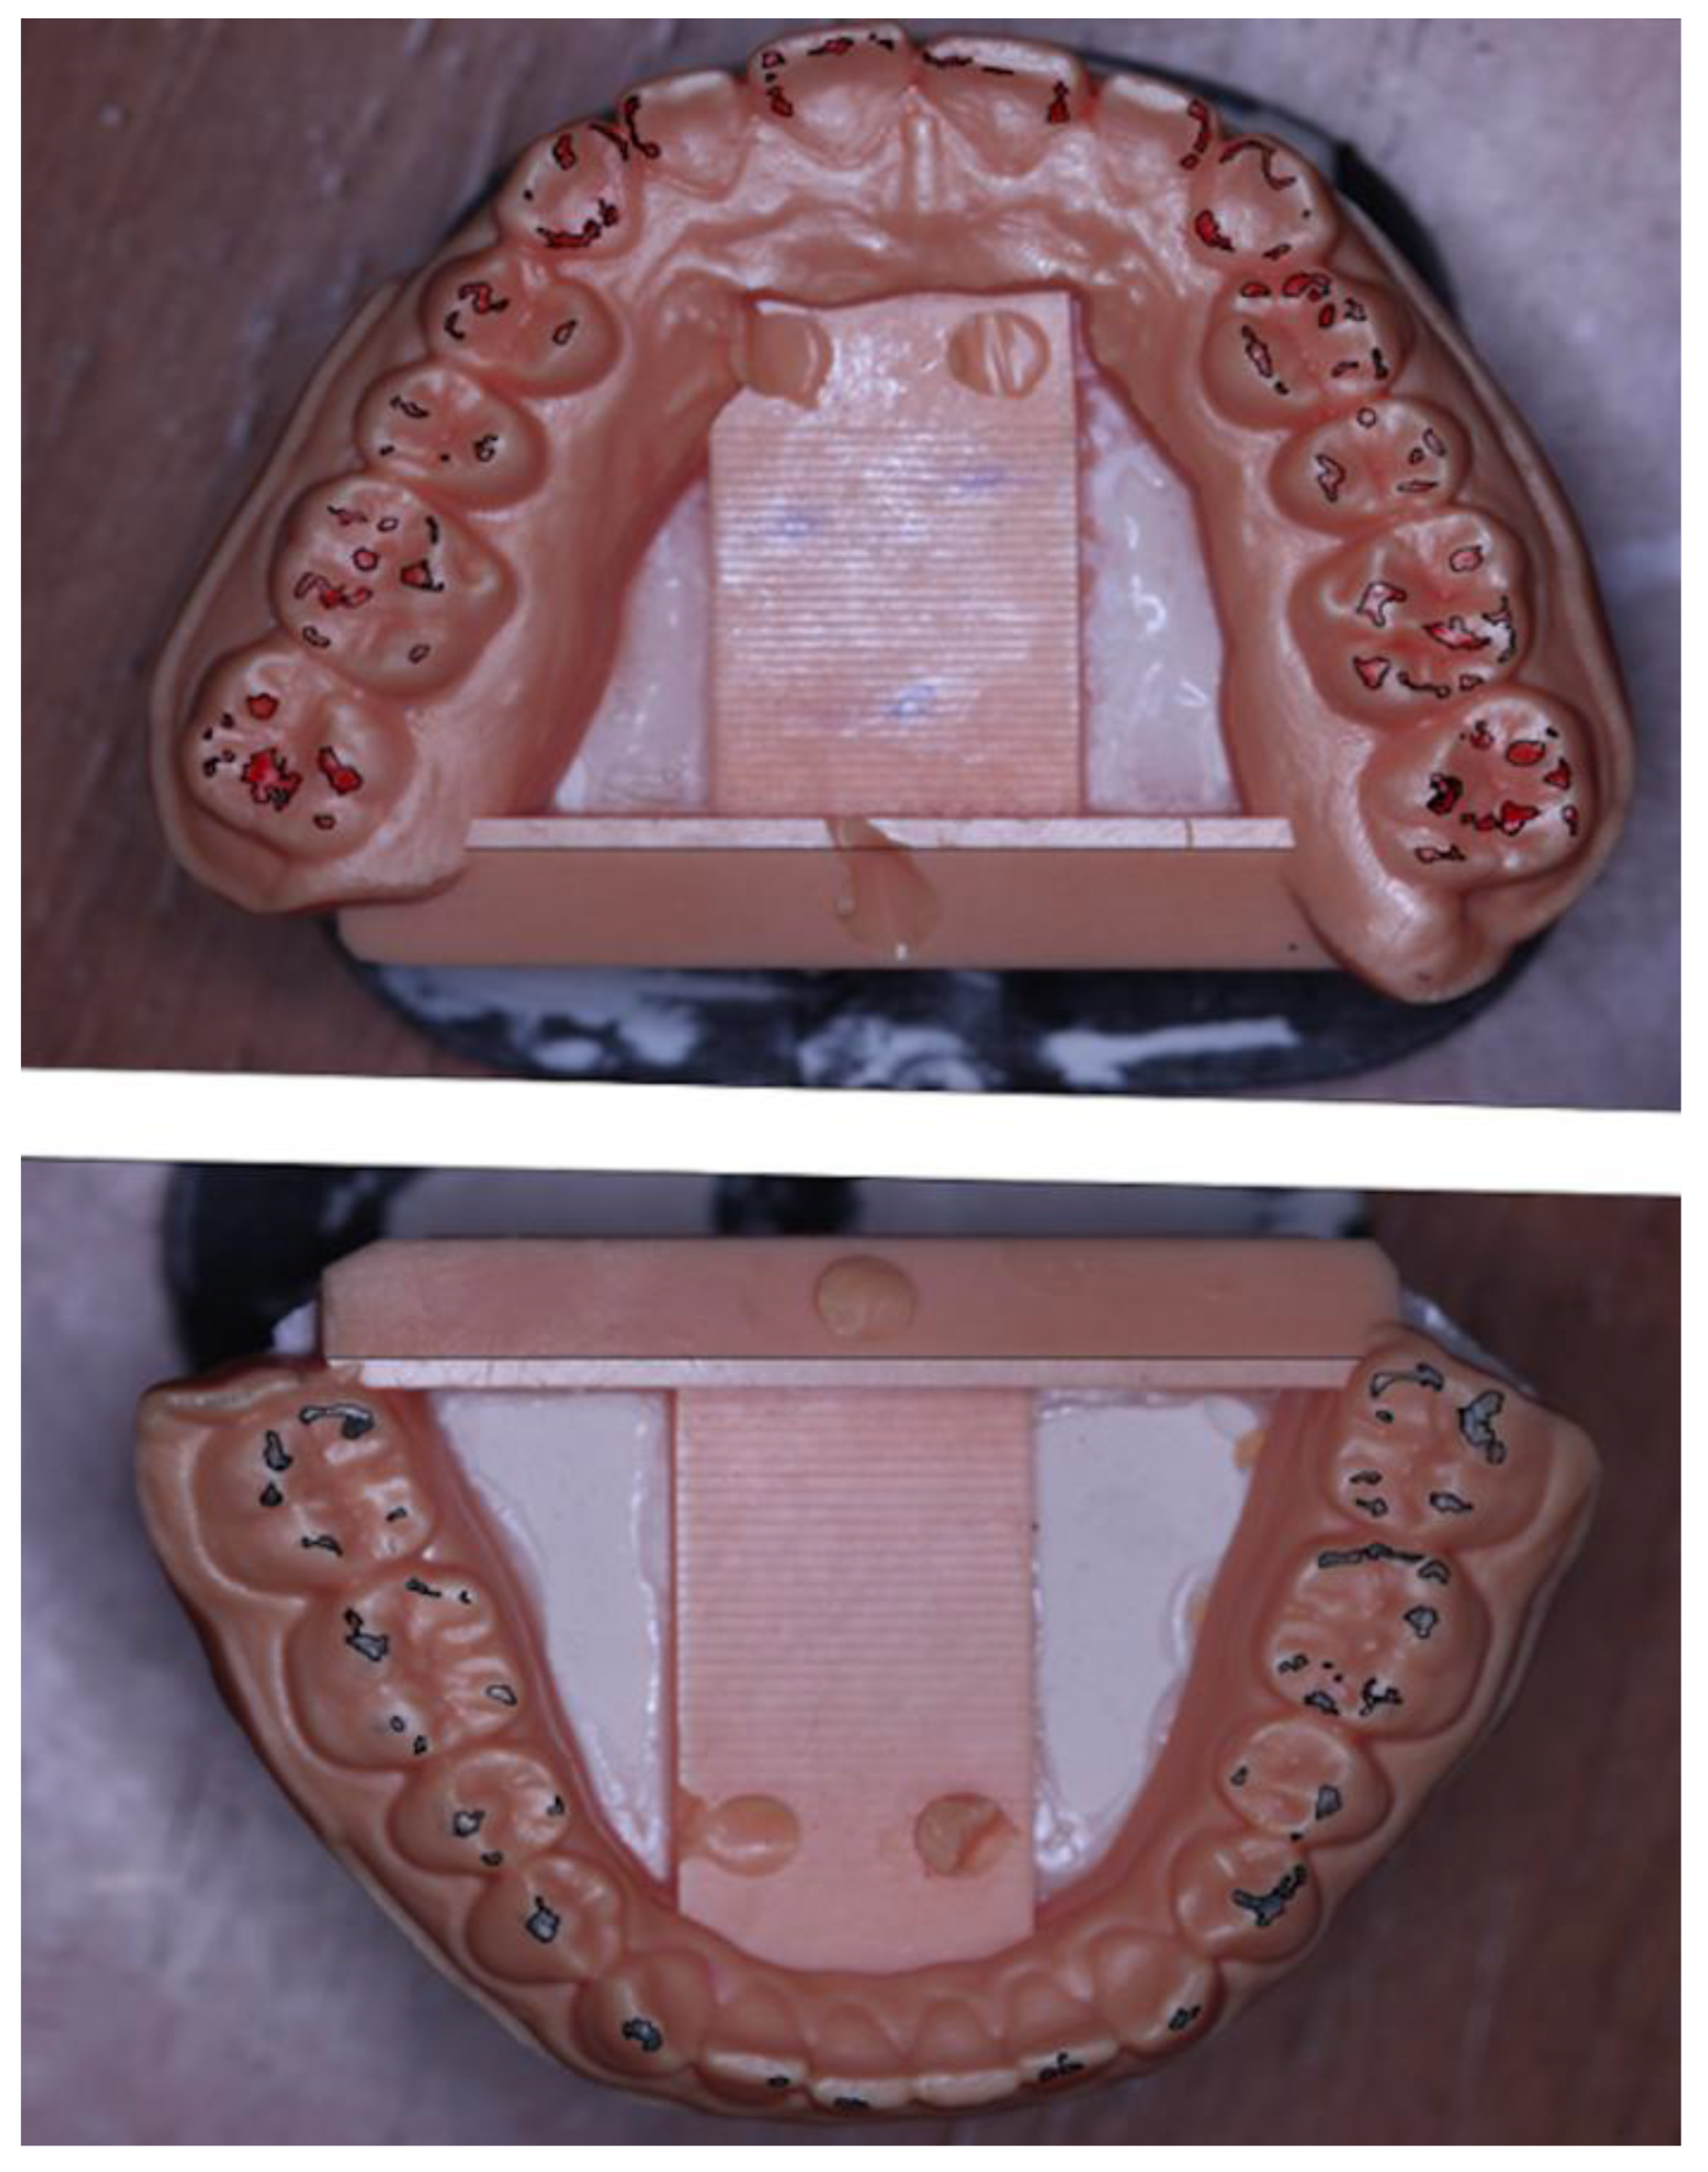
Figure 2.
A Graphic view of the OccluSense device.
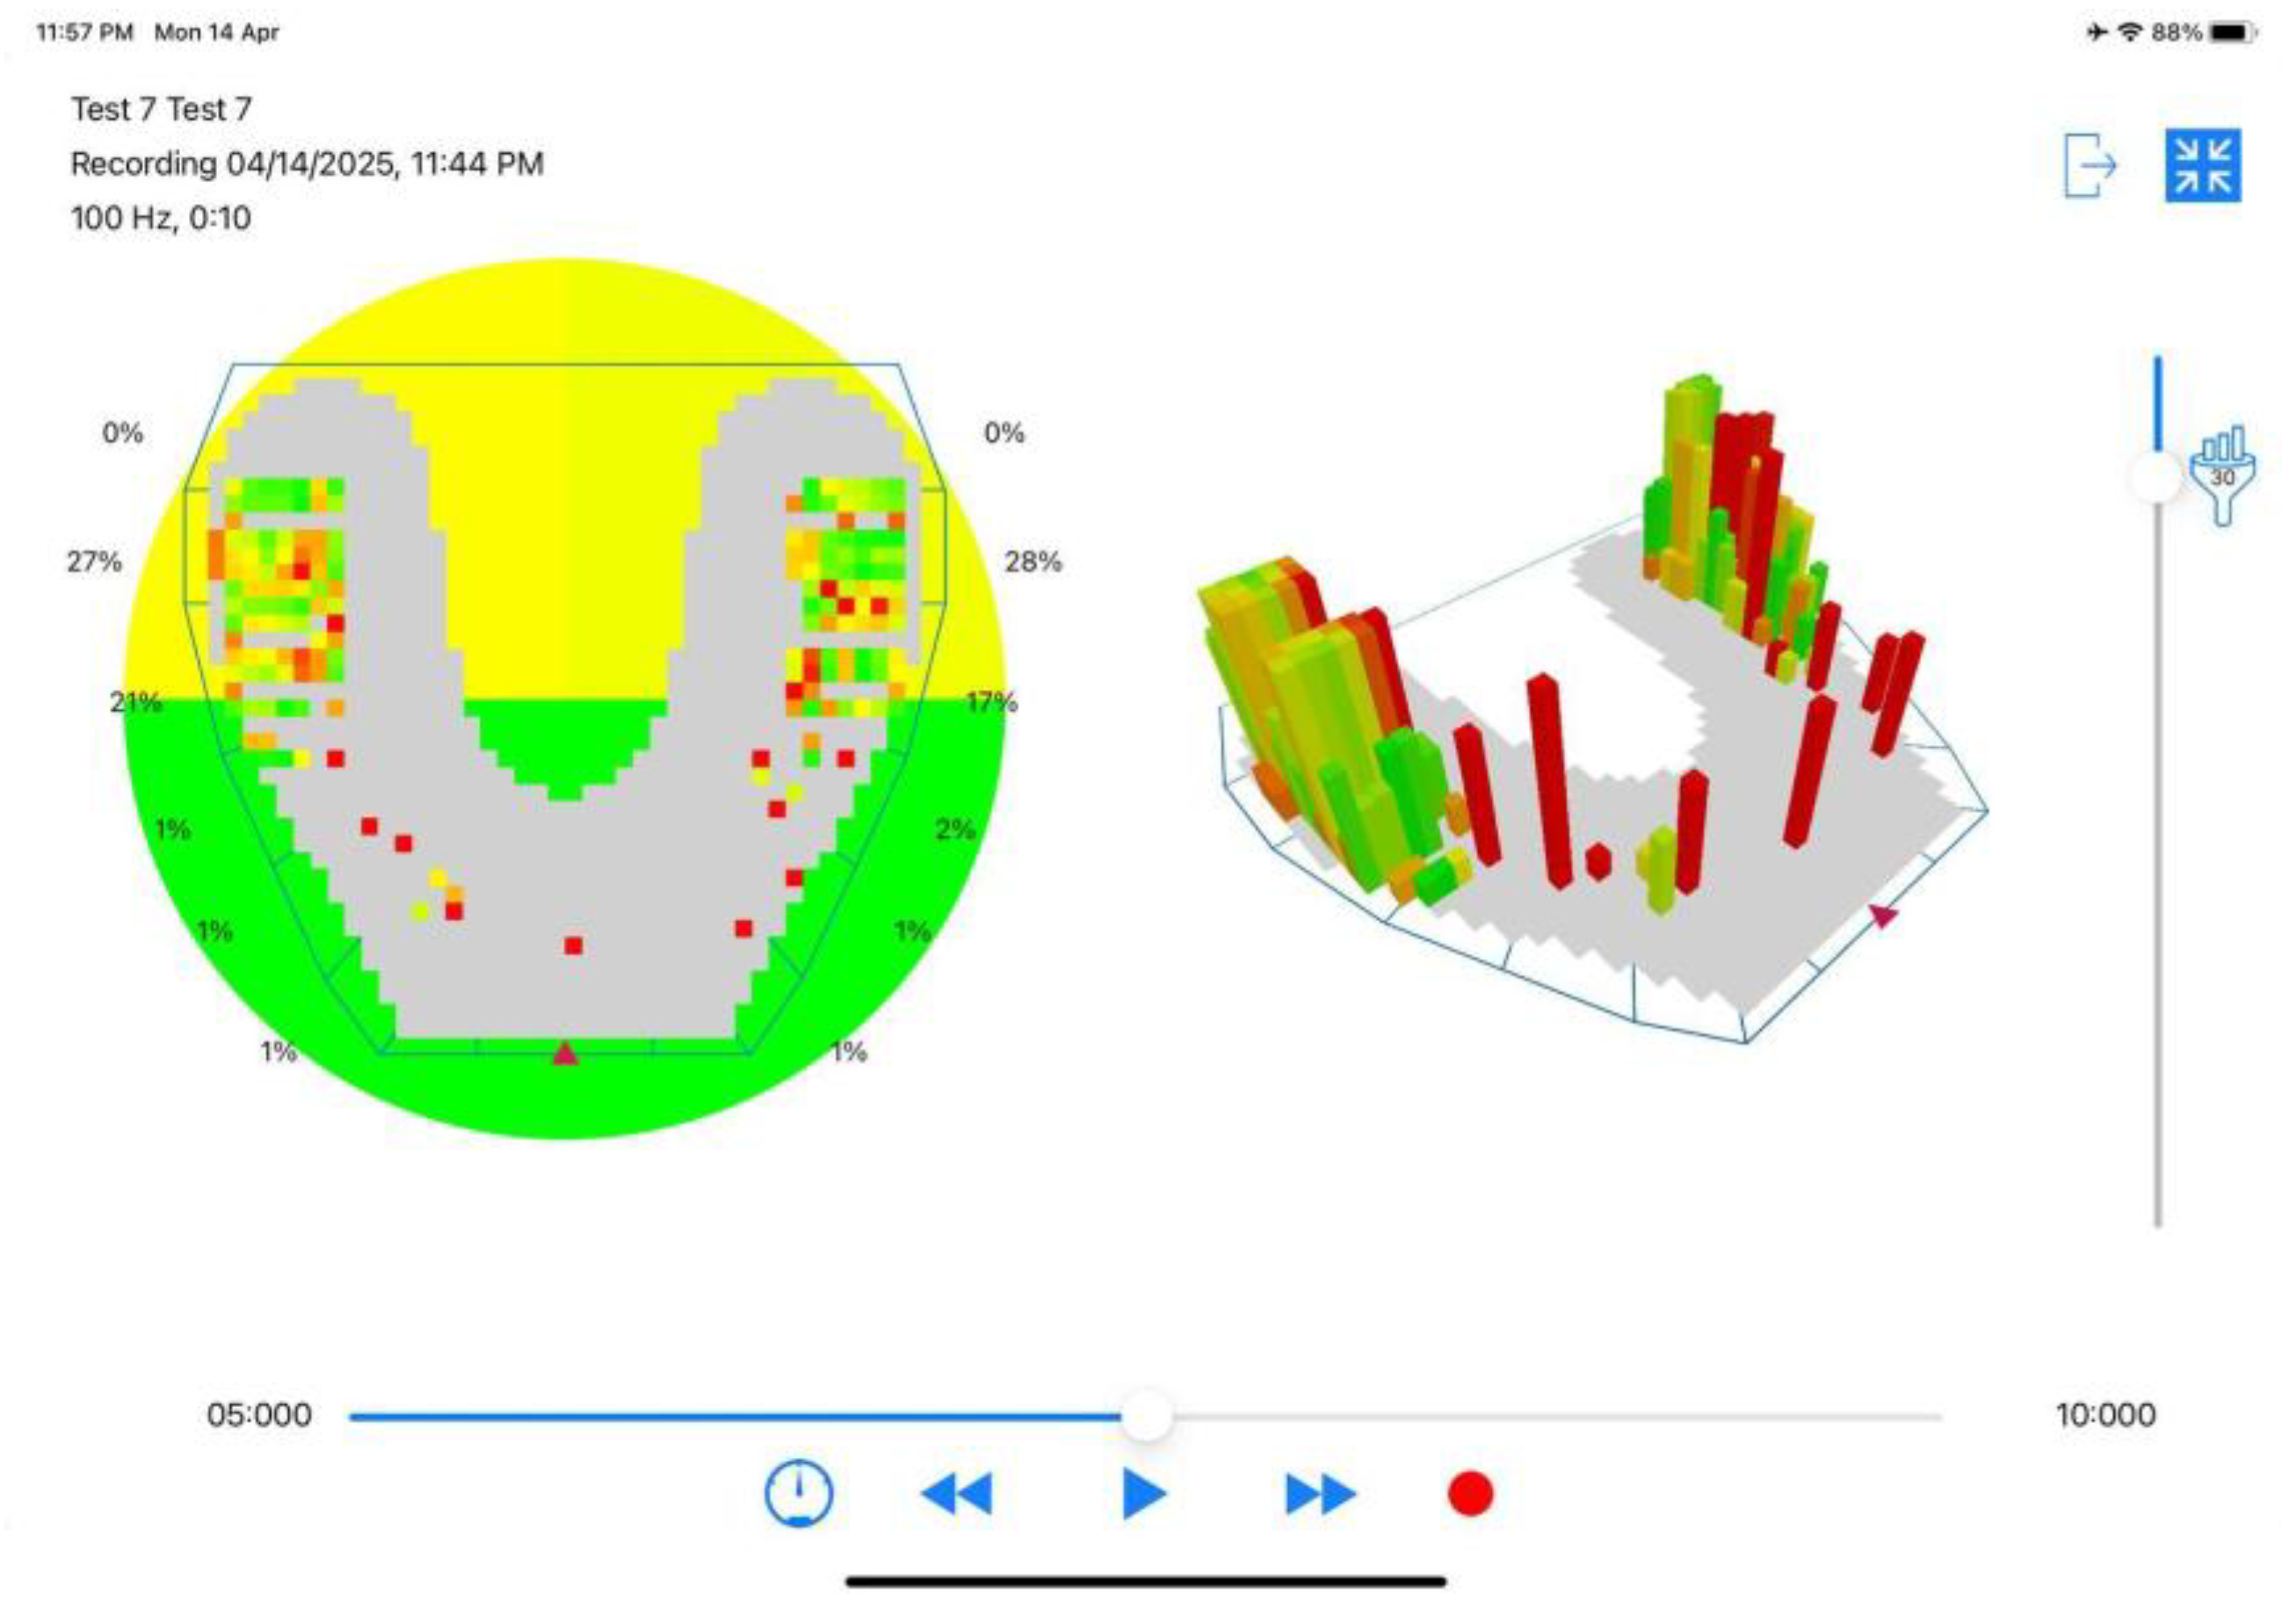
Figure 3.
using AutoCAD, then the selected outline shows the area of each contact.
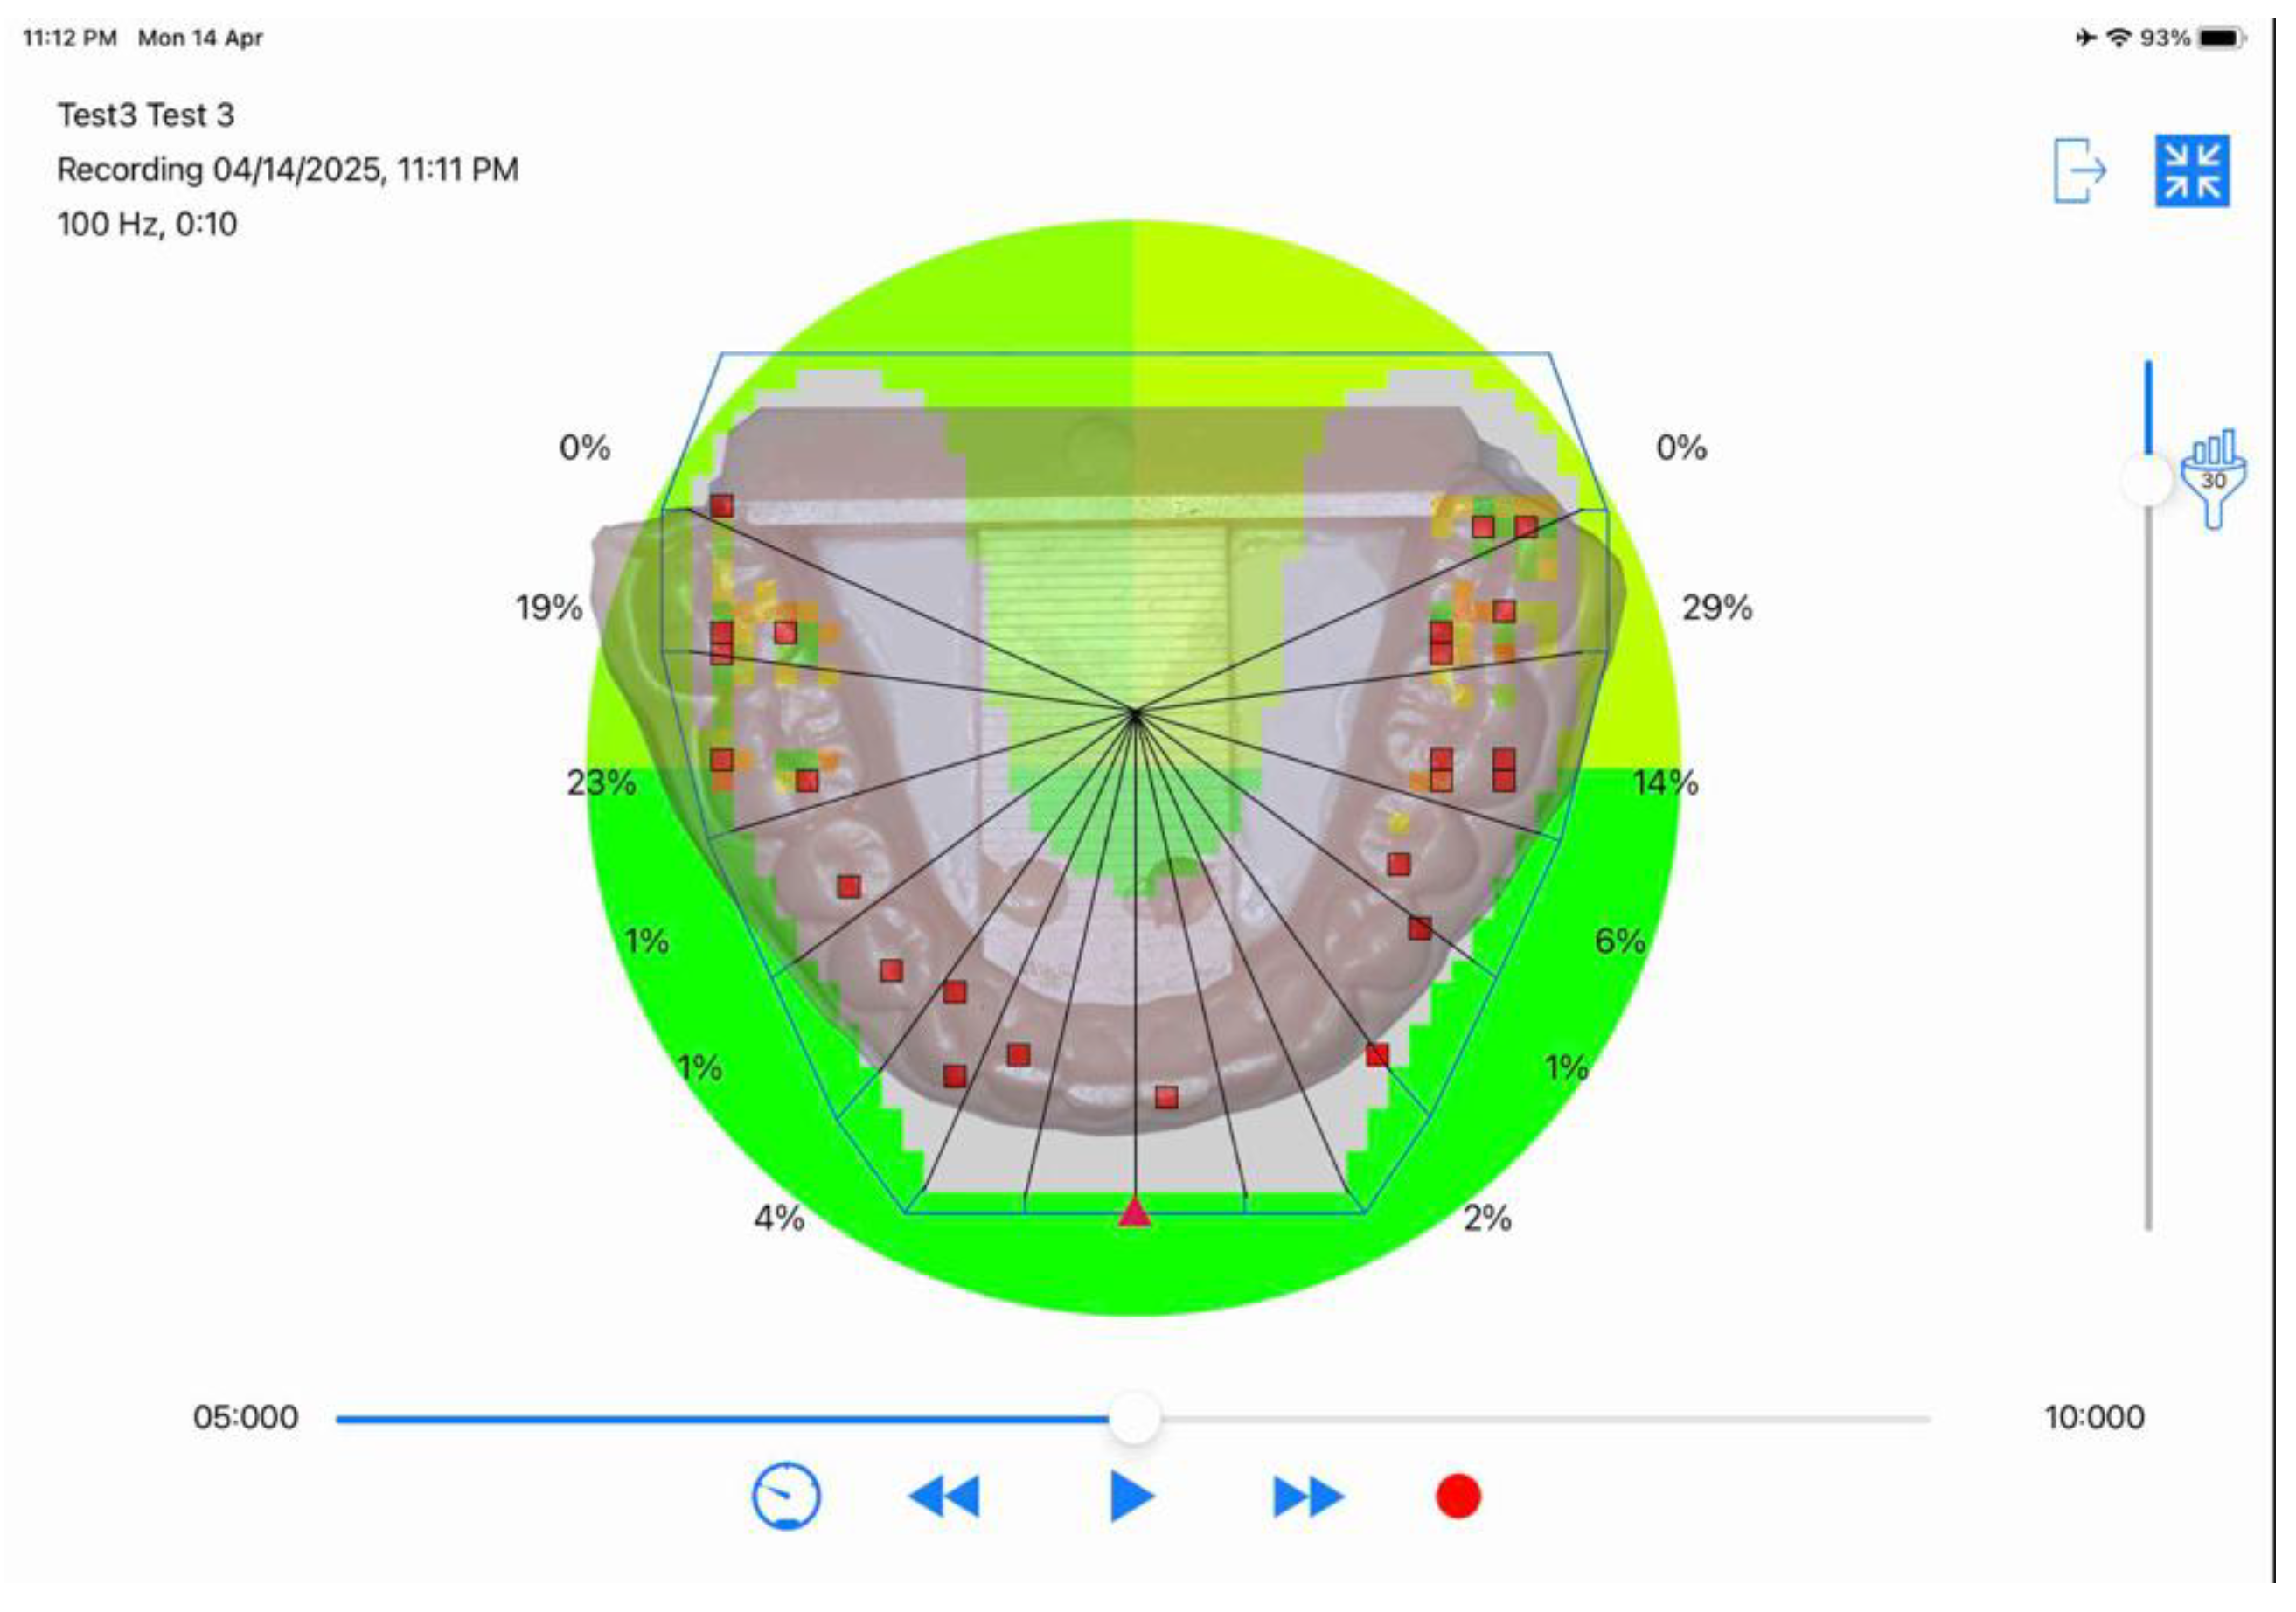
Figure 4.
image of occlusal contact of intraoral scanner.
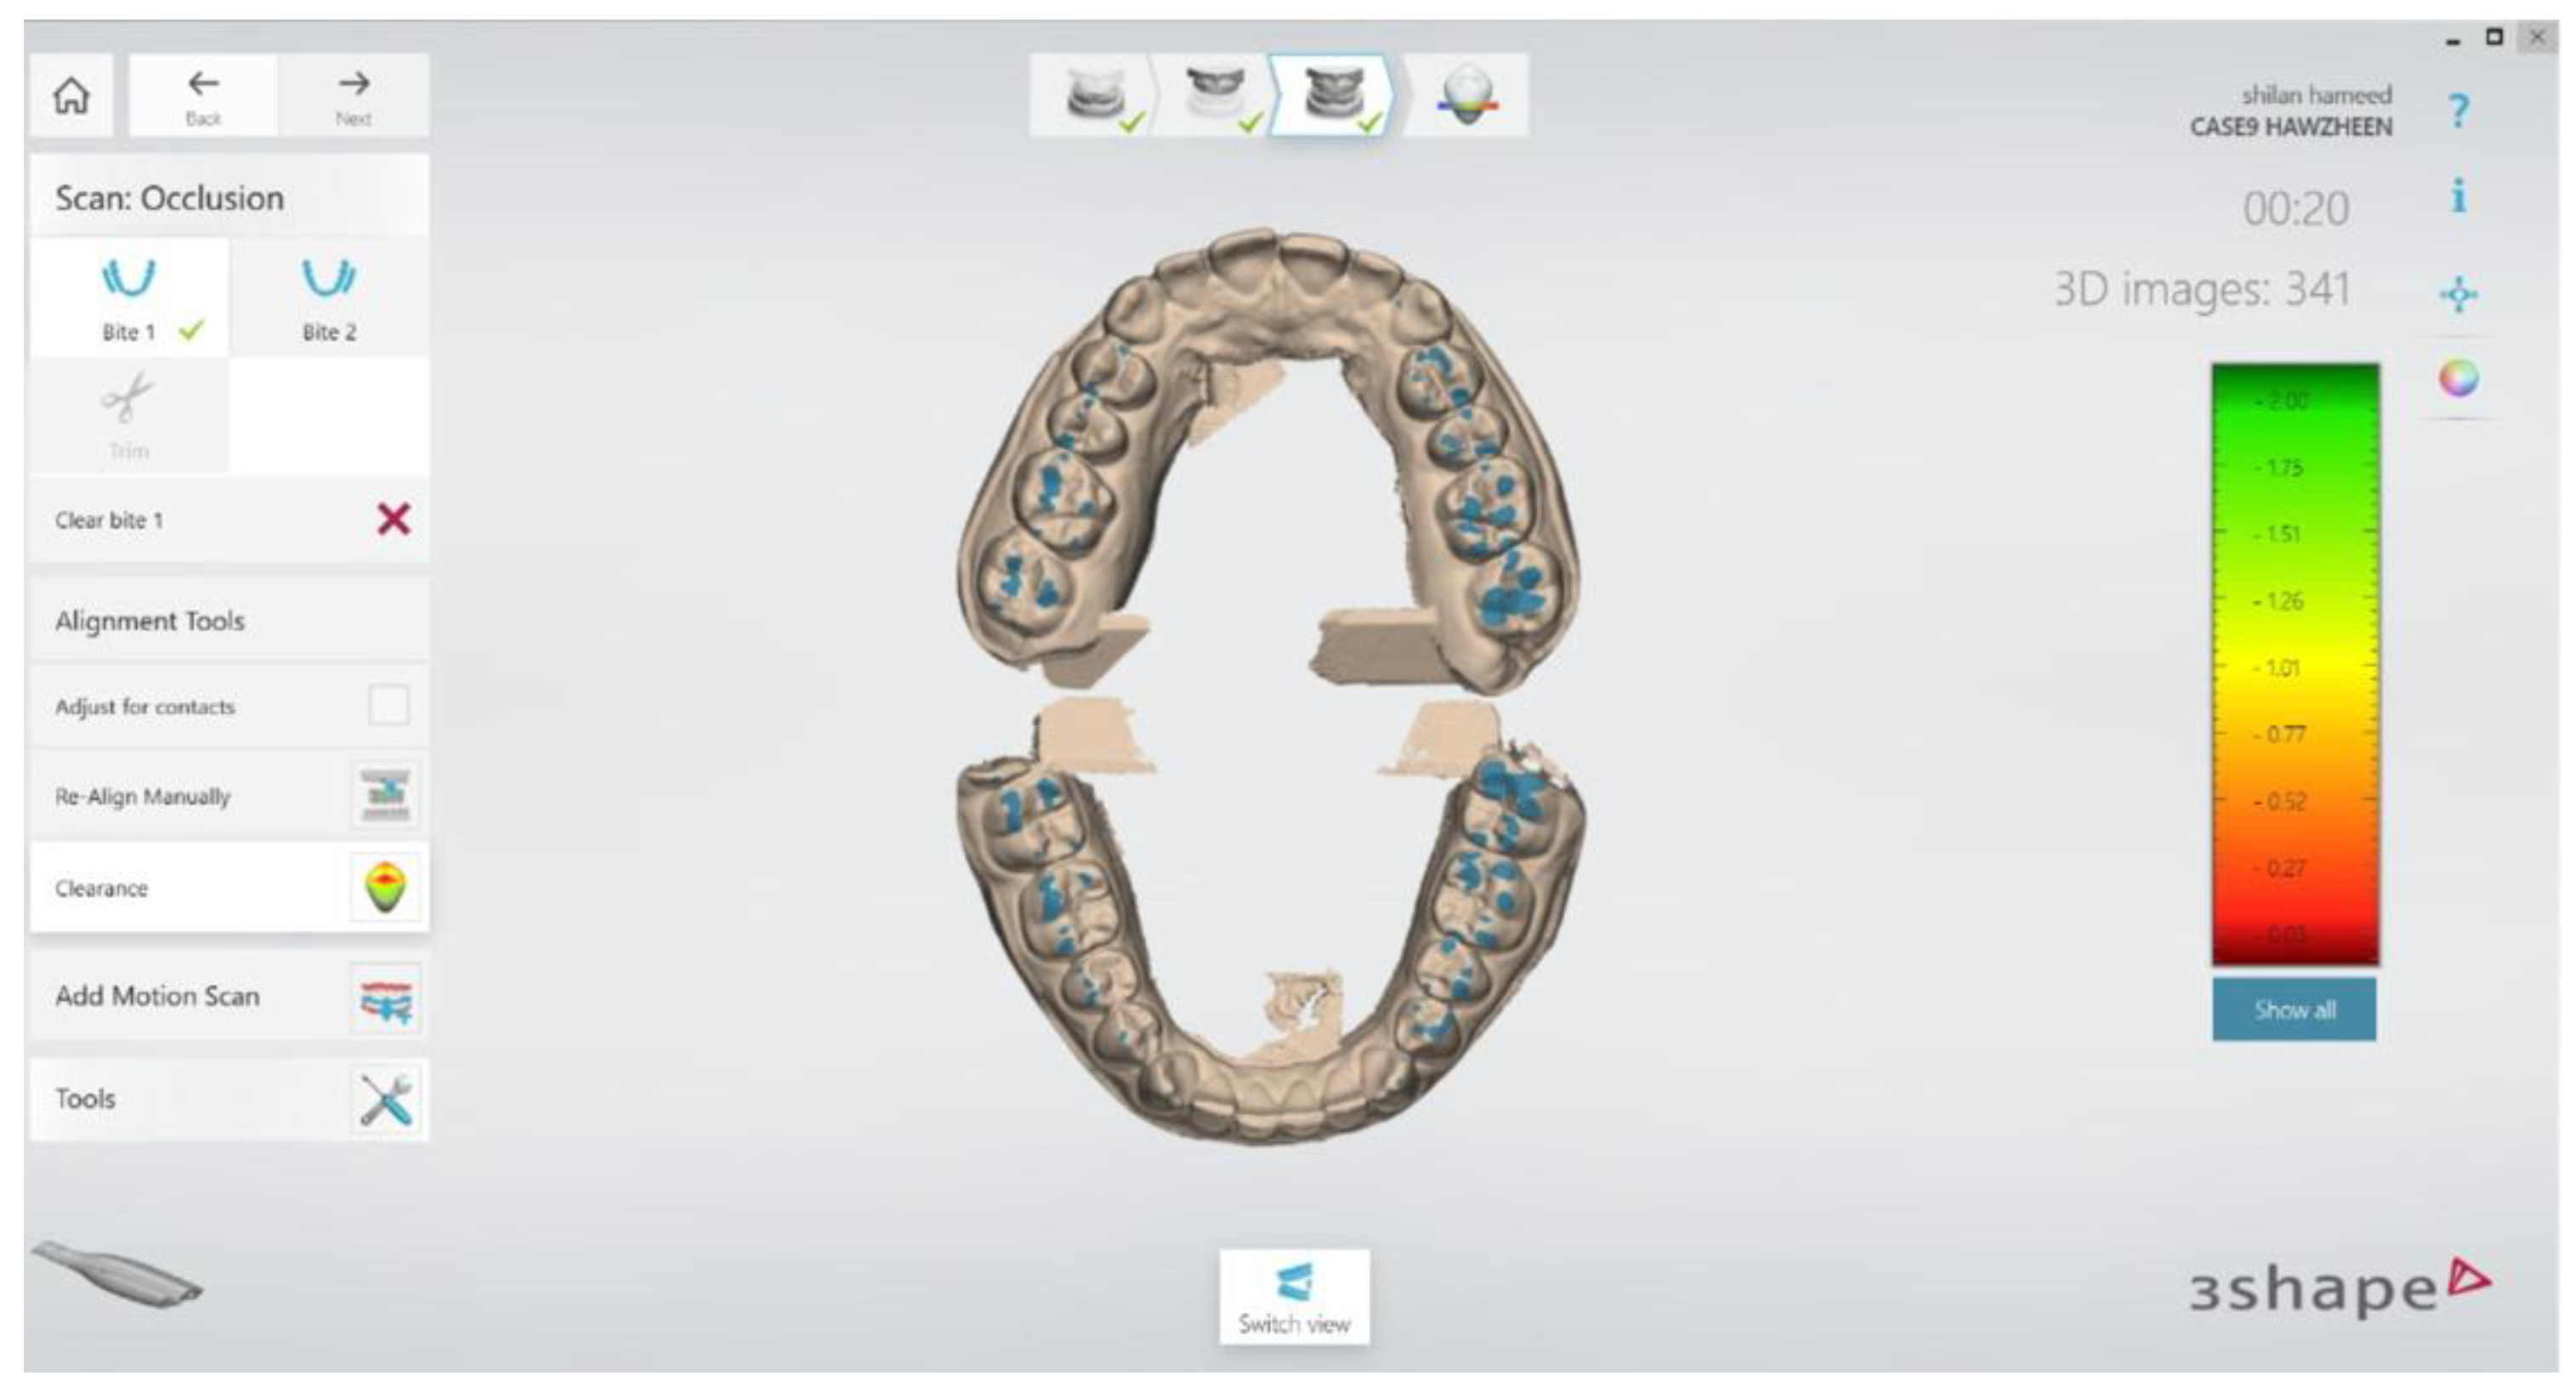
Figure 6.
The Occlusense were superimposed with IOS.
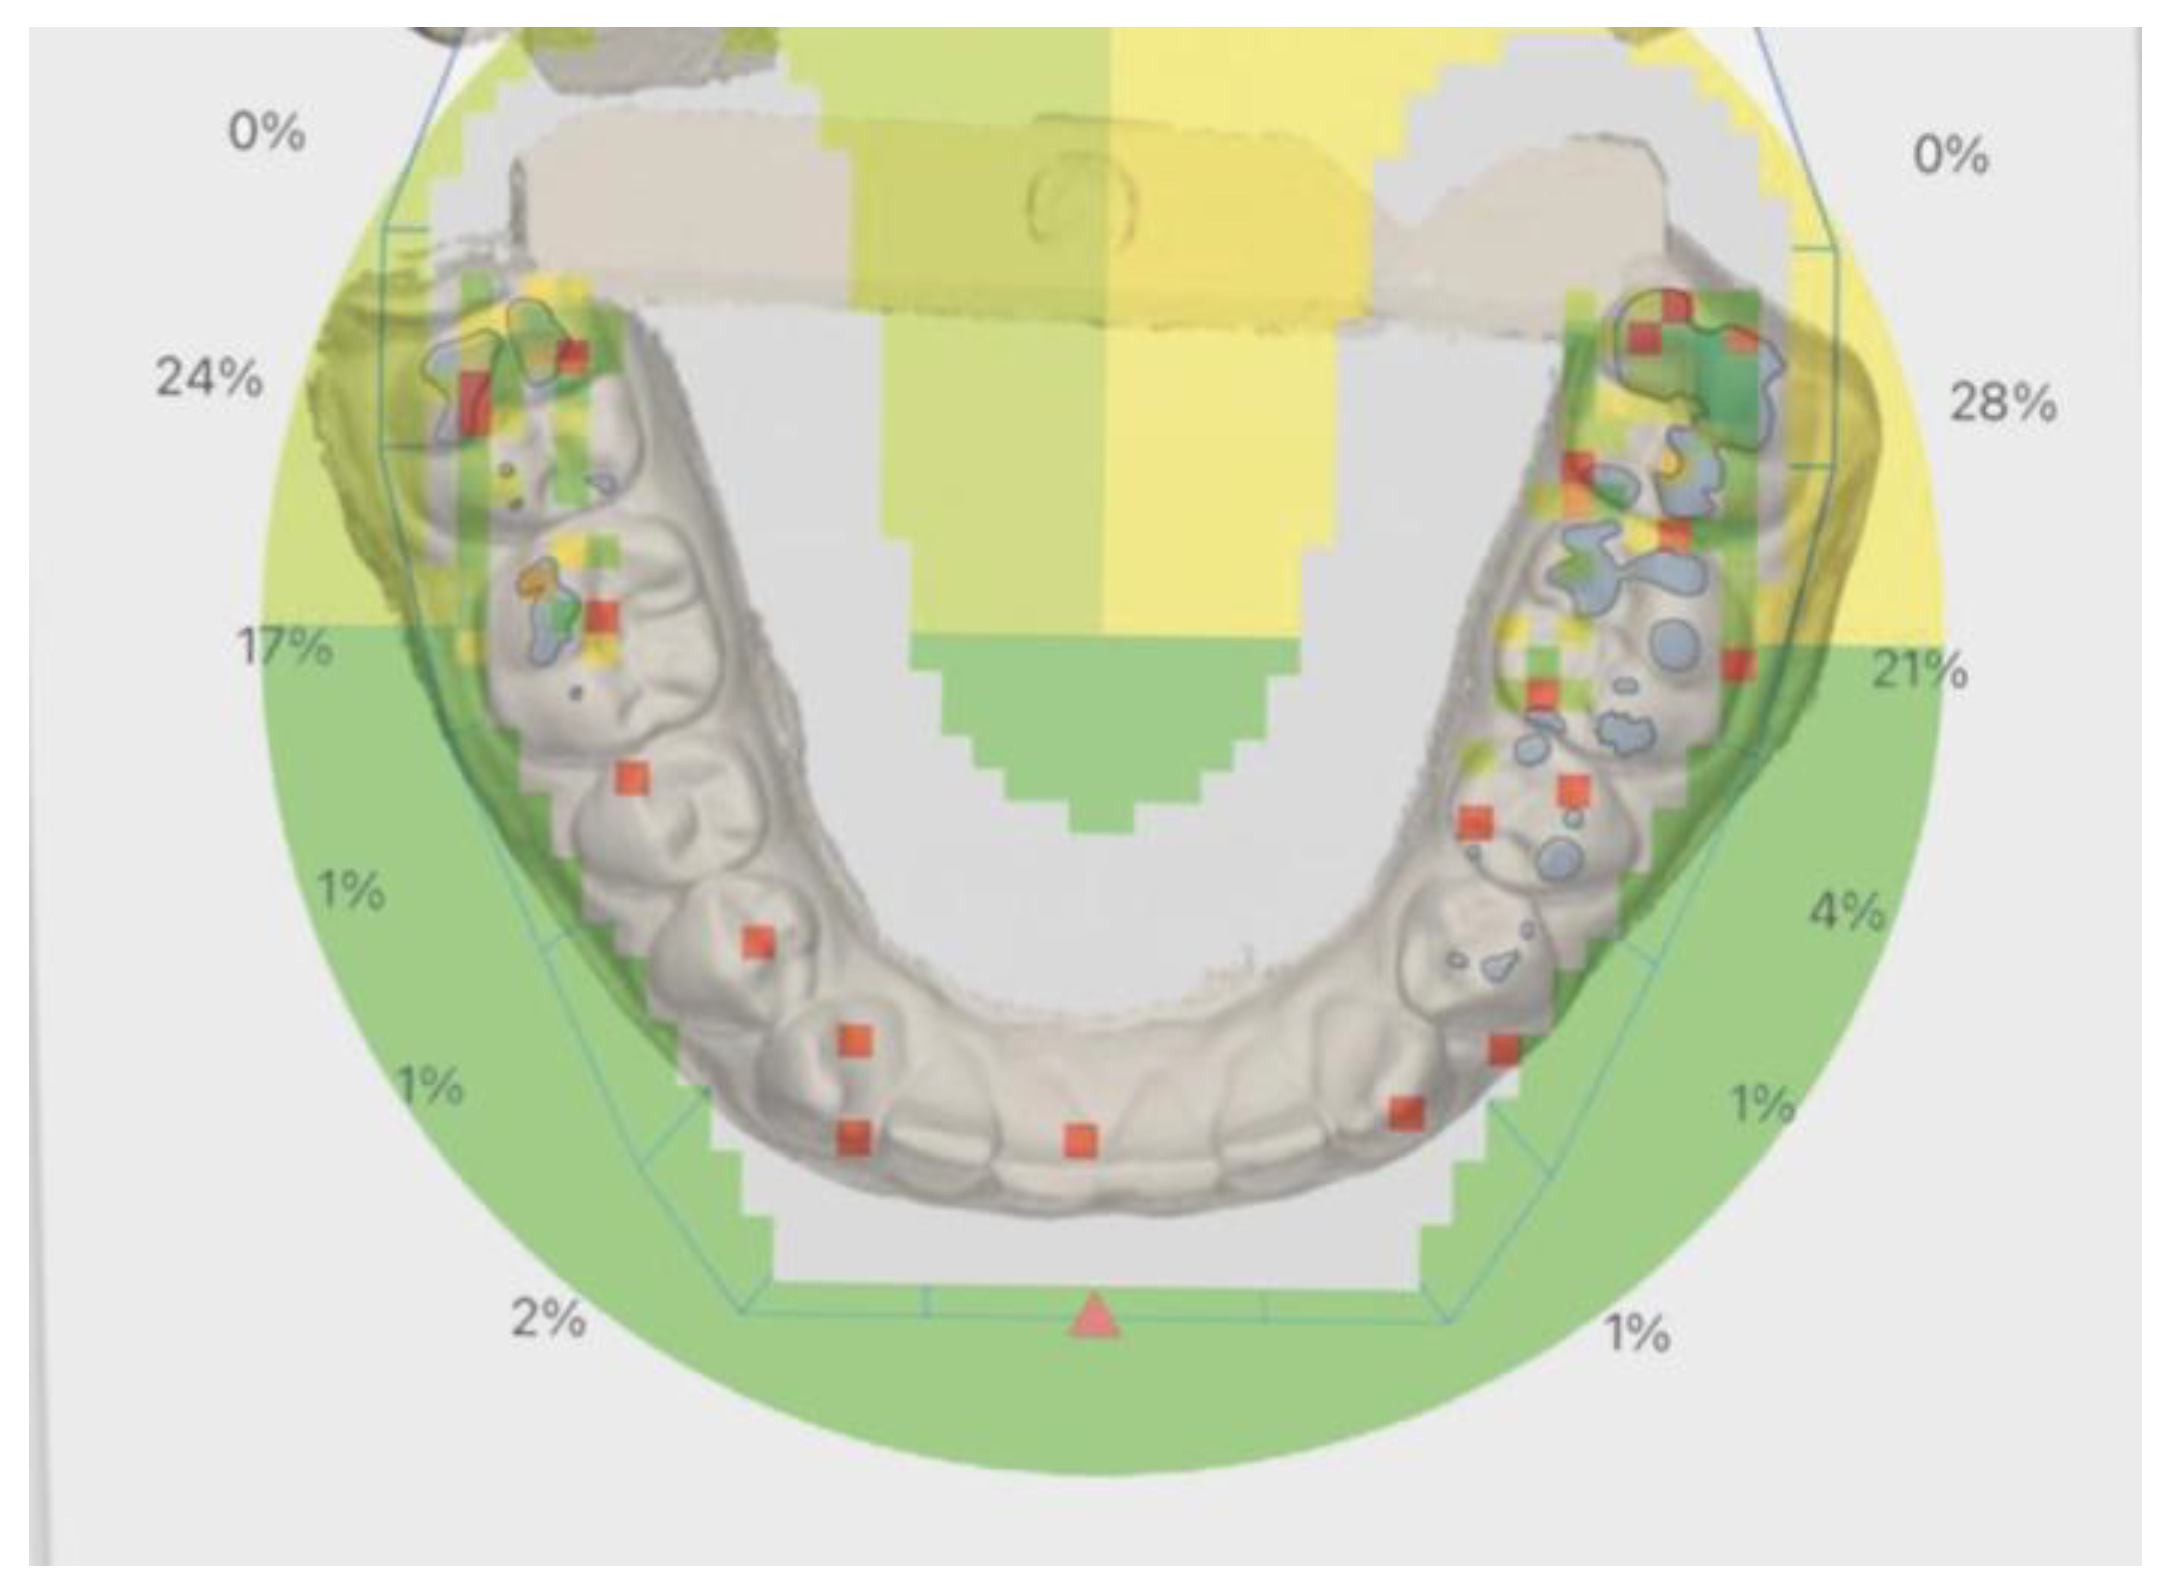

Table 1.
Mean Surface Area and Contact Count Measured by Articulating Paper, Occlusense, and Intra Oral Scanner Across Tooth Pairs (27–37 to 17–47).
Table 1.
Mean Surface Area and Contact Count Measured by Articulating Paper, Occlusense, and Intra Oral Scanner Across Tooth Pairs (27–37 to 17–47).
| Variable | Type of Variable | Articulating Paper | Occlusense | Intra Oral Scanner | ||||
|---|---|---|---|---|---|---|---|---|
| Total Surface Area (mm²)Mean Score | Number of Contact Mean Score | Total Surface Area (mm²)Mean Score | Number of ContactMean Score | Total Surface Area (mm²)Mean Score | Number of ContactMean Score | |||
| Number of teeth | 27-37 | 7.15 | 9.71 | 5.82 | 3.14 | 28.2 | 2.78 | |
| 26-36 | 5.38 | 9.36 | 6.37 | 3.42 | 15.08 | 6.42 | ||
| 25-35 | 1.65 | 4.07 | 3.45 | 1.85 | 5.69 | 2.71 | ||
| 24-34 | 2.66 | 4.60 | 2.92 | 1.57 | 3.34 | 3.57 | ||
| 23-33 | 1.33 | 3.10 | 1.86 | 1 | 0.13 | 0.42 | ||
| 22-32 | 0.70 | 1.64 | 0 | 0.42 | 0.06 | 0.07 | ||
| 21-31 | 0.57 | 1.78 | 0 | 0 | 0.04 | 0 | ||
| 11-41 | 0.89 | 3.00 | 1.32 | 0.71 | 0.01 | 0 | ||
| 12-42 | 0.33 | 1.21 | 1.59 | 1 | 0.045 | 0.21 | ||
| 13-43 | 1.62 | 2.78 | 1.86 | 1 | 0.05 | 0.14 | ||
| 14-44 | 1.66 | 2.06 | 2.92 | 1.57 | 0.33 | 0.71 | ||
| 15-45 | 1.14 | 3.28 | 2.65 | 1.42 | 1.22 | 1.71 | ||
| 16-46 | 3.70 | 7.35 | 5.84 | 3.14 | 7.78 | 3.35 | ||
| 17-47 | 6.17 | 6.99 | 8.5 | 4.57 | 12.1 | 3.42 | ||
Table 2.
Summary of Mean and Maximum Absolute Differences in Surface Area and Contact Counts Between Occlusion Methods.
Table 2.
Summary of Mean and Maximum Absolute Differences in Surface Area and Contact Counts Between Occlusion Methods.
| comparson | Mean Abs Diff (mm²) | Max Diff (mm²) | Tooth (SA) | Mean Abs Diff (Count) | Max Diff (Count) | Tooth (Count) |
|---|---|---|---|---|---|---|
| AP vs OC | 1.10 | 2.33 | 17–47 | 2.58 | 6.57 | 27–37 |
| AP vs IOS | 3.71 | 21.05 | 27–37 | 2.25 | 6.93 | 27–37 |
| OC vs IOS | 3.42 | 22.38 | 27–37 | 0.79 | 3.00 | 26–36 |
Note: This table presents the mean and maximum absolute differences in total surface area (mm²) and contact point counts between each pair of occlusion detection methods: Articulating Paper (AP), Occlusense (OC), and Intraoral Scanner (IOS). It also identifies the specific tooth pair showing the largest difference for each comparison.
Table 3.
Comparison of Total Surface Area and Number of Contact Points Across Occlusion Detection Methods (n = 14 Tooth Pairs).
Table 3.
Comparison of Total Surface Area and Number of Contact Points Across Occlusion Detection Methods (n = 14 Tooth Pairs).
| Occlusion Method | Total Surface AreaMean ± SD (mm²) | Surface AreaMean Rank | Number of Contact PointsMean ± SD | Contact PointsMean Rank | Friedman Test χ² (df = 2) | p-value |
|---|---|---|---|---|---|---|
|
Articulating Paper |
2.50 ± 2.23 | 1.71 | 4.35 ± 2.85 | 3.00 | 1.86 (Surface) |
0.40 |
| Occlusense | 3.22 ± 2.52 | 2.21 | 1.77 ± 1.31 | 1.61 | 21.71 (Contacts) |
<.01 |
|
Intra Oral Scanner |
5.29 ± 8.24 | 2.07 | 1.82 ± 1.94 | 1.39 |
Note: SD = standard deviation; df = degrees of freedom. The Friedman test was used as a non-parametric alternative to repeated measures ANOVA due to violation of the sphericity assumption (Mauchly’s test p < 0.001) and the presence of non-normal distribution. The Intra Oral Scanner showed a particularly wide range in total surface area values (0.01–28.20 mm²), leading to high variability (SD = 8.24), which could distort parametric test results. Statistical significance was set at p < 0.01.
Table 4.
Spearman’s Correlation Matrix Between Total Surface Area and Number of Contact Points Across Occlusion Detection Methods (n = 14 Tooth Pairs).
Table 4.
Spearman’s Correlation Matrix Between Total Surface Area and Number of Contact Points Across Occlusion Detection Methods (n = 14 Tooth Pairs).
| Variables | Spearman | AP-surface | OC-surface | IOS-surface | AP-contact | OC-contact | IOS-contact |
|---|---|---|---|---|---|---|---|
| AP-surface | Correlation Coefficient | 1.00 | 0.92 | 0.90 | 0.89 | 0.91 | 0.83 |
| Sig. (2-tailed) | . | p<.001 | p<.001 | p<.001 | p<.001 | p<.001 | |
| N | 14 | 14 | 14 | 14 | 14 | 14 | |
| OC-surface | Correlation Coefficient | 0.92** | 1.00 | 0.92 | 0.86 | 0.99 | 0.91 |
| Sig. (2-tailed) | p<.001 | . | p<.001 | p<.001 | p<.001 | p<.001 | |
| N | 14 | 14 | 14 | 14 | 14 | 14 | |
| IOS-surface | Correlation Coefficient | 0.90** | 0.92** | 1.00 | 0.88 | 0.93 | 0.91 |
| Sig. (2-tailed) | p<.001 | p<.001 | . | p<.001 | p<.001 | p<.001 | |
| N | 14 | 14 | 14 | 14 | 14 | 14 | |
| AP-contact | Correlation Coefficient | 0.89 | 0.86 | 0.88 | 1.00 | 0.84 | 0.83 |
| Sig. (2-tailed) | p<.001 | p<.001 | p<.001 | . | p<.001 | p<.001 | |
| N | 14 | 14 | 14 | 14 | 14 | 14 | |
| OC-contact | Correlation Coefficient | 0.91 | 0.99 | 0.93 | 0.84 | 1.00 | 0.92 |
| Sig. (2-tailed) | p<.001 | p<.001 | p<.001 | p<.001 | . | p<.001 |
Note: Correlation is significant at the 0.01 level (2-tailed). AP = Articulating Paper; OC = Occlusense; IOS = Intra Oral Scanner.
Disclaimer/Publisher’s Note: The statements, opinions and data contained in all publications are solely those of the individual author(s) and contributor(s) and not of MDPI and/or the editor(s). MDPI and/or the editor(s) disclaim responsibility for any injury to people or property resulting from any ideas, methods, instructions or products referred to in the content. |
© 2025 by the authors. Licensee MDPI, Basel, Switzerland. This article is an open access article distributed under the terms and conditions of the Creative Commons Attribution (CC BY) license (http://creativecommons.org/licenses/by/4.0/).
Copyright: This open access article is published under a Creative Commons CC BY 4.0 license, which permit the free download, distribution, and reuse, provided that the author and preprint are cited in any reuse.


