
Submitted:
01 August 2024
Posted:
02 August 2024
You are already at the latest version
Abstract
Biodiversity monitoring is a seminal key for understanding the delivery of ecosystem functions and services. Mediterranean forests and woodlands harbor the vast majority of regional vascular plant diversity, and hence, they are a good surrogate for detecting changes in biodiversity linked to global change. In this work, we present a database resulting from the study of vascular plant diversity in multi-scale plots of 0.1 ha, measured around the first decade of this century and located in Mediterranean forest environments. Diversity profiles are calculated from Hill numbers (0, 1 and 2) for local (α) and regional (ϒ) diversity, as well as multiplicative calculation of differential diversity (β). Main Mediterranean forests sampled had a medium coverage of 51 % and stand dominant height of 10.6 m being monospecific in two thirds of the cases. Local diversity reaches its highest values (around 78 species per 0.1 ha) in Holm oak dehesas, with values below 50 species for the set of the most productive forest stands dominated by species of the genus Pinus. As regards the contribution to regional diversity, it is the broadleaf formations that contribute the most, with stone pine forests and dehesas in an intermediate position, and pine forests contributing the lowest in species richness terms.
Keywords:
stand richness
; common and abundant species
; hill numbers
; coniferous and broadleaves species
; forest management
1. Introduction
Biodiversity has long been considered integral to the sustainable development agenda [1], establishing its maintenance and/or improvement as a priority objective for reaching a sustainable development “that meets the needs of the present while safeguarding Earth’s life-support system, on which the welfare of current and future generations depends” [2].
The measurement and monitoring of biodiversity at different scales is a seminal task for those involved in rural development [3], conservation planning [4] and evaluation of ecosystems services [5]. Biodiversity is a multidimensional term that involves not only genes, species and ecosystems [6] but also taxonomic, functional and phylogenetic approaches [7]. Biodiversity measurement is not as easy as it might seem, and although attempts to identify all the living beings that inhabit a certain ecosystem are not rare [8], it is more usual to focus on some surrogates or ecosystem properties related. Taxonomic diversity of some well-known biological groups (plants, birds, bats, or butterflies) is one of these surrogates. Reiterative measures of biological diversity using a framework design [9] is necessary for understanding not only local but also regional biodiversity evolution, and the main threats that affect it.
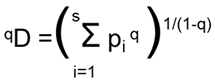
The measurement of biological diversity has been widely discussed in literature and almost endless number of indices and indicators has been proposed [10]. As diversity is a complex multidimensional property at any organization level, viewing diversity through the lens of a single index is to project that multidimensional complexity onto a one-dimensional ordinal scale [11]. In this sense, an Ecology Forum [12] raised again the question of measurement of diversity. Almost all of the authors in this Forum agreed that using Hill’ numbers [13] or species numbers equivalents instead of the classical diversity indices (entropies). Hill’ numbers (qD) has been formulated recently elsewhere [14] and for q= 0, q→1 or q= 2, are equivalent to classical species richness, exponential of Shannon index and inverse of Simpson concentration respectively. When having abundance data, the simultaneous use of these three indices, which take into account species richness, the typical species and the very abundant species in each sample, enables us to build profiles of diversity that allows a comparison more accurate between samples at different sites or samples taken on different dates. A diversity profile is a curve depicting the simultaneous values of a large collection of diversity indices. Thus, the profile portrays the views of diversity from many different vantage points simultaneously.
These diversity profiles can be applied to diversity at different scales from local or stand diversity (α diversity) to regional diversity (ϒ diversity) and to the differential diversity (β diversity), the latter being calculated either by additive or multiplicative methods. They are important tools to analyzed biogeographical regions and monitoring biodiversity in conservation plans [15,16].
Mediterranean Basin has been traditionally described as one of the hot spots for vascular plant species [17]. Mediterranean forest floras are richer that the contiguous template forest floras not only in tree species but also in other forest species, as a result of the last glaciation, ancient and actual human land uses, and natural disturbance incidences [18]. Recently, scenarios of climatic change settle a medium to severe influence on Mediterranean species and ecosystems derived from the increase of temperatures and changes in the precipitation regime including reduction of the total rainfall and elongation of the dry season. The Iberian Peninsula is an important reservoir of European biodiversity [19] and is usually included in the “Mediterranean Region” hotspot of global biodiversity [20]. In this context, we propose in this study an overview and comparison of the diversity of forests in the Mediterranean Spain, using surveys of vascular plants based on multi-scale plots carried out over a period of twelve years (2002-2013), and analyzing the diversity profiles at local and regional scale, taking into account the main dominant tree species on the stands. The data have been compiled from different projects and partly published is several papers [21,22,23,24].
The current work allows us to explore systematically the similarities and differences in diversity measures among forests that grow in different areas of the Mediterranean Spain. In a first step, this extensive dataset can be a valuable tool for long-term monitoring plans to check changes in the diversity of vascular plants, at different scales and in relation to the evolution degree of the forest stands under the influence of global change. To this end, two data matrices were built one with the name, location, and description of the sampled plots, and a second matrix with a species/inventory format where the identified species and their quantification appear in the 143 sampled plots.
In a second step, we aim:
- 1)
- To describe and to compare diversity profiles of vascular plant at the stand level (α diversity) for the main Mediterranean forests in Peninsular Spain
- 2)
- To assess what is the contribution of different typologies of Mediterranean forests to the regional diversity (ϒ diversity).
- 3)
- To infer the levels of intra-dissimilarity in species composition of the different types of forest in Mediterranean Spain (β diversity).
2. Materials and Methods
Data Collection
We have surveyed vascular plant species in a total of 143 multi-scalar plots of 0.1 ha along the Mediterranean climatic zone of Peninsular Spain. The location of these plots is not a random sampling or a stratified one, but it is the result of twelve years (2002- 2013) of a homogeneous sampling strategy carried out by a group of researchers and collaborators, in the context of different research projects. The plots sampled are shown in Figure 1.
Main plot variables recorded were location (X, Y coordinates of upper right corner of each plot), canopy cover and dominant height of the plot, average DBH –diameter at breast height- of trees, number and mean basal area of trees, forest typology, main and secondary (when appears) tree species. Then, the identification of vascular plant species was conducted at the species level following Flora Iberica [25] and Anthos (http://www.anthos.es/). Species of doubtful determination were excluded from the database.
Presence and abundance of vascular plant species in each forest site were recorded in 1000 m2 plots (50 m x 20 m), following Whittaker’s multiscale plot design, modified by Stohlgren [26]. Detailed information of the plot design can be found in previous publications [18]
Plots were mainly located in the core (n=115) of forested areas, at least 100 m away from the nearest forest edge, following the steepest slope in order to record major environmental variability, but also in ecotones or forest edges (n= 28) for detecting species that frequently thrive in these local habitat conditions. Sampling within plots was nested as follows:
- (i)
- Ten subplots of 0.5m × 2m (1m2) arranged equidistantly within the plot with the outer border of each subplot lying on the perimeter of the plot. Within these subplots the abundance of herbaceous and woody plants was estimated according to 5 cover categories: (1) <5 % of the total subplot area, (2) between 5% and 12 %, (3) between 12,1% and 25 %, (4) between 25,1% and 50 % and (5) >50 %.
- (ii)
- Two subplots of 2m × 5m (10 m2) in opposite corners of the plot, with their outer borders lying on the perimeter, within these subplots the abundance of woody species was estimated
- (iii)
- One subplot of 5m × 20m (100 m2) in the middle of the plot, without contact with any of the other subplots, within this subplot all tree individuals were measured (DBH and height) and dominant height and canopy cover were estimated. Finally, the complete plot 1,000 m2 was fully surveyed for species not found in the subplots of 1, 10 and 100 m2, and a minimum abundance rate was assigned to these species.
Fieldwork was carried out in late spring, May and June, which is considered within the optimal phenological state for species identification in a unique visit per plot. Only one annual visit for sampling is a limiting factor for detecting all the species growing throughout the year but not for the comparison between samples taken in the same way.
Data Analysis
Descriptive statistics and basic relationships between forest structural properties (EP) and diversity indexes were calculated on Statistica 6. Figure maps were made using ArcGis 10.8.
As diversity indices, we calculated diversity (qD) as effective number of species (qspE) following Hill [13], q= 0, q→1 and q=2 (see Tuomisto [27] for details).
The parameter q defines the kind of used mean. Increasing the value of q gives more weight to the most abundant species and less weight to the rarest ones. 0D (diversity with q=0) is based on the weighted harmonic of the pi values and its numerical value is the same as that of the species richness (R). 1D is based on the geometric mean and equals the exponential of the Shannon entropy, and 2D is based on the arithmetic mean and equals the inverse of the Simpson concentration.
We calculated qD values for local diversity (α) and regional diversity (ϒ), aggregating different plots of the species/inventories matrix following several criteria:
- -
- Location of the sampled plot (core or ecotone)
- -
- Tree species composition of the canopy (monospecific or mixed canopy)
- -
- Main tree species in the canopy
EstimateS 9.1 software [28] was used for calculations of diversity at different aggregation levels. Species-sampled curve and richness estimators: Abundance-based Coverage Estimator –ACE- [29] and Chao 1 [30] where calculated as well. Finally, we have calculated beta diversity using the multiplicative approach
qDγ = qDα x qDβ
When qDγ or gamma diversity is the total diversity found in the aggregation level of interest, that can be expressed as the mean effective density of species per effective compositional unit (qDα) multiplied by the number of effective compositional units obtained ( qDβ).
3. Results
Data matrices with plot location and species per plots, in CSV format, are available in this repository (CSIC repository).
The sampled forests included from open woodland and dehesas to close canopy forest (averaged coverage 51.5 ± 21.9%) with monospecific (100 plots) or mixed (43 plots) tree species canopy. The stand dominant height was on average 10.6 (± 4.6) m. In relation with the main tree species, in 82 cases the dominant species belonged to genus Pinus, in 51 cases was genus Quercus and the rest ten cases was a species of another genus (Fagus, Castanea, Fraxinus, Juniperus, Arbutus, Eucalyptus, Ilex). Significant negative correlations were found between canopy coverage (Fcc) and dominant height (H0) with α diversity indices (see Table 1) but not between other structural variables and local diversity.
Diversity at Local and Regional Scale
Averaged local richness of species per plot (0Dα) was 57.03 ±21.6. Total number of species (0Dϒ) detected in 143 plots was 1019 (28 were finally rejected because there were not determined at the species level) with an accumulated mean coverage per plot of 105.93 % and standard deviation of 45.7 %. The expected 0Dϒ calculated by ACE has been 1111 and by Chao1 1199 species. The number of species found accounted for over 15 % of the Spanish Vascular Flora and near a 25 % of the Peninsular Spain Vascular Flora [31].
Data of the Hill numbers (D= 0, 1 or 2) for alpha or local diversity at different aggregation levels are shown in Table 2. Along with the expected differences for all indices between core plots and ecotone plots (b level), a significant difference was observed between the plots dominated by Pinus spp and the rest of the species -Quercus spp and other species- (d level). The aggregation between pine species due to their main location in Mediterranean mountain habitats (P. sylvestris, P. nigra and P. uncinata) and more typically Mediterranean habitats (P. halepensis, P. pinea and P. pinaster) did not show significant differences. At the last level of aggregation, the plots dominated by P. pinea were significantly more diverse (pine group), and the dehesas dominated by Q. ilex are in turn more diverse at the aggregation level where the rest of the species have been grouped.
The contribution of the different forest plots aggregated based on the main species showed three groups (Figure 2a) in terms of the regional richness of species (0ϒ). Similar results appeared when the analysis was limited to the grouping with the lowest number of samples applying rarefaction (Figure 2b) (greater gamma diversity), The accumulation curves showed greater gamma diversity for Holm oak forests, Other Quercus spp., and the group called Other species appear (upper zone), compared to those curves with Pinus spp excepting P. pinea (lower zone). Finally, the accumulation curves for the Q. ilex dehesas and the P. pinea formations showed intermediate gamma diversity.
Heterogeneity Inside Groups
The beta diversity profiles (ratio between regional diversity and local average diversity) for the three calculated indices showed that the most heterogeneous groups for every index are those formed by “Other species”, Other Quercus spp followed by P. pinea pine forests (Figure 3). This can be interpreted as that both the species in the pool that constitutes the richness and the common and very abundant species are quite different between some samples and others. It is also remarkable that beta diversity profile of the Holm oak dehesas, being the lowest in species richness (0Dβ), it exceeded the values of common species and very abundant species in pine forests. Finally, P.sylvestris forests presented the most homogeneous, with a small number of typical species and very abundant in relation to the rest of the forests studied.
4. Discussion
We analyzed the local and regional vascular plant diversity for different forests and woodlands in Peninsular Mediterranean Spain surveying 143 0.1 ha multiscale plots throughout the first decade of the 21st century. In general, stands dominated by pine species presented lower diversity for their “Hill numbers” (richness, common species and very abundant species), both at a local and regional scale, than those dominated by Quercus spp, or other tree species. We also confirmed that two stand variables were negatively related with diversity scores, namely canopy cover and the dominant height of the main tree species.
Mediterranean environments are characterized by a low potential forest productivity [32], caused mainly by a short vegetative period (due to winter cold and summer drought). In these circumstances, forests and woodlands have more frequently delivered protective functions rather than productive, relegating wood production to a secondary place in many cases and promoting other non-wood products such as acorns and pastures in the dehesas [33], pine seeds in the P. pinea open forest [34] or resin in P.pinaster forests [20]). These environmental and management restrictions have promoted monospecific canopies with structural diversity directly related to their use or alternatively its abandonment degree [35].
Diversity at Local and Regional Scale
Although local diversity values for this type of sampling have certain limitations for comparison (e.g., a single sampling or several resampling along a year in the same plot), some references can be useful to locate the relative value of our measurements. For Mediterranean environments, the highest values of local richness that we found in literature occurred in pastures and dehesa systems. Díaz [36] cited values of 179 species per 0.1 ha in the Monte Gilboa (Israel) [37] or 135 in Sierra Morena (Spain) [38]. Other authors [39] measured richness in other Mediterranean habitats of the Aljibe Mountains (Spain) obtaining values between 50 species per 0.1 ha (Quercus coccifera Shrublands) and 95 (Quercus suber woodland). They also collected data in other Mediterranean environments throughout the globe, with average values close to 40 species per 0.1 ha in California and France and slightly above 80 in Israel [40] and Spain. Obviously, these values were highly dependent on the studied habitats, their location in the territory and the number of plots analyzed. That is why our research provides valuable data for different habitats with a significant number of surveys.
We observed significant differences between core and ecotones both for species richness and for common and abundant species. This fact was already highlighted in a previous publication [18] where the species density, percentage of unique species, and alpha diversity per plot were significantly higher (p < 0.05) in linear elements (ecotones) than in core habitats. Other authors in different environments [41,42] documented high diversity in ecotones, although other investigations [43,44] did not detect significant differences at the local level (core-ecotone-core transects).
Referring to dominant species of the canopy, there is a clear tendency towards monospecific stands (almost two out of three). Either this may occur due to the non-natural origin of some stands, i.e., plantations that were thoroughly conducted from the middle of the previous century [45], or due to the management legacy where single species stands have been traditionally prioritized [46]. In any case, we found no significant differences in diversity indices between sites dominated by single or multiple species at local scale, nor at regional one. There was only a slight difference in species richness, in favours of mixed stands (local 59.3 versus 55.8 and regional 674.4 versus 648.8 for rarefied data), but lacking statistically significance.
We found the greatest difference between pine forests and the rest of the formations (dominated by Quercus spp or by other species), when diversity based on the dominant type of tree species was considered. Pine stands had significant lower values for richness and common species. This fact is well known for forests in temperate and boreal climates [47], but in Mediterranean landscapes, other factors may be involved, like the interval from last disturbance and the phase within the forest succession [48,49]. For these authors, the existence and abundance of plants considered non-strictly forest-related are the differential fact of every forest with higher richness figures. Therefore, they considered that a structural state closer to maturity leads to a lower total number of species, which are mainly considered forest specialists. Regardless of the management circumstances, the sampled pine forests host fewer non-forest species due to their great dominant height and extensive canopy cover than forest dominated by other species (with the exception of Fagus sylvatica stands).
Our sampling of vascular plant forest diversity has highlighted the extensive presence of pine forests in Mediterranean environments in Peninsular Spain. Although the contribution of pine forests to local and regional diversity is lower than that found in other forest species, many of these pine forests are located at the so-called forest limits, either due to high altitude in the Mediterranean mountains or in degraded/unfavorable areas, in which other species might hardly thrive. In these cases, the forest canopy provides local conditions that in turn favor the development of other woody and herbaceous species, leading to a secondary succession that prevents land degradation and extreme conditions that are occurring more frequently due to global change. With respect to the other forest species, those of the Quercus genus are the most widely dominant. These species are found in an extensive environmental range, where altitude and summer rainfall determine their dominance and development, as well as ancient and recent management. Their remarkable contribution to local and regional vascular plant diversity is essential for maintaining sustainable Mediterranean landscapes. In this order, the abandonment of traditional uses can provoke a state of threat in relation to fires, changes in land use or extreme meteorological events, which would lead to a significant loss of diversity, with the replacement of forest structures by scrubland and other stages of vegetation degradation.
Author Contributions
Conceptualization, JMGB; methodology, JMGB, MOQ; data acquisition JMGB, DSR, FA, RB, RAP SG-A,FB, SR, MOQ; formal analysis, JMGB, DSR, FA; writing—original draft preparation, JMGB; writing—review and editing, JMGB, RB,RAP, MOQ; funding acquisition, JMGB,SR. All authors have read and agreed to the published version of the manuscript.
Funding
This research was partly funded by the following Spanish investigation projects: SC00-042. Evaluación Territorial de la Sostenibilidad Agroambiental en la Planificación Rural: Estudios Piloto de Sistemas Agrosilvopastorales Españoles, CPE03-001. Bases para la gestión sostenible de las masas de Pinus pinea L. En la Península Ibérica: modelos ecológico-selvícolas, diversidad genética y valoración económica y social de las producciones, GR/AMB/0458/2004. Indicadores de sostenibilidad basados en la biodiversidad, la estructura del paisaje, y el riesgo de incendios: Estudio piloto en el término municipal de Cadalso de los Vidrios (Madrid); AGL2005-06648-C02-01 “Bases ecológicas a escala paisaje para la elaboración de los PORFs: Estudio piloto en dos comarcas forestales representativas de España (ECOPORF)”; AGL2005-06648-C02-02. La planificación del paisaje en los Planes de Ordenación de Recursos Forestales (PORFs) con el mantenimiento o mejora de la biodiversidad como objetivo. BIOFORLAN, SUM2006-00034-C02. El sistema agroforestal dehesa como sumidero de carbono: hacia un modelo conjunto de la vegetación y el suelo, SOE2/P2/E261. Multifuncionalidad, conservación y empleo rural en el territorio del sur de Europa a través de la extracción de resina.
Data Availability Statement
Two main data matrices will be available at CSIC repository https://www.csic.......
Acknowledgments
We would like to express our gratitude to our now retired colleagues Ramón Elena-Rosselló and Jesús de Miguel, as well as to those from the Botany Chair of the EUITF, Juan I. García Viñas, Cesar López Leiva and Aitor Gastón for their help in the identification of the species.
Conflicts of Interest
“The authors declare no conflicts of interest.”
References
- Naeem, S.; Chazdon, R.; Duffy, J.E.; Prager, C.; Worm, B. Biodiversity and human well-being: an essential link for sustainable development. Proc. R. Soc. B: Biol. Sci. 2016, 283, 20162091. [Google Scholar] [CrossRef] [PubMed]
- Griggs, D.; Smith, M.S.; Rockström, J.; Öhman, M.C.; Gaffney, O.; Glaser, G.; Kanie, N.; Noble, I.; Steffen, W.; Shyamsundar, P. An integrated framework for sustainable development goals. Ecol. Soc. 2014, 19. [Google Scholar] [CrossRef]
- Herzon, I.; Birge, T.; Allen, B.; Povellato, A.; Vanni, F.; Hart, K.; Radley, G.; Tucker, G.; Keenleyside, C.; Oppermann, R.; et al. Time to look for evidence: Results-based approach to biodiversity conservation on farmland in Europe. Land Use Policy 2018, 71, 347–354. [Google Scholar] [CrossRef]
- Rodrigues, A.S.; Brooks, T.M. Shortcuts for Biodiversity Conservation Planning: The Effectiveness of Surrogates. Annu. Rev. Ecol. Evol. Syst. 2007, 38, 713–737. [Google Scholar] [CrossRef]
- Mace, G.M.; Norris, K.; Fitter, A.H. Biodiversity and ecosystem services: a multilayered relationship. Trends Ecol. Evol. 2011, 27, 19–26. [Google Scholar] [CrossRef] [PubMed]
- Noss, R.F. Indicators for Monitoring Biodiversity: A Hierarchical Approach. Conserv. Biol. 1990, 4, 355–364. [Google Scholar] [CrossRef]
- D’Amen, M. , Mod, H. K., Gotelli, N. J., & Guisan, A. (2018). Disentangling biotic interactions, environmental filters, and dispersal limitation as drivers of species co-occurrence. Ecography, 41(8), 1233-1244.
- Peters, M.K.; Hemp, A.; Appelhans, T.; Behler, C.; Classen, A.; Detsch, F.; Ensslin, A.; Ferger, S.W.; Frederiksen, S.B.; Gebert, F.; et al. Predictors of elevational biodiversity gradients change from single taxa to the multi-taxa community level. Nat. Commun. 2016, 7, 13736. [Google Scholar] [CrossRef]
- Suárez-Castro, A. F., Raymundo, M., Bimler, M., & Mayfield, M. M. Using multi-scale spatially explicit frameworks to understand the relationship between functional diversity and species richness. Ecography 2022, e05844. [Google Scholar]
- Magurran, A. E. , & McGill, B. J. (2011). Biological diversity. Frontiers in measurement and assessment.
- Gattone, S. A., & Battista, T. D. A functional approach to diversity profiles. Journal of the Royal Statistical Society Series C: Applied Statistics 2009, 58, 267–284. [Google Scholar] [CrossRef]
- Ellison, A.M. Partitioning diversity1. Ecology 2010, 91, 1962–1963. [Google Scholar] [CrossRef]
- Hill, M.O. Diversity and Evenness: A Unifying Notation and Its Consequences. Ecology 1973, 54, 427–432. [Google Scholar] [CrossRef]
- Chao A, Chiu C-H, Hsieh TC. Proposing a resolution to debates on diversity partitioning. Ecology 2012, 93, 2037–2051. [Google Scholar] [CrossRef] [PubMed]
- Jongman, R.H.G.; Bunce, R.G.H.; Metzger, M.J.; Mücher, C.A.; Howard, D.C.; Mateus, V.L. Objectives and Applications of a Statistical Environmental Stratification of Europe. Landsc. Ecol. 2006, 21, 409–419. [Google Scholar] [CrossRef]
- Chiarucci, A.; Nascimbene, J.; Campetella, G.; Chelli, S.; Dainese, M.; Giorgini, D.; Landi, S.; Lelli, C.; Canullo, R. Exploring patterns of beta-diversity to test the consistency of biogeographical boundaries: A case study across forest plant communities of Italy. Ecol. Evol. 2019, 9, 11716–11723. [Google Scholar] [CrossRef] [PubMed]
- Médail F, Quézel P. Hot-spots analysis for conservation of plant biodiversity in the Mediterranean basin. Ann. Missouri Bot. Gard. 1997, 84, 112–127. [Google Scholar] [CrossRef]
- Svenning JC, Skov F. The relative roles of environment and history as controls of tree species composition and richness in Europe. J. of Biogeography. 2005, 1019–1033. [Google Scholar]
- Morillo, C.; Gómez-Campo, C. Conservation in Spain, 1980–2000. Biol. Conserv. 2000, 95, 165–174. [Google Scholar] [CrossRef]
- Myers, N.; Mittermeier, R.A.; Mittermeier, C.G.; da Fonseca, G.A.B.; Kent, J. Biodiversity hotspots for conservation priorities. Nature 2000, 403, 853–858. [Google Scholar] [CrossRef] [PubMed]
- Ortega, M.; Elena-Rosellió, R.; del Barrio, J.M.G. Estimation of Plant Diversity at Landscape Level: A Methodological Approach Applied to Three Spanish Rural Areas. Environ. Monit. Assess. 2004, 95, 97–116. [Google Scholar] [CrossRef]
- Del Barrio, J.M.G.; Ortega, M.; De La Cueva, A.V.; Elena-Rosselló, R. The Influence of Linear Elements on Plant Species Diversity of Mediterranean Rural Landscapes: Assessment of Different Indices and Statistical Approaches. Environ. Monit. Assess. 2006, 119, 137–159. [Google Scholar] [CrossRef]
- García Del Barrio, J. M., Alonso Ponce, R., Benavides, R, Roig Gómez, S. Species richness and similarity of vascular plants in the Spanish dehesas at two spatial scales. Forest Systems 2014, 23, 111–119. [Google Scholar] [CrossRef]
- Soliño, M.; Yu, T.; Alía, R.; Auñón, F.; Bravo-Oviedo, A.; Chambel, M.R.; de Miguel, J.; del Río, M.; Justes, A.; Martínez-Jauregui, M.; et al. Resin-tapped pine forests in Spain: Ecological diversity and economic valuation. Sci. Total. Environ. 2018, 625, 1146–1155. [Google Scholar] [CrossRef] [PubMed]
- Castroviejo, S. (2020). Flora ibérica: plantas vasculares de la Península Ibérica e Islas Baleares.
- Stohlgren TJ, Falkner MB, Schell LD. A modified-Whittaker nested vegetation sampling method. Vegetatio 1995, 117, 113–121. [Google Scholar] [CrossRef]
- Tuomisto, H. An updated consumer’s guide to evenness and related indices. Oikos 2012, 121, 1203–1218. [Google Scholar] [CrossRef]
- Colwell, R.K.; Elsensohn, J.E. EstimateS turns 20: statistical estimation of species richness and shared species from samples, with non-parametric extrapolation. Ecography 2014, 37, 609–613. [Google Scholar] [CrossRef]
- Chazdon, R. L. , Colwell, R. K., Denslow, J. S., & Guariguata, M. R. (1998). Statistical methods for estimating species richness of woody regeneration in primary and secondary rain forests of northeastern Costa Rica.
- Chao A (1984) Nonparametric estimation of the number of classes in a population. Scand. J. Statist 11, 265-270.
- Aedo, C. , Buira, A., Medina, L., & Fernández-Albert, M. (2017). The Iberian vascular flora: richness, endemicity and distribution patterns. The Vegetation of the Iberian Peninsula: Volume 1, 101-130.
- Sánchez Palomares, O. , & Sánchez Serrano, F. (2000). Mapa de la Productividad Potencial Forestal de España. Cartografía digita, Dirección General de Conservación de la Naturaleza, MMA, Madrid.
- Linares, A.M. Forest planning and traditional knowledge in collective woodlands of Spain: The dehesa system. For. Ecol. Manag. 2007, 249, 71–79. [Google Scholar] [CrossRef]
- Calama, R.; Montero, G. Cone and seed production from stone pine (Pinus pinea L.) stands in Central Range (Spain). Eur. J. For. Res. 2005, 126, 23–35. [Google Scholar] [CrossRef]
- Quintas-Soriano, C.; Buerkert, A.; Plieninger, T. Effects of land abandonment on nature contributions to people and good quality of life components in the Mediterranean region: A review. Land Use Policy 2022, 116. [Google Scholar] [CrossRef]
- Díaz, M (2009). Biodiversity in de dehesa. In Mosquera-Losada, MR, Fernández-Lorenzo JL, Rigueiro-Rodriguez,A (editors). Agroforestry Systems as a Technique for Sustainable Territorial Management. AECID.
- Naveh Z and Whittaker, R. H (1979). Measurements and relationships of plant species diversity in Mediterranean shrublands and woodlands. In Grassle, J. F., Patil, G. P., Smith, W., & Taillie, C. Ecological diversity in theory and practice (Vol. 6). Fairland, MD: International Co-operative Publishing House.
- Marañón, T. (1985). Diversidad florística y heterogeneidad ambiental en una dehesa de Sierra Morena. Anales de Edafología y Agrobiología 44(7-8): 1183-1197.
- Ojeda, F.; Marañón, T.; Arroyo, J. Plant diversity patterns in the Aljibe Mountains (S. Spain): a comprehensive account. Biodivers. Conserv. 2000, 9, 1323–1343. [Google Scholar] [CrossRef]
- Westman WE (1988) Species richness. In: Specht RL (ed) Mediterranean-Type Ecosystems. A Data Source Book, pp 81–91. Kluwer Academic Publishers, Dordrecht, The Netherlands.
- Sharma, L.N.; Vetaas, O.R.; Chaudhary, R.P.; Måren, I.E. Ecological consequences of land use change: Forest structure and regeneration across the forest-grassland ecotone in mountain pastures in Nepal. J. Mt. Sci. 2014, 11, 838–849. [Google Scholar] [CrossRef]
- Vinter, T.; Dinnétz, P.; Danzer, U.; Lehtilä, K. The relationship between landscape configuration and plant species richness in forests is dependent on habitat preferences of species. Eur. J. For. Res. 2016, 135, 1071–1082. [Google Scholar] [CrossRef]
- Shrestha, K.B.; Vetaas, O.R. The Forest Ecotone Effect on Species Richness in an Arid Trans-Himalayan Landscape of Nepal. Folia Geobot. 2009, 44, 247–262. [Google Scholar] [CrossRef]
- Senft, A. R. (2009). Species diversity patterns at ecotones (Master’s thesis, The University of North Carolina at Chapel Hill).
- López Estébanez, N. , Gomez Mediavilla, G., Madrazo García de Lomana, G., Allende Álvarez, F., & Sáez Pombo, E. (2013). The evolution of Forest landscapes in Spain’s Central Mountain range: Different forests for different traditional uses. Cultural Severance and the Environment: The Ending of Traditional and Customary Practice on Commons and Landscapes Managed in Common, 161-175.
- Vadell, E.; Pemán, J.; Verkerk, P.J.; Erdozain, M.; De-Miguel, S. Forest management practices in Spain: Understanding past trends to better face future challenges. For. Ecol. Manag. 2022, 524. [Google Scholar] [CrossRef]
- Barbier, S.; Gosselin, F.; Balandier, P. Influence of tree species on understory vegetation diversity and mechanisms involved—A critical review for temperate and boreal forests. For. Ecol. Manag. 2007, 254, 1–15. [Google Scholar] [CrossRef]
- Amici, V.; Santi, E.; Filibeck, G.; Diekmann, M.; Geri, F.; Landi, S.; Scoppola, A.; Chiarucci, A. Influence of secondary forest succession on plant diversity patterns in a Mediterranean landscape. J. Biogeogr. 2013, 40, 2335–2347. [Google Scholar] [CrossRef]
- Kouba, Y.; Martínez-García, F.; de Frutos, .; Alados, C.L. Effects of Previous Land-Use on Plant Species Composition and Diversity in Mediterranean Forests. PLOS ONE 2015, 10, e0139031. [Google Scholar] [CrossRef]
Figure 1.
Location of 143 forests stands sampled during the 2002-2013 period.
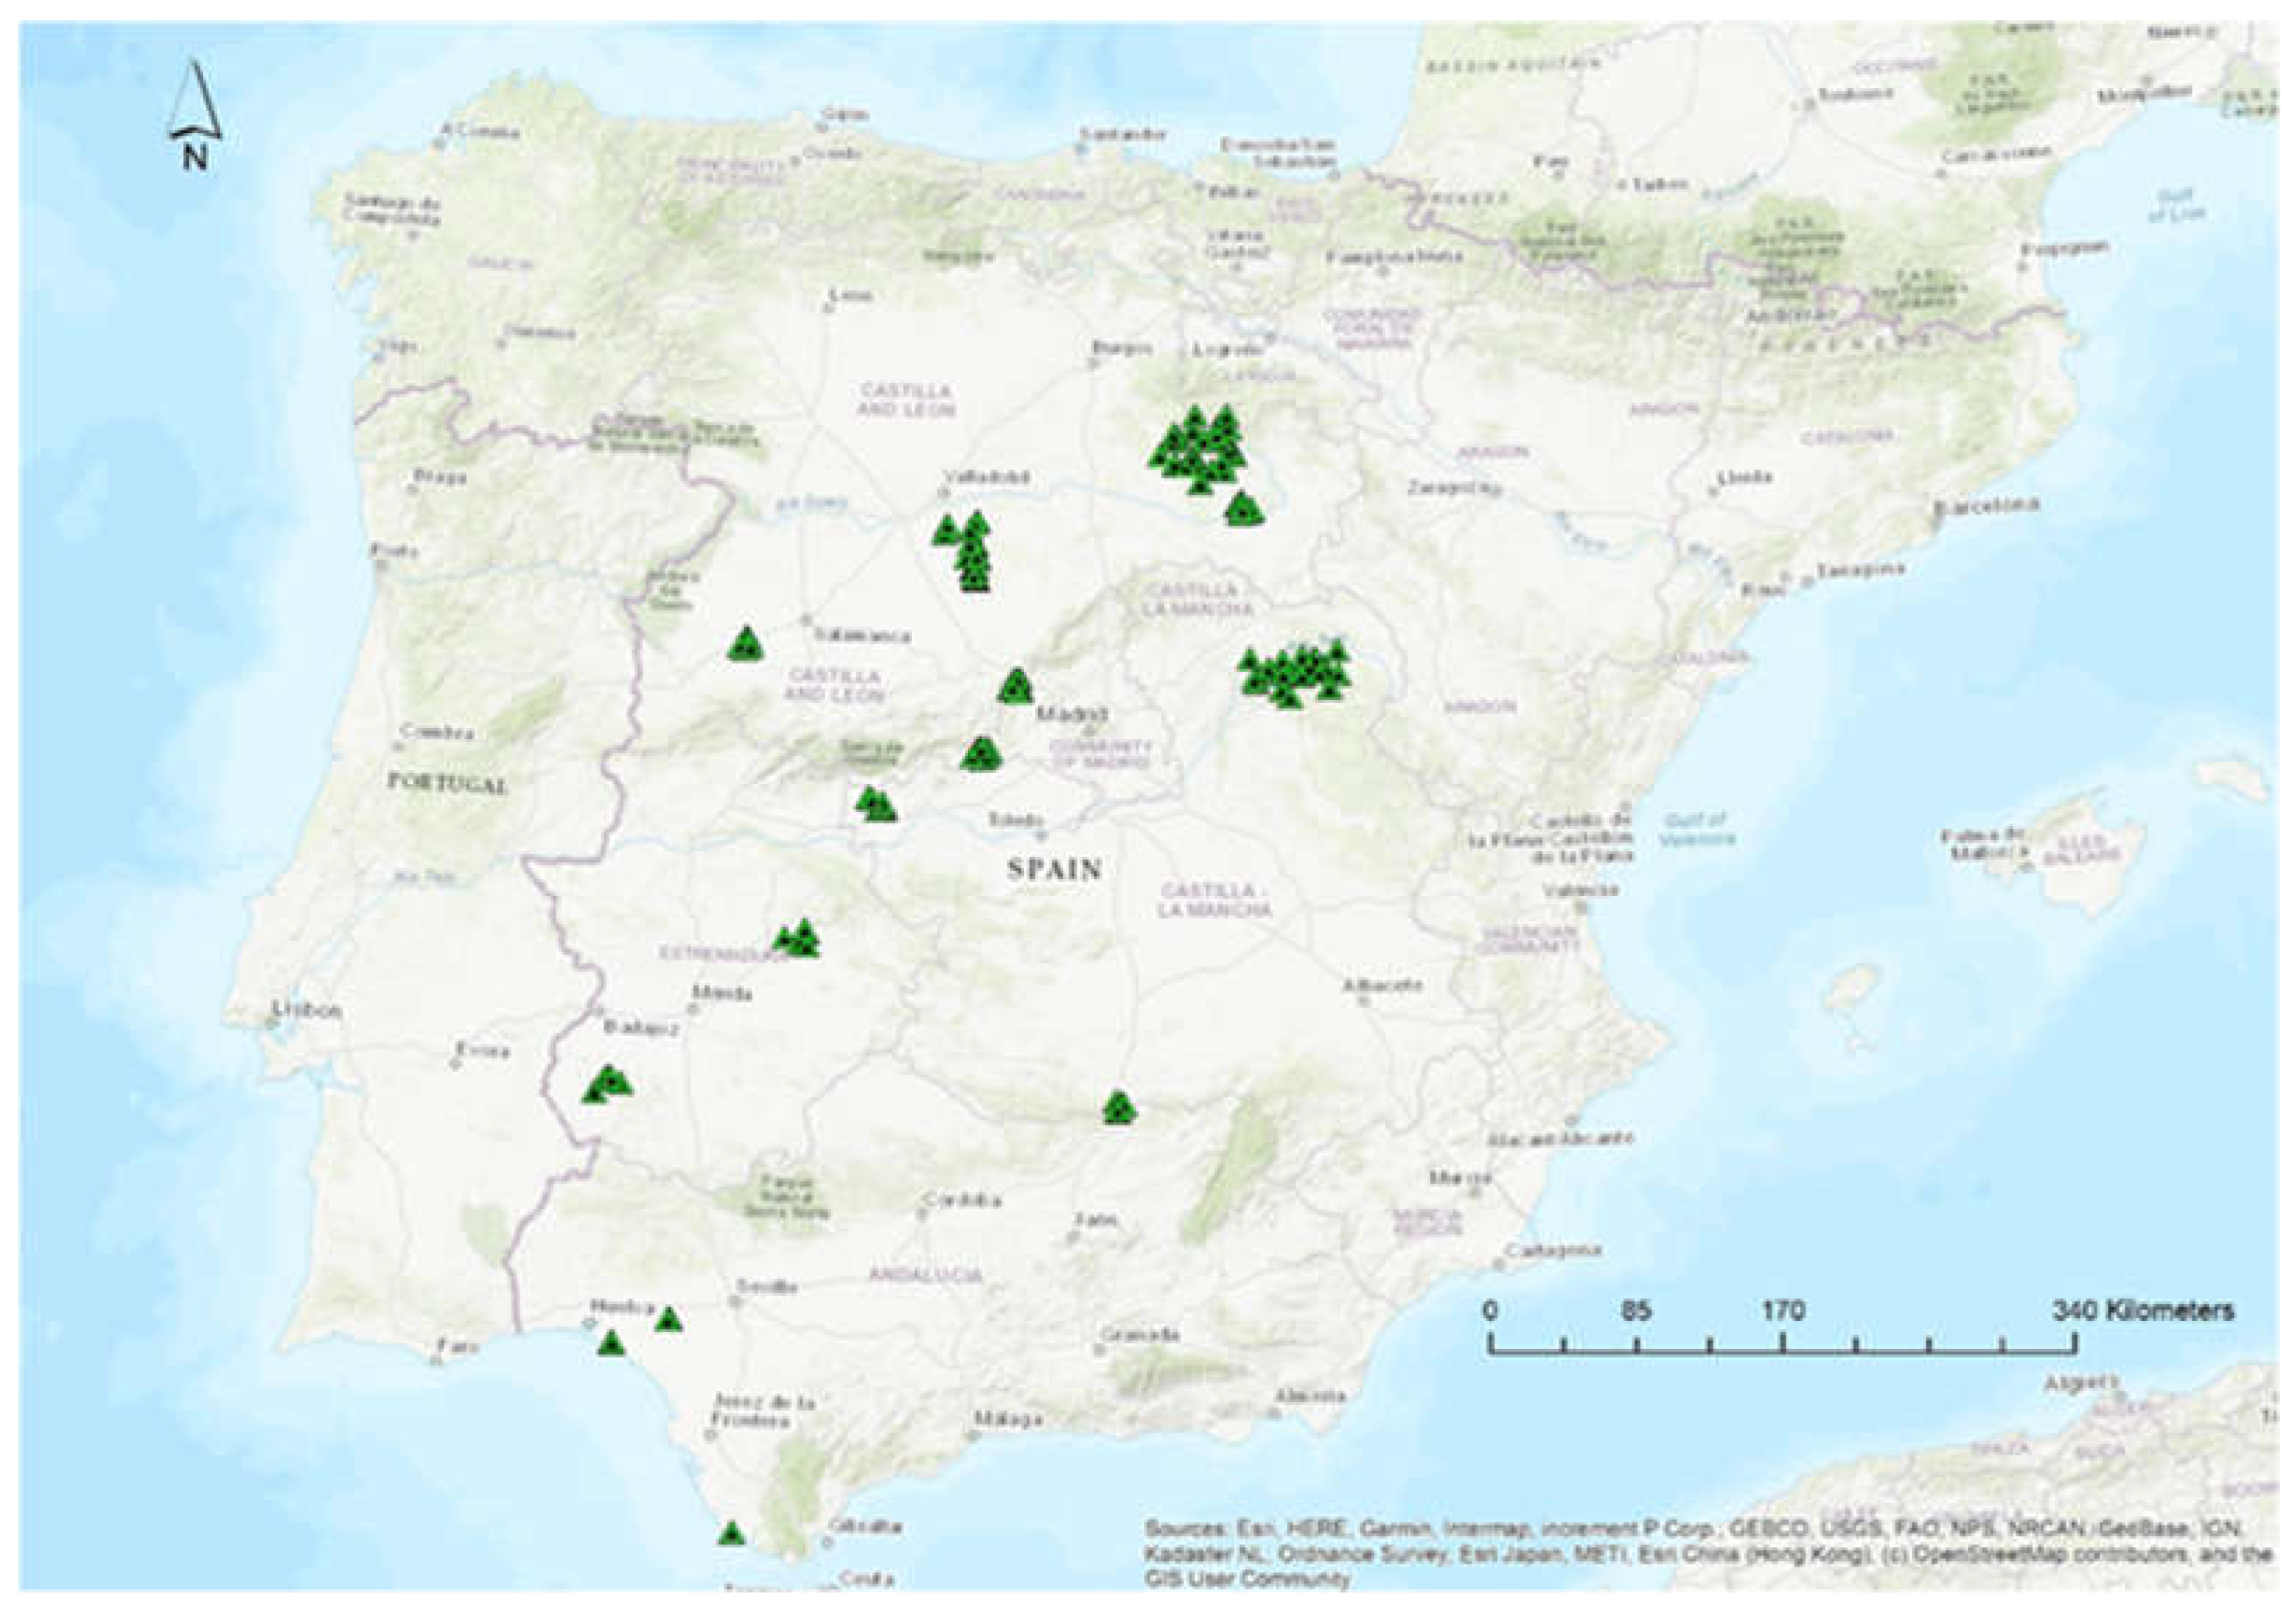
Figure 2.
Accumulation curves for species richness (0Dϒ) for groups taking into account main tree species. a) All samples with the gamma value superimposed by group (the numbers at the end of each curve are the value of the accumulated richness for each formation); b) 12 samples rarefaction by groups.
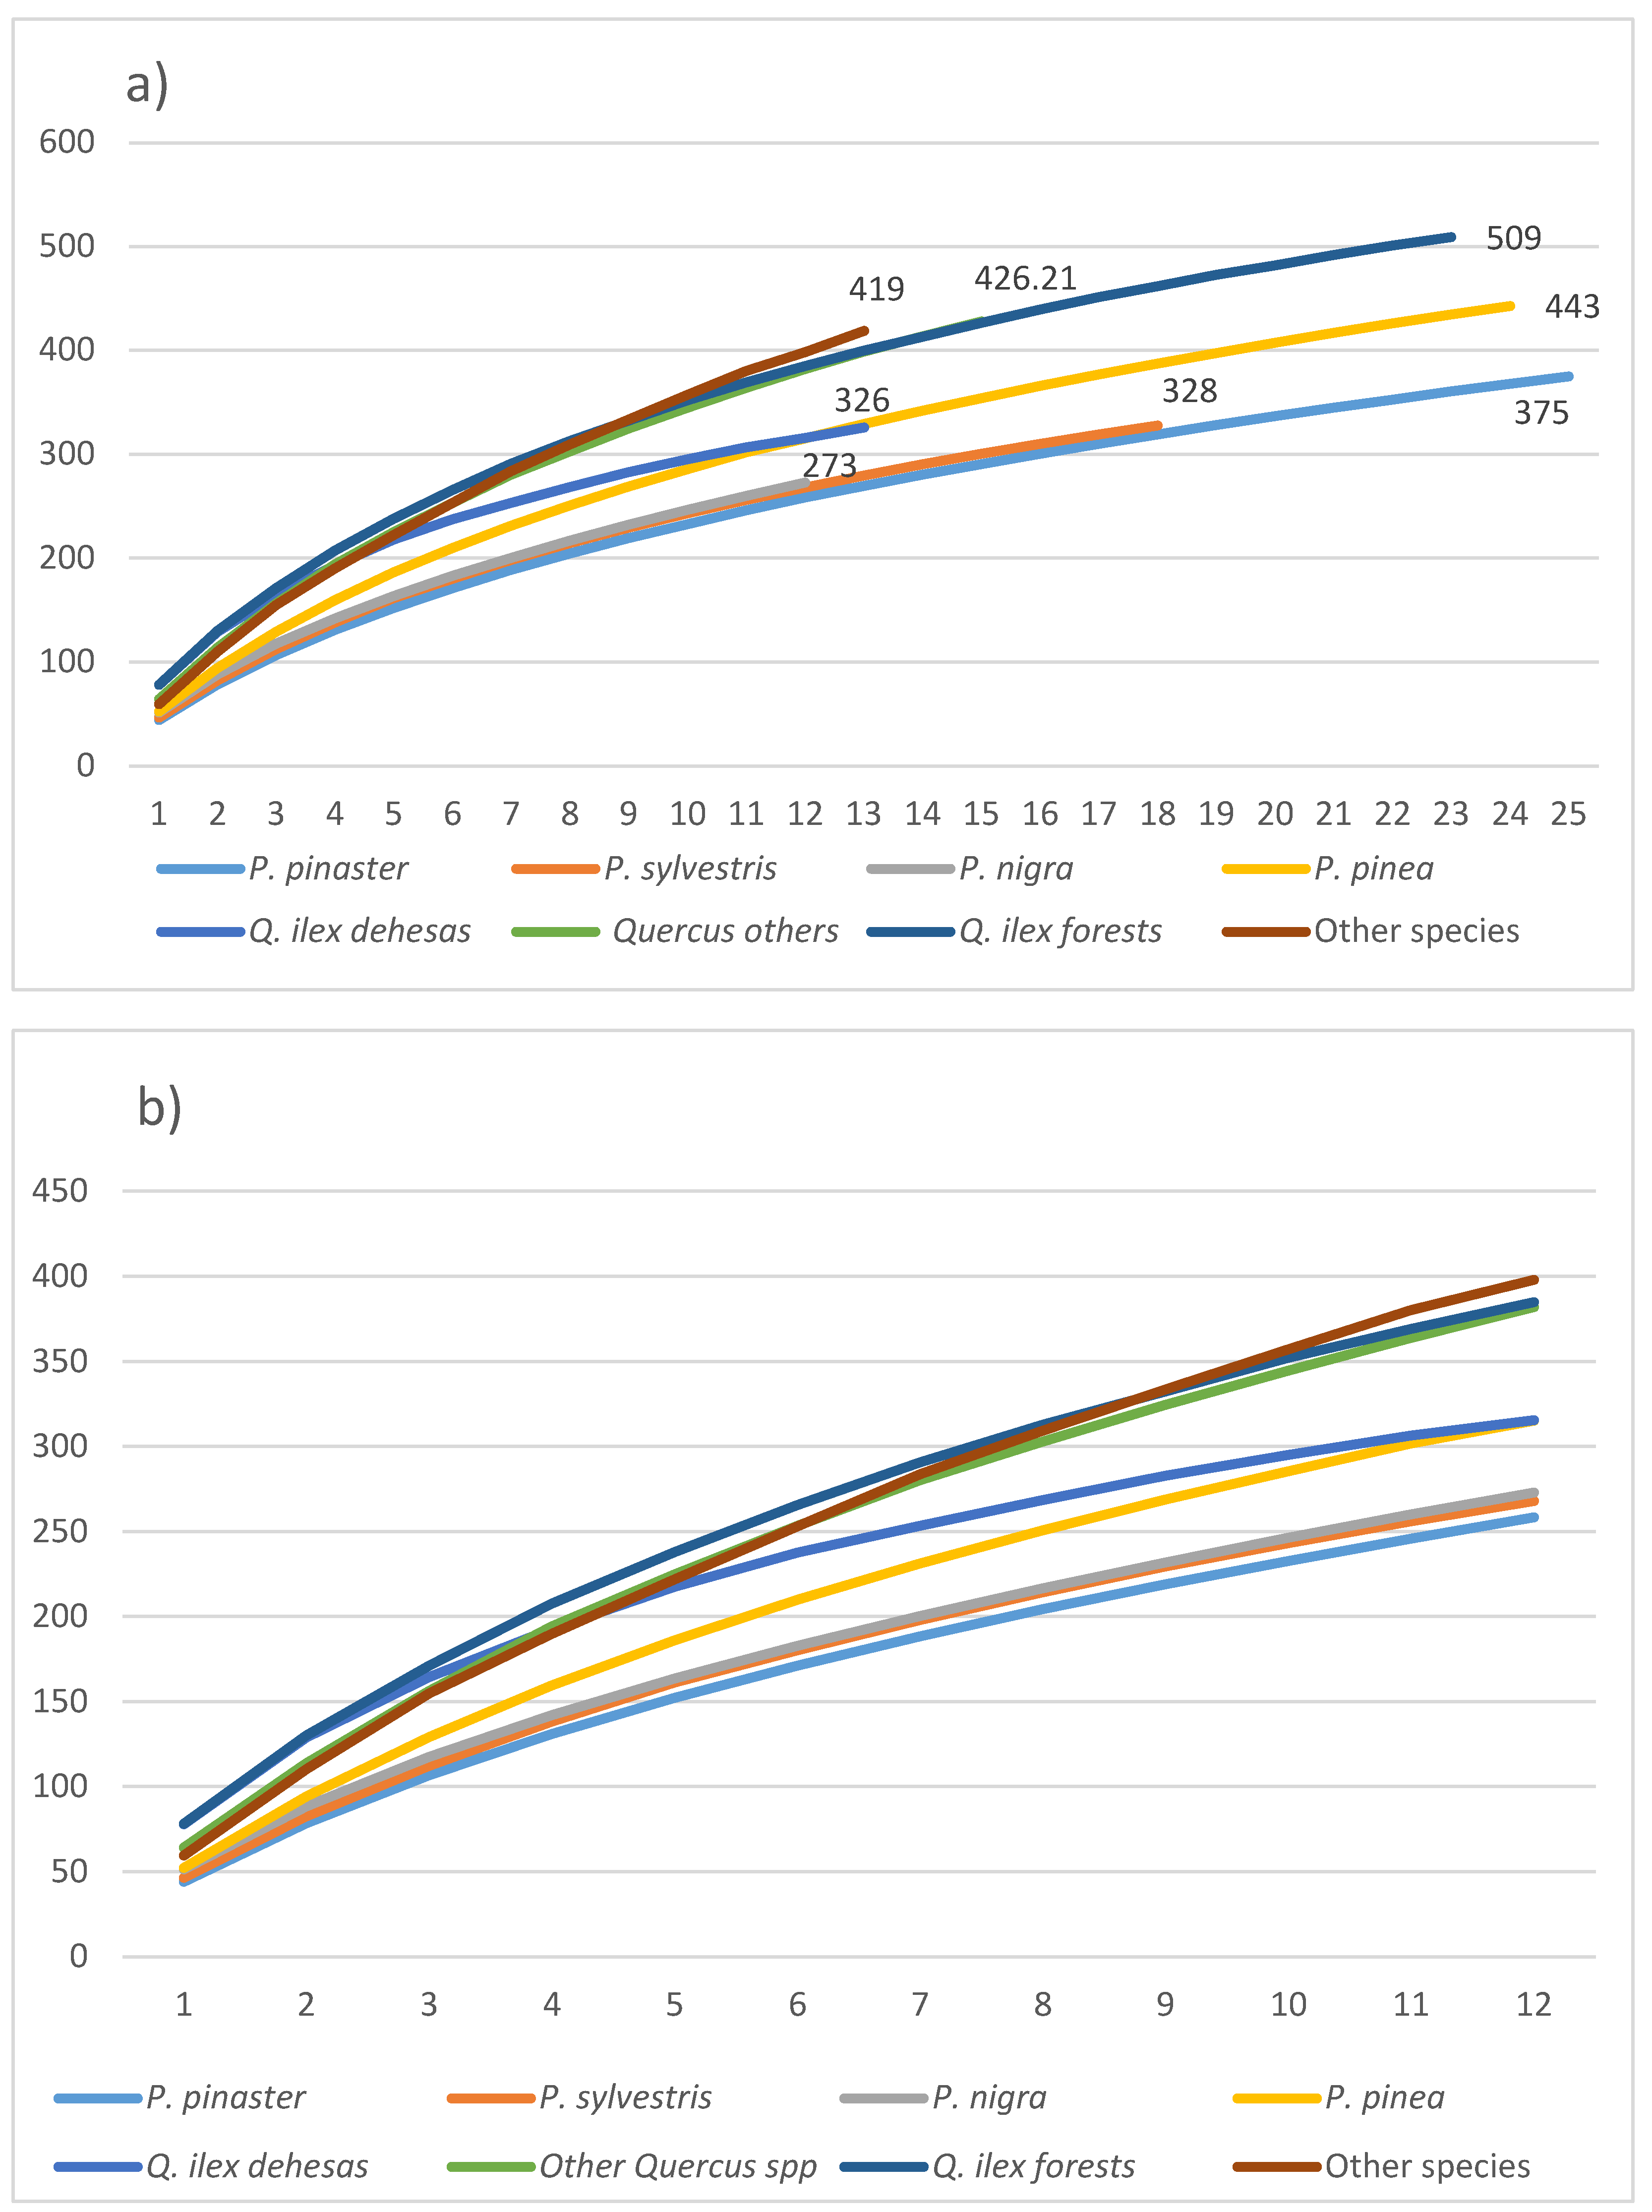
Figure 3.
Diversity profiles for multiplicative beta diversity (qDβ) grouped by main species using rarefaction data (12 samples per group).
Figure 3.
Diversity profiles for multiplicative beta diversity (qDβ) grouped by main species using rarefaction data (12 samples per group).
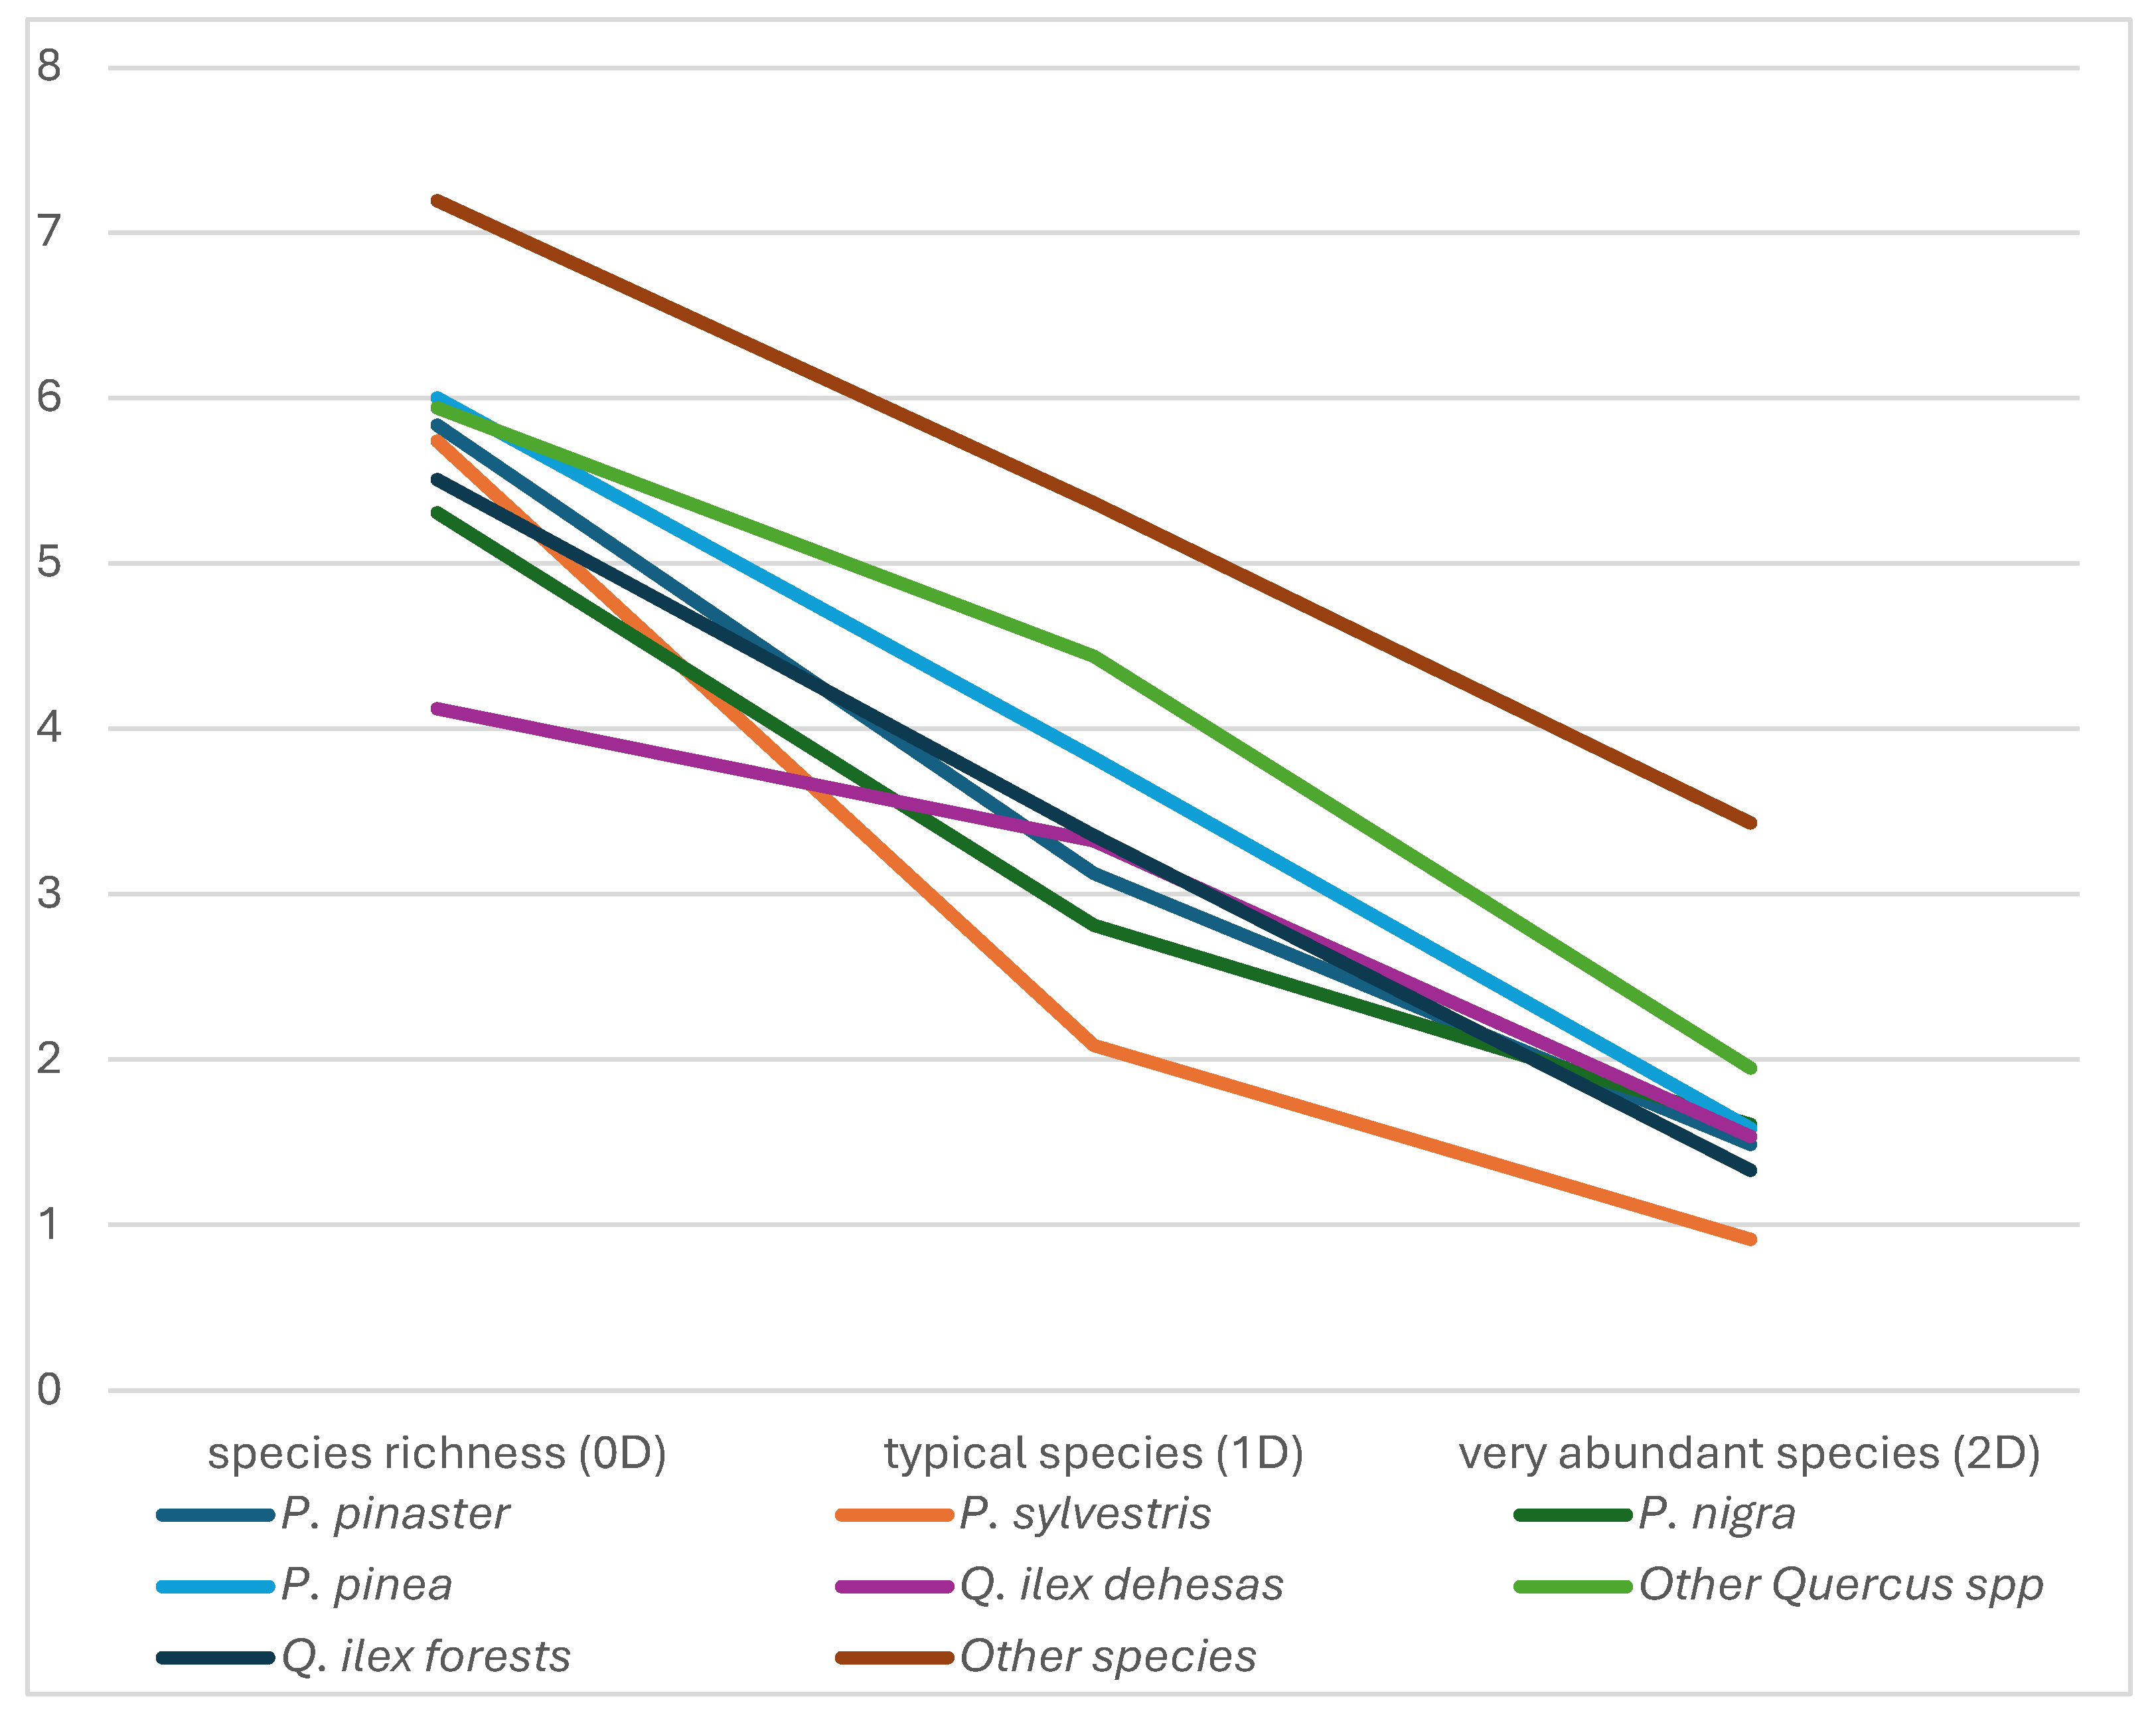

Table 1.
Statistics of lineal regression between qDα and two structural variables Fcc (canopy cover) and H0 (dominant height).
Table 1.
Statistics of lineal regression between qDα and two structural variables Fcc (canopy cover) and H0 (dominant height).
| Diversity Index | 0D | Coefficients | Typical error | t statistic | Probability | R | R^2 |
| 0D | Intercept | 68,3178 | 4,5386 | 15,0525 | 0,0000 | ||
| Fcc | -0,2227 | 0,0824 | -2,7030 | 0,0077 | 0,222 | 0,049 | |
| 1D | Intercept | 21,6049 | 1,6435 | 13,1456 | 0,0000 | ||
| Fcc | -0,1652 | 0,0298 | -5,5377 | 0,0000 | 0,423 | 0,179 | |
| 2D | Intercept | 12,9140 | 1,0515 | 12,2815 | 0,0000 | ||
| Fcc | -0,1045 | 0,0191 | -5,4730 | 0,0000 | 0,419 | 0,175 | |
| 0D | Intercept | 73,8569 | 4,4551 | 16,5782 | 0,0000 | ||
| H0 | -1,6299 | 0,3980 | -4,0956 | 0,0001 | 0,326 | 0,106 | |
| 1D | Intercept | 19,9343 | 1,7309 | 11,5167 | 0,0000 | ||
| H0 | -0,6494 | 0,1546 | -4,2001 | 0,0000 | 0,333 | 0,111 | |
| 2D | Intercept | 11,4216 | 1,1196 | 10,2016 | 0,0000 | ||
| H0 | -0,3684 | 0,1000 | -3,6836 | 0,0003 | 0,296 | 0,089 |
Table 2.
Species richness (0Dα), typical species (1Dα) and very abundant species (2Dα), at the plot scale, grouped by different criteria. Standard error in brackets. The variable Agr expresses the level of aggregation (initial letter) and the significance of the comparison between the means (same number for the members of the same group).
| Agr | n_plots | 0Dα | 1Dα | 2Dα | |
|---|---|---|---|---|---|
| All plots | a | 143 | 57.03 (21.7) | 13.23 (8.4) | 7.62(5.4) |
| Core plots | b1 | 115 | 55.14 (21.1) | 12.05 (7.4) | 6.87(4.6) |
| Ecotone plots | b2 | 28 | 64.79 (22.7) | 18.05 (10.5) | 10.69 (7.1) |
| Monoespecific plots | c1 | 91 | 55.76 (21.3) | 12.86(8.6) | 7.35 (5.6) |
| Mixed plots | c1 | 52 | 59.25 (22.3) | 13.87(8.3) | 8.08 (5.0) |
| Pinus spp | d1 | 80 | 47.39 (18.2) | 10.60 (7.0) | 6.37(5.1) |
| Quercus spp | d2 | 51 | 70.18 (18.5) | 17.22 (8.8) | 9.54(5.3) |
| Other species | d2 | 12 | 65.40 (24.3) | 18.80 (9.6) | 7.72(5.6) |
| Mediterranean pines | e1 | 51 | 47.84(18.9) | 11.34(7.7) | 6.82(5.6) |
| Mountain pines | e1 | 29 | 46.59 (17.3) | 9.30 (5.5) | 6.15 (4.06) |
| Quercus ilex | e2 | 35 | 72.17 (18.6) | 18.86 (8.9) | 10.52 (5.5) |
| Other Quercus spp | e2 | 16 | 65.81 (18.0) | 13.62 (7.6) | 7.40 (4.3) |
| Other species | e2 | 12 | 65.40 (24.3) | 18.80 (9.6) | 7.72(5.6) |
| Pinus pinaster | f1 | 25 | 45.33 (17.4) | 8.05 (3.6) | 4.62 (1.9) |
| Pinus pinea^ | f2 | 26 | 51.27 (19.9) | 14.07 (9.1) | 9.04 (6.9) |
| Pinus sylvestris* | f1 | 19 | 45.37 (20.2) | 9.24 (6.4) | 5.61(5.1) |
| Pinus nigra | f1 | 10 | 48.90 (10.2) | 9.41 (3.6) | 5.55 (2.0) |
| Quercus ilex dehesas | g1 | 12 | 77.83 (15.0) | 23.83 (7.4) | 13.92 (5.0) |
| Quercus ilex forests | g2 | 23 | 69.22 (19.8) | 16.27(8.7) | 8.75 (4.9) |
| Other Quercus spp | g2 | 16 | 65.81 (18.0) | 13.62 (7.6) | 7.40 (4.3) |
| Other species | g2 | 12 | 65.40 (24.3) | 18.80 (9.6) | 7.72(5.6) |
^Include two plots dominated by Pinus halepensis. * Include one plot dominated by Pinus uncinata.
Disclaimer/Publisher’s Note: The statements, opinions and data contained in all publications are solely those of the individual author(s) and contributor(s) and not of MDPI and/or the editor(s). MDPI and/or the editor(s) disclaim responsibility for any injury to people or property resulting from any ideas, methods, instructions or products referred to in the content. |
© 2024 by the authors. Licensee MDPI, Basel, Switzerland. This article is an open access article distributed under the terms and conditions of the Creative Commons Attribution (CC BY) license (http://creativecommons.org/licenses/by/4.0/).
Copyright: This open access article is published under a Creative Commons CC BY 4.0 license, which permit the free download, distribution, and reuse, provided that the author and preprint are cited in any reuse.


