

Submitted:
29 July 2024
Posted:
30 July 2024
You are already at the latest version
Abstract
Road congestion in Amman city increased yearly, due to the increase in private car ownership and traffic volumes. This study aims to (a) assess the social and economic impacts of the toll road in Amman, Jordan through a survey questionnaire using statistical software (SPSS), (b) identify the optimal price at selected road using micro-simulation (VISUM). Traffic, geometric and cost data of toll technique of two sections on the Airport Highway (From Ministry of Foreign Affairs to Madaba Interchange.; and From Madaba Interchange to Queen Alia International Airport (QAIA) interchange) were used for simulation purpose. The toll road (across 7 distinct scenarios at various price) were assessed for an optimal revenue. The survey questionnaire was made based on all scenarios including AM peak hour. The operation cost for toll road was determined based on greater Amman Municipality (GAM). The optimal scenario was measured based on the value ¬¬of revenue (JD), and type of payment. The results indicate that users found the most charging method to be based on traveled distance (54.02%) and the optimal value of the toll to be equal 0.25 JD (34.08%). In Addition, the total cost of Manual Toll Collection method (MTC) in 2025 is 126,935JD and the revenue is 1122.6 JD so this indicates to positive result. Eventually, the result of applying road pricing on the airport road in 2025 indicate to be effective and economically feasible only by using Manual Method.
Keywords:
Road Pricing scheme
; toll road
; VISUM
; traffic Congestion
; SPSS
; Fuel Consumption
1. Introduction
Traffic congestion is a pervasive issue in urban areas worldwide, leading to substantial economic, environmental, and social costs. In Amman, Jordan, this problem is particularly acute along the Airport Highway, a critical artery connecting Queen Alia International Airport to the city and serving as a vital link to the southern regions of the country, including major tourist destinations like Petra and Aqaba, as well as the kingdom's sole container port. The rising traffic volumes on this highway, driven by both local and international travel, highlight the urgent need for effective congestion management strategies.
The significance of this research lies in its potential to address the multifaceted impacts of traffic congestion in Amman. Economically, congestion leads to wasted fuel, increased travel time, and decreased productivity, imposing substantial costs on individuals and businesses. Environmentally, the idling vehicles contribute to higher emissions and noise pollution, adversely affecting air quality and public health. Socially, prolonged travel times reduce the quality of life and increase stress for commuters[1,2,3,4,5,6,7,8].
Given the existing and planned developments along the Airport Highway, traffic is expected to intensify in the future, exacerbating these issues. Therefore, it is imperative to explore viable solutions to mitigate congestion and enhance the overall efficiency of the transportation network.
This paper proposes road pricing as a potential solution to Amman's traffic congestion problem. Road pricing has been successfully implemented in various cities around the world, demonstrating its effectiveness in reducing traffic volumes, improving travel times, and generating revenue for infrastructure improvements.
This study focuses on analyzing the economic impact of traffic congestion by calculating costs for the old years and current year, and identifying trends in the growing economic burden. It also aims to assess public acceptance of road pricing through a questionnaire to gauge support and concerns among various demographic groups. Additionally, the study evaluates the economic feasibility of implementing road pricing by using traffic models (VISUM) for 2012 and 2025, considering both manual and automatic toll collection methods. Finally, it proposes practical recommendations for expanding toll roads to other congested routes in Amman and exploring the potential for road pricing on major highways across Jordan.
2. Literature Review
Many studies discussed various effects of road pricing systems, including traffic, environmental, distributive, and social impacts. In terms of traffic effects, road pricing schemes have shown promising results in reducing congestion and altering travel behavior (Table 1). Examples from Singapore[12,13], London[14,15], and Norway[16] demonstrate significant reductions in traffic volume during peak hours, leading to improved traffic flow and modal shifts towards public transit. Studies like those by Xie and Olsozewski (2011) in Singapore further highlight the positive correlation between road pricing and enhanced accessibility to public transit, emphasizing the potential for traffic management and mode shift strategies[17].
Regarding environmental effects, road pricing aims to mitigate emissions and noise pollution associated with transport activities. Studies, such as Johansson's analysis in Sweden[18], underscore the need for road users to internalize the environmental costs of their trips. By reducing travel time and vehicle kilometers, road pricing systems contribute to lower emissions levels, with variations in charges reflecting different vehicle types and environmental considerations. The design of road pricing charges, exemplified in Singapore's approach to electric and hybrid vehicles, influences their environmental effectiveness, underscoring the importance of tailored strategies to address specific environmental concerns[19].
Distributive effects of road pricing systems are contingent upon charge design and revenue allocation. Revenues collected from road pricing schemes can benefit public transit users and infrastructure improvements, as seen in Oslo's case[20]. However, disparities in income levels among road users may lead to inequities, with higher-income groups more likely to afford the charges compared to lower-income individuals. The division of road users into different types based on their response to charges highlights the complex socio-economic dynamics at play, underscoring the need for equitable and inclusive policy considerations[21].
Morever, social benefits of road pricing systems encompass improvements in travel time, accident reduction, reliability, and emissions. Studies by Parry and Bento (1999) advocate for the recycling of collected revenues to enhance public transit services, emphasizing the importance of reinvestment for broader social welfare gains[22]. Danna et al. (2012) further quantify the social benefits of road pricing, considering factors such as toll collection costs, transit subsidies, and overall societal welfare impacts. Their findings suggest that while toll revenues may represent cash transfers, effective road pricing policies can yield net social benefits over the long term, highlighting the potential for sustainable transportation planning and investment strategies[23].
The evolution of road pricing acceptance can be traced through various studies conducted globally. Initially met with resistance due to perceived higher costs, road pricing gradually gained traction as studies highlighted its benefits. For examplem, In Gothenburg[21] in 2002 indicated minimal public agreement with the fairness of road pricing, but by 2000, support increased to 38% when presented as a solution to reduce queues[21] Similarly, opposition in Oslo[15,24] , spain[25] and Jordan[26] , in
Oslo decreased from 70% to 54% after charges were implemented, demonstrating increased support post-implementation and in spain, the research investigated the impact of different factors on the support for these pricing options. Interestingly, the study found that attitudes towards road pricing, rather than income levels, played a significant role in influencing support for the proposed schemes. In Jordan, a study by Jdaan explored how road pricing in Amman affected travel behavior, using a pilot survey questionnaire. The findings revealed a notable shift in respondents' preferences towards utilizing public transport and carpooling as alternatives to using their vehicles. Studies in other cities like Singapore and Trondheim also showed growing acceptance over time[15,24]
Further research, such as the study by Ubbels and Verhoef in 2004, underscored the importance of adequate technical and administrative groundwork for road pricing acceptance[23]. Studies like those by S.jaensirisak et al. and Ubbels and Verhoef in 2005 and 2006, respectively, revealed that acceptance varied based on factors such as personal characteristics and perceived revenue use[23,27]. Melhorado et al. in 2010 emphasized the need for policymakers to understand the purpose of road pricing for its effective implementation and economic development[28].
Cools et al.'s 2011 study explored the link between driver behavior and road pricing acceptability, highlighting the importance of socio-cognitive factors[29]. Meanwhile, local research by Jadaan et al. in 2013 in Jordan revealed potential shifts towards carpooling and public transportation due to road pricing, impacting both individual behavior and business practices[26].
In 2014, Kaplan et al. delved into the impact of fairness and spatial equity on transit perceptions and usage, showcasing the intricate relationship between perceived service quality, ease of payment, and frequency of transit use. Together, these studies provide insights into the evolving acceptance and understanding of road pricing worldwide, emphasizing its multifaceted implications on transportation behavior and societal dynamics[30].
Several studies have created various models to examine how individuals' attitudes, behaviors, and characteristics influence the acceptability of RP. Simulation modeling offers a comprehensive approach to assess the impact of tolls across various dimensions, including economic, environmental, social, and traffic factors. Komada and Nagatani's (2010) study focused on traffic dynamics on toll highways, revealing how vehicular density and tollgate configurations influence traffic flow and queuing patterns. By deriving fundamental diagrams, they provided insights into traffic behavior under different conditions[31].
Tsekeris and Vos (2010) explored the nexus between public transport and road pricing in Greece, using simulations to demonstrate that well-designed policies could bolster public transport usage without substantially raising road user charges[32].
Chakirov and Erath (2012) delved into the intricate factors shaping road pricing design, employing Multi Agent Transport Simulation (MATvis) to model economic and socio-demographic variables influencing travel demand patterns[33]. Morever, In 2019, Malaysia employed VISSIM to simulate traffic conditions, revealing that toll collection methods have a notable impact on congestion, queues, and delays, particularly affecting heavy vehicles[34].
Road pricing systems employ various payment methods, categorized into three main types: distance-based[34,35], time-based[36,37], and toll station-based[14]. Distance-based payment, utilized in Switzerland, Germany, and Gothenburg, relies on technologies like GPS and GSM to track vehicle movement and calculate charges based on driven distance. In this system, vehicles equipped with GPS transponders communicate with central units via GSM, allowing for automatic payment processing after the vehicle enters the charging zone. This method offers real-time tracking and efficient billing, enhancing user convenience and accuracy[38].
On the other hand, Payment systems based on time, exemplified by London's congestion charging scheme, offer drivers multiple payment options and timeframes for payment. Failure to pay by the designated time incurs fines, encouraging compliance. Despite the flexibility provided to users, time-based systems require strict adherence to payment deadlines, posing challenges for enforcement and revenue collection. Nonetheless, London's scheme generates substantial annual revenues, indicating its effectiveness in managing congestion and generating funds for transportation infrastructure[39].
Toll station-based payment methods, involving munual collection, bank accounts or smart cards, streamline toll collection processes. In malaysia , a study conducted employing VISSIM for traffic simulation, which highlighted the notable influence of toll collection methods on congestion, queues, and delays, especially concerning heavy vehicles. However, results of astudy in India found that the optimal collection method is the Electronic Toll Collection (ETC) and open tolling road. Morever, In other studies[37, in other countries like Oslo, Philibeans, singapora and dubai found that the optimal
In Oslo, electronic payment is preferred due to its speed and convenience, with charges deducted directly from registered bank accounts via subscription transponders. Smart card systems, like those in Singapore and Dubai, offer similar benefits but require users to preload funds onto cards for automatic deduction upon passing toll gates. These systems minimize transaction times and enhance user convenience, contributing to efficient toll collection and revenue generation[15,24,37].
Therefore, the novelty of this research has been investigated the efficacy of toll road deployment, specifically in evaluating the most suitable method for toll collection booths and their impact on traffic flow and congestion. Through the application of sophisticated simulation modeling methods, valuable insights are provided into the effectiveness of toll road strategies. These insights can assist transportation planners and policymakers, not only in Jordan but also in other areas facing comparable transportation issues. As a result, policymakers can utilize these findings to develop informed toll road deployment strategies aimed at enhancing traffic flow, alleviating congestion, and improving road safety and mobility.
The toll road on Airport Road in Amman, analyzed through VISUM, offers significant contributions to the transportation landscape. Utilizing advanced simulation techniques, VISUM allows for a comprehensive understanding of the toll road's impact on traffic flow, congestion levels, and overall efficiency. Moreover, by designing and administering a questionnaire regarding the application of road pricing, valuable insights are gained into public perception, acceptance, and potential behavioral responses to toll implementation. Following the collection and analysis of questionnaire data, the operational costs associated with the toll road, including toll collection infrastructure, maintenance, and administration, are carefully calculated. By juxtaposing these costs with revenue projections derived from VISUM simulations, a thorough assessment of the toll road's financial viability and sustainability can be achieved.
Toll road in Amman contributes to environmental sustainability by reducing fuel consumption and vehicle emissions. By optimizing traffic flow and reducing congestion, toll roads minimize idling time and stop-and-go traffic, which are major contributors to fuel waste and air pollution. Additionally, toll roads' efficient operation helps mitigate greenhouse gas emissions associated with transportation.
3. Methodology
The methodology used in this study follows a structured scientific approach to analyze various characteristics and data related to the Queen Alia International Airport Road. Firstly, geometric data detailing the design of the highway, such as the number of lanes, lane widths, and locations of interchanges, was collected from reputable sources including the Greater Amman Municipality, the Ministry of Public Works and Housing in Jordan. This data provides a comprehensive understanding of the physical layout of the road.
Secondly, traffic data was collected to understand the volume and flow characteristics of traffic on the Airport Road. This information was sourced from the Central Traffic Department, providing insights into traffic patterns, congestion levels, and peak traffic hours. Additionally, data on fuel prices and vehicle counts were obtained from the Al-Manaseer Oil & Gas Group and the Department of Statistics in Jordan, respectively.
Furthermore, toll infrastructure cost data and survey questionnaires were utilized to assess driver attitudes and preferences towards road pricing schemes. The cost data, obtained from relevant authorities, includes expenses associated with monitoring and violation cameras, booths, signage, and toll machines. Survey questionnaires were distributed to gather feedback from drivers regarding their acceptance of toll-based pricing schemes, helping to gauge public opinion and willingness to pay
Moreover, the operational costs of toll road methods were evaluated to identify the most economical approach. By comparing the costs associated with manual toll collection versus automatic toll machines, the study aimed to determine the most cost-effective method for toll collection.
Finally, the transportation planning software VISUM was employed for traffic flow modeling. This software considers various factors such as traffic demand, network structure, and route choice behavior to simulate the impact of proposed interventions on urban transport dynamics. Different scenarios based on toll prices were evaluated using VISUM, and the level of service based on highway capacity was assessed manually, allowing for a comprehensive analysis of potential interventions and their implications for traffic management and infrastructure planning. Figure 1 provides a concise overview of the methodology used in this study.
3.1. Research Location
Amman, a prominent urban center in Jordan, is home to approximately 4.642 million people as of 2021, making up about 42% of the country's total population. The city's dense urban environment has led to a significant increase in vehicular traffic, contributing to congestion challenges on its road network. This study focuses specifically on analyzing two sections of the Airport Highway (From Ministry of Foreign Affairs to Madaba Interchange and From Madaba Interchange to QAIA interchange) , a vital transportation artery in Jordan. The Airport Highway experiences consistently growing traffic volumes, primarily because it serves as a crucial link between Queen Alia International Airport and the southern regions of Jordan. Moreover, the southern region, home to popular tourist destinations like Petra and Aqaba, also serves as a major freight hub due to its sole container port in the kingdoma as shown in Figure 2. With numerous ongoing and planned developments along the Airport Highway, traffic is anticipated to continue expanding, underscoring the importance of studying this area for effective traffic management strategies.
3.2. Geometric Data
As stated by the Greater Amman Municipality (GAM), geometric data comprises crucial information regarding the design of highways, encompassing essential details about highway design such as the number of approaches, lanes, lane widths, length of studied sections, and locations of interchanges. This data provides a basic understanding of the layout and structure of the road.
3.3. Traffic Data Collection
Traffic data collection involves gathering detailed information about the flow of traffic, particularly focusing on the volume of traffic passing through specific points over time. This includes determining the type and number of vehicles crossing selected sections. The data gathered includes information on traffic volume, free flow speed, and congested speed during morning AM peak hour along the study area. These valuable metrics are sourced from the Greater Amman Municipality (GAM) and Ministry of Public Works and Housing (MPWH), specifically collected during morning rush hours as detailed in Appendix A
Free-flow travel speed: This represents the speed at which vehicles can travel under uncongested conditions, providing a baseline for comparison, and Congested speed: This indicates the reduced speed experienced during periods of traffic congestion, highlighting the impact of traffic volume on travel times and efficiency as shown in Appendix A.
3.4. Cost Data of Toll Technique
The cost data associated with toll techniques involves assessing various economic factors related to transportation infrastructure and operations. This includes evaluating the average cost of time attributed to working hours, representing the monetary value associated with time spent due to work commitments. Additionally, the cost of fuel per gallon is examined to understand the financial implications of fuel consumption in transportation activities.
Key variables collected for analyzing the cost of toll techniques include:
- -
- Average yearly income (JD): This provides insights into the financial capacity of individuals in the region and their ability to afford transportation-related expenses.
- -
- Working days and working hours: These parameters help determine the average time spent on work-related activities, influencing travel patterns and demand for transportation services.
- -
- Cost of time: Calculated by dividing the average yearly income by the working hours, this metric signifies the value of time spent on work commitments.
- -
- Average cost of fuel and diesel (per liter): These values reflect the cost of fuel consumption, essential for understanding the economic implications of transportation activities.a number of variables were collected from different sources as summarized in Table 2.
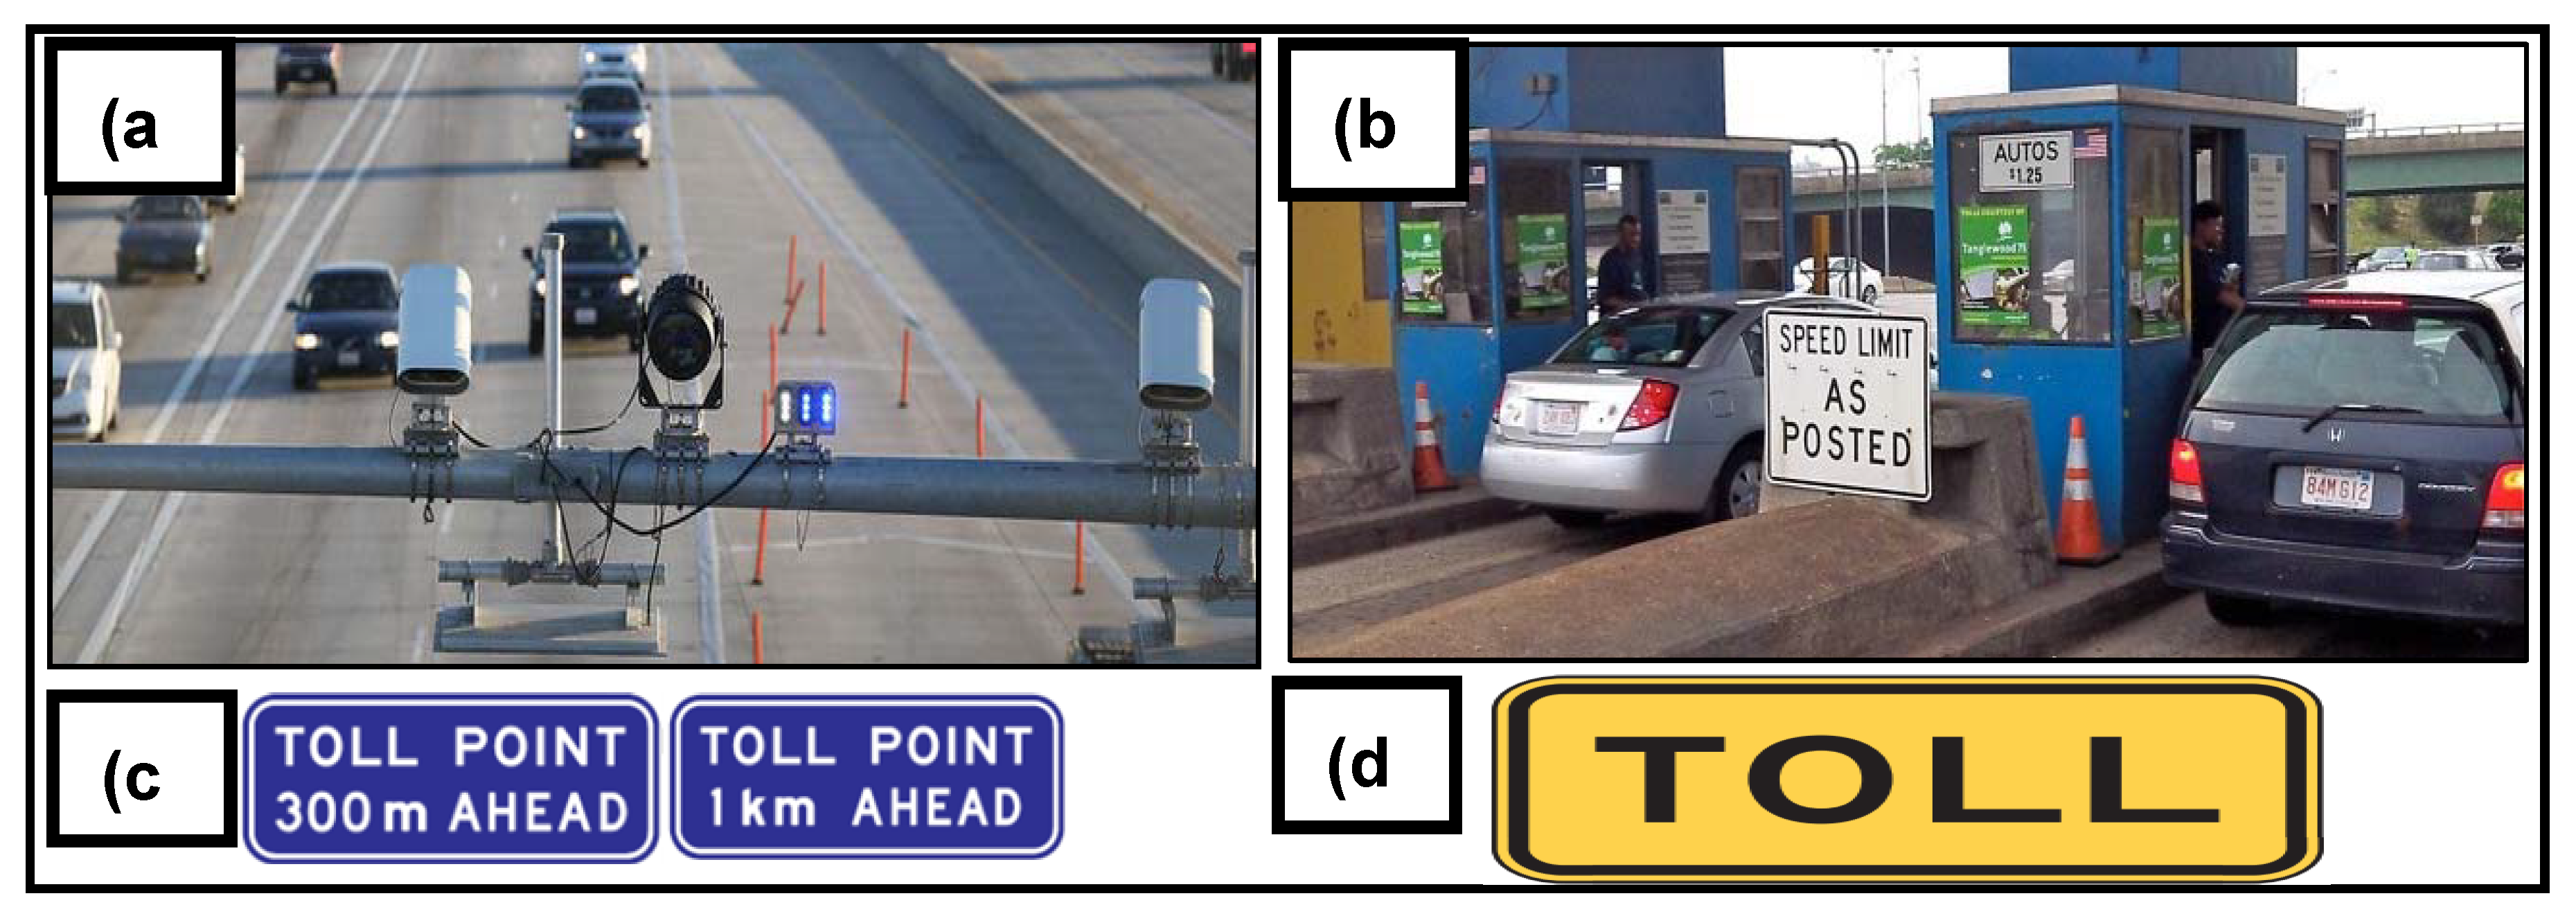
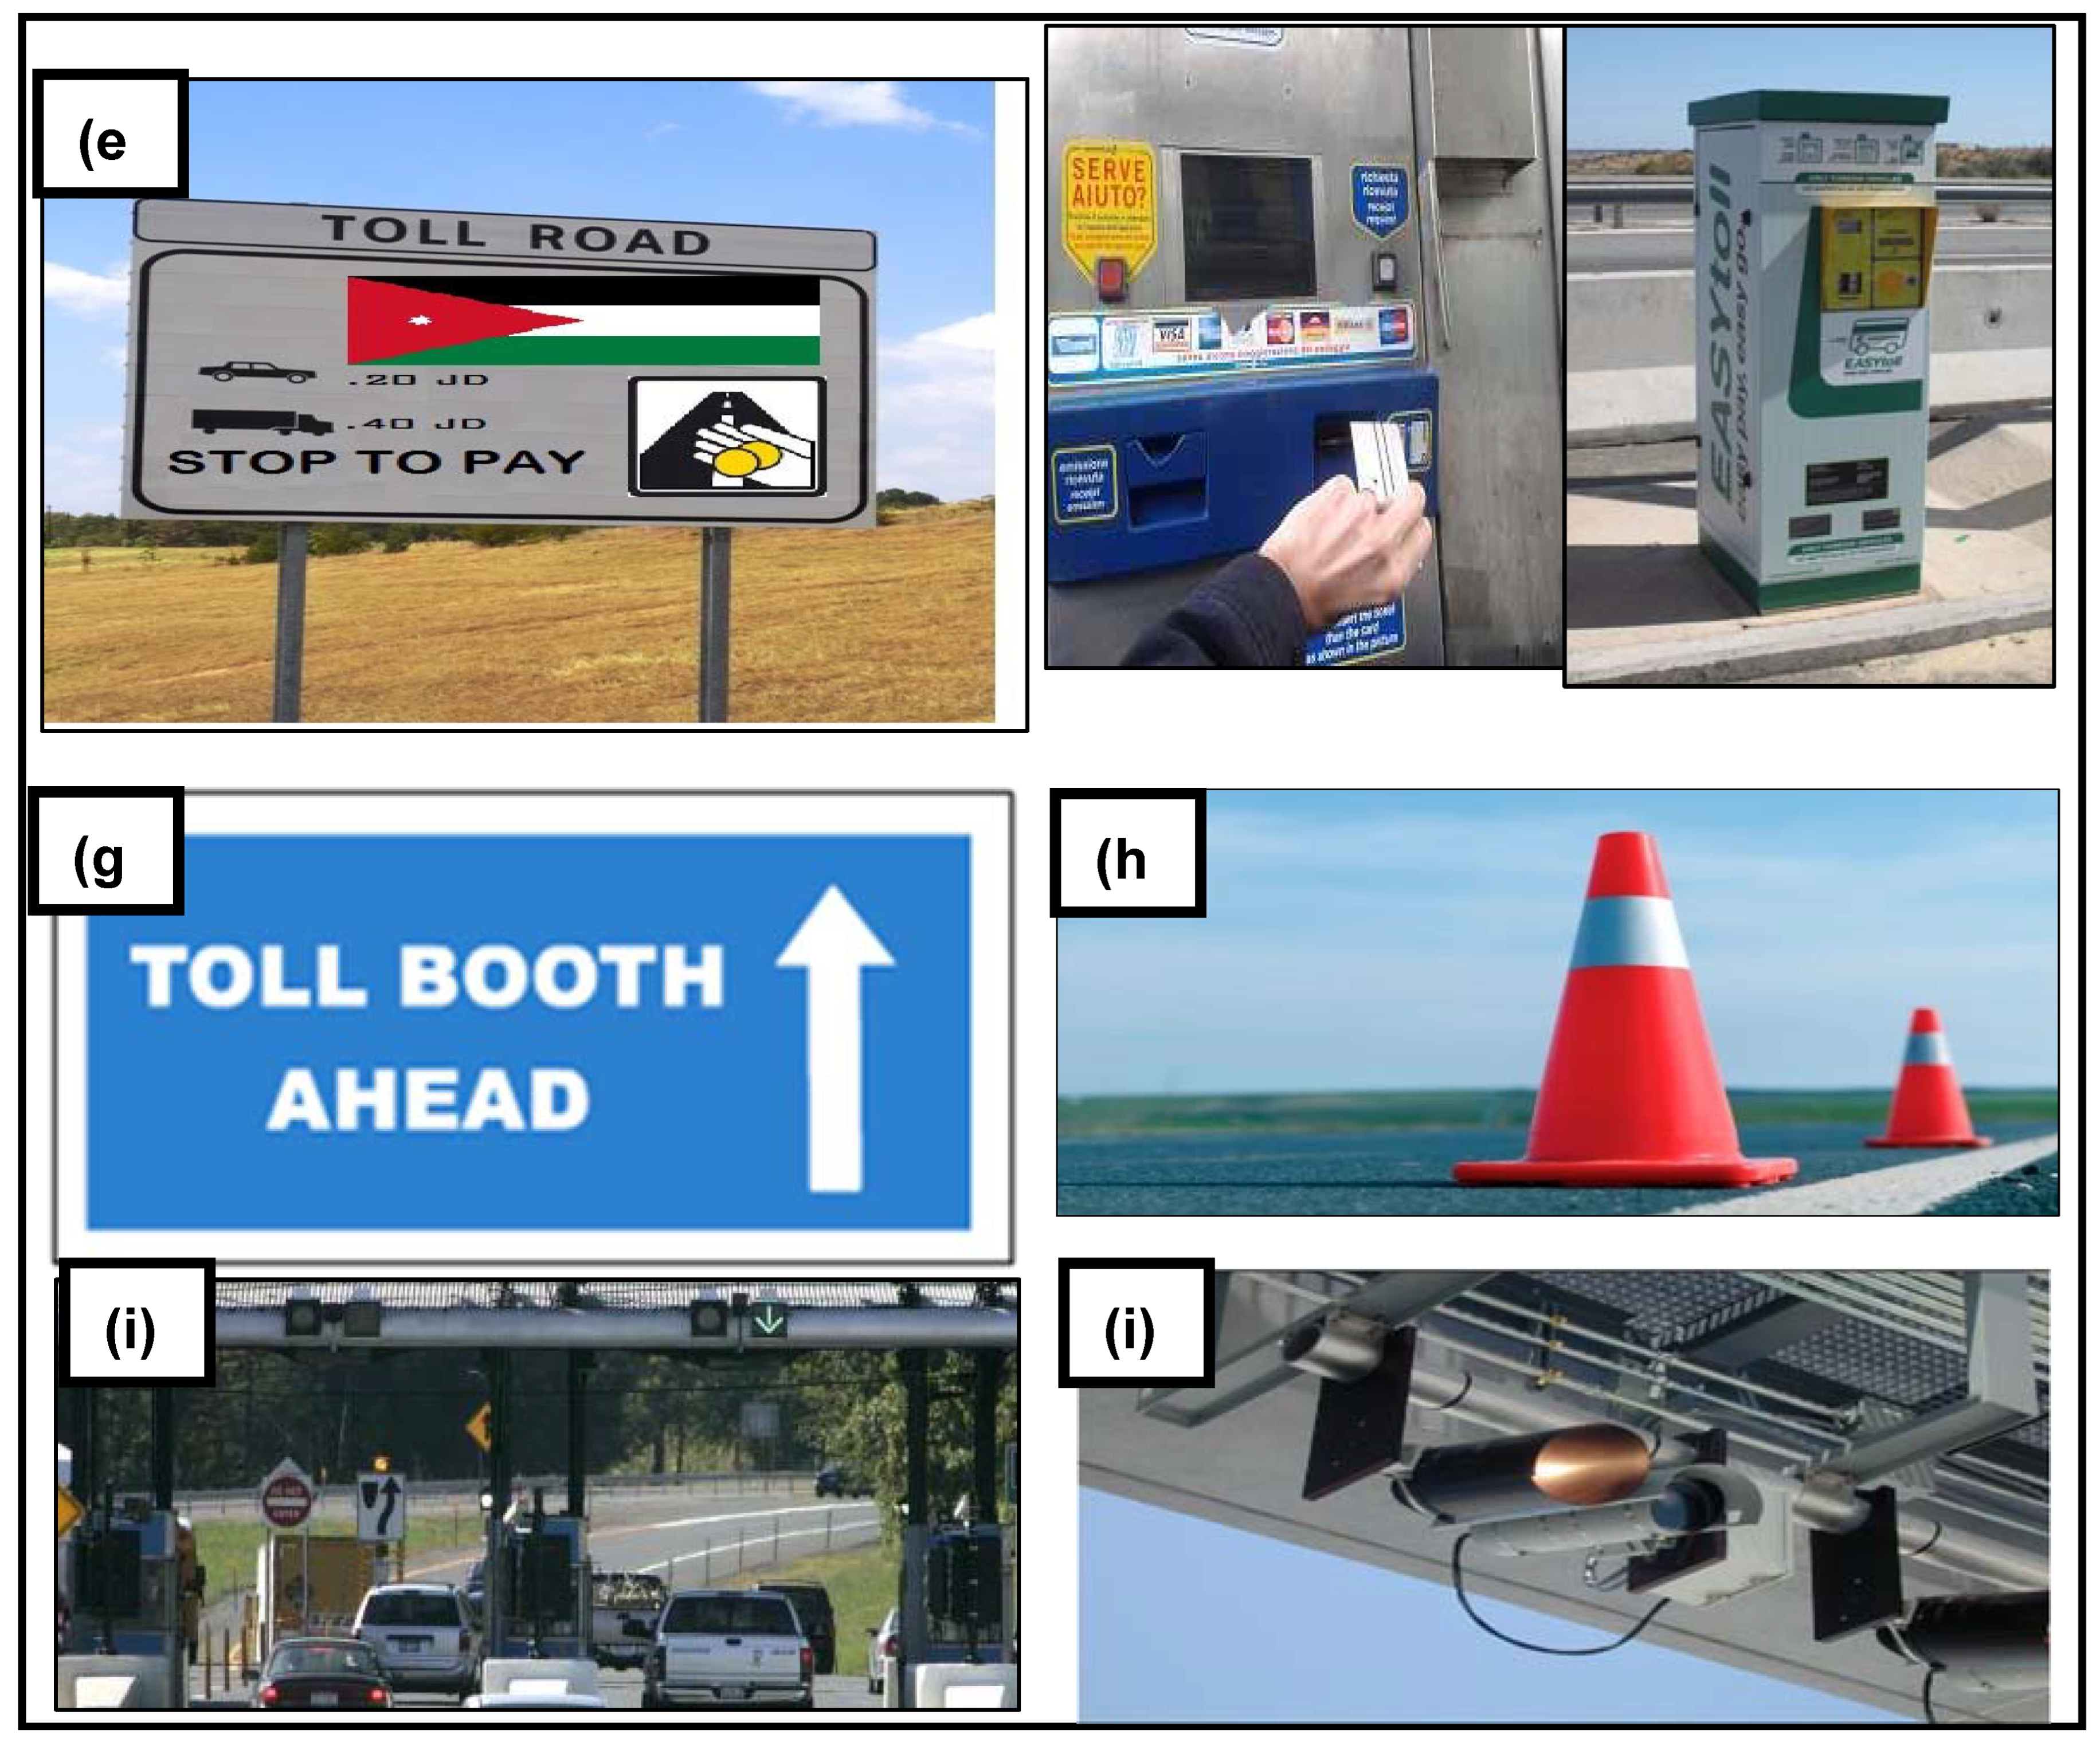
In Addition, Toll techniques includes various components and equipment necessary for the operation of toll booths or collection points as shown in Figure 3. The Table 3 provides a summary of the costs associated with different toll collection devices including cameras, booths, signs, pavement markings, and automated toll machines.
3.5. Congestion Cost
The cost of congestion encompasses two primary components: delay and fuel consumption. Delay refers to the additional time spent by motorists due to congestion, resulting in lateness for work or other commitments. Fuel consumption increases during congestion due to prolonged engine usage, leading to higher costs and increased emissions, contributing to environmental issues like global warming.
Data collection involved studying traffic volumes and speeds during peak hours along the Airport Highway sections. The delay cost was calculated by determining the difference in travel time between congested and uncongested periods, based on the value of a working hour in Jordan. Additionally, fuel-wasted costs were estimated by comparing fuel consumption rates at congested and uncongested speeds. These costs were then added to obtain the total congestion cost for each roadway section.
The following general steps are used to calculate the congestion cost in this study for each urban roadway section:
- Obtain traffic volume data by road section.
- Determine AM peak hour and PM peak hour for years 2011,2012 , 2013 and 2024.
- Obtain congested & uncongested speed for each section.
- Calculate vehicle delay by measuring the sectional time lost between congested and uncongested conditions.
- Determine wasted fuel for each section as the difference between fuels consumed on congested and uncongested speed.
- Determine the total congestion cost.

Table 3.
Details of Charging Method Costs.
| Techniques | The cost of one (JD)* |
|---|---|
| Monitoring Cameras | 4,000 |
| Violation Cameras | 40,000 |
| Booths | 9,000 |
| Signs in Advance of a Toll Point | 443.75 |
| Signs at a toll Point | 303.75 |
| Pavement marking at toll points | 150 |
| Direction Signs | 443.75 |
| poly venile chloride cone | 14 |
| Employer | 300 |
| Toll Machine | 56,000 |
(*) 1 JD = 0,72 US.
Figure 3.
Toll Techniques at Airport Road: (a): Monitoring cameras., (b): Toll booths, (c) Advanced Sign of Toll Station, (d): Pavement markings at the Toll Point, (e): Sign at Toll Point, (f): Automatic Toll Machine, (g): Directional Sign, (h): Polyvinyl Chloride cone, and (i): Violation Cameras.
Figure 3.
Toll Techniques at Airport Road: (a): Monitoring cameras., (b): Toll booths, (c) Advanced Sign of Toll Station, (d): Pavement markings at the Toll Point, (e): Sign at Toll Point, (f): Automatic Toll Machine, (g): Directional Sign, (h): Polyvinyl Chloride cone, and (i): Violation Cameras.
3.6. Survey Questionnaire
In this study, a road pricing scheme was designed for the Airport Highway to examine drivers' attitudes towards such schemes. A survey questionnaire was conducted with travelers at various locations along the airport road (Madaba, Marj Al-Hamam, and the South of Jordan). Participants were asked several questions to determine their preferences regarding road pricing, their acceptance, and their willingness to pay for the implementation of such a scheme.
The primary tool of this study was a stated preference questionnaire, organized into four sections, as detailed in Appendix C.
Section 1: This section includes questions about the demographic and socioeconomic characteristics of the drivers, such as gender, age, household income, and education level.
Section 2: The objective of this section was to inform and raise awareness about road pricing schemes, focusing on their potential positive and negative impacts. It contained questions about the advantages and disadvantages of a congestion pricing scheme, which was especially relevant for users with little experience with road pricing.
Section 3: This section gathered information related to respondents' travel behavior, specifically the number of trips and the purpose of these trips. The assumption is that travelers' acceptance and willingness to pay for a congestion charging scheme depend on their trip characteristics.
Section 4: This section included questions about the preferred payment method and acceptable pricing. The objective was to identify the most suitable payment method and an acceptable fee or price.
3.7. Evaluation the Operation Cost of Toll Road
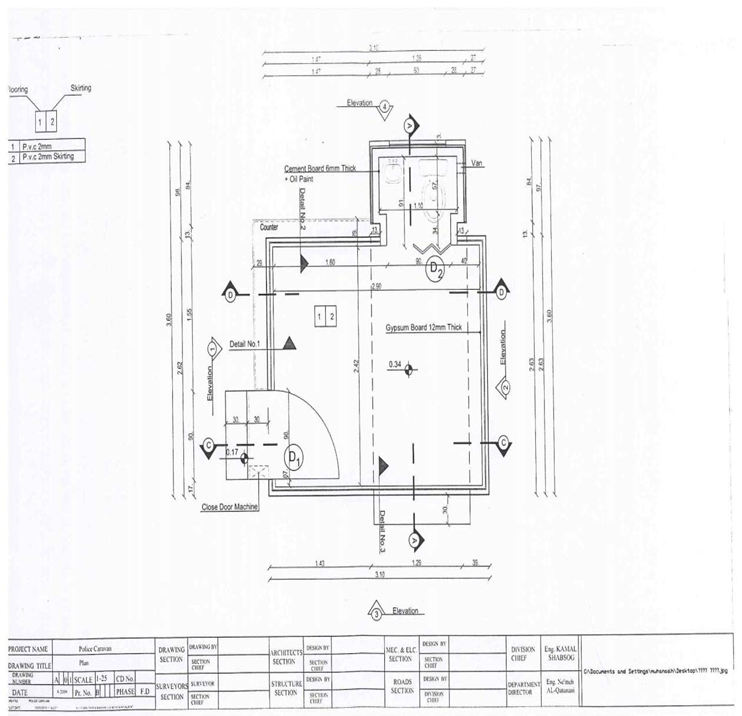
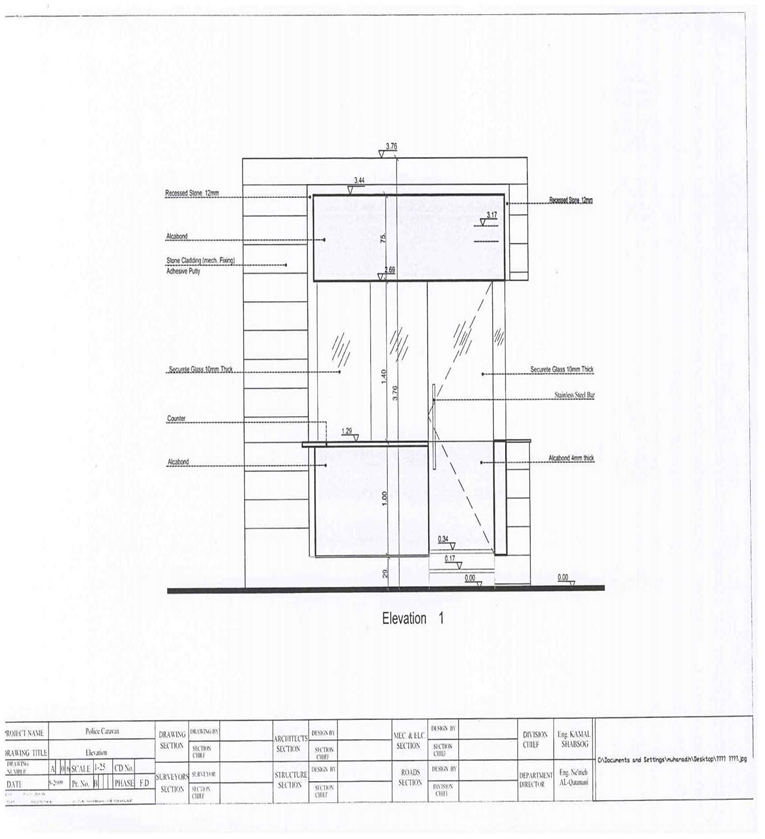
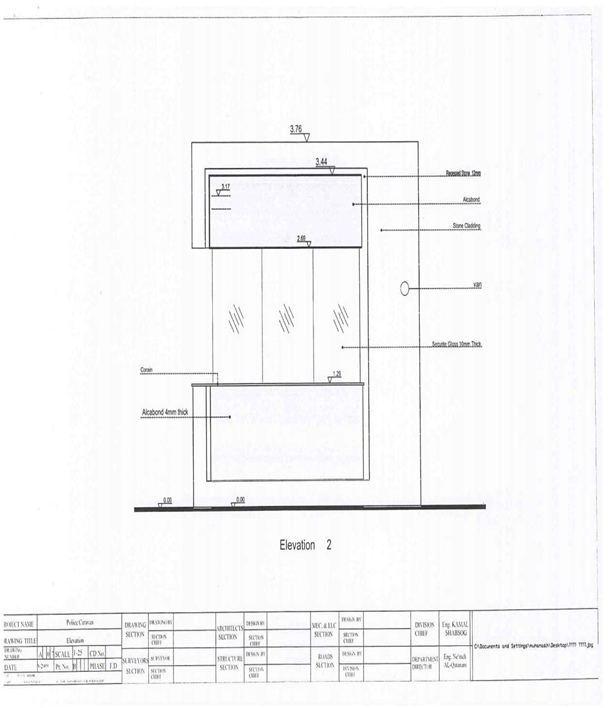
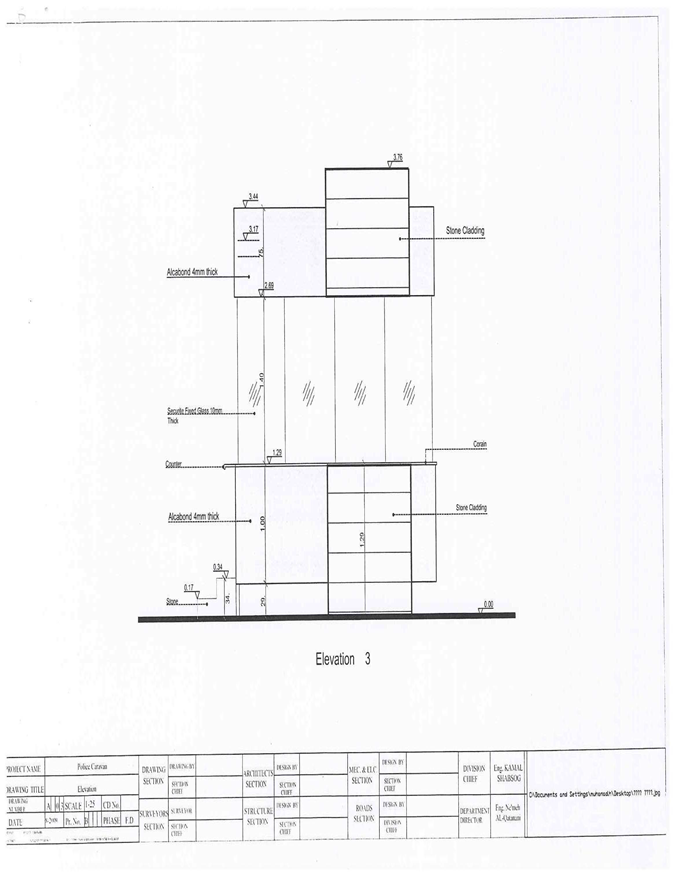
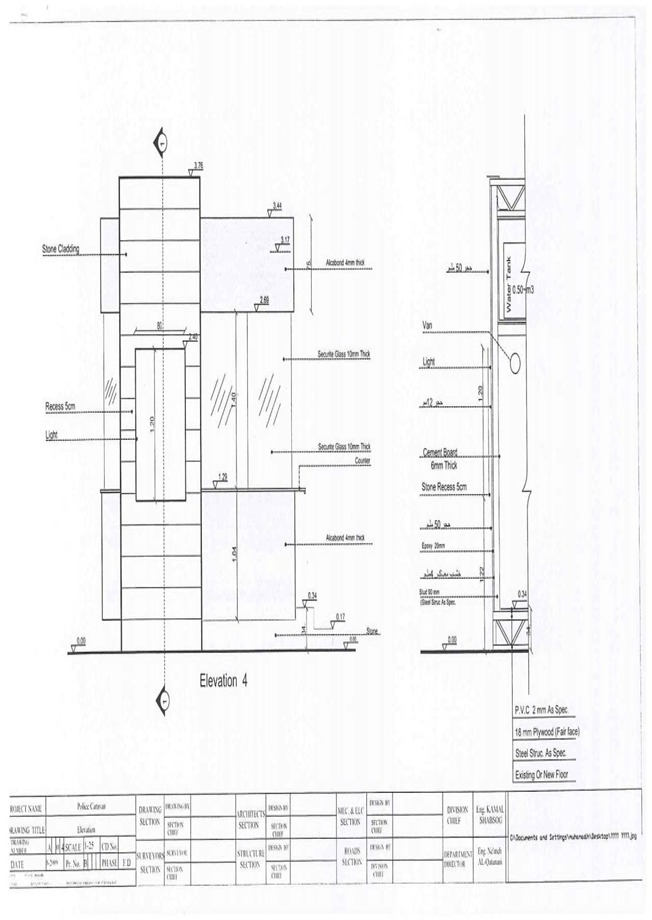
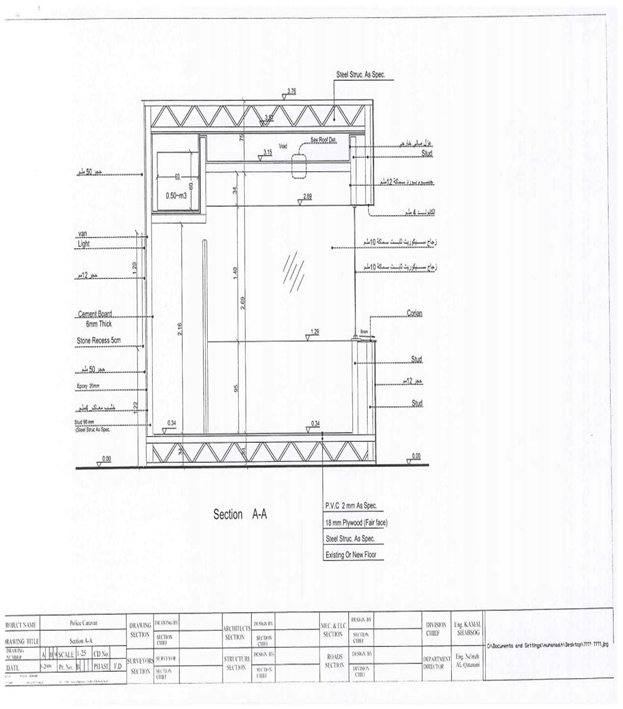
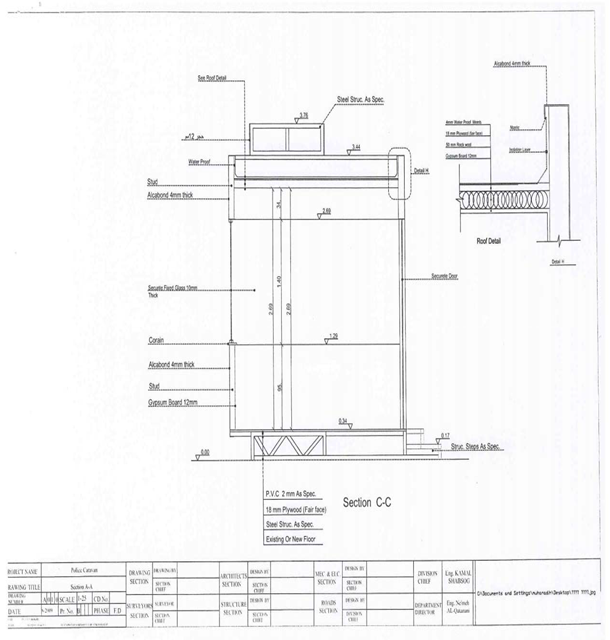
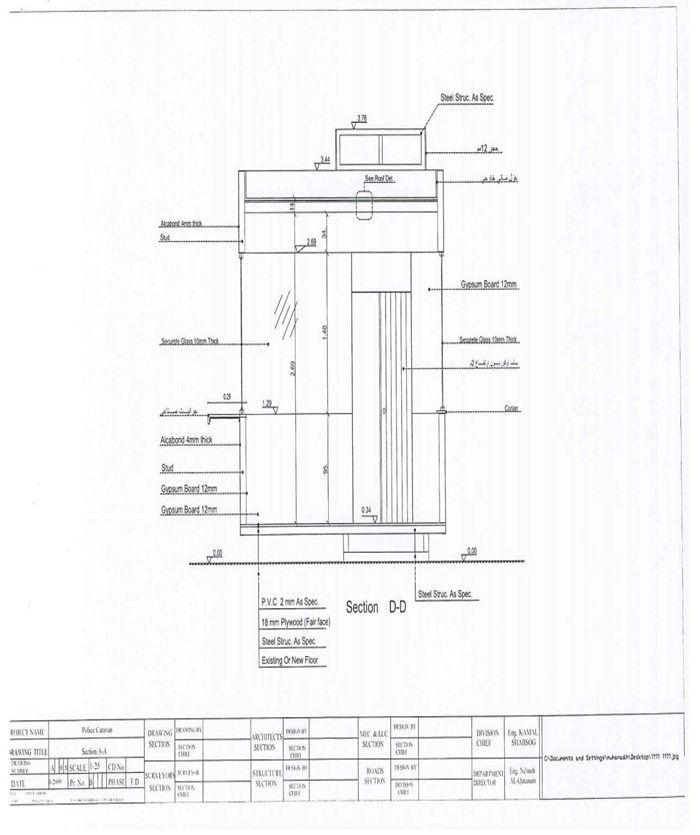
The operation cost includes the costing of two toll road methods: the manual method and the automatic toll machine method for the service road along main road. Specifically applied to the service road alongside the main thoroughfare of the airport road, this assessment underscores the importance of exploring various charging mechanisms to determine the most cost-effective approach that optimizes revenue generation. The manual method entails a detailed estimation of expenses, encompassing the deployment of monitoring cameras, booths, pavement markings, signage, and employee salaries during peak operational hours. Considering the airport road's three lanes, each section requires three booths, as illustrated in Figure 4. Thus, three monitoring cameras are installed in each section's three lanes to ensure efficient monitoring. Booths play a vital role in facilitating the payment process, occupying an area of approximately (3.10m × 3.66m). Detailed specifications of the booths are provided in Appendix D.
Different types of Toll Road Signs play pivotal roles in guiding drivers and providing essential information before they enter toll roads. These include Signs in Advance of the Toll Point, Signs at the Toll Point, Pavement Markings at the Toll Point, and Direction Signs. Signs in Advance of the Toll Point serve to inform drivers about approaching toll points, ensuring they are aware of upcoming toll booths. These signs are crucial in preparing drivers for toll payment and navigating through the toll road. They typically measure (2.5m×1.25m), with a sign column height of 4.5m. Signs at the Toll Point Positioned at toll points, these signs detail payment information and vehicle charges. With dimensions of (1.5m × 0.75m) and a sign column height of 4m. Signs at the Toll Point Positioned at toll points, these signs detail payment information and vehicle charges. With dimensions of (1.5m × 0.75m) and a sign column height of 4m. Signs at the Toll Point Positioned at toll points, these signs detail payment information and vehicle charges. With dimensions of (1.5m × 0.75m) and a sign column height of 4m. Pavement Markings at the Toll Point play a crucial role in guiding drivers within toll areas. These markings, characterized by a black legend on a yellow background, establish a visual connection with the TOLL patch on direction signs. They cover an area of (2m × 2.5m) and are instrumental in ensuring smooth traffic flow within toll plazas.
In addition, the poly vines cones are used to divide the lanes when the toll points are being installed. They are placed about 100 m before toll points. A cone is placed every 3m so the total cones required for the three lanes are 30. Three employees are required for the three lanes.
Conversely, the automatic toll machine system involves calculating the costs associated with toll machines, surveillance cameras, signage, and pavement markings. A camera is important in toll road operations to show more details of payment and to save a fine when vehicles not paying the charge. three cameras in three lanes in each section
3.8. Model Development
Utilizing the transportation planning software VISUM, an intervention with the urban transport network was modeled. PTV Group developed and maintains VISUM, a tactical modeling package for representing traffic flows in networks. Origin-destination matrices for various user classes to characterize the traffic demand and a geographically precise supply model that specifies a particular road network are the fundamental parts and inputs of the traffic planning software. Additional fundamental components of VISUM include distinct assignment protocols, which are necessary to connect supply-side and demand-side traffic. Estimated flows for each vehicle category on each network link are the outcome of the assignment procedure. While VISUM can also manage public transportation, this functionality was not included in these simulations because the demand for both public and private transportation is not very interdependent. Furthermore, compared to individual motorized traffic, calculation durations and data needs for public transport assignments are significantly higher. Owing to the strong supply-side interdependencies between passenger cars and freight traffic, both demand groups were included in our simulations. The underlying ideas of transport assignment models such as VISUM are illustrated in Figure 5.
To model the toll road, we created the required road along the route of Airport Road with link type 13 (Freeway speed 110 km/hr, 3 lanes) and edited the link to add the chosen toll charge for each vehicle type. For the service road, we adjusted the link type for the current Airport Road to provide a lower Level of Service (LOS), selecting road type 32 (Suburban dual 2, medium intersected). To incorporate the toll charge into the impedance calculation, we accessed the calculation procedures, opened the functions tab, and selected PrT, then Impedance. For each formula, we used Create and added 1*Toll PrTsys, adjusting the coefficient for Toll PrTsys to, e.g., 2 or 4, to set different tolls for goods vehicles. The toll was input in fils, and the impedance calculation was based on the value of time.
The toll charge must be added for each link, making it challenging to allow users to access different sections and all pay a fixed cost. To address this, we considered the following options:
Option 1: The toll road extends from the Foreign Ministry to the Airport with no intermediate entry points. This would result in lower traffic flow since the toll road would no longer serve South Amman.
Option 2: Three separate toll roads are created for each of the three entry/exit points for journeys to the airport (Foreign Ministry, Marj al Hamam Bridge, and Madaba Bridge). Congestion and speeds would need to be checked manually.
Option 3: Different tolls are applied to each section, so only vehicles traveling from the Foreign Ministry to the airport pay the full amount. Vehicles are charged for all the sections they use, requiring the definition of three link types.
Option 4: The toll is applied only to vehicles using the section from Madaba Bridge to the airport, restricting access to the toll road for those not using this section.
After testing all options, we found that due to the low levels of vehicles assigned to the toll road in 2012 and 2025, Option 1 was the most suitable. Subsequently, we tested Option 4 using two sections of the toll road. The toll was charged on the first section (from the Foreign Ministry to Madaba Bridge), and only vehicles using this section were allowed to use the second section (from Madaba Bridge to the airport). This configuration allowed the toll road to be accessed from Madaba Bridge for trips to or from Amman only.
The traffic infrastructure that is currently in place is represented in a simplified manner by the network model. It is made up of nodes with links between them. The regional location and connections of the nodes and links in the network model are first determined by the network structure that has to be mapped as detailed in Figure 6a and 6b. Furthermore, in VISUM, every network element can be given a set of unique properties. Equation 1 calculates the length of the stretch, the speed at which a vehicle may travel freely, the maximum capacity, and the proportion of the road that is congested for linkages. Figure 6c displays an example of a VISUM network.
% Traffic Congestion = Volume/(Capacity)×100 %
The number of trips (from / to traffic zone) for each origin-destination (O-D) pair is represented by fixed, typically symmetric matrices in VISUM, which is used to analyze travel demand. As a result, distinct transport demand segments (such as those for cars and trucks) can be distinguished. The alternate routes for the travel demand of an origin-destination pair are determined by the network's structure as well as the physical attributes of each individual route section. Usually, when modeling the simultaneous route choice of all road users, a mono-criteria method is used. This indicates that the various factors considered while selecting a route—such as travel durations, tolls, and trip times—are combined into a single value known as "generalized costs."
For every demand segment, average values of time and distance (VoT, VoD) must be stated in addition to link-specific conditions like a toll. This makes it possible to see a road user's route selection as a unique cost minimization issue. When using the same links to make trips for distinct O-D relations, the route chosen is reliant on each other. As a result, capacity-limited assignment techniques typically operate iteratively, beginning with an initial demand allocation on possible network paths that is frequently arbitrary. But in VISUM, a change in the overall costs—for example, because of a toll or newly constructed road—only affects route choice behavior and has no effect on demand levels. We exogenously modeled these effects on demand levels since the premise of a stable demand is impractical for greater changes in generalized costs.
4. Results and Discussions
4.1. Congestion Cost
The traffic volume data provided by the Ministry of Public Works and Housing (MPWH) allowed for the identification of morning (AM) peak period: 8:00 to 9:00. Engineering drawings from MPWH provided the estimated lengths of sections, and speed data (congested and uncongested) were also obtained from MPWH designs. Delays were calculated for each section by measuring the time difference between congestion and uncongested conditions. This information was then used to calculate the congestion cost caused by delays. The results are detailed in Table 4.
Based on MPWH data:
Average Traffic volume = 1392 + 2330 + 2153 + 1216 = 3,546 vehicles/hour
Total delay in 2011 = 2.4 + 1.65 = 4.05 min/vehicle
Yearly delay per vehicle = 255 * 4.05 = 17.21 hours
Total yearly delay for AM peak volume = 17.21 * 3,546 = 61,035.5 h-veh
Total cost = total delay × cost of time (hours)
Total cost = 61,035.5 * 1.21 (JD)
Total congestion cost due to delay time for 2011 = 73,853 JD
Similar calculations were conducted for 2012 ,2013 and 2024 for AM peak hours resulting in congestion costs of 107,141.5 JD ,91,459 JD and 7,094,446.6 respectively
Air resistance is a major component that affects fuel usage. A car's energy expenditure to overcome air resistance might reach 40%. Since air resistance increases exponentially with speed, the increase in air resistance during a 65 mph to 70 mph acceleration is greater than the increase during a 55 mph to 60 mph acceleration. More energy is needed to overcome greater air resistance, which increases fuel consumption.. For instance, accelerating from 65 mph to 70 mph requires significantly more energy than accelerating from 55 mph to 60 mph because air resistance rises exponentially with speed.
In our study, we analyzed fuel consumption across different speeds to illustrate this relationship. As shown in Figure 7 and Figure 8, we found that vehicles consume more fuel at both low and high speeds compared to an optimal speed. Specifically, at lower, congested speeds, vehicles are often forced to operate inefficiently due to frequent stops and slow-moving traffic, leading to higher fuel consumption. For example, vehicles traveling at an optimal speed of around 55 kph (kilometers per hour) tend to have better fuel efficiency because this speed strikes a balance between minimizing air resistance and maintaining steady, smooth driving conditions.
Conversely, when vehicles travel at lower speeds, such as those seen in congested traffic, they consume more fuel per kilometer. This is because constant acceleration and deceleration, idling, and lower engine efficiency contribute to higher fuel use. Our figures illustrate that vehicles traveling at congested speeds (such as 90 km/h in our study) have higher fuel consumption rates than those traveling at an optimal, steady speed of 55 kph. In our studied street the values of congested and uncongested speeds are 90 and 100 km/h, respectively, then Similar calculations were conducted for 2012, 2013 and 2024. resulting in fuel consumption costs, respectively, then total congestion cost as shown in Table 4 for AM peak hours.
At 90 km/hr (congested speed ), fuel economy = 30 mpg (mile/gallon).
At 100 km/hr (uncongested speed), fuel economy =28 mpg(mile/gallon).
Fuel wasted/ vehicle /km = 30- 28= 2 mile/gallon = .28 L/km.
Annual Fuel wasted cost by PC = .28 * 27 * 2,278 * 0.62 * 255= 2,722,747.6 JD
Annual Fuel wasted cost by HV = .28 * 27 *1,227 * 0.515 * 255= 1,218,186.5 JD.
4.2. Survey Questionnaire
The questionnaire was filled out through in-person, direct interviews. Decision-makers and other road users, including drivers, passengers, students, etc., participated in the sample.The goal of the field study was to gather various drivers and trip characteristics, hence it was carried out on weekdays (working days) during various working hours. In order to give the respondents all the time they needed to answer the questions, the majority of the interviews were conducted in offices of the Greater Amman Municipality, the Ministry of Works and Housing, the Land Transport Regulatory Commission, universities like Al-Isra'a, MEU, Petra, and Zaytouna, and roadside gas stations. To ensure that participants understood every aspect of congestion pricing, thorough explanations were given both during the interview and when completing the questionnaire. In order to avoid any doubt about the responses given, the interviewers thoroughly explained each question to the respondents.
After 650 questionnaires were completed, the responses were carefully examined, and 26 of the completed surveys were excluded from the analysis because they contained errors or inconsistent information. As a result, 624 questionnaires made up the final sample.
4.2.1. The Demographic and Socioeconomic Characteristics
This section includes questions related to the demographic and socioeconomic characteristics of the drivers; including: gender, age, household income and level of education obtained as shown in Table 5.
Table 5 shows that 53.7% of the sample were males while, 46.3% were female. The highest percentage of age groups was (37.2%) for the (25–34-year-old, and the lowest percentage was for group between 45-64 years & more than 65 years with about 19.0%.
Table 5 reveals that the category with highest percentage within the sample was students with (33.3%), and the percentage for employee reached (31.3%), while the lowest percentage was for the retired (4.5%). The highest percentages for education 57.7% of the sample were bachelor degrees, while the lowest percentage for uneducated with only (1.8%).
Table 5 also shows that the highest percentages of interviewees came from households of low-income brackets (250-500) with 29.3%, and for (500-750) reached 28.4%. The lowest percentage of respondents came from the highest income category; earning more than 1500JD was a mere 6.1%.
4.2.2. Trip Characteristics
This section involved information related to elements of respondents travel behavior with respect to their trip characteristics. In particular, the number of travel trips and the purpose of their trip. The necessity of obtaining such information is based on the assumption that traveler acceptability and willingness-to-pay for a congestion charging scheme is dependent on trip characteristics.
Driver trip characteristics were also analyzed and the results are presented in Table 6. The majority of drivers driving on Airport Road make work related trips (38.5%) and (35.4%) were on studying trips to the many universities on airport road, either in Amman or in the South of Jordan. The majority of trips were frequent trips, 2-4 times in a week (39.9%), because most workers and students come from the south to work in Amman or come from Amman to work in southern destinations like Aqaba.
Table 7 shows that the answer to the occurrence of congestion with the highest percentage of responses was “sometimes” which reached 59.9% (N=374) while the response “rarely” reached (32.2%); while the lowest percentage was for “always” (7.9% ). The last questions related to the road pricing charging method. About 54% of respondents chose the “Travelled Distance”. The most agreed upon response on the suitable value of toll was (0.25JD), with a percentage 34.8% as explained in Table 13.
4.2.3. The Advantages and Disadvantages of a Congestion Pricing Scheme
Statistical analysis by SPSS of the data extracted from the second section of the questionnaire elicited driver preferences in relation to the measure of road pricing. What needs to be considered together with the identified trends is that the survey participants have not experienced the implementation and effects of such a measure. Increased travel time was considered to be the most important effect of traffic congestion by the participants being followed by environmental pollution and deterioration of psychological calm.
The advantages and disadvantages of a congestion scheme as perceived by the road users provide an indication of user acceptability factors.
Table 8 and Table 9 illustrate drivers perceptions on the advantages and disadvantages of a congestion pricing scheme.
Table 8, users perceived improvement in environmental conditions as the most important advantage of a road pricing scheme (41.2% chose it as an important advantage) while the increase in use of transit came second with 38% selecting it as an important advantage.
The overall means and standard deviations of the responses are displayed in Table 9. The results indicate that the mean of Statement 2 (Applying road pricing reduces environmental pollution) was the highest (2.23) , with the standard deviation =0.738; followed by the overall mean of Statement 3 (Applying road pricing increase the use of transit) which was (2.20) , with a standard deviation =0.723 , while Statement 1 (Applying road pricing improves highway quality) had the lowest impact with a mean =2.15 and (0.703) standard deviation.
A one sample t-test was conducted to evaluate whether their mean was significant. The results are in Table 10. The sample mean (2.19) was significantly t (623)=10.390.
Most respondents (37%) explained that road pricing was not fair because people with low income are not able to afford to pay for every trip ; this makes sense wince most monthly household incomes of respondents were between (250-500 JD). Another disadvantage highlighted was loss of privacy with a percentage of (30.1%)as shown in Table 11.
A one sample t test was conducted of respondent sample about disadvantages of a congestion pricing to evaluate whether their mean was significant. The results are in Table 12. The sample mean (2.10) standard devation (0.593) was significant as t(623) =4.451.
4.2.4. The Details of Payment
This section included two questions about the best method to pay and the value of price. The objective of this section is to find the most suitable payment method and an acceptable fee or priceas shown in Table 13.
Table 13.
Road Pricing Characteristics.
| Value of Toll (JD) | Road Pricing Method | |||
|---|---|---|---|---|
| 0.25 | 34.80% | Travelled distance | 54.20% | |
| 0.5 | 25.50% | |||
| 0.75 | 7.70% | Travel time | 28.70% | |
| 1 | 20.80% | |||
| 1.25 | 7.10% | Type of vehicle | 17.10% | |
| 1.5 | 4.10% | |||
4.3. Costs of Road Pricing Scheme
The road pricing scheme encompasses two methods: the manual method and the automatic toll machine method, each requiring thorough cost estimation for comparison. In the manual method, costs include 12,000 JD per section for cameras, 27,000 JD for booths, and variable costs for signs and pavement markings. The signs at the toll point, for instance, amount to 303.75 JD each, while pavement markings cost 150 JD per lane. Direction signs are priced at 443.75 JD each, and PVC cones total 420 JD. Additionally, the monthly salary for three employees per section is 900 JD.
In contrast, the automatic toll machine method involves significant equipment costs. Each toll machine costs approximately 56,000 JD per section, with a total of three machines required. Cameras for this method amount to 12,000 JD per section. Similar to the manual method, signs and pavement markings incur costs, with advance signs estimated at 443.75 JD each and signs at the toll point at 303.75 JD each. Pavement markings cost 150 JD per lane, direction signs 443.75 JD each, and PVC cones 420 JD in total.
Two charging methods are explained. The costs of both methods are summarized in Table 14.
4.4. Outputs of Model Development
4.4.1. Modelling the Toll Road (2012)
In the AM peak hour model for 2012, the following outputs and results were obtained:
Travel Time Analysis: Table 15 summarizes the travel time between the Foreign Ministry and QAIA during the AM peak hour on both the main road and service road, in both directions. Notably, southbound travelers on the main road spend 16.76 minutes, while it takes 24.06 minutes on the service road in congested conditions. The difference in travel time between the two roads is 7.30 minutes. Similarly, in the northbound direction, the difference between the two roads is 4.88 minutes as detailed in Appendix E. Additionally, Figure 9 illustrates the difference between free-flow time and the current service time of the toll road.
- -
- Speed Analysis: Figure 10 depict the speed variations on the main road and the service road, respectively, during the AM peak hour. Speeds reach up to 107 km/h on the main road and 70 km/h on the service road.
- -
- Traffic Congestion Percentage: Figures 10 illustrate the percentage of traffic congestion during the AM peak hour on both the main road and the service road for 2012. Congestion levels are depicted as 179% in the northbound direction and 75% in the southbound direction on the main road. The service road experiences congestion starting at 153% and 70%, respectively, gradually decreasing along the distance.
4.4.2. Modelling the Toll Road (2025)
In the AM peak hour model for 2025, the following outputs and results were obtained. Detailed information can be found in Appendix E.
- -
- Travel Time Analysis: Table 16 summarizes the travel time between the Foreign Ministry and QAIA during the AM peak hour on both the main road and service road, in both directions. Notably, southbound travelers on the main road spend 33.83 minutes, while it takes 35.81 minutes on the service road in congested conditions. The difference in travel time between the two roads is 1.98 minutes. As for the northbound direction, the difference between the two roads is 10.13 minutes. Additionally, Figure 11 illustrates the difference between free-flow time and the current service time of the toll road.
- -
- Speed Analysis: Figure 12 depict the speed variations on the main road and the service road, respectively, during the AM peak hour. Speeds reach up to 70 km/h in the southbound direction and 60 km/h in the northbound direction on both roads. Furthermore, various model runs were conducted to maximize revenue. The toll price was set at 0.25 JD, resulting in reduced travel time to half its value in the northbound direction. Table 16 presents the travel time values with and without the imposed toll.
Users only pay tolls in the northbound direction, where travel time was reduced from 30.8 minutes to 14.53 minutes. As a result, 684 cars and 21 taxis utilized the toll road, generating revenue of 141 JD.
- -
- Traffic Congestion Percentage: Figures 12 illustrate the percentage of traffic congestion during the AM peak hour on both the main road and the service road for 2025. Congestion levels are depicted as 155% in the northbound direction and 155% in the southbound direction on the main road. The service road experiences congestion starting at 125% and 115%, respectively, gradually decreasing along the distance. Furthermore, multiple model runs were conducted to maximize revenue. The toll price was set at 0.2 JD. Table 16 presents the scenarios with different toll prices and their corresponding revenue. Additionally, Figure 13 shows the revenue values obtained from the different simulated models. seven scenarios were investigated to achieve the maximum revenue, which was about 1122.6 JD when the toll was set at 0.20 JD for cars and 0.40 JD for goods vehicles. Finally, Table 16 presents the difference in travel time with or without the toll. Travel time changed from 33.83 minutes to 14.20 minutes in the southbound direction and from 53.43 minutes to 15.51 minutes in the northbound direction.
5. Significance of the Study
The significance of toll roads in Jordan, particularly as outlined in this study, is primarily focused on addressing the significant congestion costs on Airport Road. This road has become a major traffic problem due to the increasing volume of vehicles and inadequate infrastructure. The study highlights the significant challenge of traffic congestion in Amman, especially along the Airport Highway, a crucial route in Jordan. This congestion is intensified by increasing traffic volumes due to Queen Alia International Airport, which serves as a main connection to southern Jordan, including major tourist sites like Petra and Aqaba, and the kingdom's only container port. With current and planned developments along this highway, traffic is expected to worsen.
While the Savonius wind turbine (SWT) study, which explored wind turbines along Queen Alia Airport Road, offers a valuable approach to renewable energy, its impact on directly alleviating traffic congestion is less immediate [42]. On the other hand, toll roads provide a more direct and immediate solution to addressing traffic congestion. This study stands out in its approach by focusing on practical solutions to traffic congestion, such as road pricing, and evaluating their feasibility through survey questionnaires and simulation tools like VISUM , whereas other approaches, like the cellular automata model study, delve into advanced simulation technology and its effects on traffic flow[43].
In contrast to other research that examines toll road strategies from profit-maximizing perspectives [44], local and federal government conflicts over non-price measures [45], and theoretical toll allocation methods [46], this study provides a real-world context and immediate solutions to congestion through toll implementation. Moreover, while other studies introduce innovative concepts like mobility consumption theory [47] and models for social welfare maximization in urban planning [48], the current study emphasizes the specific challenges of Jordan's Airport Road, supported by comprehensive data analysis and public feedback.
The current study analyzes the congestion costs for both historical and current years, revealing the growing expenses related to traffic and emphasizing the urgent need for a solution. It also calculates the initial operational costs of implementing a toll road system, considering the use of an alternative service road for toll pricing, making it a practical and cost-effective approach.
To evaluate the feasibility of toll roads, a comprehensive survey questionnaire was conducted, showing that the public is generally in favor of the idea. The survey data on toll pricing was then inputted into the VISUM software to simulate its impact on traffic flow and vehicle movement. This simulation helped analyze how tolls could change traffic patterns, reduce congestion, and improve overall transportation efficiency. The potential revenue from toll roads was compared with the initial costs to determine economic viability, with positive results supporting the implementation of toll roads.
By examining traffic data from past, present, and future years, the study offers a detailed understanding of traffic trends, which is crucial for future transportation planning. The detailed analysis, practical solutions, and favorable public feedback underscore the importance of toll roads as a strategic solution to manage congestion and enhance traffic flow on Jordan's Airport Road. The study highlights that toll roads could be a feasible and beneficial improvement for Jordan’s transportation system.
6. Conclusions and Recommendations
The study highlights the significant challenge of traffic congestion in Amman, particularly along the Airport Highway, a vital route in Jordan. To evaluate the feasibility of toll roads as a solution, a comprehensive survey questionnaire was conducted, which revealed broad public support for the concept. Data from the survey on toll pricing were then inputted into VISUM software to simulate the impact on traffic flow and vehicle movement.
This simulation enabled an assessment of how tolls might influence traffic patterns, reduce congestion, and enhance overall transportation efficiency. By comparing the potential revenue from toll roads with the initial implementation costs, the study assessed their economic viability. Therefore, the study concludes the findings in main points presented below:
- The study calculated congestion costs for the years 2011, 2012, 2013, and 2024, revealing a consistent annual increase. The results show that congestion costs have been rising each year. For the current year (2024), congestion costs due to delay time and wasted fuel consumption were estimated at 7,094,446.6 JD during the AM peak hour. To address this issue, the study proposed implementing road pricing as a potential solution.
- To evaluate public acceptance of road pricing, a questionnaire was administered, revealing a higher inclination towards such schemes, particularly during peak hours for commuting or education purposes. Environmental benefits were cited as a primary advantage by 41% of respondents, while about 30% expressed concerns about privacy reduction. The preferred charging method was based on traveled distance, with a suggested toll value of 0.25 JD, perceived as fair, particularly considering its potential impact on low-income groups.
- Two models were utilized in the study for old and future years (2012 AM, 2025 AM). The economic feasibility of implementing road pricing in 2025 was assessed, indicating a total cost of 126,935 JD using the manual method and 873,935 JD using automatic toll machines, with an expected revenue of 269,424 JD. Manual toll collection appeared economically viable. However, in 2012, the system was deemed ineffective due to low revenue (141 JD daily during the AM peak hour), outweighed by the substantial implementation costs.
- The reduction in travel time, from approximately 33.83 min to 14.20 min in the southbound direction and from 53.43 min to 15.51 min in the northbound direction, demonstrates positive economic effects. Moreover, reduced travel time yields environmental benefits, such as decreased emissions and noise pollution.
- Practical recommendations include extending the toll road solution to other congested routes within Amman, such as AlMadina Almonawarah Street and Queen Rania Street. Additionally, implementing toll roads on crucial links like Alordon Street, connecting Amman to northern cities, could alleviate congestion and reduce accidents, enhancing overall traffic flow and safety. Future research could explore the applicability of road pricing solutions to other major highways, like the Desert Highway, to further alleviate congestion and improve transportation efficiency across Jordan.
Author Contributions
Conceptualization, Methodology, Amani Abdallah Assolie. Data curation, Writing- Original draft preparation, Amani Abdallah Assolie; Visualization, Investigation, Amani Abdallah Assolie ; Supervision, Rana Imam, Ibrahim Khliefat ; Software, , Amani Abdallah Assolie; Writing- Reviewing and Editing. ,Amani Abdallah Assolie, Rana Imam, Ibrahim Khliefat, and Ala Alobeidyeen .All authors have read and agreed to the published version of the manuscript.
Data Availability Statement
Data is contained within the article. The data presented in this study are as shown in the article.
Acknowledgments
The authors would like to thank Central Traffic Department in Greater Amman Municipality for providing the data and all information in this research.
Conflicts of Interest
The authors declare no conflict of interest.
List of Abbreviations
| CTD | Central Traffic Department |
| GAM | Greater Amman Municipality |
| HCM | Highway Capacity Manual |
| LOS | Level of Service |
| QAIA | Queen Alia International Airport |
| MTC | Manual Toll Collection |
| ETC | Electronic Toll Collection |
| MPWH | Ministry of Public Works and Housing |
Appendix A. Traffic Data Used in This Study
| Traffic data used for the year 2025 | ||||||||||
| From Foreign Ministry to Marj al-Hamam Bridge | ||||||||||
| Number of segments | Travelling South | Travelling North | ||||||||
| % Congested | Current speed (km/h) | Free flow time (S) | Current time (s) | Distance (km) | % Congested | Current speed (km/h) | Free flow time (S) | Current time (s) | Distance (km) | |
| L1 | 152 | 20 | 17 | 71 | 0.3944 | 153 | 18 | 17 | 73 | 0.3650 |
| L2 | 121 | 36 | 12 | 28 | 0.2800 | 166 | 15 | 12 | 69 | 0.2875 |
| L3 | 121 | 36 | 44 | 98 | 0.9800 | 166 | 15 | 44 | 236 | 0.9833 |
| L4 | 128 | 31 | 13 | 34 | 0.2927 | 176 | 12 | 13 | 88 | 0.2933 |
| L5 | 128 | 31 | 11 | 28 | 0.2411 | 176 | 12 | 11 | 72 | 0.2400 |
| L6 | 125 | 33 | 20 | 49 | 0.4491 | 156 | 18 | 20 | 92 | 0.4600 |
| L7 | 125 | 33 | 17 | 40 | 0.3666 | 156 | 18 | 17 | 75 | 0.3750 |
| L8 | 103 | 48 | 37 | 62 | 0.8266 | 143 | 23 | 37 | 128 | 0.8177 |
| L9 | 103 | 48 | 16 | 27 | 0.3600 | 143 | 23 | 16 | 57 | 0.3641 |
| Total | 187 | 437 | 4.1908 | 187 | 890 | 4.1861 | ||||
| From Marj al-Hamam Bridge to Madaba Bridge | ||||||||||
| Travelling South | Travelling North | |||||||||
| L10 | 153 | 18 | 21 | 109 | 0.5450 | 182 | 10 | 21 | 201 | 0.5583 |
| L11 | 115 | 39 | 11 | 25 | 0.27080 | 133 | 27 | 11 | 37 | 0.2775 |
| L12 | 115 | 39 | 22 | 51 | 0.5525 | 133 | 27 | 22 | 74 | 0.5550 |
| L13 | 115 | 39 | 23 | 55 | 0.59580 | 133 | 27 | 23 | 79 | 0.5925 |
| L14 | 121 | 34 | 13 | 36 | 0.3400 | 133 | 27 | 13 | 45 | 0.3375 |
| L15 | 121 | 34 | 32 | 84 | 0.7933 | 133 | 27 | 32 | 109 | 0.8175 |
| L16 | 122 | 33 | 31 | 85 | 0.7791 | 139 | 23 | 31 | 122 | 0.7794 |
| L17 | 122 | 34 | 18 | 48 | 0.4533 | 155 | 17 | 18 | 96 | 0.45333 |
| L18 | 122 | 34 | 4 | 11 | 0.10389 | 155 | 17 | 4 | 22 | 0.1038 |
| L19 | 103 | 61 | 37 | 68 | 1.1522 | 148 | 25 | 37 | 167 | 1.1597 |
| L20 | 103 | 61 | 18 | 33 | 0.5591 | 148 | 25 | 18 | 81 | 0.5625 |
| L21 | 94 | 71 | 7 | 11 | 0.2169 | 147 | 25 | 7 | 32 | 0.2222 |
| L22 | 94 | 71 | 27 | 42 | 0.8283 | 147 | 25 | 27 | 119 | 0.8263 |
| L23 | 90 | 74 | 24 | 36 | 0.7400 | 115 | 49 | 24 | 56 | 0.7622 |
| L24 | 90 | 74 | 25 | 37 | 0.7605 | 115 | 49 | 25 | 57 | 0.7758 |
| L25 | 114 | 50 | 12 | 28 | 0.3888 | 106 | 58 | 12 | 24 | 0.3866 |
| L26 | 114 | 50 | 10 | 22 | 0.3055 | 106 | 58 | 10 | 19 | 0.3061 |
| L27 | 114 | 50 | 47 | 104 | 1.4444 | 106 | 58 | 47 | 90 | 1.4500 |
| Total | 382 | 885 | 10.8300 | 382 | 1430 | 10.9266 | ||||
| From Madaba bridge to Airport | ||||||||||
| Travelling South | Travelling North | |||||||||
| L28 | 111 | 53 | 35 | 72 | 1.0600 | 117 | 47 | 35 | 81 | 1.0575 |
| L29 | 111 | 52 | 41 | 88 | 1.2711 | 125 | 40 | 41 | 114 | 1.2666 |
| L30 | 111 | 52 | 82 | 173 | 2.4988 | 125 | 40 | 82 | 226 | 2.5111 |
| L31 | 111 | 52 | 47 | 99 | 1.4300 | 125 | 40 | 47 | 130 | 1.4444 |
| L32 | 111 | 52 | 15 | 32 | 0.4622 | 125 | 40 | 15 | 42 | 0.4666 |
| L33 | 111 | 53 | 66 | 138 | 2.0316 | 118 | 46 | 66 | 157 | 2.0061 |
| L34 | 94 | 70 | 20 | 31 | 0.6027 | 109 | 55 | 20 | 40 | 0.6111 |
| L35 | 94 | 70 | 21 | 33 | 0.6416 | 109 | 55 | 21 | 42 | 0.6416 |
| L36 | 94 | 70 | 27 | 42 | 0.8166 | 109 | 55 | 27 | 54 | 0.8250 |
| Total | 354 | 708 | 10.8150 | 354 | 886 | 10.8302 | ||||
| Traffic data used for the year 2012 | ||||||||||
| From Foreign Ministry to Marj al-Hamam Bridge | ||||||||||
| Number of segments | Travelling South | Travelling North | ||||||||
| % Congested | Current speed (km/h) | Free flow time (s) | Current time (s) | Distance (km) | % Congested | Current speed (km/h) | Free flow time (s) | Current time (s) | Distance (km) | |
| L1 | 112 | 41 | 55 | 122 | 1.3894 | 163 | 14 | 55 | 356 | 1.3840 |
| L2 | 162 | 15 | 17 | 105 | 0.4375 | 80 | 68 | 17 | 22 | 0.41550 |
| L3 | 155 | 17 | 9 | 53 | 0.2502 | 79 | 69 | 9 | 12 | 0.2300 |
| L4 | 116 | 38 | 43 | 104 | 1.0977 | 59 | 81 | 43 | 48 | 1.0800 |
| L5 | 116 | 38 | 37 | 90 | 0.9500 | 59 | 81 | 37 | 42 | 0.9450 |
| Total | 161 | 474 | 4.1250 | 161 | 480 | 4.0550 | ||||
| From Marj al-Hamam Bridge to Madaba Bridge | ||||||||||
| Travelling South | Travelling North | |||||||||
| L6 | 96 | 54 | 21 | 35 | 0.5250 | 72 | 74 | 21 | 26 | 0.5344 |
| L7 | 96 | 54 | 11 | 18 | 0.2700 | 72 | 74 | 11 | 13 | 0.2672 |
| L8 | 96 | 54 | 22 | 36 | 0.5400 | 72 | 74 | 22 | 27 | 0.5550 |
| L9 | 89 | 61 | 69 | 102 | 1.72830 | 66 | 78 | 69 | 80 | 1.7333 |
| L10 | 89 | 61 | 31 | 46 | 0.7794 | 66 | 78 | 31 | 36 | 0.7800 |
| L11 | 89 | 61 | 18 | 26 | 0.4405 | 66 | 78 | 18 | 20 | 0.4333 |
| L12 | 88 | 62 | 4 | 6 | 0.1033 | 66 | 77 | 4 | 4 | 0.0855 |
| L13 | 54 | 84 | 13 | 14 | 0.3266 | 37 | 88 | 13 | 13 | 0.3177 |
| L14 | 54 | 84 | 13 | 14 | 0.3266 | 37 | 88 | 13 | 13 | 0.3177 |
| L15 | 54 | 84 | 33 | 35 | 0.8166 | 37 | 88 | 33 | 33 | 0.8066 |
| L16 | 54 | 84 | 38 | 41 | 0.9566 | 37 | 88 | 38 | 39 | 0.9533 |
| L17 | 54 | 84 | 11 | 12 | 0.2800 | 37 | 88 | 11 | 11 | 0.2688 |
| L18 | 46 | 106 | 5 | 5 | 0.14722 | 31 | 109 | 5 | 5 | 0.1513 |
| L19 | 46 | 106 | 69 | 72 | 2.1200 | 31 | 109 | 69 | 70 | 2.1194 |
| L20 | 46 | 106 | 47 | 49 | 1.4427 | 31 | 109 | 47 | 48 | 1.4533 |
| Total | 405 | 511 | 10.8033 | 405 | 438 | 10.7775 | ||||
| From Madaba bridge to Airport | ||||||||||
| Travelling South | Travelling North | |||||||||
| L21 | 36 | 108 | 76 | 78 | 2.3400 | 40 | 107 | 76 | 78 | 2.31830 |
| L22 | 36 | 108 | 41 | 42 | 1.2600 | 40 | 107 | 41 | 42 | 1.24830 |
| L23 | 36 | 108 | 103 | 105 | 3.1500 | 40 | 107 | 103 | 106 | 3.15050 |
| L24 | 36 | 108 | 134 | 137 | 4.1100 | 40 | 107 | 134 | 138 | 4.10160 |
| Total | 354 | 362 | 10.8600 | 354 | 364 | 10.8188 | ||||
(Note : % Congested =Volume*100/ Capacity)
Appendix B. Regression Model for Average Annual Income Prediction
Source: Department of Statistics.
Model parameters:
| Upper bound (95%) | Lower bound (95%) | Pr > |t| | t | Standard error | Value | Source |
| -298083.745 | -515532.015 | 0.004 | -16.099 | 25269.094 | -406807.880 | Intercept |
| 257.988 | 149.832 | 0.004 | 16.224 | 12.569 | 203.910 | YEAR |
Equation of the model:
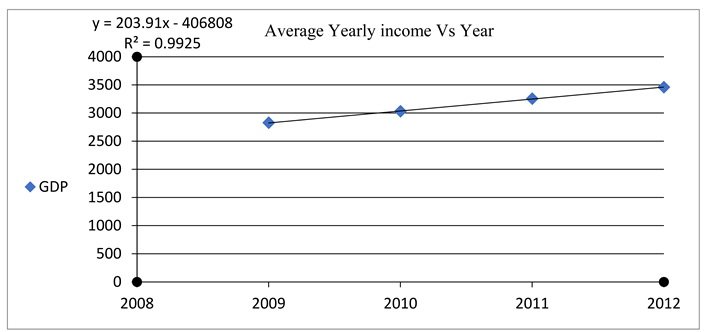
GDP = -406807.88+203.91*YEAR
For the year 2013 , and based on the model before GDP = 3662.83 JD
Appendix C. Questionnaire about Feasibility of Applying Road Pricing on Airport Road
.
Gender:
- ○
 Male
Male- ○
- Femal
Age:
- ○
- 18-24
- ○
- 25-34
- ○
- 35-44
- ○
- 45-54
- ○
- 55-64
- ○
- more than 65
Employment:
- ○
- Employee
- ○
- Self-Employee
- ○
- Un-Employee
- ○
- Retired
- ○
- Student
Education:
- ○
- Unenlightened
- ○
- School
- ○
- Diploma
- ○
- Master
- ○
- Ph.D.
Household Income:
- ○
- less than 250
- ○
- 250-500
- ○
- 500-750
- ○
- 750-1000
- ○
- 1000-1500
- ○
- more than 1500
The number of trips:
- ○
- Never
- ○
- less than 2 in a week
- ○
- 2-4 in a week
- ○
- more than 4 times in a week
- ○
- Every day
The purpose of using the Airport Road:
- ○
- Employment.
- ○
- Travel
- ○
- Education.
- ○
- Visiting family/Friends.
There is congestion on the Airport Road:
- ○
- Rarely
- ○
- sometimes
- ○
- Always
Applying of road pricing reduce the traffic congestion:
- ○
- in a small effect
- ○
- in a moderate effect
- ○
- in A high effect
Applying of road pricing increase the public transit :
- ○
- in a small effect
- ○
- in a moderate effect
- ○
- in a high effect
Applying of road pricing increase the quality of road:
- ○
- in a small effect
- ○
- in a moderate effect
- ○
- in a high effect
Applying of road pricing reduces the environmental pollution:
- ○
- in a small effect
- ○
- in a moderate effect
- ○
- in a high effect
Applying of road pricing not fair :
- ○
- in a small effect
- ○
- in a moderate effect
- ○
- in a high effect
Applying of road pricing loss of privacy:
- ○
- in a small effect
- ○
- in a moderate effect
- ○
- in a high effect
The factor to determine the price:
- ○
- travel distance
- ○
- travel time
- ○
- Type of vehicle
The suitable of price on the Airport Road:
- ○
- .25 JD
- ○
- .50 JD
- ○
- .75 JD
- ○
- 1 JD
- ○
- 1.25 JD
- ○
- 1.50 JD
Appendix D. THE Layouts OF Toll Booths
Appendix E. The Outputs of VISUM Model with Toll Road
| The outputs of VISUM Model with Toll Road for the year 2025 | ||||||||||
| From Foreign Ministry to Marj al-Hamam Bridge | ||||||||||
| Number of sections | Travelling South | Travelling North | ||||||||
| % Congested | Current speed (km/h) | Free flow time (S) | Current time (s) | Distance (km) | % Congested | Current speed (km/h) | Free flow time (S) | Current time (s) | Distance (km) | |
| L1 | 126 | 17 | 20 | 83 | 0.3919 | 115 | 20 | 20 | 68 | 0.3777 |
| L2 | 93 | 32 | 14 | 32 | 0.2844 | 126 | 17 | 14 | 62 | 0.2927 |
| L3 | 93 | 32 | 50 | 111 | 0.9866 | 127 | 17 | 50 | 212 | 1.0011 |
| L4 | 102 | 27 | 15 | 40 | 0.2925 | 138 | 13 | 15 | 81 | 0.3000 |
| L5 | 102 | 27 | 12 | 33 | 0.2475 | 138 | 13 | 12 | 66 | 0.2475 |
| L6 | 100 | 28 | 23 | 60 | 0.4666 | 119 | 19 | 23 | 87 | 0.4666 |
| L7 | 100 | 28 | 19 | 49 | 0.3811 | 119 | 19 | 19 | 72 | 0.3811 |
| L8 | 79 | 40 | 42 | 75 | 0.8333 | 108 | 24 | 42 | 126 | 0.8333 |
| L9 | 79 | 40 | 19 | 33 | 0.3666 | 108 | 24 | 19 | 56 | 0.3666 |
| Total | 214 | 516 | 4.2508 | 214 | 830 | 4.2669 | ||||
| From Marj al-Hamam Bridge to Madaba Bridge | ||||||||||
| Travelling South | Travelling North | |||||||||
| L10 | 124 | 19 | 27 | 99 | 0.5225 | 144 | 13 | 27 | 142 | 0.5127 |
| L11 | 87 | 40 | 14 | 25 | 0.2777 | 98 | 32 | 14 | 31 | 0.2755 |
| L12 | 87 | 40 | 28 | 50 | 0.5555 | 98 | 32 | 28 | 61 | 0.5422 |
| L13 | 87 | 40 | 30 | 54 | 0.6000 | 98 | 32 | 30 | 66 | 0.5866 |
| L14 | 94 | 35 | 17 | 35 | 0.3402 | 98 | 32 | 17 | 38 | 0.3377 |
| L15 | 94 | 35 | 41 | 82 | 0.7972 | 98 | 32 | 41 | 90 | 0.8000 |
| L16 | 95 | 34 | 40 | 83 | 0.7838 | 104 | 29 | 40 | 99 | 0.7975 |
| L17 | 95 | 34 | 23 | 47 | 0.4438 | 119 | 21 | 23 | 75 | 0.4375 |
| L18 | 95 | 34 | 5 | 11 | 0.1038 | 119 | 21 | 5 | 17 | 0.0991 |
| L19 | 75 | 58 | 59 | 71 | 1.1438 | 109 | 32 | 59 | 128 | 1.1377 |
| L20 | 75 | 58 | 28 | 34 | 0.5477 | 108 | 32 | 28 | 61 | 0.5422 |
| L21 | 67 | 65 | 11 | 12 | 0.2166 | 107 | 33 | 11 | 24 | 0.2200 |
| L22 | 67 | 65 | 43 | 46 | 0.8305 | 107 | 33 | 43 | 91 | 0.8341 |
| L23 | 63 | 68 | 39 | 40 | 0.7555 | 75 | 58 | 39 | 47 | 0.7572 |
| L24 | 63 | 68 | 40 | 41 | 0.7744 | 75 | 58 | 40 | 48 | 0.7733 |
| L25 | 86 | 49 | 20 | 28 | 0.3811 | 59 | 70 | 20 | 20 | 0.3888 |
| L26 | 86 | 49 | 15 | 22 | 0.2994 | 59 | 70 | 15 | 15 | 0.2916 |
| L27 | 86 | 49 | 74 | 106 | 1.4427 | 59 | 70 | 74 | 74 | 1.4388 |
| Total | 554 | 886 | 10.8172 | 554 | 1127 | 10.7733 | ||||
| From Madaba bridge to Airport | ||||||||||
| Travelling South | Travelling North | |||||||||
| L28 | 79 | 54 | 55 | 70 | 1.05 | 72 | 61 | 55 | 63 | 1.0675 |
| L29 | 85 | 50 | 65 | 92 | 1.2777 | 74 | 59 | 65 | 78 | 1.2783 |
| L30 | 85 | 50 | 129 | 182 | 2.5277 | 74 | 59 | 129 | 154 | 2.5238 |
| L31 | 85 | 50 | 74 | 104 | 1.4444 | 74 | 59 | 74 | 88 | 1.4422 |
| L32 | 85 | 50 | 24 | 34 | 0.4722 | 74 | 59 | 24 | 29 | 0.4752 |
| L33 | 84 | 50 | 104 | 145 | 2.0138 | 71 | 61 | 104 | 119 | 2.0163 |
| L34 | 70 | 62 | 31 | 35 | 0.6027 | 59 | 70 | 31 | 31 | 0.6027 |
| L35 | 70 | 62 | 33 | 37 | 0.6372 | 70 | 62 | 33 | 37 | 0.6372 |
| L36 | 70 | 62 | 42 | 48 | 0.8266 | 59 | 70 | 42 | 42 | 0.8166 |
| Total | 557 | 747 | 10.8527 | 557 | 641 | 10.8602 | ||||
| The outputs of VISUM Model with Toll Road for the year 2025 | ||||||||||
| From Foreign Ministry to Marj al-Hamam Bridge | ||||||||||
| Number of sections | Travelling South | Travelling North | ||||||||
| % Congested | Current speed (km/h) | Free flow time (s) | Current time (s) | Distance (km) | % Congested | Current speed (km/h) | Free flow time (s) | Current time (s) | Distance (km) | |
| L1 | 70 | 51 | 71 | 98 | 1.3883 | 158 | 11 | 71 | 468 | 1.4300 |
| L2 | 77 | 46 | 21 | 33 | 0.4216 | 147 | 13 | 21 | 120 | 0.4333 |
| L3 | 81 | 43 | 12 | 20 | 0.2388 | 138 | 15 | 12 | 58 | 0.2416 |
| L4 | 62 | 57 | 56 | 69 | 1.0925 | 93 | 36 | 56 | 110 | 1.1000 |
| L5 | 62 | 57 | 48 | 60 | 0.9500 | 93 | 36 | 48 | 95 | 0.9500 |
| Total | 208 | 280 | 4.0913 | 208 | 851 | 4.1550 | ||||
| From Marj al-Hamam Bridge to Madaba Bridge | ||||||||||
| Travelling South | Travelling North | |||||||||
| L6 | 63 | 56 | 27 | 34 | 0.5288 | 92 | 37 | 27 | 52 | 0.5344 |
| L7 | 63 | 56 | 14 | 17 | 0.2644 | 92 | 37 | 14 | 27 | 0.2775 |
| L8 | 63 | 56 | 28 | 35 | 0.5444 | 92 | 37 | 28 | 54 | 0.5550 |
| L9 | 57 | 61 | 89 | 102 | 1.7283 | 82 | 43 | 89 | 146 | 1.7438 |
| L10 | 57 | 61 | 40 | 46 | 0.7794 | 82 | 43 | 40 | 67 | 0.8002 |
| L11 | 57 | 61 | 23 | 26 | 0.4405 | 82 | 43 | 23 | 38 | 0.4538 |
| L12 | 60 | 58 | 5 | 6 | 0.0933 | 83 | 42 | 5 | 8 | 0.0966 |
| L13 | 32 | 70 | 17 | 17 | 0.3305 | 35 | 70 | 17 | 17 | 0.3305 |
| L14 | 32 | 70 | 16 | 16 | 0.3111 | 35 | 70 | 16 | 16 | 0.3111 |
| L15 | 32 | 70 | 42 | 42 | 0.8166 | 35 | 70 | 42 | 42 | 0.8166 |
| L16 | 32 | 70 | 49 | 49 | 0.9527 | 35 | 070 | 49 | 49 | 0.9527 |
| L17 | 32 | 70 | 14 | 14 | 0.2722 | 35 | 70 | 14 | 14 | 0.2722 |
| L18 | 26 | 70 | 8 | 8 | 0.1555 | 29 | 70 | 8 | 8 | 0.1555 |
| L19 | 26 | 70 | 109 | 109 | 2.1194 | 29 | 70 | 109 | 109 | 2.1194 |
| L20 | 26 | 70 | 74 | 74 | 1.4388 | 29 | 70 | 74 | 74 | 1.4388 |
| Total | 555 | 595 | 10.7766 | 555 | 721 | 10.8588 | ||||
| From Madaba bridge to Airport | ||||||||||
| Travelling South | Travelling North | |||||||||
| L21 | 39 | 70 | 120 | 120 | 2.333 | 21 | 70 | 120 | 120 | 2.3333 |
| L22 | 39 | 70 | 75 | 75 | 1.4583 | 21 | 70 | 75 | 75 | 1.4583 |
| L23 | 39 | 70 | 162 | 162 | 3.1500 | 21 | 70 | 162 | 162 | 3.1500 |
| L24 | 39 | 70 | 212 | 212 | 4.1222 | 21 | 70 | 212 | 212 | 4.1222 |
| Total | 569 | 569 | 11.0638 | 569 | 569 | 11.0638 | ||||
References
- Szczuraszek, T. and R. Klusek. Influence on the Type of Intersection on Road Traffic Safety in Poland. in IOP Conference Series: Materials Science and Engineering. 2019. IOP Publishing.
- Pilko, H., S. Mandžuka, and D. Barić, Urban single-lane roundabouts: A new analytical approach using multi-criteria and simultaneous multi-objective optimization of geometry design, efficiency and safety. Transportation Research Part C: Emerging Technologies, 2017. 80: p. 257-271. [CrossRef]
- Shah, R., et al. 67. Traffic Analysis Evaluate and Signalize the Existing Roundabout using Ptv Vissim Software. in 1ST INTERNATIONAL CONFERENCE ON RECENT ADVANCES IN CIVIL AND EARTHQUAKE ENGINEERING (ICCEE-2021)–OCT 08, 2021. 2021.
- Owais, M., O. Abulwafa, and Y.A. Abbas, When to decide to convert a roundabout to a signalized intersection: simulation approach for case studies in Jeddah and Al-Madinah. Arabian Journal for Science and Engineering, 2020. 45(10): p. 7897-7914. [CrossRef]
- Shatnawi, A., et al., Analyzing the Effect of Driving Speed on the Performance of Roundabouts. 2022. [CrossRef]
- Zhou, L., L. Zhang, and C.S. Liu, Comparing Roundabouts and Signalized Intersections Through Multiple-Model Simulation. IEEE Transactions on Intelligent Transportation Systems, 2021. [CrossRef]
- Fatimah, S. and S.A. Matondang, Simulation Model to Reduce the Traffic Jams with a Stochastic Program. WSEAS Transactions on Environment and Development, 2022. 18: p. 37-41. [CrossRef]
- Assolie, A. A., Sukor, N. S. A., Khliefat, I., & Abd Manan, T. S. B. (2023). Modeling of Queue Detector Location at Signalized Roundabouts via VISSIM Micro-Simulation Software in Amman City, Jordan. Sustainability, 15(11), 8451. [CrossRef]
- AlKofahi, N. and T. Khedaywi, Trends and Modeling of Traffic Accidents in Jordan. INTERNATIONAL JOURNAL OF ENGINEERING AND TECHNOLOGY (IJET), 2019. 11: p. 1166-1181.
- Hazim, N. and M.R. Hassan, Improving Traffic Incident Management Using Intelligent Transportation Systems, A Case of Amman City. Turkish Journal of Computer and Mathematics Education, 2021. 12(12): p. 4343-4352.
- Abid, R.I., A. Tortum, and A. Atalay, Fractal Dimensions of Road Networks in Amman Metropolitan Districts. Alexandria Engineering Journal, 2021. 60(4): p. 4203-4212. [CrossRef]
- Hau, T.D. (1992) Economic Fundamentals Of Road Pricing: A Diagrammatic Analysis. World Bank Policy Research Working Paper Series, WPS No. 1070, The World Bank, Washington, D.C.pp.
- Chin, K. (2002). Road pricing Singapore’s experience. Essay prepared for the third seminar of the IMPRINT-EUROPE Thematic Network. Land Transport Authority, Singapore.
- TFK (2002) ITSCost – Installations-, drifts- och underhållskostnader för ITS. TFK Rapport 2002:X, in print.
- Gorpe, P. (2001) Dags för trängselavgifter i Stockholmstrafiken - Referat från en konferens. Vinnovarapport VR 2001:28.
- Larsen, O.I. and Hamre. T.N. (2000) Tidsdifferentiering av satsene for bompengeringene i Oslo. TÖI notat 1155/2000.
- Xie , L. and Olszewski , P. (2011).Modelling the effects of Road Pricing on Traffic using ERP traffic data . Transportation Research A , 45, pp. 512-522. [CrossRef]
- Johansson,O.(1997).Optimal Road-Pricing: Simultaneous Treatment of Time Losses, increased Fuel consumption, and Emissions. Department of Economics, 2(2), pp.77-87.
- Eliasson, J. (2001) Road pricing with limited information and heterogeneous users: A successful case. The Annals of Regional Science, 35, pp. 595-604. [CrossRef]
- Ramjerdi, F. (1992) Road pricing in urban areas: a means of financing investments in transport infrastructure or of improving resource allocation, the case of Oslo. Transportökonomisk institutt, Oslo. 7-97.
- Eliasson, J., and Lundberg, M.(2002) .Road Pricing in Urban Areas. Swedish National Road Administration.
- Parry, I.W., & Bento, A.M. (1999). Tax Deductions, Environmental Policy, and the Double Dividend Hypothesis.
- Ubbels, B. and Verhoef, E.(2006). Acceptability of Road Pricing and Revenue use in the Netherlands. European Transport, pp. 69-94.
- Tretvik (2002) Urban Road Pricing in Norway: Public Acceptability and Travel Behavior. Presented at the MC-ICAM Conference, Dresden, May 2002. Available from http://www.strafica.fi/mcicam/conferences-dresden.html.
- Bueno, P. C., Gomez, J., & Vassallo, J. M. (2017). Seeking Factors to Increase the Public's Acceptability of Road-Pricing Schemes: Case Study of Spain. Transportation Research Record, 2606(1), 9-17.
- Jaadan, K. ,Abudeyyeh , D. and Msallam, M. (2013) . Behavioral Responses to Road Pricing in Jordan. Engineering science and Technology : An international Journal, 3(3), pp.505-509.
- Jaensirisak, S., Wardman, M. and May, A.D. (2005) Explaining variations in public acceptability of road pricing schemes. Journal of Transport Economics and Policy, 39 (2). pp. 127-153. ISSN 0022-5258.
- Melhorado , A. , Gutierrez , J. , and Palomares , J. (2011). Spatial impacts of road pricing :Accessibility , regional spillovers and territorial cohesion . Transportation Research A , 45, pp.185-203.
- Cools , M ., Brijs, K. , Tormans, H., Moons, E., Janssens, D. , and Wets, G. (2011). The socio-cognitive links between road pricing acceptability and changes in travel-behavior . Transportation Research A , 45, pp .779-788. [CrossRef]
- Kaplan ,S., Silva ,J., and Ciommo ,F.(2014). The Relationship between Young People's Transit Use and Their Perceptions of Equity Concepts in Transit Service Provision. Transport Policy, 36, pp.79–87. [CrossRef]
- Komada, K. and Nagatani, T.(2010).Traffic Flow Through Multi-lane Tollbooths on A Toll Highway. Physica A, 389, pp. 2268-2279. [CrossRef]
- Tsekeris, T., Voß, S. Public transport and road pricing: a survey and simulation experiments. Public Transp 2, 87–109 (2010). [CrossRef]
- Chakirov, A., & Erath, A. (2012). Overcoming challenges in road pricing design with an agent-based transport simulation. Arbeitsberichte Verkehrs-und Raumplanung, 766.
- Mahdi, M. B., Leong, L. V., & Sadullah, A. F. M. (2019). Use of microscopic traffic simulation software to determine heavy-vehicle influence on queue lengths at toll plazas. Arabian Journal for Science and Engineering, 44, 7297-7311. [CrossRef]
- Adurthi, N. M., Bari, C. S., Navandar, Y. V., & Dhamaniya, A. (2022). A Study on User Acceptable Road Pricing Policy for Toll Roads: A Case of Eethakota, India. Transportation Research Procedia, 62, 656-663. [CrossRef]
- Cools, M., Brijs, K., Tormans, H., Moons, E., Janssens, D., & Wets, G. (2011). The socio-cognitive links between road pricing acceptability and changes in travel-behavior. Transportation Research Part A: Policy and Practice, 45(8), 779-788. [CrossRef]
- Jose, P. G., Chatterjee, S., Patodia, M., Kabra, S., & Nath, A. (2016). A Comparative Study of Different Technologies for Electronic Toll Collection System. Int. J. Innov. Res. Comput. Commun. Eng., 4(6), 2257-2263.
- Broaddus, A., & Gertz, C. (2008). Tolling heavy goods vehicles: Overview of European practice and lessons from German experience. Transportation Research Record, 2066(1), 106-113.
- Gogoski, R. (2012). Payment systems in economy-present end future tendencies. Procedia-Social and Behavioral Sciences, 44, 436-445. [CrossRef]
- Prud’homme, R., Koning, M., & Kopp, P. (2009, October). Paris: a desire named street-car. In Proceedings of the INFRADAY Conference.
- MPG For Speed. (n.d.). Speed kills MPG. from https://www.mpgforspeed.com.
- Al-Ghriybah, M., Hdaib, I. I., & Adam Lagum, A. (2024). Using 2-bladed Savonius rotor to harvest highway wind energy at airport: A case study. Energy Sources, Part A: Recovery, Utilization, and Environmental Effects, 46(1), 659-673. [CrossRef]
- Zeng, J., Qian, Y., Yin, F., Zhu, L., & Xu, D. (2022). A multi-value cellular automata model for multi-lane traffic flow under lagrange coordinate. Computational and Mathematical Organization Theory, 1-15. [CrossRef]
- Guo, X., & Xu, D. (2016). Profit maximization by a private toll road with cars and trucks. Transportation Research Part B: Methodological, 91, 113-129. [CrossRef]
- De Borger, B., & Proost, S. (2021). Road tolls, diverted traffic and local traffic calming measures: Who should be in charge?. Transportation Research Part B: Methodological, 147, 92-115.
- Wu, H., van den Brink, R., & Estévez-Fernández, A. (2024). Highway toll allocation. Transportation Research Part B: Methodological, 180, 102889.
- Bliemer, M. C., Loder, A., & Zheng, Z. (2024). A novel mobility consumption theory for road user charging. Transportation Research Part B: Methodological, 102998. [CrossRef]
- Li, Z. C., Cheng, L., & de Palma, A. (2024). Ring road investment, cordon tolling, and urban spatial structure. Transportation Research Part B: Methodological, 182, 102905.
Figure 1.
Research methodology at Airport Road.
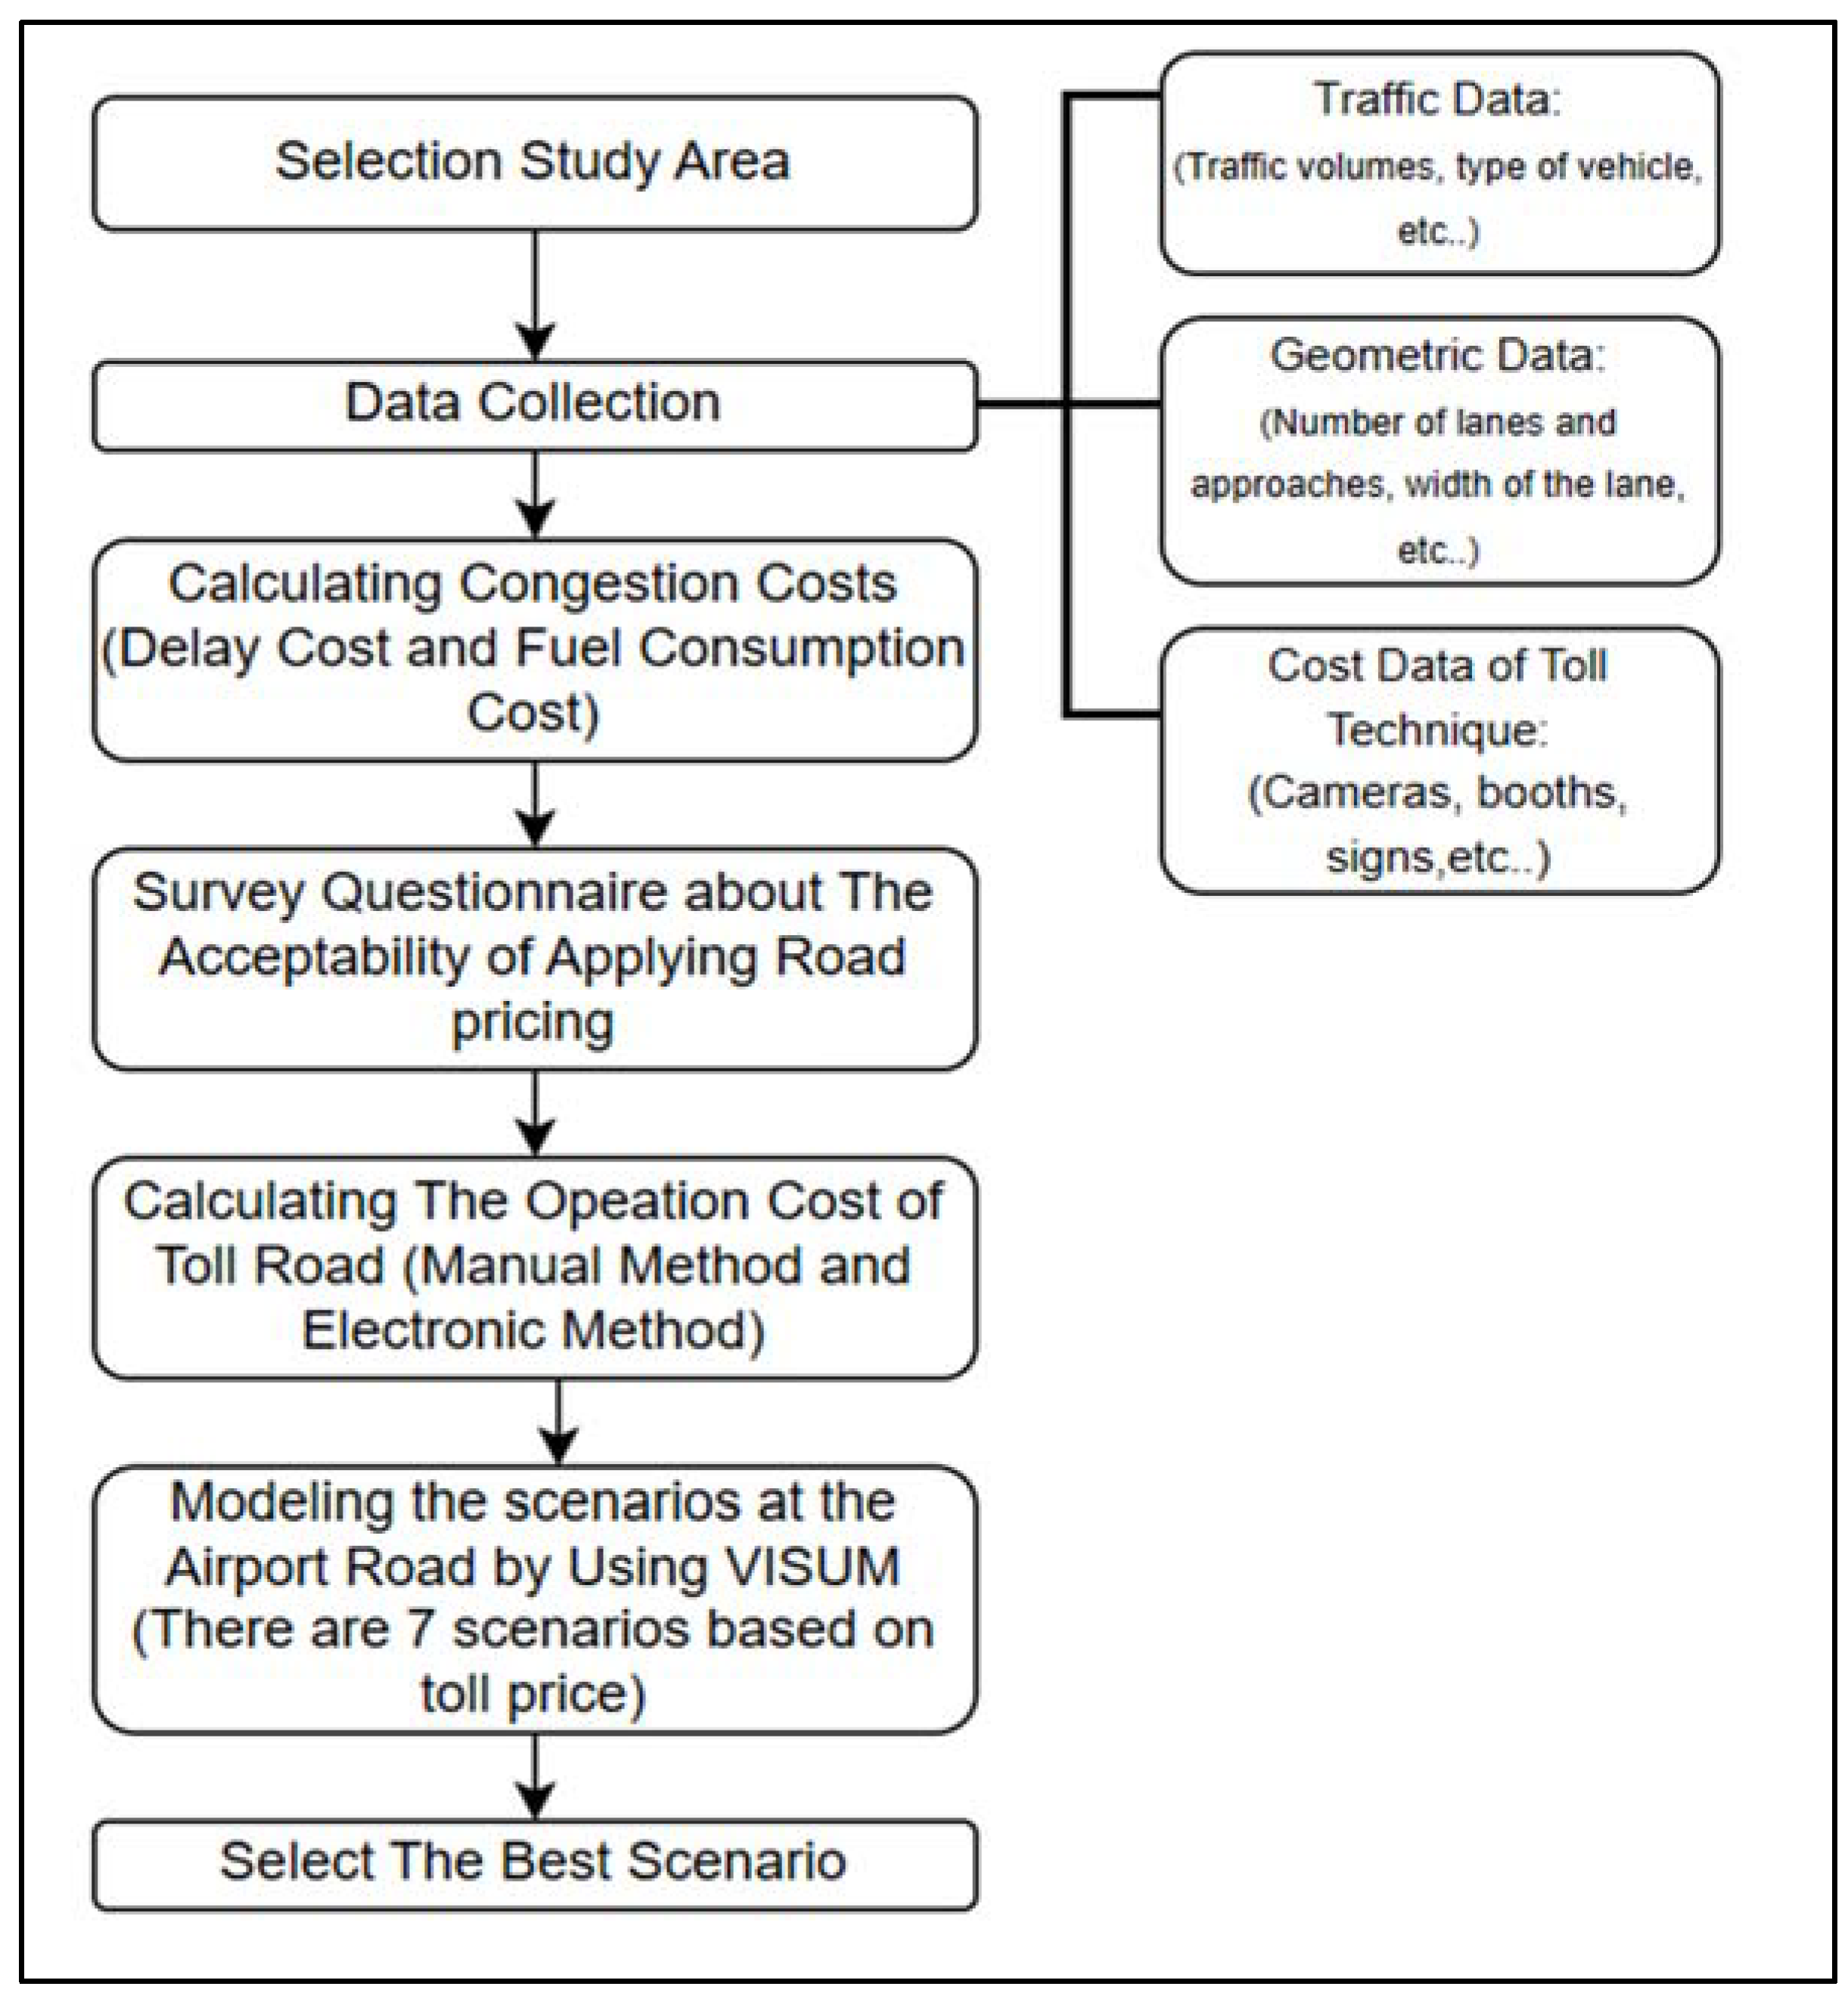
Figure 2.
An aerial photography for Amman city with the two sections from foreign ministry through Madaba bridge to Queen Alia Airport along Airport Highway (Greater Amman Municipality).
Figure 2.
An aerial photography for Amman city with the two sections from foreign ministry through Madaba bridge to Queen Alia Airport along Airport Highway (Greater Amman Municipality).
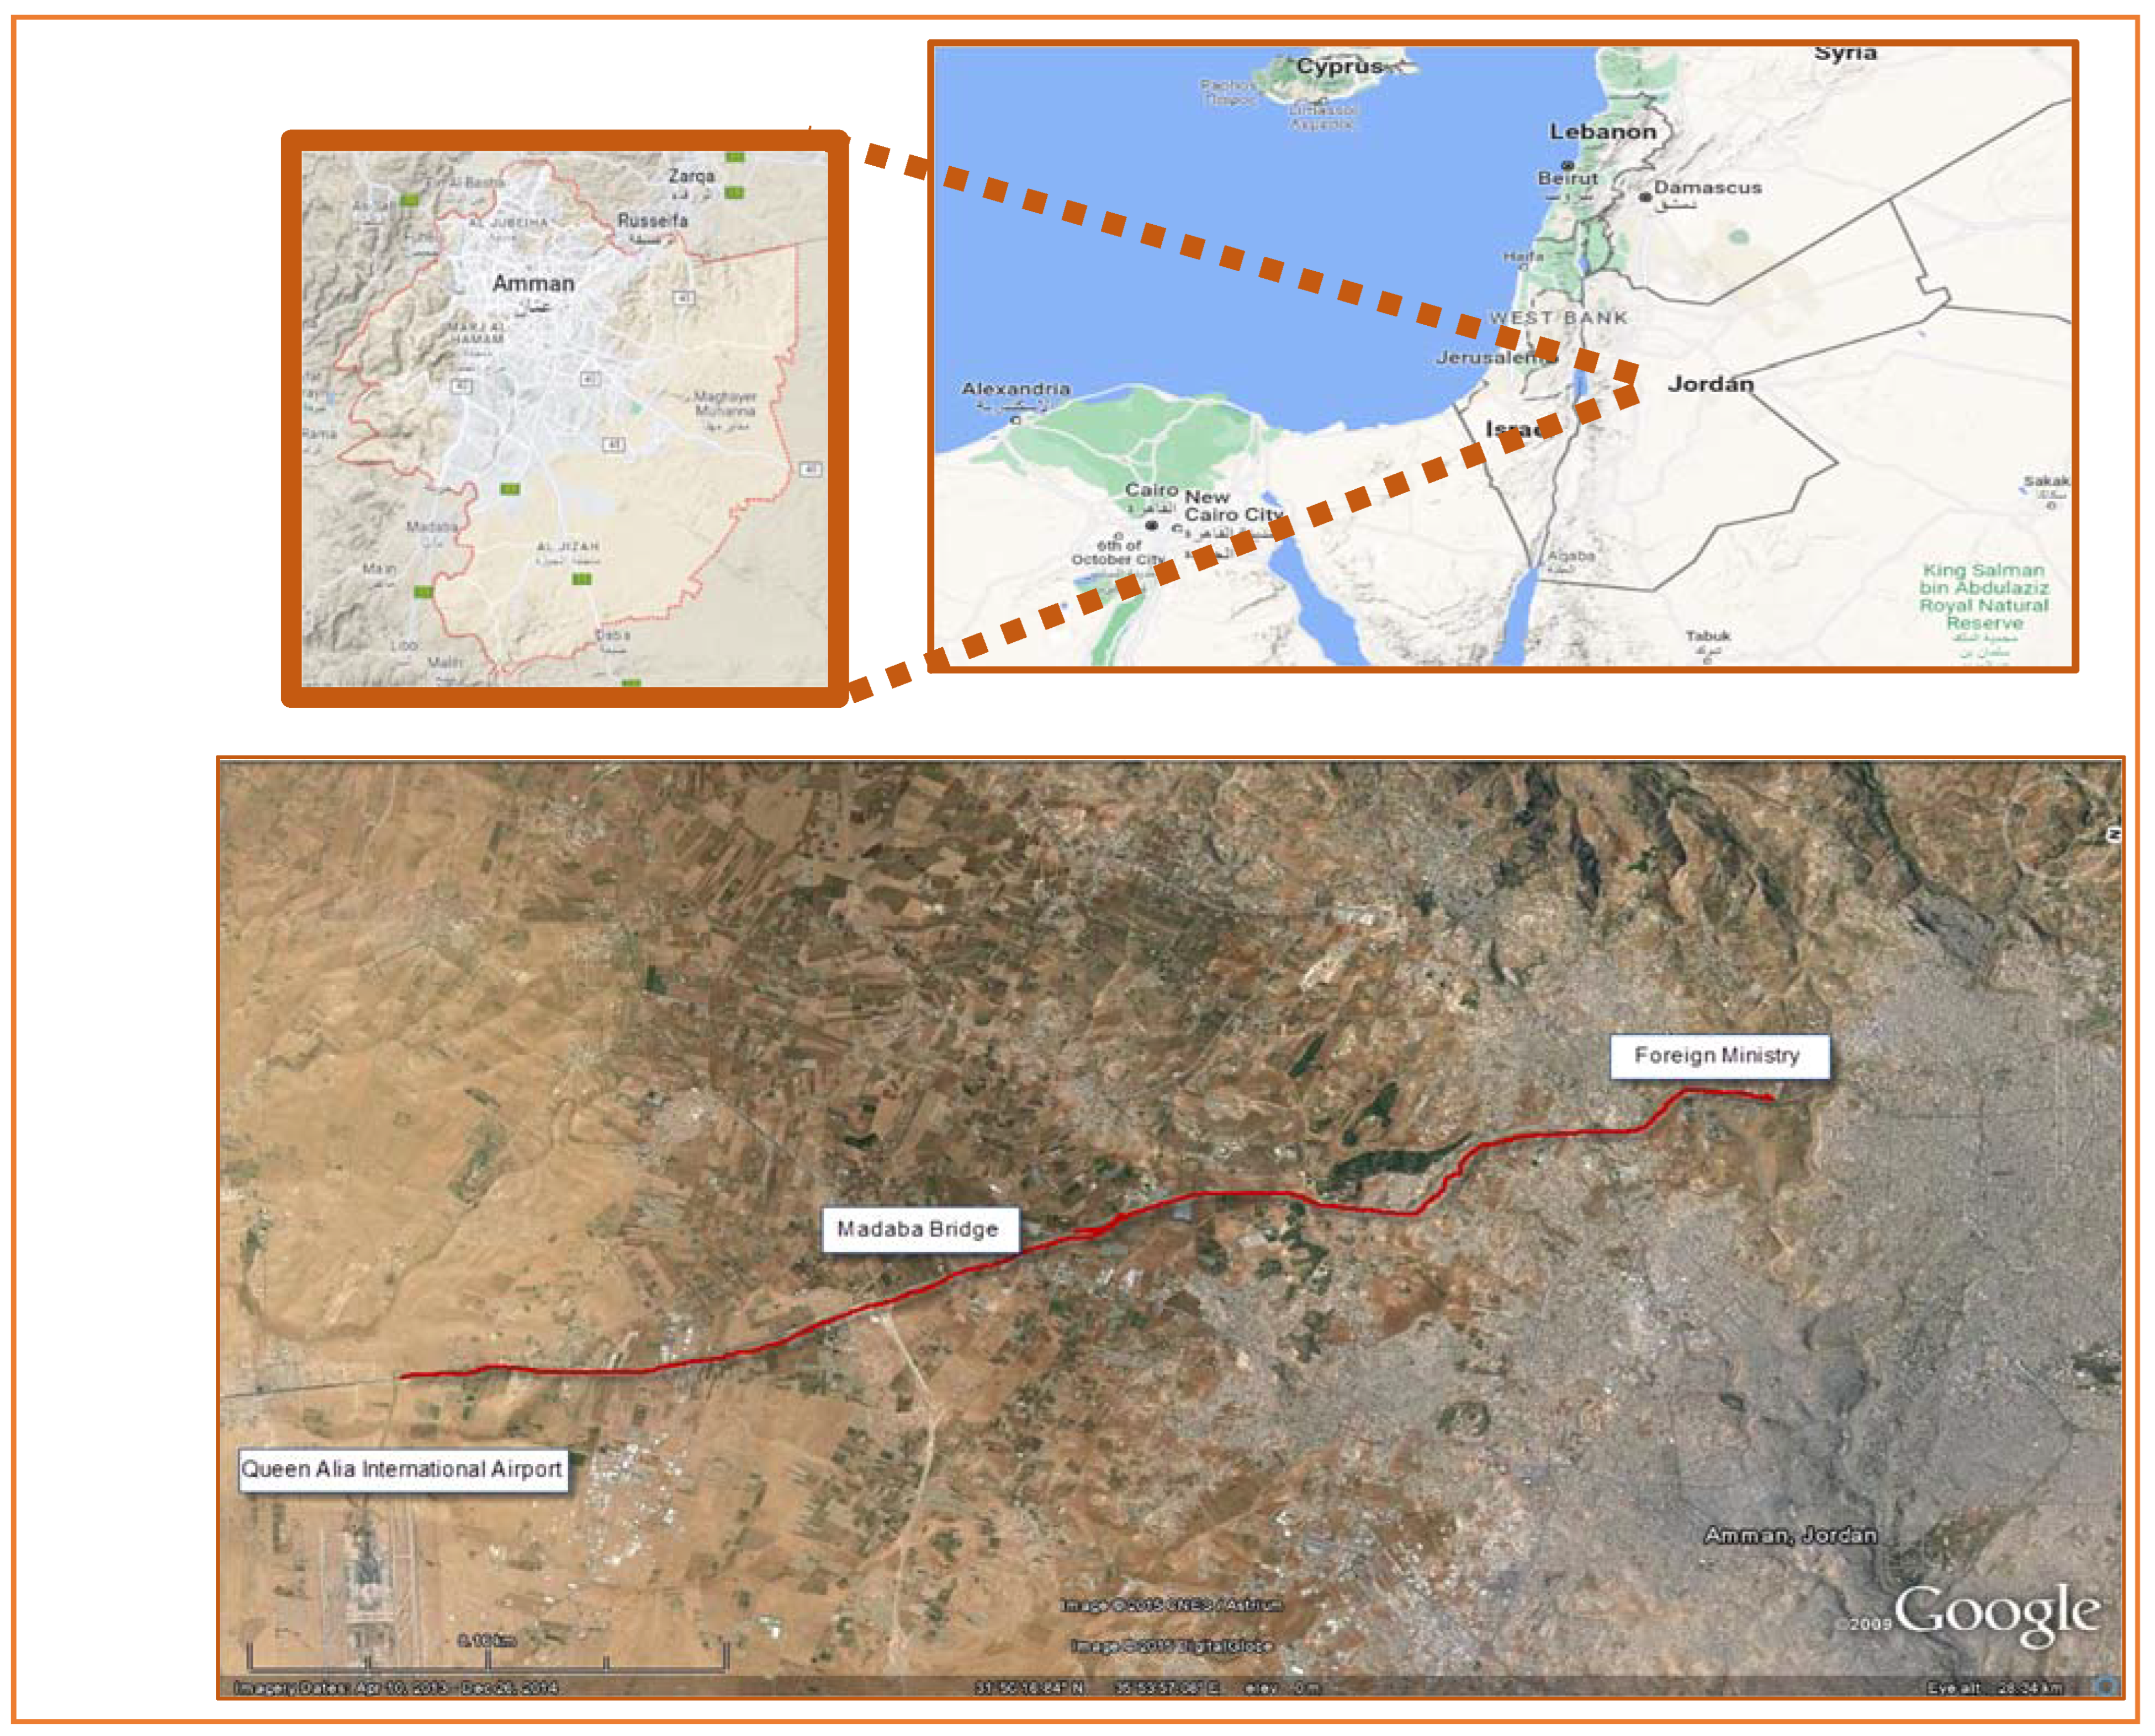
Figure 4.
The positions of Toll Booth at Airport Road with Red Circles.
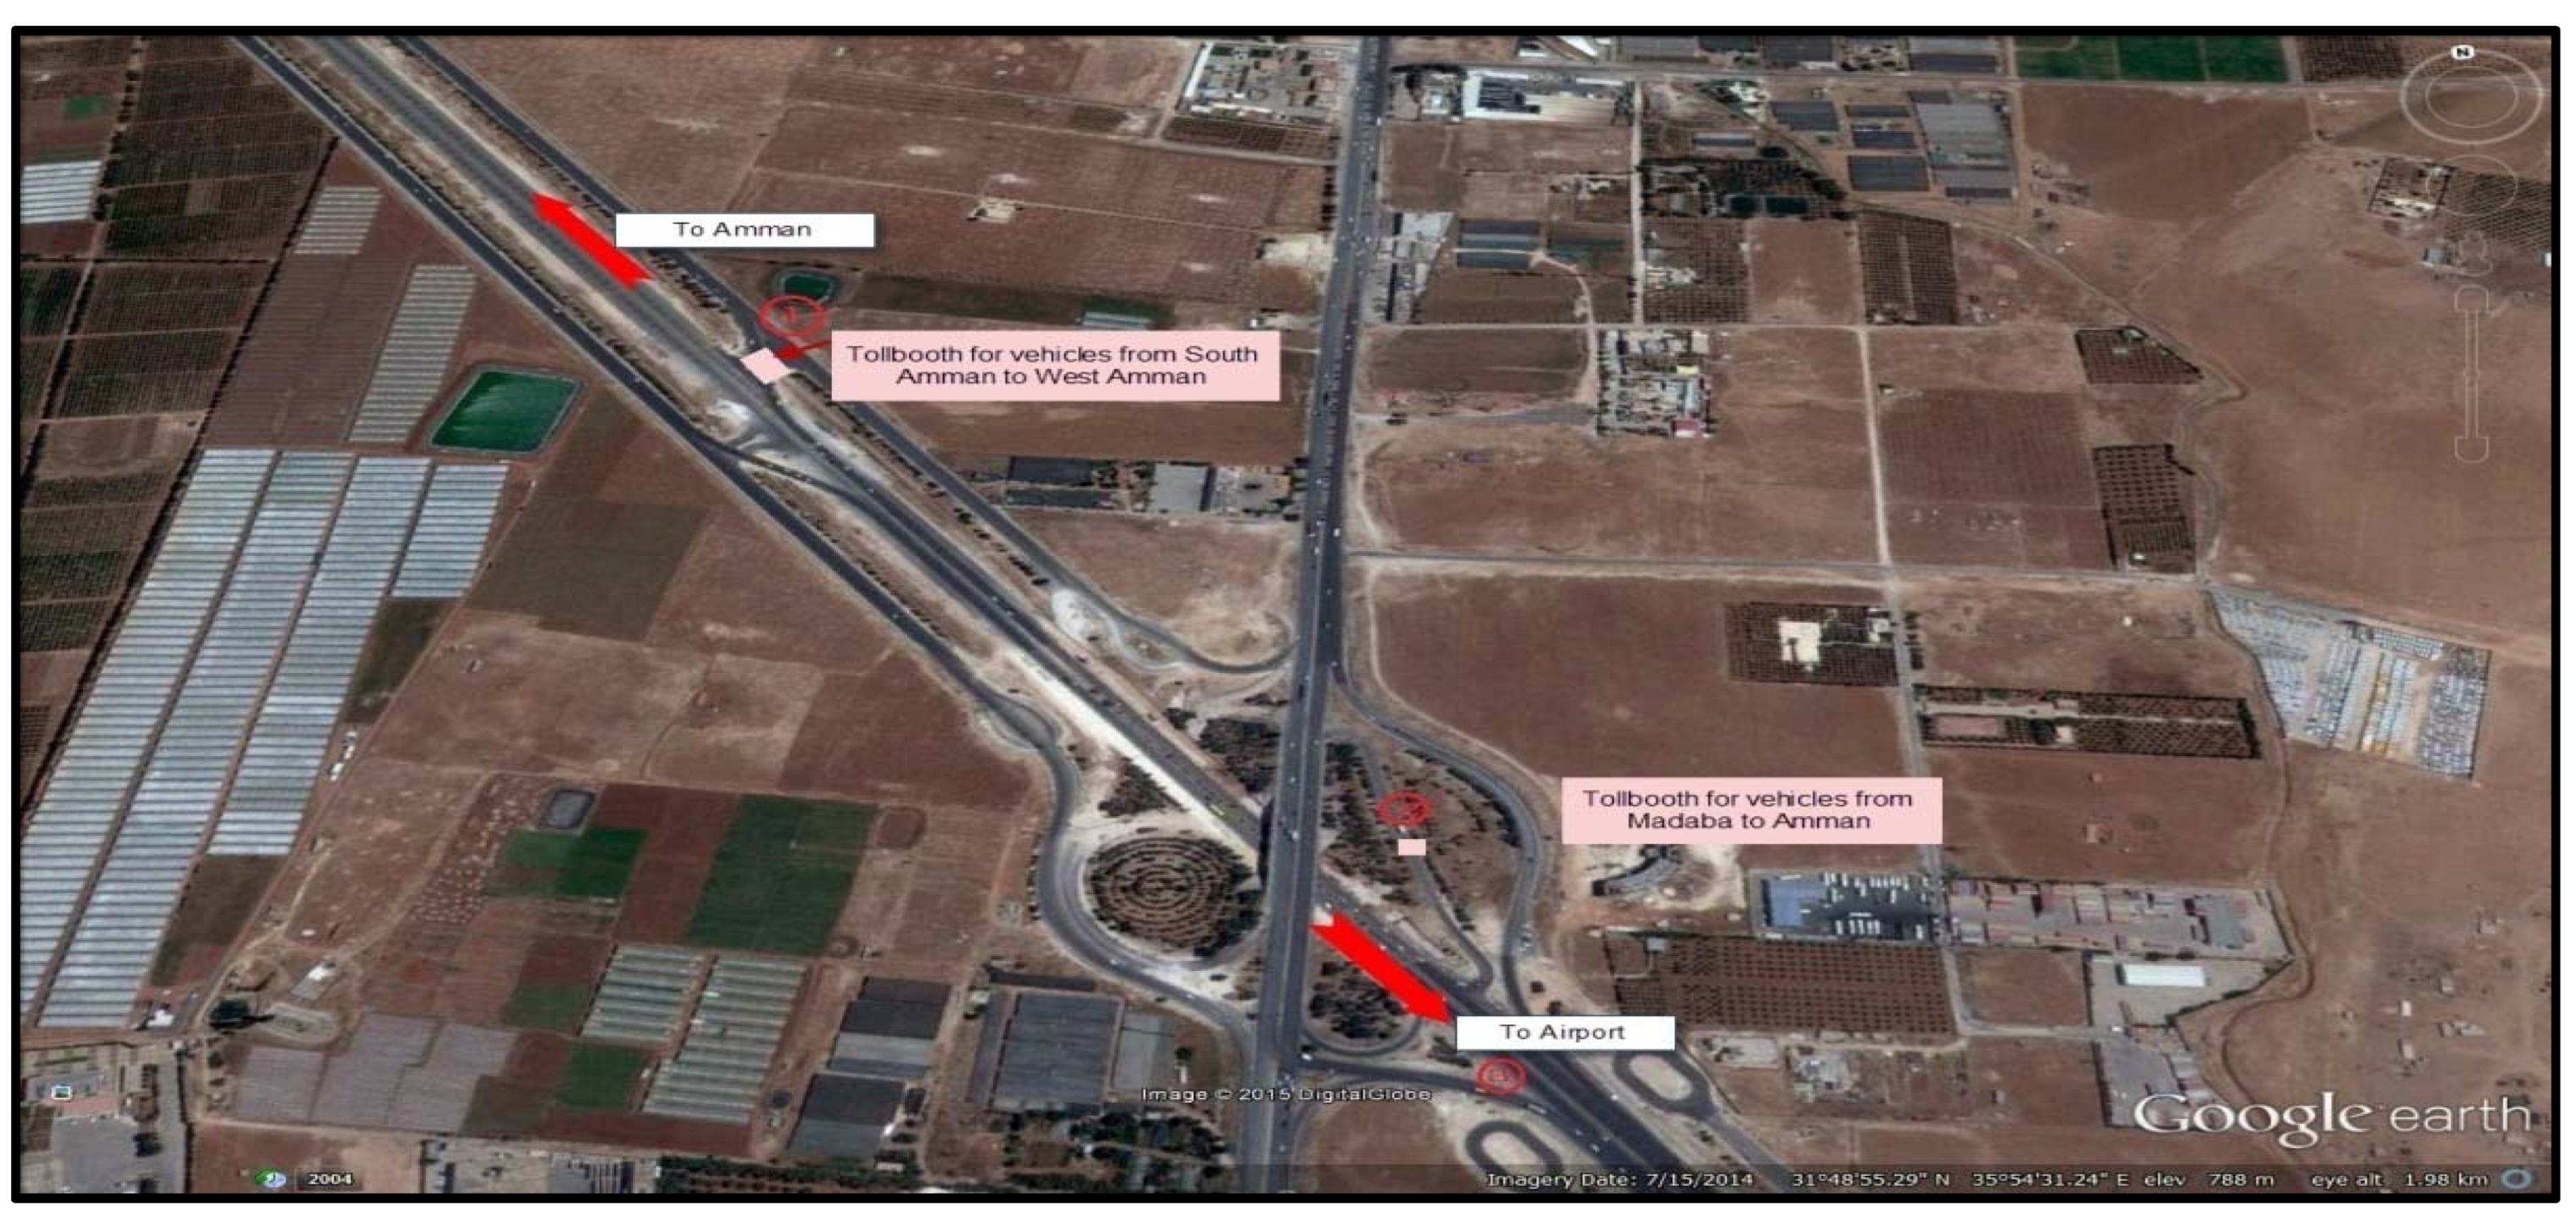
Figure 5.
Basic Structure of the Transport Model.
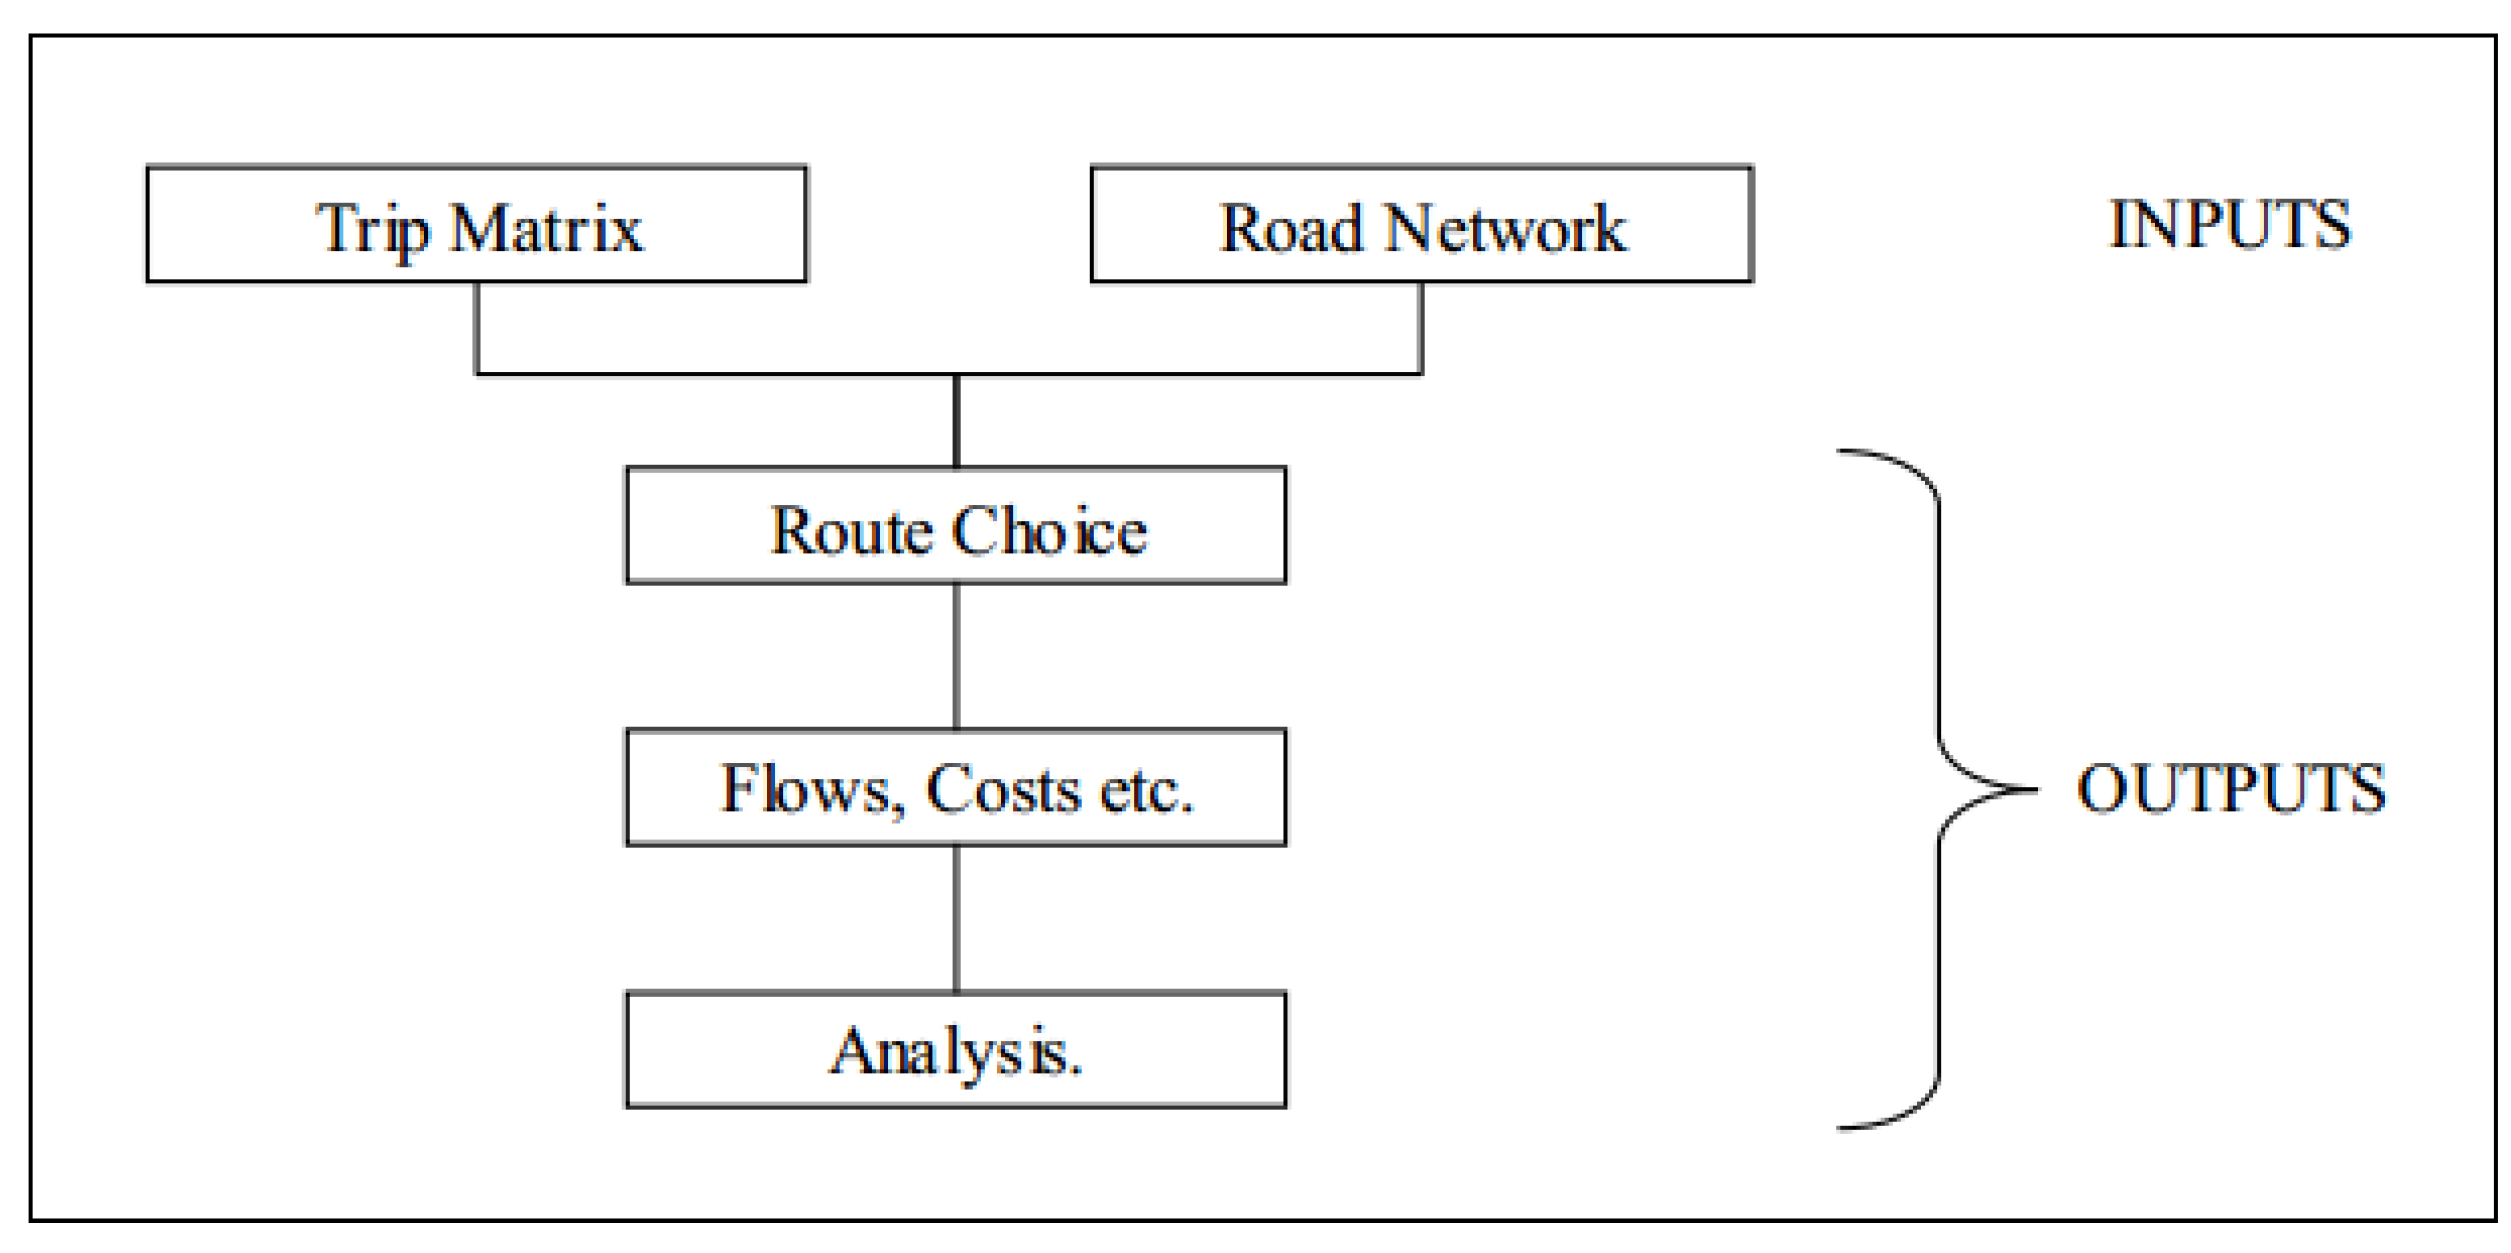
Figure 6.
(a):Southbound Traffic Flow Bundles and (b):Northbound Traffic Flow Bundle. (c): VISUM Network Model for Amman.
Figure 6.
(a):Southbound Traffic Flow Bundles and (b):Northbound Traffic Flow Bundle. (c): VISUM Network Model for Amman.
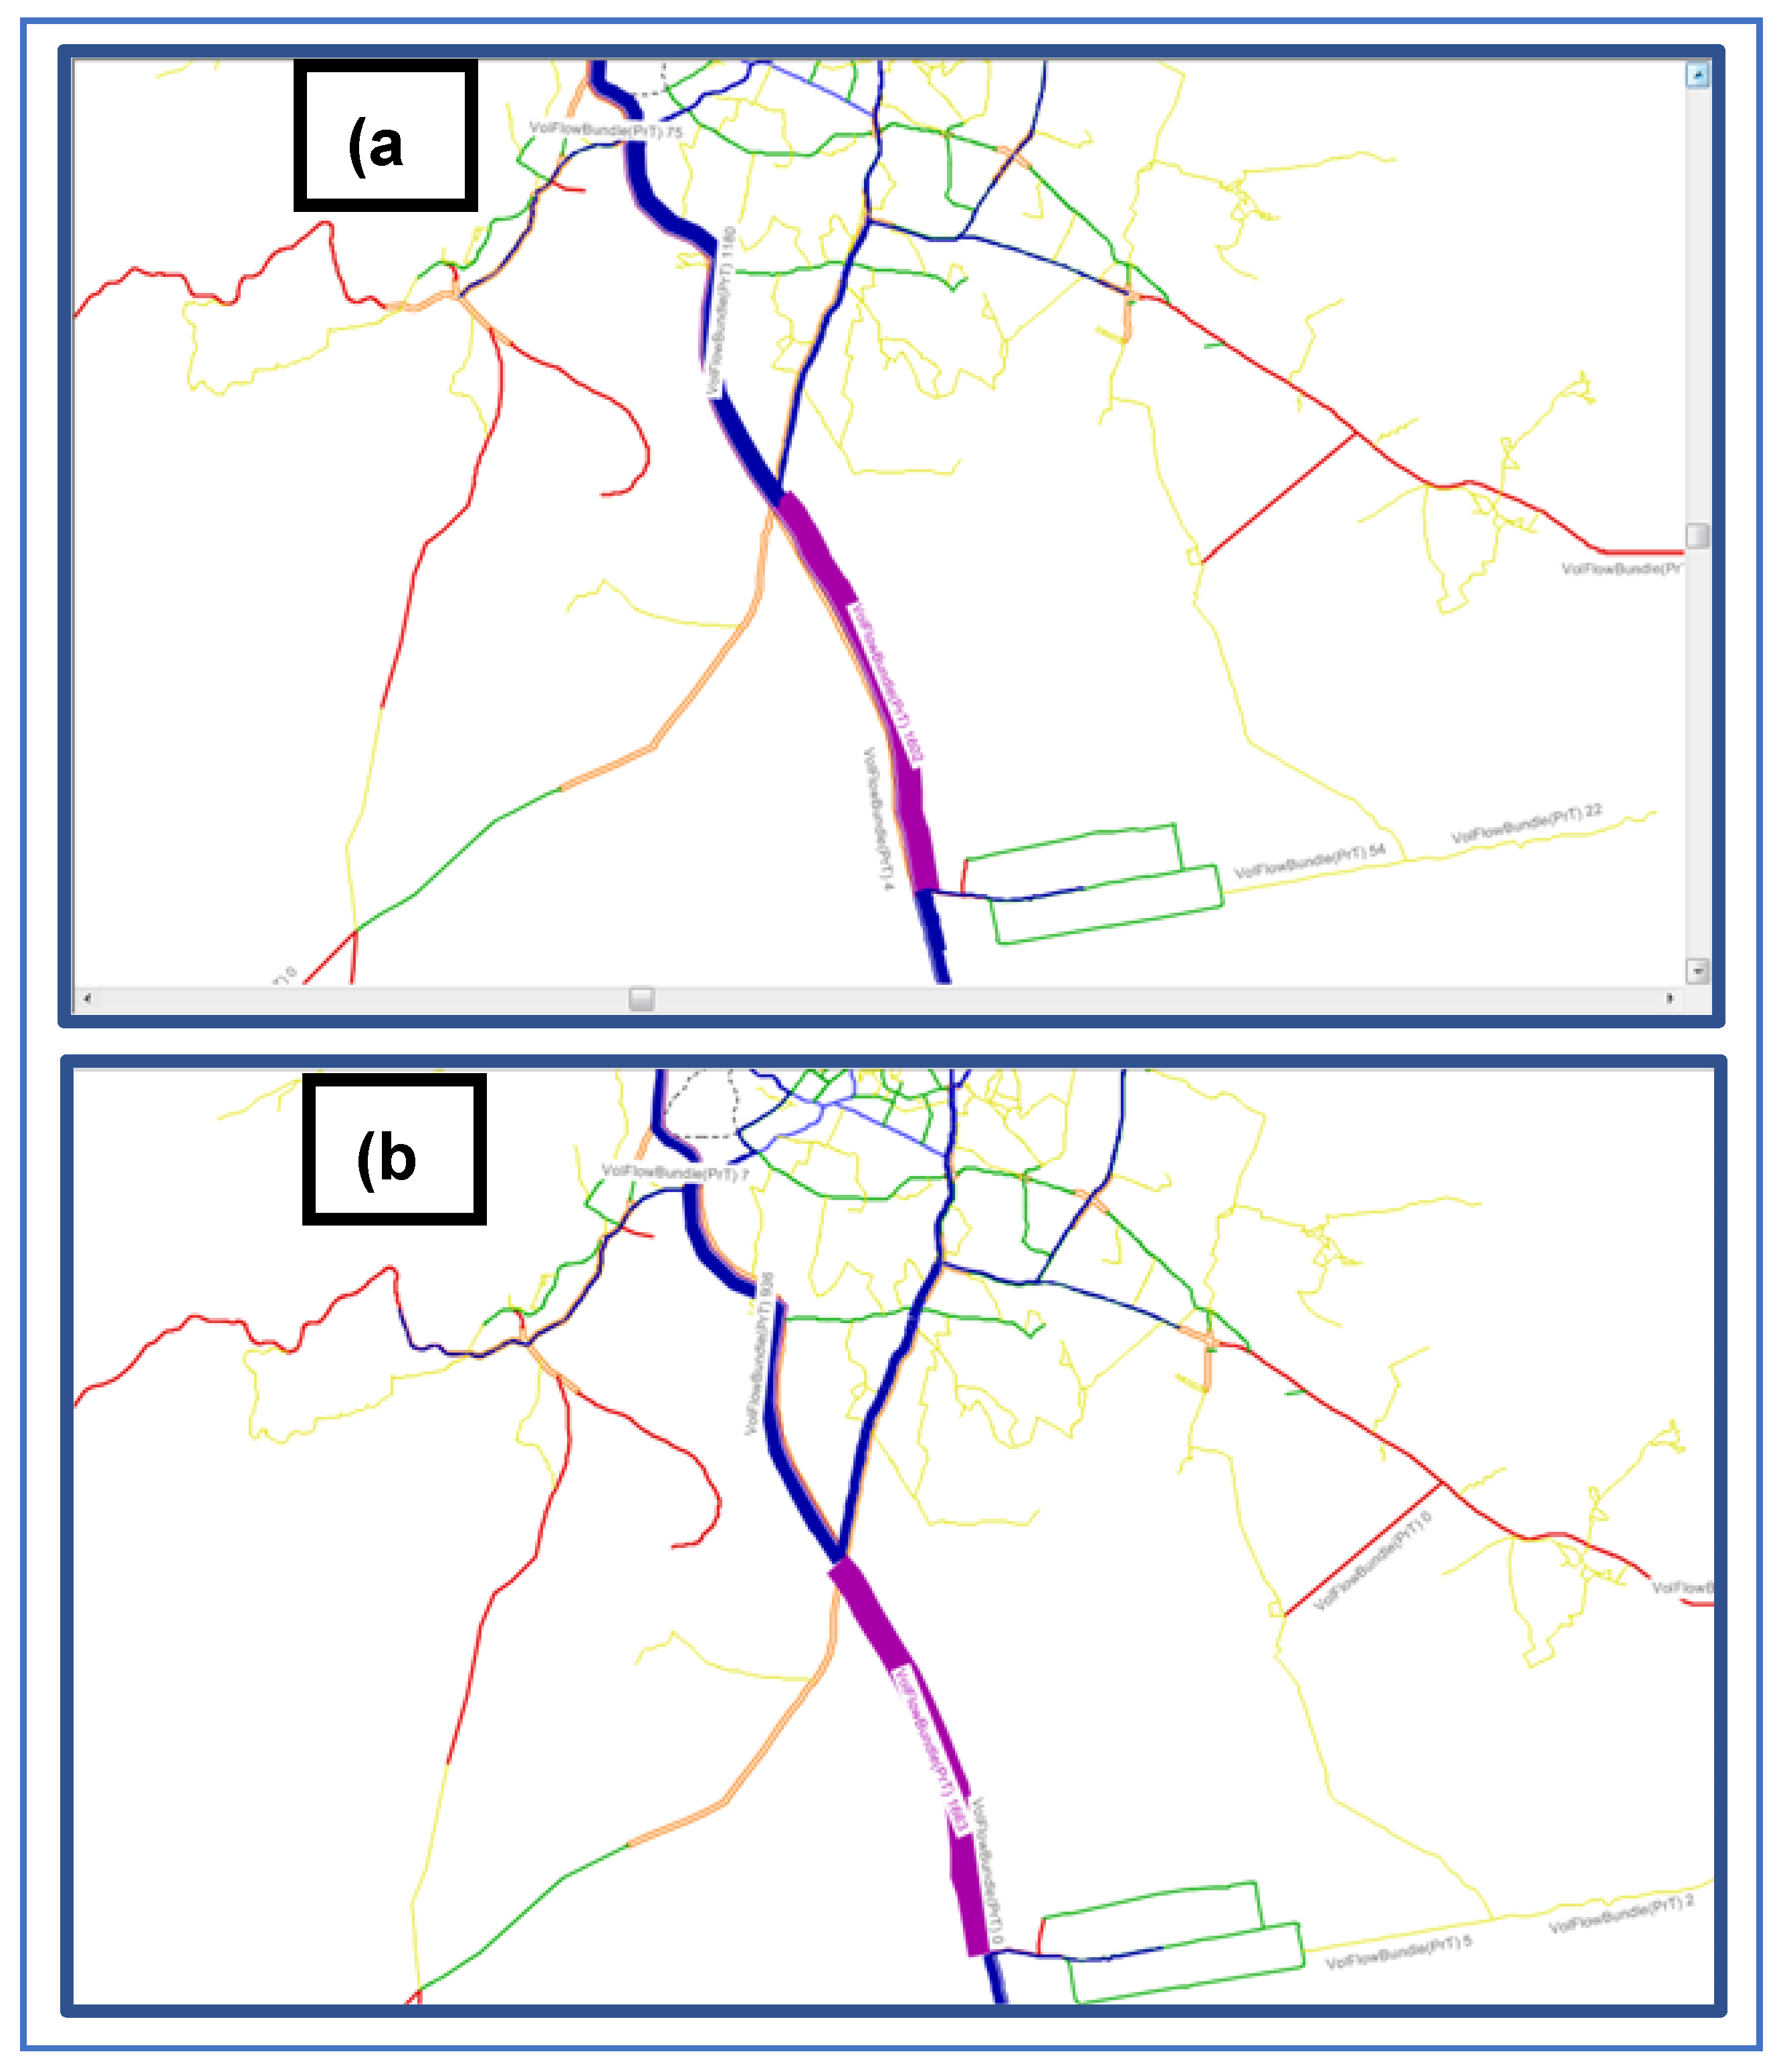
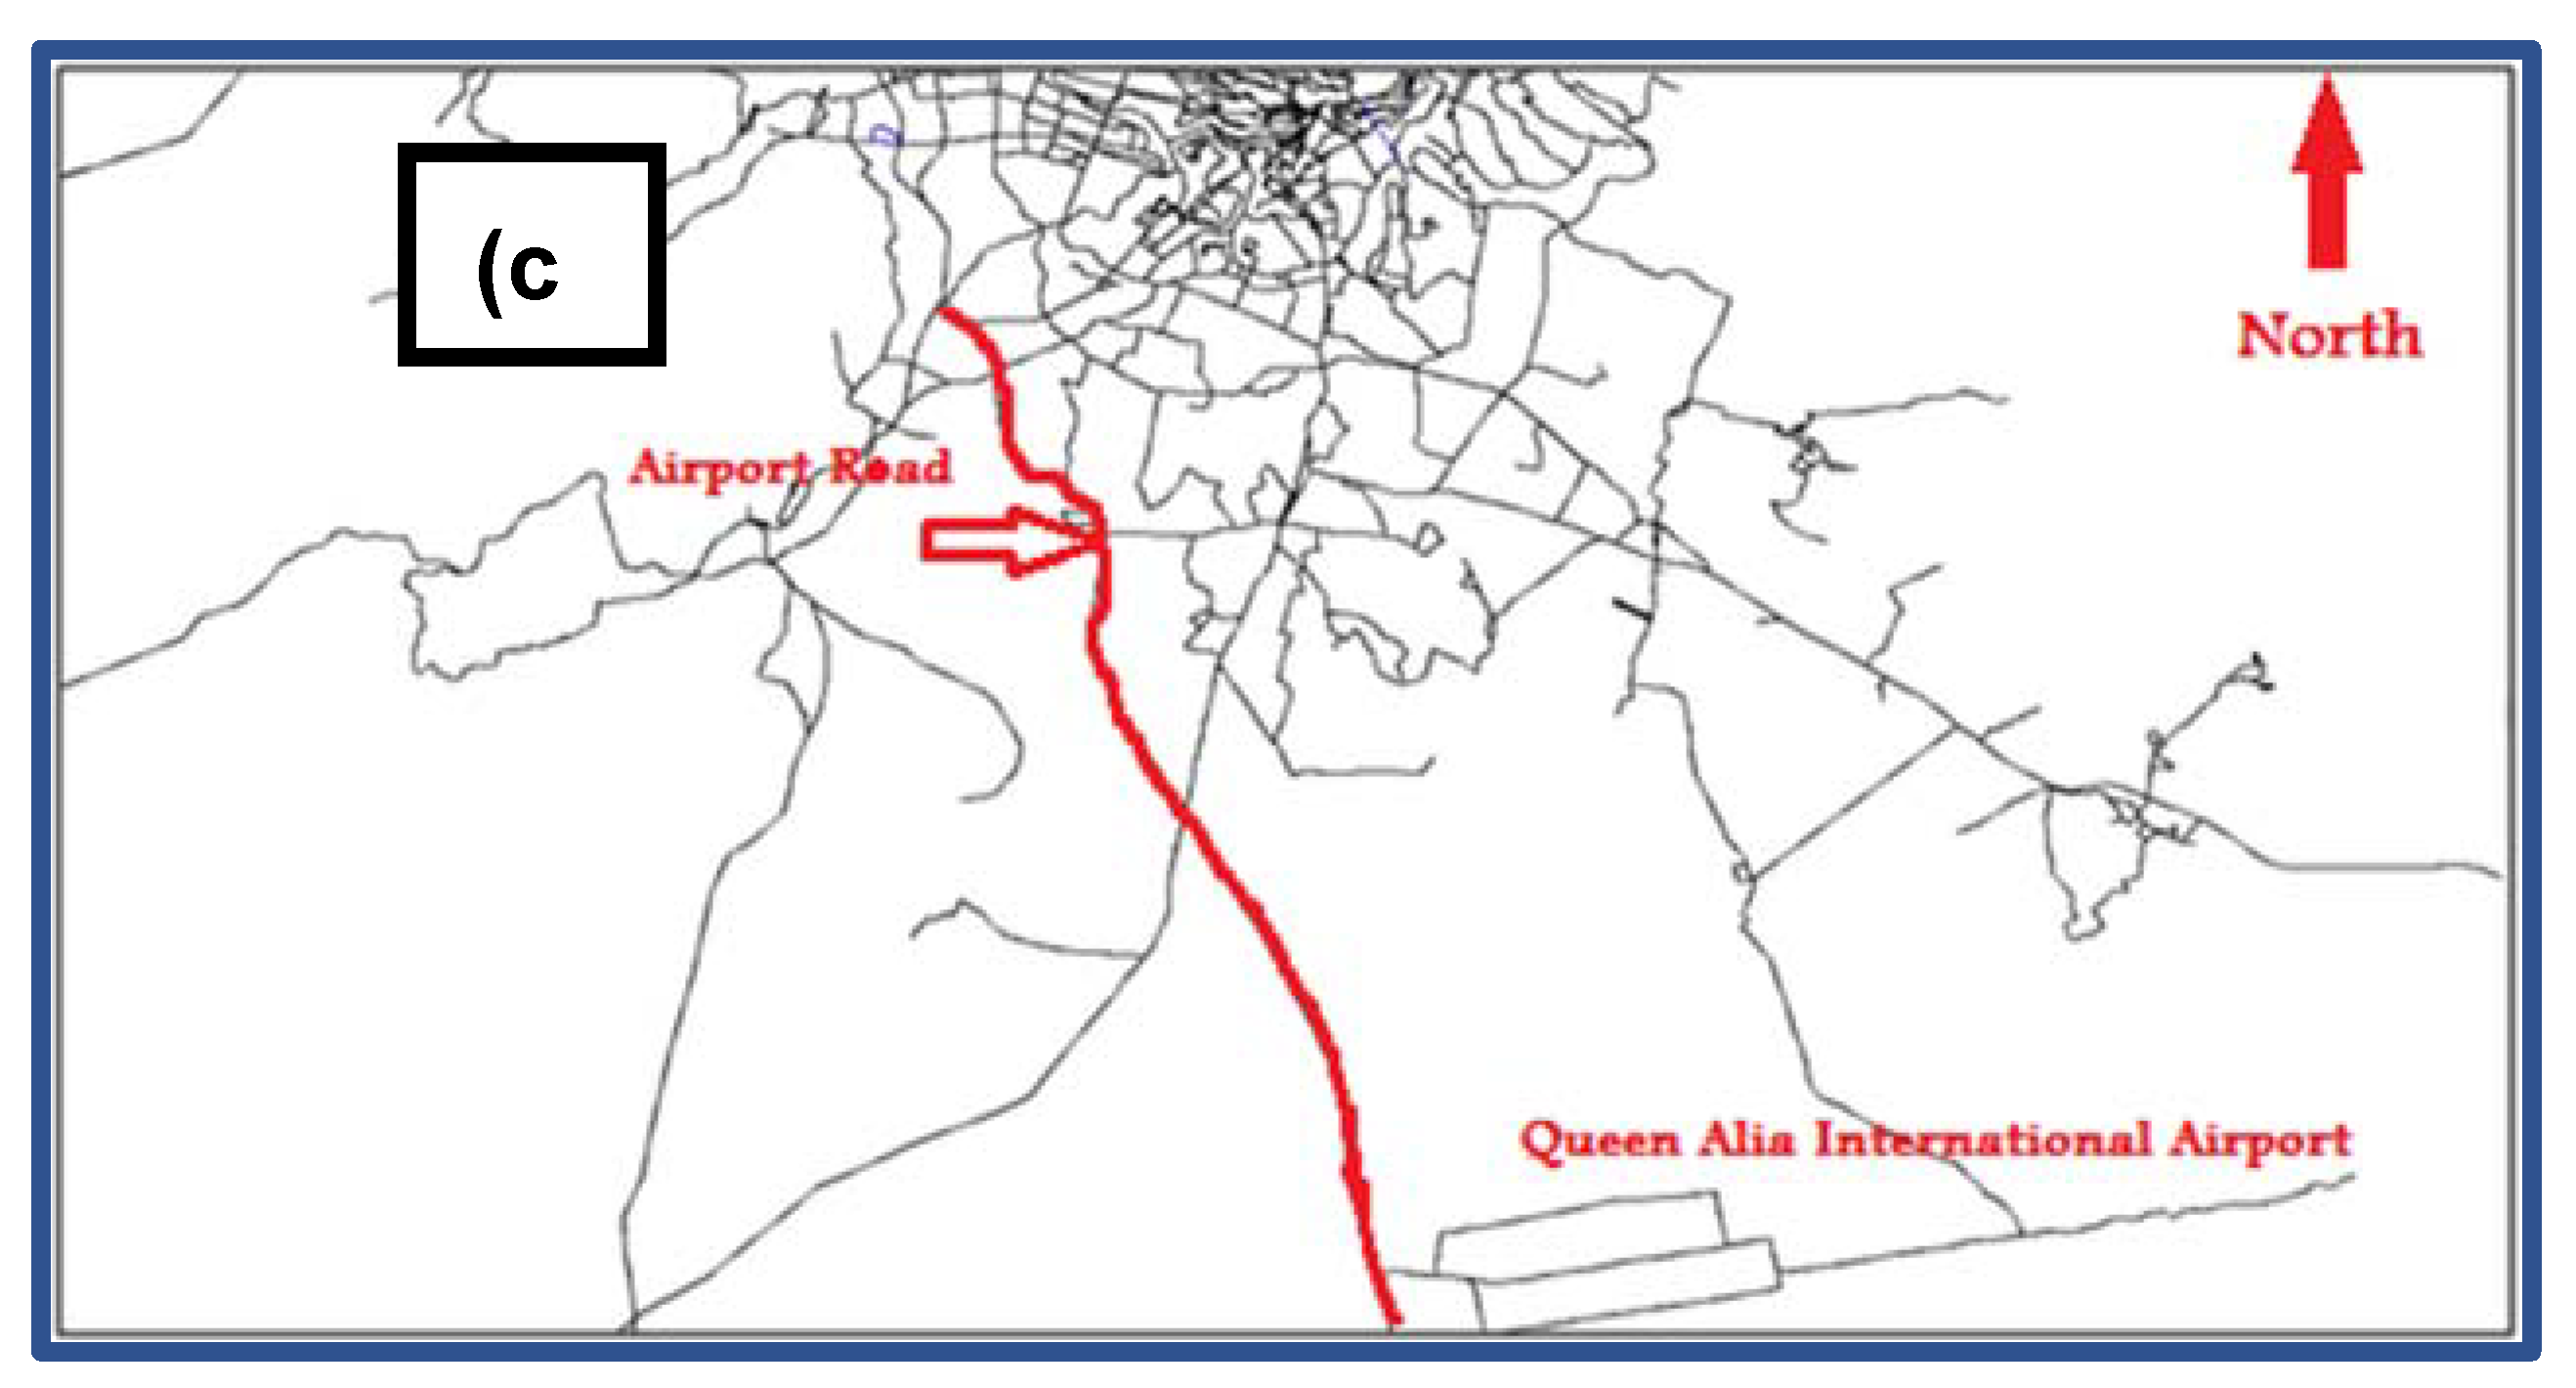
Figure 7.
Relationship between Speed & Fuel Consumption[40].
Figure 7.
Relationship between Speed & Fuel Consumption[40].
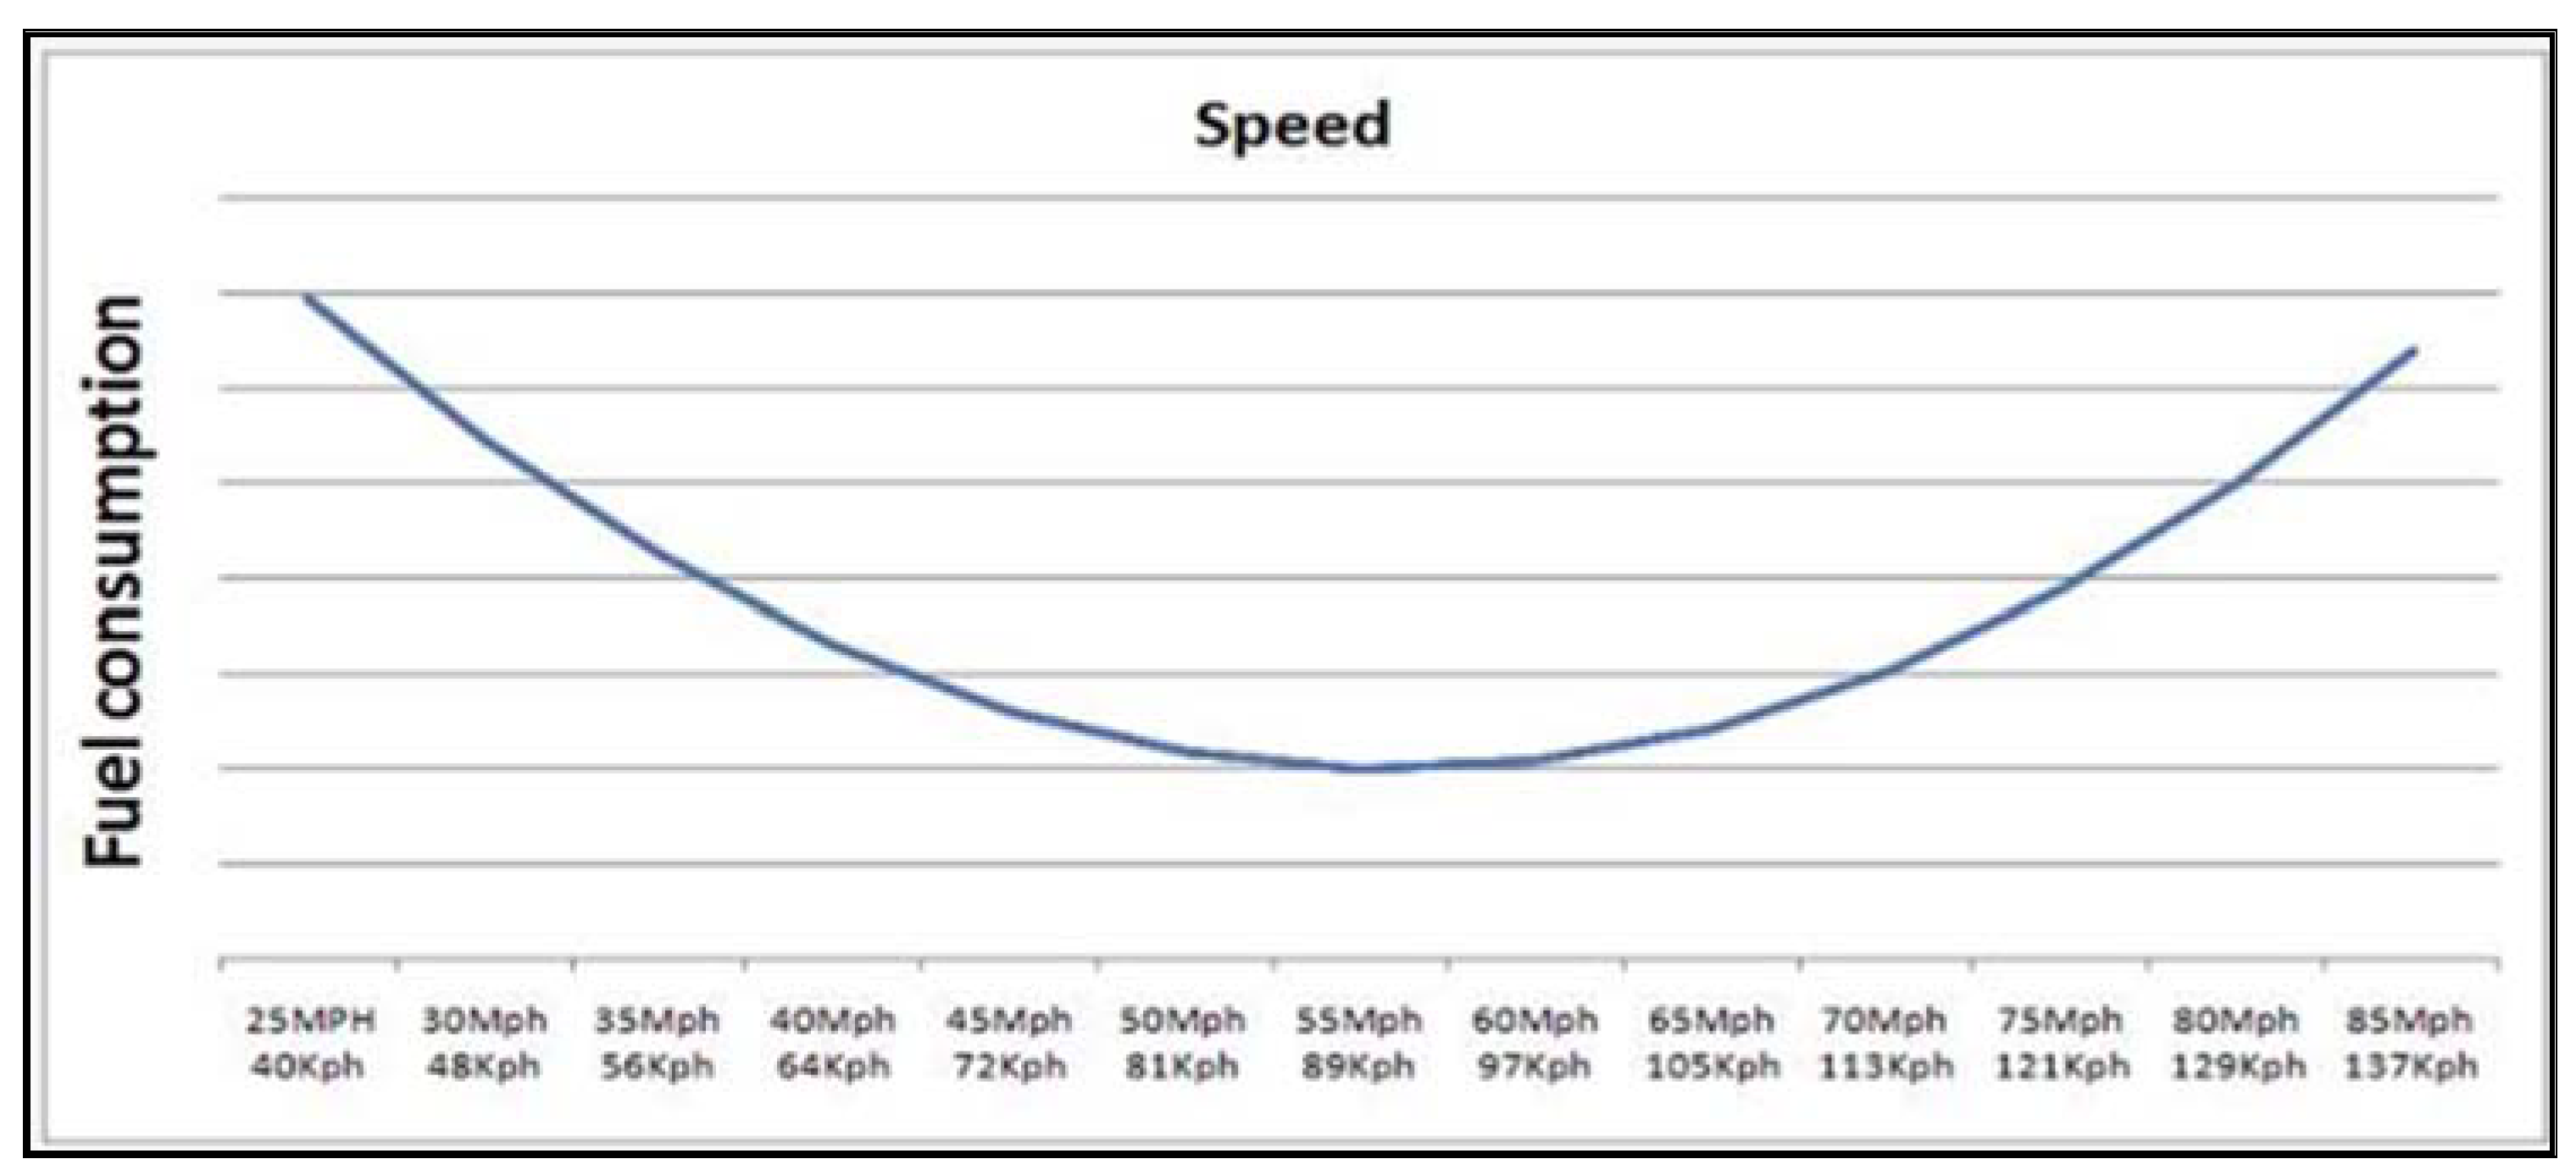
Figure 8.
Standard curve between Speed and Fuel Economy[41].
Figure 8.
Standard curve between Speed and Fuel Economy[41].
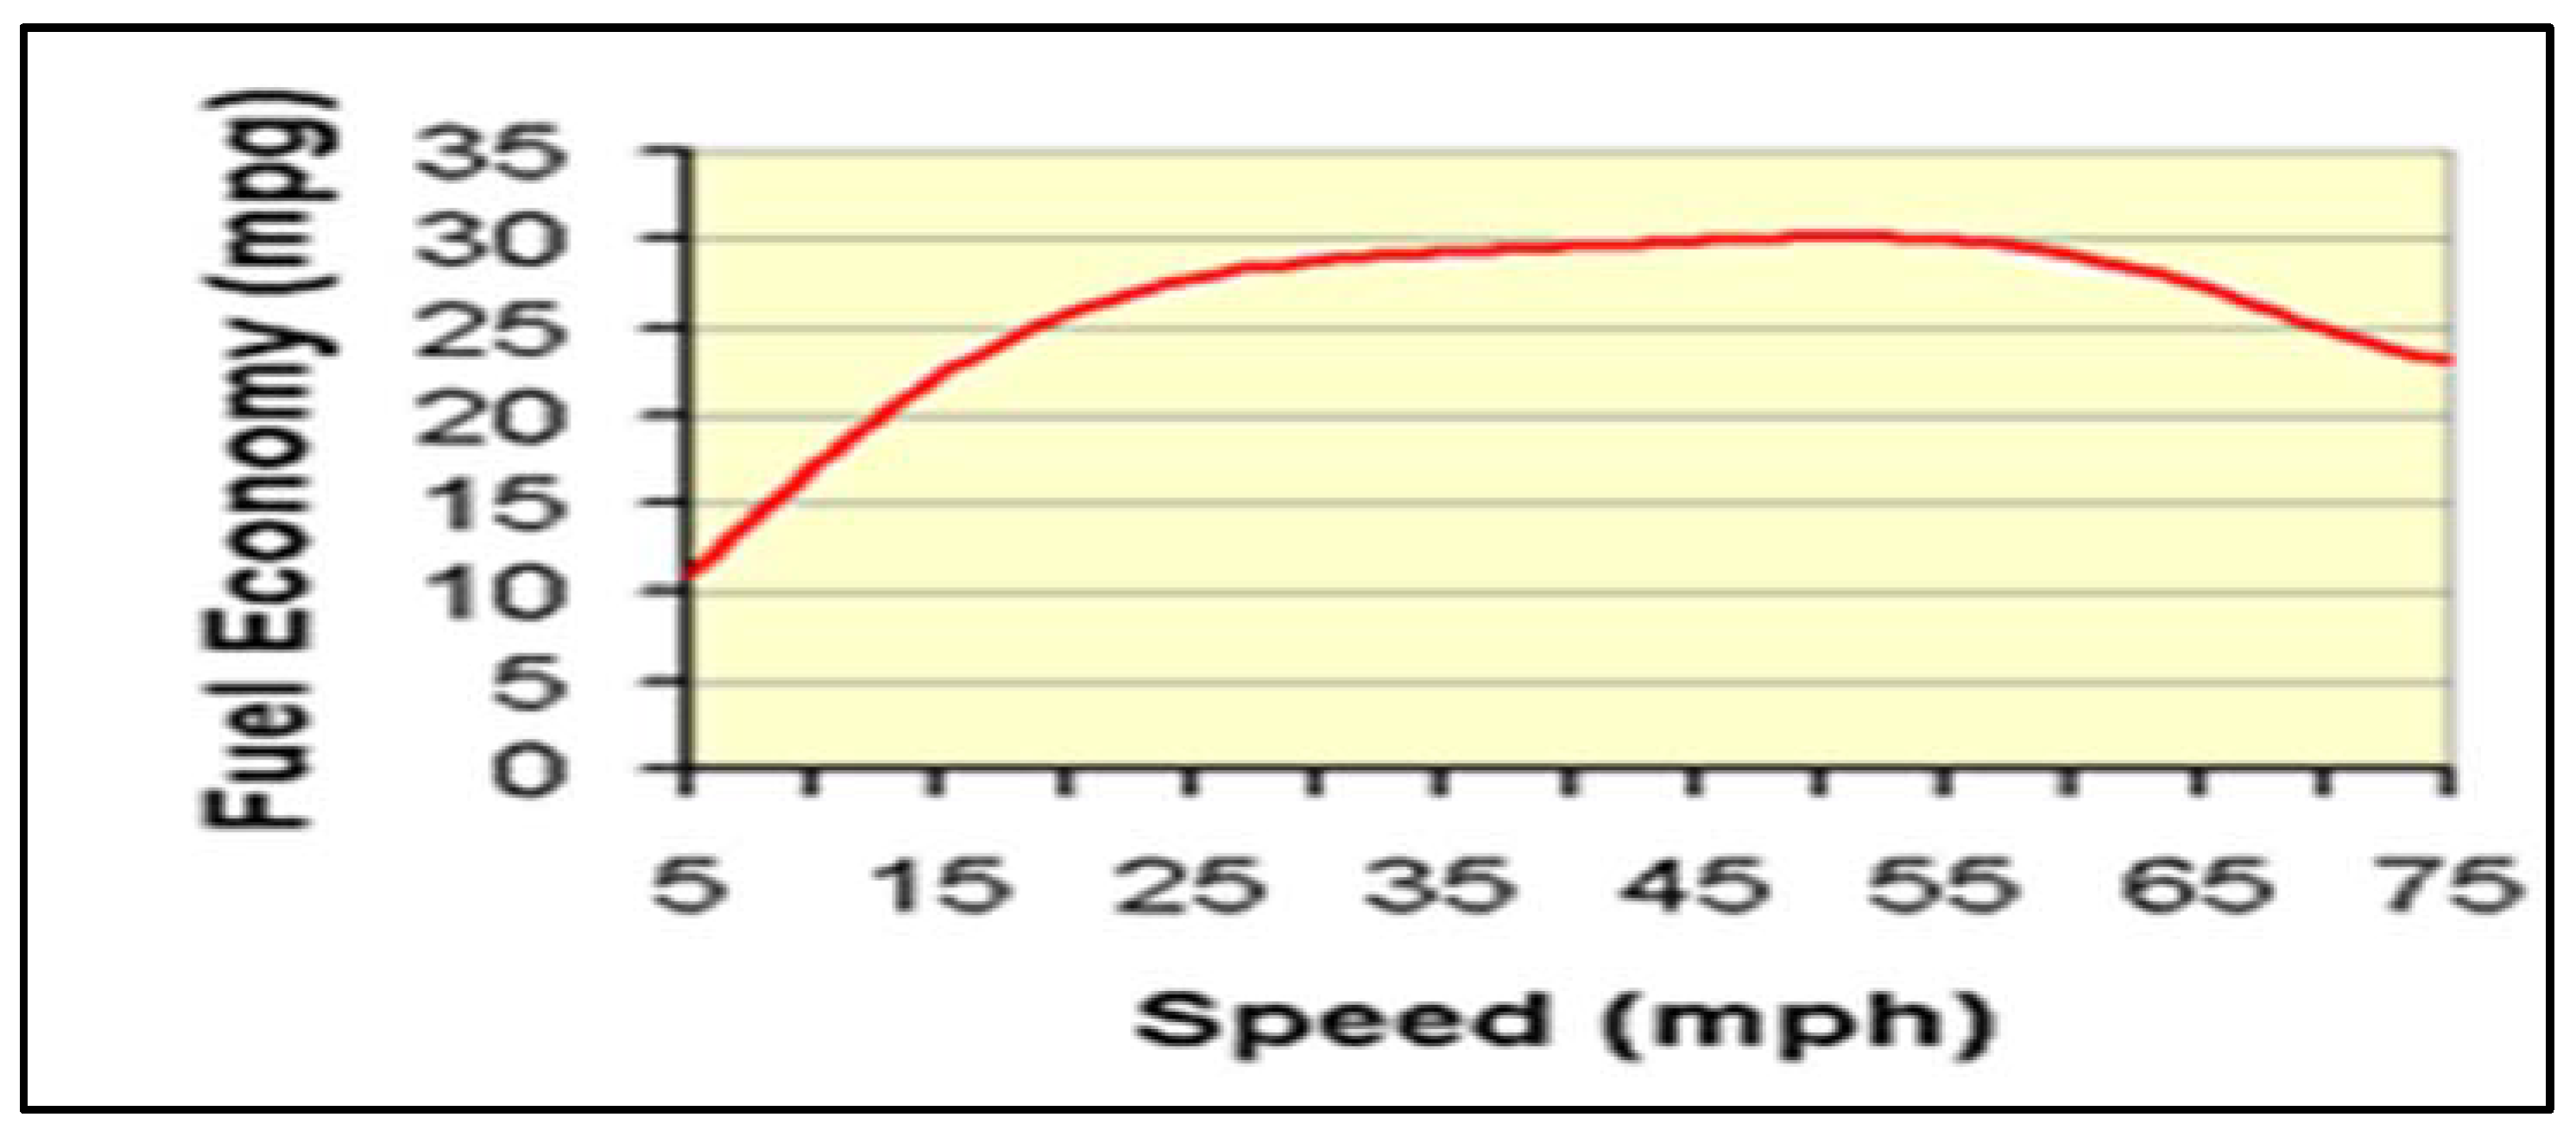
Figure 9.
(a)Free flow time in both direction in Service and Toll Road in the AM peak hour (2012), (b): Current time in both direction in Service and Toll Road in the AM peak hour (2012).
Figure 9.
(a)Free flow time in both direction in Service and Toll Road in the AM peak hour (2012), (b): Current time in both direction in Service and Toll Road in the AM peak hour (2012).
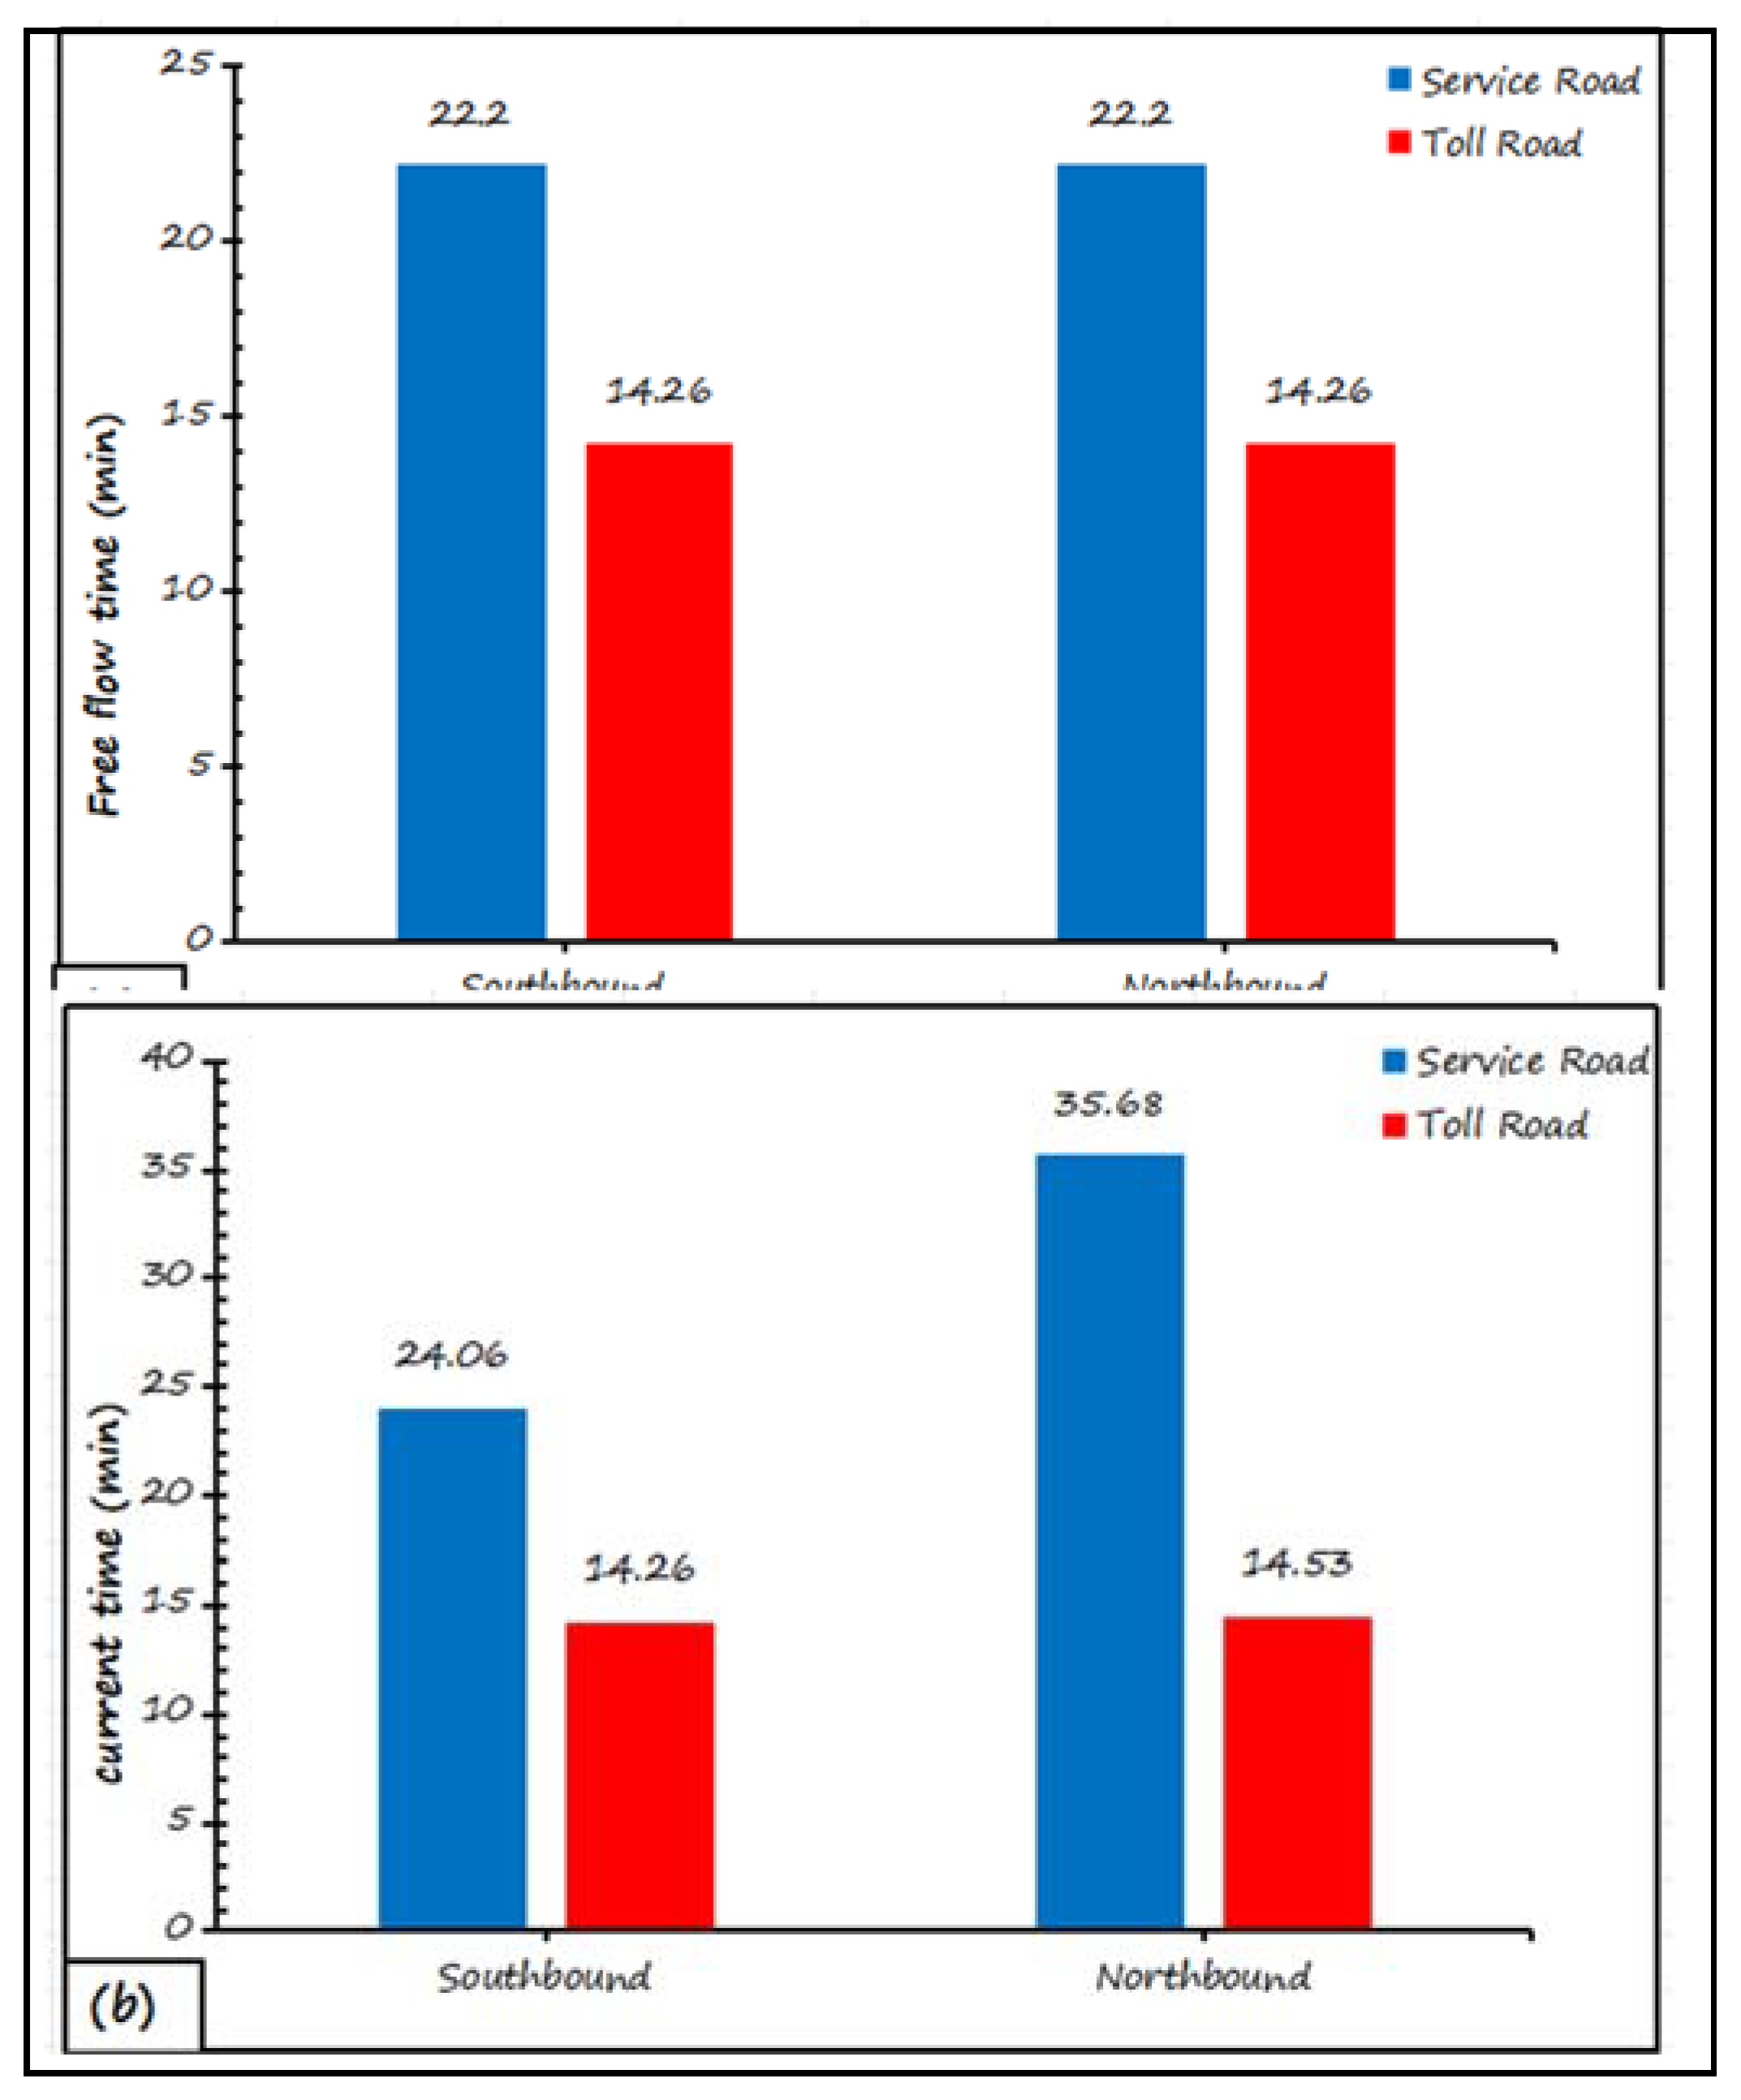
Figure 10.
(a)Details of speed and congested on the Southbound of main Road in the AM peak hour (2012), (b): Details of speed and congested on the Northbound of main Road in the AM peak hour (2012), (c): Details of speed and congested on the Southbound of Service Road (Toll) in the AM peak hour (2012) and (d):Details of speed and congested on the Northbound of Service Road (Toll) in the AM peak hour (2012).
Figure 10.
(a)Details of speed and congested on the Southbound of main Road in the AM peak hour (2012), (b): Details of speed and congested on the Northbound of main Road in the AM peak hour (2012), (c): Details of speed and congested on the Southbound of Service Road (Toll) in the AM peak hour (2012) and (d):Details of speed and congested on the Northbound of Service Road (Toll) in the AM peak hour (2012).
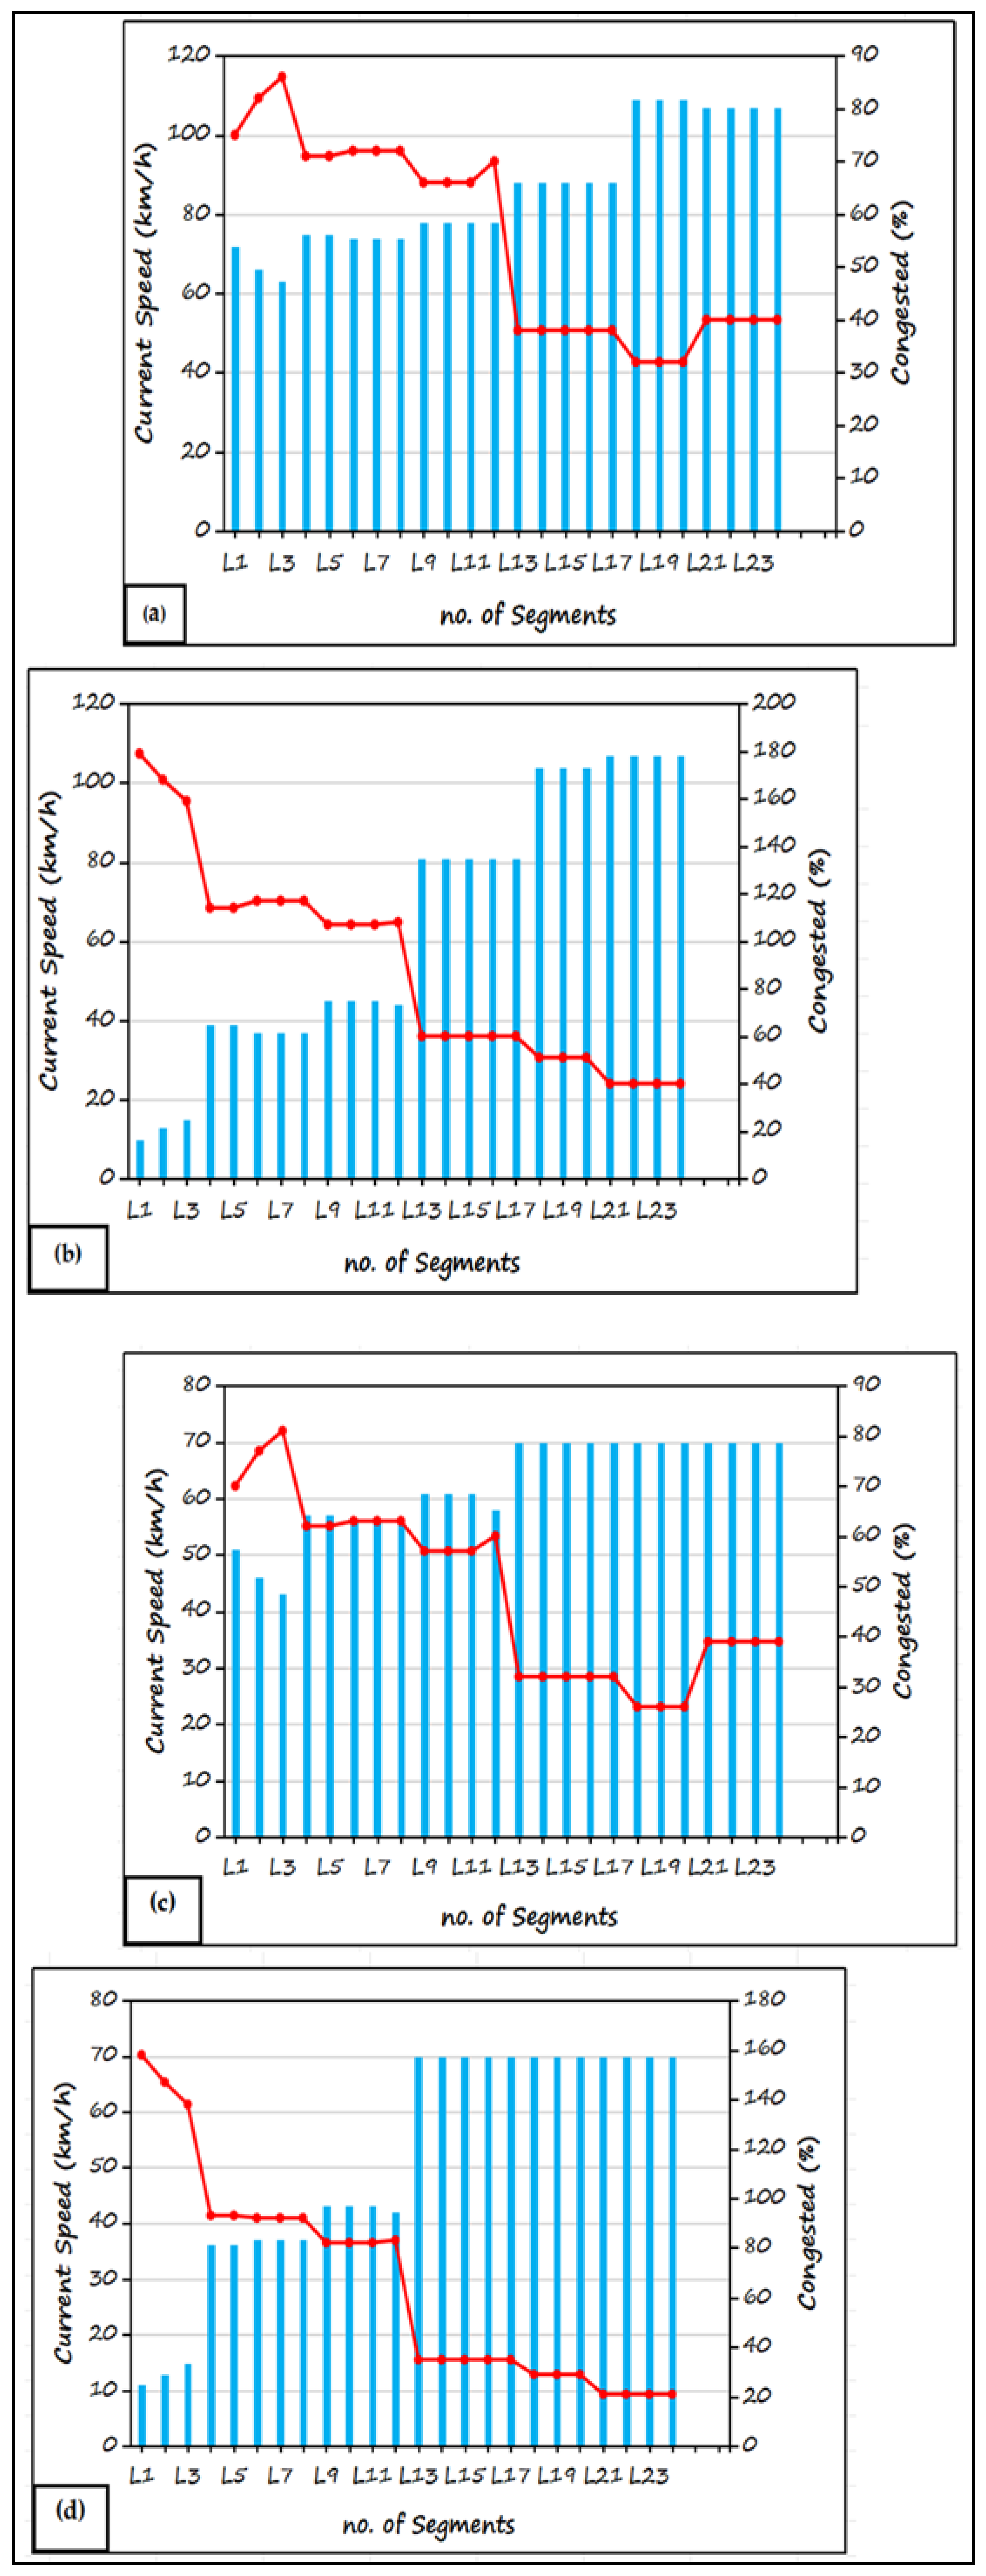
Figure 11.
(a)Free flow time in both direction in Service and Toll Road in the AM peak hour (2025), (b): Current time in both direction in Service and Toll Road in the AM peak hour (2025).
Figure 11.
(a)Free flow time in both direction in Service and Toll Road in the AM peak hour (2025), (b): Current time in both direction in Service and Toll Road in the AM peak hour (2025).
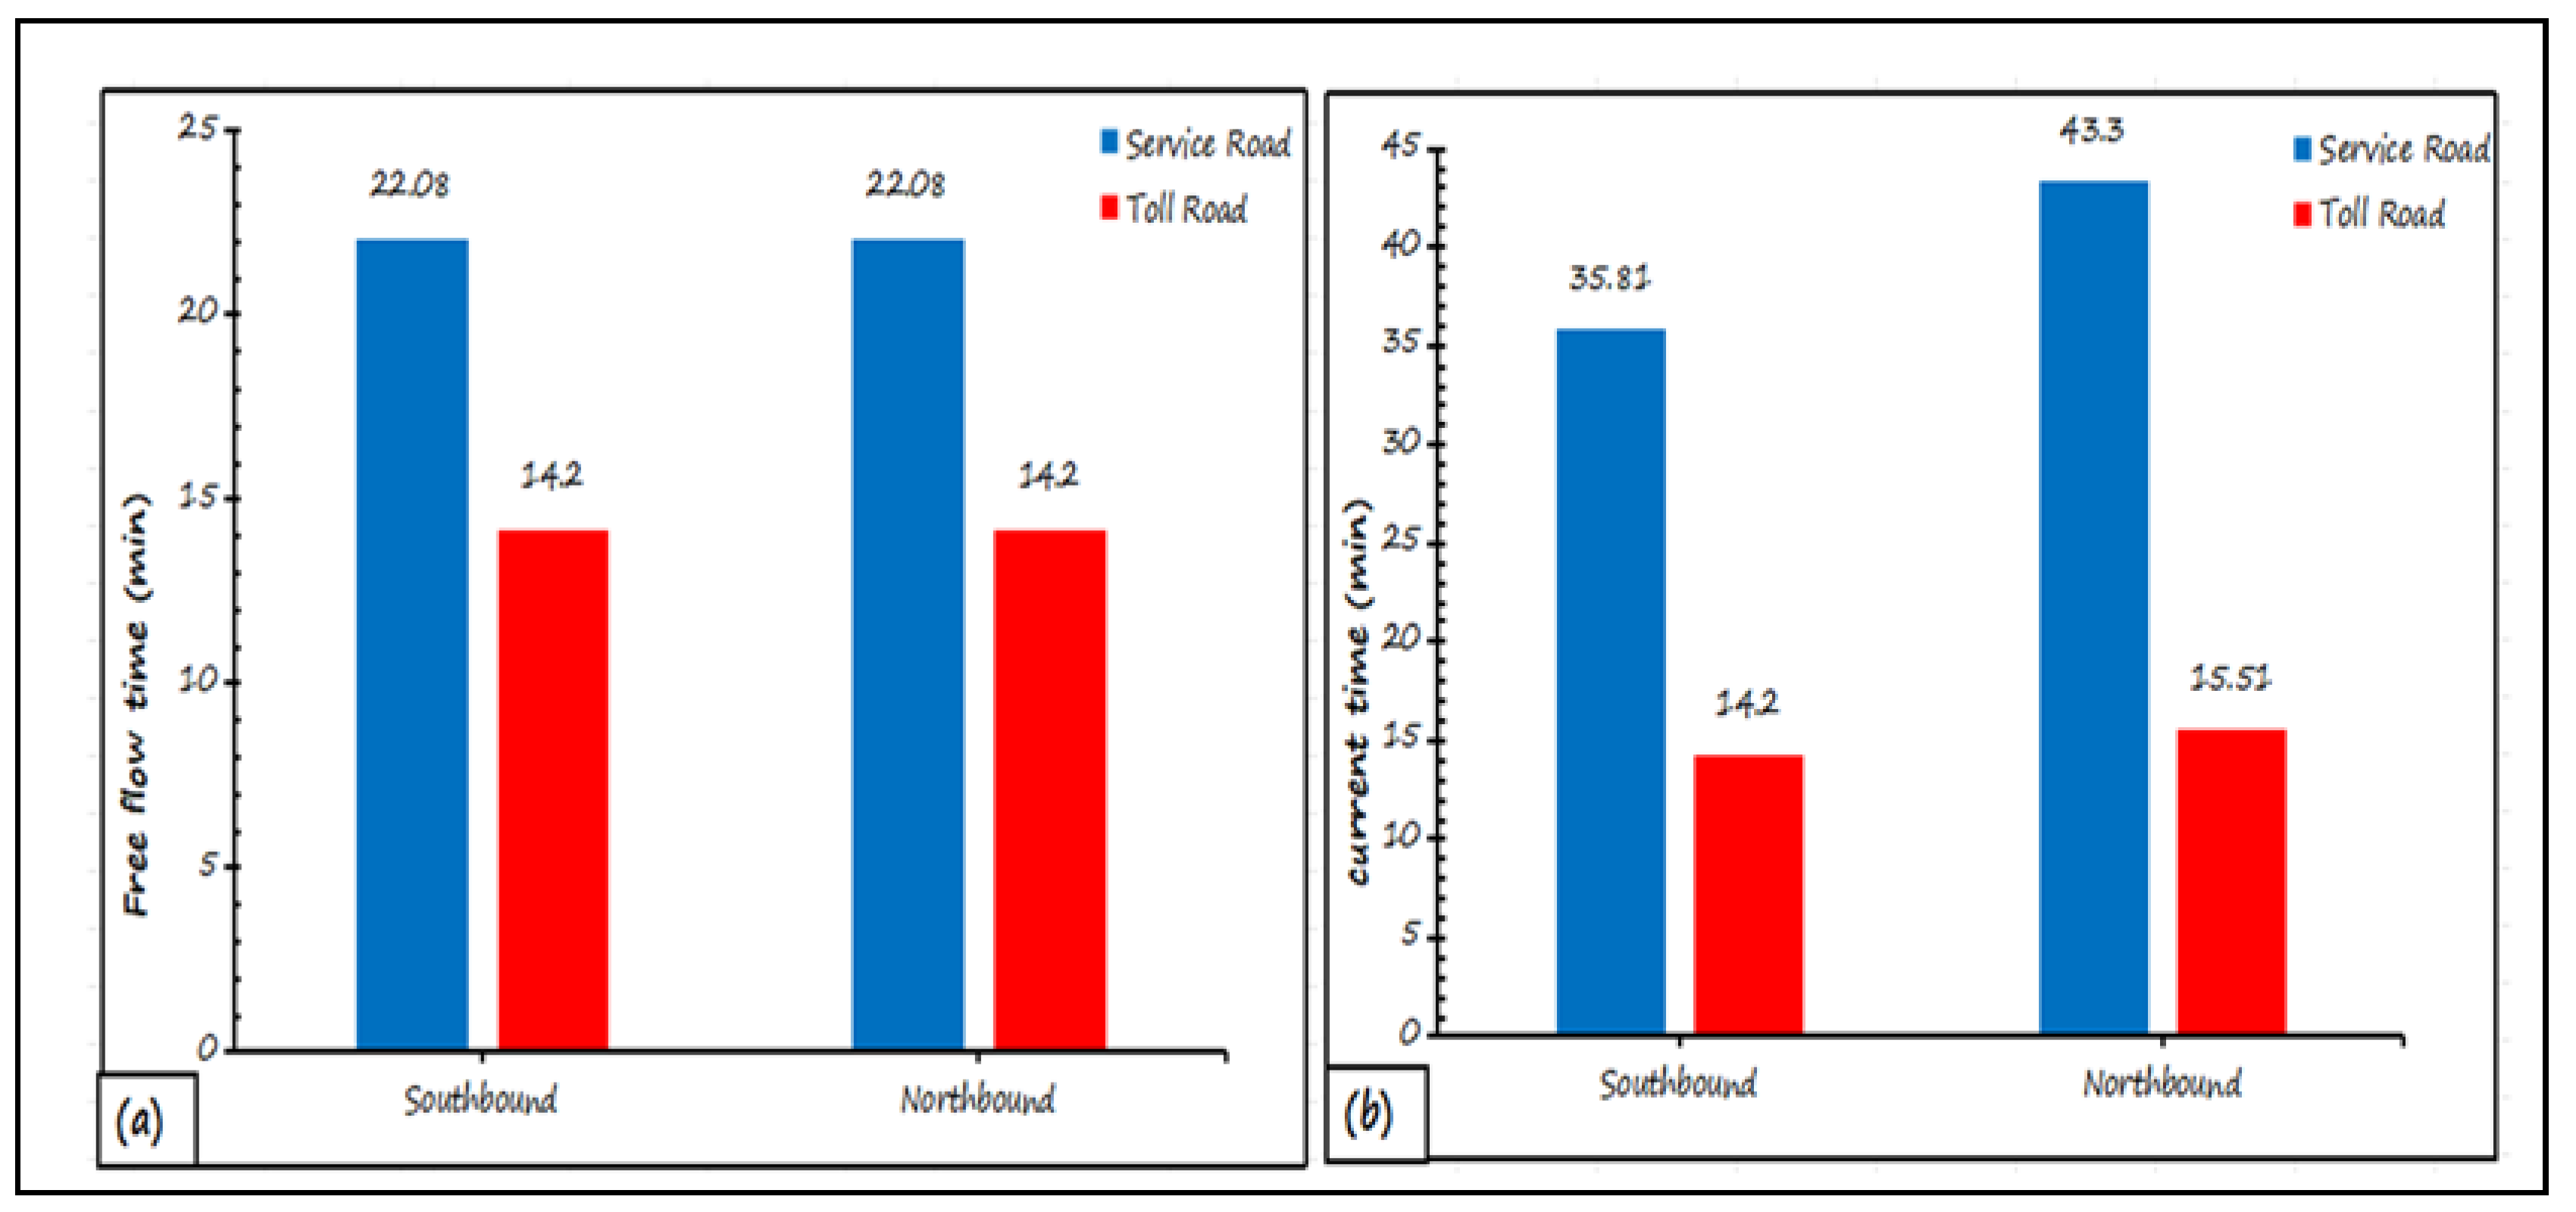
Figure 12.
(a)Details of speed and congested on the Southbound of main Road in the AM peak hour (2025), (b): Details of speed and congested on the Northbound of main Road in the AM peak hour (2025), (c): Details of speed and congested on the Southbound of Service Road (Toll) in the AM peak hour (2025) and (d):Details of speed and congested on the Northbound of Service Road (Toll) in the AM peak hour (2025).
Figure 12.
(a)Details of speed and congested on the Southbound of main Road in the AM peak hour (2025), (b): Details of speed and congested on the Northbound of main Road in the AM peak hour (2025), (c): Details of speed and congested on the Southbound of Service Road (Toll) in the AM peak hour (2025) and (d):Details of speed and congested on the Northbound of Service Road (Toll) in the AM peak hour (2025).
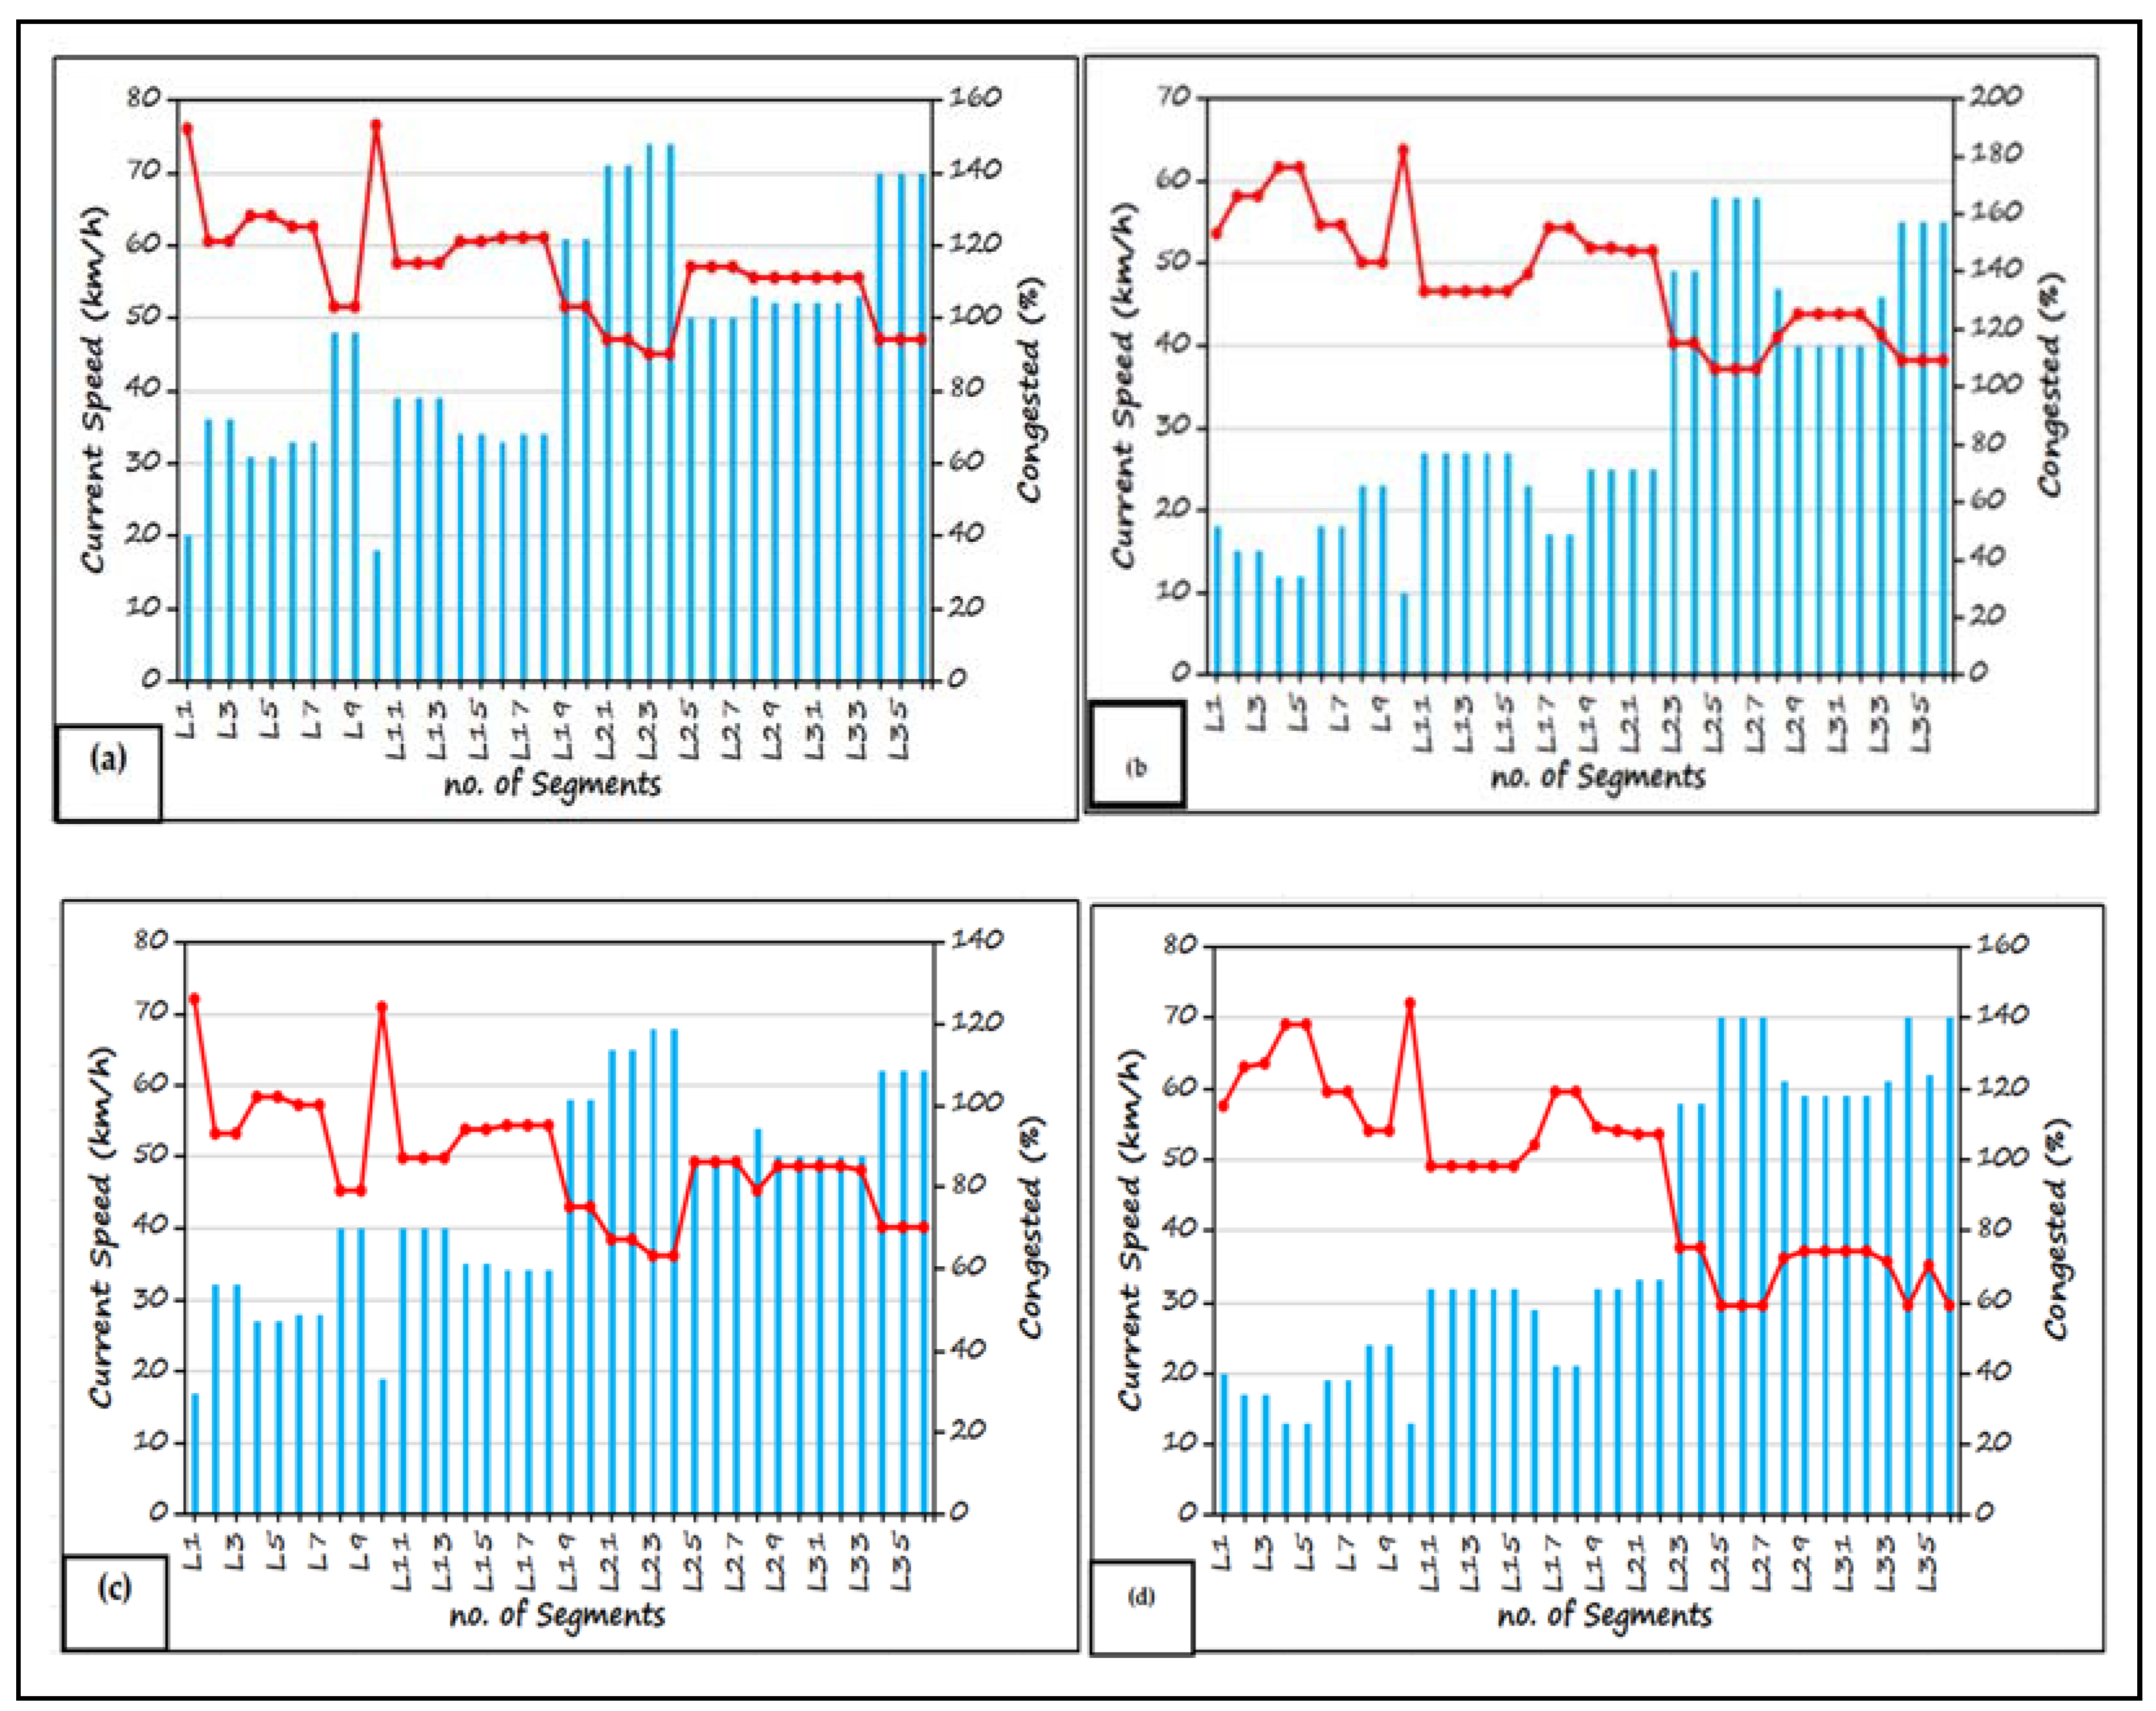
Figure 13.
The number and type of vehicles and the value revenue in AM peak hour for all scenarios (2025).
Figure 13.
The number and type of vehicles and the value revenue in AM peak hour for all scenarios (2025).
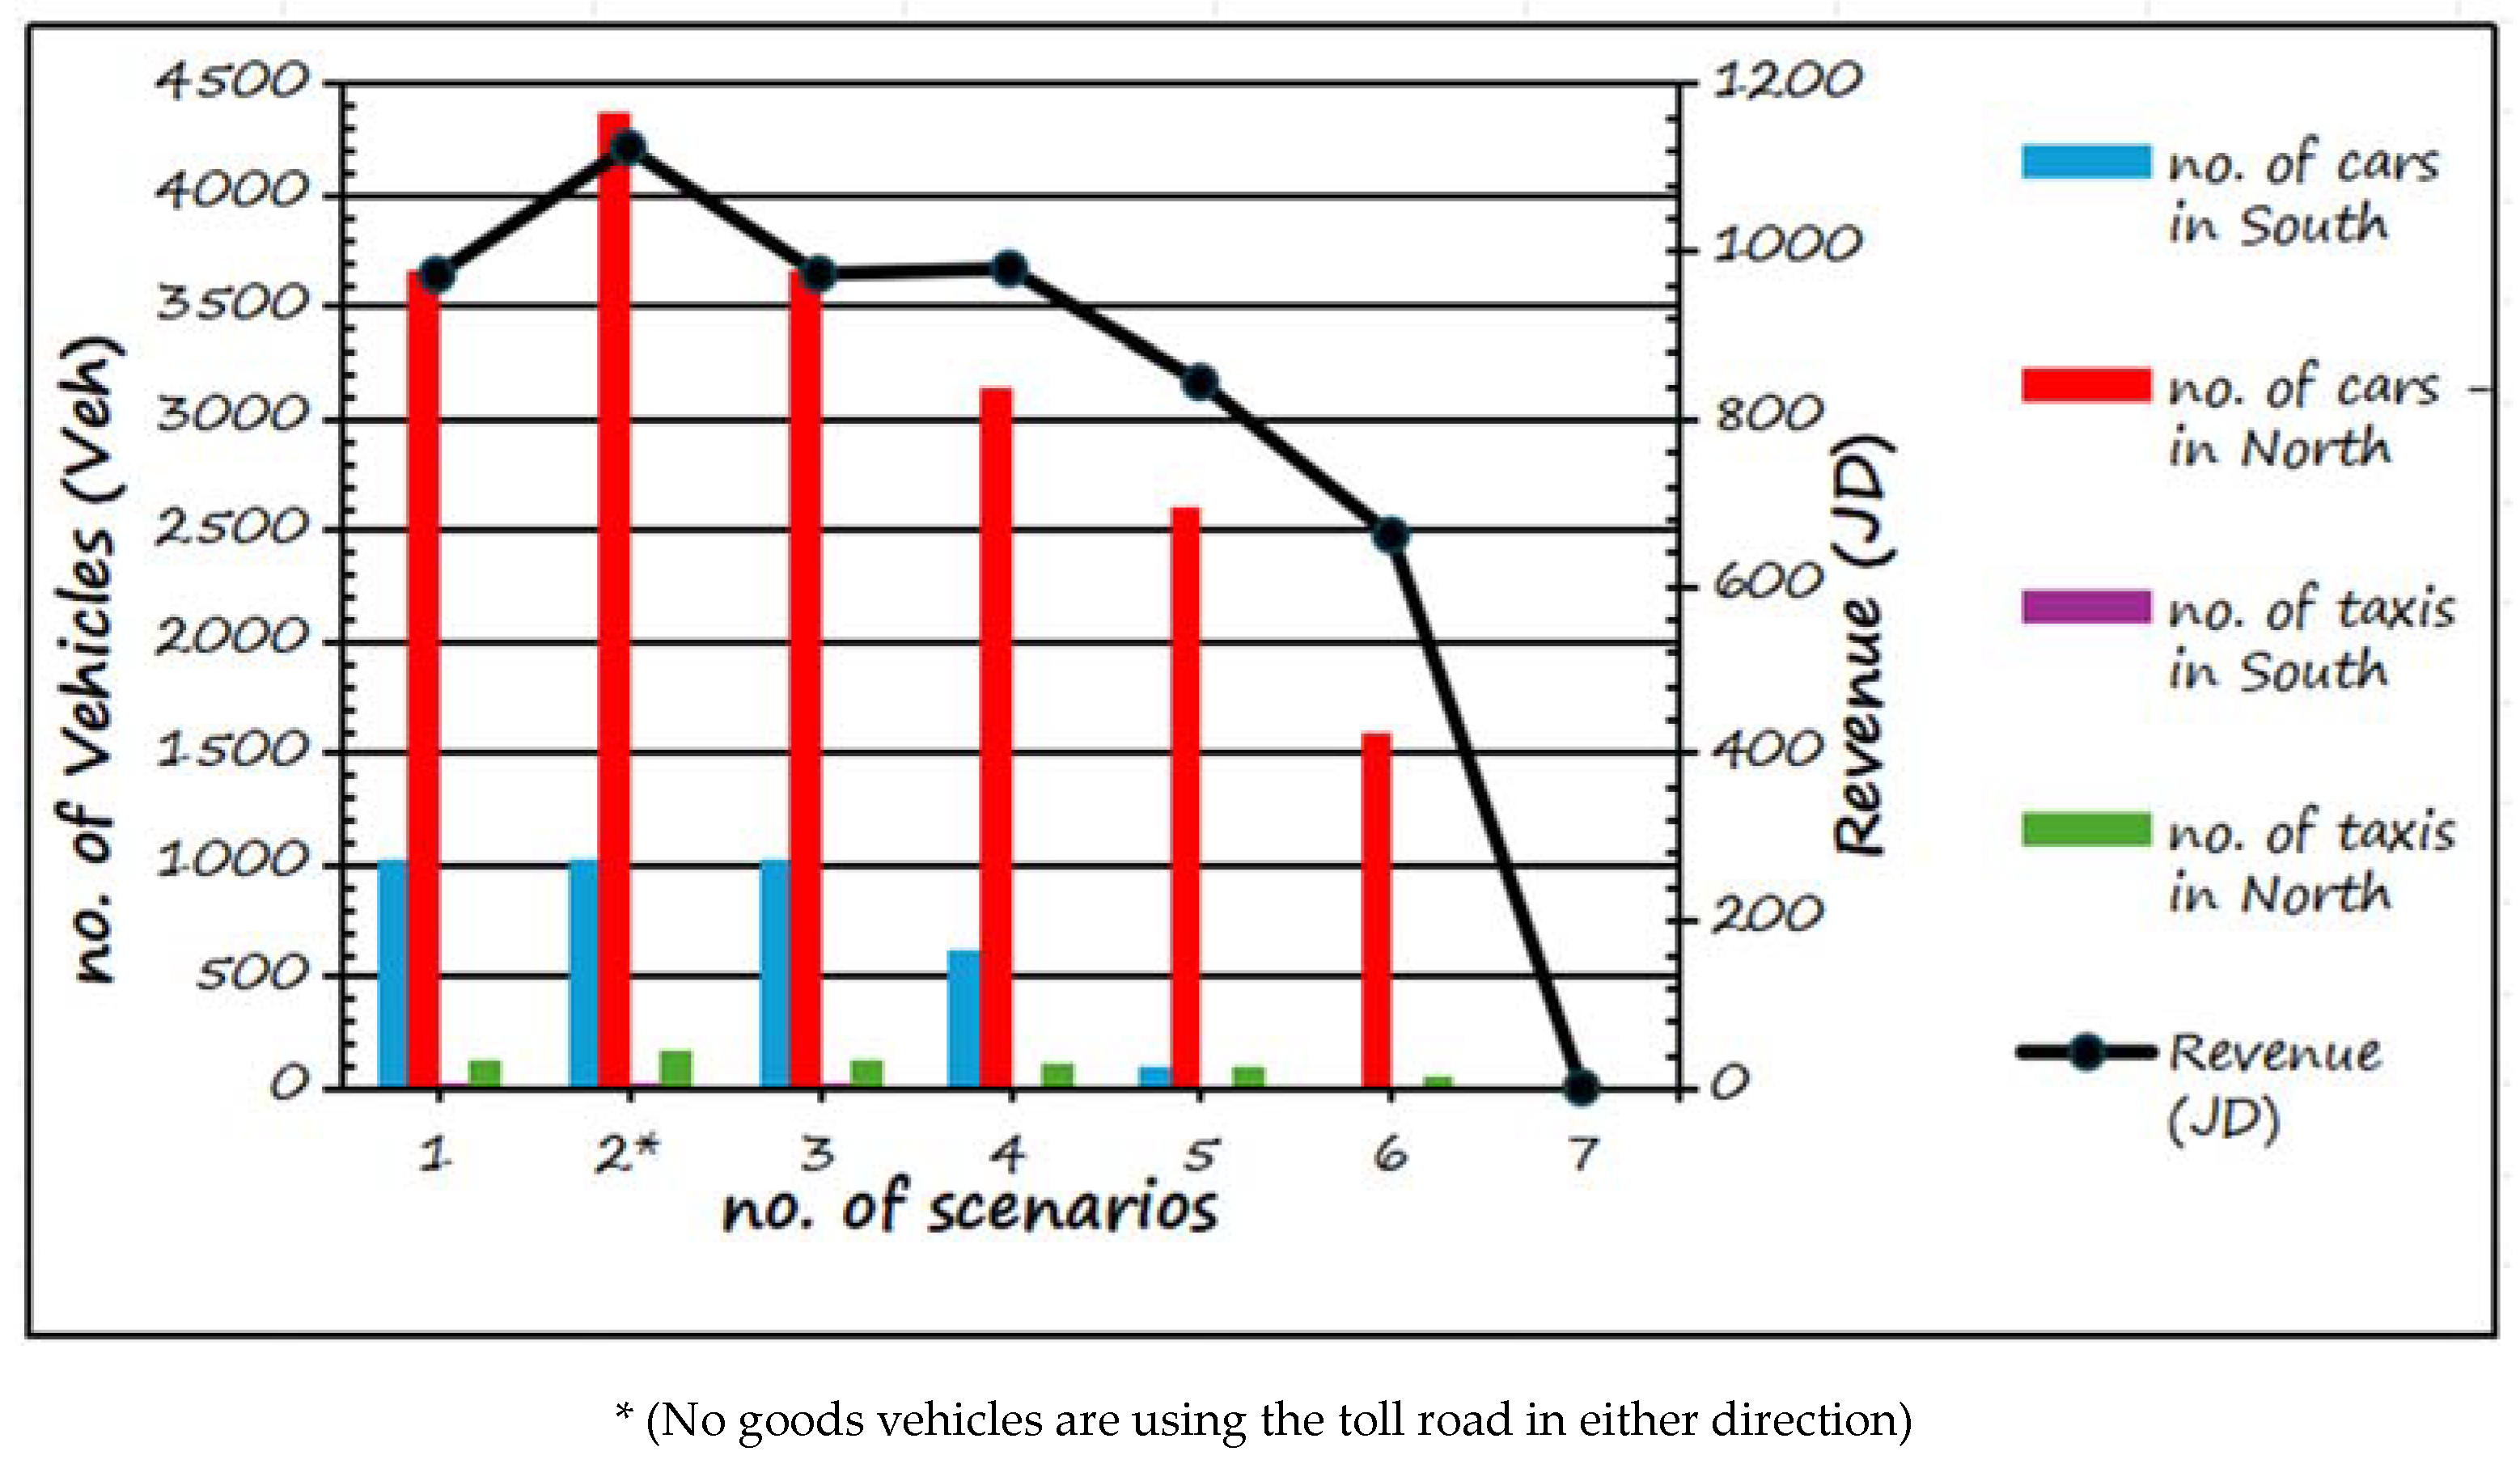
Table 1.
Literatures on road pricing from international countries, and Jordan compared to current study.
Table 1.
Literatures on road pricing from international countries, and Jordan compared to current study.
| Country (Ref.) | Outcomes Measure | Interventions | Traffic Simulation Software |
Statistical Software | The type of payment | Payment Method |
Findings |
|
|---|---|---|---|---|---|---|---|---|
| 1. | Flanders, Belgium (2011)[36] |
impact of road pricing on people's inclination to adjust their current travel behavior | the implementation of a variable road pricing system, with charges of 7 eurocents on roads at un-congested periods and 27 eurocents at congested periods, for each kilometer traveled by car. | N/A |
AMOS 4.0 |
Based distance | N/A | -Charges must surpass a minimum threshold and benefits should be clearly communicated for behavior change |
| 2. | Seattle (2012) | reduced travel time, increased travel reliability, reduced emissions, and reduced traffic accidents | Implementation of cordon-based road pricing and toll collection | N/A | N/A | N/A | Different scenarios | -road pricing in downtown Seattle is projected to have positive impacts on the city and region. |
| 3. | Jordan (2013) [26] |
To investigate the travel behavioral responses of affected road users to road pricing in Amma |
A pilot Survey questionnaire | N/A | SPSS | N/A | N/A | -half of the respondents reporting that they would use -the public transport system and car pooling instead of using -their vehicles while firms will increase the price of their goods |
| 4. | Denmark (2014) |
To investigate the effect of price and travel mode fairness and spatial equity in transit provision |
a web-based questionnaire for revealed preferences data collection |
structural equation modeling (SEM) |
SPSS | N/A | N/A | -Higher perceived service quality is associated with greater perceived ease of payment, leading to increased frequency of transit use. |
| 5. | Philippines (2016) [37] |
To reduce traffic congestion and fuel consumption | Manual Toll collection system, Electronic Toll Collection system | N/A | N/A | Based time | Different scenarios | -The optimal collection method is the Electronic Toll Collection (ETC) |
| 6. | Spain (2017) [25] |
Delay | participants received were information about and questions regarding three different road-pricing schemes: a surcharge to avoid congestion at any time (express toll lanes), a time-based pricing scheme (peak versus off-peak), and a flat fee-charging system (vignette). |
N/A | Binary choice Models | Based time | Different scenarios | -Support for pricing options is not linked to income, with attitudinal factors playing a more significant role in acceptability. Users' perceptions vary significantly depending on the type of charging scheme proposed. |
| 7. | Malaysia (2019)[34] |
Delay Queue length |
Real data from the position to evaluate the traffic congestion | VISSIM | N/A | Based distance | Different scenarios | The collection toll method is the mains case of congestion, queue and delay especially for heavy vehicles. |
| 8. | India (2021)[35] |
to reduce peak hour travel, traffic congestion and environmental impacts. | Revealed preference data is derived from real-life situations and is based on users' perceptions. |
N/A |
Multinomial Logit Model. |
Based distance |
Different scenarios |
The optimal collection method is the Electronic Toll Collection (ETC) and Open Road Tolling |
| 9. | Jordan (Current Study) |
-reduce traffic congestion assess the social and economic impacts |
Revealed preference data is obtained from actual situations and is grounded in users' perceptions | VISUM | SPSS | Based distance | Different scenarios | -The users found the most charging method to be based on traveled distance (54.02%) -the value of the toll to be equal 0.25 JD (34.08%). -The effective method is the Manual Toll Collection (MTC) in 2025 (cost : 126,935JD and the revenue : 1122.6 JD) |
(N.A : Not Available).
Table 2.
The Required Variables to Calculate Congestion Cost for 2011,2012, 2013 and 2024).
| Constant | Value (2011) | Value (2012) | Value (2013) | Current value(2024) |
|---|---|---|---|---|
| Avg. yearly income (JD)1 | 3276.80 | 3438.6 | 3662.83 | 425.07 |
| Working days2 | 255 | 255 | 255 | 255 |
| Working hours3 | 2040 | 2040 | 2040 | 2040 |
| Cost of Time4 | 1.21 | 1.27 | 1.36 | 1.66 |
| Avg. Cost of Fuel (L)5 | 0.620 JD/L | 0.723 JD/L | 0.800 JD/L | 0.925JD/L |
| Avg. Cost of Diesel (L)5 | 0.515 JD/L | 0.568 JD/L | 0.648 JD/L | 0.72 JD/L |
1 From the Regression Model in Appendix B 2 Source: Department of Statistics, Jordan (Annual Yearbook of Statistics 2011, 2012, 2013, 2024). 3 By subtracting all Fridays and official holidays in 2011, 2012 and 2013= (365-96-14); and based on job law section 56 in Jordan, the daily working hours =8hr, so working hour per year = 255*8 = 2040 hr. 4 By dividing the avg. yearly income by the working hours in 2011,2012 and 2013 = (1.21,1.27, 1.36 and 1.66) JD. 5 Source: Al-Manaseer Oil & Gas Group.
Table 4.
(a) Delay Time on the Airport Highway during AM Peak Hour for 2011 and (b): Delay cost, Fuel Consumption cost and congestion cost during AM Peak Hours.
Table 4.
(a) Delay Time on the Airport Highway during AM Peak Hour for 2011 and (b): Delay cost, Fuel Consumption cost and congestion cost during AM Peak Hours.

Table 5.
Summary of Socioeconomic and Demographic Characteristics.
| Gender | Age | Employment | Education | Monthly Household Income | |||||
|---|---|---|---|---|---|---|---|---|---|
| Male | 335 | 18-24 | 213 | Employed | 195 | Un-educated | 11 | <250 | 61 |
| 25-34 | 232 | School | 52 | 250-500 | 183 | ||||
| 35-44 | 97 | Self-Employed | 156 | Diploma | 66 | 500-750 | 177 | ||
| Female | 289 | 45-54 | 44 | Unemployed | 37 | Bachelor | 360 | 750-1000 | 116 |
| 55-64 | 19 | Retired | 28 | Master | 98 | 1000-1500 | 49 | ||
| >65 | 19 | Student | 208 | PhD | 37 | >1500 | 38 | ||
Table 6.
Trip Characteristics.
| Number of trips/week | Trip Purpose | ||
|---|---|---|---|
| Never | 6.80% | Work | 38.50% |
| <2 | 19.80% | Travel | 24.20% |
| 2-4 | 39.90% | Studying | 35.40% |
| >4 | 16.50% | Social relations | 1.9% |
| Every day | 16.90% | ||
Table 7.
Responses to Occurrence of Traffic Congestion.
| Congestion Occurrence | Frequency | Percentage |
|---|---|---|
| Rarely | 201 | 32.20% |
| Sometimes | 374 | 59.90% |
| Always | 49 | 7.90% |
| Total | 624 | 100 |
Table 8.
Advantages of Road Pricing.
| Advantage | Low Effect | Moderate Effect | High Effect |
|---|---|---|---|
| Improve highway quality | 18.30% | 48.40% | 33.30% |
| Reducing Environmental pollution | 18.40% | 40.40% | 41.20% |
| Increase in the use of transit | 18.10% | 43.90% | 38% |
| Reduction in congestion | 15.70% | 49.40% | 34.90% |
Table 9.
Means and Standard Deviations of Responses.
| Statement | Mean | Standard deviation | |
|---|---|---|---|
| 1 | Applying road pricing improves highway quality | 2.15 | .703 |
| 2 | Applying road pricing reduces environmental pollution | 2.23 | .738 |
| 3 | Applying road pricing increases the use of transit | 2.20 | .723 |
| 4 | Applying road pricing reduces traffic congestion | 2.19 | .686 |
Table 10.
One way t-test of Advantages.
| Mean | Standard deviation | T | df | Sig |
|---|---|---|---|---|
| 2.19 | 0.462 | 10.390 | 623 | 000 |
Table 11.
Disadvantages of road pricing.
| Disadvantage | Low Effect | Moderate Effect | High Effect |
|---|---|---|---|
| Not Fair | 22.30% | 40.70% | 37% |
| Loss of privacy | 23.70% | 46.20% | 30.10% |
Table 12.
One way t-test of Disadvantages.
| Mean | Standard deviation | T | df | Sig |
|---|---|---|---|---|
| 2.105 | 0.593 | 4.451 | 623 | 000 |
Table 14.
Details of Charging Method Costs.
| Techniques | The cost of one (JD) | Total Number |
Total Cost (Manual Method) |
Total Cost (Automatic Toll Method) |
|---|---|---|---|---|
| Monitoring Cameras | 4,000 | 9 | 36,000JD | - |
| Violation Cameras | 40,000 | 9 | - | 360,000JD |
| Booths | 9,000 | 9 | 81,000JD | - |
| Signs in Advance of a Toll Point | 443.75 | 6 | 2,662.5JD | 2,662.5JD |
| Signs at a toll Point | 303.75 | 3 | 911.25JD | 911.25JD |
| Pavement marking at toll points | 150 | 9 | 1,350JD | 1,350JD |
| Direction Signs | 443.75 | 3 | 1,331.25JD | 1,331.25JD |
| poly venile chloride cone | 14 | 70 | 980JD | 980JD |
| Employer | 300 | 9 | 2,700JD | 2,700JD |
| Toll Machine | 56,000 | _____ | _______ | 504,000 JD |
| Total Cost | 126,935JD | 873,935JD | ||
*(Note: excluding the maintenance costs and cycle life).
Table 15.
The (a): Travel Time in AM peak hour on both roads in 2012(without pricing) and (b): Travel time on the main road and toll road in AM peak hour (2012).
Table 15.
The (a): Travel Time in AM peak hour on both roads in 2012(without pricing) and (b): Travel time on the main road and toll road in AM peak hour (2012).
| (a)Travel Time in AM peak hour on both roads in 2012(without pricing) | ||||
| Travel Time | Main Road | Service Road | ||
| Southbound | Northbound | Southbound | Northbound | |
| Free flow time (min) | 15.33 | 15.33 | 22.20 | 22.20 |
| Current time (min) | 16.76 | 30.80 | 24.06 | 35.68 |
| (b)Travel time on the main road and toll road in AM peak hour (2012) | ||||
| Travel Time | Main Road | Toll Road | ||
| Southbound | Northbound | Southbound | Northbound | |
| Free flow time (min) | 15.33 | 15.33 | 14.26 | 14.26 |
| Current time (min) | 16.76 | 30.80 | 14.26 | 14.53 |
Table 16.
(a)Travel Time in the AM peak hour on both roads, (b): The scenarios of different value of price with different values of revenue in AM peak hour, and (c): Travel Time in the AM peak hour on both roads in 2025.
Table 16.
(a)Travel Time in the AM peak hour on both roads, (b): The scenarios of different value of price with different values of revenue in AM peak hour, and (c): Travel Time in the AM peak hour on both roads in 2025.
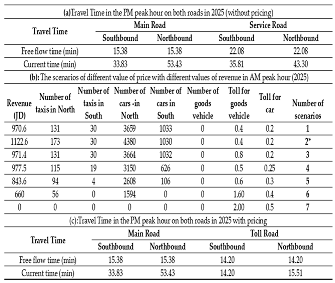
Disclaimer/Publisher’s Note: The statements, opinions and data contained in all publications are solely those of the individual author(s) and contributor(s) and not of MDPI and/or the editor(s). MDPI and/or the editor(s) disclaim responsibility for any injury to people or property resulting from any ideas, methods, instructions or products referred to in the content. |
© 2024 by the authors. Licensee MDPI, Basel, Switzerland. This article is an open access article distributed under the terms and conditions of the Creative Commons Attribution (CC BY) license (http://creativecommons.org/licenses/by/4.0/).
Copyright: This open access article is published under a Creative Commons CC BY 4.0 license, which permit the free download, distribution, and reuse, provided that the author and preprint are cited in any reuse.


