Submitted:
30 July 2024
Posted:
31 July 2024
You are already at the latest version
Abstract
GeoQuickView is a software application designed to bridge the gap between advanced Geographic Information Systems (GIS) and users with no prior experience in GIS. This paper explores the development, functionality, and user-centric design of GeoQuickView, highlighting its capabilities in loading, visualizing, and analyzing geographic data. Emphasis is placed on its use with LiDAR-derived Digital Terrain Models (DTMs), user-friendly interface, and robust tools for measurement and digitization. The application’s role in democratizing access to complex geospatial data is discussed. The software was designed to work seamlessly with data from Romania and can display various types of raster elevation data. While the Coordinate Reference System (CRS) may present challenges for data extraction outside of Romania, the data can still be visualized effectively within the app. The application is available upon request.
Keywords:
Lidar
; GeoQuickVeiw
; Visualization
; Software
; Hillshade
1. Introduction
Geographic Information Systems (GIS) have revolutionized the way we analyze and visualize spatial data, enabling detailed insights into various fields such as archaeology, environmental science, and urban planning. However, the complexity of traditional GIS software often restricts its use to trained professionals. GeoQuickView aims to overcome this barrier by providing a simple yet powerful tool for visualizing and analyzing geographic data, specifically designed for users with no prior GIS experience.
Developed by Dr. Alexandru Hegyi at the West University of Timisoara, GeoQuickView is particularly adept at handling LiDAR-derived Digital Terrain Models (DTMs), making it a valuable asset for projects like the Laki II project in Romania. This paper details the development process, core functionalities, and user experience design of GeoQuickView, as well as its applications and future prospects.
2. Development and Design Philosophy
GeoQuickView was developed with the primary goal of making GIS accessible to a broader audience. The development prioritized simplicity, ease of use, and functionality throughout the design process. The application leverages several powerful libraries to achieve its goals:
- GDAL (Geospatial Data Abstraction Library): Used for handling raster data, including loading, processing, and exporting various raster formats.
- PyQt5: A set of Python bindings for Qt libraries, used to create the graphical user interface.
- Shapely: A library for geometric operations, used for handling and analyzing spatial data.
- numpy: A library for numerical operations, used for processing raster data.
- pyproj: A library for cartographic projections and coordinate transformations.
- cryptography: A library for encryption and decryption, used for managing license keys.
- zipfile: A standard library module for handling ZIP files, used for extracting raster data.
- tempfile: A standard library module for creating temporary files and directories.
The combination of these libraries allowed to create a robust application that hides the complexity of GIS operations behind an intuitive interface. This approach ensures that users can focus on their data and analysis without needing to understand the underlying technical details.
3. Key Features and Functionalities
3.1. Loading Raster Data
One of the core features of GeoQuickView is its ability to load and visualize raster data from various formats, including .tif, .tiff, .ecw, and .zip files. This capability is crucial for handling LiDAR-derived DTMs, which are often distributed in compressed formats. The application automatically extracts and processes these files, displaying the data in an easy-to-understand visual format. The use of GDAL ensures compatibility with a wide range of raster data formats and efficient data processing.
The raster loading process involves several steps:
- File Selection: Users select a raster file from their filesystem using a file dialog.
- Data Extraction: If the selected file is a zip archive, the application extracts its contents to a temporary directory.
- Raster Processing: GDAL is used to open the raster file, read its data, and obtain metadata such as geotransform and projection information.
- Display: The raster data is rendered on the map canvas, with the application handling coordinate transformations and scaling as needed.
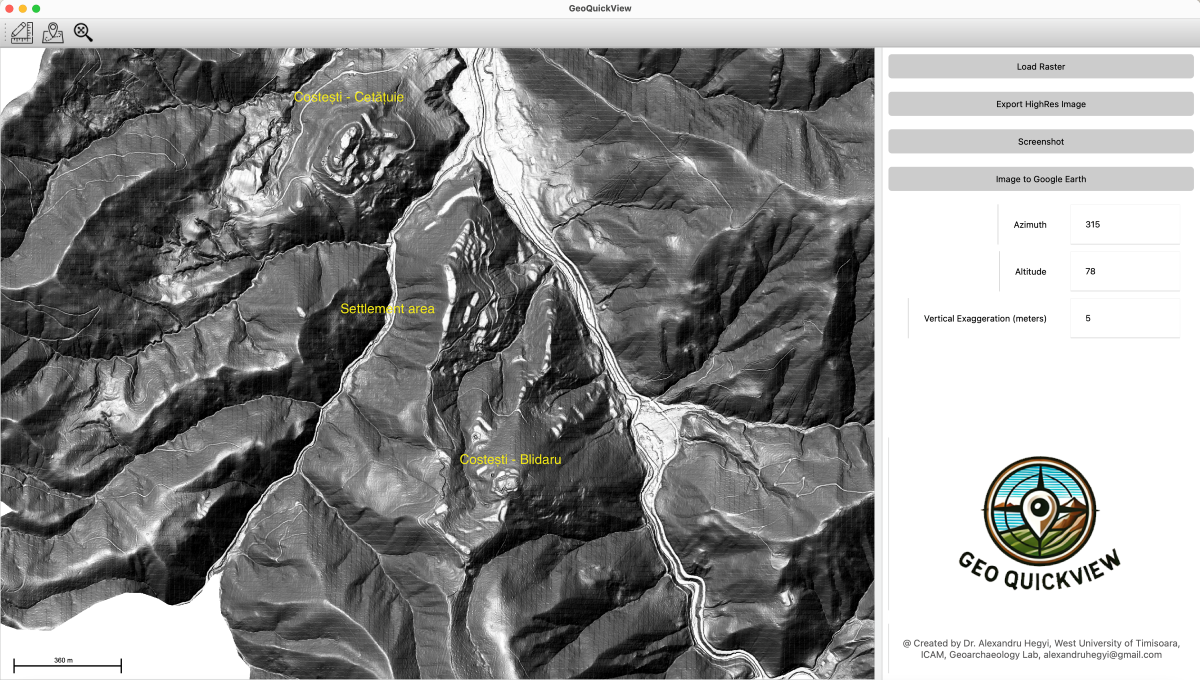
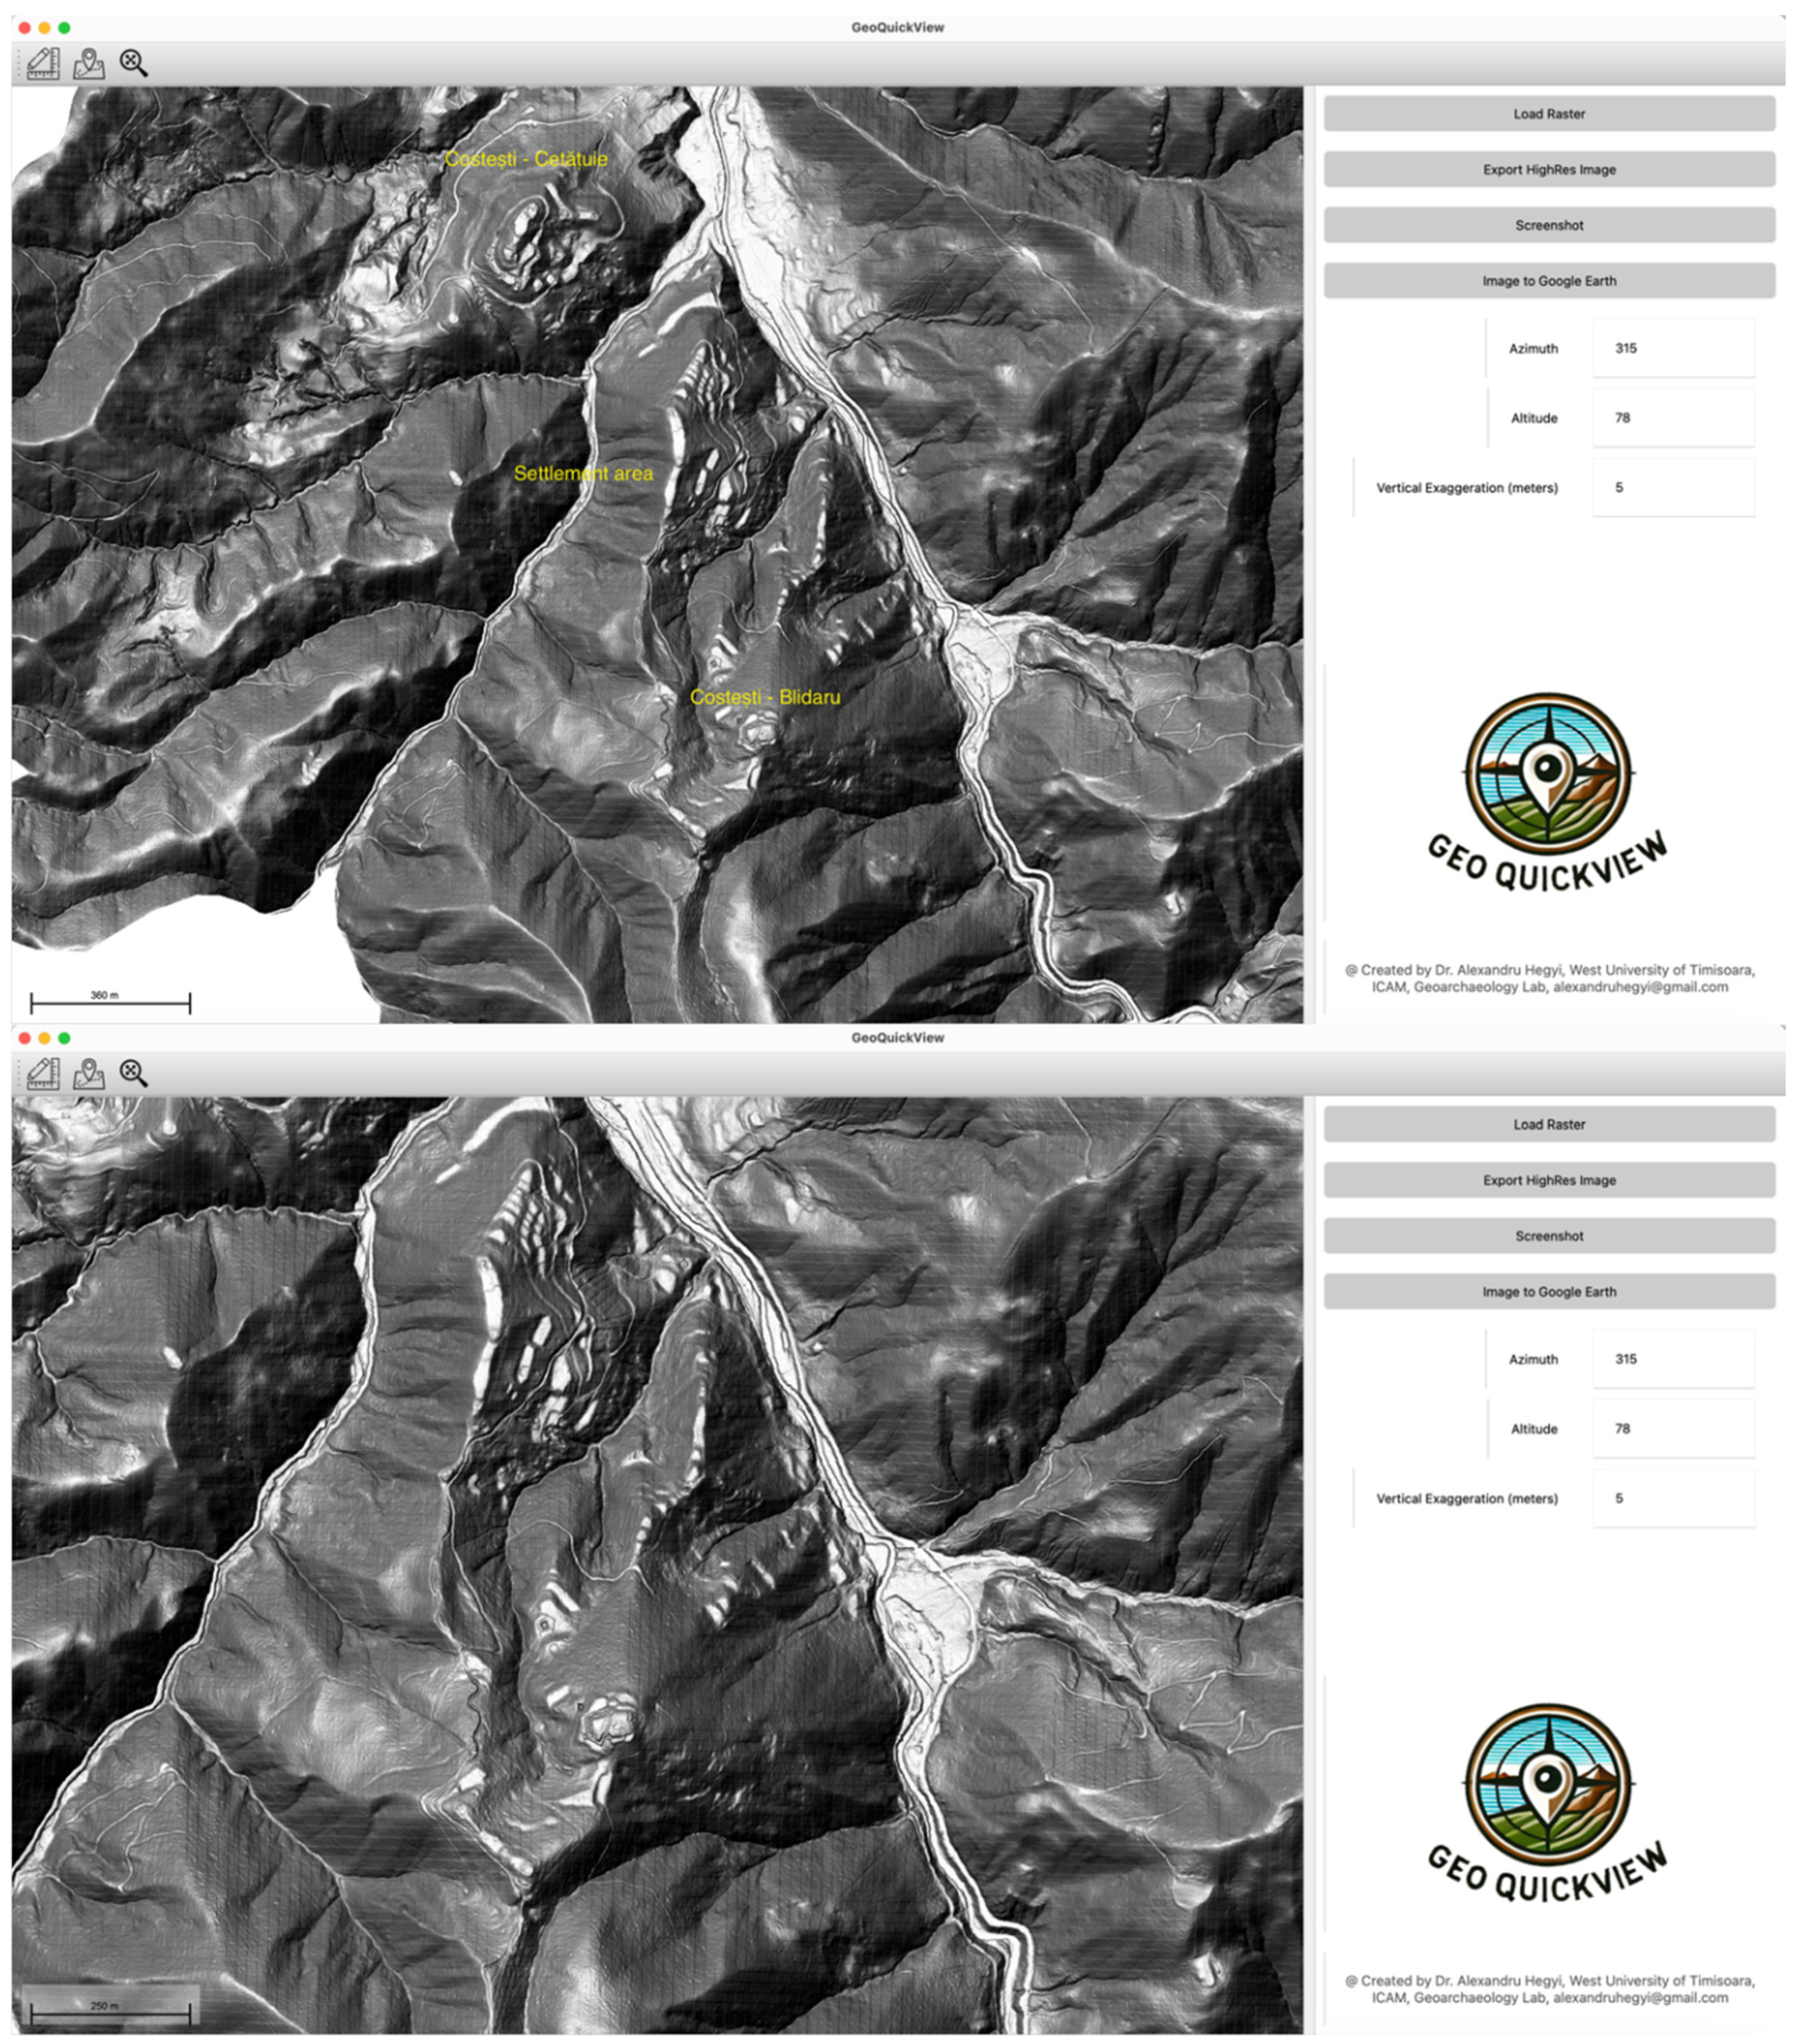
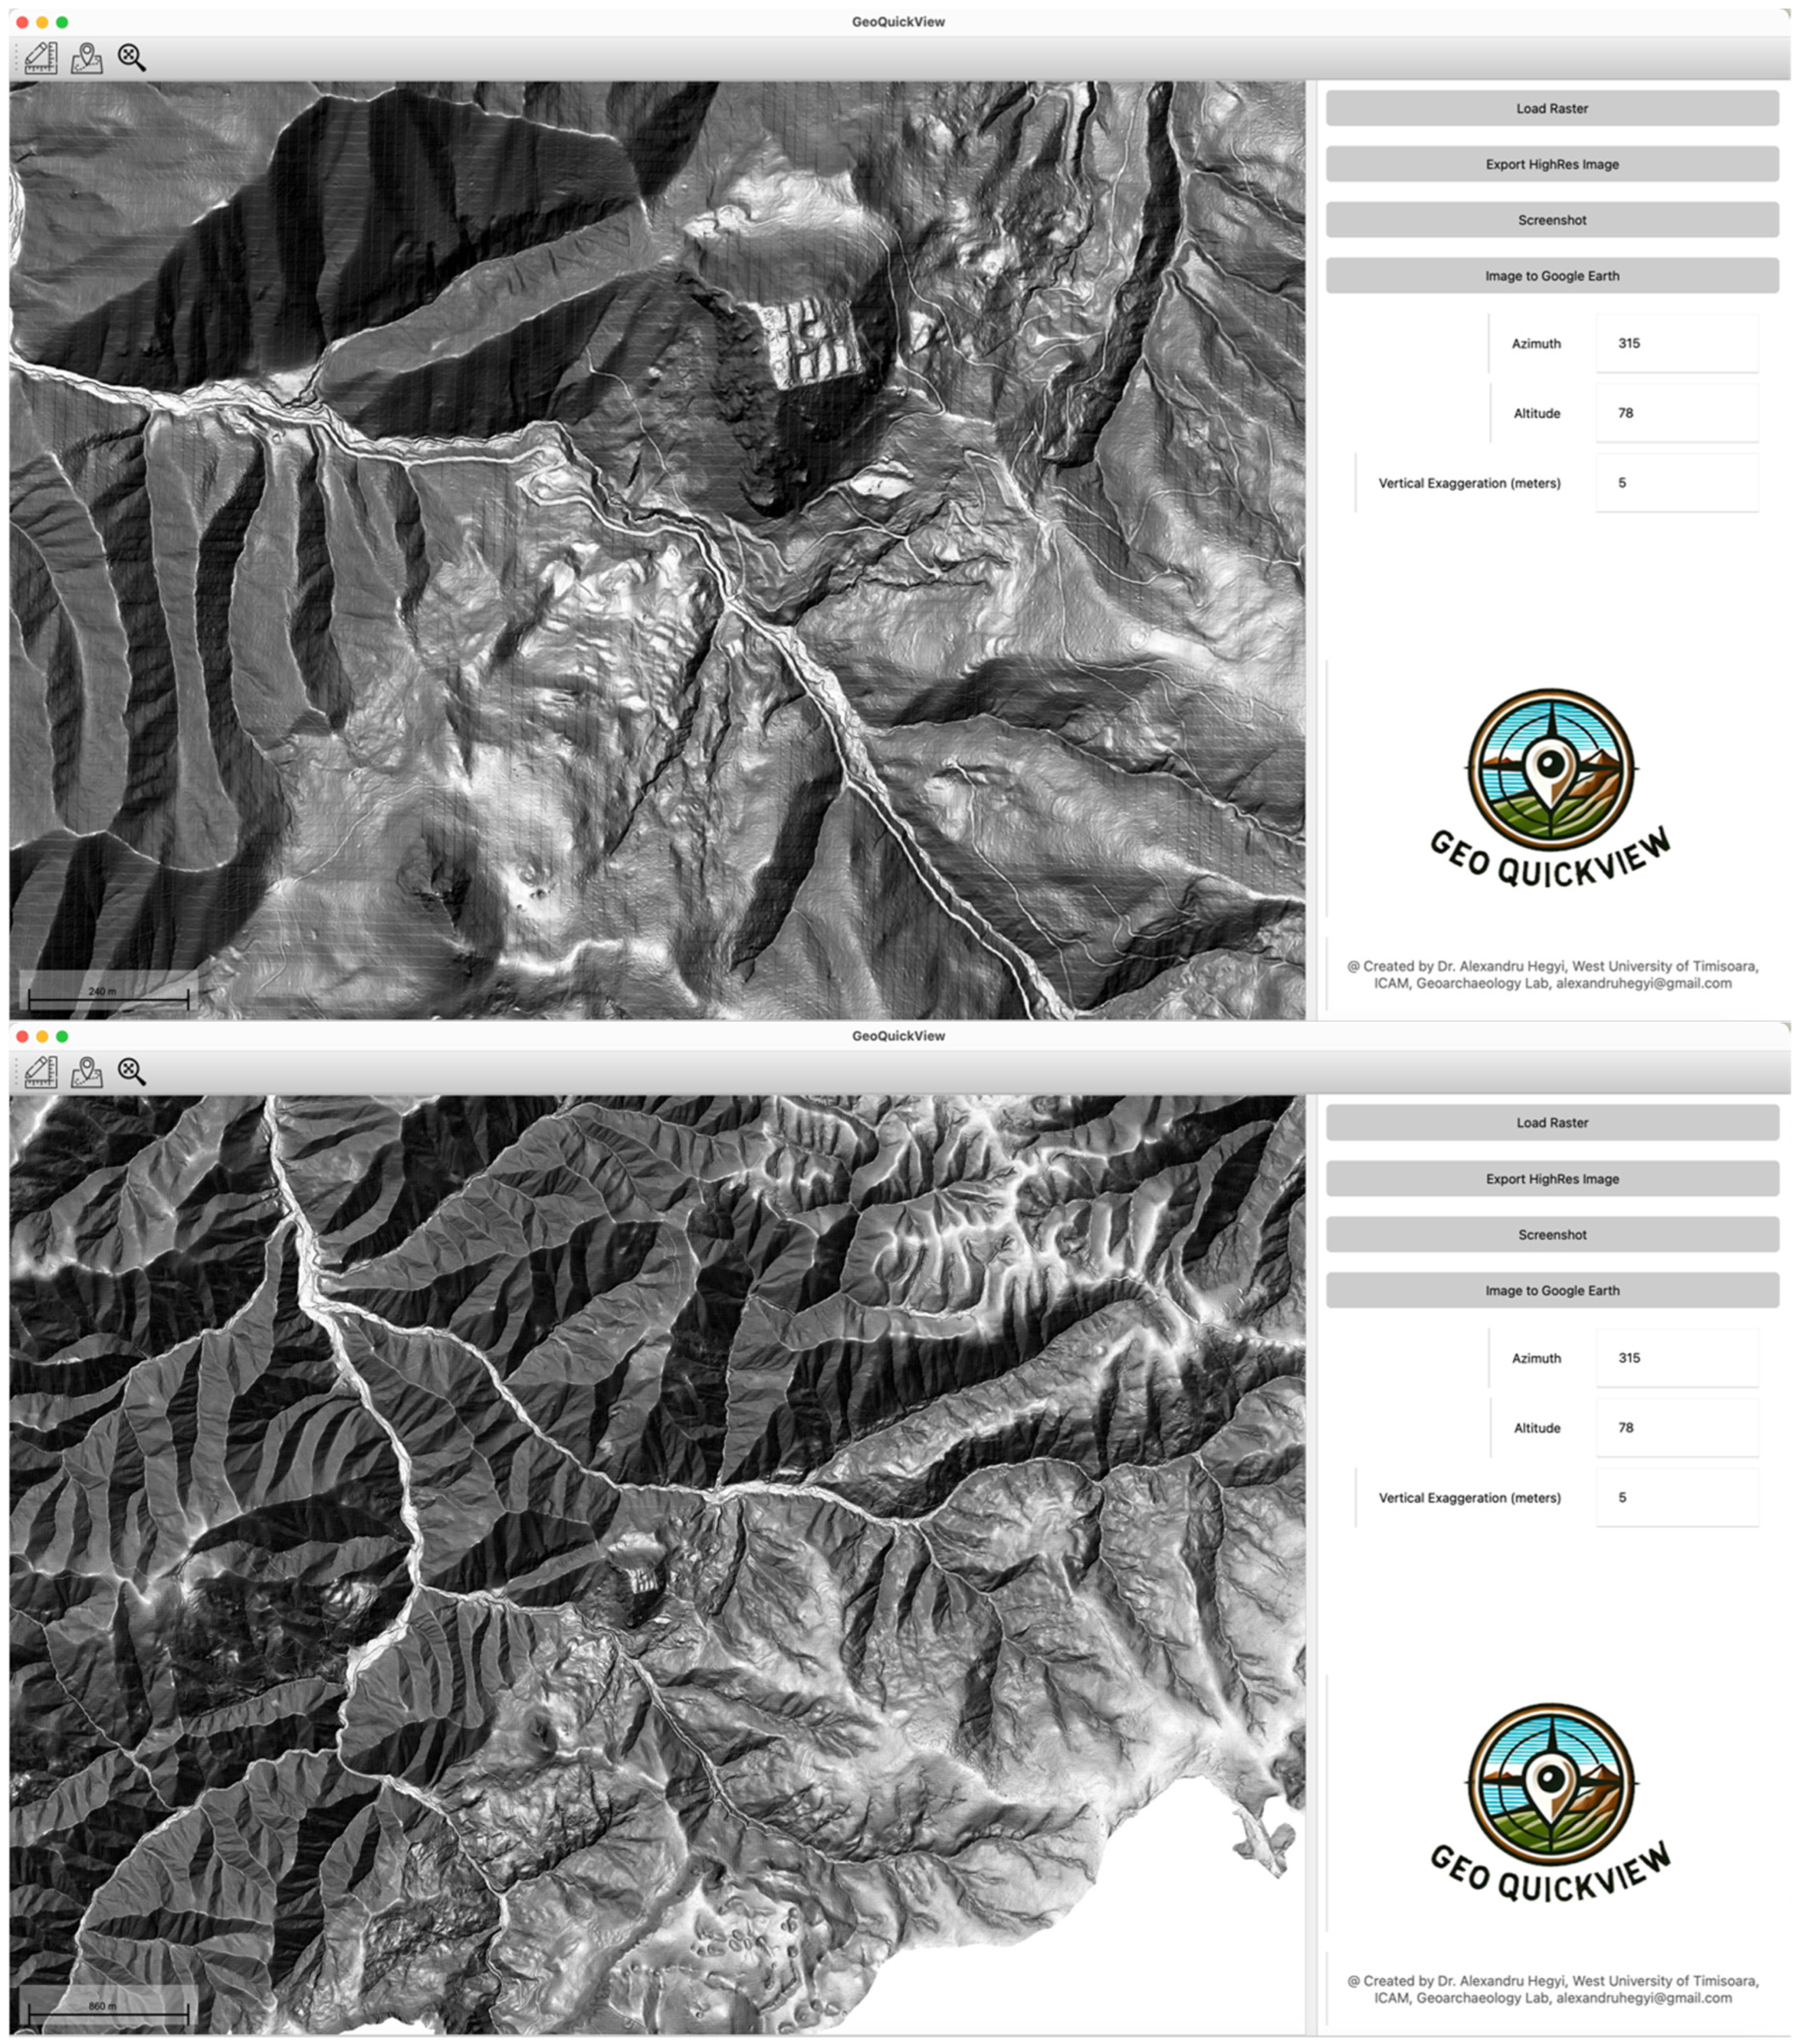
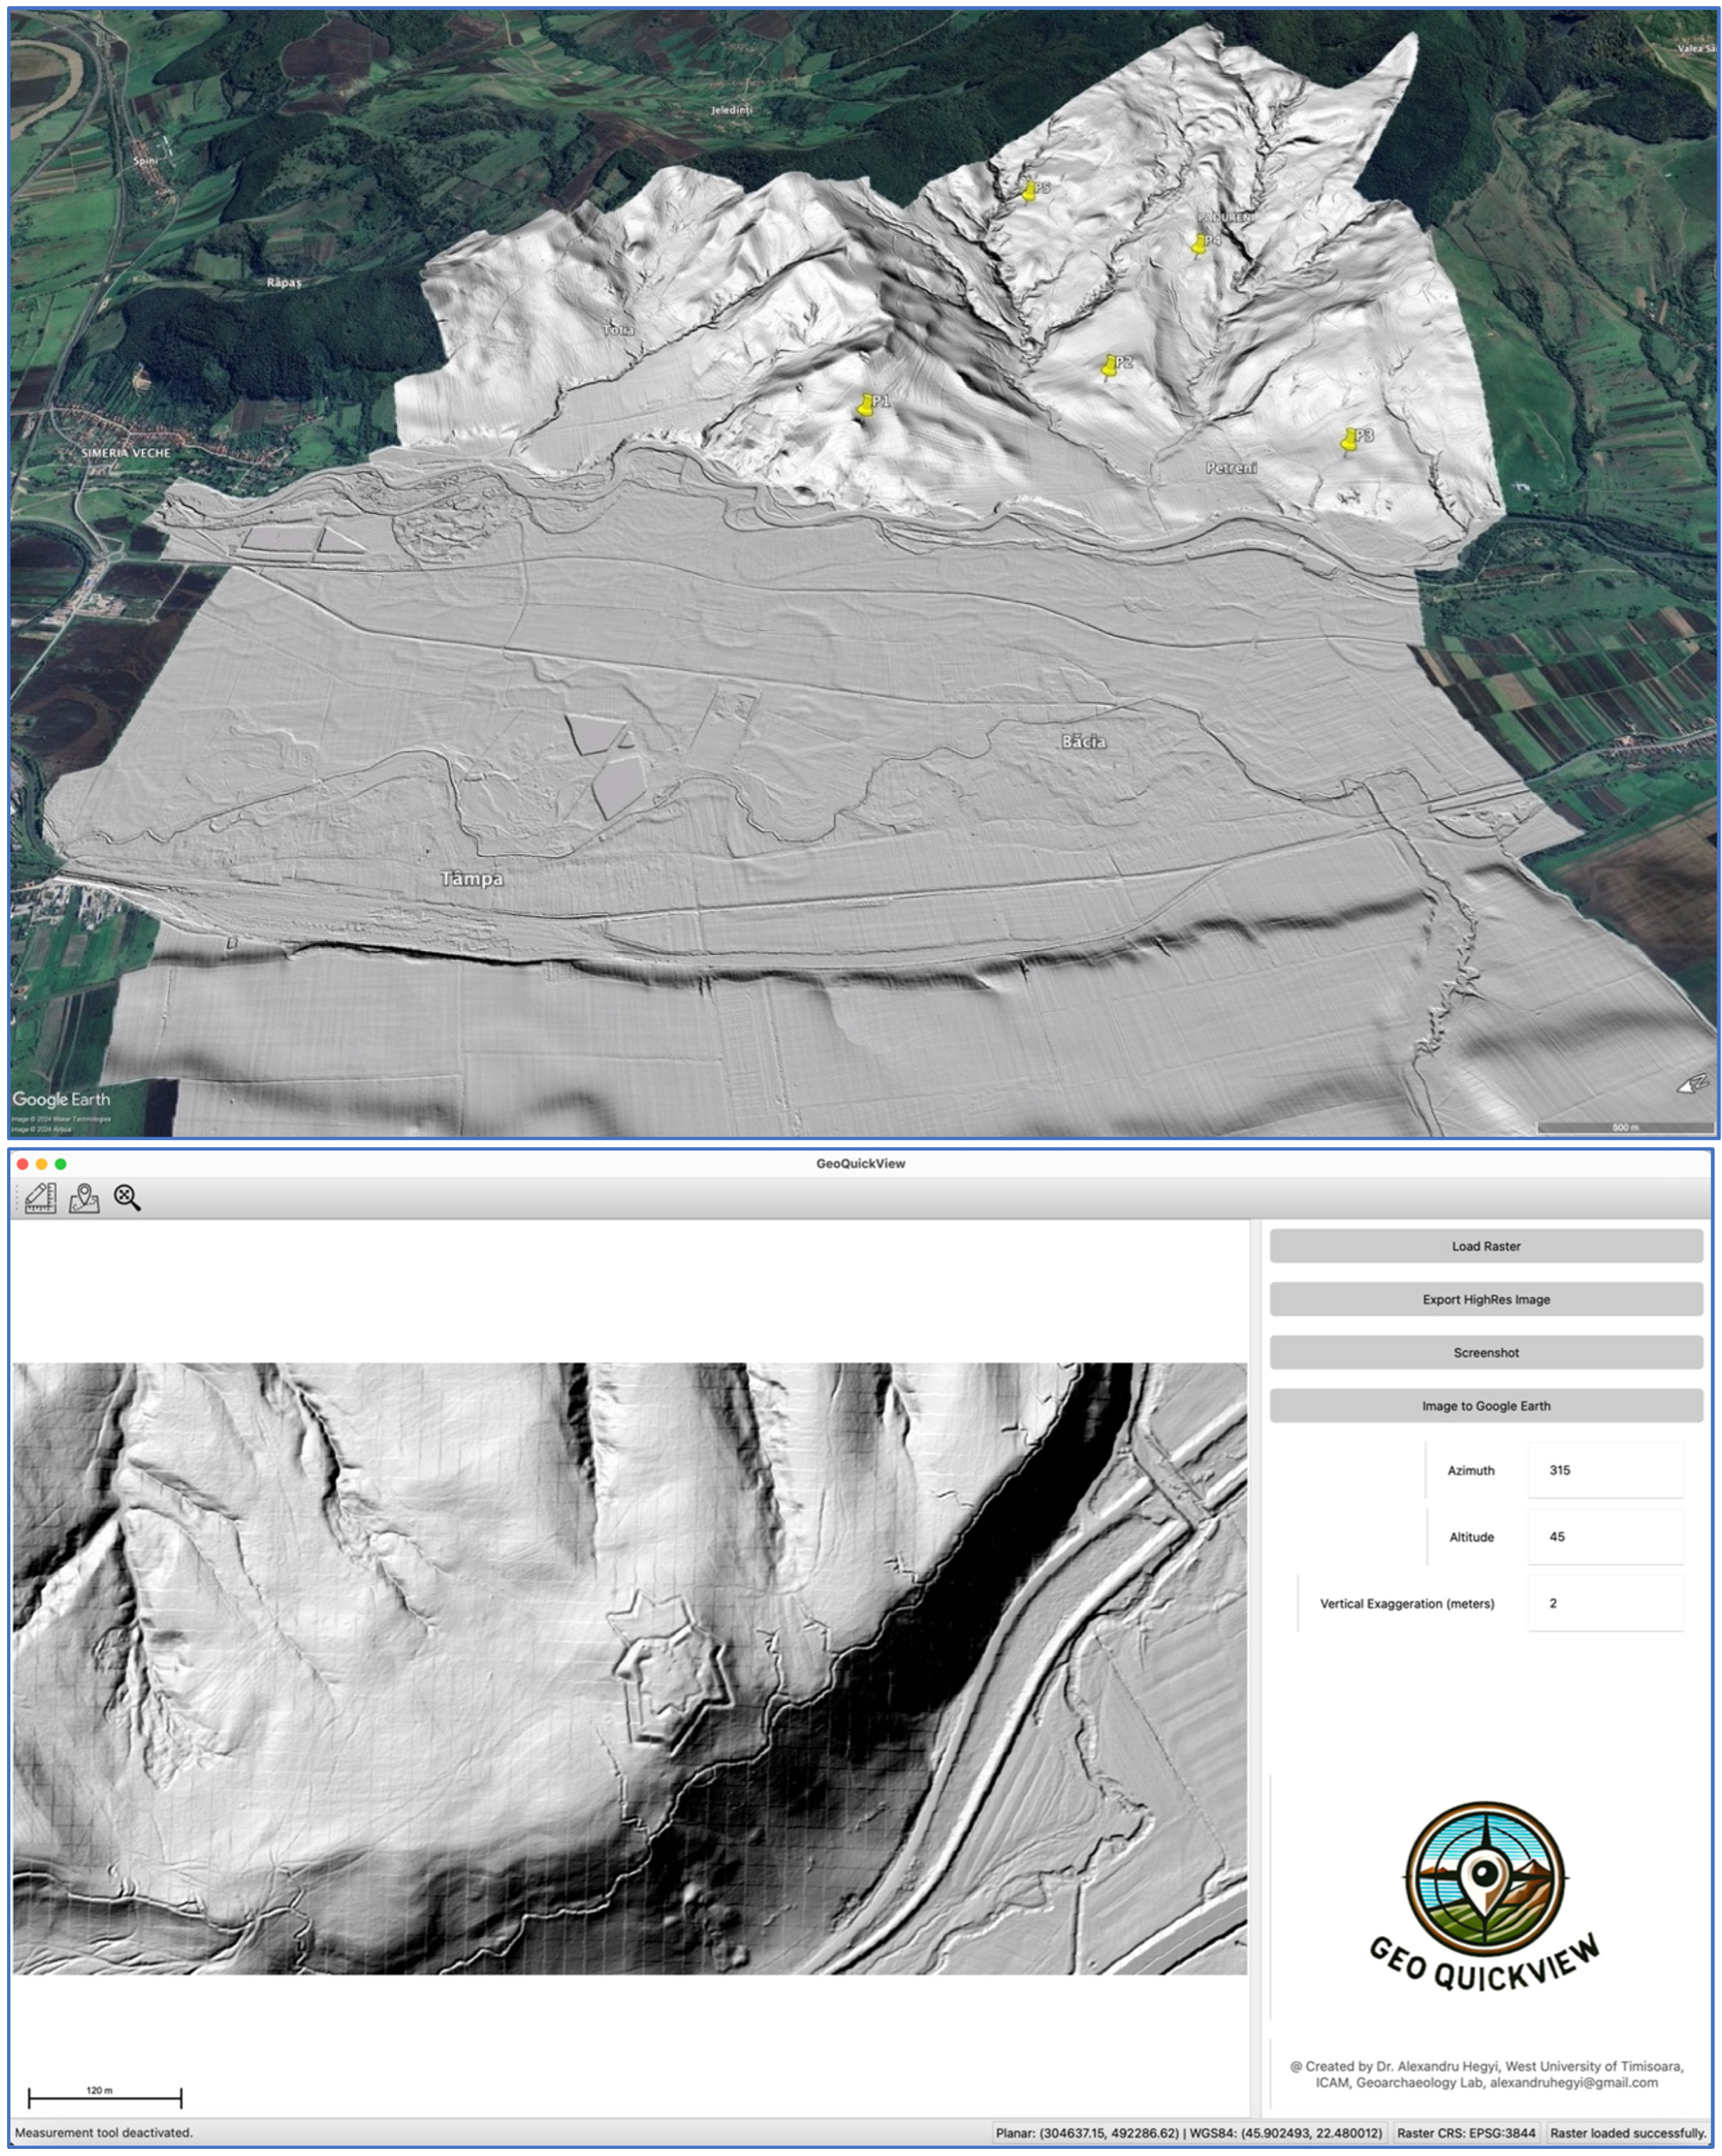
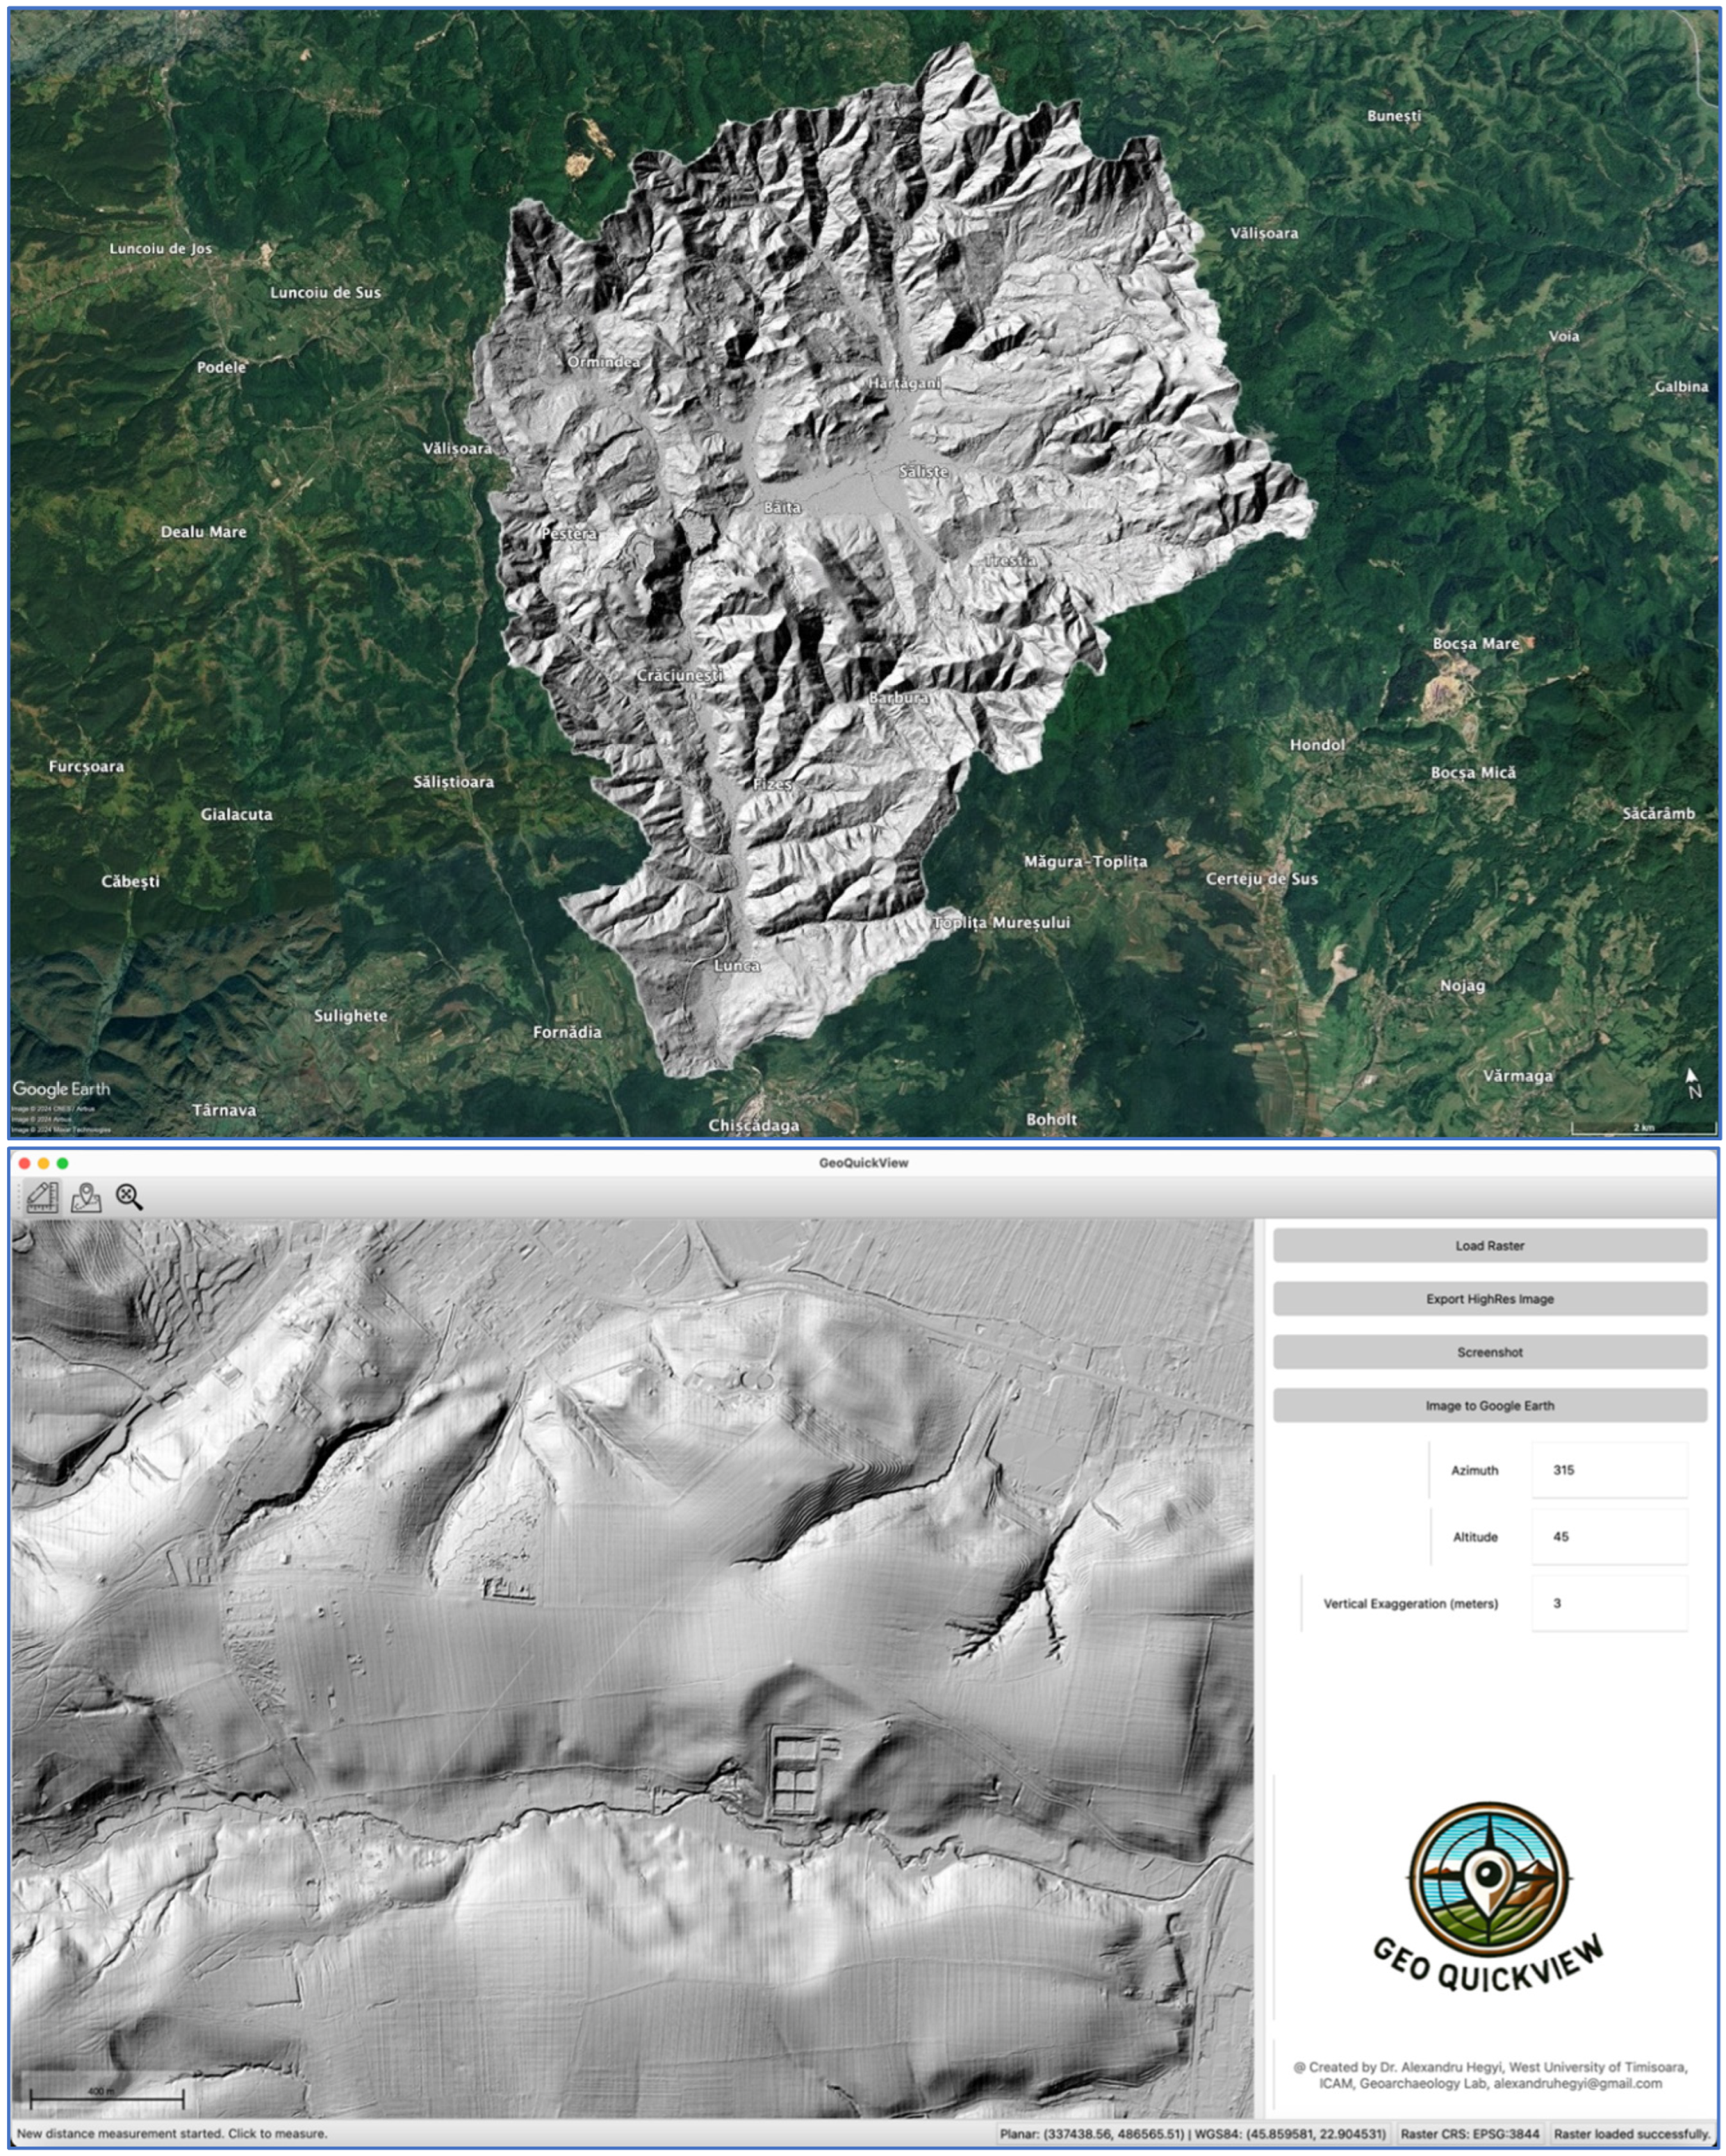
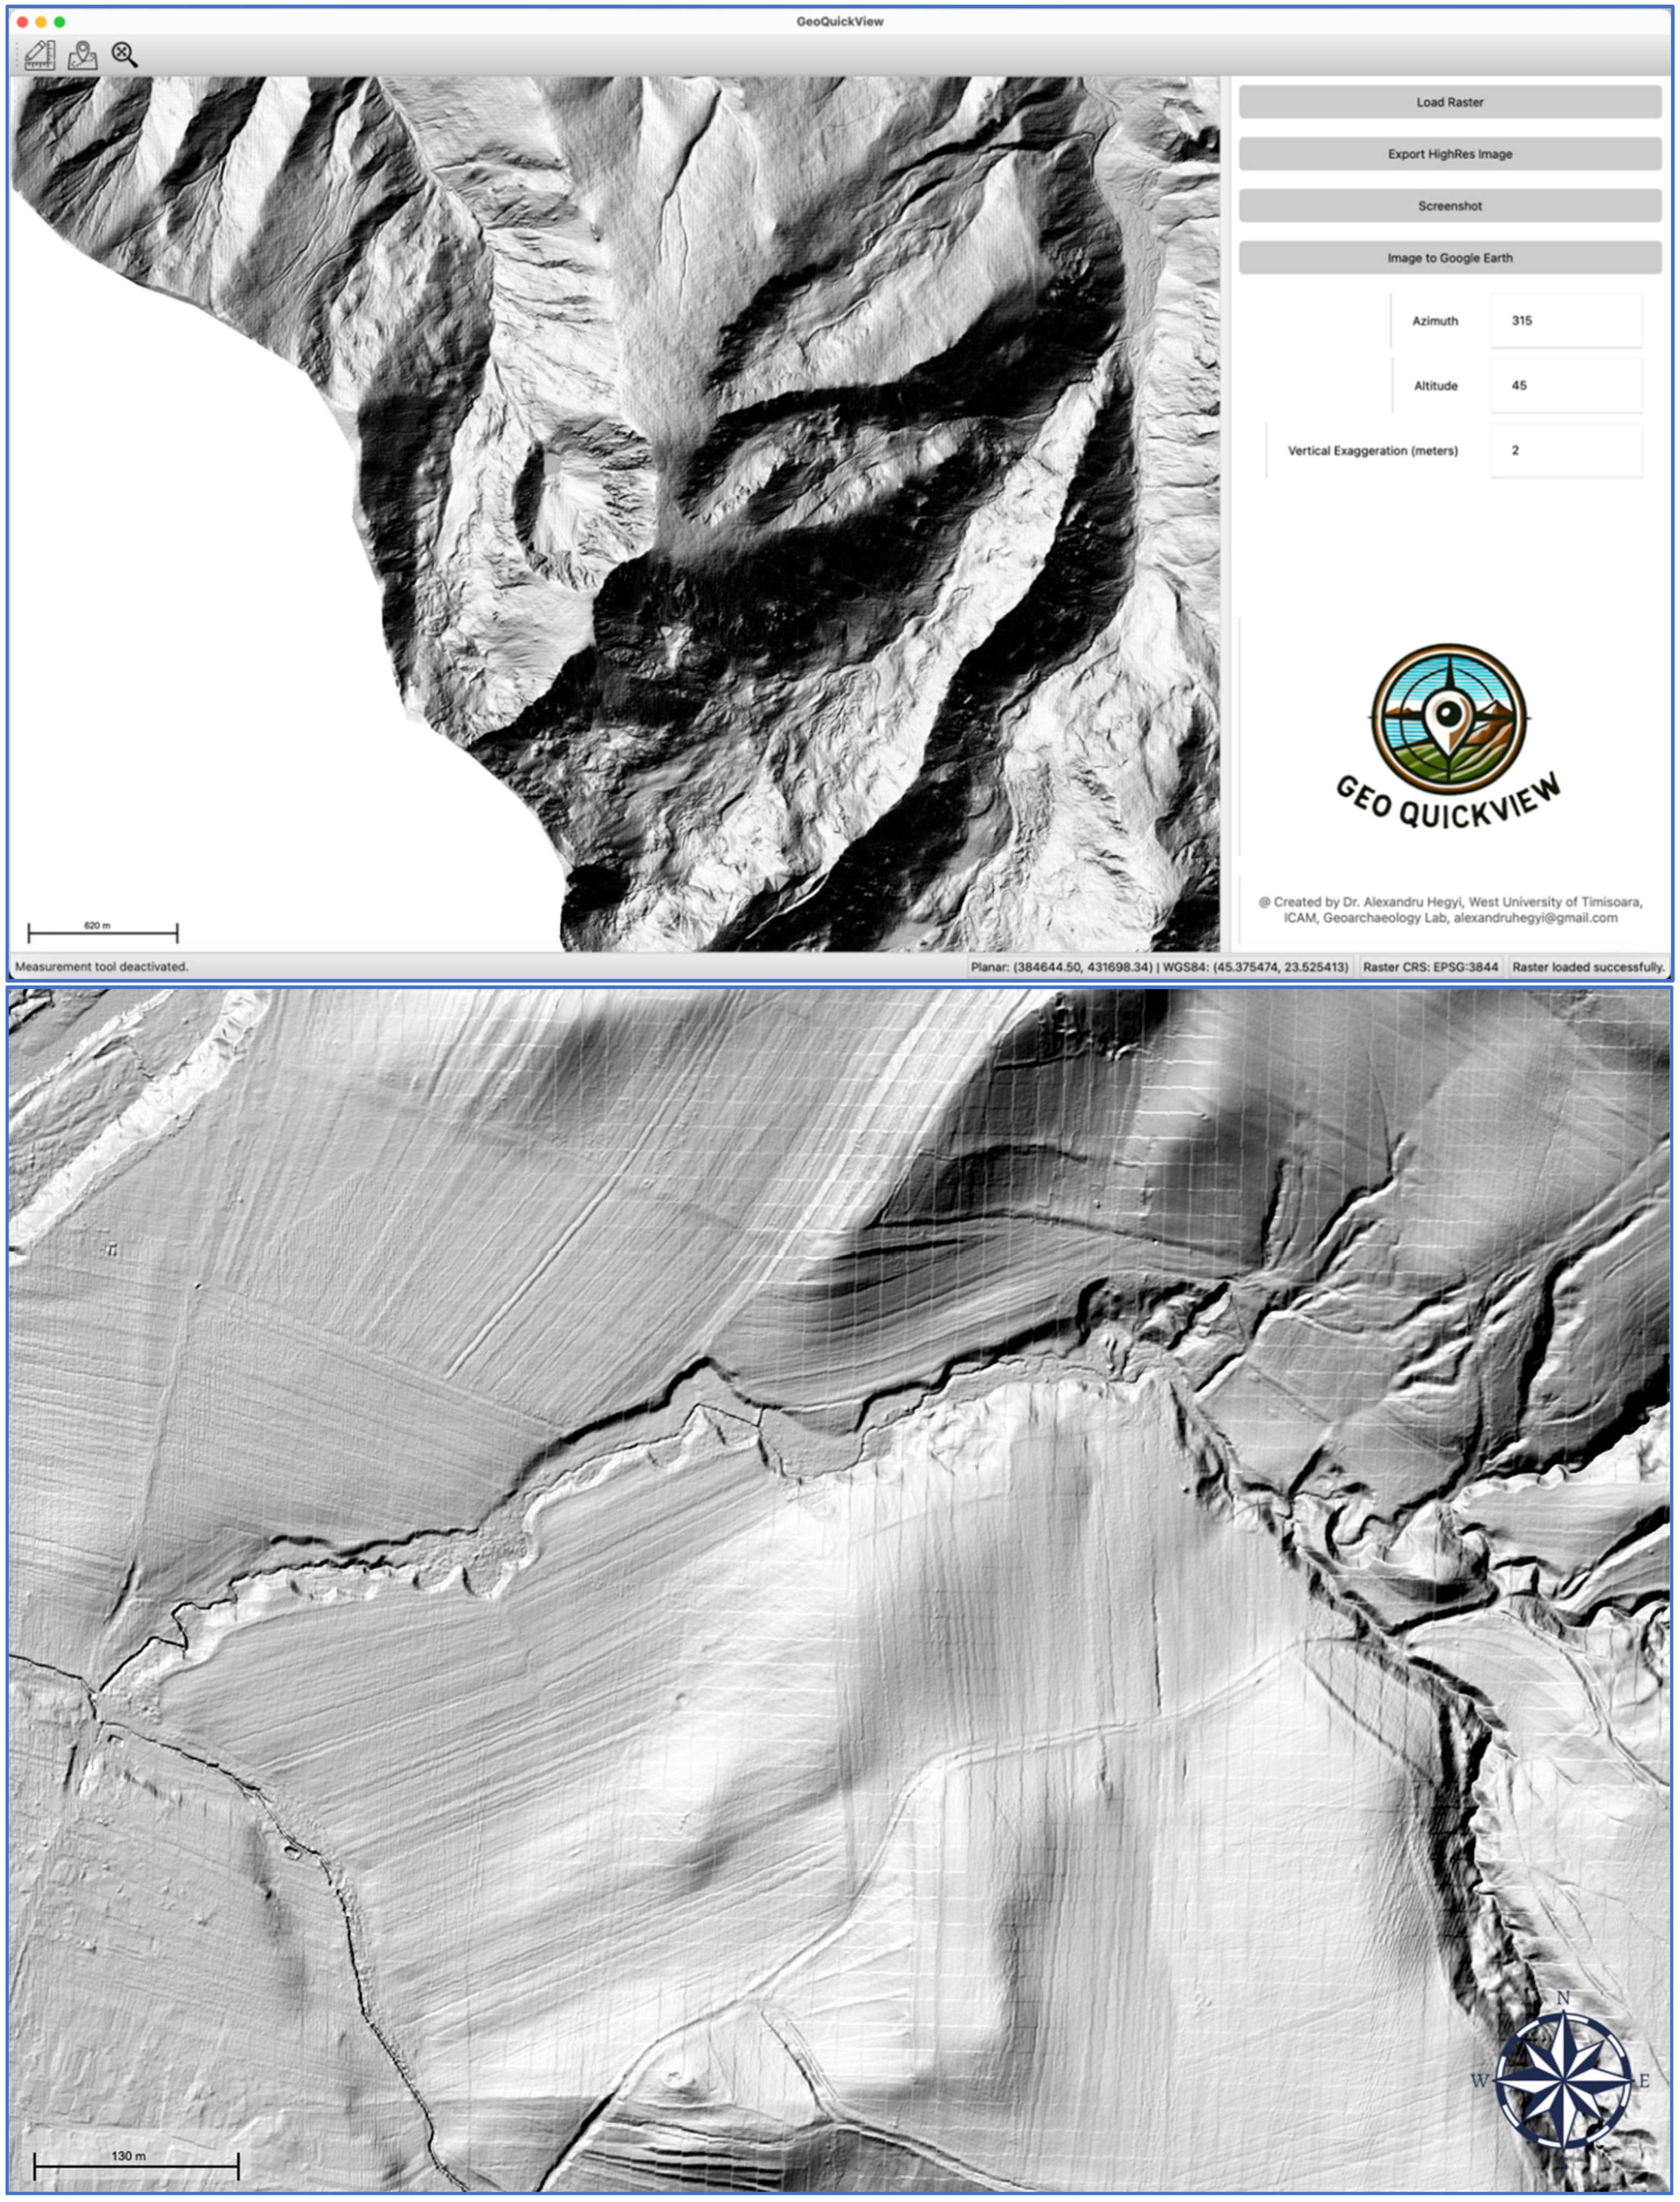
3.2. Hillshade Visualization
Hillshade visualization is a critical tool for understanding terrain features. GeoQuickView allows users to create detailed hillshade maps by adjusting parameters such as azimuth, altitude, and vertical exaggeration. These parameters control the direction and angle of the simulated light source, enhancing the visibility of terrain features.
The hillshade generation process leverages GDAL’s DEMProcessing capabilities:
- Parameter Input: Users input values for azimuth, altitude, and vertical exaggeration through the control panel.
- Temporary Storage: The loaded raster data is saved to a temporary file in GeoTIFF format.
- Hillshade Calculation: GDAL’s DEMProcessing function is used to create a hillshade image based on the specified parameters.
- Normalization: The resulting hillshade data is normalized to an 8-bit grayscale image for display.
- Rendering: The hillshade image is rendered on the map canvas, replacing any previous visualization.
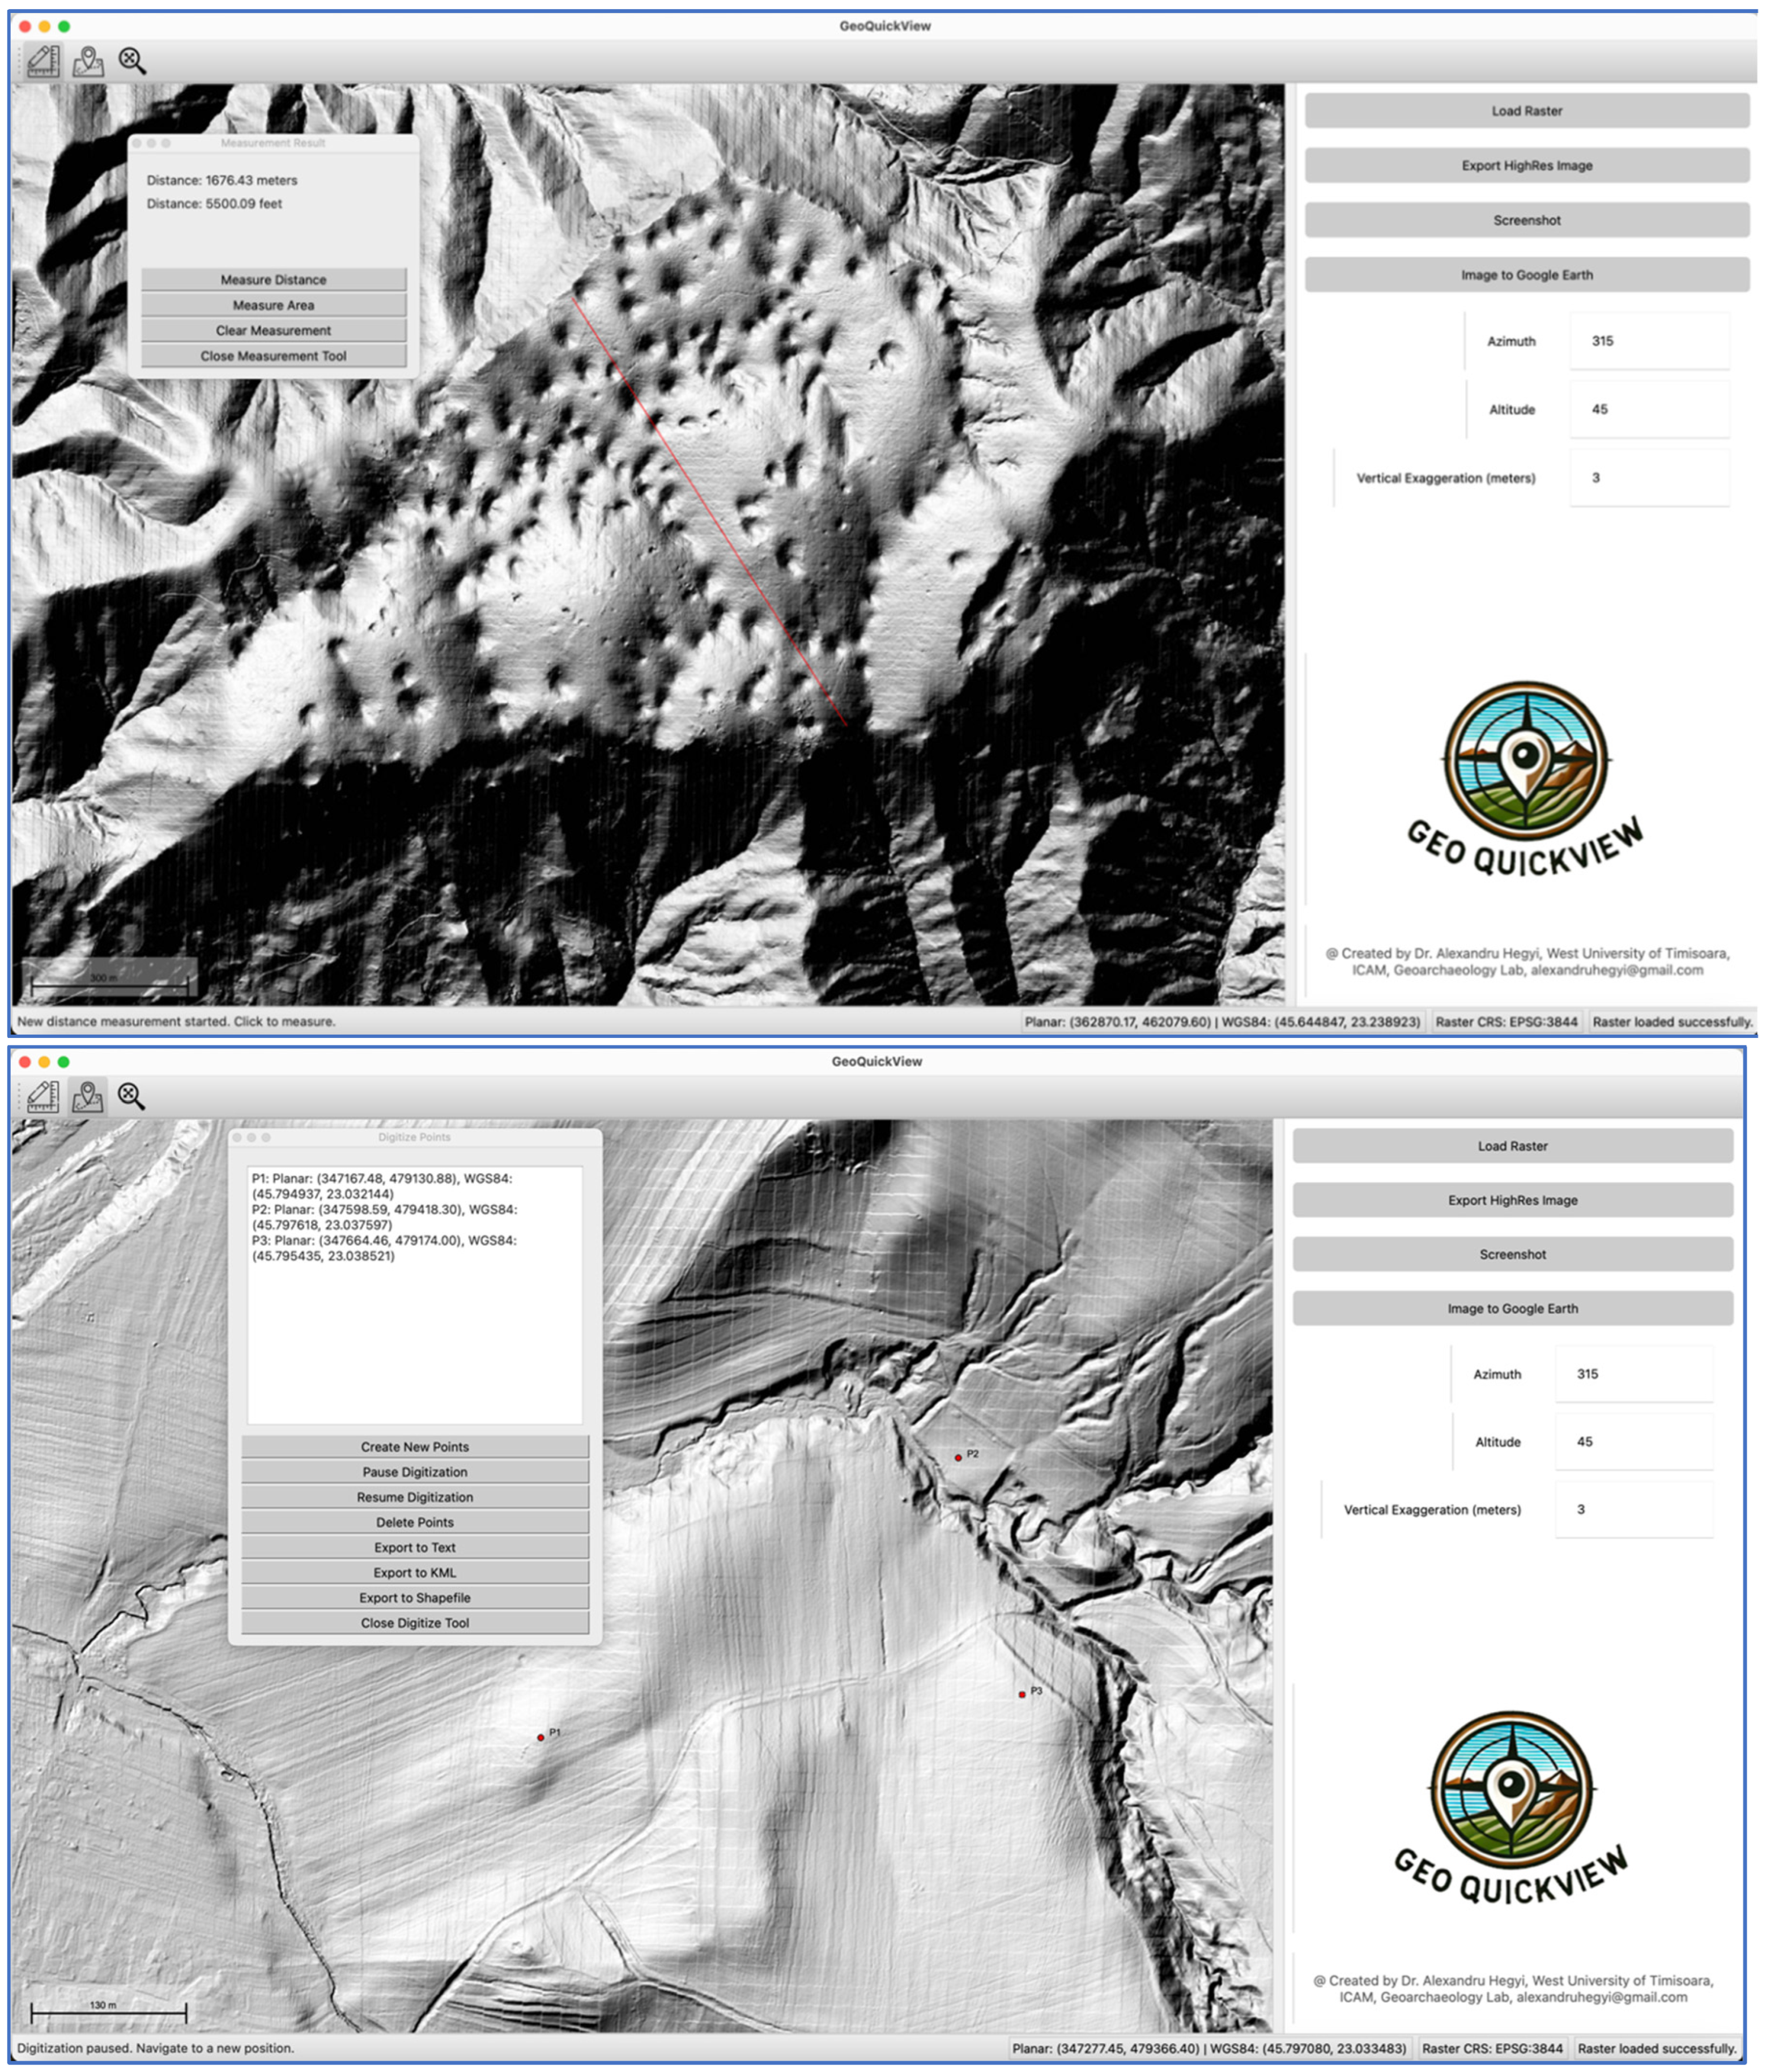
3.3. Measurement Tools
GeoQuickView includes robust tools for measuring distances and areas on the map. These tools are essential for various applications, from environmental assessments to urban planning and archaeological surveys. The measurement process involves the following steps:
- Tool Activation: Users activate the measurement tool from the toolbar.
- Point Selection: Users click on the map to add measurement points. For distance measurements, consecutive points define line segments. For area measurements, consecutive points define polygon vertices.
- Calculation: The application calculates distances and areas based on the selected points. For distance measurements, the Euclidean distance between points is computed. For area measurements, the area of the defined polygon is calculated.
- Display: The results are displayed in the measurement dialog, showing distances in meters and feet, and areas in square meters and hectares.
3.4. Digitizing Points
Digitizing points is a common task in many GIS applications, and GeoQuickView simplifies this process with a straightforward interface. Users can click on the map to add points, which can then be labeled, edited, and exported in multiple formats, including text files, KML, and shapefiles. This feature is particularly useful for field data collection and creating custom datasets.
The digitizing process involves several steps:
- Tool Activation: Users activate the digitizing tool from the toolbar.
- Point Addition: Users click on the map to add points. Each point is represented by a red marker and labeled with a unique identifier.
- Coordinate Transformation: The pixel coordinates of each point are transformed to planar coordinates using the raster’s geotransform, and then to WGS84 coordinates using a transformer object.
- Display: The points and their labels are displayed on the map canvas. Information about each point, including planar and WGS84 coordinates, is shown in the digitize dialog.
- Export: Users can export the digitized points to text files or KML for further analysis or sharing.
3.5. Exporting Images and Georeferenced Data
GeoQuickView allows users to export the current map view as high-resolution PNG images, which can be useful for reports, presentations, and further analysis. Additionally, the application supports exporting georeferenced data to Google Earth in KML/KMZ format. This feature ensures that users can share their findings and visualizations with colleagues and stakeholders who may not have GIS software.
The export process includes:
- Image Export: Users can save the current map view as a PNG file, preserving the visual details and annotations.
- Screenshoots: Users can save the the map extent to an image with a scale bar and north arrow – image ready for publication.
- Google Earth Export: Users can export the map view to KML format, allowing the data to be viewed and explored in Google Earth with accurate georeferencing.
4. User Interface and Experience
GeoQuickView’s user interface is designed to be intuitive and user-friendly, catering to users with no prior GIS experience. The main components of the interface include the control panel, map canvas, and toolbar.
4.1. Control Panel
The control panel on the right side of the application provides quick access to essential functions such as loading rasters, exporting images, and adjusting visualization parameters. Each input field is clearly labeled, and tooltips provide additional guidance, ensuring that even novice users can navigate the application with ease. The control panel includes:
- Load Raster Button: Opens a file dialog for selecting raster files.
- Export Image Button: Opens a save dialog for exporting the current map view as a PNG image.
- Azimuth Input: Allows users to set the azimuth angle for hillshade visualization.
- Altitude Input: Allows users to set the altitude angle for hillshade visualization.
- Vertical Exaggeration Input: Allows users to set the vertical exaggeration for hillshade visualization.
4.2. Map Canvas
The central map canvas is where all the visualizations are displayed. Users can zoom in and out using the mouse wheel and pan the map by clicking and dragging. The application includes a full extent button to quickly reset the view to the entire dataset. The map canvas is designed to be highly responsive, providing a smooth user experience.
4.3. Toolbar
The toolbar at the top of the application offers quick access to the measurement and digitizing tools. Icons are used to represent each tool, and hover-over tooltips provide additional information. This design ensures that users can quickly find and use the tools they need without getting lost in menus. The toolbar includes:
- Measurement Tool Icon: Activates the measurement tool.
- Digitizing Tool Icon: Activates the digitizing tool.
- Full Extent Button: Resets the view to the full extent of the raster data.
5. Applications and Few Use Cases
GeoQuickView’s simplicity and powerful features make it suitable for a wide range of applications.
5.1. Archaeology
In archaeology, detailed analysis of terrain features can reveal hidden structures and artifacts. GeoQuickView is particularly valuable for projects like the Laki II project in Romania, which utilizes LiDAR data to uncover archaeological sites. The application’s hillshade visualization and measurement tools allow archaeologists to identify and analyze potential sites without requiring GIS expertise.
5.2. Environmental Science
Environmental scientists can use GeoQuickView to analyze terrain changes, monitor vegetation, and assess the impact of natural disasters. The measurement and digitizing tools enable precise data collection and analysis, supporting informed decision-making. For example, scientists can measure changes in river courses, monitor deforestation, and assess landslide-prone areas.
5.3. Urban Planning
Urban planners can benefit from GeoQuickView’s ability to visualize and analyze geographic data. The application can help in planning infrastructure projects, assessing land use, and conducting environmental impact assessments. The user-friendly interface ensures that planners without GIS training can still leverage these powerful tools to make informed decisions about urban development and resource management.
5.4. Forestry
Forestry professionals can use GeoQuickView to analyze forest cover, monitor changes over time, and plan sustainable forest management practices. The ability to visualize terrain features and measure distances and areas is crucial for tasks such as mapping tree stands, assessing forest health, and planning logging activities.
5.5. Engineering
Engineers can use GeoQuickView for site analysis, infrastructure planning, and environmental impact assessments. The application’s ability to visualize terrain and measure distances and areas is essential for planning construction projects, designing drainage systems, and assessing site suitability.
5.6. Topography
Topographers can use GeoQuickView to create detailed maps and conduct terrain analysis. The application’s hillshade visualization and measurement tools are valuable for identifying and analyzing landforms, creating contour maps, and planning topographic surveys.
6. Technical Implementation
GeoQuickView is built upon a robust technical foundation that leverages various open-source libraries and technologies. This section delves deeper into the technical aspects of the application’s implementation, including data handling, user interface design, and performance optimization.
6.1. Data Handling
GeoQuickView relies heavily on GDAL for handling raster data. GDAL provides a comprehensive suite of tools for reading, writing, and processing geospatial data formats. The application uses GDAL to perform several key functions:
- Loading Rasters: GDAL’s Open function is used to read raster files, regardless of their format. This function extracts metadata, geotransform, and projection information necessary for rendering the raster data.
- Hillshade Generation: GDAL’s DEMProcessing function is used to generate hillshade images from Digital Elevation Models (DEMs). This function takes parameters such as azimuth, altitude, and vertical exaggeration to create realistic shadow effects that highlight terrain features.
- Coordinate Transformation: The Transformer class from the PyProj library is used to convert coordinates between different spatial reference systems. This is essential for ensuring that digitized points and measurements are accurately represented in both planar and geographic coordinate systems.
6.2. User Interface Design
The user interface of GeoQuickView is designed using PyQt5, a set of Python bindings for the Qt application framework. PyQt5 provides a flexible and powerful toolkit for creating modern, responsive user interfaces. Key components of the GeoQuickView interface include:
- Main Window: The main window of the application is a QMainWindow that houses the map canvas, control panel, and toolbar. The layout is managed using QVBoxLayout and QHBoxLayout to ensure a clean and organized presentation.
- Map Canvas: The map canvas is implemented using QGraphicsView and QGraphicsScene. This setup allows for efficient rendering of raster data and interactive elements such as measurement lines and digitized points. The ZoomPanGraphicsView subclass enhances the base QGraphicsView with custom zoom and pan functionality.
- Control Panel: The control panel on the right side of the main window uses a combination of QLabel, QLineEdit, QPushButton, and QFormLayout to provide a user-friendly interface for inputting parameters and executing actions.
- Dialogs: Custom dialogs such as the DigitizeDialog and MeasurementDialog are used to provide additional functionality and display results. These dialogs are designed to stay on top of the main window, ensuring that they are always accessible to the user.
6.3. Performance Optimization
Performance is a critical consideration for any application that handles large datasets. GeoQuickView incorporates several optimization techniques to ensure smooth and responsive performance:
- Lazy Loading: Raster data is loaded and processed on demand, minimizing the initial load time and memory usage. This approach ensures that the application remains responsive, even when handling large datasets.
- Efficient Rendering: The use of QGraphicsView and QGraphicsScene allows for efficient rendering of large images and interactive elements. These classes leverage hardware acceleration and optimized painting routines to deliver high performance.
- Asynchronous Processing: Time-consuming tasks such as raster loading and hillshade generation are performed in separate threads using QThread. This ensures that the main user interface remains responsive while background tasks are executed.
8. Conclusion
GeoQuickView represents a significant step forward in making GIS accessible to a wider audience. By focusing on simplicity and ease of use, the application empowers users with no prior GIS experience to visualize and analyze complex geographic data. Whether in archaeology, environmental science, or urban planning, GeoQuickView provides the tools necessary to turn data into insights. The continued development and enhancement of GeoQuickView promise to further democratize access to geospatial analysis, fostering greater innovation and discovery across multiple disciplines.
If you enjoy using GeoQuickView please consider supporting the developer by buying a few cups of coffee here:
https://buymeacoffee.com/alexhegyi
GeoQuickView User Guide
Welcome to GeoQuickView!
GeoQuickView is a user-friendly application designed to make the visualization and basic analysis of LiDAR derived raster, or any type of elevation raster, accessible to everyone, even those with no prior experience in GIS. This guide will walk you through the installation, features, and functionalities of GeoQuickView, ensuring you get the most out of this powerful tool.
Table of Contents
- Installation
- Main Interface Overview
- Step-by-Step Guide
- Loading Raster Data
- Viewing and Adjusting Hillshade
- Exporting Images
- Using the Measurement Tool
- Using the Digitizing Tool
- Navigating the Map
- Additional Features
- Credits
Installation
Important: Ensure you install the application with administrator privileges to avoid permission issues (Run as Administrator in Windows)
- 1. Download the Installer:
- o Obtain the GeoQuickView installer from the official website or the provided download link.
- 2. Run the Installer:
- o Right-click on the installer file and select Run as administrator.
- o Follow the on-screen instructions to complete the installation.
- 3. Launch GeoQuickView:
- o After installation, locate the GeoQuickView icon on your desktop or in the Start menu. Double click on the icon and the application should start.
- o If by any chance you did not run the installer with administration permision right-click the icon and select Run as administrator to ensure the application has the necessary permissions to strat. You should now add the license key.
Main Interface Overview
When you open GeoQuickView, you will see three main sections:
Map Canvas: The central area where your raster data and hillshade maps are displayed.
Control Panel: On the right side, where you can load rasters, export images, and adjust settings.
Toolbar: At the top, with quick access to measurement and digitizing tools.
Step-by-Step Guide
1. Loading Raster Data
- Load Raster Button:
- o Click this button to open a file dialog.
- o Select your raster file (e.g., .tif, .tiff, .ecw, .zip).
- o GeoQuickView supports LiDAR-derived DTMs and other raster formats.
- o Once loaded, the progress bar will show the loading status.
2. Viewing and Adjusting Hillshade
- Azimuth Input:
- o Enter a value between 0-360 degrees to set the direction of the light source.
- o Default is 315 degrees.
- Altitude Input:
- o Enter a value between 0-90 degrees to set the angle of the light source.
- o Default is 45 degrees.
- Vertical Exaggeration Input:
- o Enter a value to set the vertical exaggeration for the hillshade.
- o Default is 3 meters.
- Update Hillshade:
- o Changes to the above inputs will automatically update the hillshade display.
3. Exporting Images
- Export Image Button:
- o Click this button to open a save dialog.
- o Choose where to save the current map view as a PNG image.
4. Using the Measurement Tool
- Measurement Tool Icon:
- o Click this icon in the toolbar to activate the measurement tool.
- o When activated, click on the map to start measuring distances.
- o Click multiple points to measure cumulative distances or draw a polygon for area measurement.
- Measurement Dialog:
- o Shows the results of your measurements in meters, feet, square meters, and hectares.
- o Measure Distance Button: Click to start a new distance measurement.
- o Measure Area Button: Click to start a new area measurement.
- o Clear Measurement Button: Clears current measurements.
- o Close Measurement Tool Button: Deactivates the measurement tool.
5. Using the Digitizing Tool
- Digitizing Tool Icon:
- o Click this icon in the toolbar to activate the digitizing tool.
- o When activated, click on the map to add digitized points.
- Digitize Dialog:
- o Create New Points Button: Clears current points and starts a new digitizing session.
- o Pause Digitization Button: Temporarily stops adding new points.
- o Resume Digitization Button: Resumes adding new points.
- o Delete Points Button: Deletes all digitized points.
- o Export to Text Button: Saves digitized points to a text file.
- o Export to KML Button: Saves digitized points to a KML file for Google Earth.
- o Export to Shapefile Button: Saves digitized points to a shapefile for GIS software.
- o Close Digitize Tool Button: Deactivates the digitizing tool.
Additional Features
- Progress Bar: Displays the loading status of raster files.
- Scale Bar: Automatically updates to show the scale of the map in meters or kilometers.
Credits
Developed by Dr. Alexandru Hegyi, West University of Timisoara, ICAM, Geoarchaeology Lab.
Thank you for using GeoQuickView! We hope this guide helps you get the most out of the app. If you have any questions or need further assistance, please don’t hesitate to contact us.
This guide provides an overview of the core features and functionalities of GeoQuickView, designed to help you efficiently visualize and analyze geographic data with ease.
APP SCREENSHOOTS
References
- Open Source Geospatial Foundation. (2024). GDAL: Geospatial Data Abstraction Library. Retrieved from https://gdal.org/.
- PyQt Documentation. (2024). PyQt5 Reference Guide. Retrieved from https://www.riverbankcomputing.com/static/Docs/PyQt5/.
- Shapely Documentation. (2024). Shapely: Geospatial Geometric Operations. Retrieved from https://shapely.readthedocs.io/en/stable/.
- numpy Documentation. (2024). NumPy Reference. Retrieved from https://numpy.org/doc/stable/.
- pyproj Documentation. (2024). pyproj: Python interface to PROJ. Retrieved from https://pyproj4.github.io/pyproj/stable/.
- cryptography Documentation. (2024). Cryptography: Python Library for Encryption and Decryption. Retrieved from https://cryptography.io/en/latest/.
- Python Standard Library Documentation. (2024). zipfile — Work with ZIP archives. Retrieved from https://docs.python.org/3/library/zipfile.html.
- Python Standard Library Documentation. (2024). tempfile — Generate temporary files and directories. Retrieved from https://docs.python.org/3/library/tempfile.html.
Disclaimer/Publisher’s Note: The statements, opinions and data contained in all publications are solely those of the individual author(s) and contributor(s) and not of MDPI and/or the editor(s). MDPI and/or the editor(s) disclaim responsibility for any injury to people or property resulting from any ideas, methods, instructions or products referred to in the content. |
© 2024 by the authors. Licensee MDPI, Basel, Switzerland. This article is an open access article distributed under the terms and conditions of the Creative Commons Attribution (CC BY) license (https://creativecommons.org/licenses/by/4.0/).
Copyright: This open access article is published under a Creative Commons CC BY 4.0 license, which permit the free download, distribution, and reuse, provided that the author and preprint are cited in any reuse.


