
Submitted:
04 June 2024
Posted:
06 June 2024
You are already at the latest version
Abstract
In recent decades, the creation and availability of Voluntary Geographic Information (VGI) has changed the paradigm associated with the production of Geospatial Information (GI), since due to its free access, citizens can view, analyse, process, and validate this type of data. One of the most popular examples of VGI is the collaborative OpenStreetMap (OSM) project which covers a wide range of themes or characteristics associated with the real world. One of these themes is the feature “waterway” that represents watercourses. The quality of OSM data characteristics is an issue that has been published by many authors in recent years, particularly on the analysis of the completeness indicator. However, few references are found in literature to studies that analyse the completeness of OSM watercourses. This study presents an analysis of the variation over time in completeness/coverage of the OSM "waterway" feature in the epochs of 2014 and 2023 in a mountainous region included in the Mondego River basin, located in Inland of Portugal. The results show that the completeness of this OSM feature (waterway) has a slight increase, considering the amplitude of this period (nine years) and the fact that, nowadays, digital mobile devices enable access to satellite images, therefore allowing in an easy way the digitalization of entities or objects of the real world remotely. Regarding the indicator’s altitude, slope and location/proximity of settlements, it was not possible to observe their influence on the evolution of the completeness of this geographic entity (OSM waterway).
Keywords:
completeness
; waterway
; VGI
; OpenStreetMap
1. Introduction
Recently, the remotely sensed data have been extensively utilized for the mapping of water [1]. The amount and location of water on the Earth's surface changes over time and is influenced by natural processes and human activities [2]. The cartographic representation of watercourses is necessary for several hydrological studies, namely the morphometric basins characterization. Normally, topographic maps produced by cartographic agencies of each country have the "watercourses" theme represented there. However, this feature is part also of the OpenStreetMap database. OSM is a collaborative project that enables the creation and distribution of geospatial data in vector format from around the world in open access. It is designed to create and deliver datasets geographic areas based on contributions from voluntary citizens (e.g. [3]). It was founded in 2004 based on an idea launched by a master's student, Steve Coast, which would later be included in his master thesis and which consisted of the following: If a citizen start mapping the area where he lives, an area that he knows well, and if another citizen proceed in the same way, then this idea can be extended to all citizens of the world and on this way it will be possible to map all the world. Since then, OSM data has been used and applied in several studies located in different zones of the world and currently the platform already has more than 10,000,000 registered volunteers (https://wiki.openstreetmap.org/wiki/Contributors, in October 2023).
The volunteer citizens collect and edit geographic entities in vector format (point, line, and polygon). These three feature categories may represent real-world objects, such as: roads, rivers networks, streets, buildings, green areas, points of interest, among others. Many studies have been carried out to evaluate the quality of OSM data entities, such as, streets, green spaces, buildings, and land cover. The evaluation is done to quantify the deviation in the horizontal plane (2D) between these OSM data and the reference data, normally authoritative geospatial data created and maintained by government institutions [4] of each country. The ISO 19157 establishes guidelines on a series of spatial data quality elements such a logical consistency, positional accuracy, and completeness ([5,6]). Among these quality categories or elements, completeness is considered as a fundamental measure of geographic data quality in Voluntary Geographic Information (VGI) and in the OSM research [7]. [8] refers that completeness are one of the most significant aspects of VGI quality. Completeness may be understood as a measure of the presence or absence of features and their attributes represented in a map or geographic/geospatial database, that is, completeness analyses errors of omission and commission. Many authors had studied the completeness of OSM data, e.g., the completeness of: i) airports [9]; ii) buildings ([,410,11,12,13,14])] iii) streets [15]; iv) urban teaching equipment [16]; vi) retail stores [17], land use and land cover [18]. However, the references found in the literature on the completeness of watercourses represented on maps are scarce, relating to those published on the completeness of other types of entities. [19] have found that the completeness of OSM data is heterogeneous from region to region in the world. [20] did a characterization and quantified positional and completeness errors observed in hydrographic dataset, obtained by different scales and with different methodologies, such as, photogrammetric restitution and automatic extraction from Digital Elevation Models (DEMs). They conclude that completeness errors may be present in distinct locations on the map, and this type of errors may promote changes in the extent and direction of mapped watercourses, drainage density and consequently, the size of the basins that influences their characterization.
In this study we analyse the completeness of the OSM watercourses in two distinct epochs (years of 2014 and 2023) in a rural mountain region of Portugal and try to understand the evolution of the completeness of this feature in relation with some factors such as: slope, elevation, and settlements location/proximity.
2. Materials and Methods
In general terms, the completeness of the lines on a topographic map is normally calculated considering the total length of the lines under analysis divided by the total length of the reference lines multiplied by 100, that is, it is a percentage indicator. Usually, the reference data are provided by map agencies. In this study the lines under analysis they were the OSM waterways of a mountainous region included in the Basin Mondego River, which is the largest Portuguese river.
2.1. Data and Study Area
This study was applied to a region located in the river basin of Mondego River, municipality of Gouveia, Guarda, Portugal, which is a region characterized by having an accentuated relief with embedded valleys, steep slopes, and irregular mountains. The altitudes ranging from 216 and 1095 m. Figure 1 shows the location of study area.
3.2. Methodology
The OSM waterways data were extracted in two different dates, on October 14, 2014 and on November 14, 2023, using the Geofabrik free download server (Figure 3). When we extracted these data (watercourses) from OpenStreetMap platform, they are organized in a shapefile format file contain lines referenced in the WGS 84 (World Geodetic System 1984) which is subsequently converted (projected) to the Portugal - Transverse Mercator 06 - European Terrestrial Reference System 1989 (PT-TM06/ETRS 89) which is the coordinate system associated with the reference hydrography data used in this study (Figure 2).
The completeness of geographic entities represented in a map or database is a measure obtained by comparison of the ones that are represented in the map or geographic database under analysis to the ones that are represented in a reference map or database. Completeness is also a metric or an indicator of coverage of the features (points, lines, or polygons) in terms of mapping representation. The measure of completeness of lines is obtained dividing the total length of the lines under analysis () to the total length of the reference lines data (), according to equation (1).
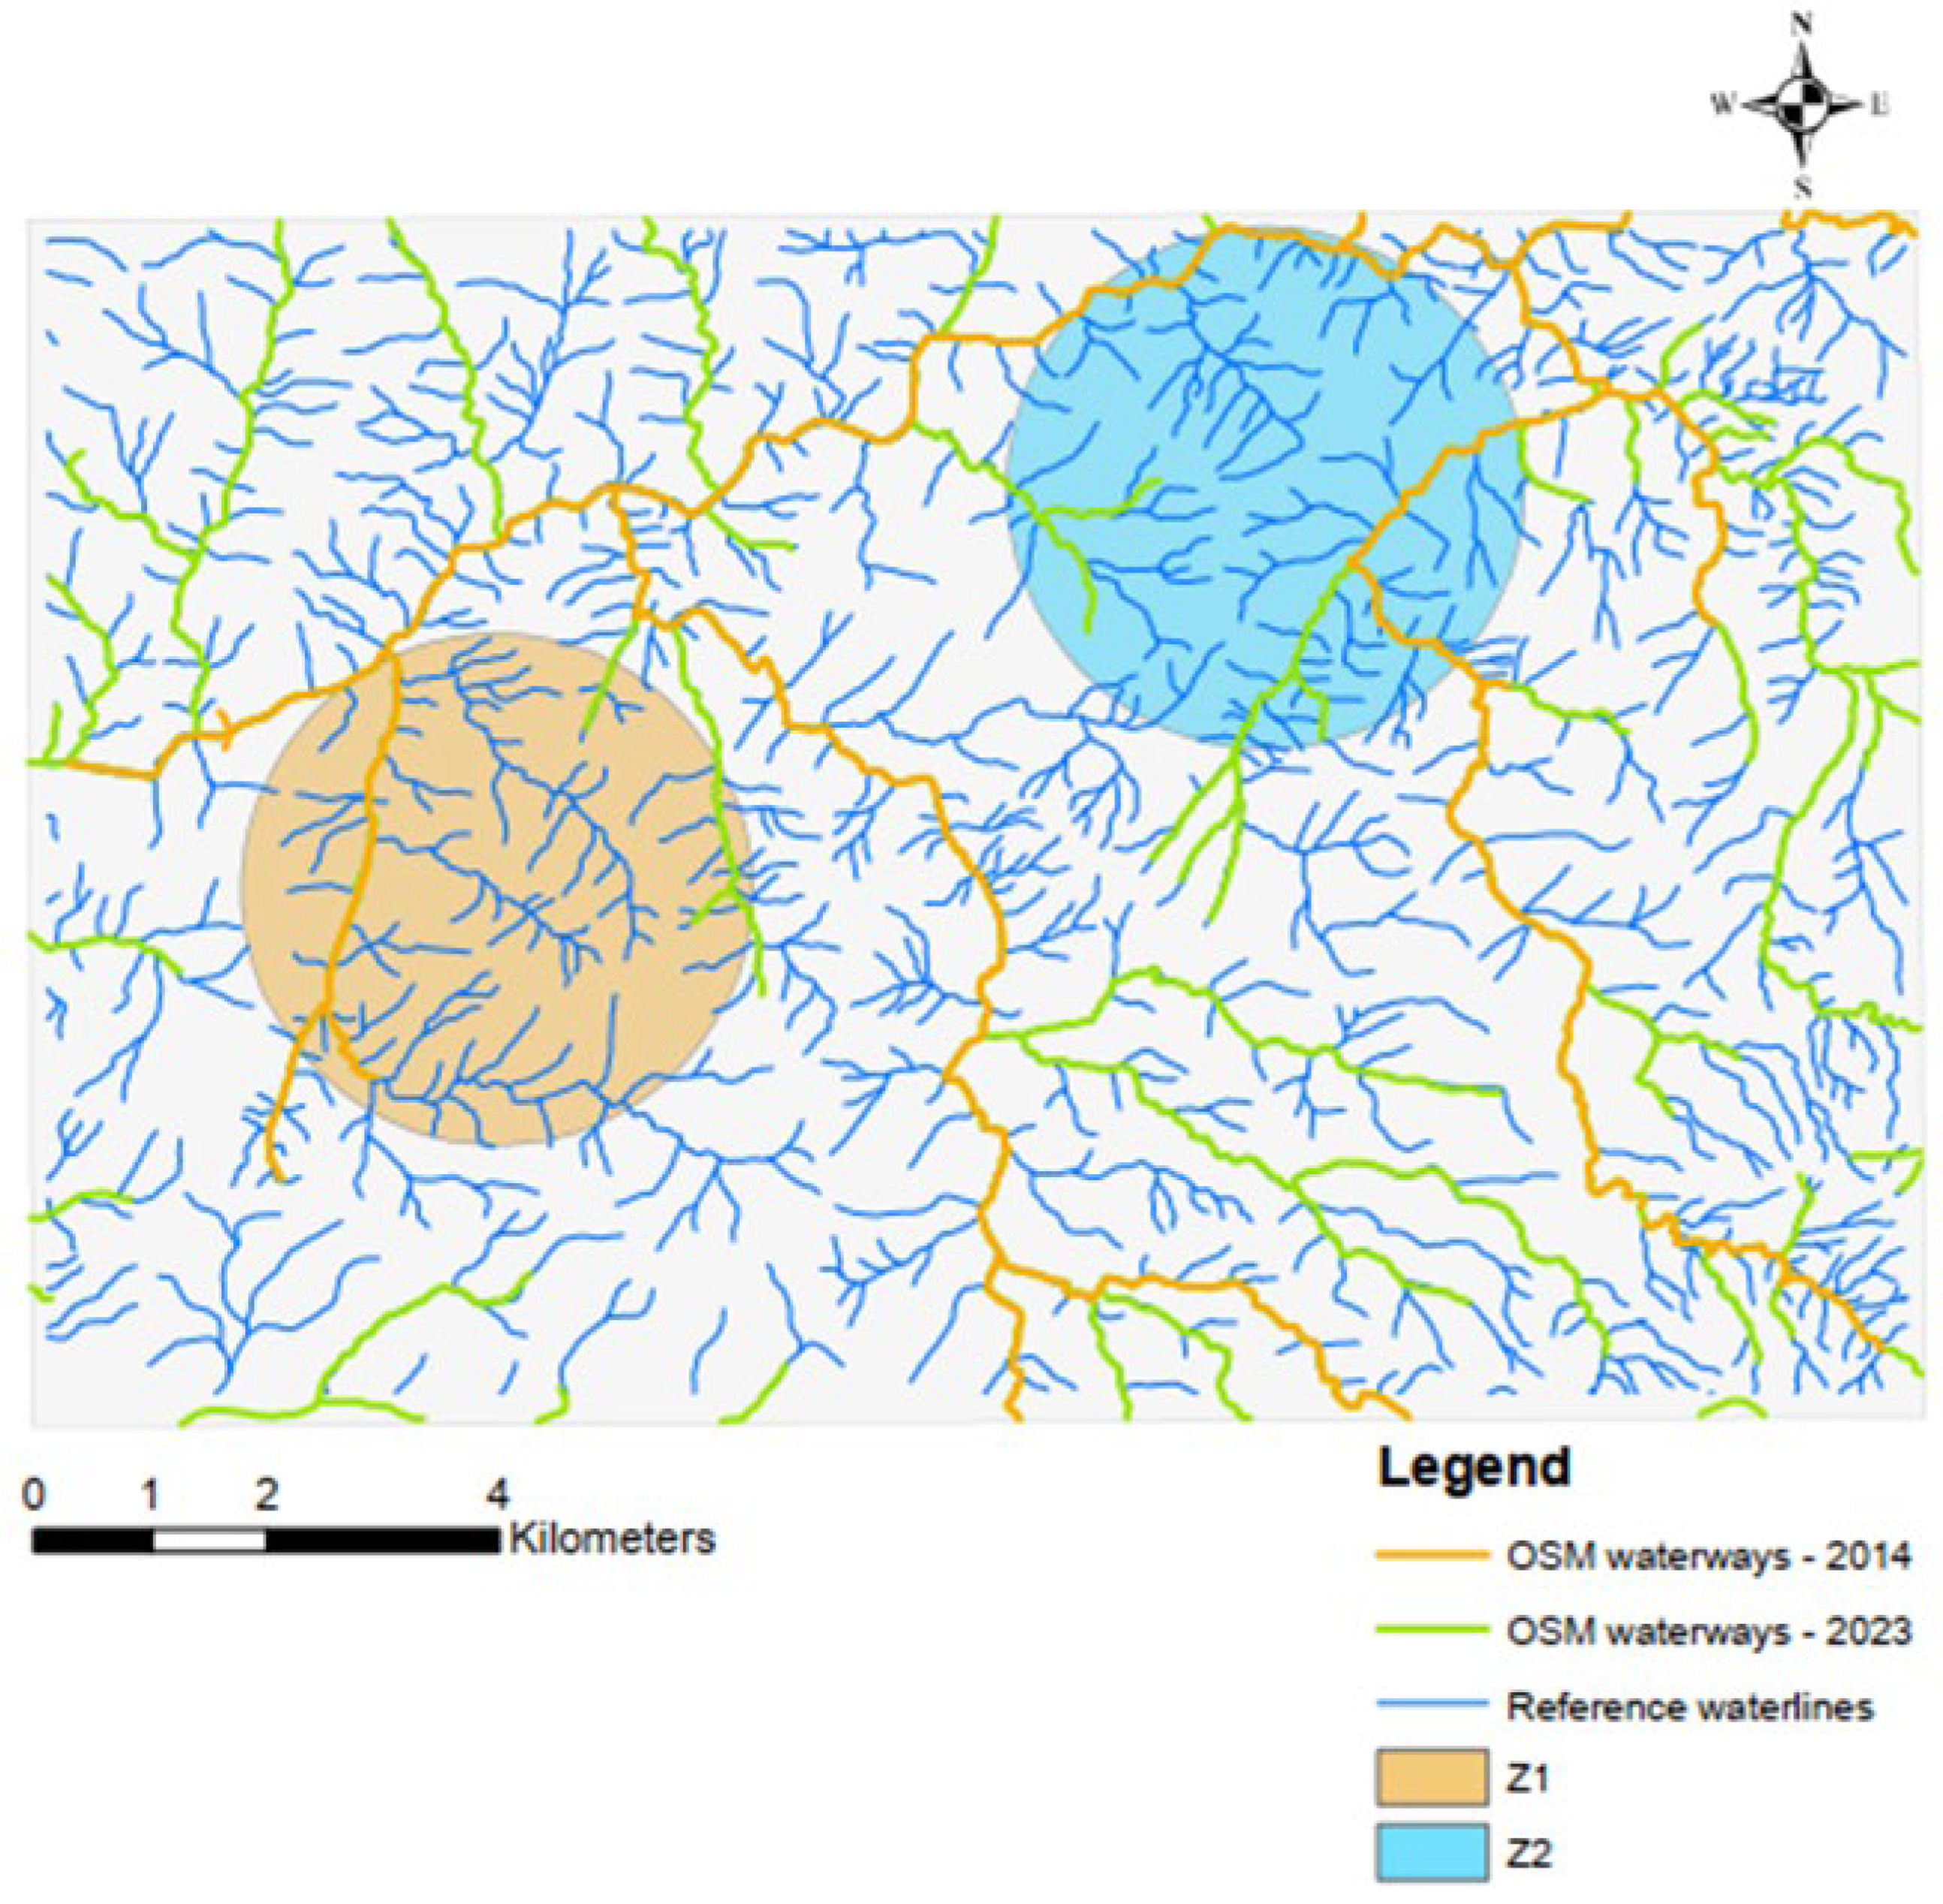
The main objective of this study was to analyze the evolution of waterways completeness throughout this time (from 2014 to 2023). Firstly, the completeness of waterways of all study area was calculated for both epochs using equation (1). After that, two zones were defined randomly over the study area, respectively Z1 and Z2 zones, and the waterways completeness was also calculated for both time epochs (2014 and 2023). With this it was possible to analyze the percentual increase of the completeness in all study area, and in both zones Z1 and Z2. Other analyses were carried out to understand if there is any relationship between the news’s OSM waterways created and some factors (elevation, slope, and settlements). For this purpose, the SRTM Digital Elevation Model (DEM) was used and the slope map with nine slope classes was generated to the study area. Using the DEM and the slope map, it was possible to analyze the possible relationship between elevation and slope with the creation of new water lines. Using the visual interpretation carried out on satellite image, we tried to understand any relationship between the appearance of new OSM’s water lines and the location/proximity to urban settlements.
Figure 4.
Z1 (orange color) and Z2 (blue color) zones inserted in study area.
3. Results Analysis and Discussion
The study made it possible to analyze the completeness of OSM watercourses considering a temporal separation in the data of nine years. The possible influence of some indicators was also considered when comparing the results obtained in terms of completeness. The proposed methodology can be applied to the study of completeness and its evolution over time for any line type geographic entity represented on the OSM platform.
3.1. Entire Study Area
In study area it can be observed an increase of watercourses completeness as shown in Figure 5. In 2014 only the main rivers are represented. In 2023, it is observed that more OSM rivers are represented, although they continue to be the main tributaries, as they are those that are best identifiable in satellite images by the volunteer collaborators.
Through visual observation it is possible to see that the completeness of the watercourses increased in all study area, particularly in the northern part of the main river (the Mondego River) (i)), where in the first date considered (2014) no watercourses were represented. It is also clear that in 2023 smaller rivers will begin to be represented (ii)) as can be seen in Figure 5. It is also observed that the watercourses used as reference present greater smoothing than the OSM watercourses, this is since the OSM watercourses are digitized above satellite image, while the watercourses of the reference were represented cartographically according to photogrammetric methods. It is also possible to observe that the OSM watercourses have connectivity problems, not effectively representing a hydrographic network such us the reference watercourses. This aspect could be a limitation for carrying out processing on the network to obtain sequential hydrological calculations.
Analyzing the OSM watercourses in all study area in two-time epochs, it can be seen according to the Table 1, that there was an increase in completeness (15,4%). In turn, the increase in the representation of rivers was smaller (7 to 9) than the increase in streams (8 to 72).
The topographic parameter total length of reference watercourses and the total length of OSM watercourses in 2014 and 2023 and the correspond completeness on these two dates are shown in Figure 6.
- i)
- Elevation
The first indicator that was analysed was the altitude of the terrain. The altitude of the study area varies between values of 216 and 1095 meters. Figure 7 presents the SRTM DEM of the entire study area, and it is possible to observe considerable altitude values, with an average value of 655,5 meters, or if we were not in a mountain area. When we observe the news’s OSM watercourses, we see that they are mainly located in lower altitude areas.
- ii)
- Slope
We also try to understand if there is any relation between slope and the evolution of completeness of watercourses in that temporal period (nine years). A slope map for all study area was created using Shuttle Radar Topography Mission (SRTM) DEM, with 90 meters of spatial resolution. Analysing the entire study area, it can be seen that the steepest slopes are located along the routes of the main rivers and also in a higher area located southeast of the study area it is also observed in Figure 8 that the news’s OSM watercourses appears mostly in regions with gentler slopes, however, it can be observed that some small watercourses also appearing in areas with steeper slopes (southeast of the area of study).
- iii)
- Settlements
The urban zones all over of the world are the places where the most part of people lives. The completeness of highly populated urban areas is often higher than that of remote and rural areas ([10,17]). [13] also shows that the size of the urban centres measured by population was positively correlated to completeness. There are also differences between developed and developing countries ([22,23]). These variations on completeness depends on social factors, e.g., population distribution, population density on earth surface and the location of OSM platform contributors [24].
The study area presents some dispersed and small settlements. When we analyse this indicator (settlements), in an intuitive way, it is believed that it will not have influence in completeness of OSM waterways as the completeness of other themes, such as OSM buildings ([25,26,27]), green spaces, roads and other type of collective equipment located in urban environment. This is also since the way of a river is well visible in satellite images that is the geospatial product that were used by volunteers. Using the visual interpretation carried out on satellite images, it can be seen (Figure 9) that most of the OSM watercourses that appear represented are placed out of settlements (rural areas). However, it should be noted that this does not happen on the north bank of the main river, the Mondego River shown in Figure 9 (white arrows).
3.2. Z1 and Z2
When we analyse the completeness on both zones (Figure 4) defined for the same time epochs the obtained results are slightly different (Table 2 and Table 3). The results of Z1 are presented in Table 2 that show an increase of completeness of 7,9%, a value lower than the value obtained for the entire study area which was 15,4%. In terms of number of rivers there was no variation, but the streams increased from 2 to 5.
In Z2 the increasing of completeness was 13,6%, a value greater than the correspond for Z1 zone but still lower than the value obtained for the entire study area (15,4%). The number of OSM rivers increased from 1 to 3, and OSM streams from 2 to 6 (Table 3). It can also be observed that the total length of reference watercourses in Z2 zone is greater than the total length of reference watercourses in Z1 zone.
Figure 10 presents the reference watercourses and the OSM waterways represented in both time epochs for Z1 zone. As can be observed in 2023 the news’s watercourses created are in east part of Z1 zone.
In Z2 the news’s watercourses are distributed on south and west parts of that zone (Figure 11). As we mentioned before we may observe there exist much more reference watercourses in Z2 than Z1 and the increasing of completeness is also higher in Z2.
Considering the DEM of Z1 zone, we verify that the news’s OSM watercourses represented are in regions with elevation values belonging to the range [385 m, 461 m] (Figure 12). In Z2 zone, the news’s OSM watercourses represented are located at altitudes between values belonging to the range [357 m, 376m], [371 m, 418 m] and [358 m, 407 m], as may be seen in Figure 12. In other words, in relation to this indicator (altitude), there is no relation between the appearance of new watercourses and altitude indicator. This can be explained by the fact that the watercourse is a linear and continuous entity that develops throughout physical space and naturally it develops precisely according to the variation in this altitude indicator.
As we did for the entire study area, we will analyse for the two zones Z1 and Z2, the completeness depending on the indicators: altitude, slope, and settlements. The news’s OSM watercourses appear in the Z1 zone at slopes belonging to the ranges [0%, 2,4%]; [5,8%, 7,7%] and [7,8%, 9,9%] (Figure 13). In Z2 zone, the news’s OSM watercourses represented are in areas with slopes belonging to the ranges [0%, 2,4%]; [2,5%, 4%] and [7,8%, 9,9%] (Figure 13).
Analysing the evolution of completeness during the period under study in the zones Z1 zone, it is observed that the news’s OSM waterways do not cross settlements, despite being located relatively close together in the northeast and east part of the Z1 zone as can be seen in Figure 14.
In Z2 zone as can be seen in Figure 15 the news’s OSM waterways are placed in west and south, and do not cross any settlement, despite the new water lines located there (southern part of Z2) being considerably close to a population cluster that develops linearly following its own development.
4. Conclusions
The completeness of OSM data has been studied and published by numerous authors, however in relation to the topic watercourses it is difficult to find publications of studies and works developed that address the topic. In this study, the evolution of the completeness of watercourses extracted from OpenStreetMap in two-time epochs nine years apart was analysed. The methodology was applied to an area located in a rural and mountainous region located in center of Portugal. The completeness of OSM watercourses across the entire study area increased by 15.4%. It is thought that is a low value considering that nine years past and the availability that exists today, through mobile devices with internet access, to access platforms for accessing satellite images with increasingly greater spatial resolution. We also try to analyse some relation between the position of new watercourses and some indicators, such as: elevation, slope, and settlements. Analysing the completeness with the elevation indicator, the news’s OSM watercourses drawn appear mainly in the lower altitude areas of the study area. We concluded that the slope is not related to the representation of the news’s OSM watercourses, as most of them are in the lower slope areas. Finaly, we try to relate the completeness with the settlement’s locations, and we verify that the most part of news’s watercourses are represented in non-urbanized areas. Other detailed analysis was carried out in two zones defined randomly, and we didn’t observe a relation between the creation of news’s OSM watercourses with those indicators.
Other future research direction will be to analyse the application of the same methodology to an area of the same size, in the same country but in a non-urban area and in the same temporal epochs (2014 and 2023), which allows to analyse the relation of the same indicators to completeness, particularly verifying whether or not the presence of people influence the representation of this OSM feature, therefore we already know from other published studies that the completeness of other OSM features, such as buildings and other objects located in urban environment, is influenced and correlated by the presence of people that lives in these areas, particularly the OSM contributors.
Author Contributions
Conceptualization, E.M. and G.P. methodology, E.M.; software, E.M.; validation, E.M. and G.P.; formal analysis, E.M. and G.P.; investigation, E.M. and G.P.; resources, E.M. and G.P.; writing-original draft preparation, E.M.; writing-review and editing, E.M. and G.P. Both authors have read and agreed to the published version of the manuscript.
Funding
This work was supported by the Portuguese Foundation for Science and Technology under the project grant UIDB/00308/2020 with the DOI 10.54499/UIDB/00308/2020.
Acknowledgments
The authors thank the Army Geospatial Information Center (Portugal) for making available the hydrography of the military map 1/25,000 that was used in the study as reference data.
Conflicts of Interest
The authors declare no conflicts of interest.
References
- Bao, L.; Lv, X.; Yao, J. Water Extraction in SAR Images Using Features Analysis and Dual-Threshold Graph Cut Model. Remote Sens. 2021, 13, 3465. [Google Scholar] [CrossRef]
- Jiang, H.; Feng, M.; Zhu, Y.; Lu, N.; Huang, J.; Xiao, T. An Automated Method for Extracting Rivers and Lakes from Landsat Imagery. Remote Sensing. Journal 2014, www.mdpi.
- Al-Bakri, M.; Fairbairn, D. Assessing the accuracy of ‘Crowdsourced’ data and its integration with official spatial datasets. In: Proc. Symp. Accuracy Abbreviated Journal 2010, Leicester, UK, 317-320.
- Biljecki, F.; Chow, Y.S.; Lee, K. Quality of crowdsourced geospatial building information: A global assessment of OpenStreetMap attributes. Building and Environment 2023, 237, 110295. [Google Scholar] [CrossRef]
- Girres, J.F.; Touya, G. Quality assessment of the french OpenStreetMap dataset. Trans. GIS 2010, 14, 435–459. [Google Scholar] [CrossRef]
- ISO 19157. Geographic Information – Data Quality. ISO No. 19157 2013, Tech. Rep, 146pp.
- Barrington-Leigh, C.; Millard-Ball, A. The world's user-generated road map is more than 80% complete. PLoS One 2017, 12, e0180698. [Google Scholar] [CrossRef] [PubMed]
- Goodchild, M.F. Geographic Information Systems and Science: today and tomorrow. Annals of GIS – Taylor & Francis 2009, 15, 3–9. [Google Scholar]
- Chen, Y.; Wei, Z. Assessing completeness of global airport data in OSM. Advances in Cartography and GIScience of the International Cartographic Association, International Cartographic Conference (ICC 2023), 13-18 August 2023, Cape Town, South Africa.
- Hecht, R.; Kunze, C.; Hahmann, S. Measuring Completeness of Building Footprints in OpenStreetMap over Space and Time. ISPRS Int. J. Geo-Inf. 2013, 2, 1066–1091. [Google Scholar] [CrossRef]
- Brovelli, M.A.; Zamboni, G.A. New Method for the Assessment of Spatial Accuracy and Completeness of OpenStreetMap Building Footprints. ISPRS International Journal of Geo Information 2018, 7, 289. [Google Scholar] [CrossRef]
- Ullah, T.; Lautenbach, S.; Herfort, B.; Reinmuth, M.; Schorlemmer, D. Assessing Completeness of OpenStreetMap Building Footprints Using MapSwipe. International Journal of Geoinformation 2023, 20pp. [Google Scholar] [CrossRef]
- Herfort, B.; Lautenbach, A.; Albuquerque, J.P.; Anderson, J.; Zipf, A. A spatio-temporal analysis investigating completeness and inequalities of global urban building data in OpenStreetMap. Nature Communications 2023, 14pp. [Google Scholar] [CrossRef] [PubMed]
- Yeboah, G.; Porto de Albuquerque, J.; Troilo, R.; Tregonning, G.; Perera, S.; Ahmed, S.A.K.S.; Ajisola, M.; Alam, O.; Aujla, N.; Azam, S.I.; et al. Analysis of OpenStreetMap Data Quality at Different Stages of a Participatory Mapping Process: Evidence from Slums in Africa and Asia. ISPRS Int. J. Geo-Inf. 2021, 10, 265. [Google Scholar] [CrossRef]
- Neis, P.; Zielstra, D.; Zipf, A. The Street Network Evolution of Crowdsourced Maps: OpenStreetMap in Germany 2007–2011. Future Internet 2012, 4, 1–21 doiorg/103390/fi4010001. [Google Scholar] [CrossRef]
- Jackson, S.P.; Mullen, W.; Agouris, P.; Crooks, A.; Croitoru, A.; Stefanidis, A. Assessing Completeness and Spatial Error of Features in Volunteered Geographic Information. ISPRS – International Journal of Geo-Information 2013, 2, 507–530; [Google Scholar] [CrossRef]
- Brückner, J.; Schott, M.; Zipf, A.; Lautenbach, S. Assessing shop completeness in OpenStreetMap for two federal states in Germany. AGILE GIScience Ser. 2021, 2, 1–7. [Google Scholar] [CrossRef]
- Wang, S.; Zhou, Q.; Tian, Y. Understanding Completeness and DiversityPatterns of OSM-Based Land-Use and Land Cover Dataset in China. ISPRS – Int. J. of Geo-Inf. 2020, 9, 531. [Google Scholar] [CrossRef]
- Barron, C.; Neis, P.; Zipf, A. A Comprehensive Framework for Intrinsic OpenStreetMap Quality Analysis. Transactions in GIS, 2014, 6, 877–895. [Google Scholar] [CrossRef]
- Sampaio, T.V.M.; Rocha, J. On the Quality of the drainage network cartographic representation. Ecological Indicators 2022, 143, 109350, ISSN 1470–160X. [Google Scholar] [CrossRef]
- Afonso, A.; Lopes, J.; Dias, R. Controlo de Qualidade Posicional da Cartografia Militar do IGeoE em ETRS89. Report of IGeoE 2010, 5pp. [Google Scholar]
- Herfort, B.; Lautenbach, S.; Porto de Albuquerque, J.; Anderson, J.; Zipf, A. The evolution of humanitarian mapping within the OpenStreetMap community. Sci. Rep. 2021, 11, 3037. [Google Scholar] [CrossRef]
- Herfort, B.; Lautenbach, S.; de Albuquerque, J.P.; Anderson, J.; Zipf, A. Investigating the digital divide in OpenStreetMap: Spatio-temporal analysis of inequalities in global urban building completeness. 2022, preprint.
- Quattrone, G.; Mashhadi, A.; Capra, L. Mind the map: The impact of culture and economic affluence on crowd-mapping behaviours. In Proceedings of the 17th ACM conference on Computer Supported Cooperative Work & Social Computing-CSCW ‘14, Baltimore, MD, USA, 15–19 February 2014; ACM Press: Baltimore, MD, USA, 2014; pp. 934–944. [Google Scholar]
- Zhou, Q.; Zhang, Y.; Chang, K.; Brovelli, M.A. Assessing OSM building completeness for almost 13, 000 cities globally. International Journal of Digital Earth 2022, 15, 2400–2421. [Google Scholar] [CrossRef]
- Borkowska, S.; Bielecka, E.; Pokonieczny, K. OpenStreetMap – building data completeness visualization in terms of “Fitness for purpose”. Advances in Geodesy and Geoinformation, 72, 20pp. [CrossRef]
- Zhang, Y.; Zhou, Q.; Brovelli, M.A.; Li, W. Assessing OSM Building Completeness Using Population Data. International Journal of Geographical Information Science 2022, 36, 1443–1466. [Google Scholar] [CrossRef]
Figure 1.
Location of study area: rectangular region included in the Mondego River basin, which corresponds to the area of the sheet number 201 of the M888 cartographic series of the Geospatial Information Center of Portuguese Army.
Figure 1.
Location of study area: rectangular region included in the Mondego River basin, which corresponds to the area of the sheet number 201 of the M888 cartographic series of the Geospatial Information Center of Portuguese Army.
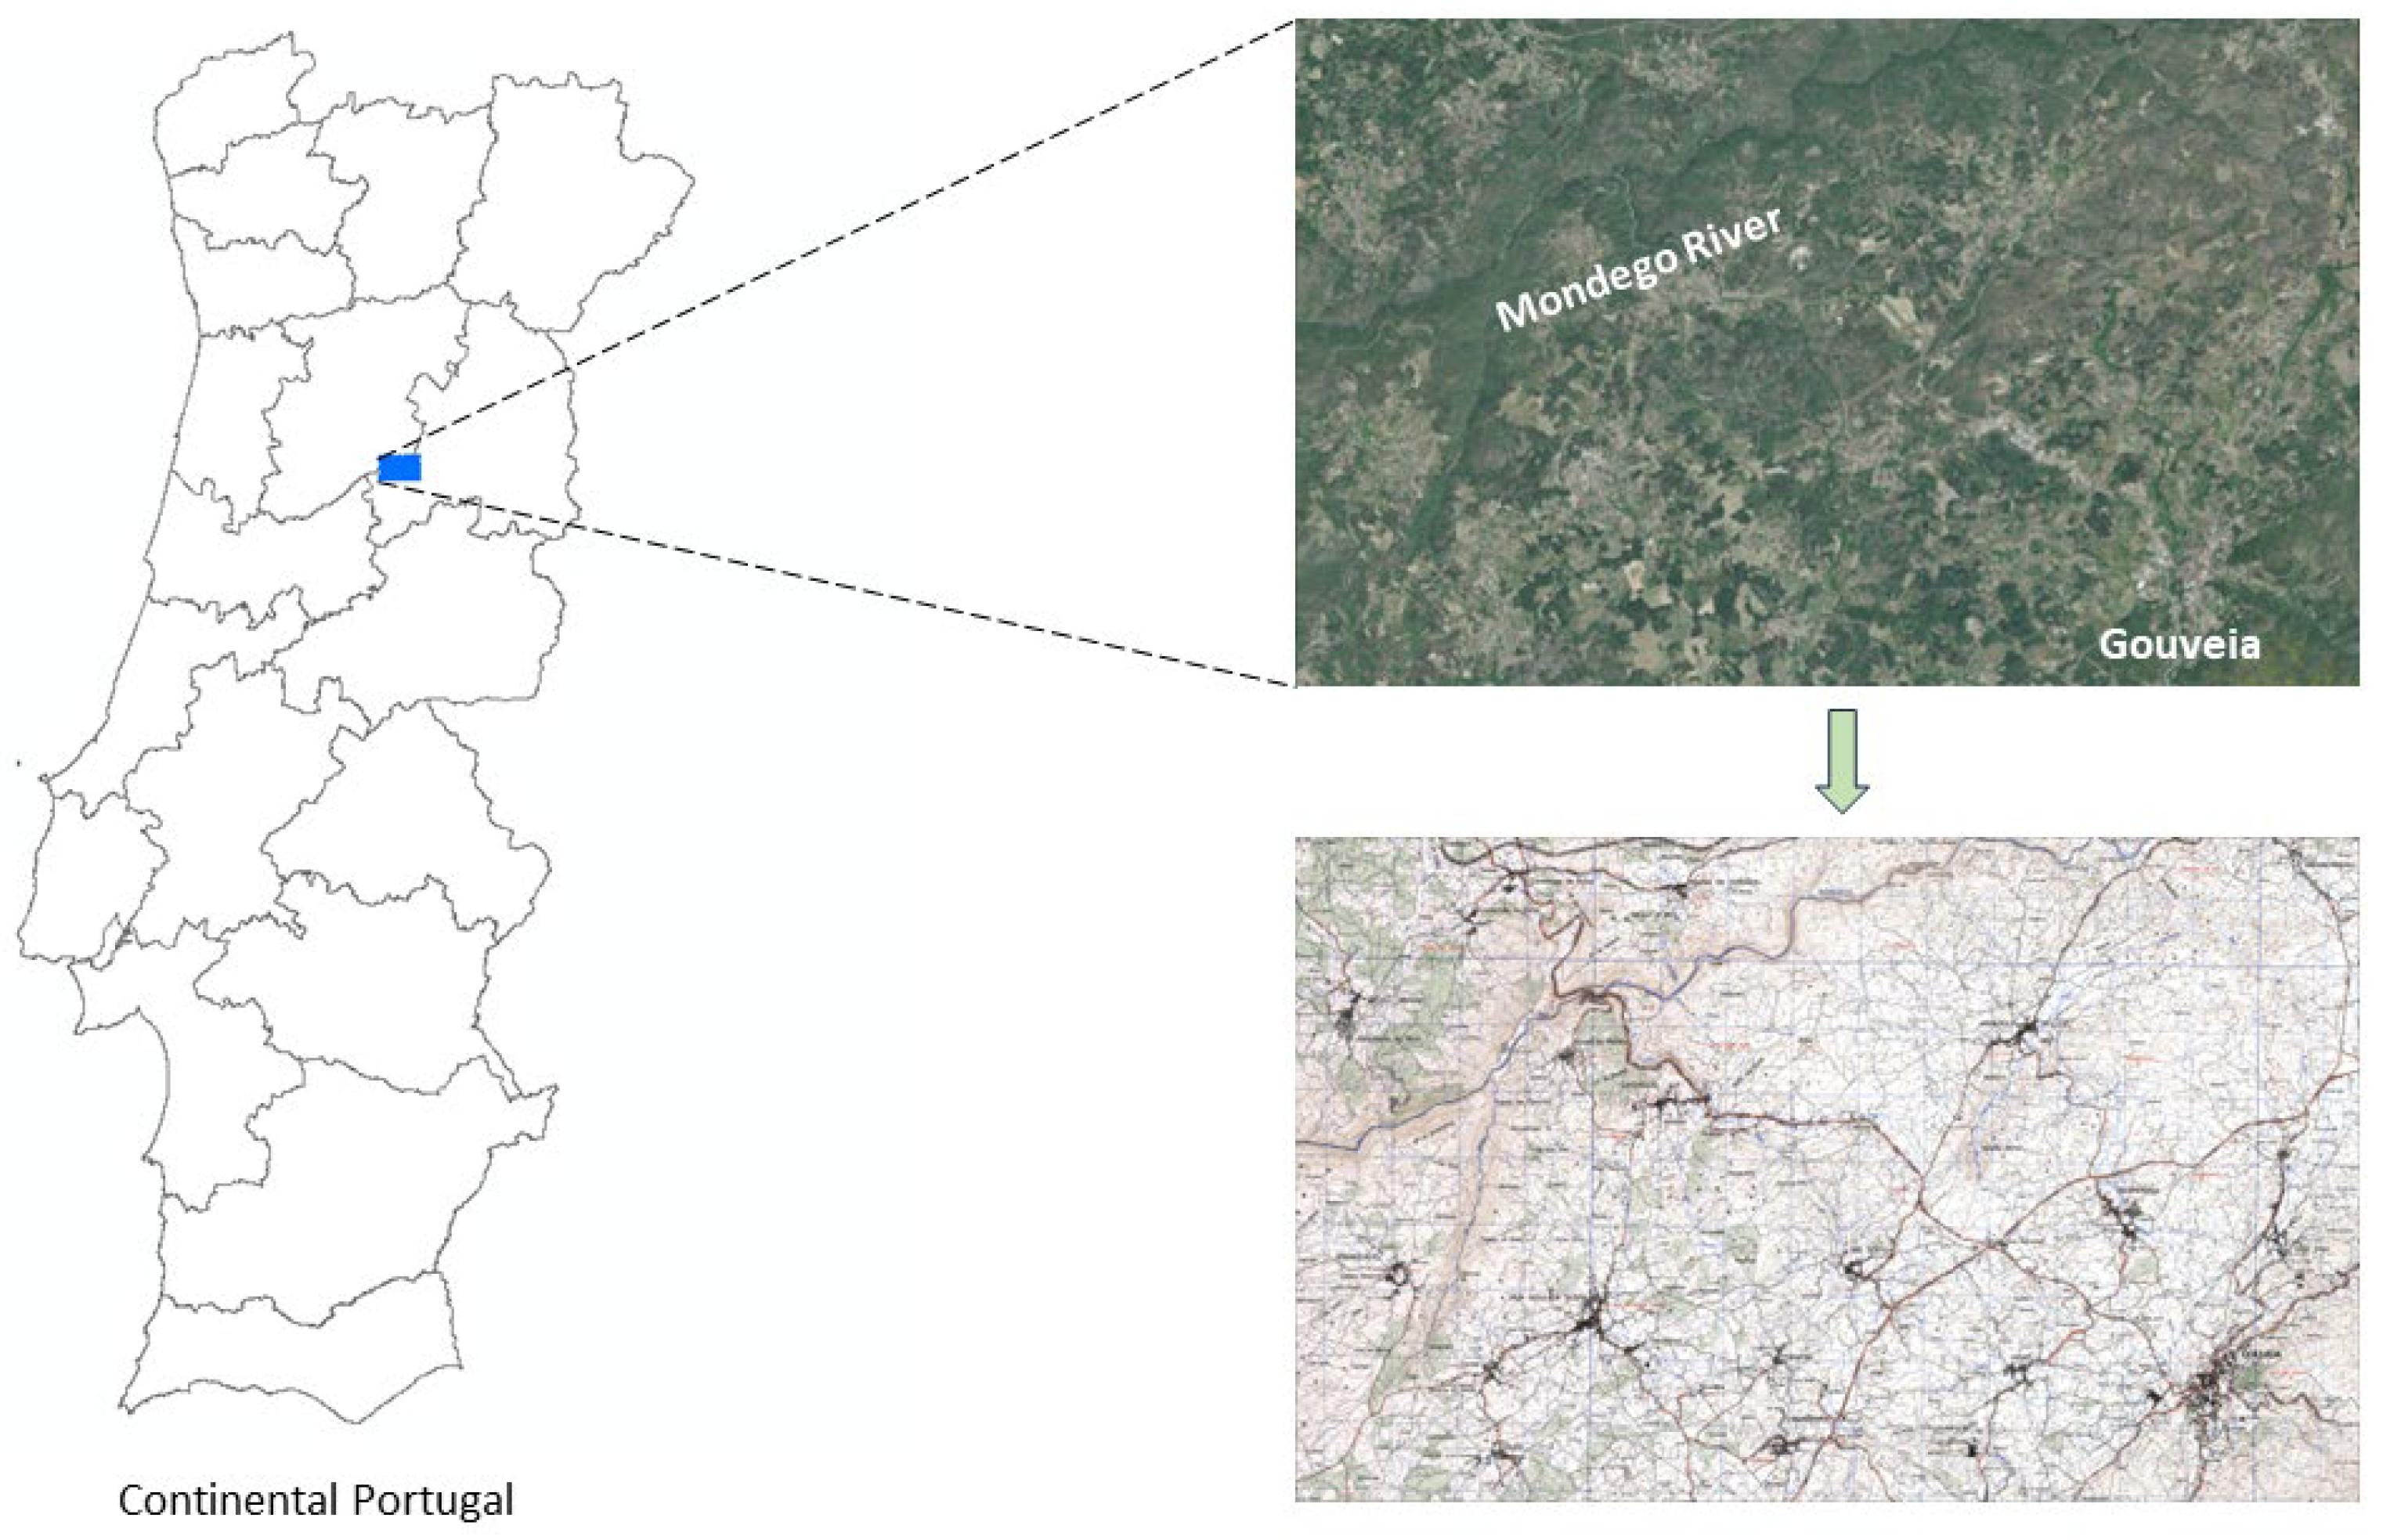
Figure 2.
Reference data - Army Geospatial Information Center Hydrography at 1/25 000 scale.
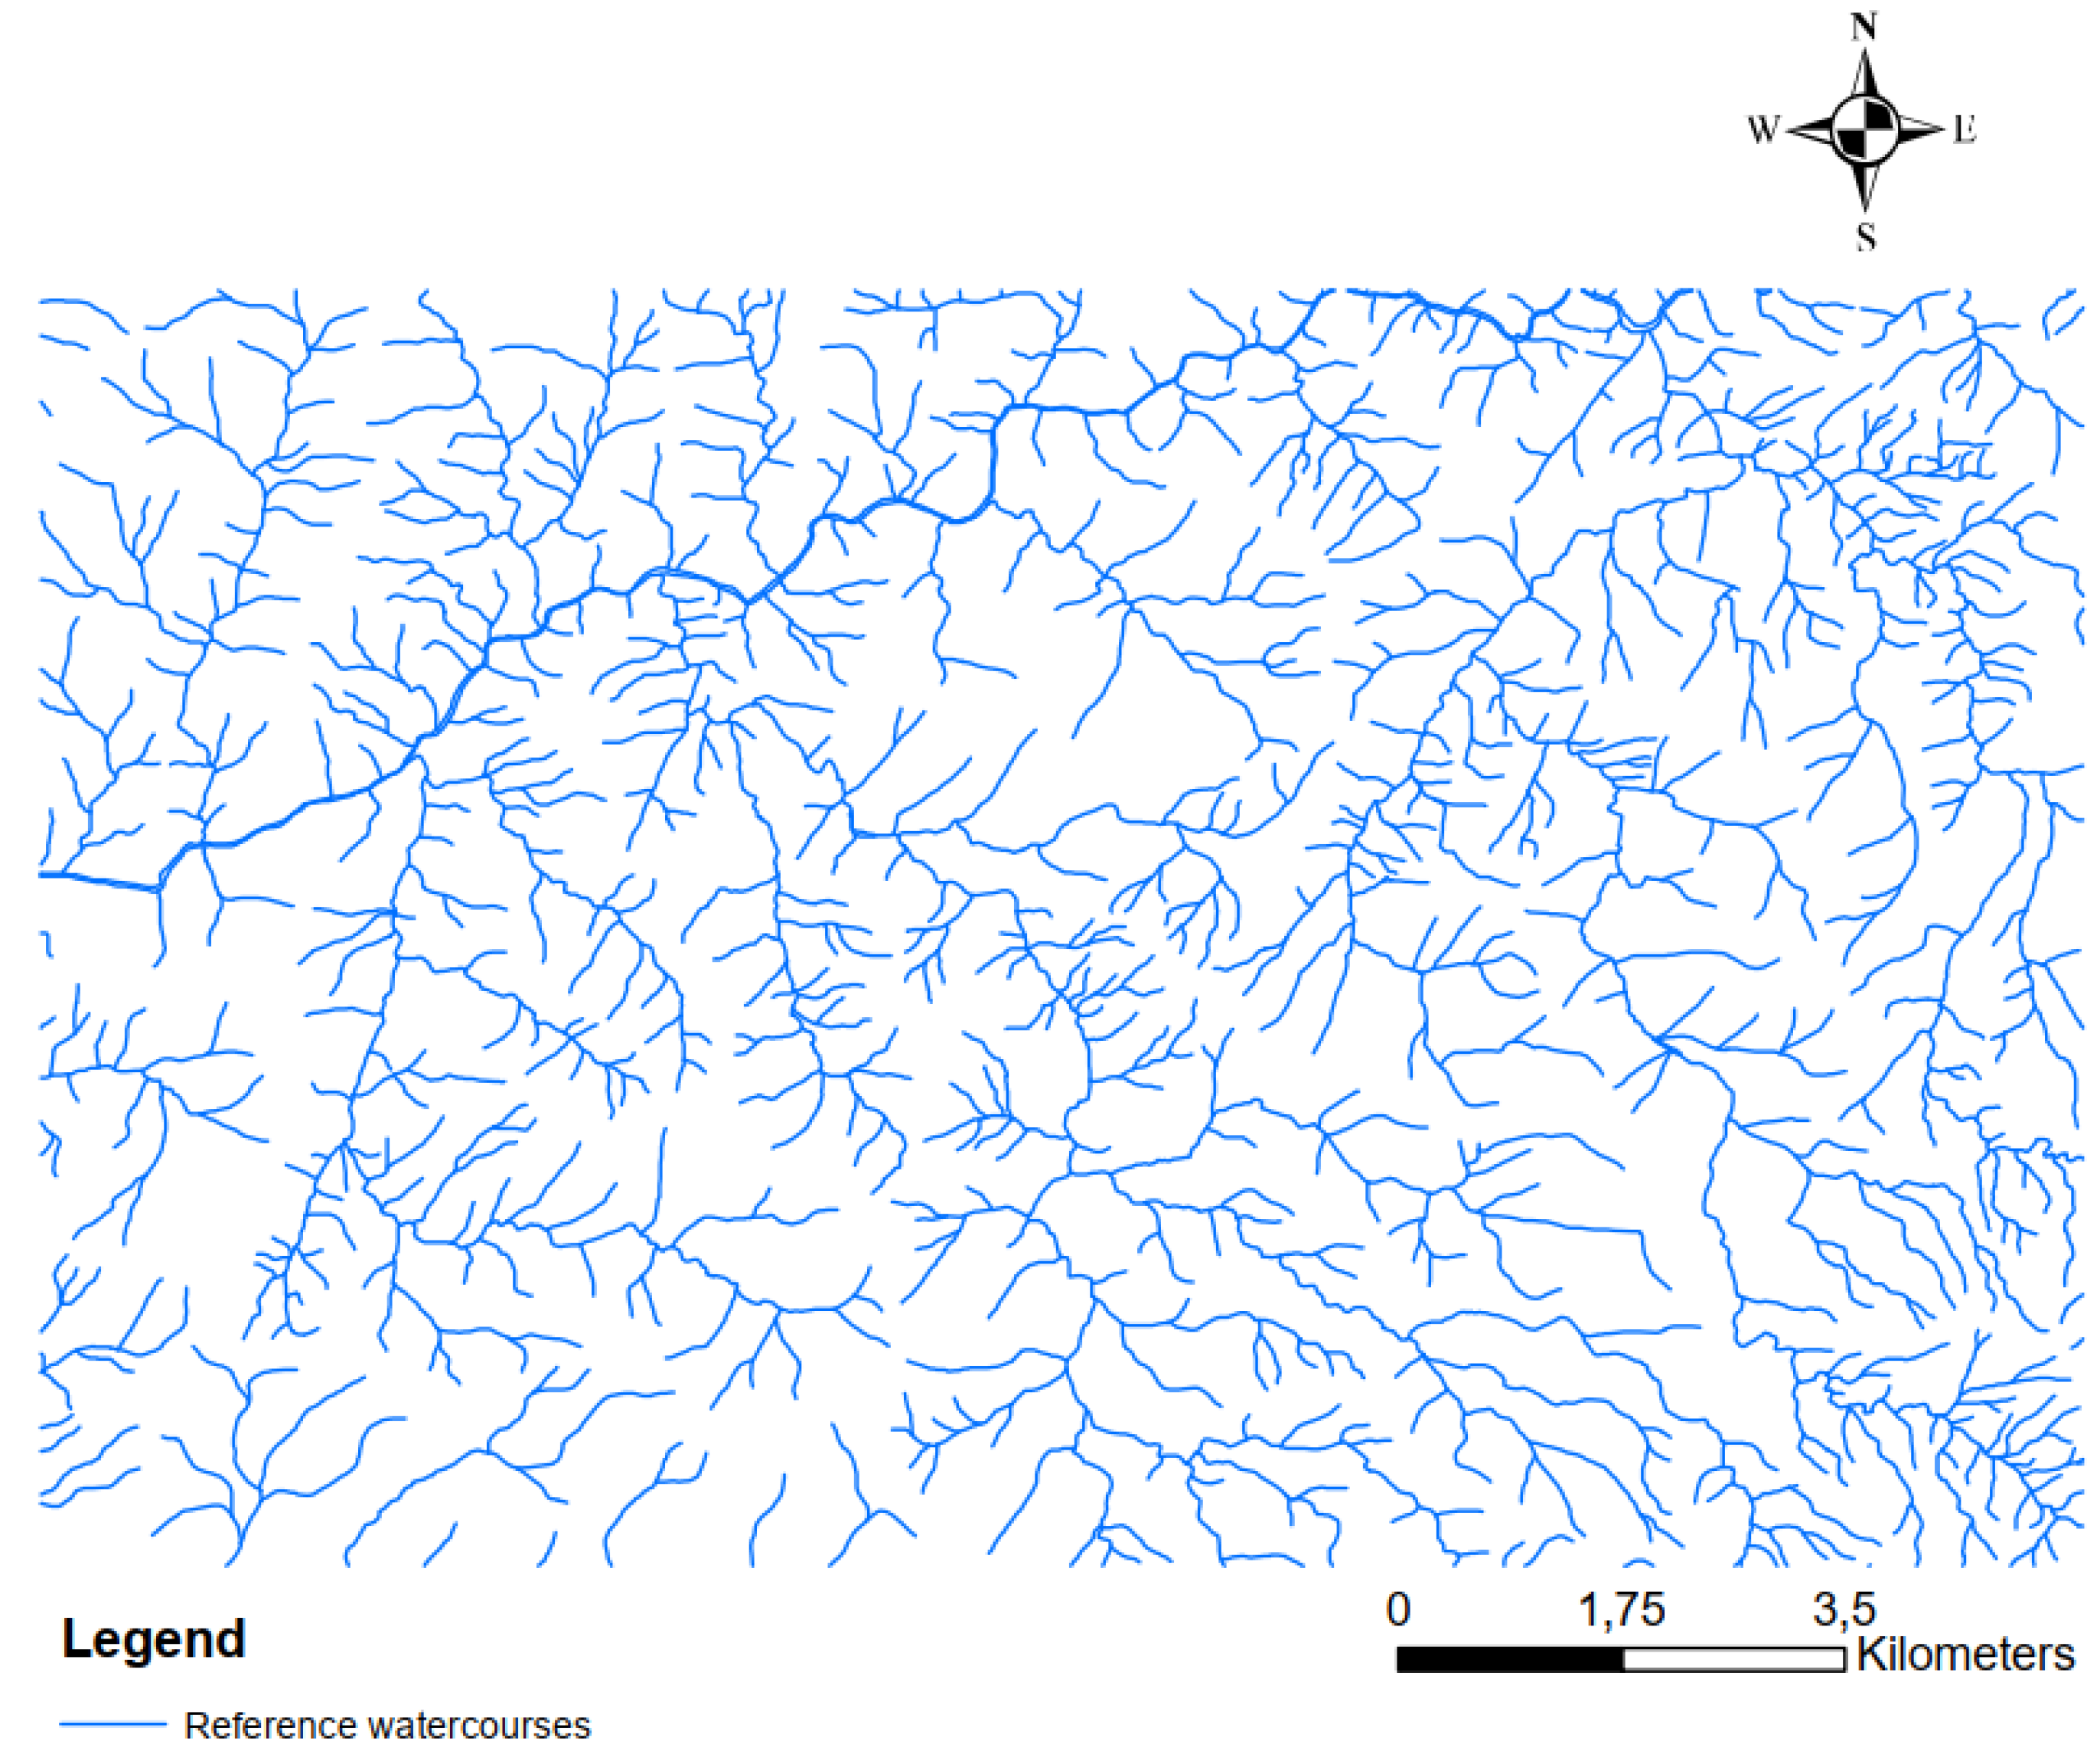
Figure 3.
OSM waterways extracted in 2014 (orange color) and in 2023 (green color) above satellite image.
Figure 3.
OSM waterways extracted in 2014 (orange color) and in 2023 (green color) above satellite image.
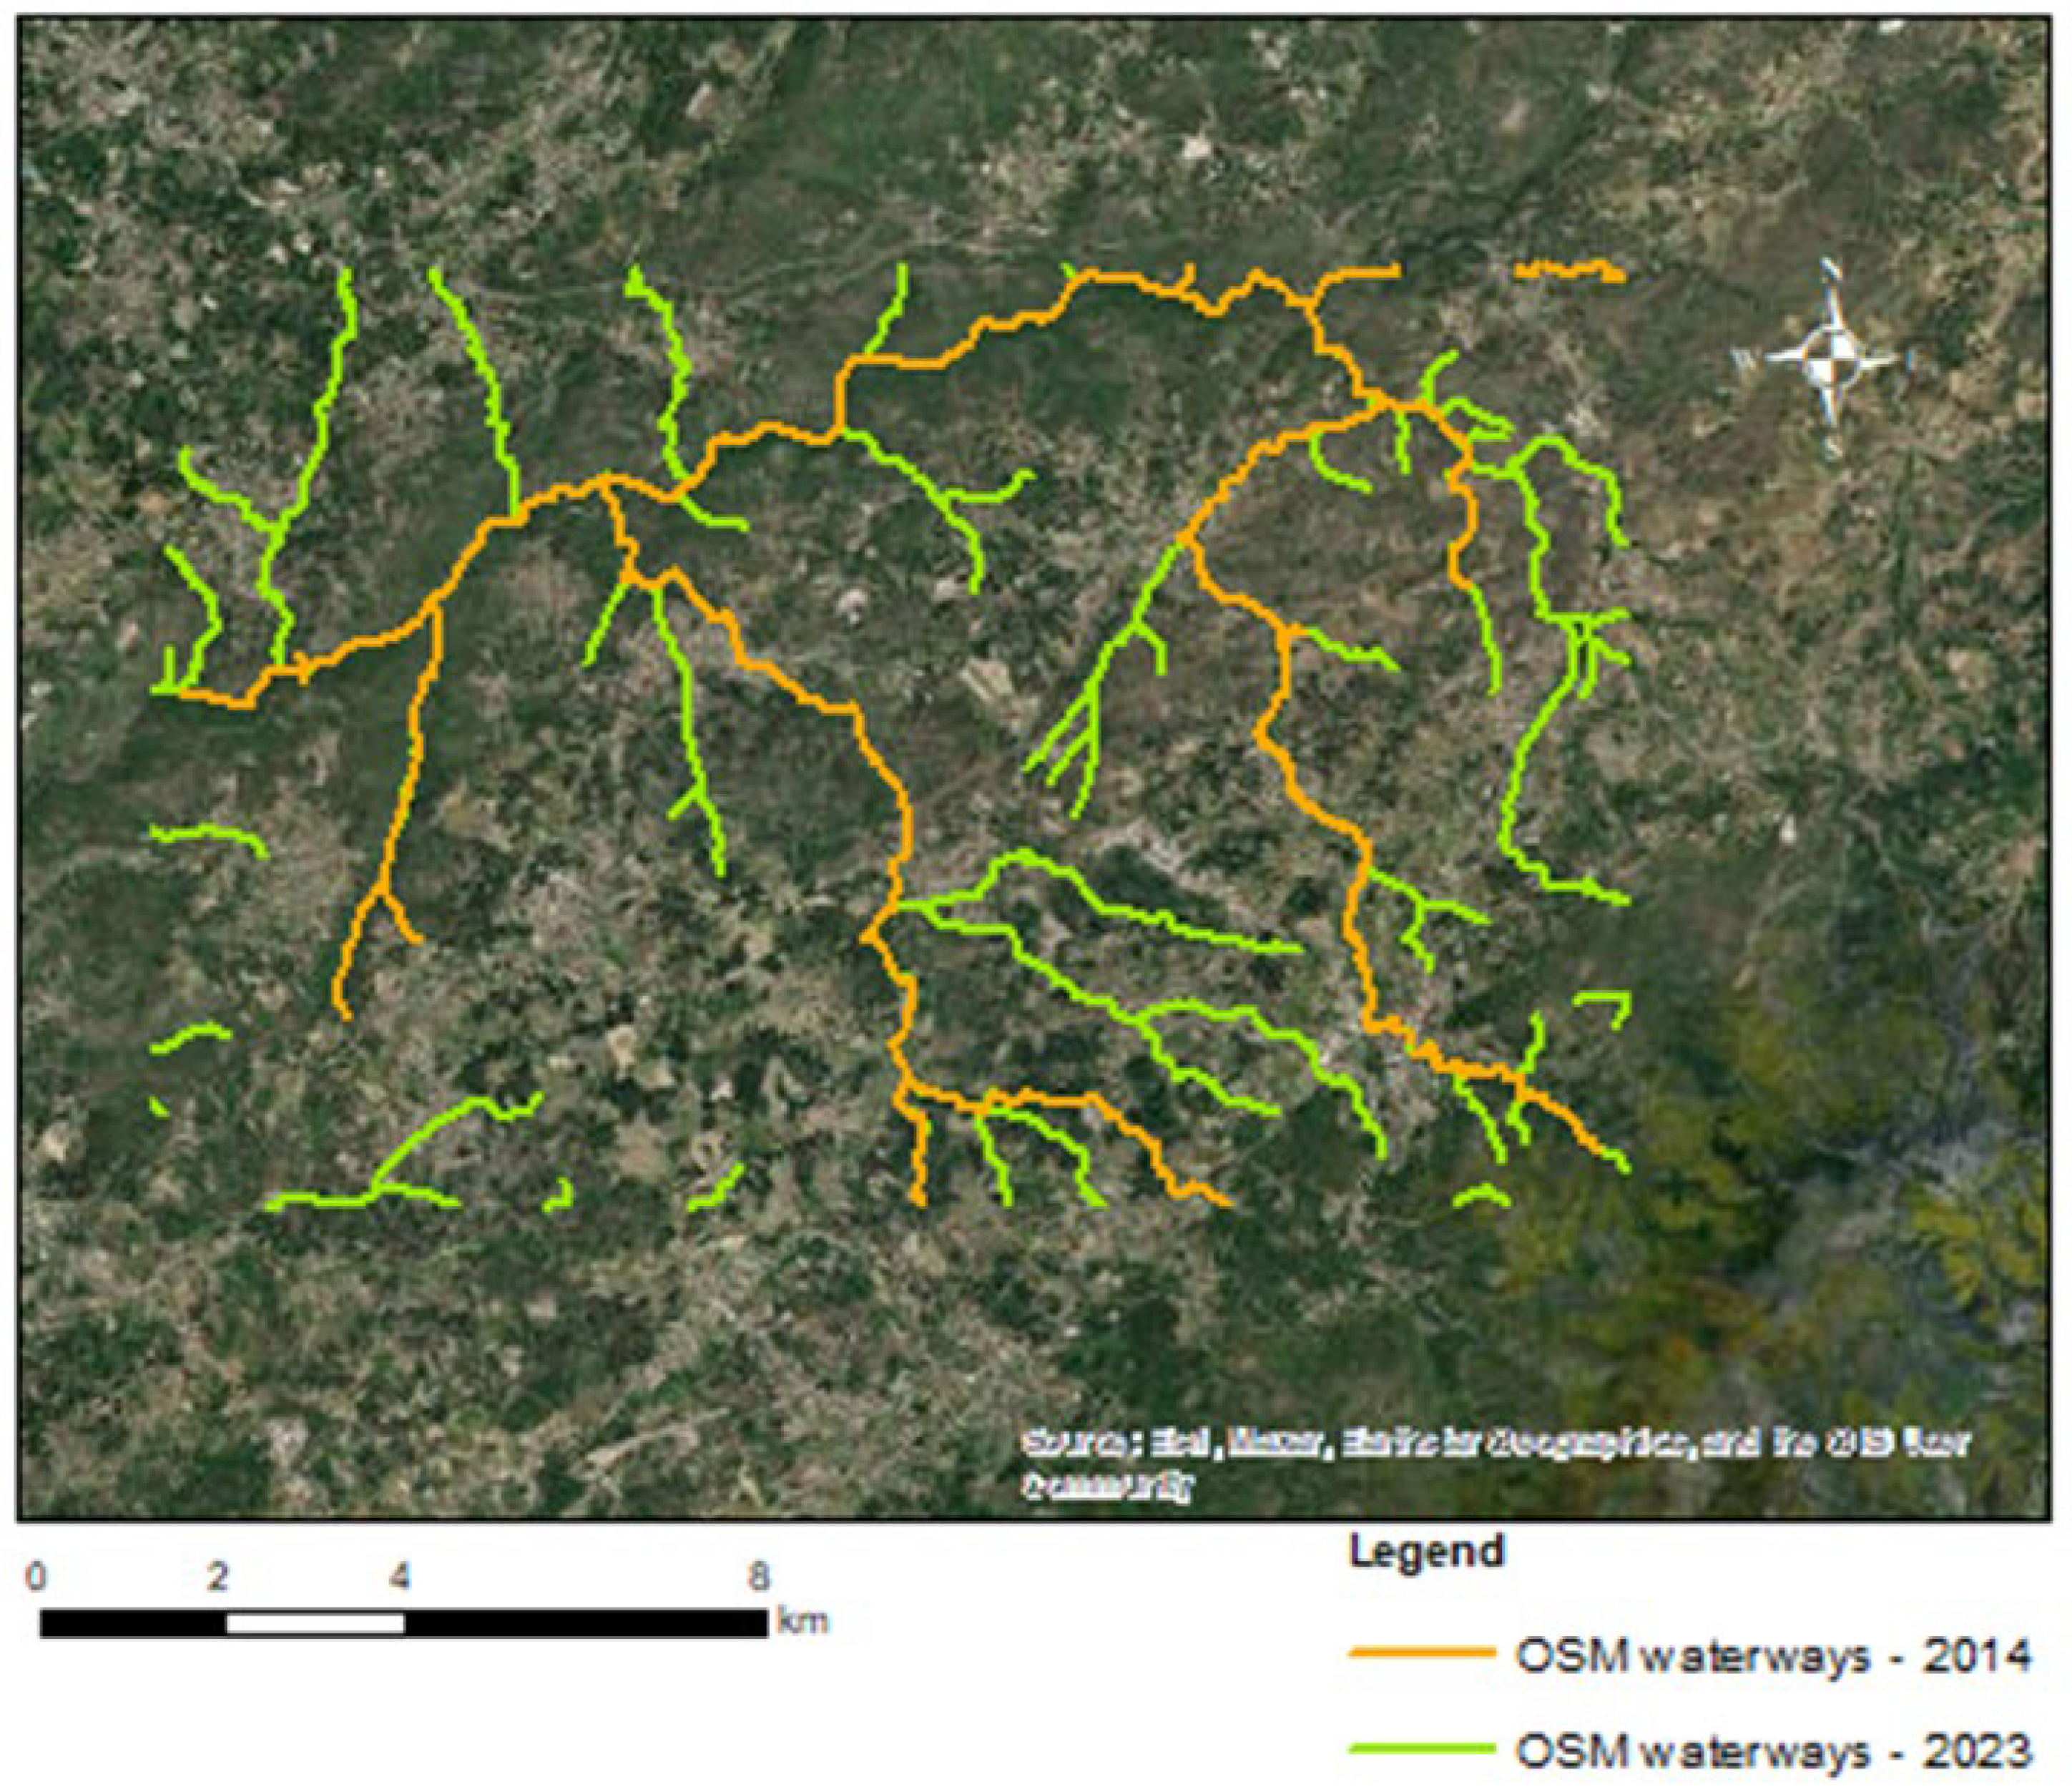
Figure 5.
OSM watercourses extracted in 2014 and 2023 and the reference watercourses.
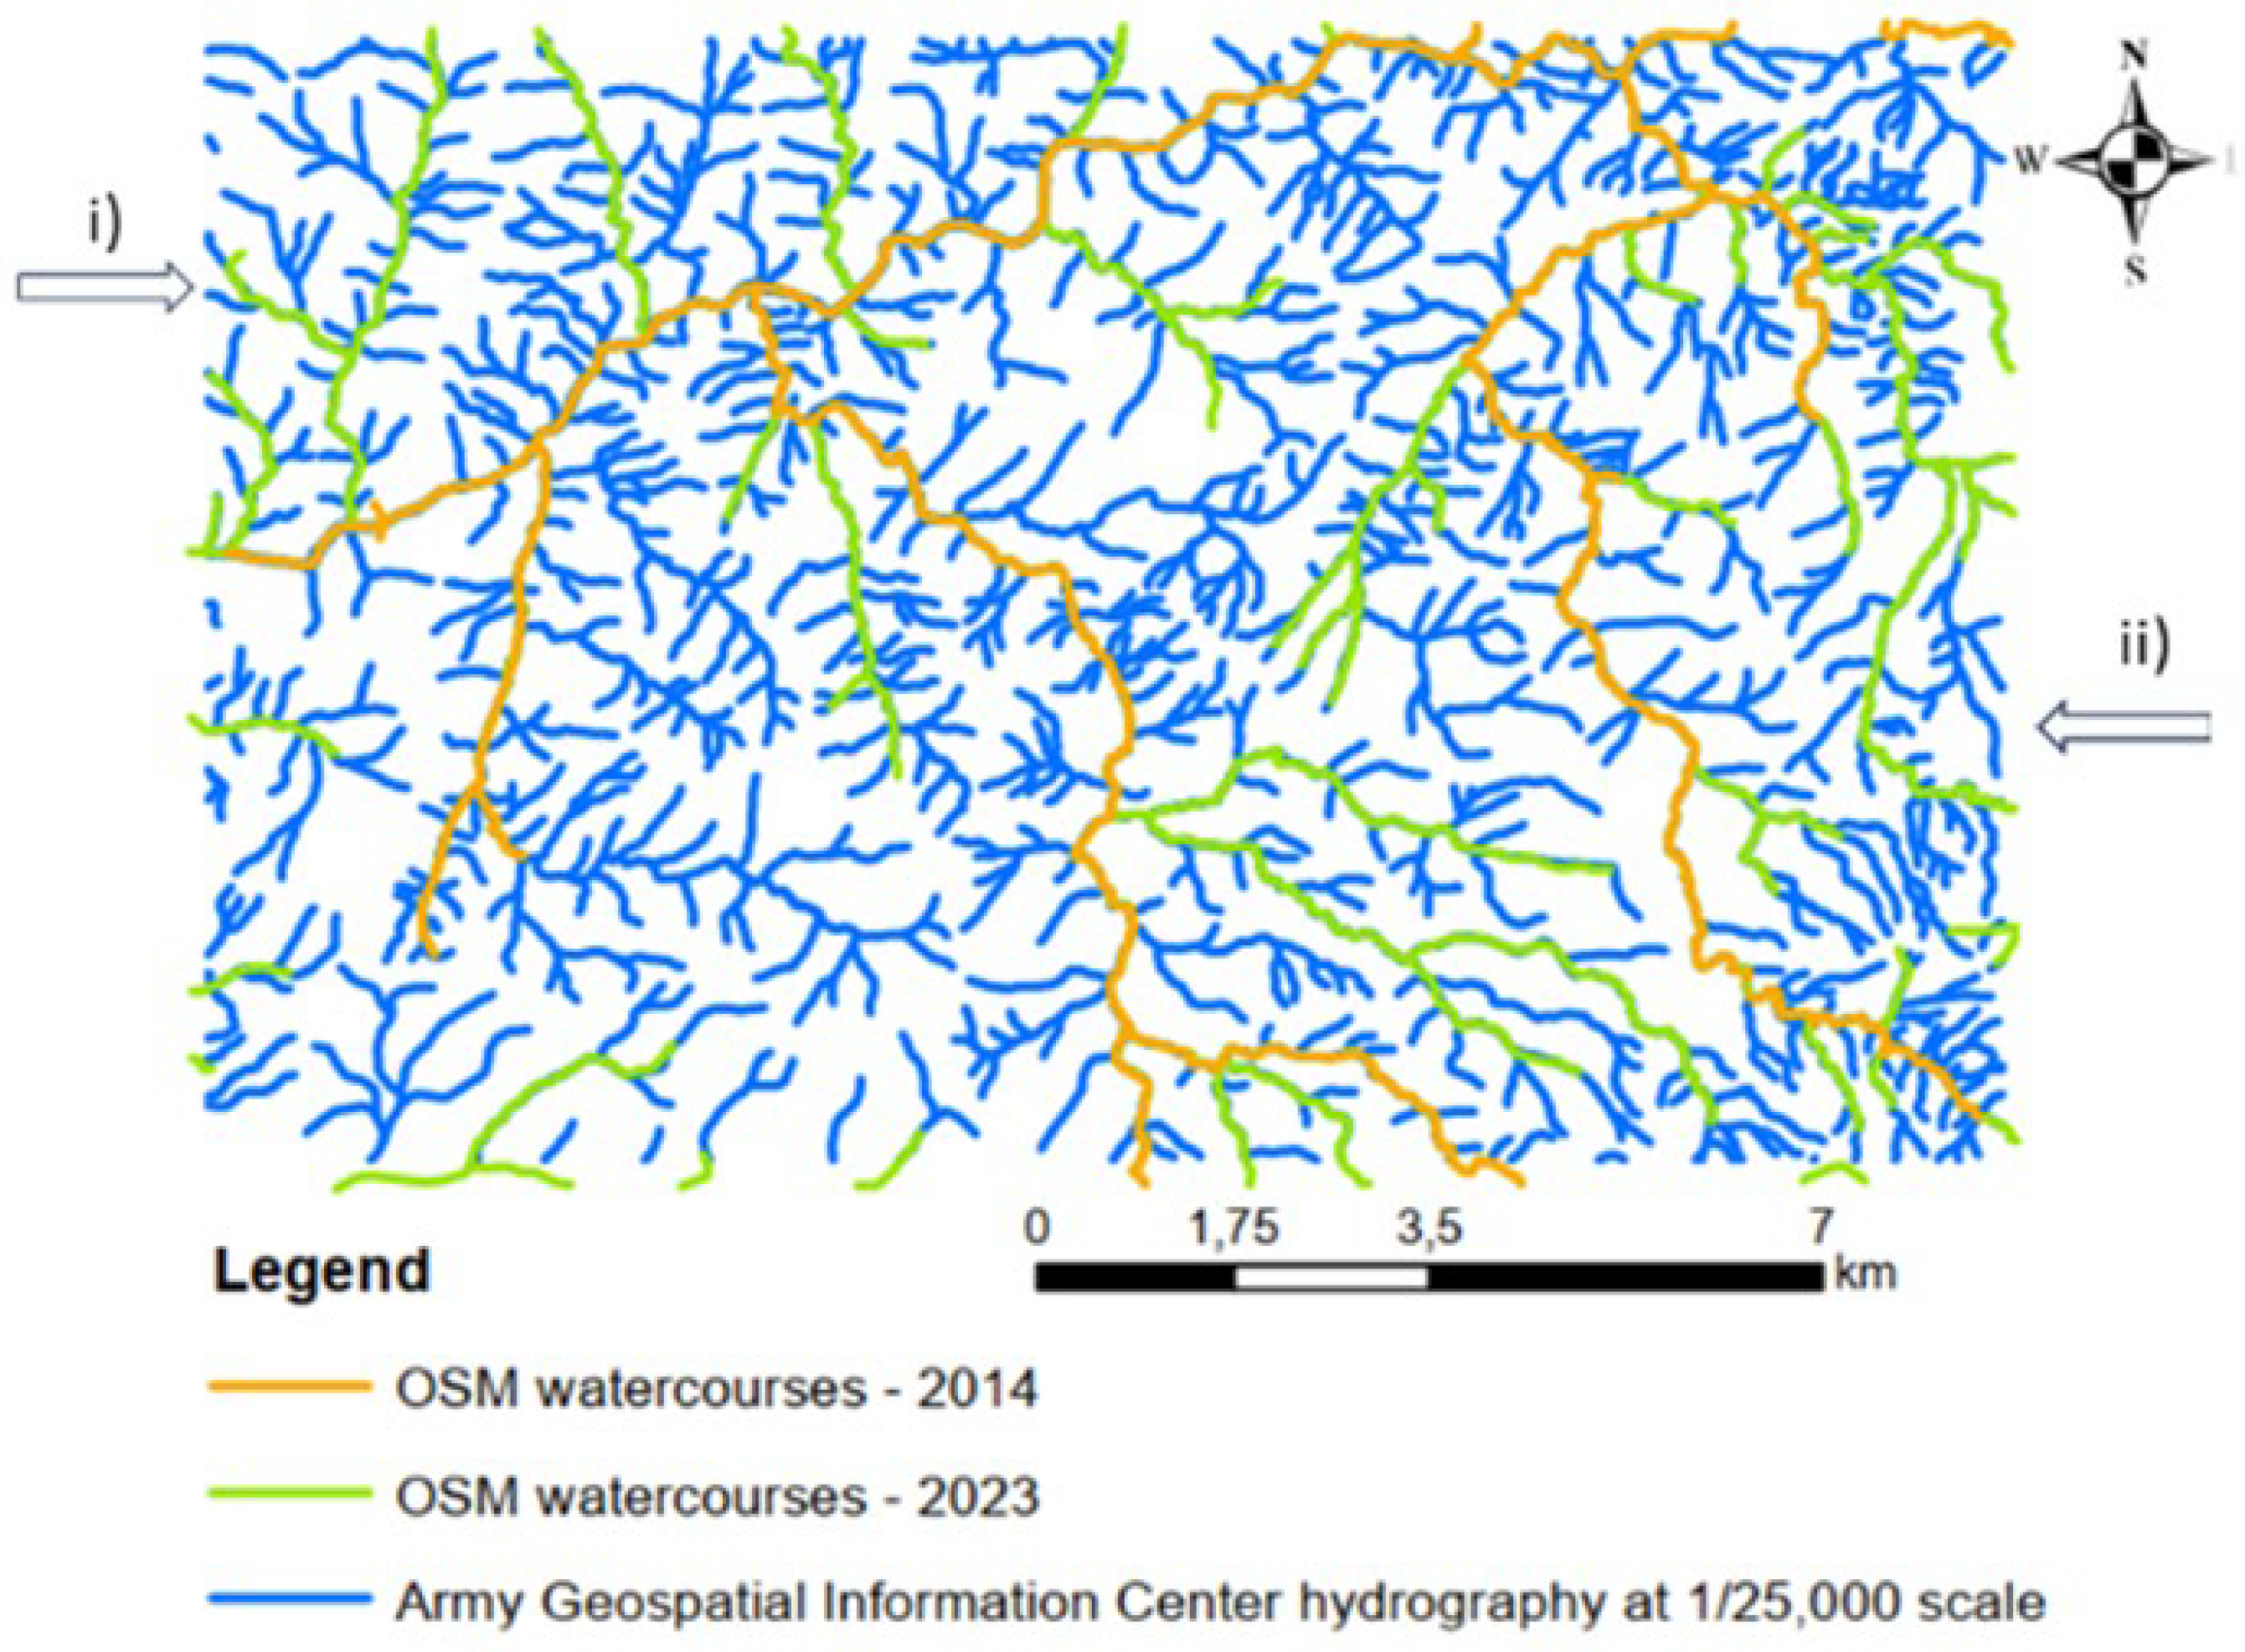
Figure 6.
Total length of watercourses of the reference drainage network and of OSM watercourses in 2014 and 2023 (left) and completeness values of OSM watercourses in 2014 and 2023 (right).
Figure 6.
Total length of watercourses of the reference drainage network and of OSM watercourses in 2014 and 2023 (left) and completeness values of OSM watercourses in 2014 and 2023 (right).
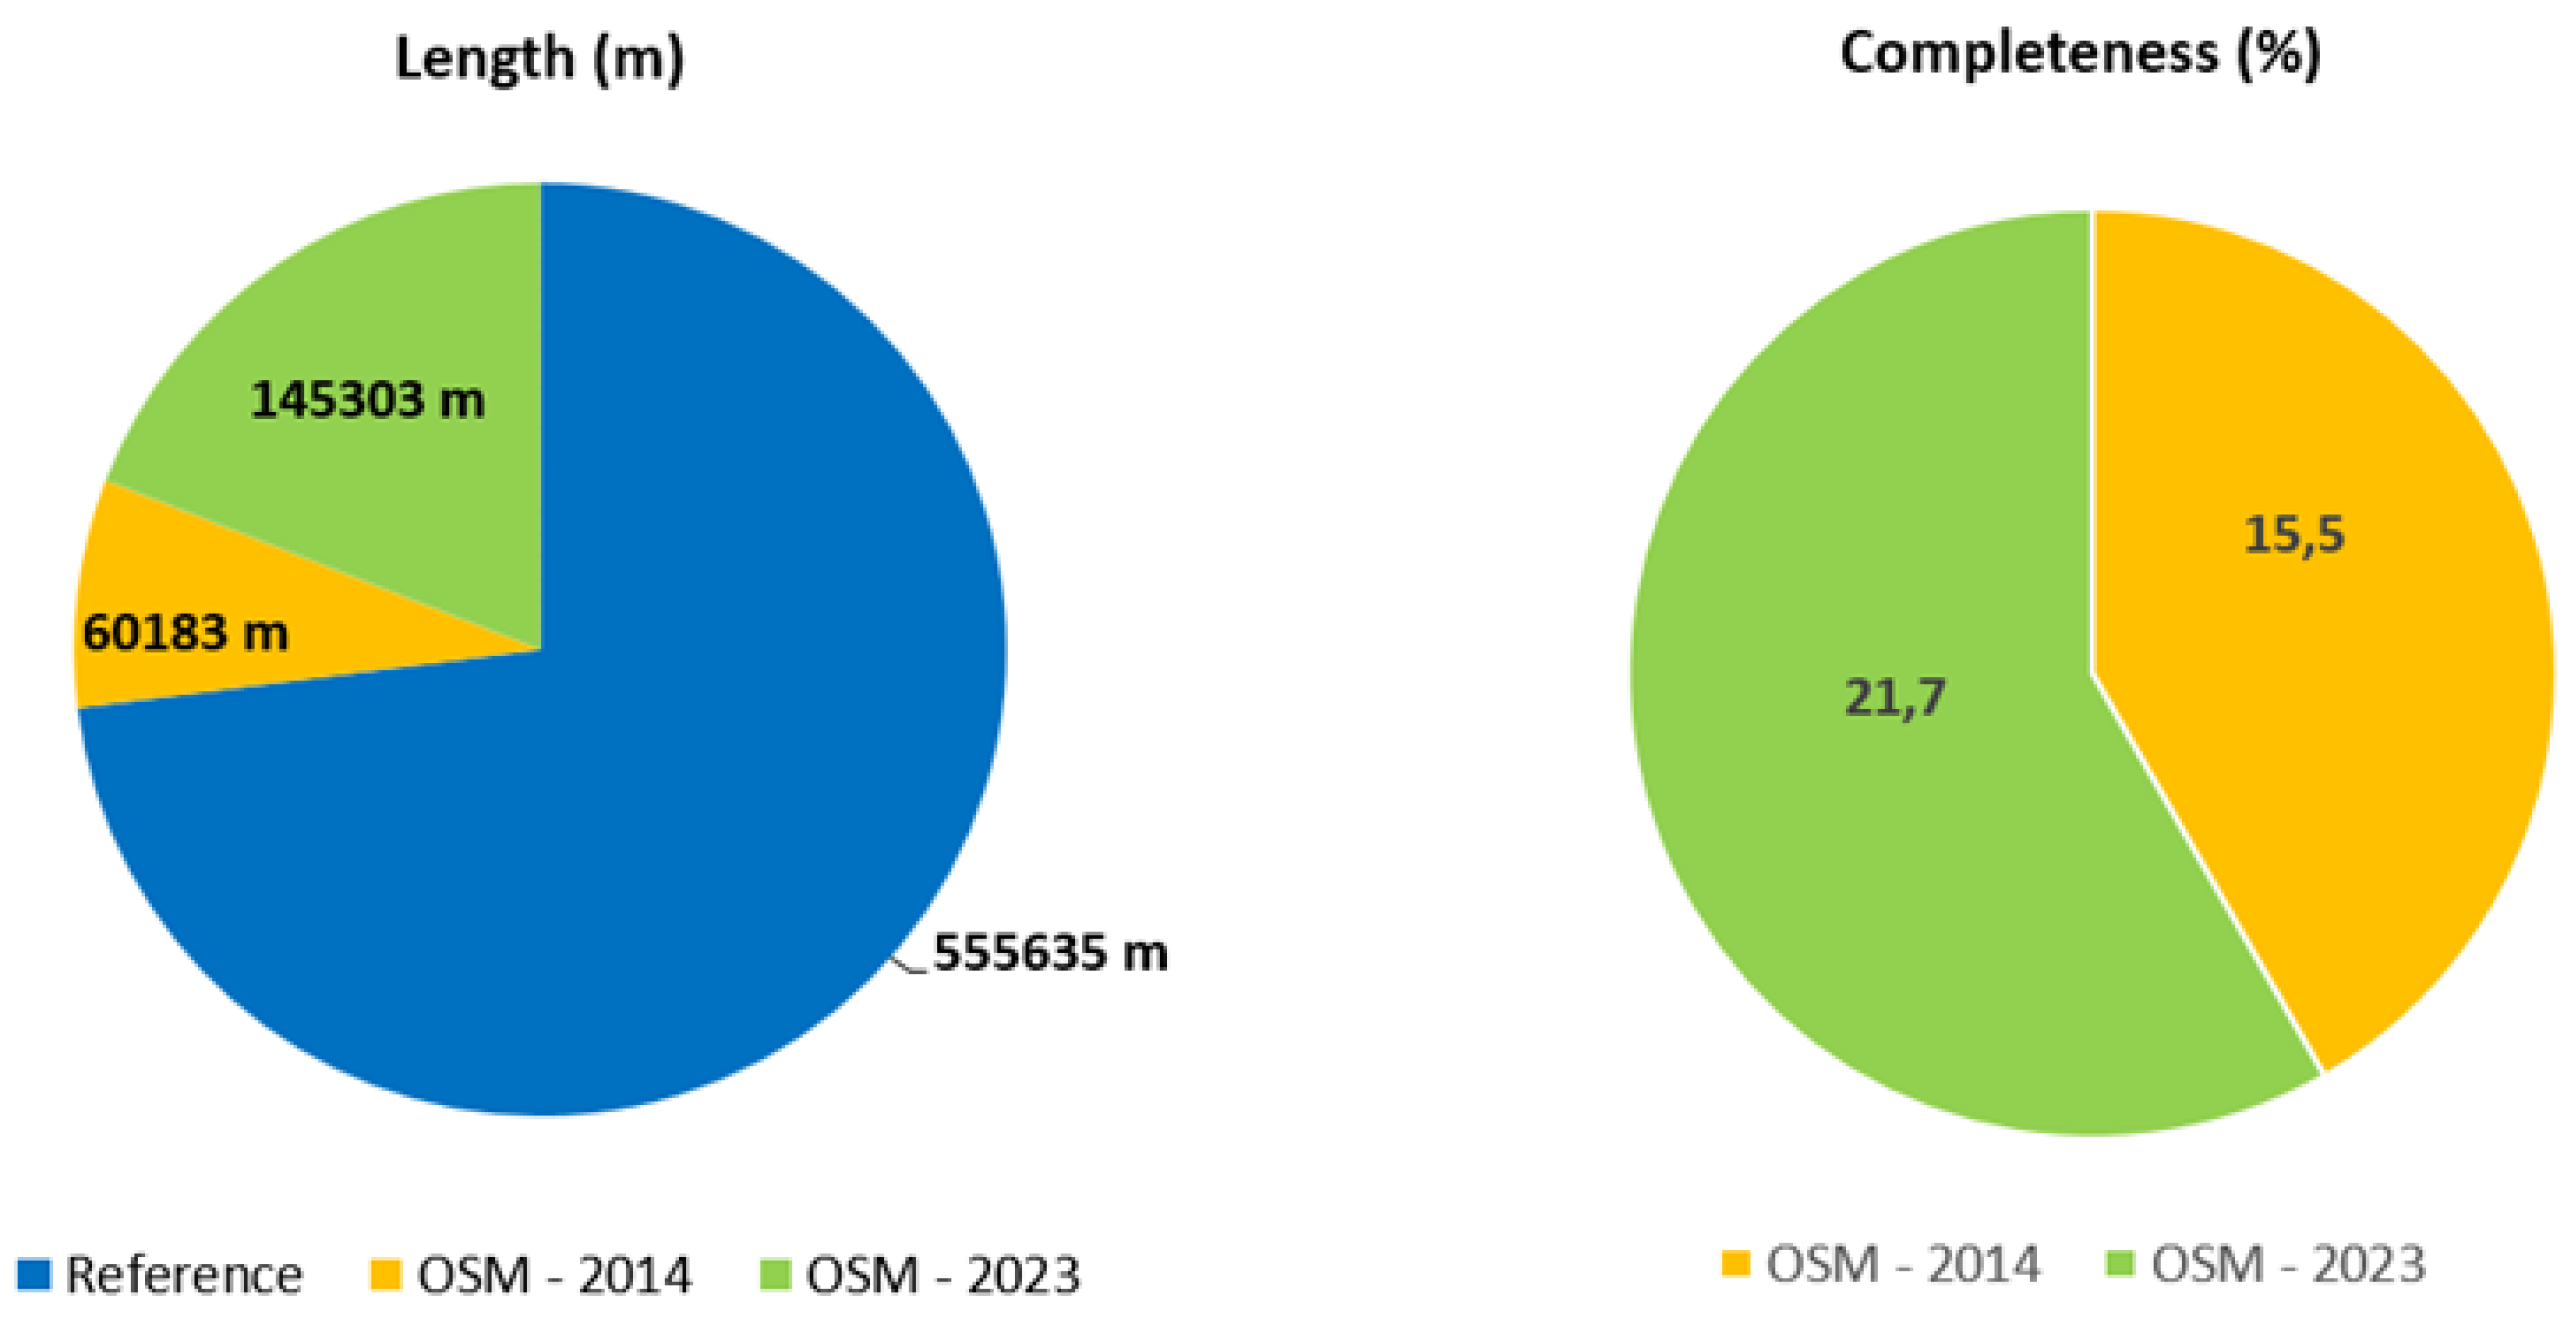
Figure 7.
Digital Elevation Model of study area and OSM watercourses in 2014 and 2023.
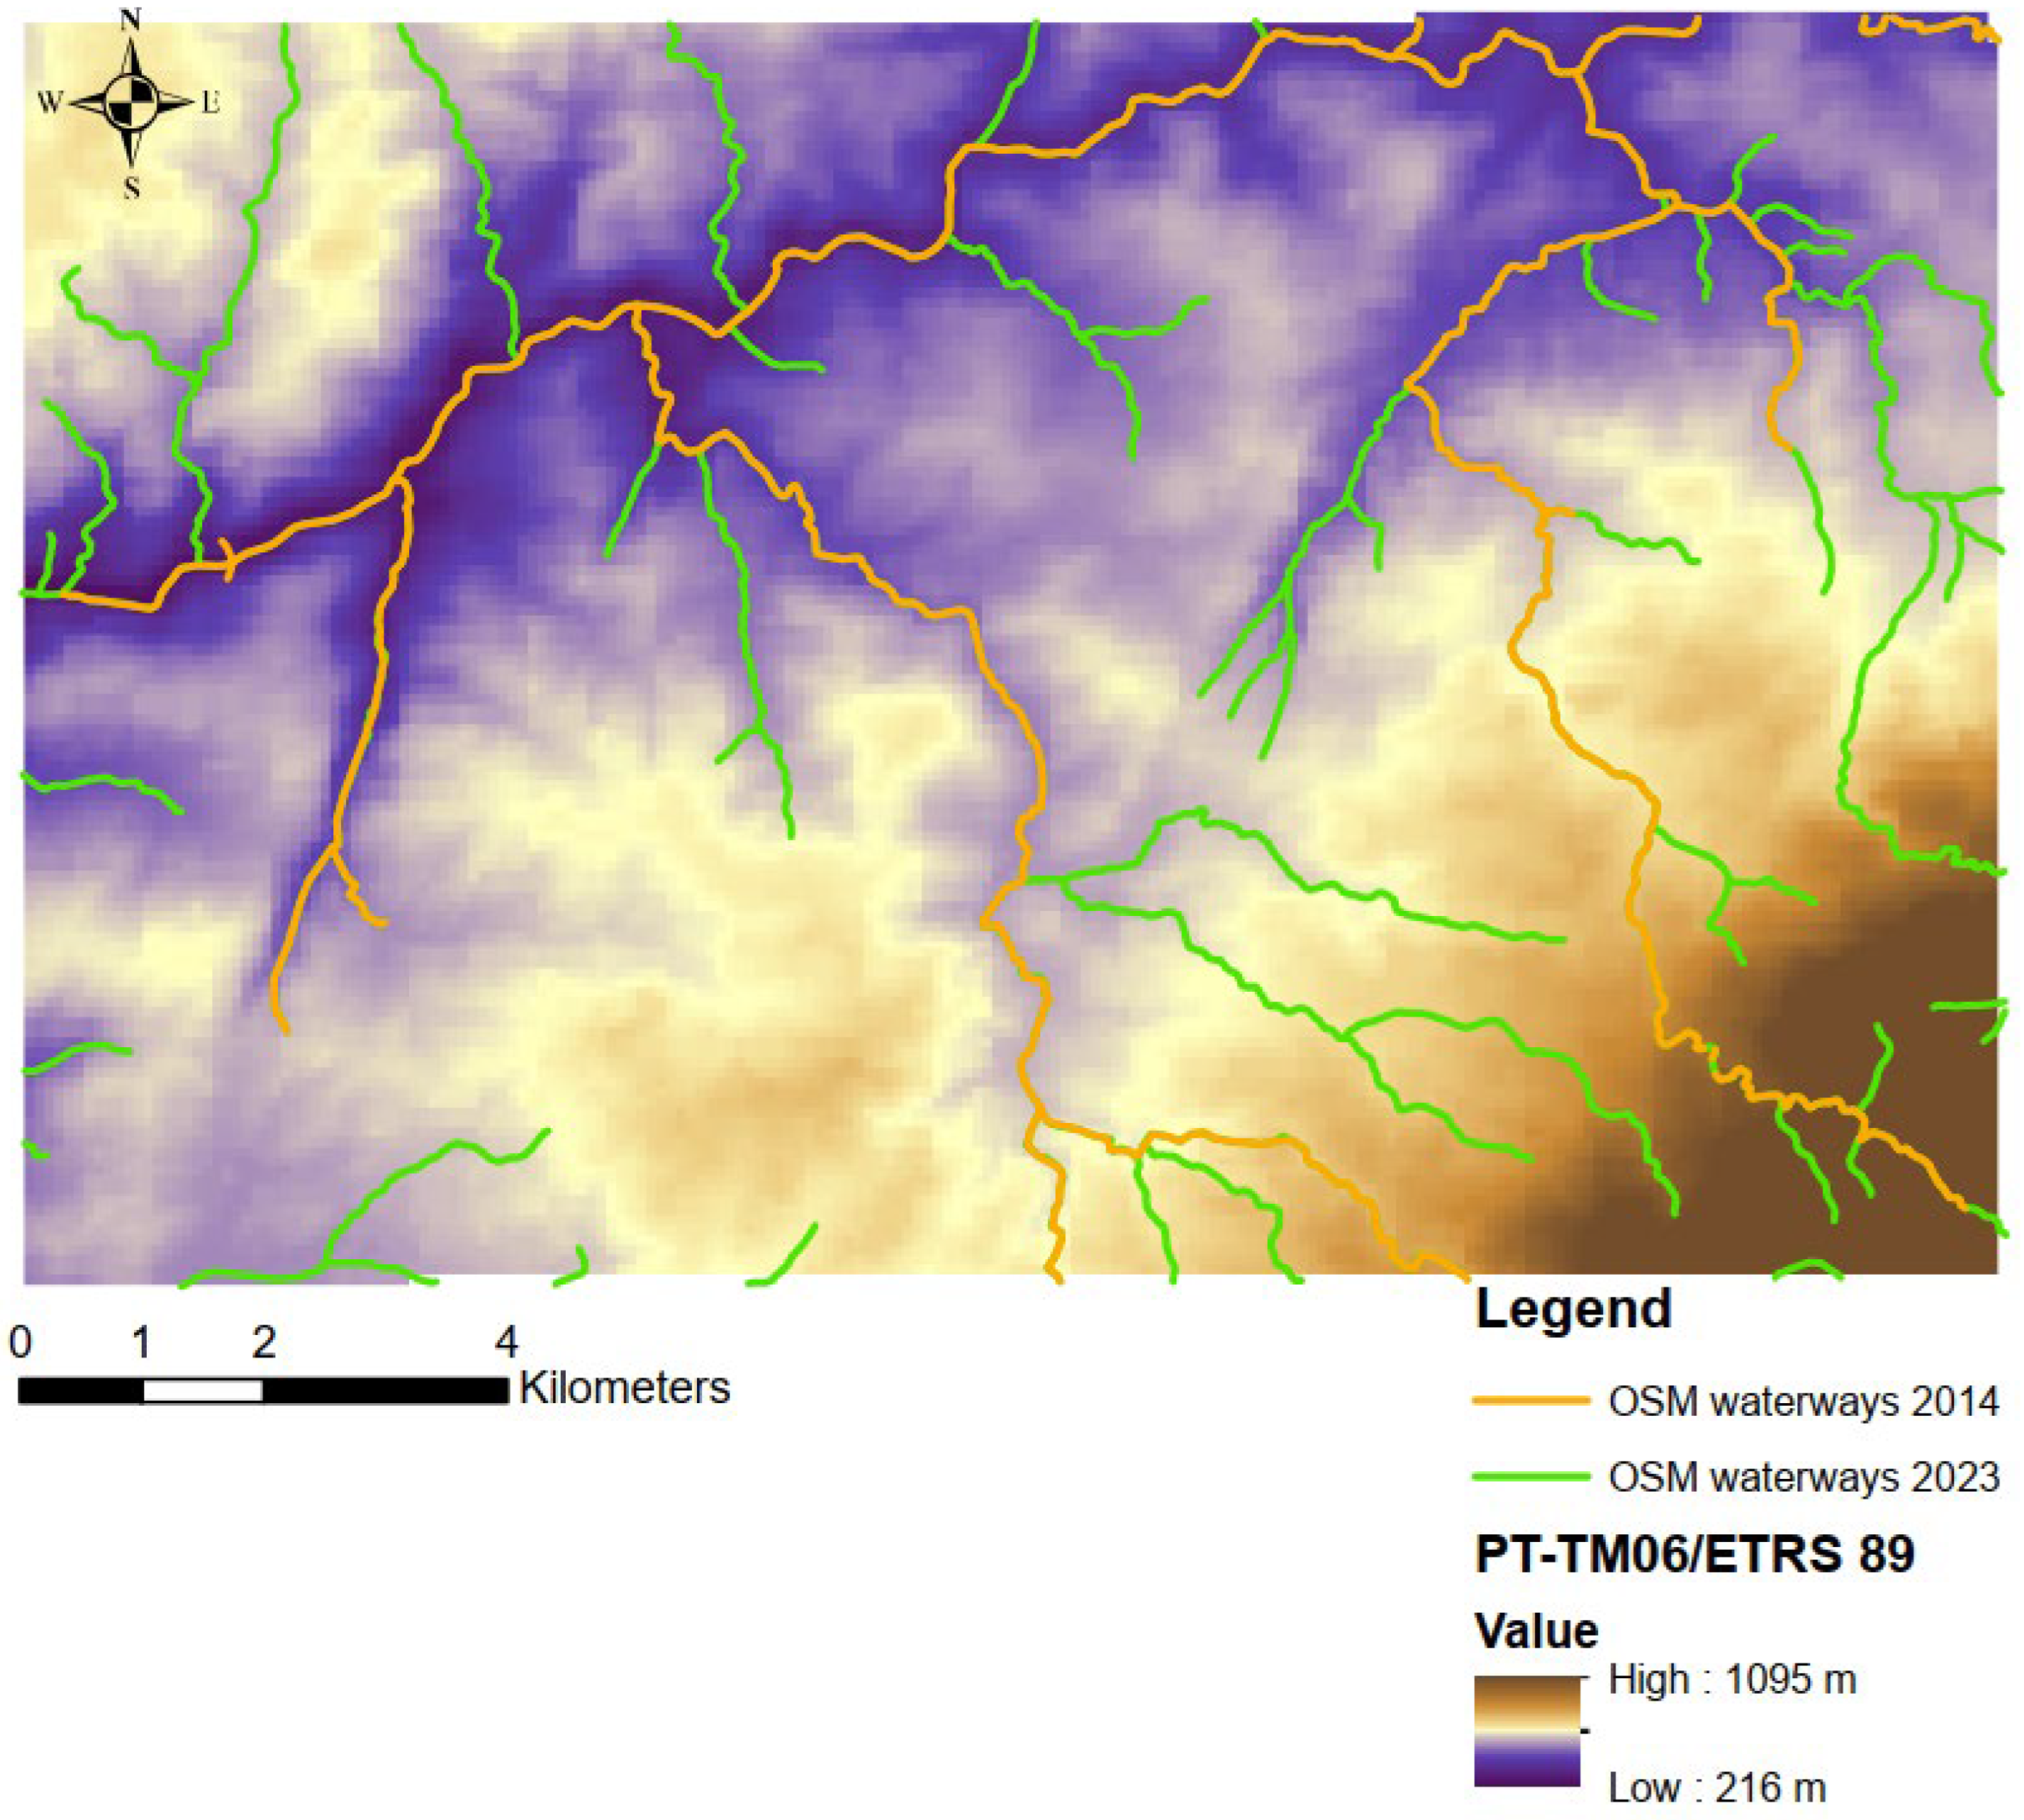
Figure 8.
Slope map of study area with the representation of OSM watercourses in 2014 (orange colour) and in 2023 (green colour).
Figure 8.
Slope map of study area with the representation of OSM watercourses in 2014 (orange colour) and in 2023 (green colour).
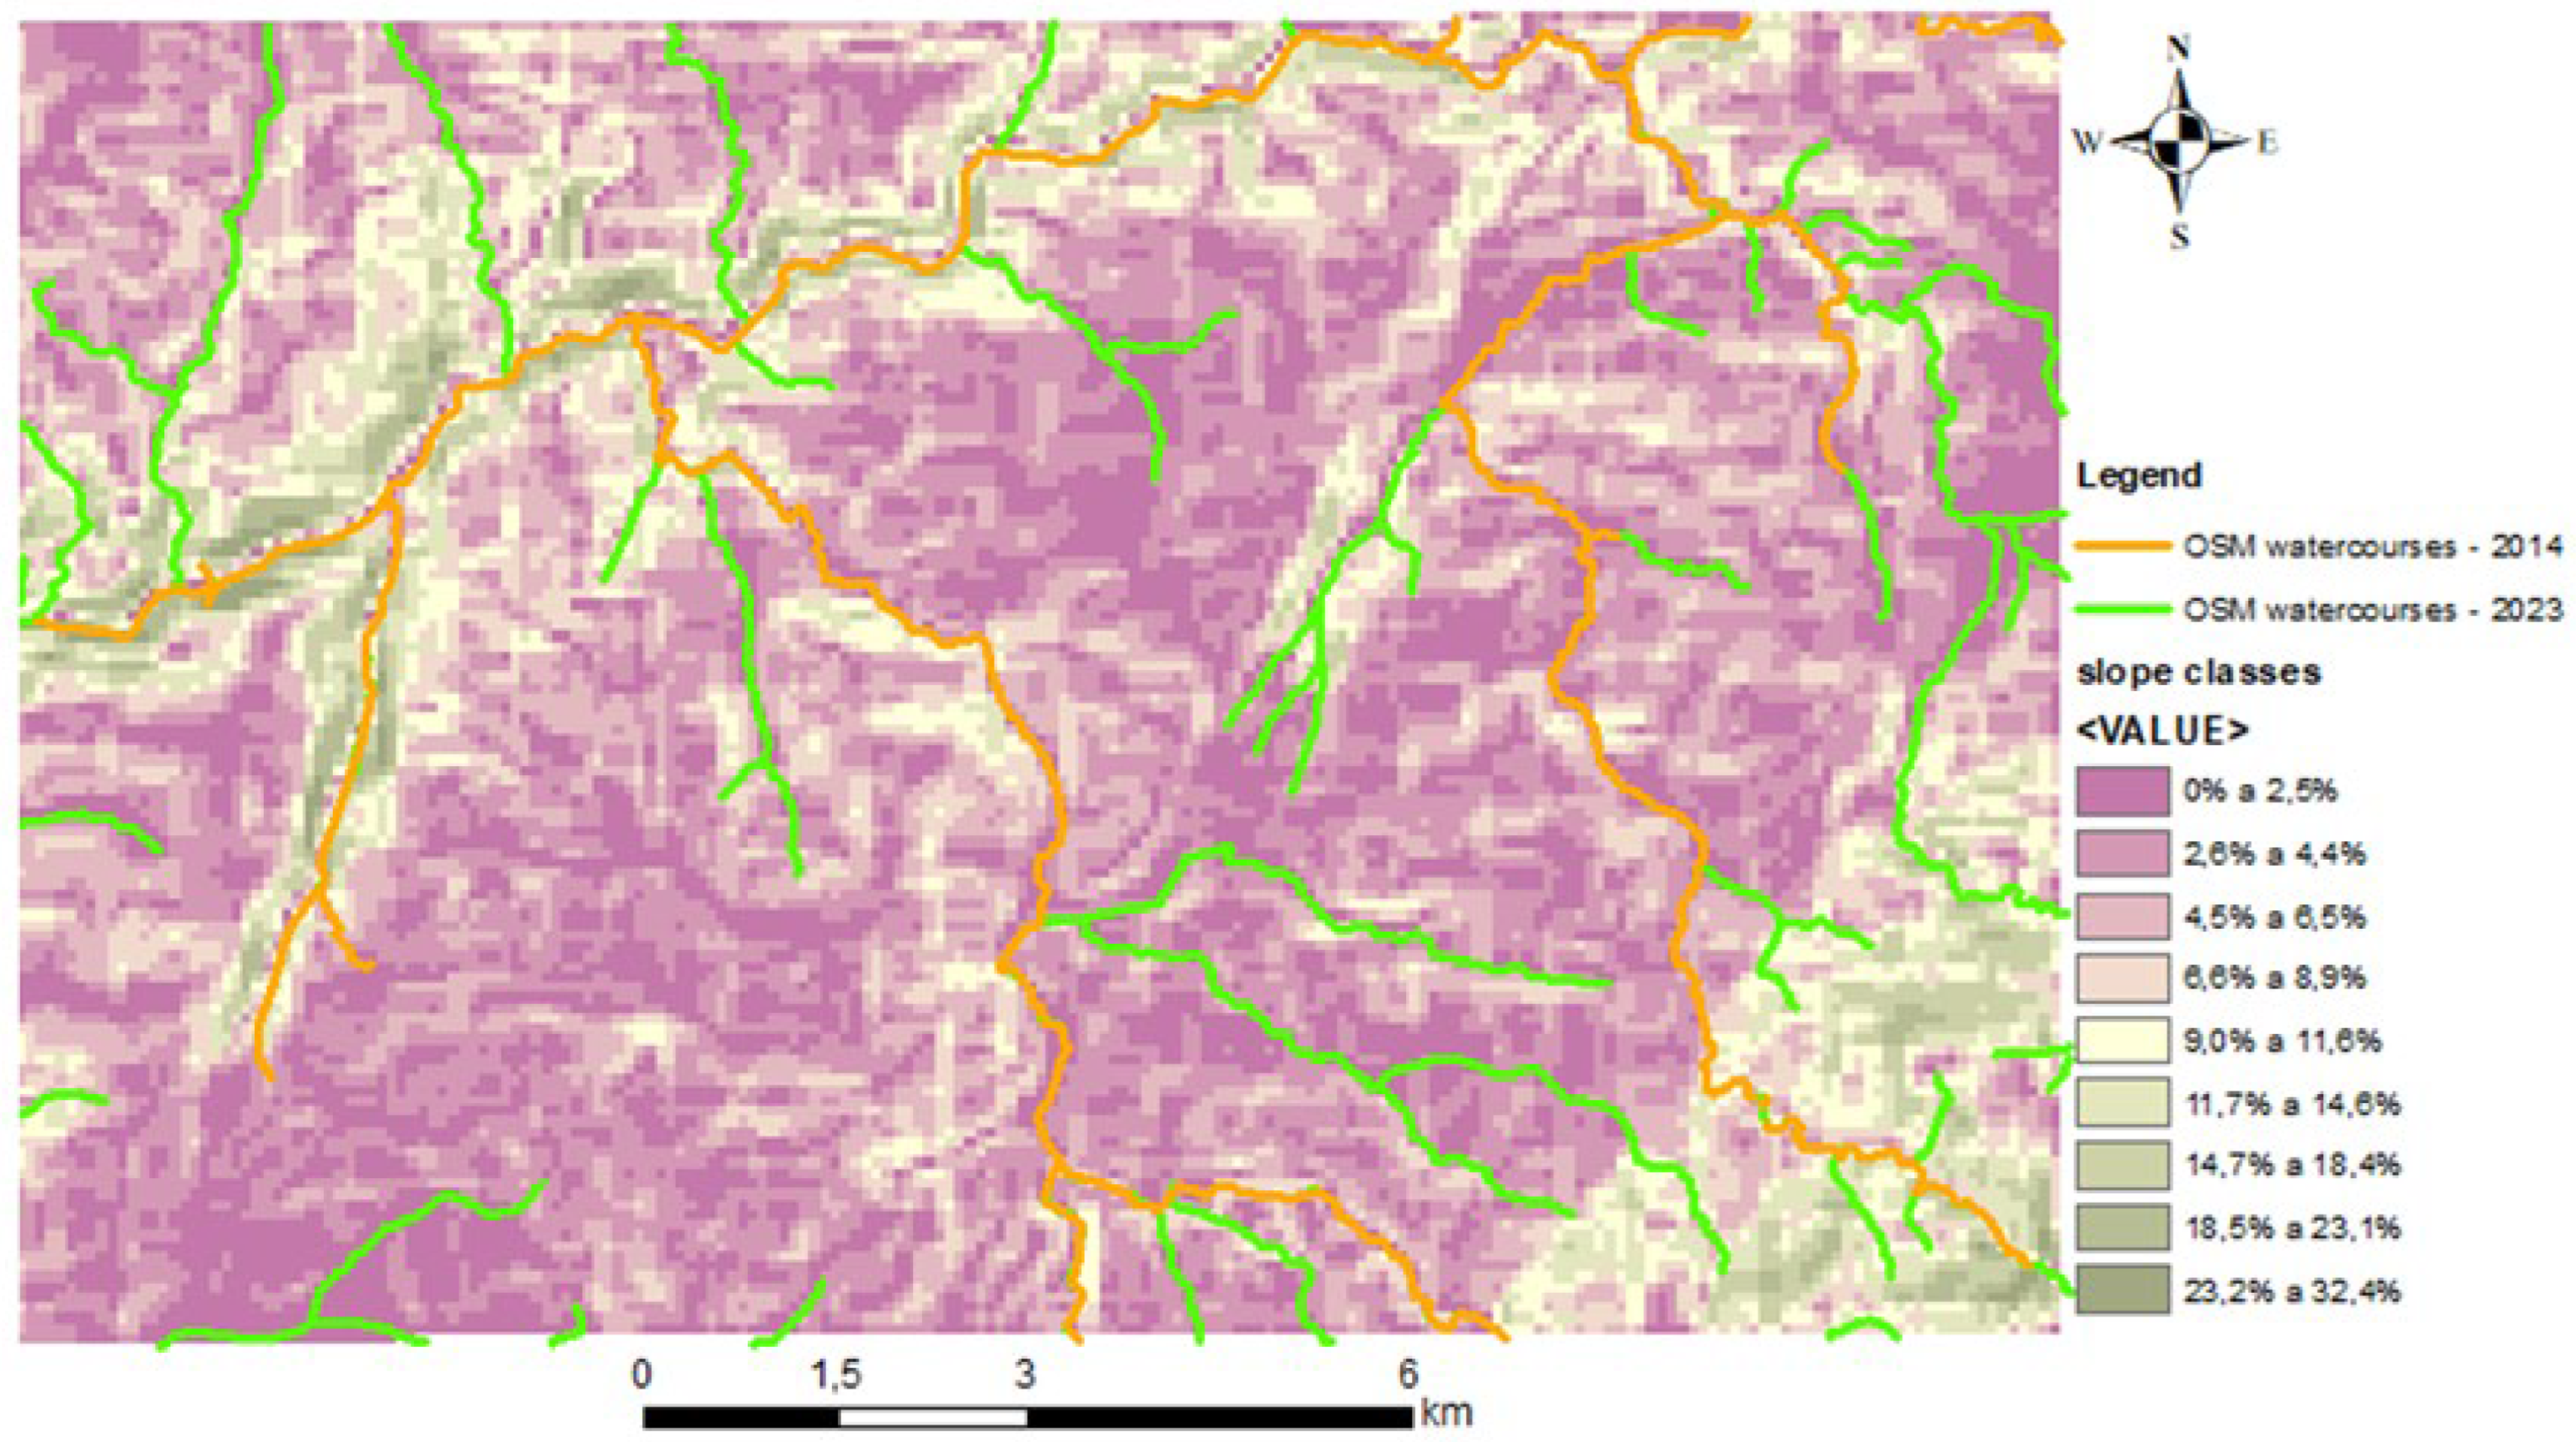
Figure 9.
Relation between the news’s OSM waterways and settlements.
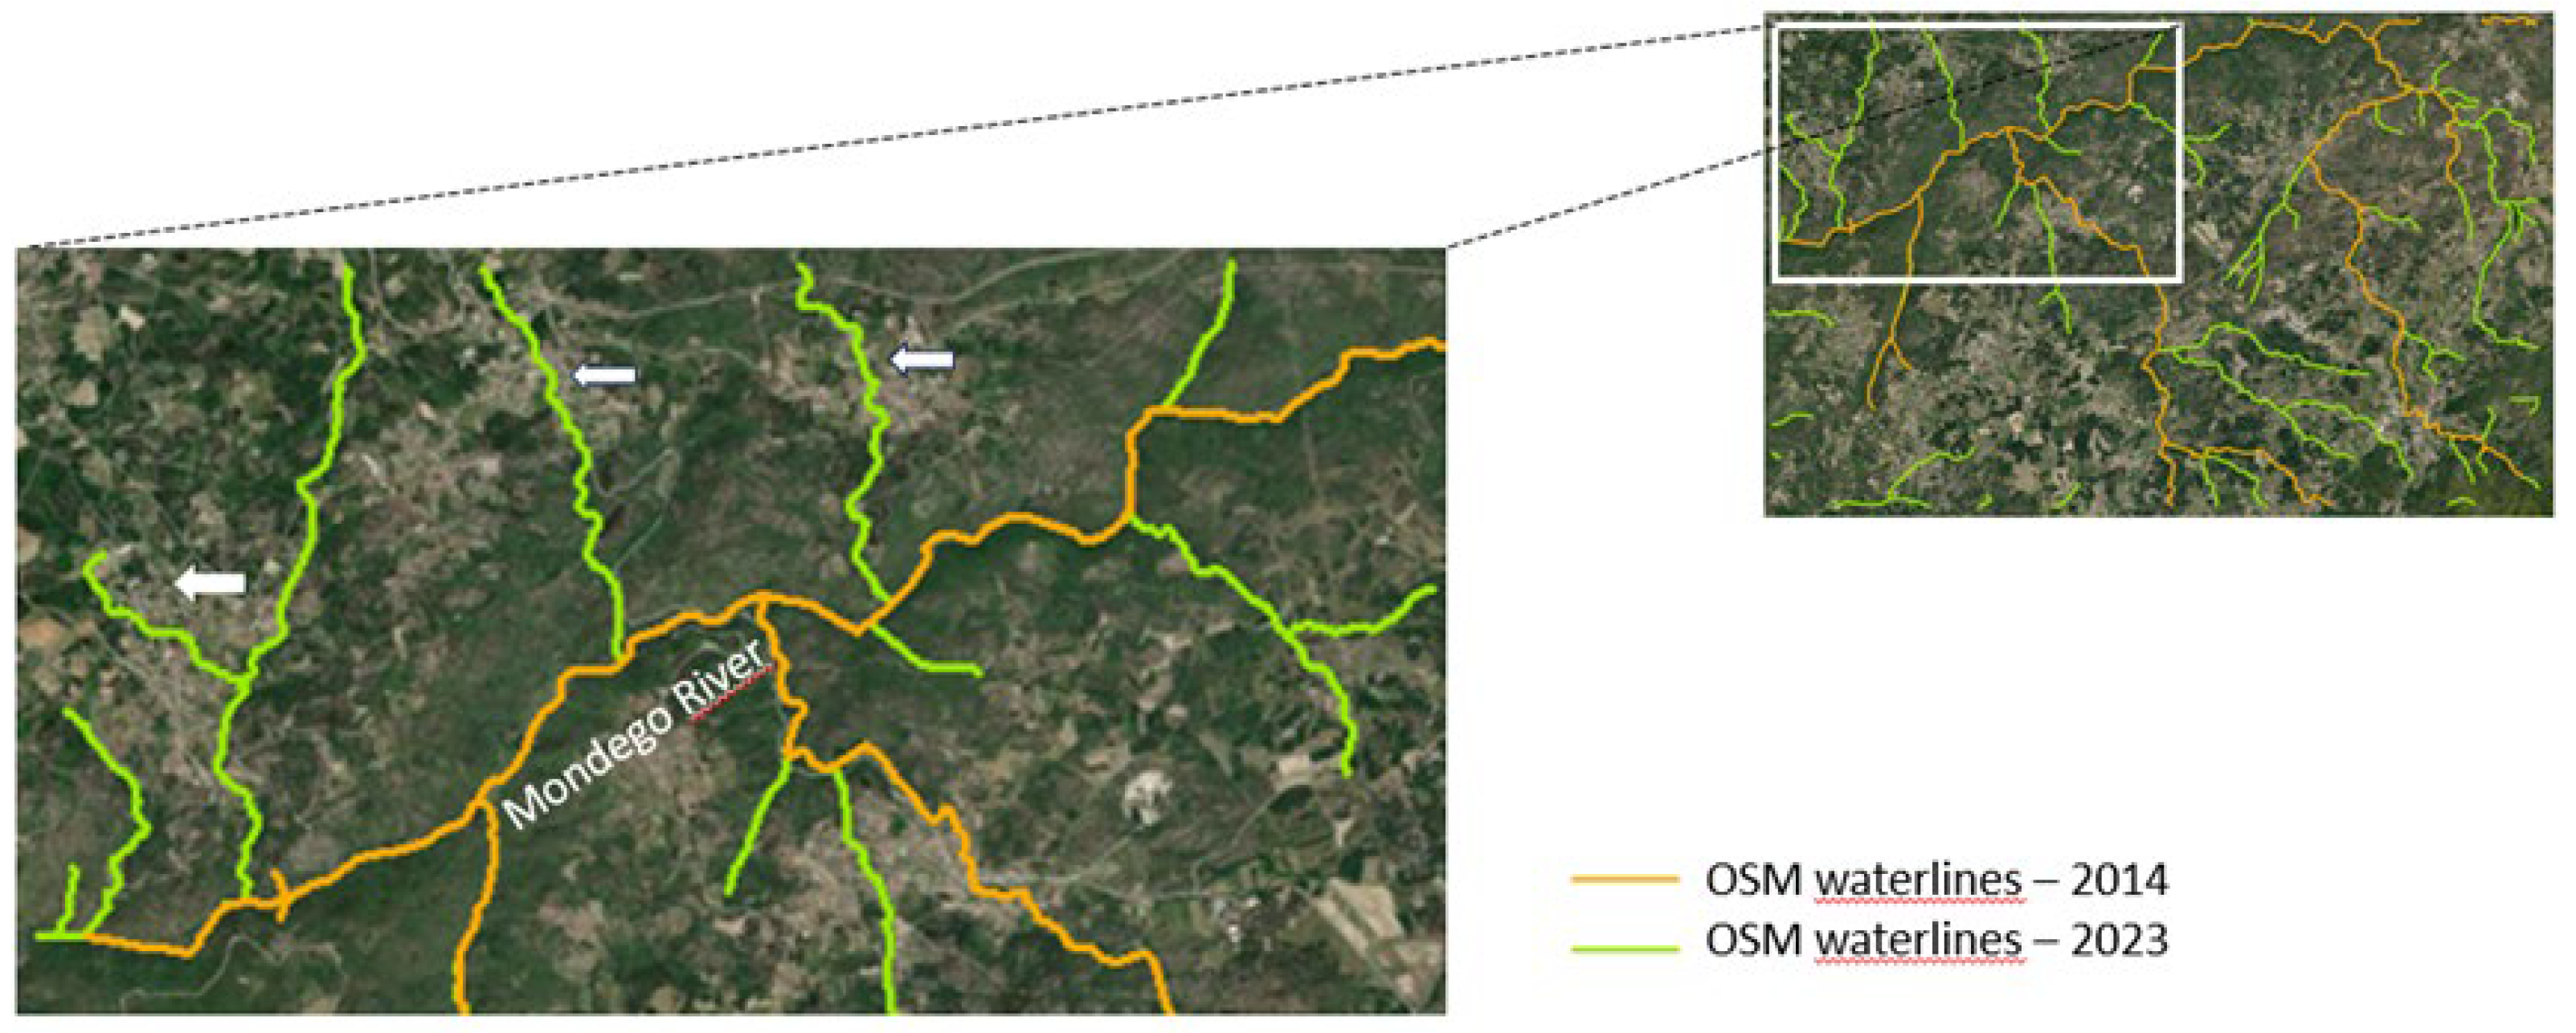
Figure 10.
Reference watercourses (left) and OSM watercourses in Z1 zone in 2014 and 2023 (right).
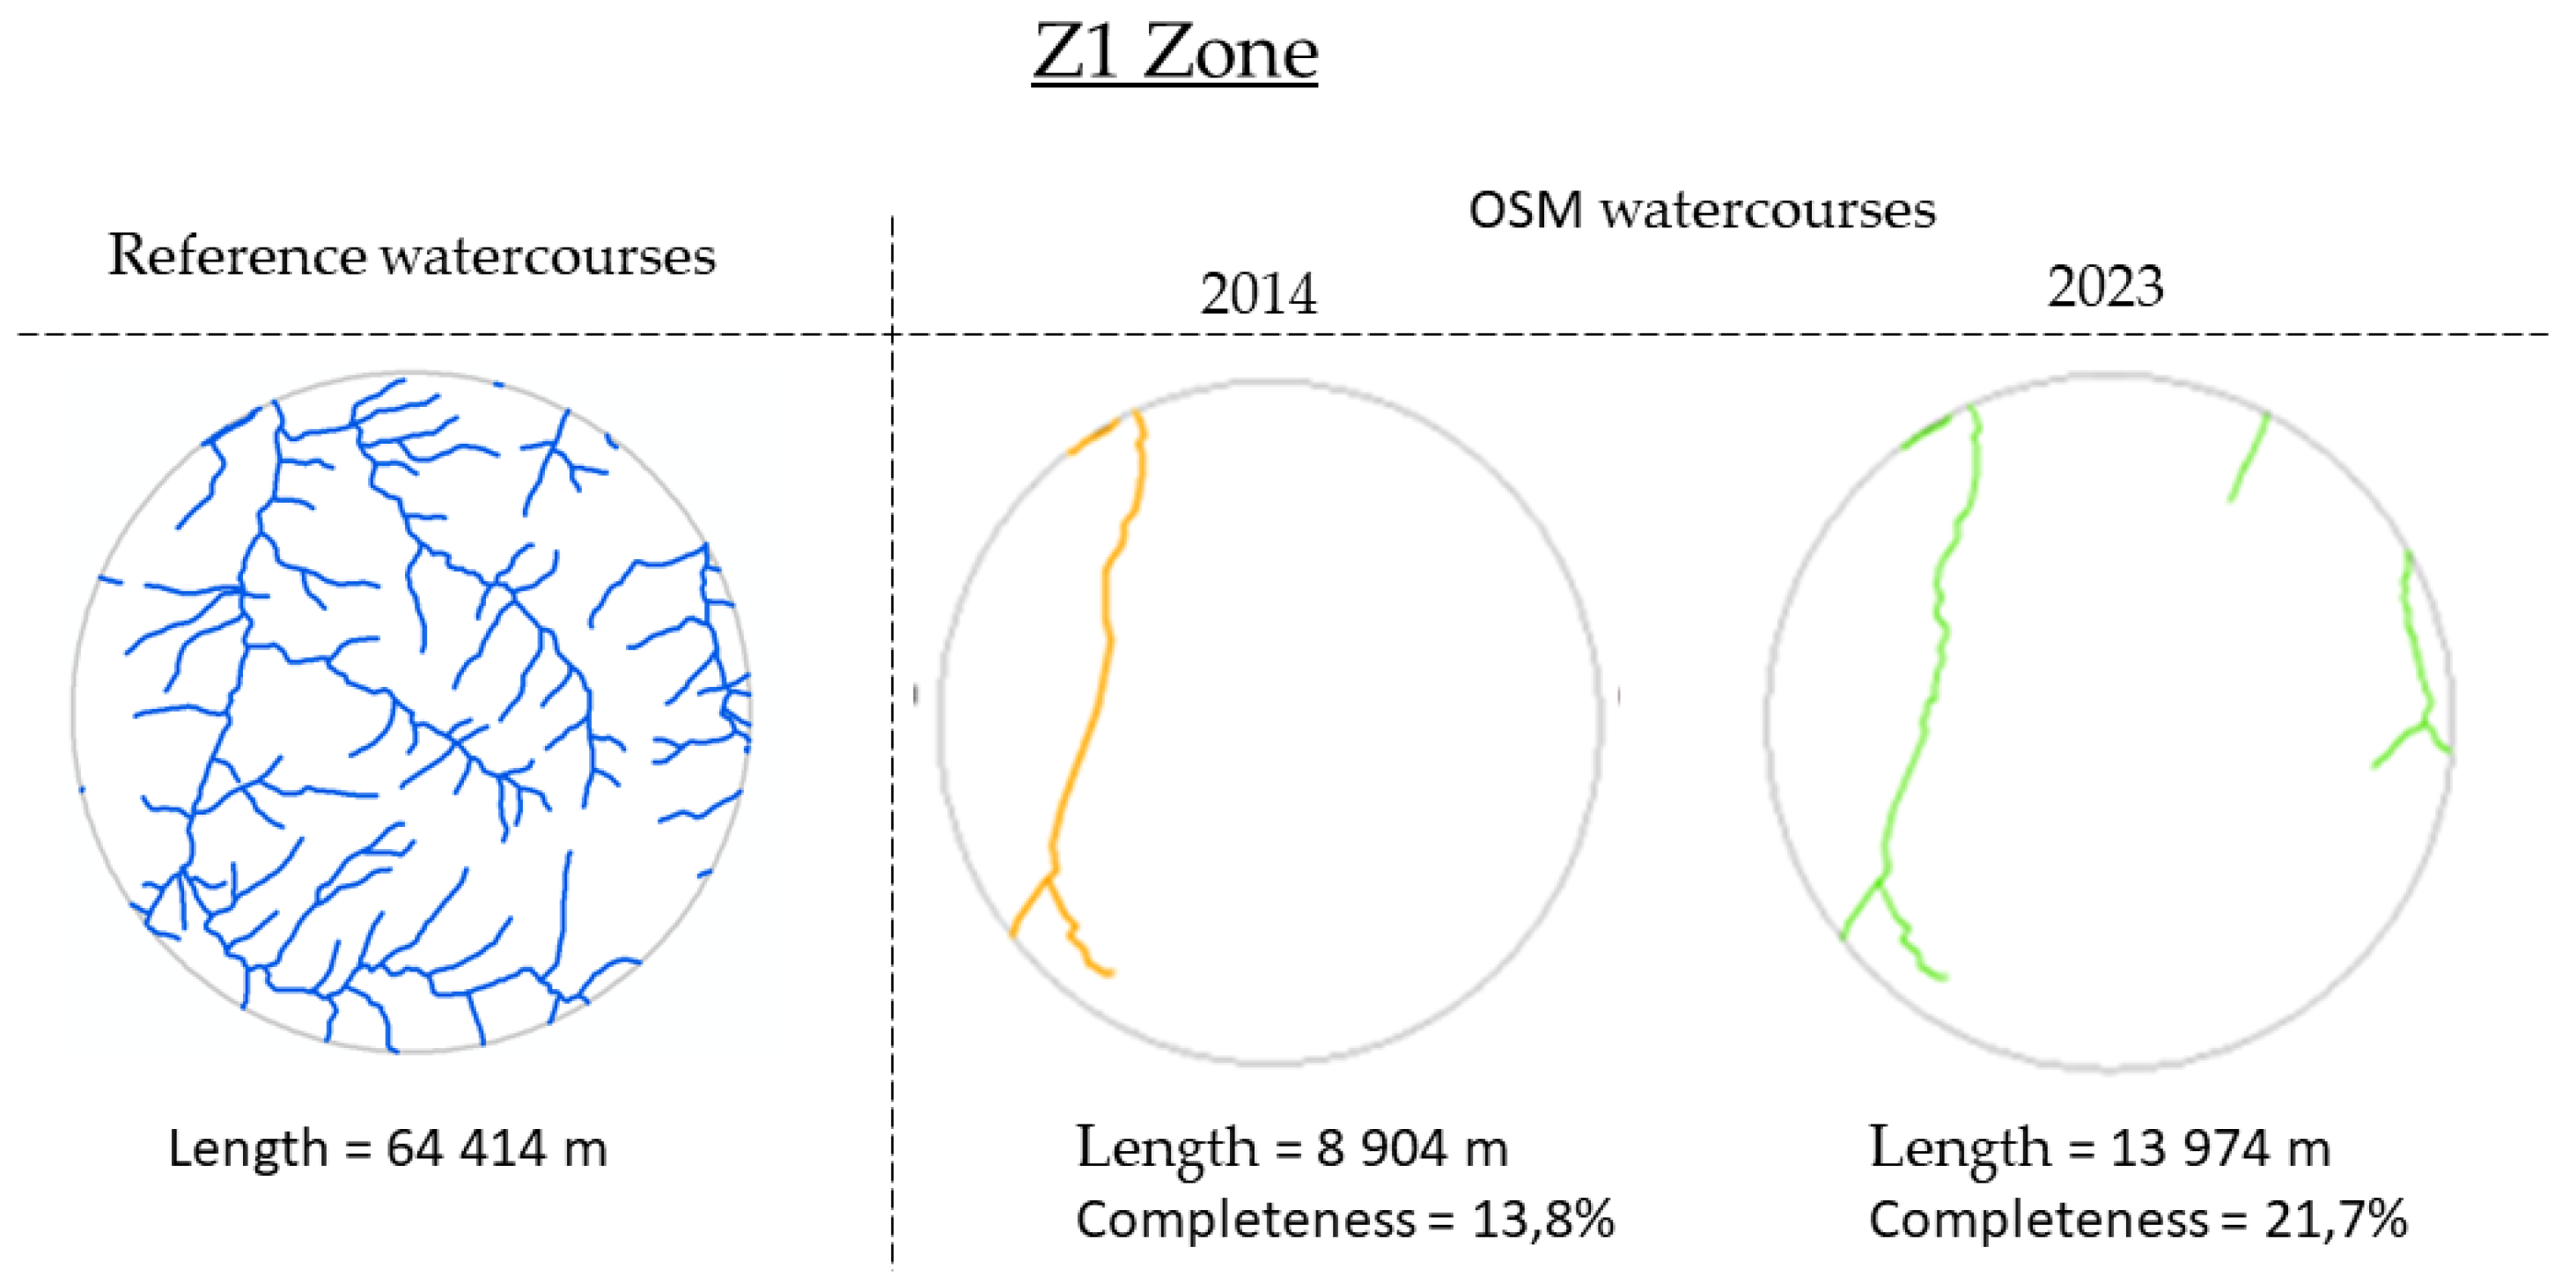
Figure 11.
Reference watercourses (left) and OSM watercourses in Z2 zone in 2014 and 2023 (right).
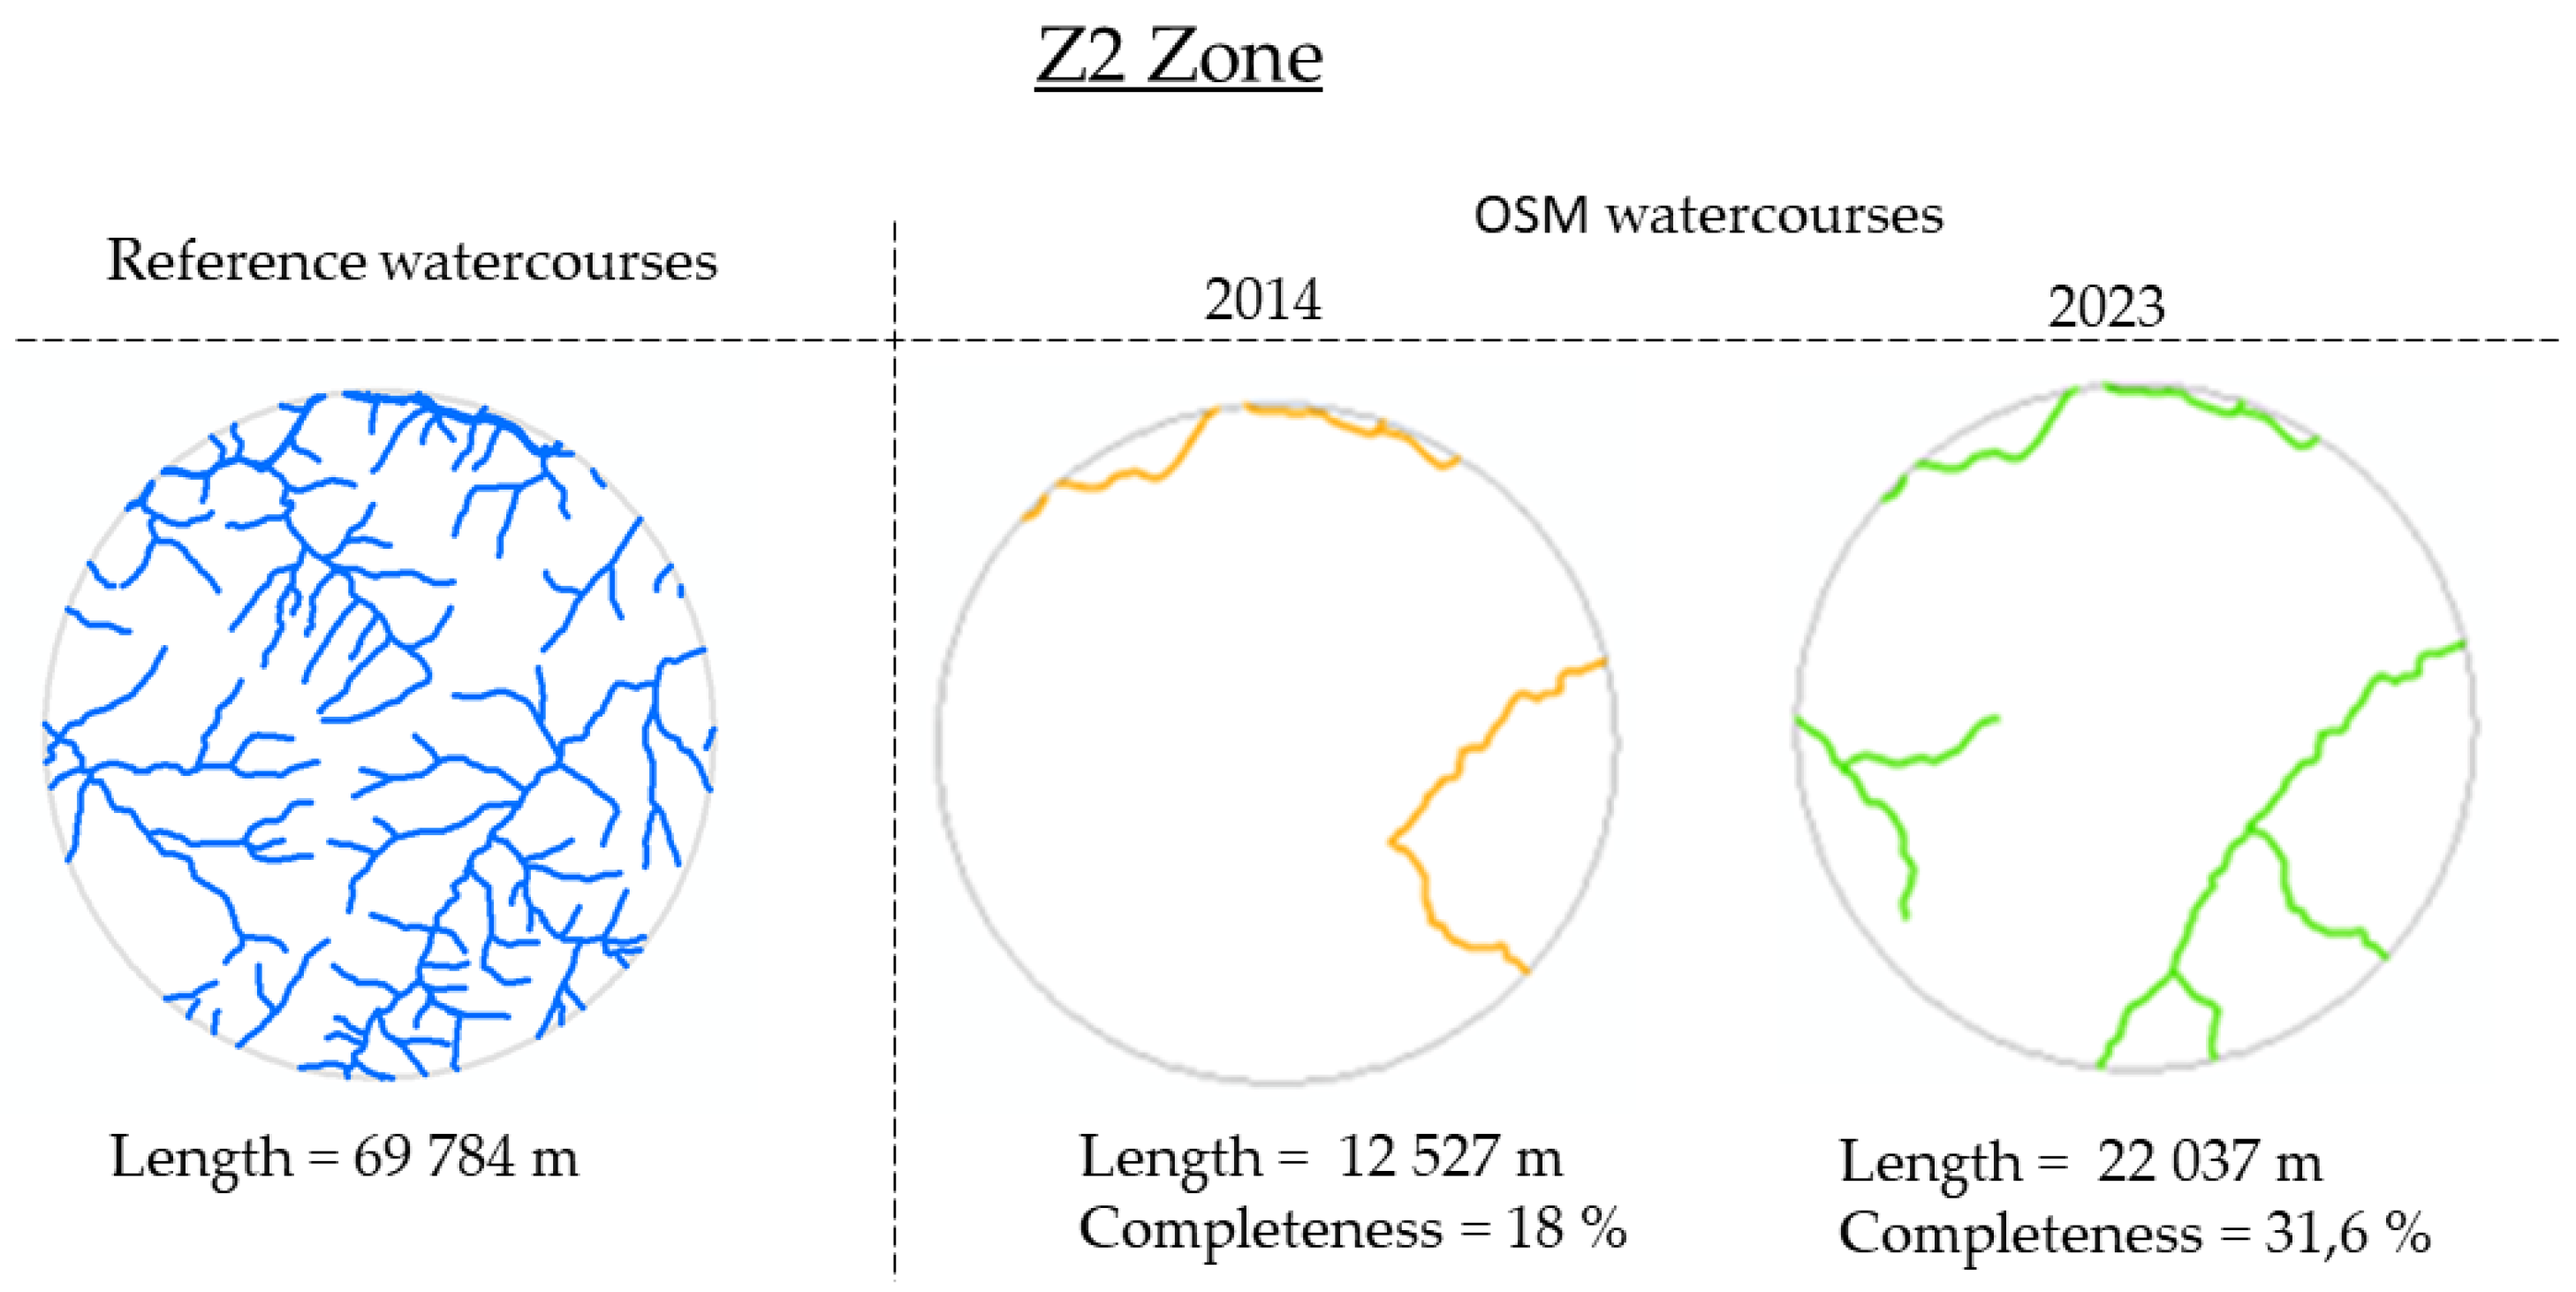
Figure 12.
Completeness of OSM waterways versus altitude in Z1 (left) and Z2 (right) zones.
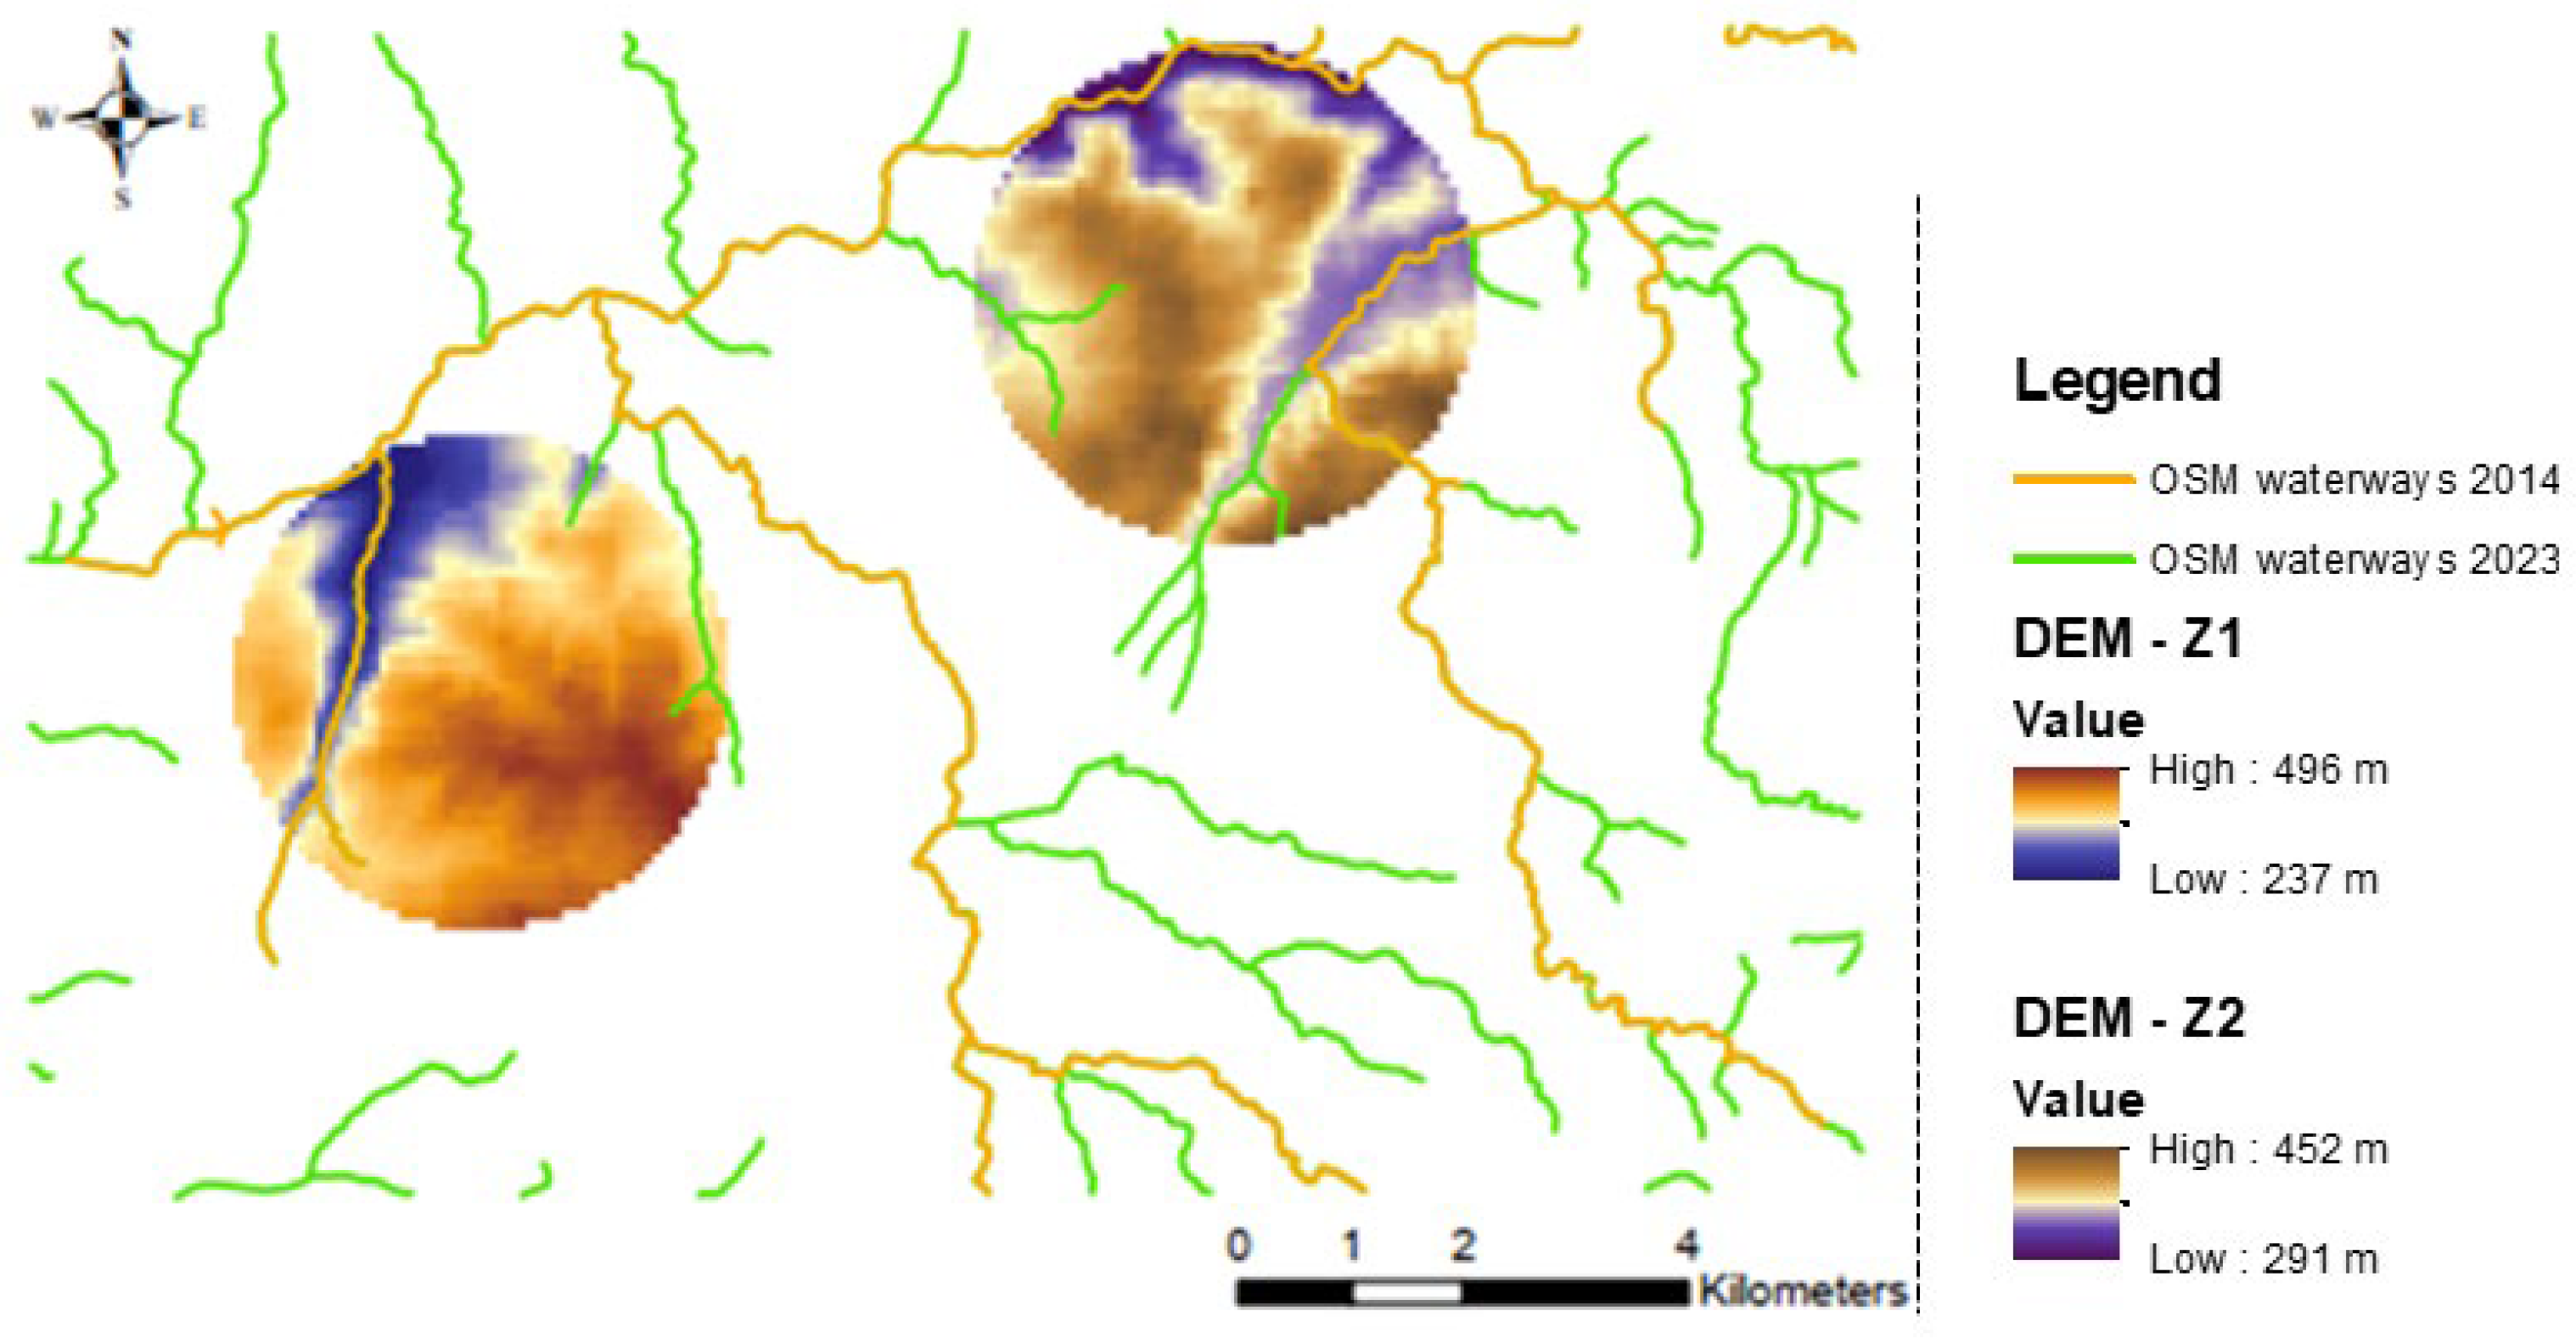
Figure 13.
Completeness of OSM waterways versus slope in Z1 and Z2 zones.
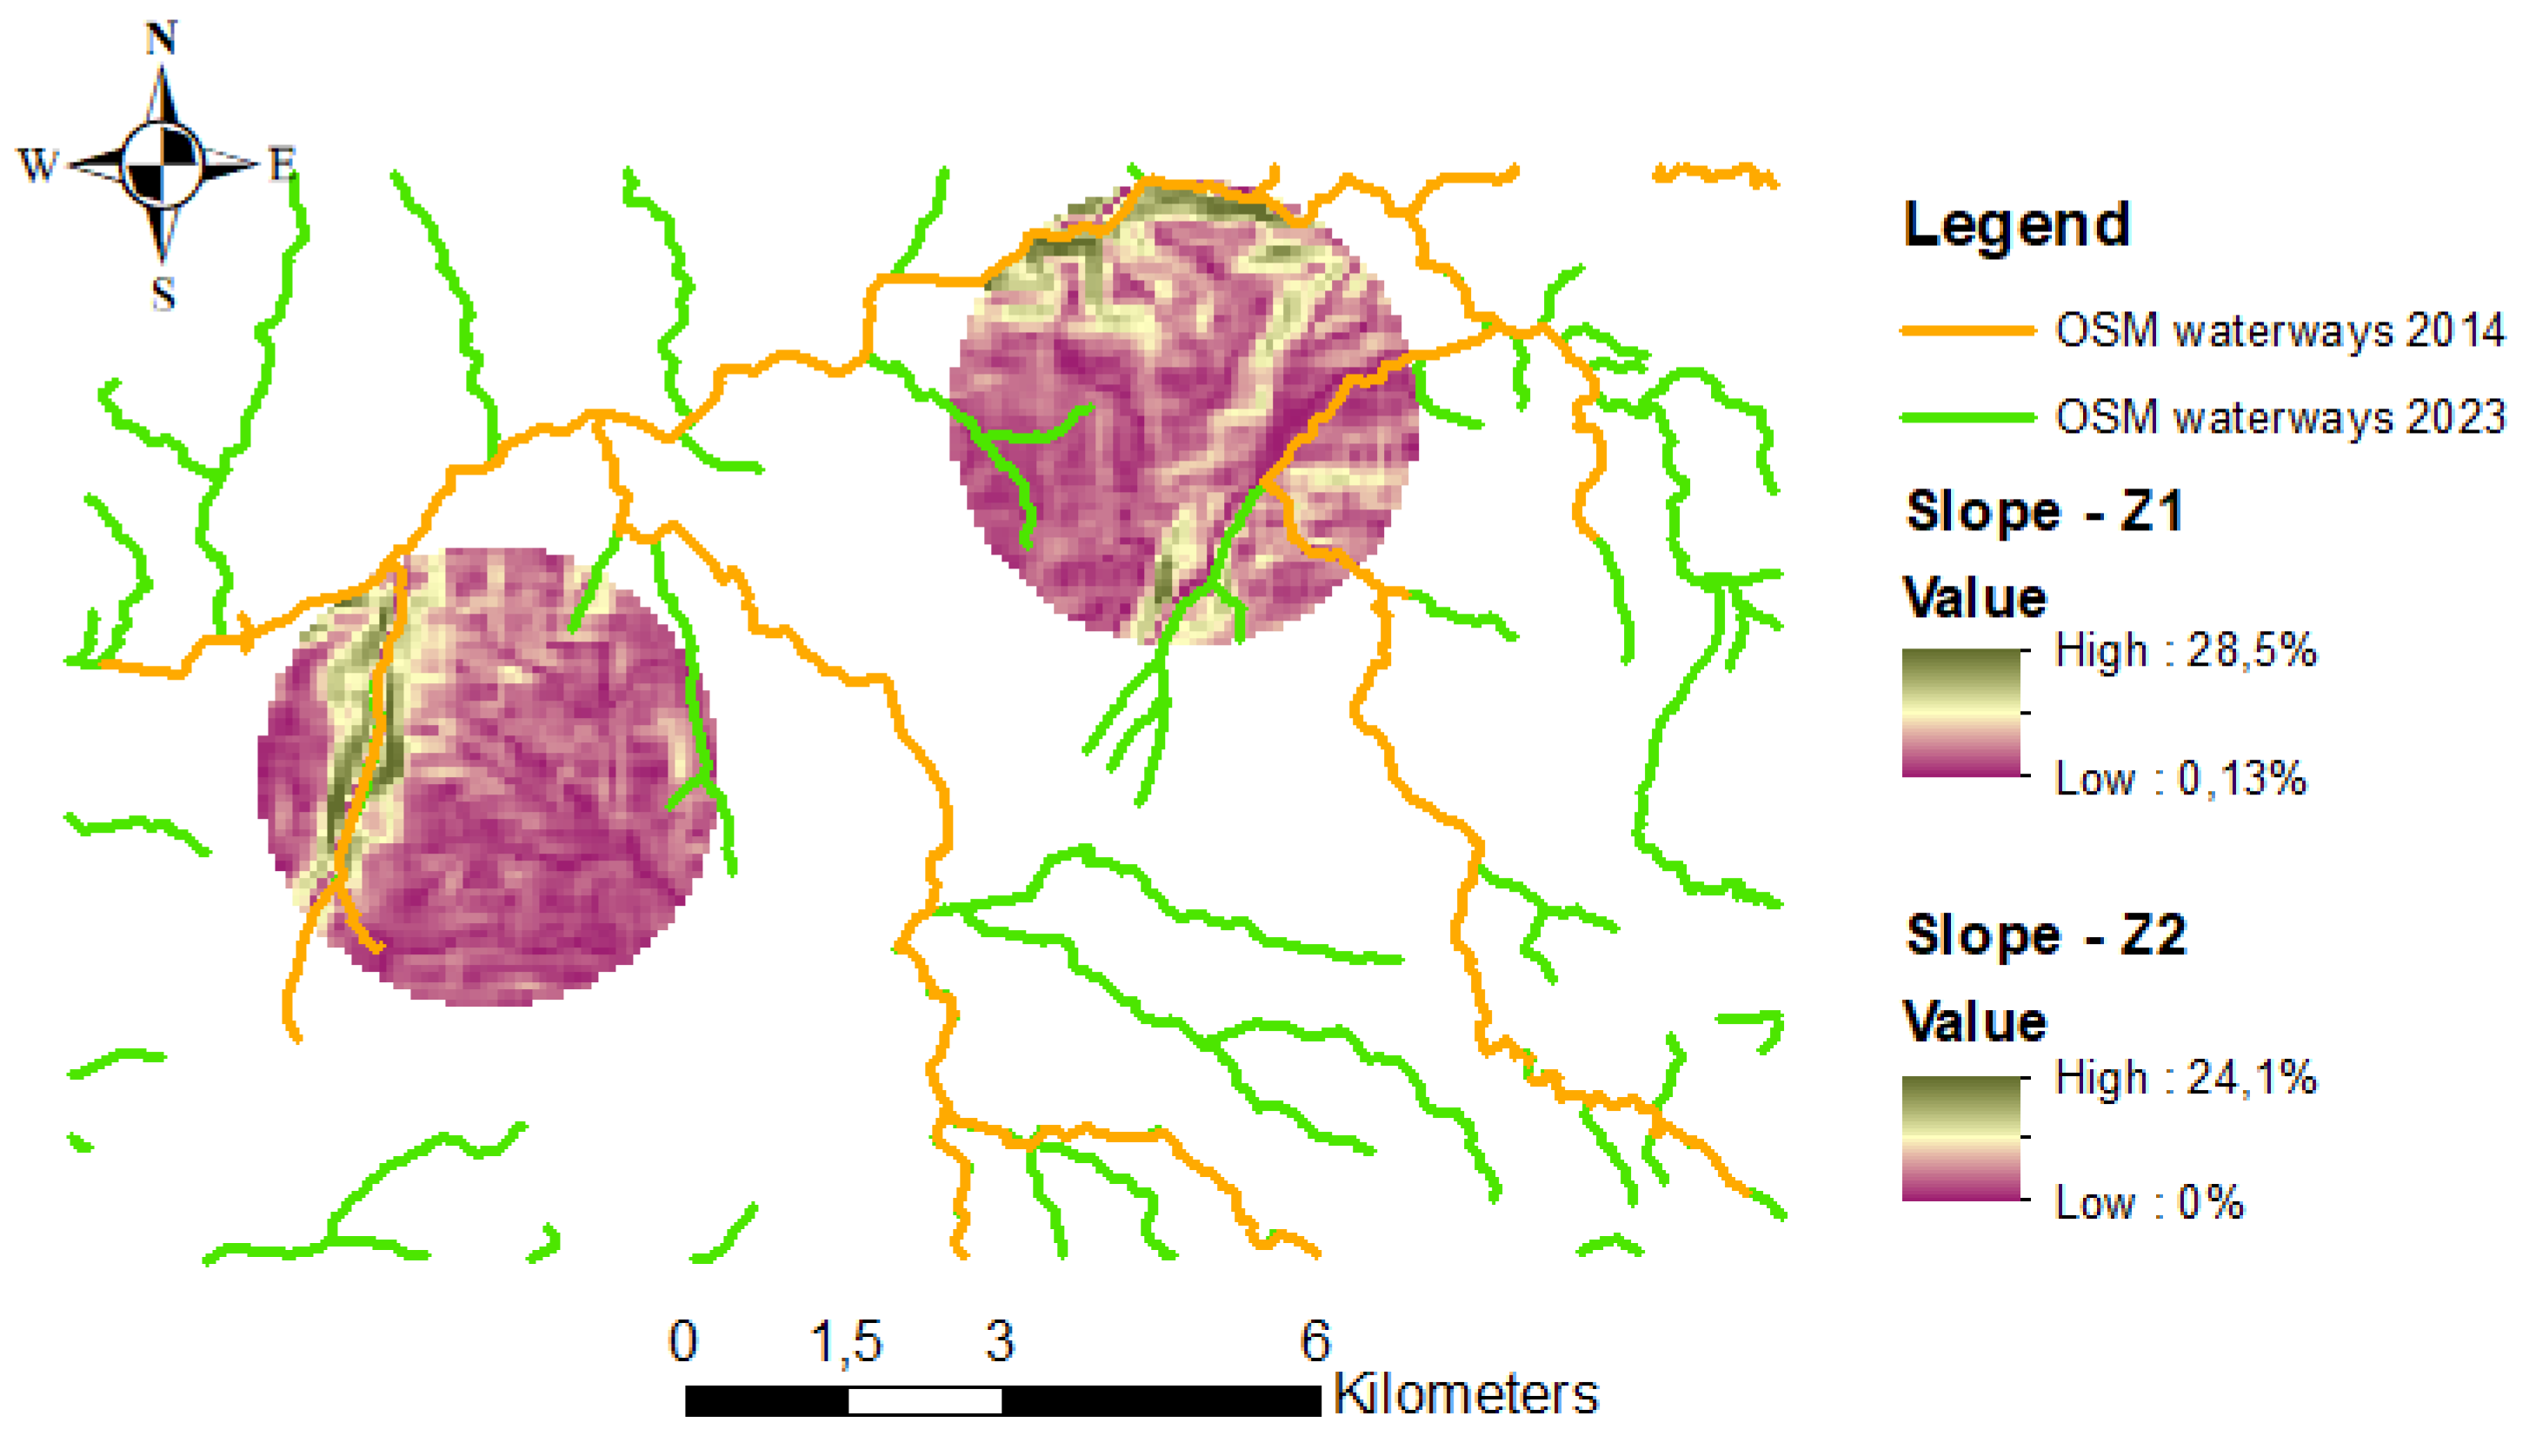
Figure 14.
New’s OSM waterways in Z1 zone.
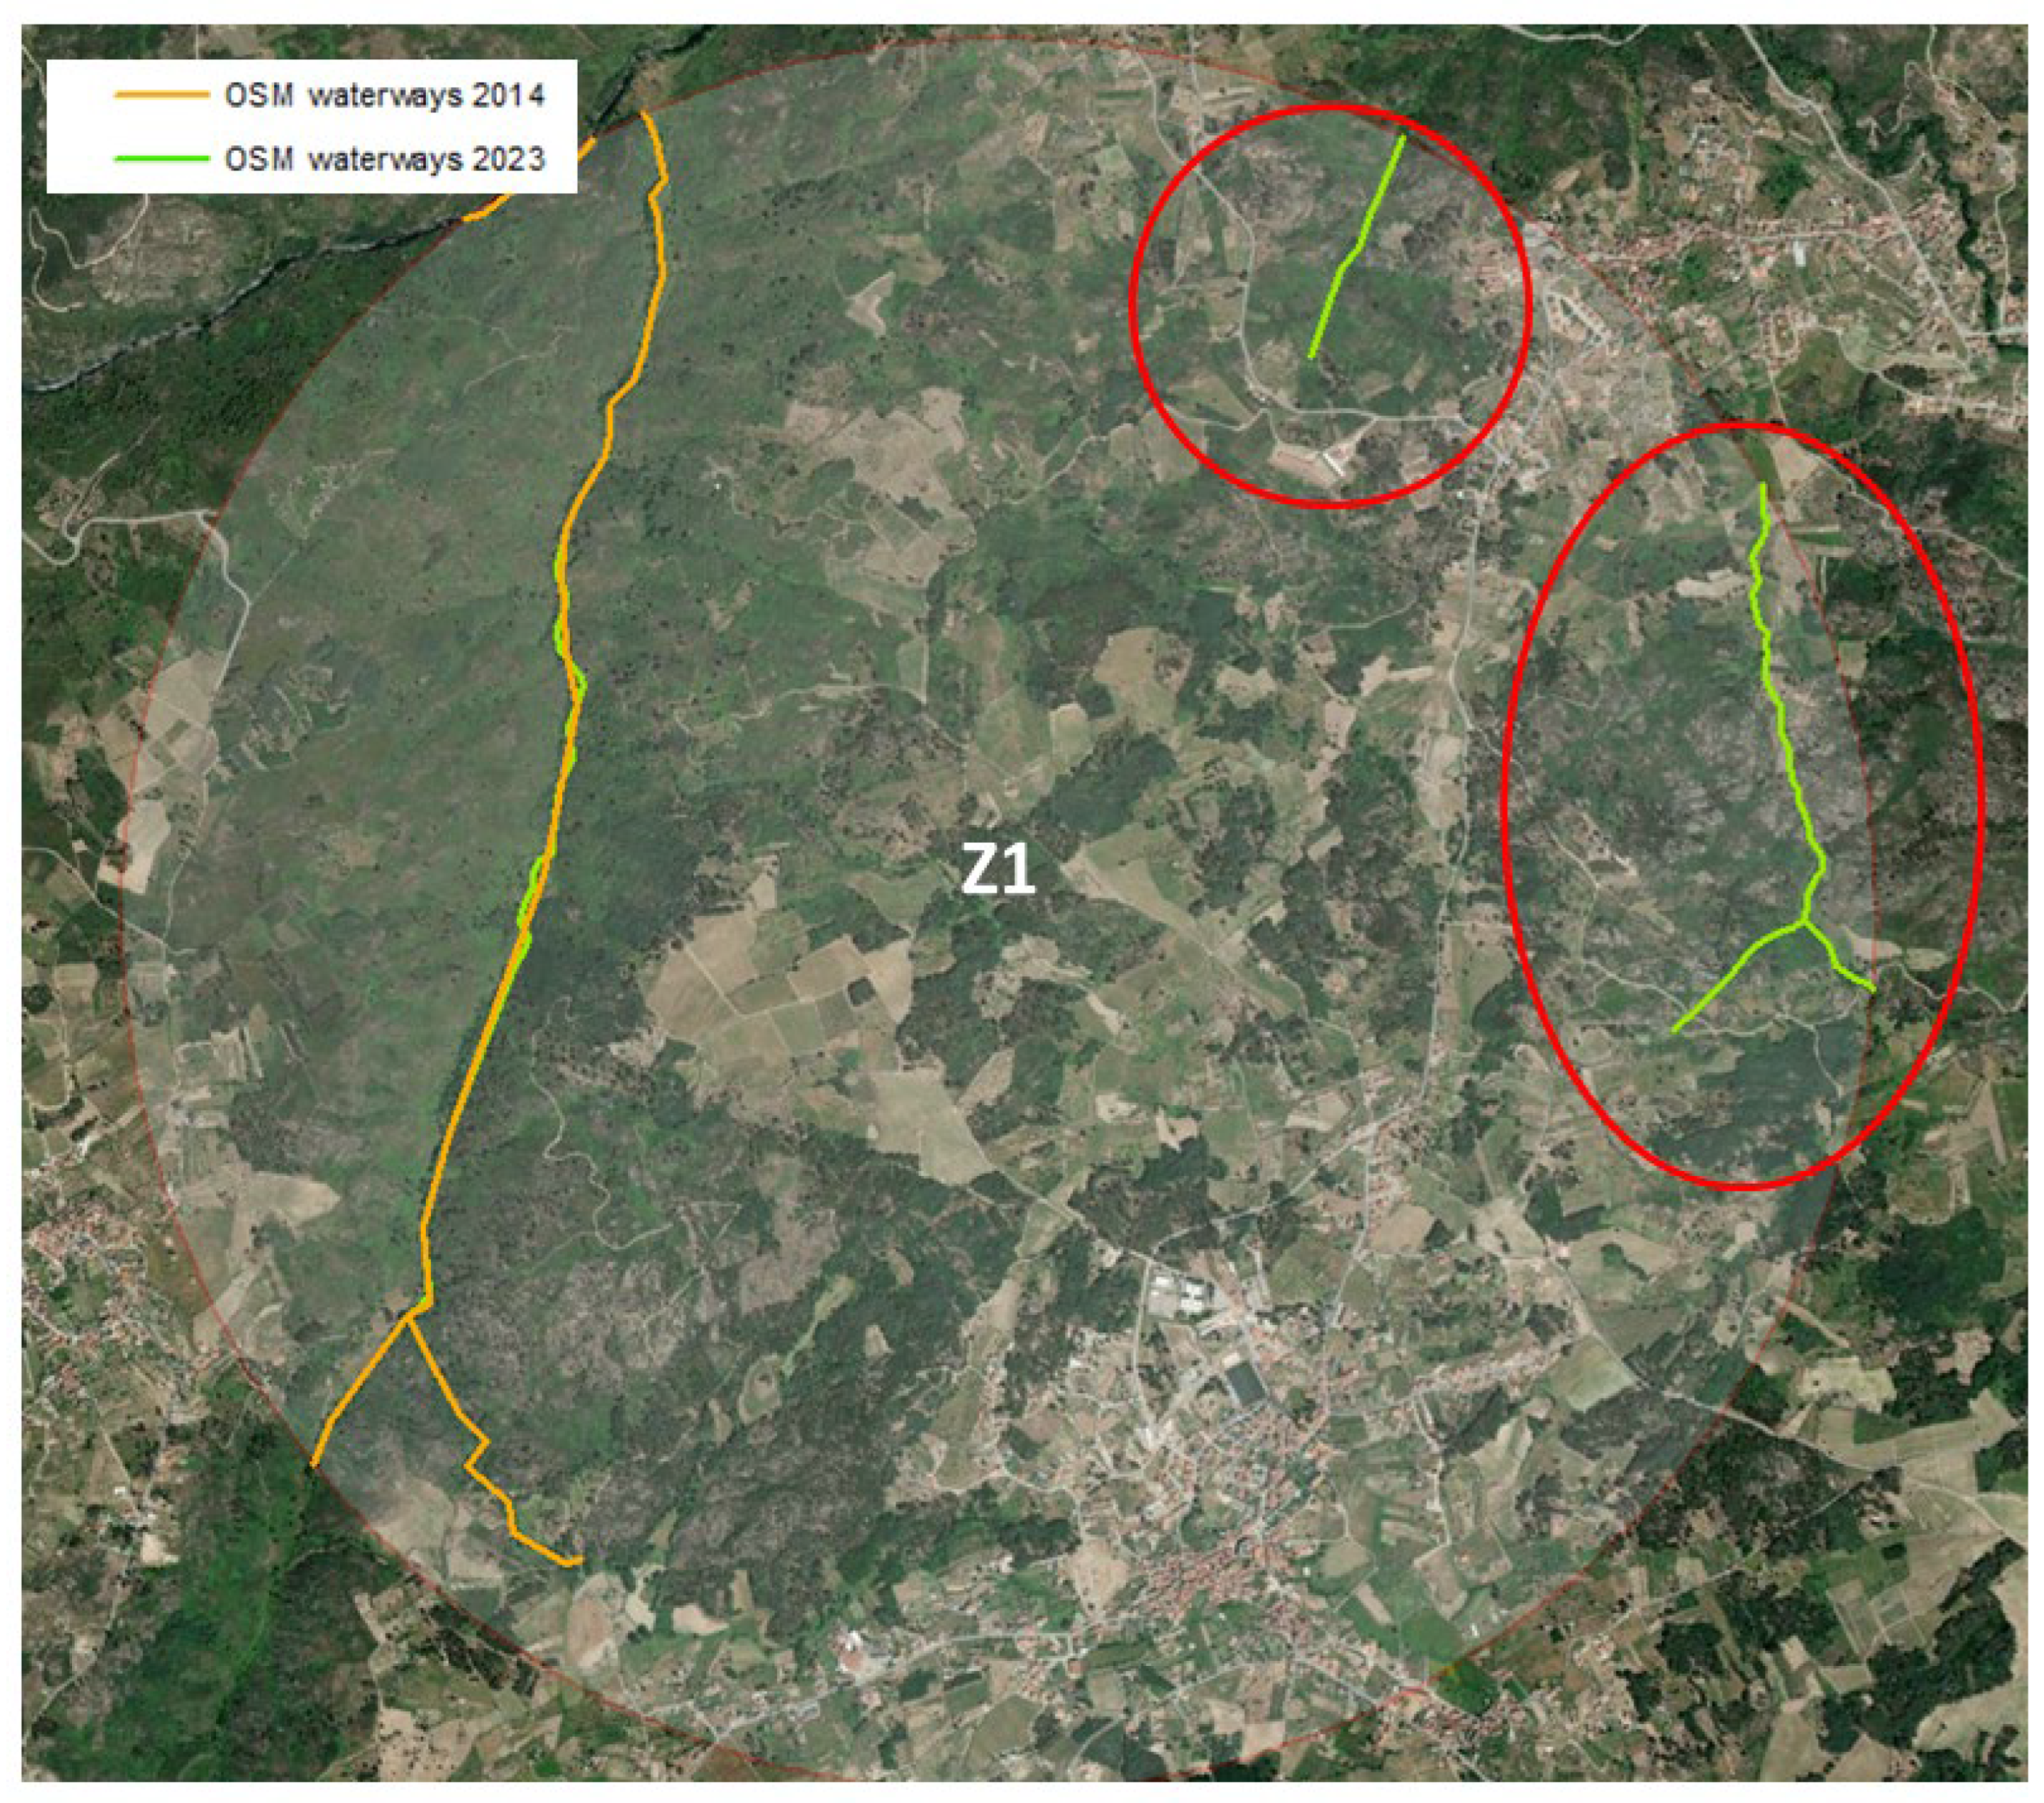
Figure 15.
New’s OSM waterways in Z2 zone.
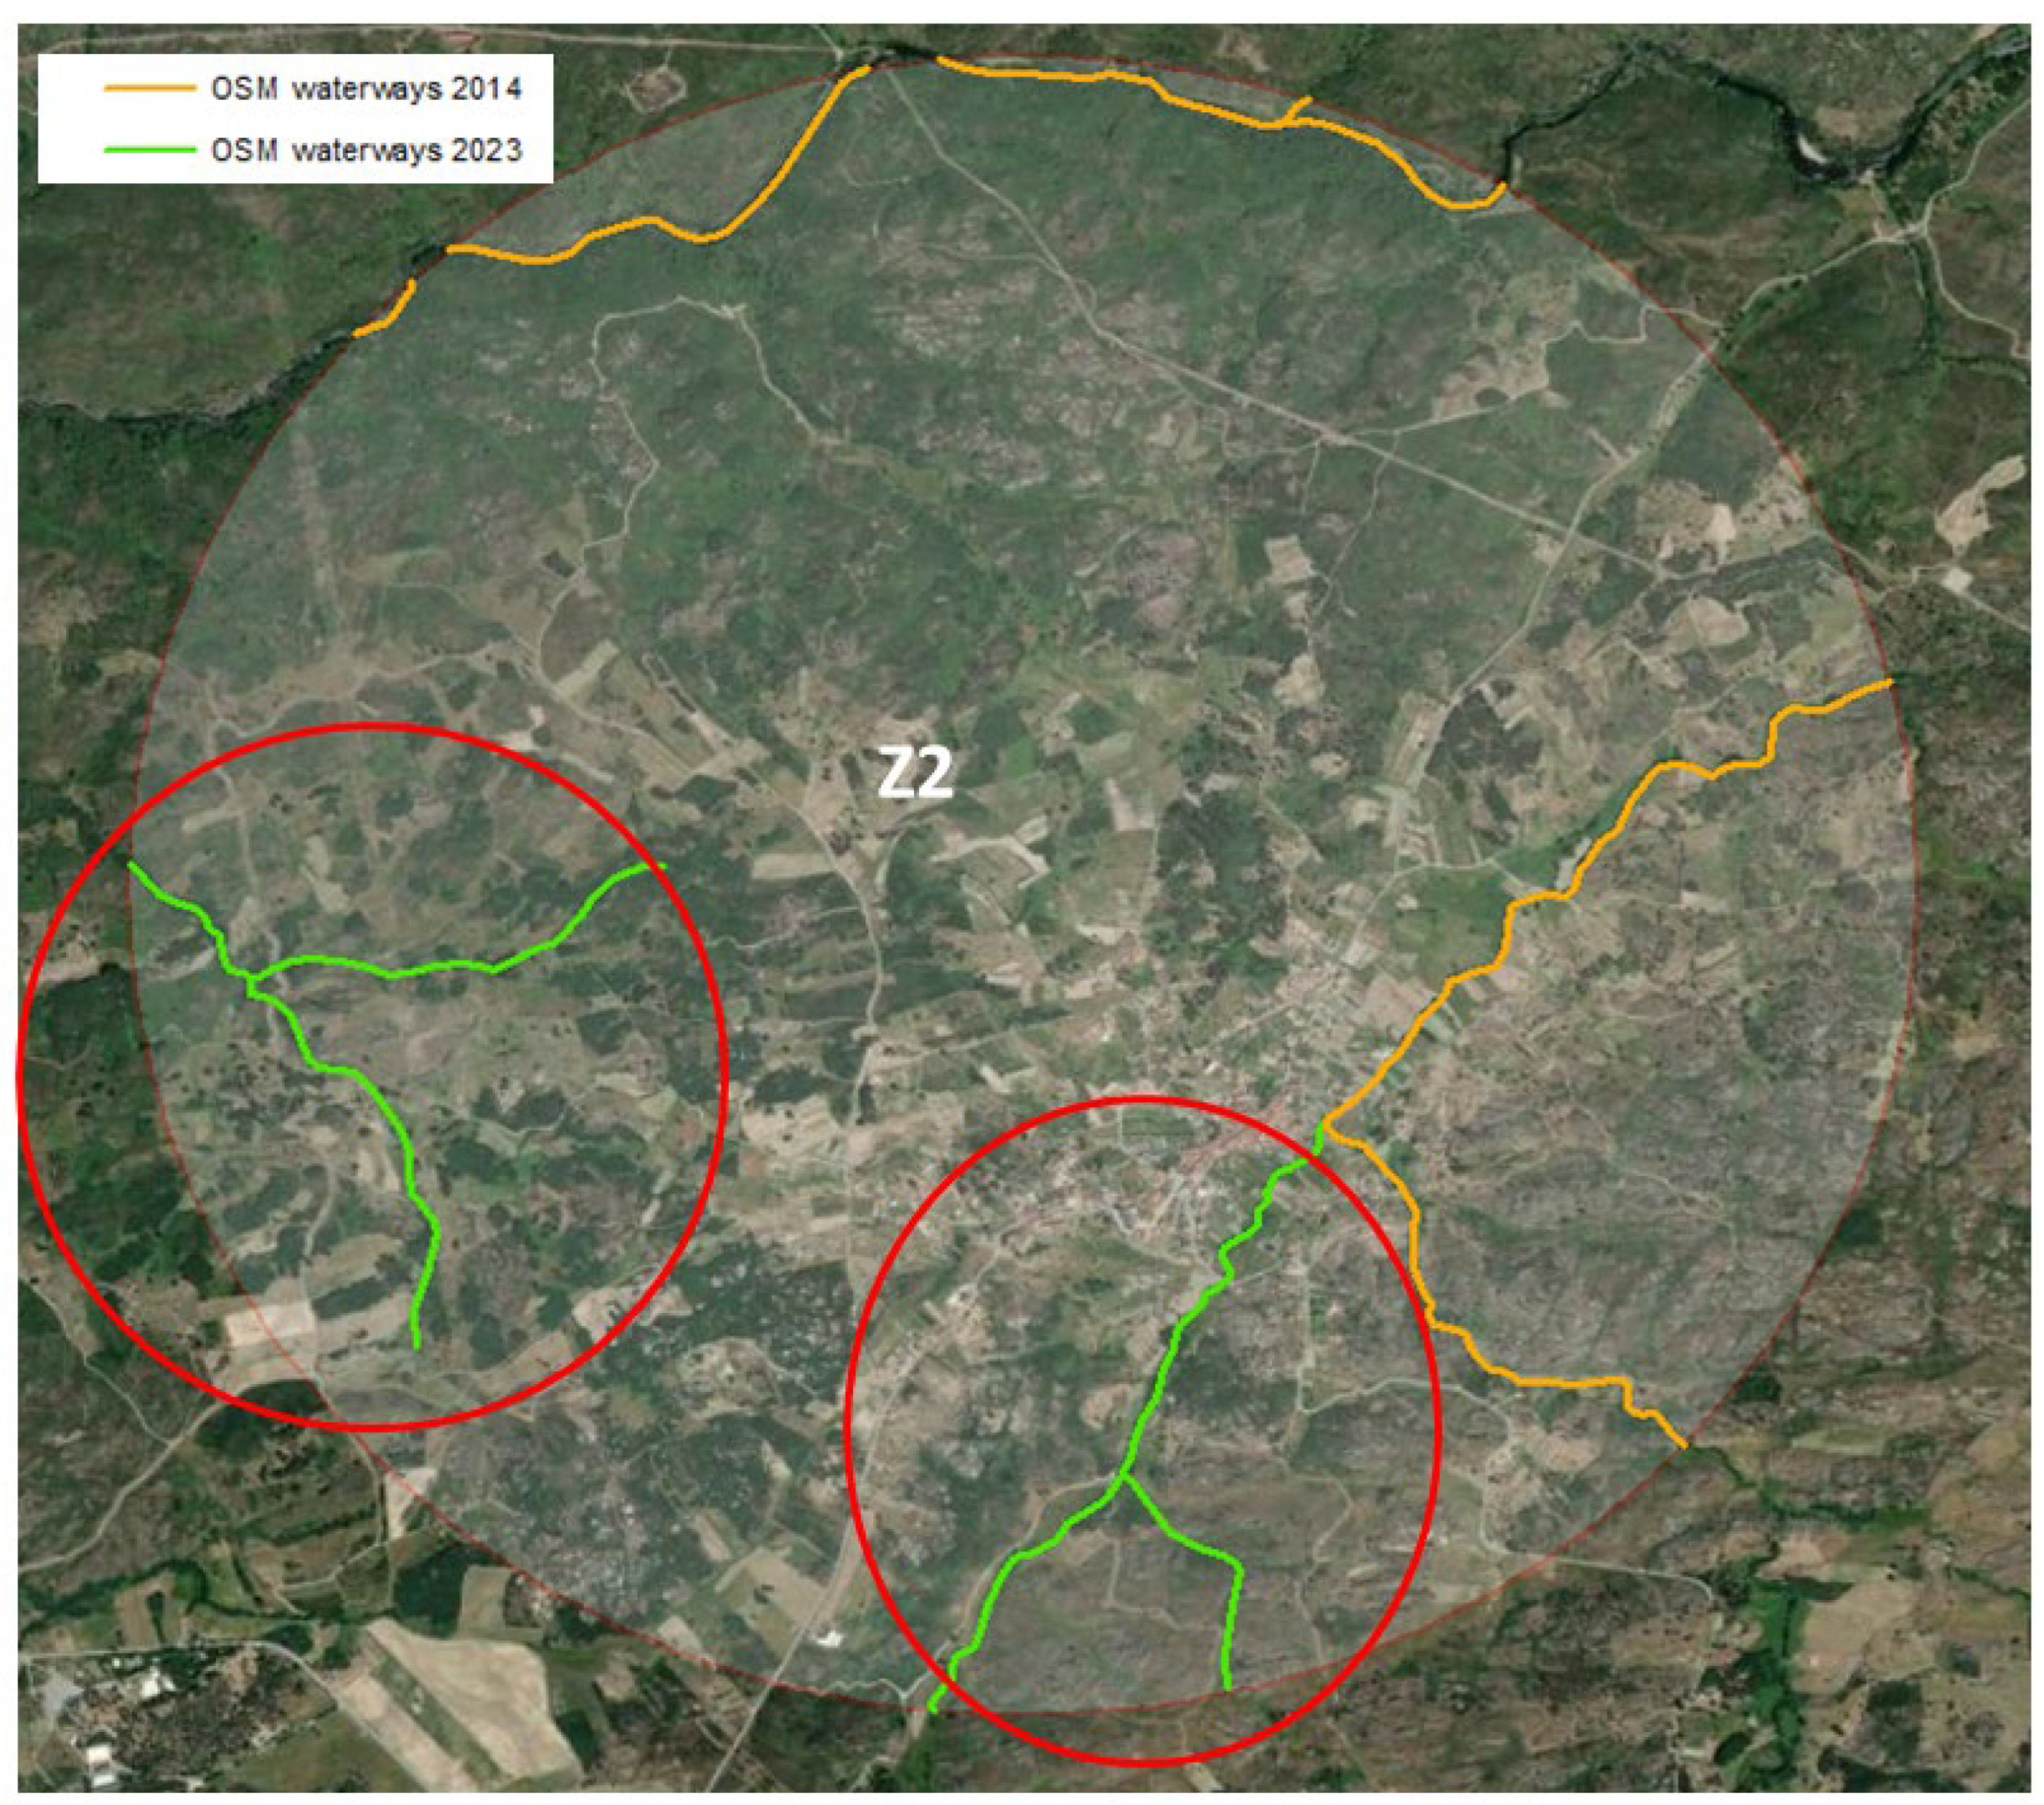

Table 1.
Total length of watercourses, completeness, number of rivers and streams for both time epochs (2014 and 2023).
Table 1.
Total length of watercourses, completeness, number of rivers and streams for both time epochs (2014 and 2023).
| Watercourses | Total Length (m) | Completeness (%) | N. of rivers | N. of streams |
|---|---|---|---|---|
| Reference | 555 635 | |||
| OSM - 2014 | 60 183 | 10,8 | 7 | 8 |
| OSM - 2023 | 145 303 | 26,2 | 9 | 72 |
Table 2.
Total length, completeness, number of rivers and number of streams of OSM watercourses in Z1 zone.
Table 2.
Total length, completeness, number of rivers and number of streams of OSM watercourses in Z1 zone.
| Watercourses | Total Length (m) | Completeness (%) | N. of rivers | N. of streams |
|---|---|---|---|---|
| Reference | 64 414 | |||
| OSM - 2014 | 8 904 | 13,8 | 1 | 2 |
| OSM - 2023 | 13 974 | 21,7 | 1 | 5 |
Table 3.
Total length, completeness, number of rivers and number of streams of OSM watercourses in Z2 zone.
Table 3.
Total length, completeness, number of rivers and number of streams of OSM watercourses in Z2 zone.
| Watercourses | Total Length (m) | Completeness (%) | N. of rivers | N. of streams |
|---|---|---|---|---|
| Reference | 69 784 | |||
| OSM - 2014 | 12 527 | 18,0 | 1 | 2 |
| OSM - 2023 | 22 037 | 31,6 | 3 | 6 |
Disclaimer/Publisher’s Note: The statements, opinions and data contained in all publications are solely those of the individual author(s) and contributor(s) and not of MDPI and/or the editor(s). MDPI and/or the editor(s) disclaim responsibility for any injury to people or property resulting from any ideas, methods, instructions or products referred to in the content. |
© 2024 by the authors. Licensee MDPI, Basel, Switzerland. This article is an open access article distributed under the terms and conditions of the Creative Commons Attribution (CC BY) license (http://creativecommons.org/licenses/by/4.0/).
Copyright: This open access article is published under a Creative Commons CC BY 4.0 license, which permit the free download, distribution, and reuse, provided that the author and preprint are cited in any reuse.


