
Submitted:
30 January 2024
Posted:
31 January 2024
You are already at the latest version
Abstract
The ongoing expansion in volume, velocity and variety of geospatial data has stimulated the development of artificial intelligence applications and associated online cartographic visualizations. In this context, the cartographic communication through peer-reviewed media evolved to incorporate Findability, Accessibility, Interoperability and Re-usability (FAIR) principles. In this paper, we review the functionalities proposed by current international peer-reviewed media for accessing, exploring and re-using geospatial data, and situate them on a diagram conceived for peer-reviewed cartography in the artificial intelligence era. We then present an overview of the cartographic infrastructure and workflow currently available in the Terra Digitalis journal for the online publication of massive spatiotemporal data. This free and opensource based solution allows a smooth integration, from data submission to final peer reviewed publication, of dynamic, interactive 2D and 3D maps. As a proof of concept, we present two maps derived from massive spatiotemporal data, related, respectively, to a climate numerical model (raster data) and a bike sharing system’s origin-destination dataset (vector data). We argue that the combination of technologies used in the journal provides an efficient and low-cost solution, unmatched by other publication media, to boost the accessibility and FAIR principles for geospatial big data.
Keywords:
geospatial big data
; FAIR
; OJS
; digital earth
; OGC web services
; data sharing and re-using
1. Introduction
In a couple of decades, maps jumped from paper to the memory of a computer, and then from the computer to the network, provided with its additive storage and processing capabilities. Rather than information on the spatial relationships of a fixed set of objects, maps in some way have become windows connected to the underlying datasets, themselves being part of the emergent era of “Geospatial Big Data” and “Artificial Intelligence” (AI) [1,2,3]. By jumping from the computer to the network, and thanks to spatial interoperability standards and web mapping technologies, the measurements, calculations and models of a particular scientist acquired the potential to join those of all other scientists. This synergy is giving shape, density and substance, to an emerging digital replica of the planet, encompassed in the concept of digital earth [2,3]. In this sense, the expansion of free and open source software (FOSS) has fostered novel practices of data assembling, data sharing and data re-using, among scientists, within the paradigm of FAIR (Findability, Accessibility, Interoperability and Re-usability) principles [4,5]. In a recent review by Kinkade and Shepherd (2022) [6] on the advance of practices towards FAIR principles, the authors argue that FAIR applicability relies to a large extent on the initiative of local geoscientific laboratories to extend their own hardware, software and human resources, in order to create new FAIR resources and maintain them. In his agenda for FAIR geovisualization, Degbelo (2022) [7] emphasizes that data sharing and re-using for service-oriented online applications, implies that FAIR principles be considered from the analyst’s perspective, which we take as our FAIR criteria in this research.
The sharp increase in the volume, velocity and variety of the spatial data (a way to define the “geospatial big data” era [1]) has meant new challenges and opportunities for the cartographic and geo-visualization community [8]. Among these challenges, key aspects of the cartographic representation of geospatial data are the interactive aspect (flexibility for multi-attribute data, 3D visualization), and the dynamic aspect (evolution over time). For geospatial big data, the visual analysis of spatiotemporal patterns has been a fundamental research tool for geoscientists. This can be explained in two ways [9]. First, because the visual representation of data facilitates scientific communication beyond disciplinary boundaries. Second, because techniques of scientific visualization are irreplaceable - at least to date - in the study of processes which develop in the geographic space; the heterogeneity and variety of properties and relationships that occur in it cannot be adequately represented for their utilization in entirely automated processes [10], because the extraction of evidences still depends on the inference capacity of the human mind and on the ancillary knowledge of their properties and relationships with respect to real places and spaces [9,10].
In this context, we argue that the peer reviewed publication of maps occurs, in a large portion of the scientific communication media, as if its main substrate continued to be on paper (a digital version of a sheet of paper). Although it is possible to submit geospatial products based on interactive / dynamic maps, for publication in peer-reviewed journals, the format proposed for publication does not enable any, or most of the interactive or/and dynamic aspects of these products. In most cases, cartographic products accepted for publication are handled as supplementary material for which a standard application is offered for viewing and downloading a static or video-animated version of it. As a result, the potential for the rest of the scientific community to access and re-use these peer-reviewed data (in the sense of “examining” or “discovering” new information [10], and “unveiling the unknown” in the McEachren cubic representation of cartography [11], Figure 1) could be greatly limited. An online geo-visualization of the published geospatial data using ad-hoc online techniques from the geographical information sciences could enhance these aspects of the FAIR principles.
In 2016, Elsevier publishing released the “Geofacets” platform [12], a Spatial Data Infrastructure (SDI) which gathers geospatial data from the set of scientific articles published in Elsevier journals. This SDI is embedded into the ArcGIS environment, through which scientists can access to the peer-reviewed data and related articles. Although this initiative is a promising step for facing the challenges stated earlier, Geofacets is restricted to Elsevier and ArcGIS access, two proprietary licenses. Additionally, the geospatial data available is restricted to the admitted format in each electronic journal, for which advanced geo-visualizations are currently not available.
As stated by Kinkade and Shepherd [6], the online representation of geospatial information with interesting data re-using and sharing capabilities requires a data publication ecosystem which is demanding in terms of technological and human resources. In this research, we present results from the ongoing developments of the Terra Digitalis international journal, a university-based Service-Oriented Architecture (SOA) [5] with features such as the integration of an editorial processing system within an SDI, a shared data distribution platform, as well as a set of interactive and dynamic visualization solutions.
In the following section (section 2), we review the functionalities available in peer reviewed geospatial data, and recall elements of the technological solution based on which geospatial data are published in Terra Digitalis since the launch of the journal. In section 3, we present the set of FOSS tools and architectural features of the Terra Digitalis platform at present, which enable the extension of visualizations to massive geospatial data; we present two cases of visualization: a climate numerical model (massive spatiotemporal raster data) and a bike sharing system’s origin-destination dataset (massive spatiotemporal vector data). To illustrate the contribution of these developments, the respective visualizers are presented in section 4, and their relevance is compared with visualizations of journal platforms elsewhere using a representation of peer-reviewed cartography in the AI era. Finally, we discuss in section 5 challenges and opportunities for paving the way to the scientific communication of geospatial data in the future.
2. Online Geospatial Data in Peer Reviewed Scientific Journals
The schemes for the online publication of geospatial data in peer reviewed cartographic journals are reviewed, according to the functionalities proposed by international journals (section 2.1). We then present fundamental elements of the technological solution for the publication of geospatial data in Terra Digitalis (section 2.2).
2.1. The Access and Visualization of Geospatial Data in Peer-Reviewed Scientific Journals
Based on an extensive search on publication practices of peer-reviewed articles with geospatial data in international peer-reviewed journals (disciplines of Geoscience, Geographical Information, Geography and Data Science using both the Web of Science and Scopus journal browsers; a total of more than 50 international journals), we found that four schemes are offered to the authors of the manuscripts:
- i)
- Publication of a static map (pdf format), a major orientation of the Journal of Maps, for example;
- ii)
- Publication of a geospatial dataset, a major orientation of the Geoscience Data Journal, for example;
- iii)
- Geo-visualization of a dataset (including .kml and .kmz format), encouraged in the aims and scope of some journals including Cartography and Geographic Information Science;
- iv)
- Incorporation in the publisher’s internal Spatial Data Infrastructure, for example the Geofacets solution implemented for journals of the Elsevier publisher [12].
In case i), the static map is considered as a (major) supplementary material placed in a web-site for consultation, browsing and download. In case ii), the publisher proposes to the authors a scheme of data sharing via a data repository, i.e. an external SDI which handles the visualization. In case iii), the diversity of data formats available is greater and the visualization of the data is offered over the Google maps interface, with limited visualization possibilities. In the three above mentioned schemes, the dynamic or 3D visualization of datasets is either not possible or very limited. Finally, under scheme iv), the publisher handles an SDI. For example, Geofacets offers access to a database of maps, figures and tables from all geoscientific peer reviewed Elsevier publications and the geospatial data can be accessed and visualized through a GIS under ESRI and Elsevier Licenses. The university-based “international e-journal of maps Terra Digitalis” (Terra Digitalis) proposes an SDI based on FOSS tools for the published geospatial data.
Although Geovisualization research is included in the scope of many journals for peer reviewed geospatial data and cartography, no infrastructure has been found to specifically access dynamic or 3D interactive geospatial data within a platform tailored for this purpose in the reviewed journals, except for Terra Digitalis.
2.2. The Access and Visualization of Geospatial Data in Terra Digitalis
Terra Digitalis is an online international journal of maps which was launched in 2017 [13]. Its design is based on the use of Geonode (an official project of the Open Source Geospatial Foundation OSGeo [14]), as a Geospatial Content Management System (GeoCSM) linked to the Open Journal System (OJS, [15,16]) editorial process.
Publishable products in Terra Digitalis include (Figure 2): i) interactive maps that show the underlying database, with capabilities to filter objects, query attributes and present them at various scales; ii) dynamic maps that exhibit the spatiotemporal variation of a process; iii) 3D maps that exhibit the spatial distribution of a vector layer’s attributes; iv) publicly available collections of spatial data, made available through Open Geospatial Consortium (OGC) services.
In the OJS-based design of the editorial process, the text and the map are separate galleys. First, this separation allows us to divide the editorial process into two separate but interdependent routes, which can progress in parallel. The first one is managed within OJS, the second one is managed through an assorted mix of desktop and server-side geospatial content management tools (Figure 3). Second, OJS permits the link to additional galleys, which can be associated with specialized visualizers (Figure 2), external to OJS, with their own DOI linked to the main article. This core feature enables us to focus on the adaptation of optimized visualizers for each of the referred cartographic products.
To efficiently implement the editorial process of interactive maps, automatic solutions are preferred where possible, using existing software tools, preferably open source, and if necessary fill in the gaps with our own code. The selected software tools depend both on the initial data and on the final cartographic product that is to be implemented (Figure 2). In the field of geosciences, the two most commonly used GIS desktops are QGIS (free and opensource software) and ArcGIS (commercial software).
In the case of an ArcGIS-based map, the following processing flow is applied:
- ⮚
- The starting point is a map package (mpk format) sent by the author
- ⮚
- The map document is reconstructed from the mpk file
- ⮚
- Through the "Bridge" plugin, each of the layers that make up the map is exported to Geoserver, generating style specifications (sld format) and the corresponding metadata,
- ⮚
- The layers are published as OGC services
- ⮚
- We write the code in php and/or java script, using OpenLayers or Leaflet libraries, to generate interactive maps (Figure 4)
- ⮚
- This code consumes data through OGC connections
- ⮚
- In the case of a QGIS-based map, the following processing flow is applied:
- ⮚
- The starting point is a map package (geopak format) sent by the author
- ⮚
- The map document is reconstructed from the qgs file
- ⮚
-
If the geo-visualization is:
- ○
- An interactive 2D map that will consume gojson data: we use the qgis2web QGIS plugin to generate i) the json data for each layer, ii) the style specification, and iii) the java script code of the interactive map that consumes this code (Figure 4)
- ○
- An interactive 3D map that will consume gojson data: we use the qgis2three QGIS plugin to generate the same 3 components referred to above
- ○
- A dynamic map that will consume data through OGC services: for each layer i) we generate the sld specification, ii) we export it to Geoserver, iii) we publish the data as an OGC service, and iv) we write the php/js code that consumes the data
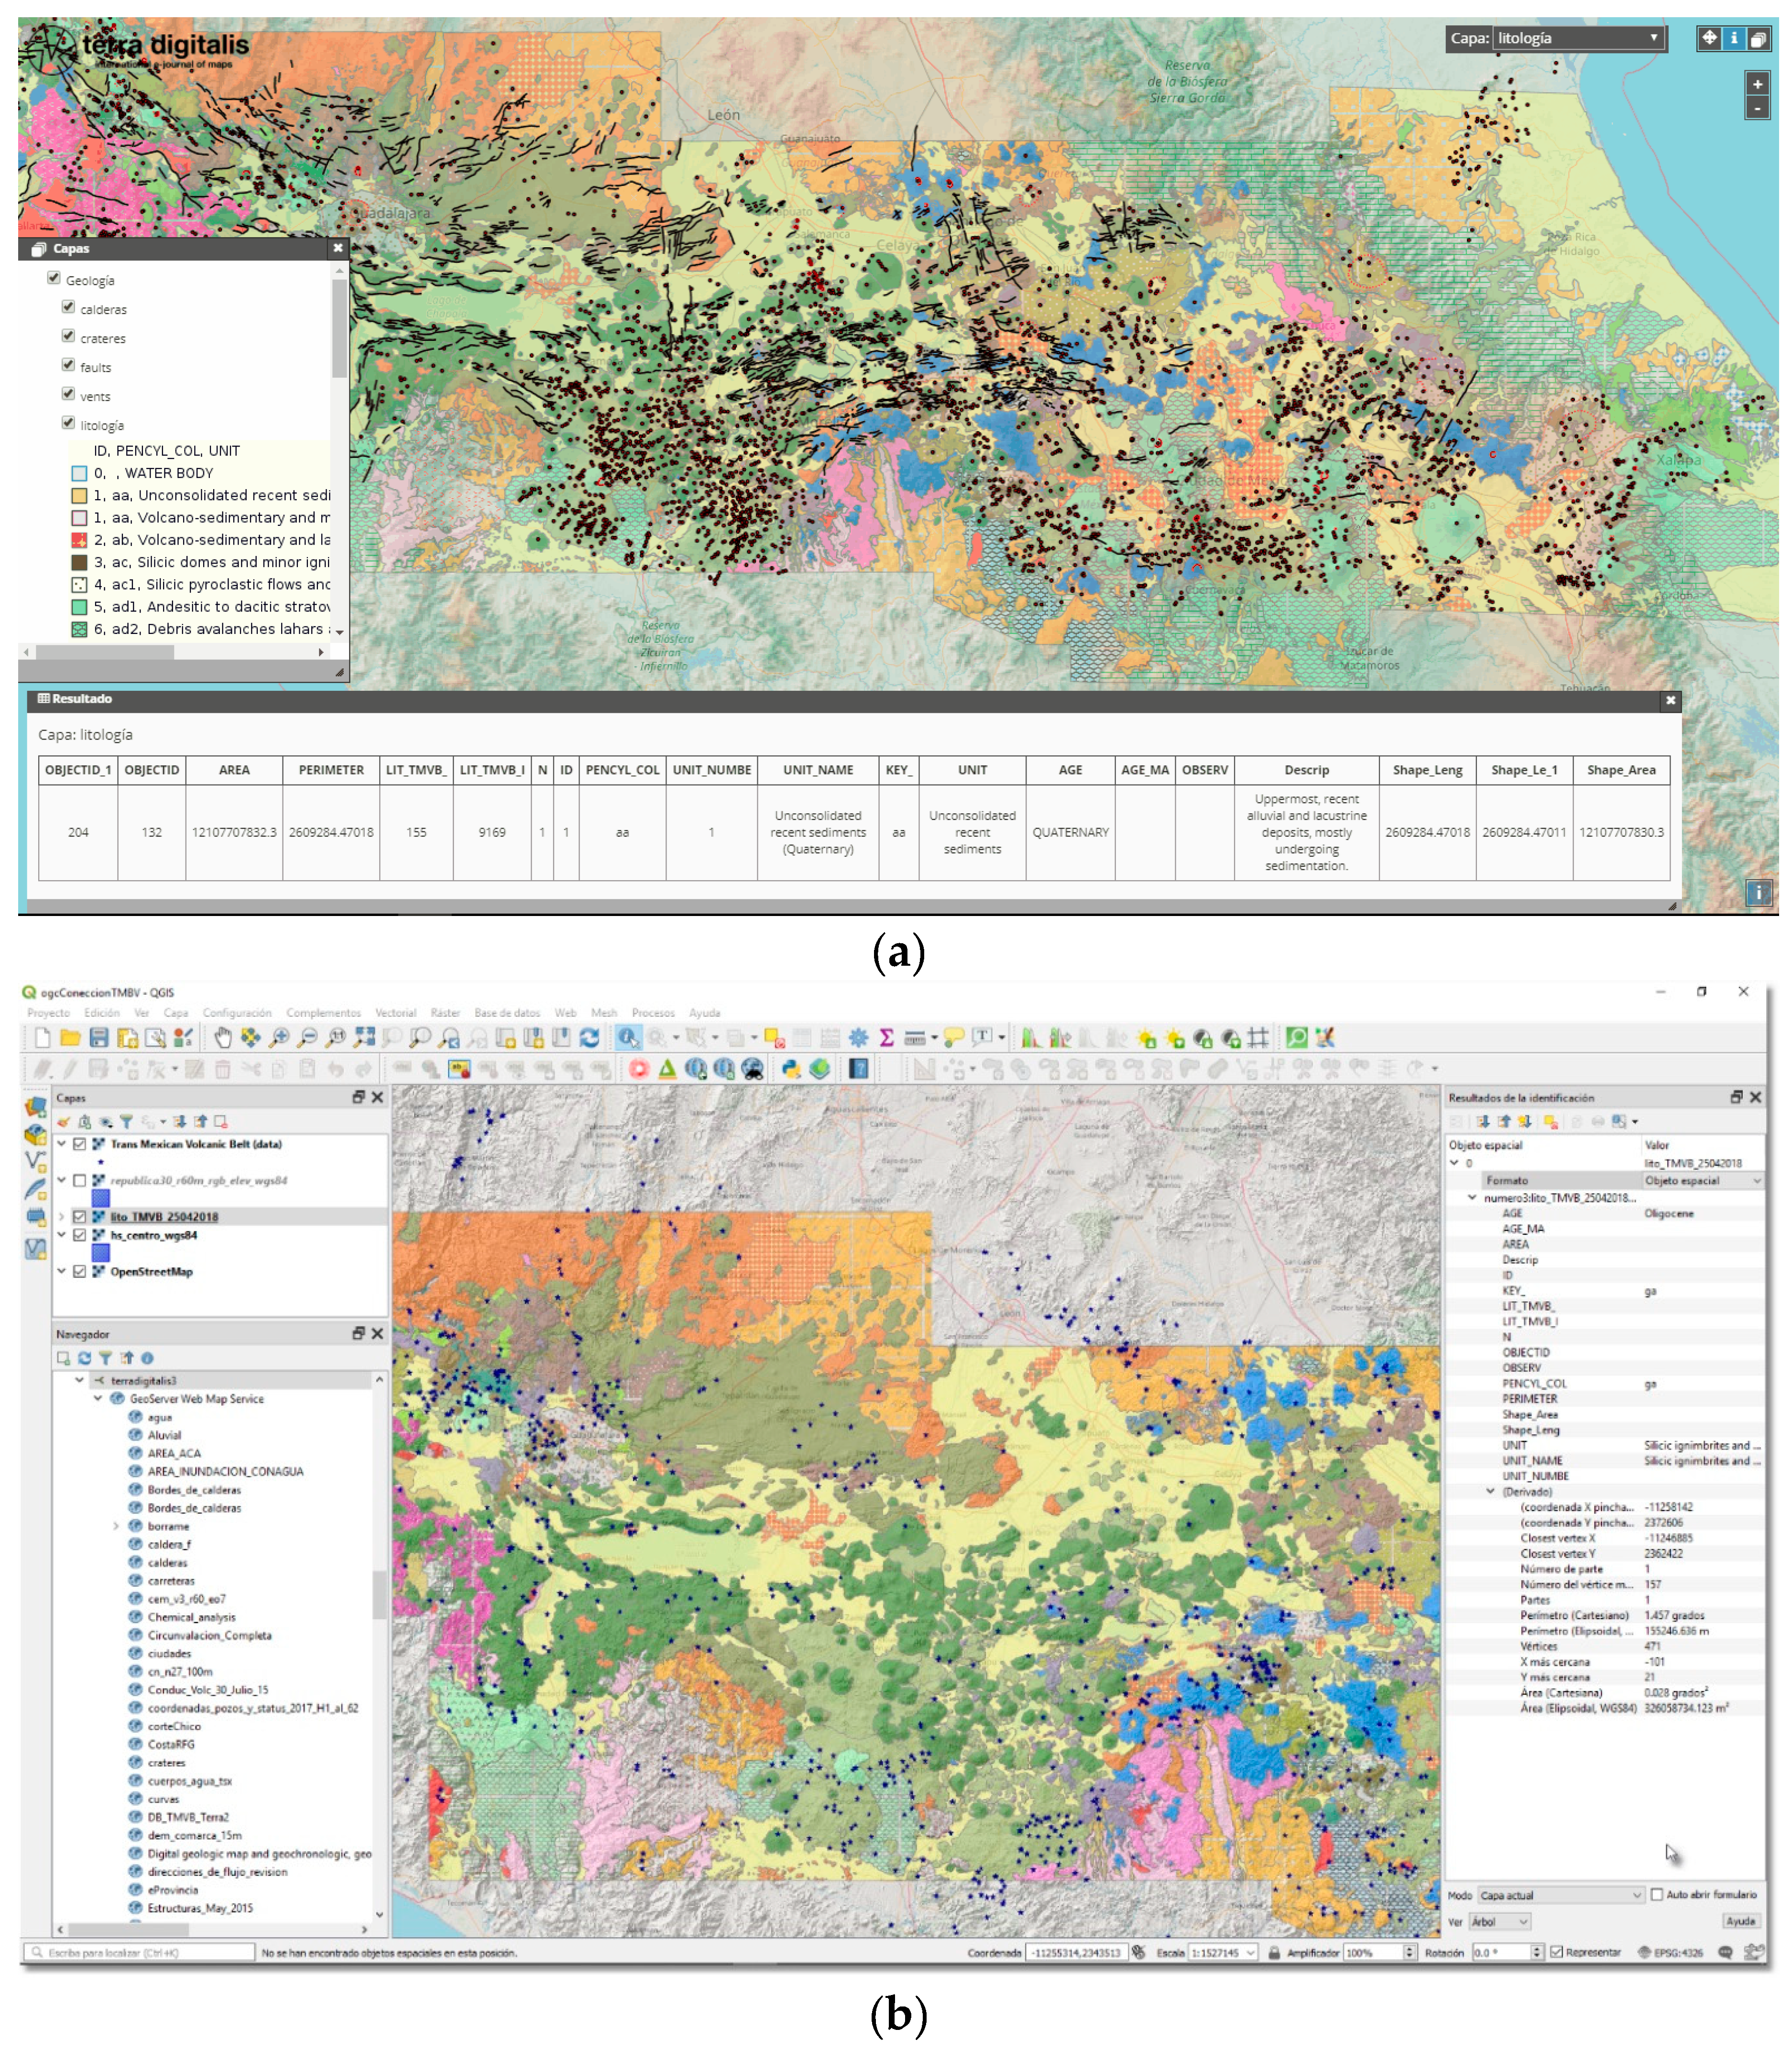
Figure 4.
Access to the data through Open Geospatial Consortium (OGC) connections: a) by the OpenLayers code in the interactive 2D map galley b) by the WMS/WMTS connector of a QGIS desktop.
Figure 4.
Access to the data through Open Geospatial Consortium (OGC) connections: a) by the OpenLayers code in the interactive 2D map galley b) by the WMS/WMTS connector of a QGIS desktop.
3. Materials and Methods
3.1. Architecture Extensions to Enable Geospatial Big Data Visualization
A solution for geovisualization of geospatial big data is implemented integrating FOSS tools - Openlayers, PostGIS, Geoserver and pycsw-, under the architecture shown in Figure 5.
To illustrate the innovative nature and operability of our solution, we present the interactive web mapping tools developed through two instances of articles in the journal, corresponding to the visualization of massive Raster and Vector spatiotemporal data. OGC protocols and structures (WMS, WMT with GeoWebCache) were used for visualizing the spatiotemporal sequences.
3.2. Massive Geospatial Data Visualized in Terra Digitalis
The massive Raster spatiotemporal data are a stack of daily images (daily variables for the 1979-2011 time period) extracted from a numerical climate model for Mexico at the national scale, hosted in the data center of the Terra Digitalis platform at UNAM university (URL: http://vista-c.igg.unam.mx). A fundamental feature of the peer reviewed visualizer is the use of the OpenLayer capability to handle multidate datasets for dynamic visualization. Raster image stacks were compiled in NetCDF data cubes. Sequences of images were stored in the Geoserver map server which displays each daily frame through a WMS service.
The massive Vector spatiotemporal data are the full database (56 million records) of arrival and departure events registered in the stations of the Mexico City “Ecobici” bike sharing system. The peer-reviewed work consisted in a set of interactive maps that capture patterns of the origin-destination flows. Specifically, Python scripts were developed using the PsycopPG cursor library, in order to read from the bike sharing system web API and upload the data to the PostgreSQL database. The 3D geometric representation was built using PL/pgSQL and PgRouting taking advantage of the powerful geospatial capabilities of PostGIS.
Within the Terra Digitalis SDI, options are available to adjust, extend or replace the code of the data or the map to fine-tune the style of the layers, add multimedia contents, and modify, extend or redesign the functionality of the interactive map. These interactive objects can be linked to the main article as additional galleys (as is illustrated in Figure 2), simply by providing its URL, from anywhere in the worldwide web.
4. Results
The dynamic visualization of massive Raster and Vector geospatial data (Figure 6 and Figure 7, respectively) is controlled by the user via a widget, written in php language. In both cases, we propose a video composition to illustrate the interactive online visualizers’ capabilities for spatiotemporal pattern exploration. The dynamics of one variable of the Raster numerical climate model can be apprehended here. In the Vector case, the dynamics pattern of some variables can be apprehended through 3D geo-visualization, accessible here.
In the Raster case, images are displayed via a scene using OpenLayers, according to the interaction with the user (Figure 6). The widget allows to scan one by one the images upon user defined time intervals or in an automatic manner. With respect to the simple availability of the data online in NetCDF or other formats, this geo-visualization feature enhances the Findability aspect of the FAIR principles because it includes the opportunity to rapidly examine and visually explore the data online. In the Vector case, the 3D interactive and dynamic visualization of the massive geospatial data (Figure 7) are innovative FOSS solutions for the exploration and discoverability of spatiotemporal patterns.
The open source software solution imbedded in the Terra Digitalis journal includes Geoserver and WMS services (Web Map Services), which are used to simplify and accelerate the consultation of geospatial information in interactive maps, as well as the consultation of the underlying data via WFS (Web Feature Services).
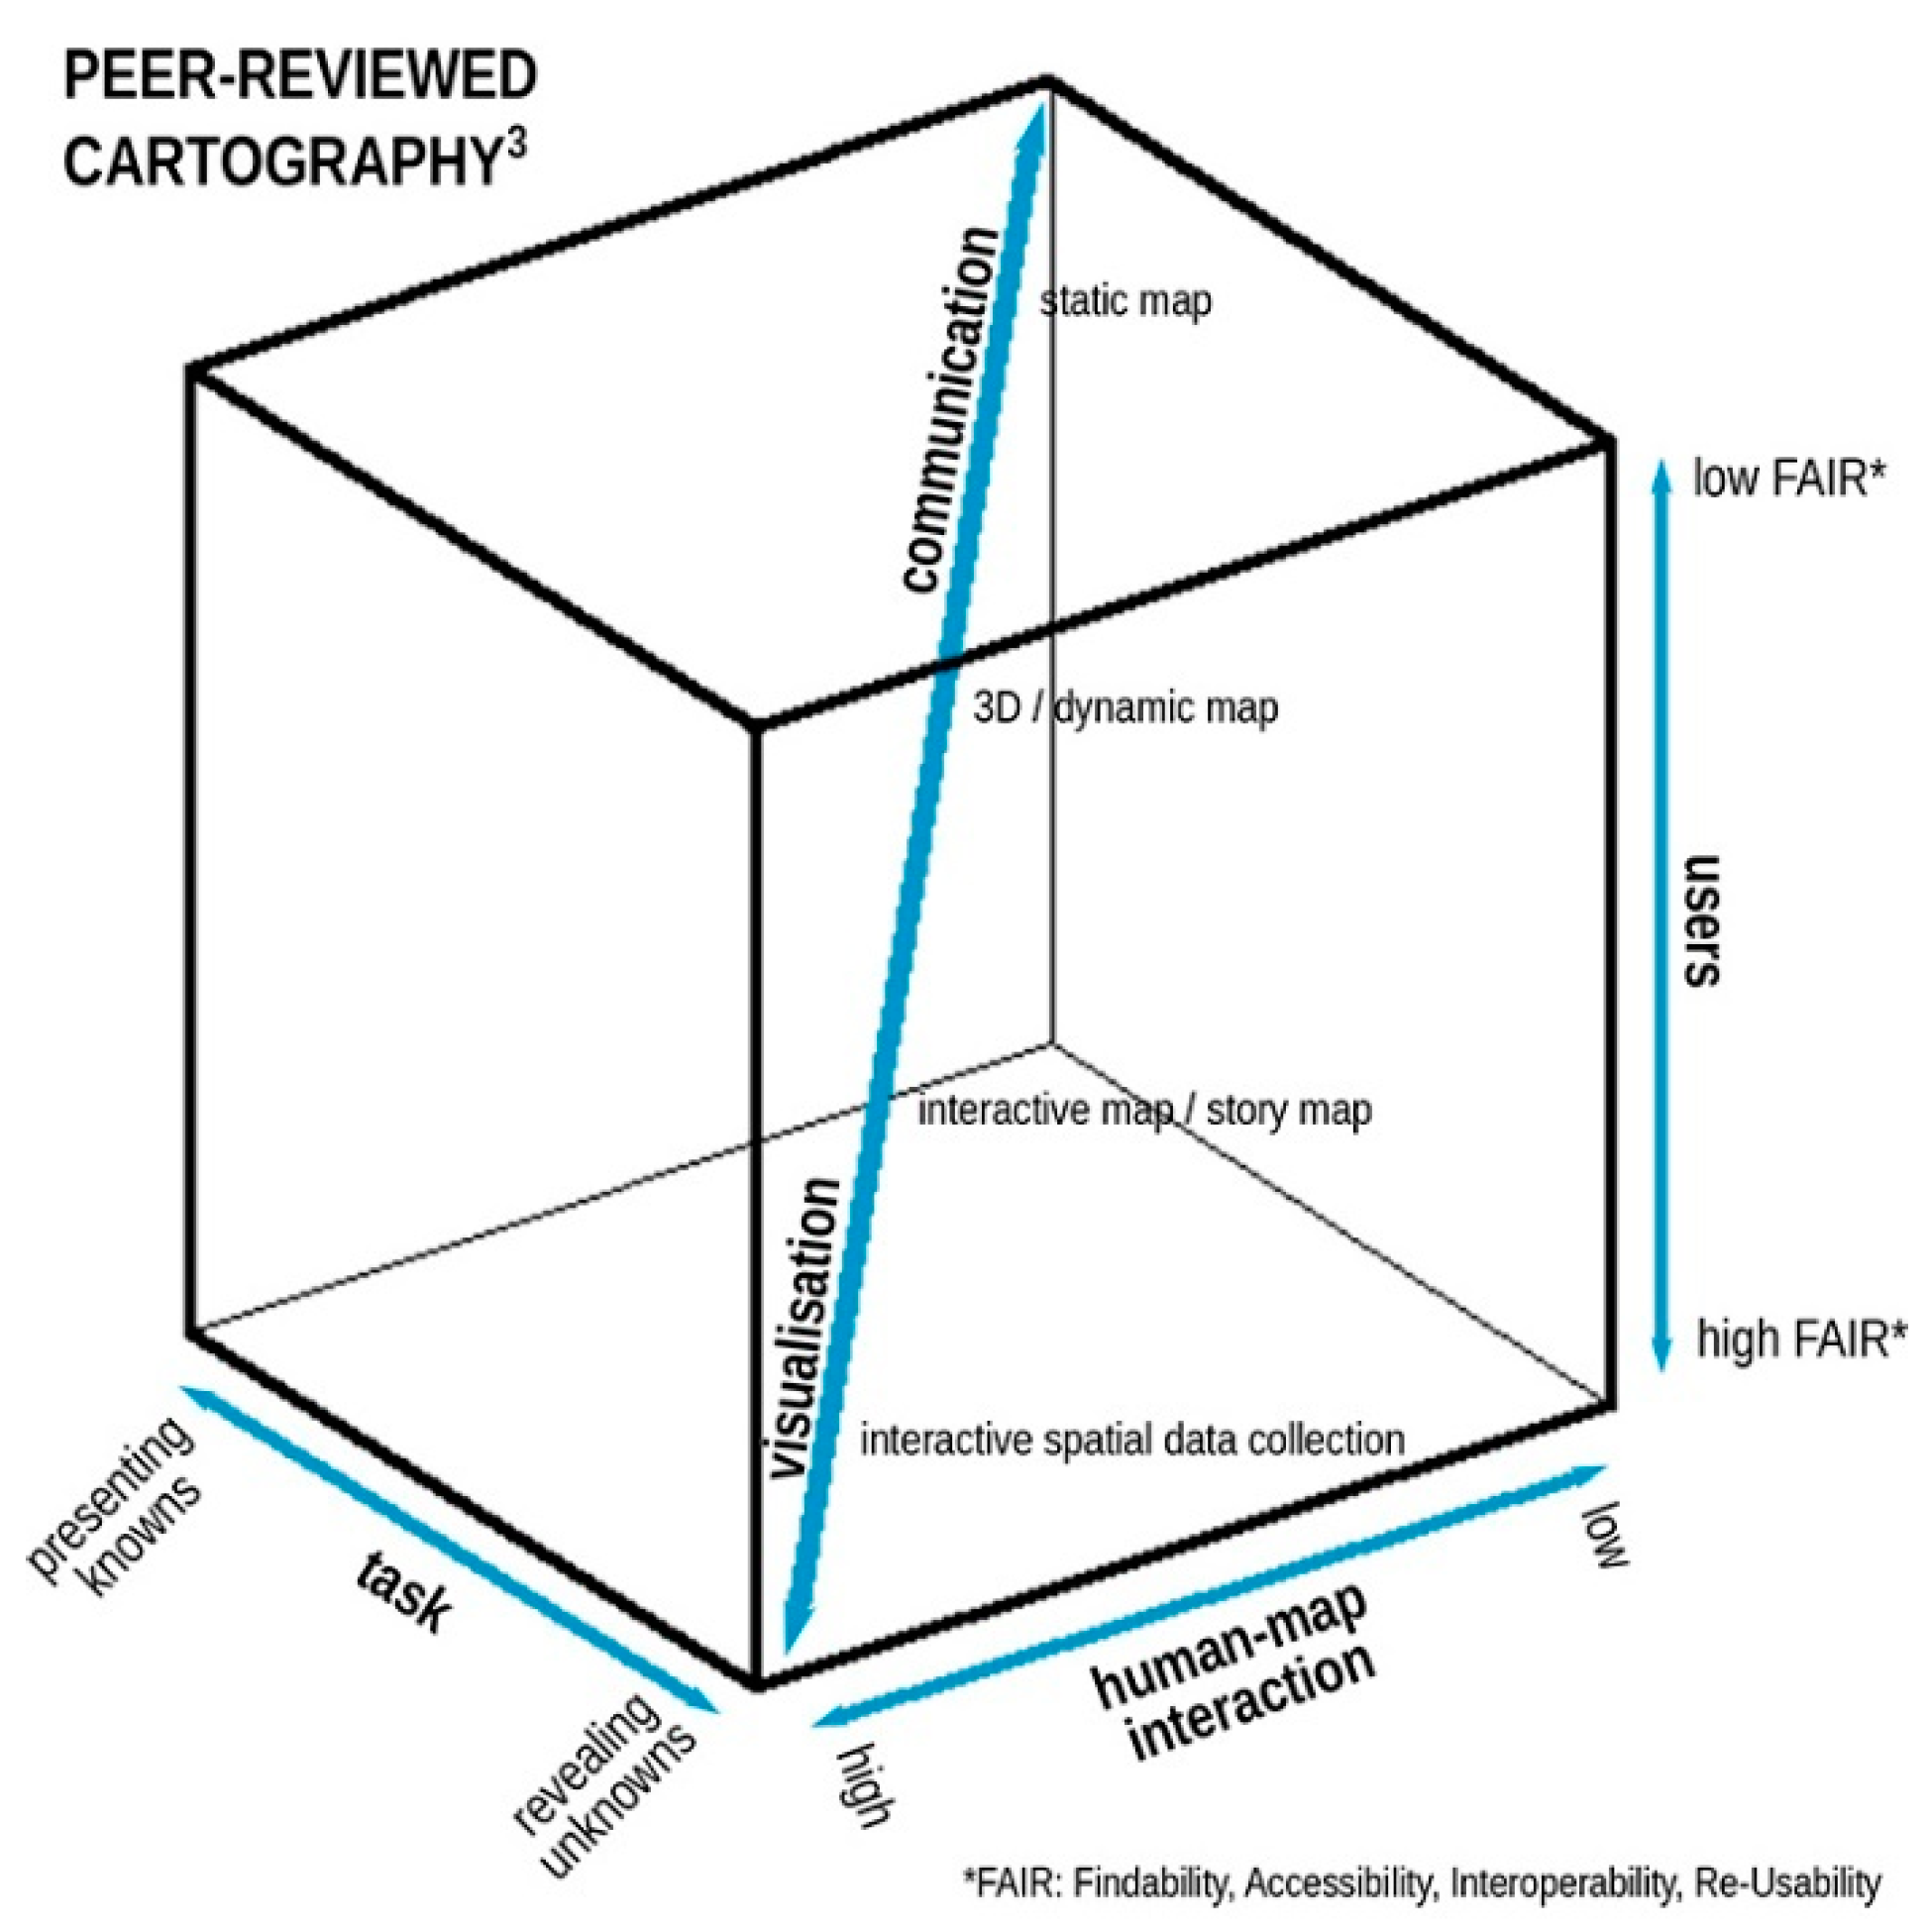
The Findability and Re-usability aspects of FAIR principles are enhanced for massive geospatial datasets with respect to visualizations proposed elsewhere. In Figure 8, a qualitative diagram is proposed for peer-reviewed cartography in the AI era, building on the well accepted McEachren cubic representation on Cartography in the 1990s [11]. Some advanced cartographic geo-visualizations are located on the “Visualization - Communication” diagonal of our diagram. Geo-visualization items such as story maps, 3D and dynamic maps, as well as interactive maps, are peer-reviewed and currently incorporated in the Terra Digitalis journal. Among international journals focused on cartography, the Journal of Maps (www.journalofmaps.com) is a popular and emblematic publication medium. Online functionalities of this journal are limited to large extent static map visualization and download, they do not include interactive visualization, thereby limiting the exploration, interaction and FAIRness of the geospatial data.
In data science journals, peer-reviewed geospatial data are typically hosted in data repositories with persistent web and open access characteristics (ex. datadryad.org, Mendeley Data). For example, Mendeley Data allows the publication of data collections (Digital Commons Data) and is designed for a range of indexed Journals (https://data.mendeley.com/). Mendeley Data works as a cloud data repository that allows researchers to make their research data publicly available. Available file types include geospatial data and geographic information systems (GIS) files, such as Geography Markup Language (GML) (.gml), MapInfo Interchange Format (MIF/MID) (.mif/.mid), ESRI Shapefiles (.shp & related files), MapInfo (.tab & related files), and Keyhole Markup Language (KML) (.kml). However, Mendeley Data does not allow for online geospatial data visualization using these data. For example, in Leger et al. (2020) [17], 26 shapefiles are made available for download to view and analyze a glacial geomorphological map in a Mendeley Data online repository, however, this visualization opportunity mainly favors the domain scientists that are already familiar with the data. For non-domain scientists, accessing and re-using the data is still heavily dependent on how to access and view it in a flexible manner [6,7].
Some of Elsevier's journals, not necessarily with a cartographic or data science focus, such as Global Environmental Change (https://www.journals.elsevier.com/global-environmental-change), are innovating in data visualization with the inclusion of tools that may enhance aspects in accessibility, discoverability, and usability, intended for research areas that incorporate large-extent images, for example epidemics or geological maps. With these tools, interactive maps can be included in KML format, making use of Google Maps technology. A large image viewer (Virtual microscope) is made available for the examination of high-resolution slide images in research articles. This tool includes Functionalities such as zoom, scroll, pan and rotate, and can be applied to high-resolution static maps. This solution was developed in collaboration with Kitware SAS (https://www.kitware.com/), and combines open source with commercial technologies. The data underlying the maps, however, cannot be visualized in an interactive manner.
A Service Oriented Architecture (SOA) mapping approach is well adapted to the challenge of producing cartography based on geospatial big data [5]. The Elsevier Geofacets platform is a SOA mapping approach to peer reviewed cartography. On the ESRI (the Geofacets platform producer for Elsevier) website, a section on data visualization (https://www.elsevier.com/authors/tools-and-resources/data-visualization), specifies visualization functionalities under development, for 3D model representations for example. The technologies presented do not include map servers, and the focus is made on vector data or raw image renderization to lighten the load for visualization.
By contrast, the free and open source software solution imbedded in the Terra Digitalis journal includes Geoserver and WMS services (Web Map Services), which are used to simplify and accelerate the consultation of geospatial information in interactive maps, as well as the consultation of the underlying data via WFS (Web Feature Services). These technologies are particularly useful for the incorporation of geospatial big data, because the map server can interact with spatial databases such as PostGIS and synthetically visualize large volumes of geospatial data.
5. Discussion
Online functionalities of most cartographic journals are mainly focused on the visualization of large extent, static maps, not on interactive visualization, thereby limiting the exploration, interaction and FAIRness of the geospatial data. In data science journals, a major focus of the peer-review process is on the novelty and usefulness of a data collection for the scientific community. Peer-reviewed geospatial data are typically hosted in data repositories with persistent web and open access characteristics, and the host infrastructure allows fast and easy data download. Preliminary online geospatial data visualization is usually not offered, with the outcome that only the domain scientists that are already familiar with the type of data, will know how to geo-visualize the data. As is explicitly stated in the benchmarks to bridge geoscience and data science for non-domain scientists and multi-disciplinary studies [18], an adequate, preliminary geo-visualization with discoverability and exploration functionalities, are a key step for re-using the data.
Geospatial big data have referred to spatial data sets exceeding the conventional capacity of computing systems, and are of particular importance in the context of AI applications [19]. Geospatial big data have boosted the advances in Geographic Information Science toward three directions: storage, integration and management; analytics; platforms for visualization and distribution. A peer-reviewed journal involved in publishing geospatial data in the face of AI applications should consider solutions for the visualization and distribution in line with the authors' perspectives for accessibility and re-use. The Terra Digitalis journal inaugurates the paradigm of an online Geographic Information System integrated with a peer-reviewed data journal. A scientific map alone does not explain itself. Text, equations and graphs are required to argue the relevance and scientific novelty of the methods and results reported on the map. OJS handles these latter contents well; For other types of resources, OJS allows to link additional galleys which can be associated with specialized visualizers, external to OJS. It seems that peer reviewed cartographic journals other than Terra Digitalis have not opted for a design that links their editorial management system to an SDI. Perhaps the bottleneck has been the added layer of complexity and cost, required to deal with the “transcription” of the original GIS-based map to an interactive Web based, equivalent.
The development of the Terra Digitalis platform is a dynamic process, which will have to overcome current limitations and adapt to the development of geospatial big data. Our data storage system is PostgreSQL, not one that is specifically designed for Big Data (e.g. MongoDB). Some studies have documented PostgreSQL to outperform MongoDB for the display of massive spatio-temporal data [20]. Our geospatial data cases were well structure (low variety), hence the MongoDB advantages were not needed. However, this technology update should be considered in the future, to cope with an increasing visualization demand of geospatial big data in the journal. Especially considering that the data cases presented in this paper, to some respect may fail to represent the typical geospatial big data. Also, in Terra Digitalis, the set of SDI services is not fully implemented yet. For example, the process of involving the authors to document the metadata of their product has not been designed. Also, Geospatial Coverage Services (GCS) and its extension WPS, that has been documented as a very efficient remote processing protocol for big earth data, are not yet exploited in the present version of the Terra Digitalis platform.
6. Conclusions
An adequate geo-visualization, with discoverability and exploration functionalities in the user’s perspective [7], are an important component of the call to bridge geoscience and data science [18] and for more FAIR data in the big data era [21], both of which are keystones for re-using data in AI applications and in multidisciplinary science [19]. We argue that a great opportunity in this sense would be a preliminary visualization, according to the authors’ perspectives for data re-use, made available in peer-reviewed media.
We reviewed the functionalities proposed by current international peer-reviewed media for accessing, exploring and re-using geospatial data. Building on the well-accepted McEachren cubic representation of cartography in the 1990s, we propose in this research a qualitative diagram for Peer-reviewed cartography in the era of AI (Figure 8). Online interactive maps are an important tool of AI applications for the advancement of cartography and other geographical sciences [19]. Scientific communication through peer reviewed cartographic journals, still largely occurs as if the main substrate of maps continued to be a static pdf file. By contrast, within the Public Knowledge Project, an objective of the geoscientific community includes contributing to the access to a free and open source Common Digital Earth. We argue a keystone in that direction should be the development of more peer-reviewed media for the publication and flexible visualization of geospatial big data. A major contribution of our solution in Terra Digitalis consists in mixing and matching a set of computational tools to allow the interrelation between the OJS system and a FOSS based SDI. Further developments are under way to incorporate geospatial data with more variety as well as better handle metadata within the SDI of the journal, key aspects for enhanced FAIR standards of scientific data.
Author Contributions
Conceptualization, Francisco Osorno-Covarrubias, Stéphane Couturier, Luca Ferrari and Manuel Suárez Lastra; Data curation, Penélope López-Quiroz; Formal analysis, Stéphane Couturier, Iván Martínez-Zazueta and Luca Ferrari; Funding acquisition, Stéphane Couturier, Luca Ferrari and Manuel Suárez Lastra; Investigation, Stéphane Couturier and Luca Ferrari; Methodology, Francisco Osorno-Covarrubias and Penélope López-Quiroz; Project administration, Penélope López-Quiroz and Luca Ferrari; Resources, Francisco Osorno-Covarrubias and Luca Ferrari; Software, Francisco Osorno-Covarrubias and Iván Martínez-Zazueta; Supervision, Stéphane Couturier, Luca Ferrari and Manuel Suárez Lastra; Validation, Francisco Osorno-Covarrubias, Stéphane Couturier and Penélope López-Quiroz; Visualization, Francisco Osorno-Covarrubias, Stéphane Couturier, Iván Martínez-Zazueta and Penélope López-Quiroz; Writing – original draft, Francisco Osorno-Covarrubias, Stéphane Couturier and Penélope López-Quiroz; Writing – review & editing, Stéphane Couturier, Luca Ferrari and Manuel Suárez Lastra. All authors have read and agreed to the published version of the manuscript.
Funding
The work underlying this research has been partially funded by the following projects: PAPIIT IN304722 (funded by UNAM DGAPA); LANOT2023 and A1-S-34633 (funded by CONACYT); Terra Digitalis (funded by four Institutes pertaining to the UNAM university: IGg, CIGA, IGp, CentroGeociencias).
Data Availability Statement
All the data analysed and software developed in this article are publicly available through the following URLs:https://terradigitalis.igg.unam.mx/html/ojs3/index.php/terra_digitalis/article/view/61, https://terradigitalis.igg.unam.mx/html/ojs3/index.php/terra_digitalis/article/view/58, http://vista-c.igg.unam.mx/servicios.php.
Conflicts of Interest
The authors declare no conflicts of interest.
References
- Ivan, I.; Singleton, A.; Horák, J.; Inspektor, T. The Rise of Big Spatial Data. Springer: Heidelberg, Germany,, 2017. [Google Scholar]
- Hart, J.K.; Martinez, K. Environmental sensor networks: A revolution in the earth system science? Earth-Science Reviews 2006, 78, 177–191. [Google Scholar] [CrossRef]
- Craglia, M.; de Bie, K.; Jackson, D.; Pesaresi, M.; Remetey-Fülöpp, G.; Wang, C.; et al. Digital Earth 2020: towards the vision for the next decade. International Journal of Digital Earth 2012, 5, 4–21. [Google Scholar] [CrossRef]
- Brovelli, M.A.; Minghini, M.; Moreno-Sanchez, R. and Oliveira, R. Free and open source software for geospatial applications (FOSS4G) to support Future Earth. International journal of digital earth 2017, 10, 386–404. [Google Scholar] [CrossRef]
- Jobst, M.; Gartner, G. Service-Oriented Mapping --An Introduction. In Service-Oriented Mapping: Changing paradigm in Map Production and Geoinformation Management; Döllner, J., Jobst, M., Schmitz, P., Eds.; Springer: Heidelberg, Germany, 2019; pp. 3–42. [Google Scholar]
- Kinkade, D.; Shepherd, A. Geoscience data publication: Practices and perspectives on enabling the FAIR guiding principles. Geoscience Data Journal 2022, 9, 177–186. [Google Scholar] [CrossRef]
- Degbelo, A. FAIR geovisualizations: definitions, challenges, and the road ahead. International Journal of Geographical Information Science 2022, 36, 1059–1099. [Google Scholar] [CrossRef]
- Robinson, A.C.; Demsar, U.; Moore, A.B.; Buckley, A.; Jiang, B.; Field, K.; Kraak, M.J.; Camboim, S.P.; Sluter, C.R. Geospatial big data and cartography: research challenges and opportunities for making maps that matter. International Journal of Cartography 2017, 3 (suppl. 1), 32–60. [Google Scholar] [CrossRef]
- Andrienko, N.; Andrienko, G. Visual analytics of movement: An overview of methods, tools and procedures. Information Visualization 2013, 12, 3–24. [Google Scholar] [CrossRef]
- Keim, D.; Andrienko, G.; Fekete, J.-D.; Görg, C.; Kohlhammer, J.; Melançon, G. Visual analytics: Definition, process, and challenges. In Information Visualization; Springer: Heidelberg, Germany, 2008; pp. 154–175. [Google Scholar]
- MacEachren, A.M. Visualization in modern cartography: Setting the agenda. In Visualization in Modern Cartography, 1st ed.; MacEachren, A.M., Fraser Taylor, D.R., Eds.; Elsevier Publisher: USA, 1994; pp. 1–11. [Google Scholar] [CrossRef]
- Elsevier Engineering and Geoscience Solutions, the Geofacets solution, Elsevier Publisher 2015. Available online: https://www.elsevier.com/solutions/geofacets (accessed on 23 June 2023).
- Osorno Covarrubias, J.; Couturier, S.; López Quiroz, P.; Ferrari, L.; Martínez Zazueta, I. Terra Digitalis: diseño e implementación de una revista internacional interactiva de mapas arbitrados. GeoFocus 2018, 22, 115–139. [Google Scholar] [CrossRef]
- Brovelli, M.A.; Minghini, M.; Moreno-Sanchez, R. and Oliveira, R. Free and open source software for geospatial applications (FOSS4G) to support Future Earth. International journal of digital earth 2017, 10, 386–404. [Google Scholar] [CrossRef]
- Laakso, M.; Welling, P.; Bukvova, H.; Nyman, L.; Björk, B.-C.; Hedlund, T. The development of open access journal publishing from 1993 to 2009. PloS one 2011, 6, e20961. [Google Scholar] [CrossRef]
- Muir, S.P.; Leggott, M.; Willinsky, J. Open journal systems: An example of open source software for journal management and publishing. Library Hi Tech 2005, 23, 504–519. [Google Scholar] [CrossRef]
- Leger, T. P.; Hein, A. S.; Bingham, R. G.; Martini, M. A.; Soteres, R. L.; Sagredo, E. A.; Martínez, O. A. The glacial geomorphology of the Río Corcovado, Río Huemul and Lago Palena/General Vintter valleys, northeastern Patagonia (43 S, 71 W). Journal of Maps 2020, 16, 651–668. [Google Scholar]
- Ebert-Uphoff, I.; Thompson, D. R.; Demir, I.; Gel, Y. R.; Karpatne, A.; Guereque, M.; …; Smyth, P. A vision for the development of benchmarks to bridge geoscience and data science. In 17th International Workshop on Climate Informatics, USA, 22 September 2017. [Google Scholar]
- Wagemann, J.; Clements, O.; Marco Figuera, R.; Rossi, A. P.; Mantovani, S. Geospatial web services pave new ways for server-based on-demand access and processing of Big Earth Data. International Journal of Digital Earth 2018, 11, 7–25. [Google Scholar] [CrossRef]
- Haynes, D.; Ray, S.; Manson, S.M. and Soni, A. High performance analysis of big spatial data. In 2015 IEEE International Conference on Big Data (Big Data), USA, 15 October 2015; pp. 1953–1957. [Google Scholar]
- Stall, S.; Yarmey, L.; Cutcher-Gershenfeld, J.; Hanson, B.; Lehnert, K.; Nosek, B.; …; Wyborn, L. Make scientific data FAIR. Nature 2019, 570, 27–29. [Google Scholar] [PubMed]
Figure 1.
The cartographic cube, introduced in 1994 by MacEachren [11], illustrates uses and purposes of cartography in scientific research.
Figure 1.
The cartographic cube, introduced in 1994 by MacEachren [11], illustrates uses and purposes of cartography in scientific research.

Figure 2.
Multiple galley scheme in the Terra Digitalis journal: (a) Main article page; (b) Galley 1: pdf viewer; (c) Galley 2: 2D interactive visualizer; (d) Galley 3: 3D interactive visualizer.
Figure 2.
Multiple galley scheme in the Terra Digitalis journal: (a) Main article page; (b) Galley 1: pdf viewer; (c) Galley 2: 2D interactive visualizer; (d) Galley 3: 3D interactive visualizer.
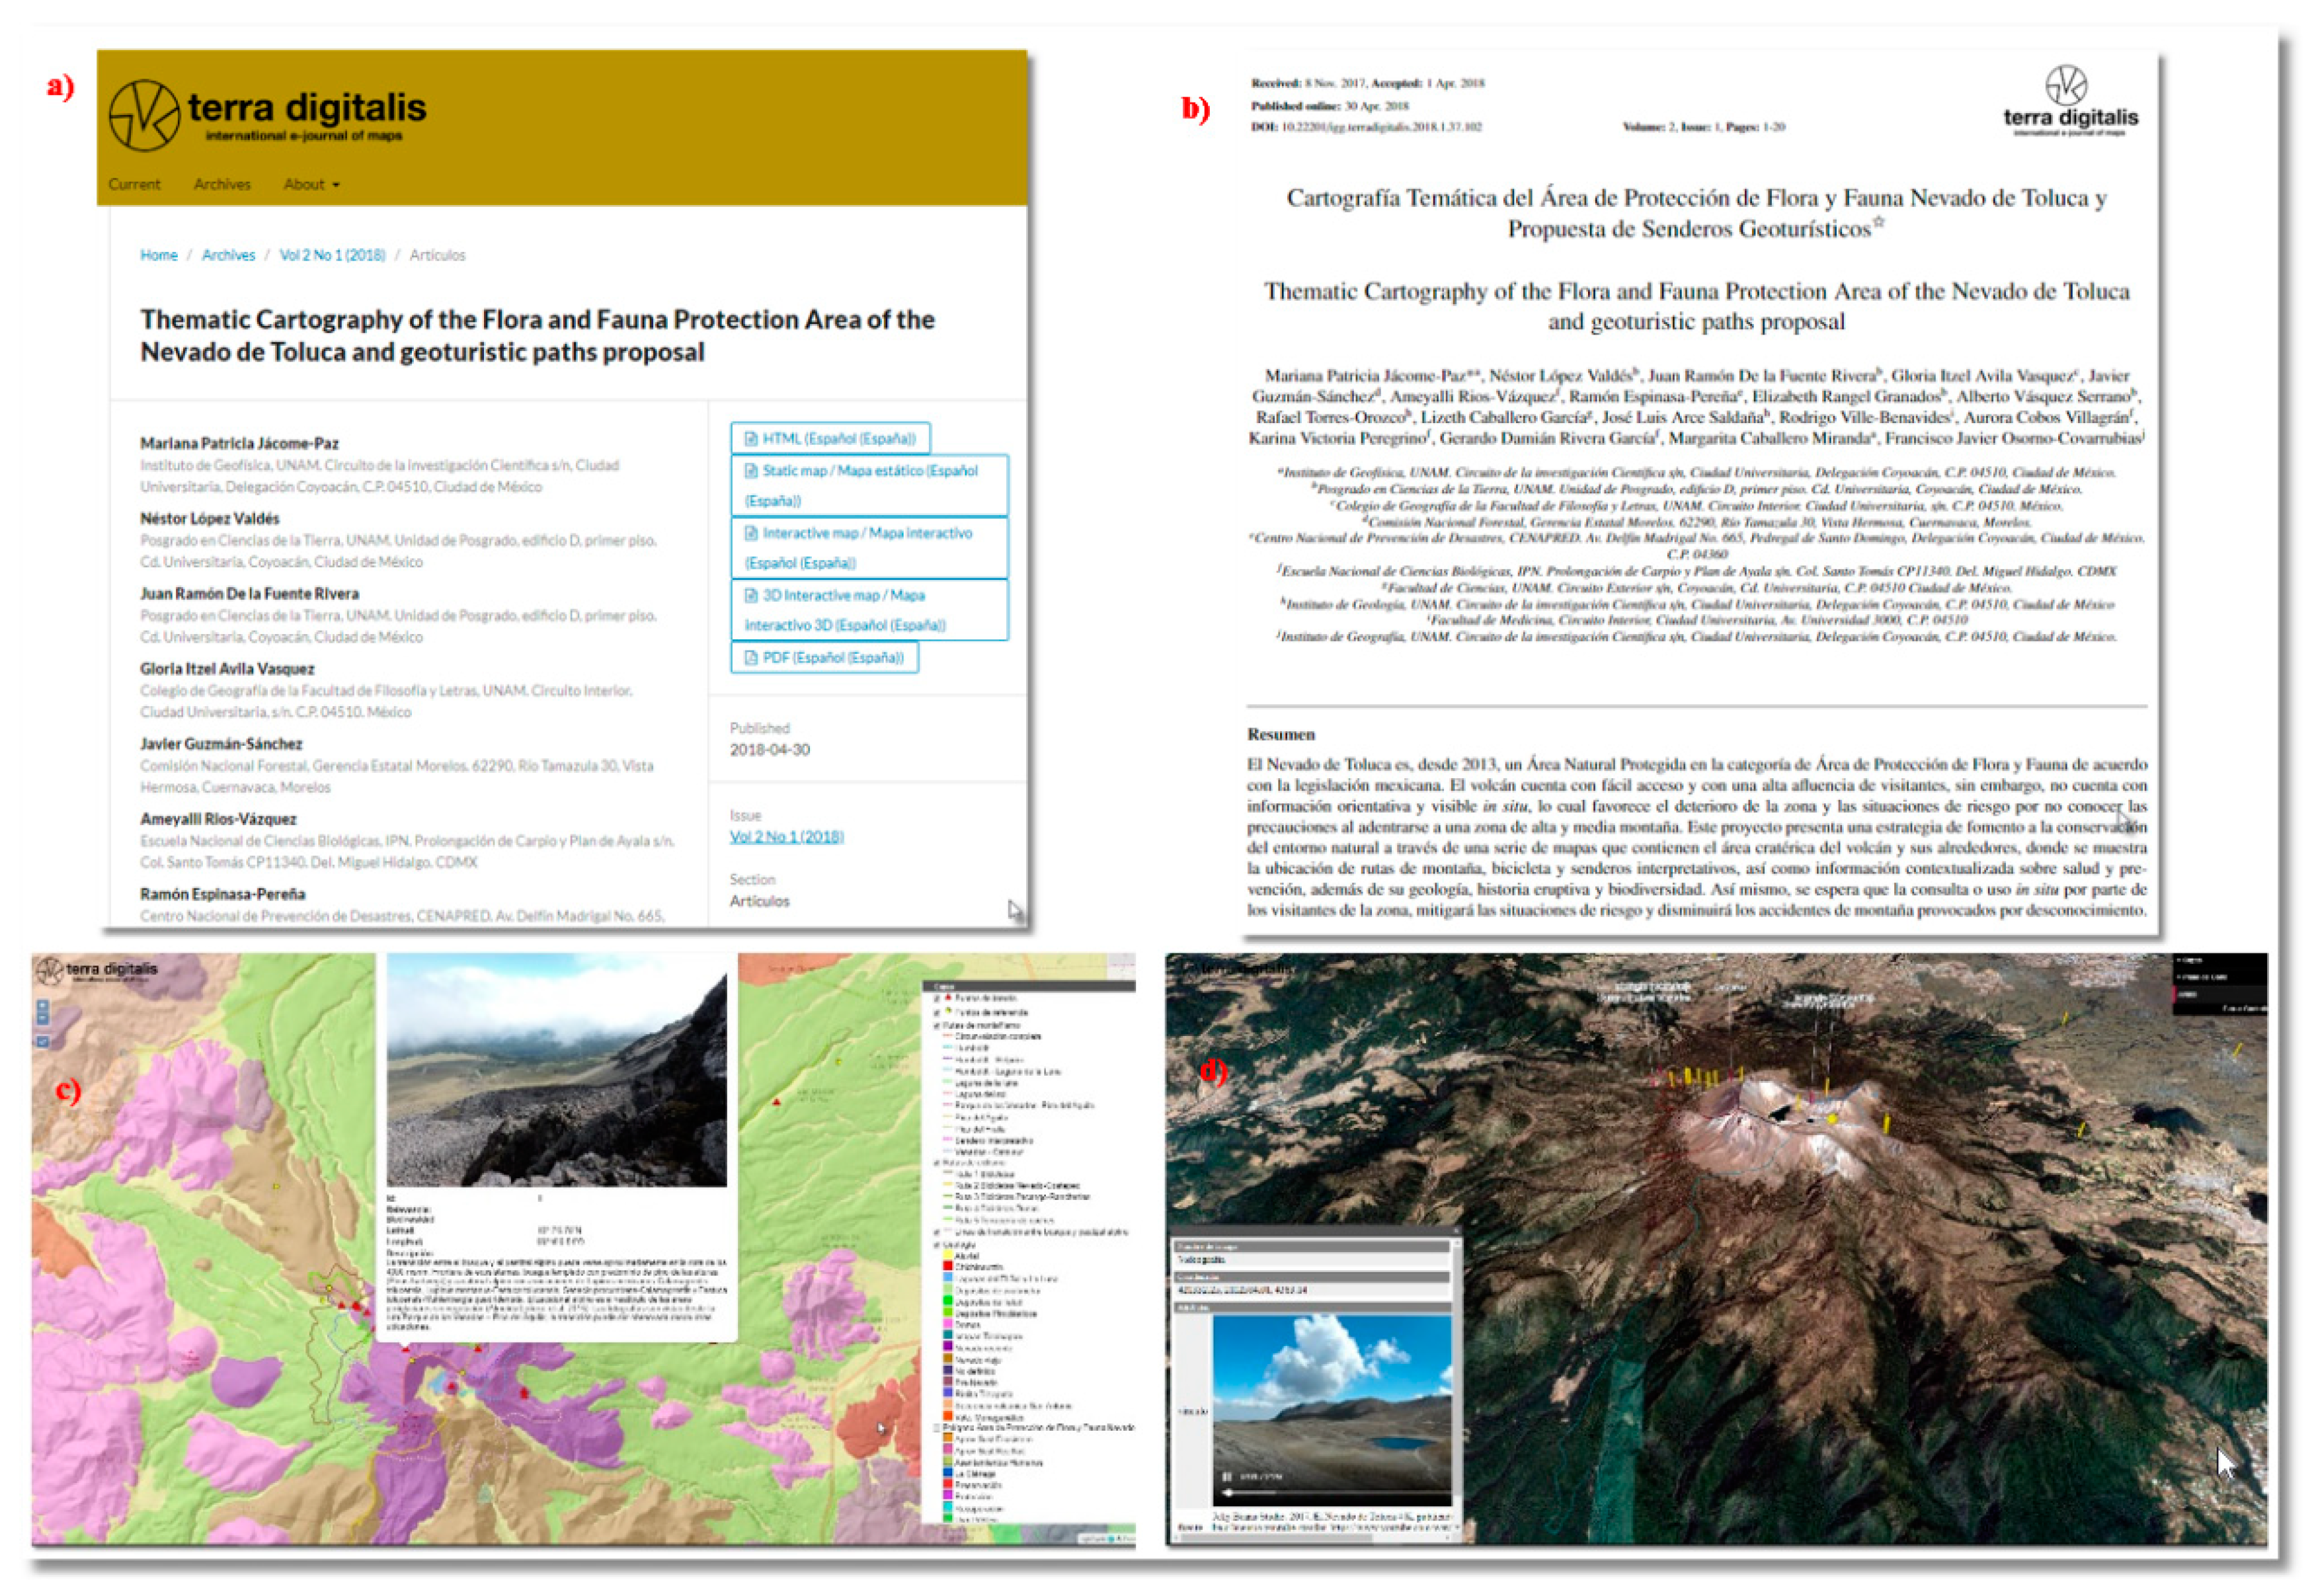
Figure 3.
Tools used in the cartographic editorial process (taken from [13]).
Figure 3.
Tools used in the cartographic editorial process (taken from [13]).
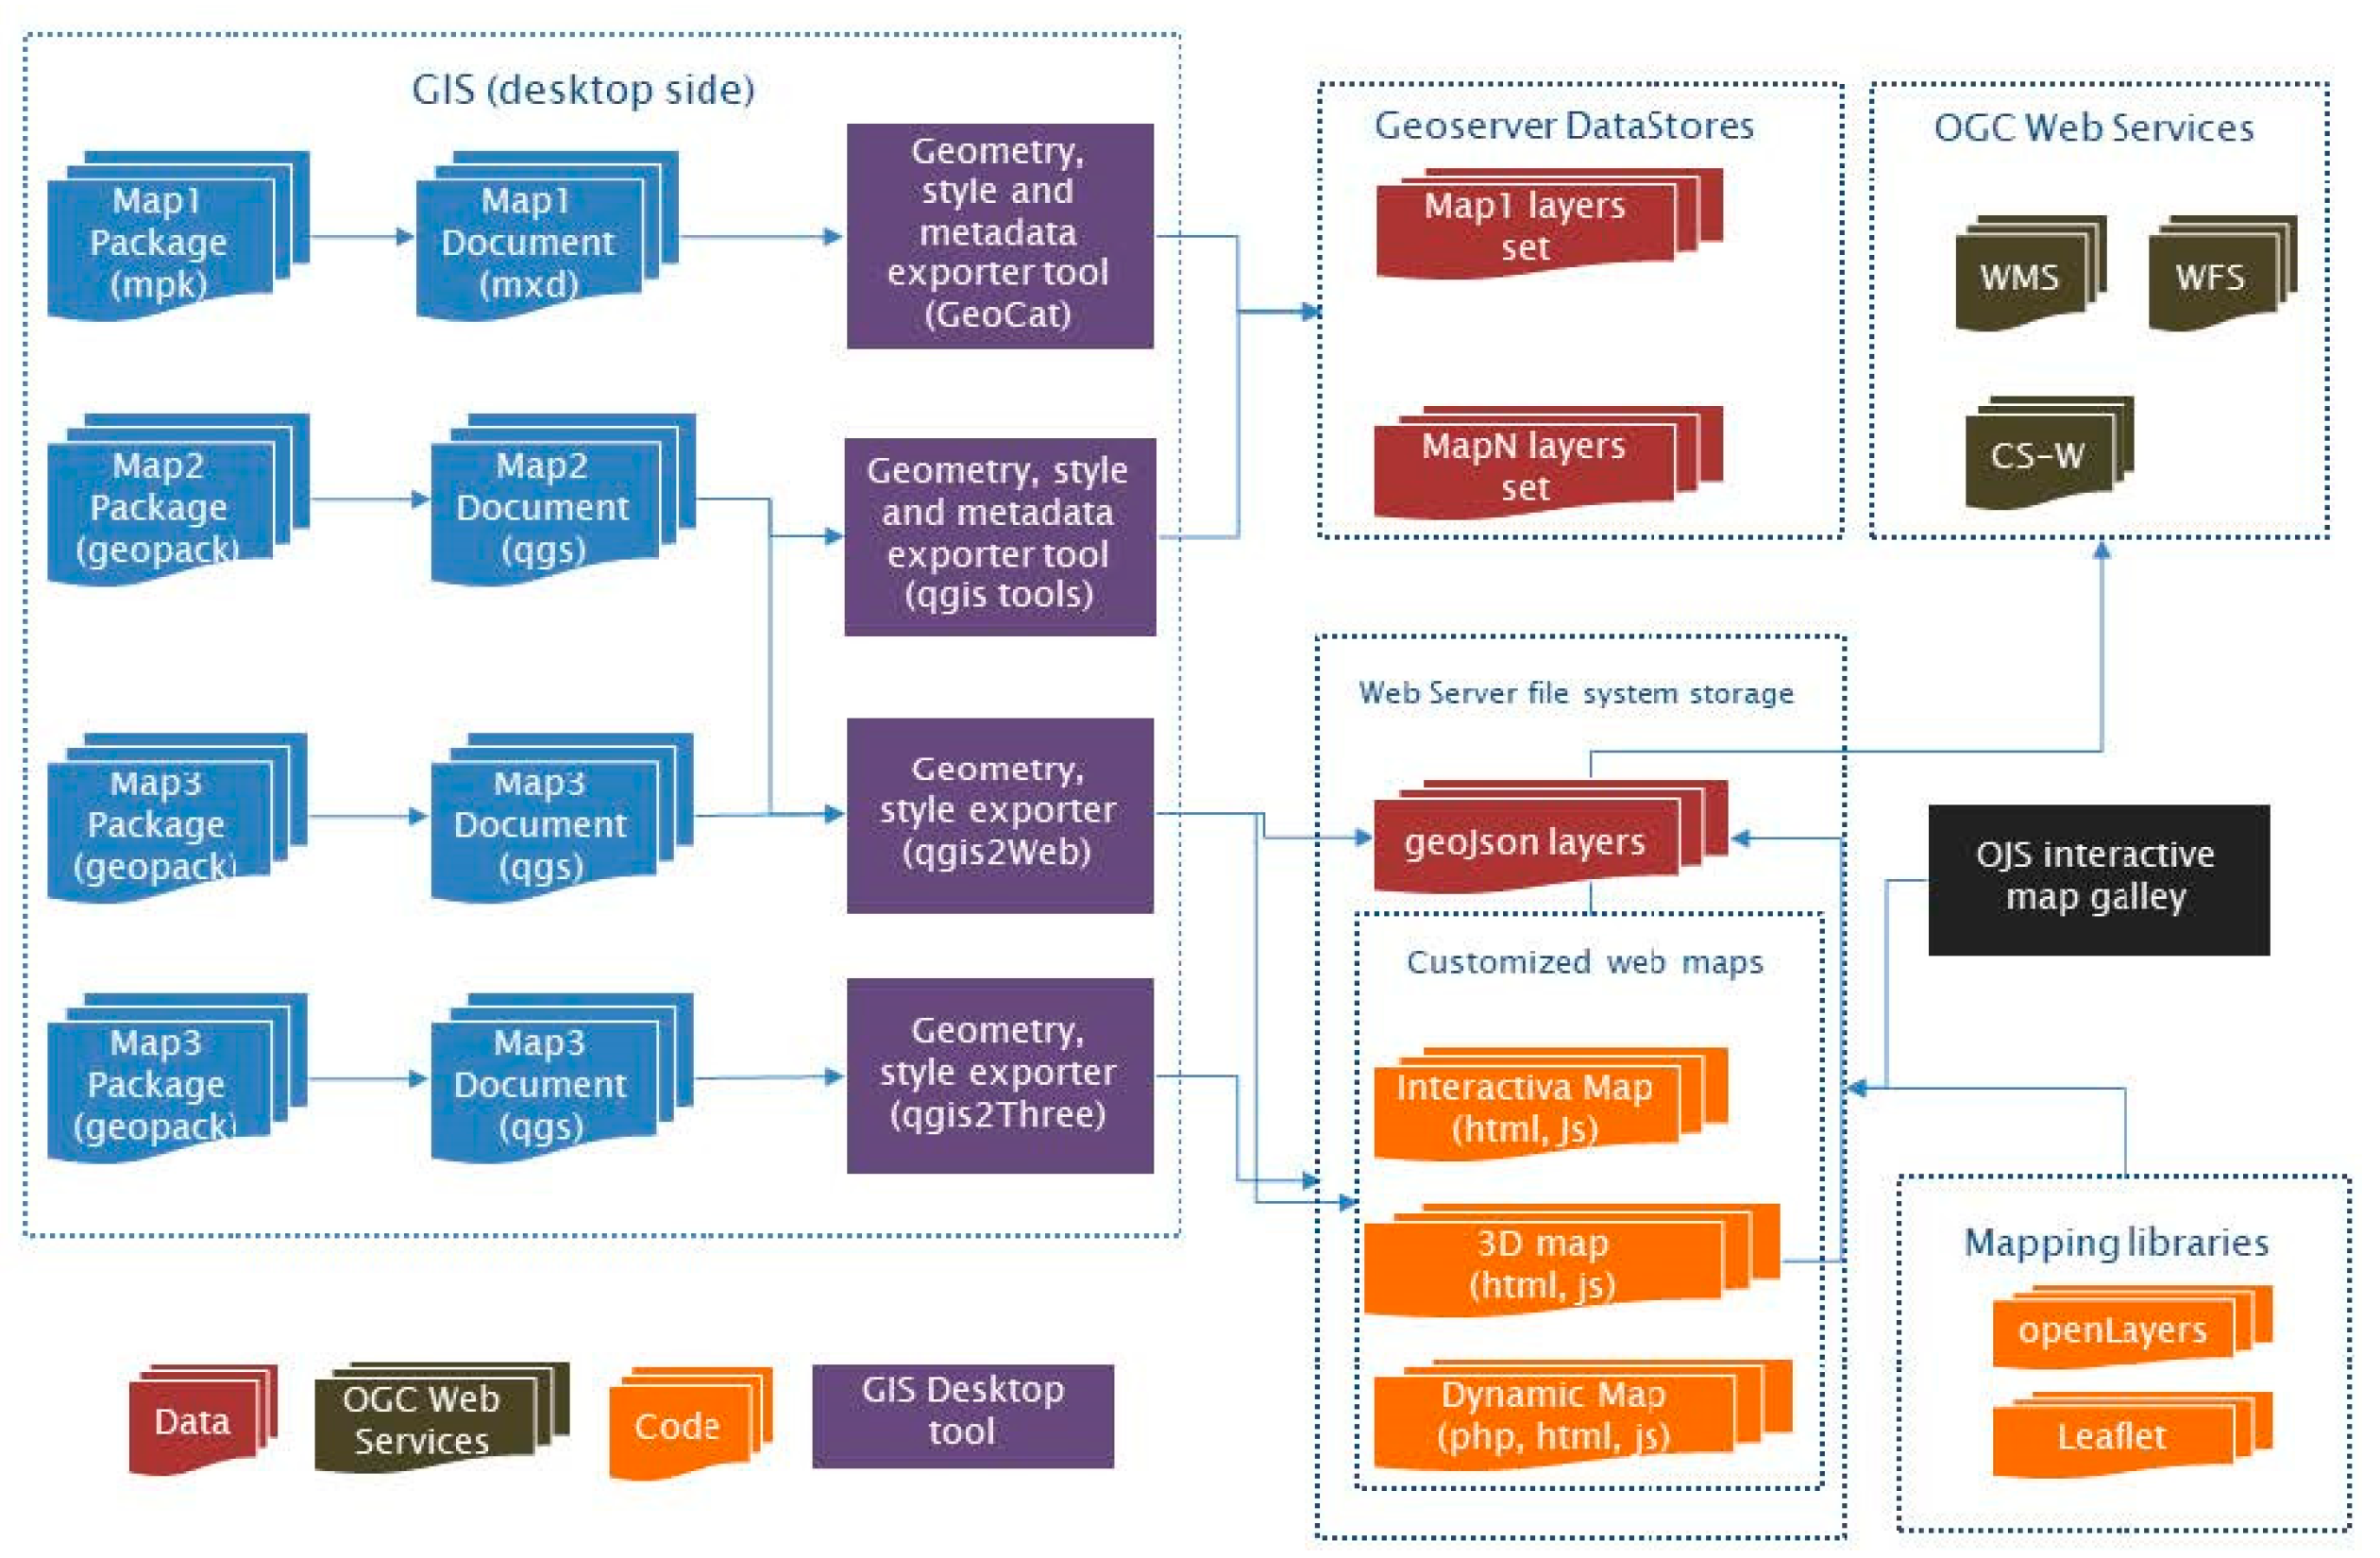
Figure 5.
Service-oriented architecture (SOA) for online publication in the Terra Digitalis platform.
Figure 5.
Service-oriented architecture (SOA) for online publication in the Terra Digitalis platform.
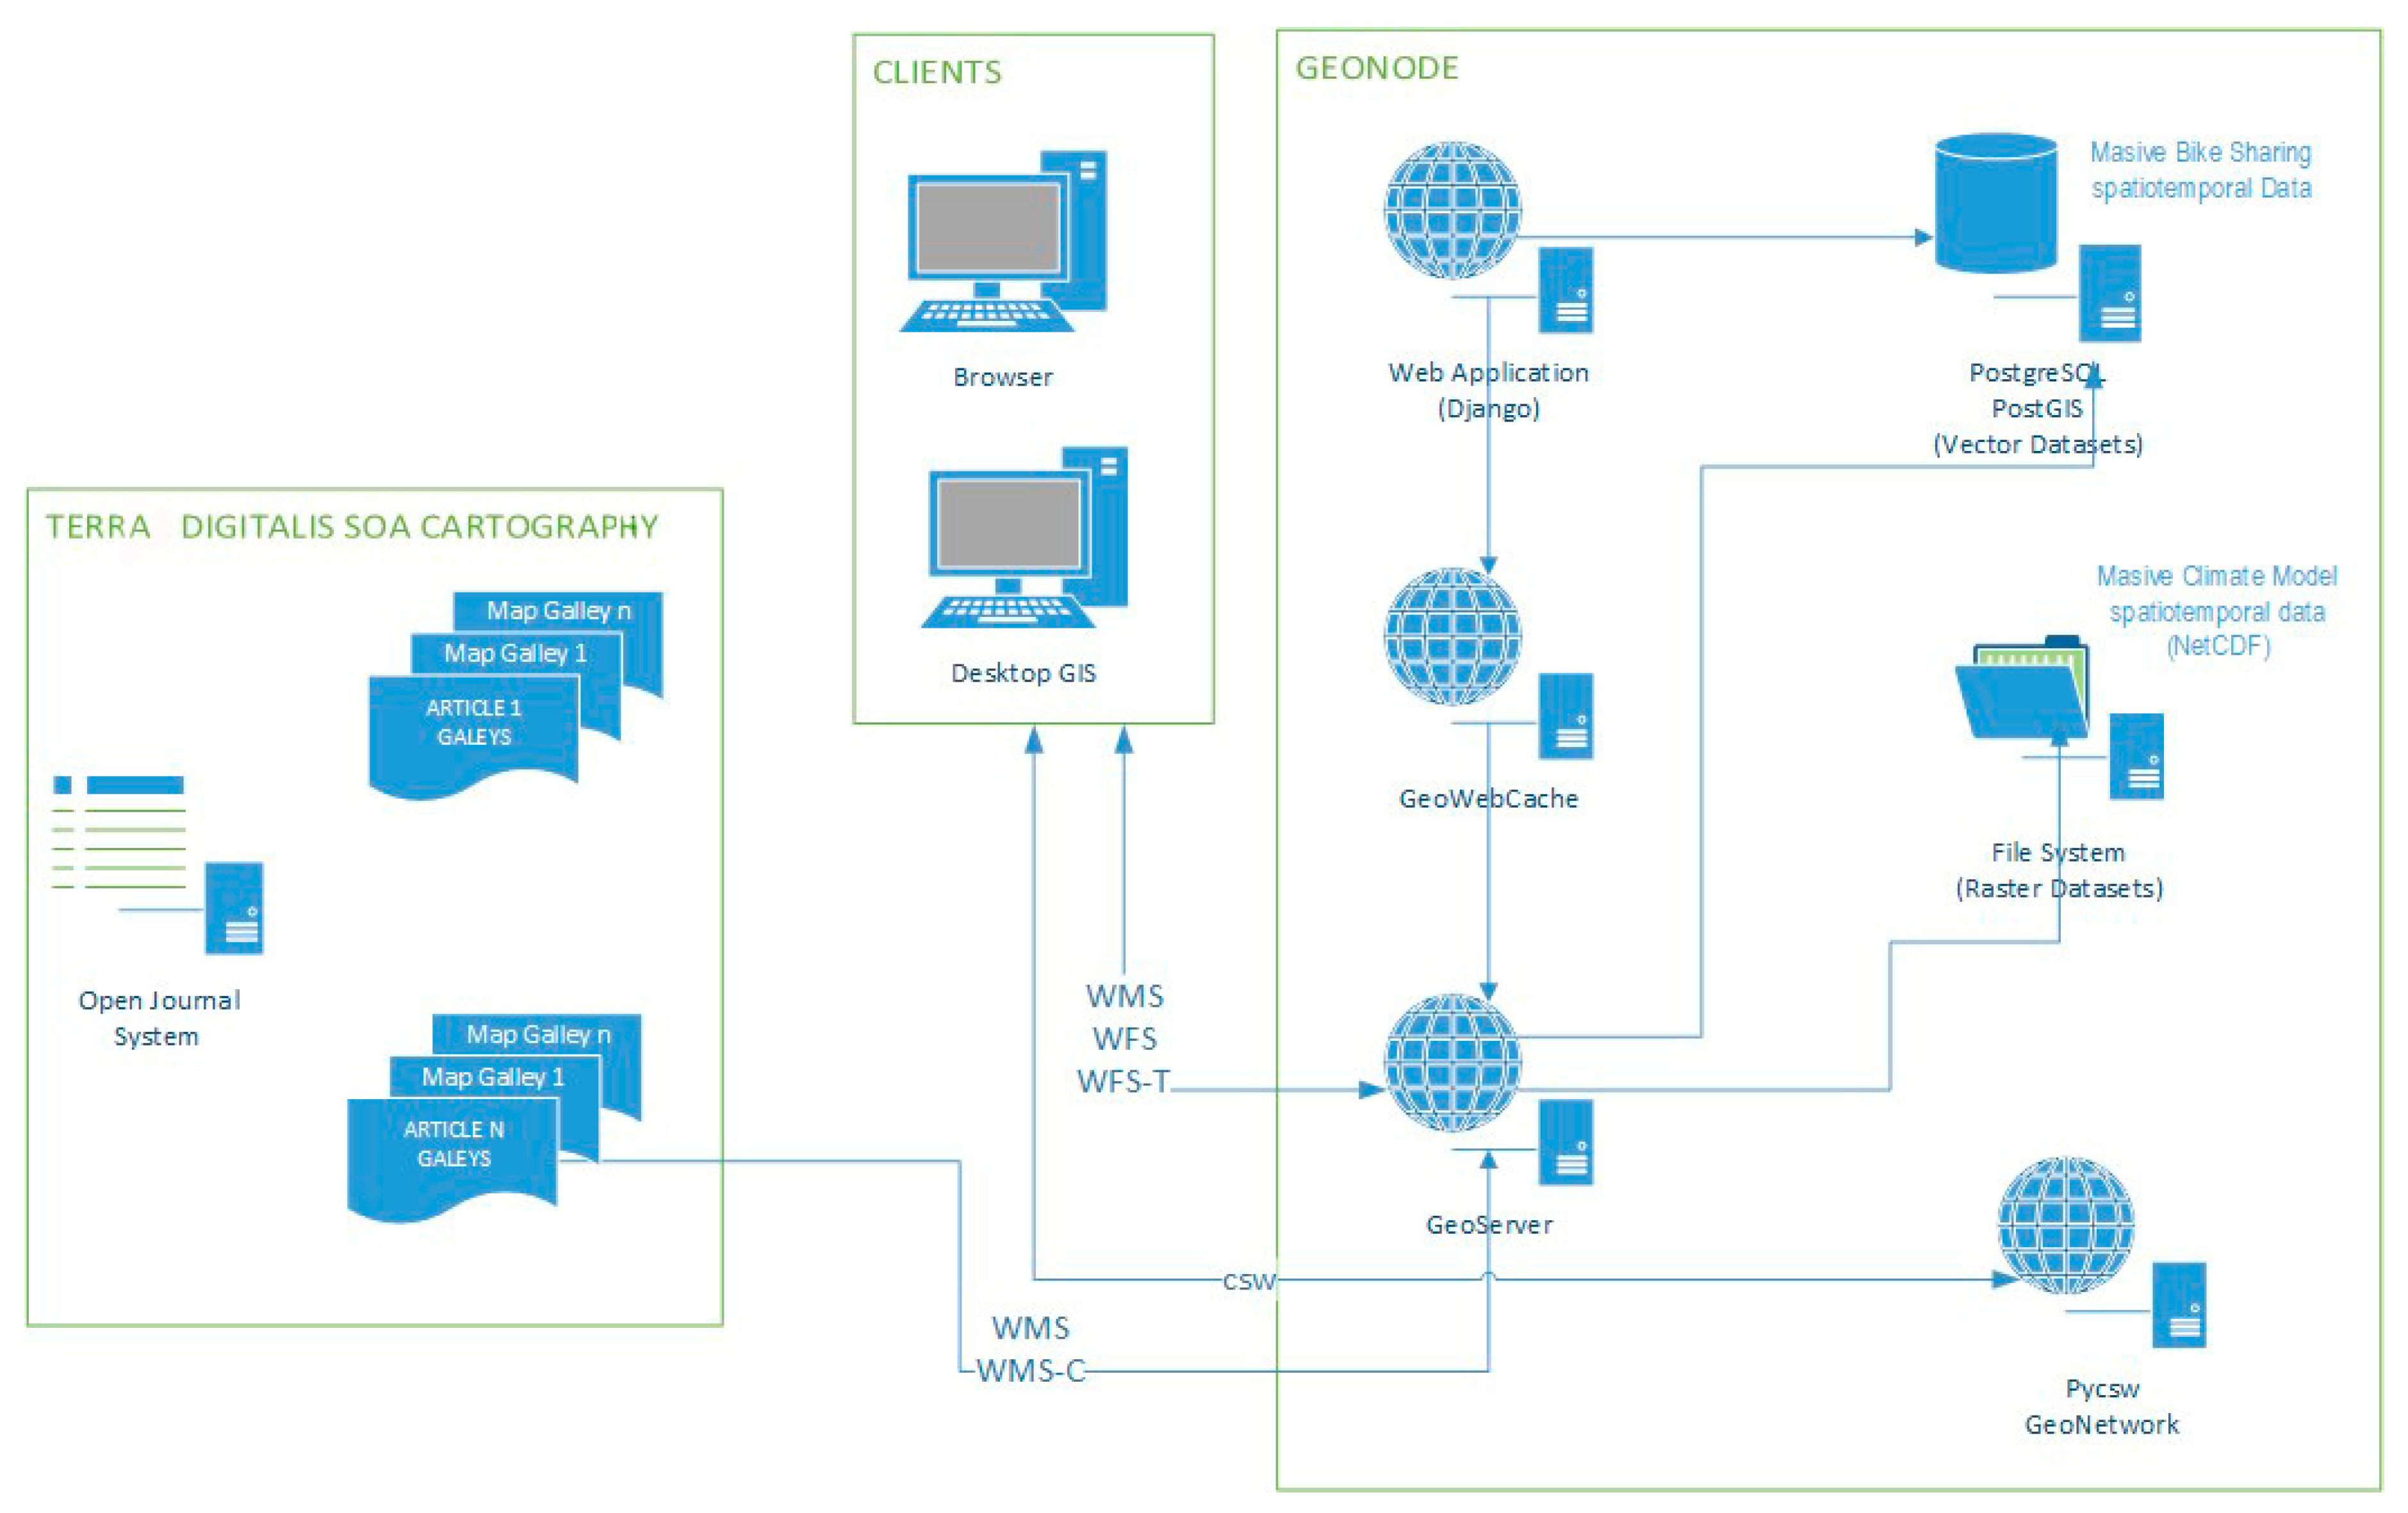
Figure 6.
Dynamic visualization of massive spatiotemporal Raster data. These data refer to the numerical climate model in Mexico hosted in the VISTA-C online platform (vista-c.igg.unam.mx). A compressed view of the spatiotemporal dynamics of the numerical climate model can be accessed here. The article referring to this work is accessible in volume 3, issue 1 of the Terra Digitalis journal.
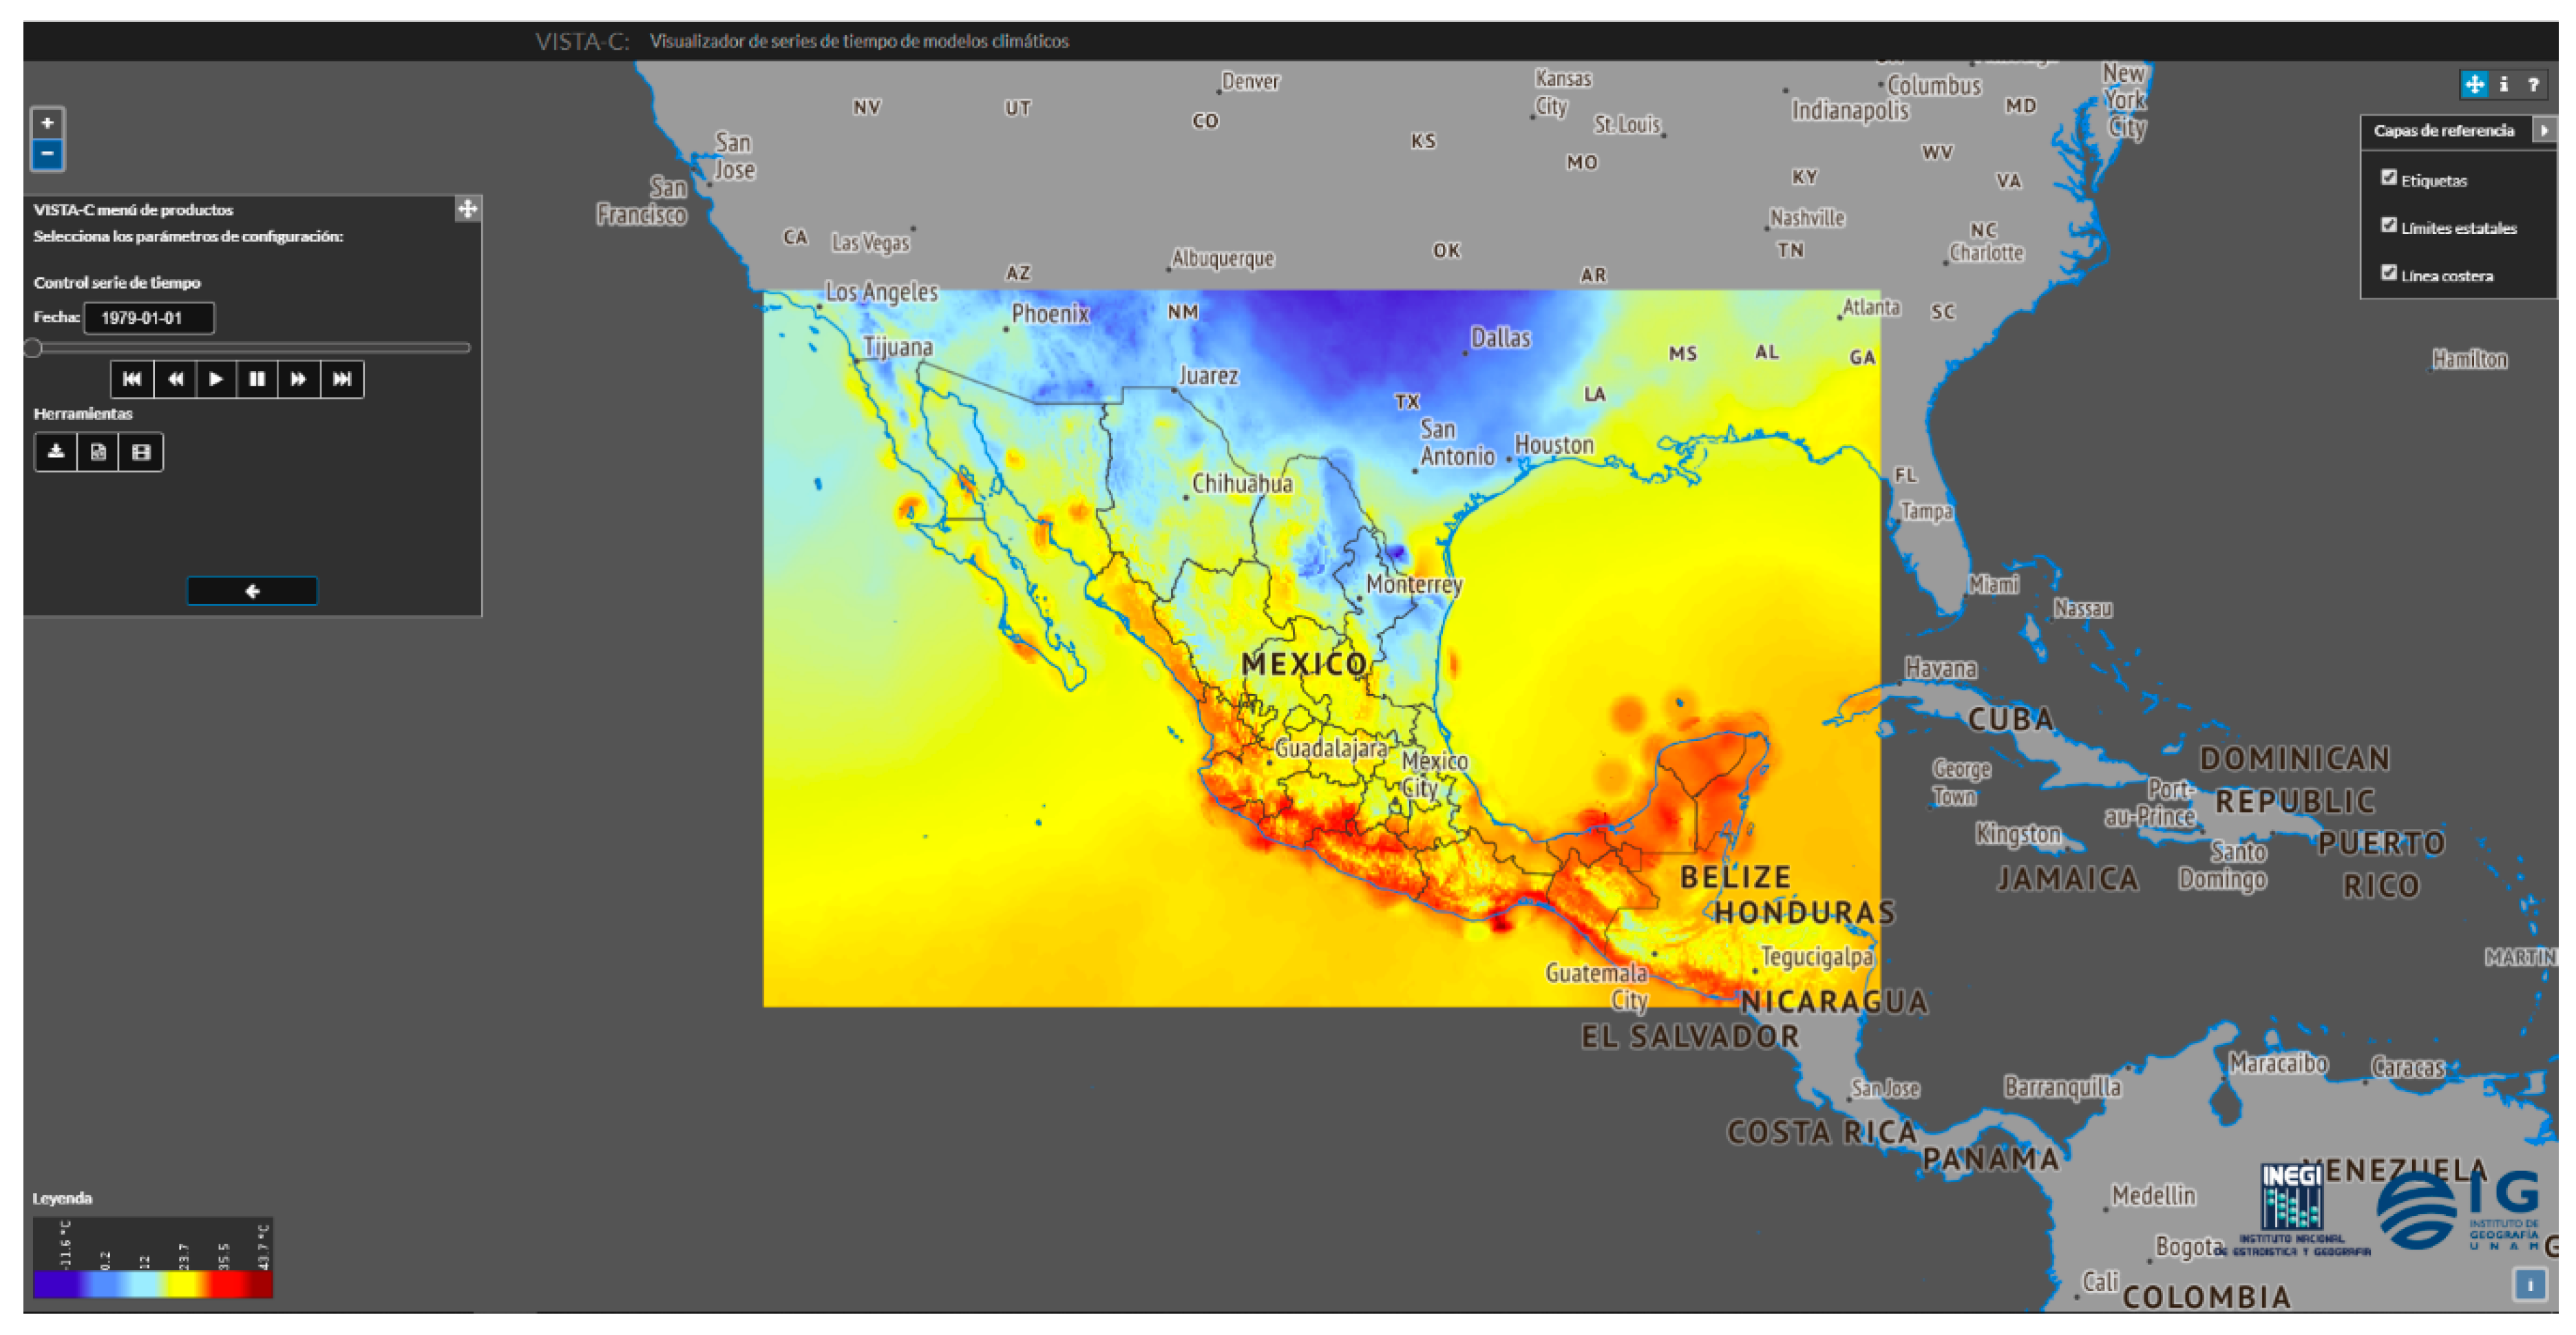
Figure 7.
Dynamic visualization of massive spatiotemporal Vector data. This is a composed video of the spatiotemporal dynamics of the arrival and departure events in the stations of the Mexico City bike sharing system (accessible here). The article referring to this work is in volume 3 issue 2 of the Terra Digitalis journal.
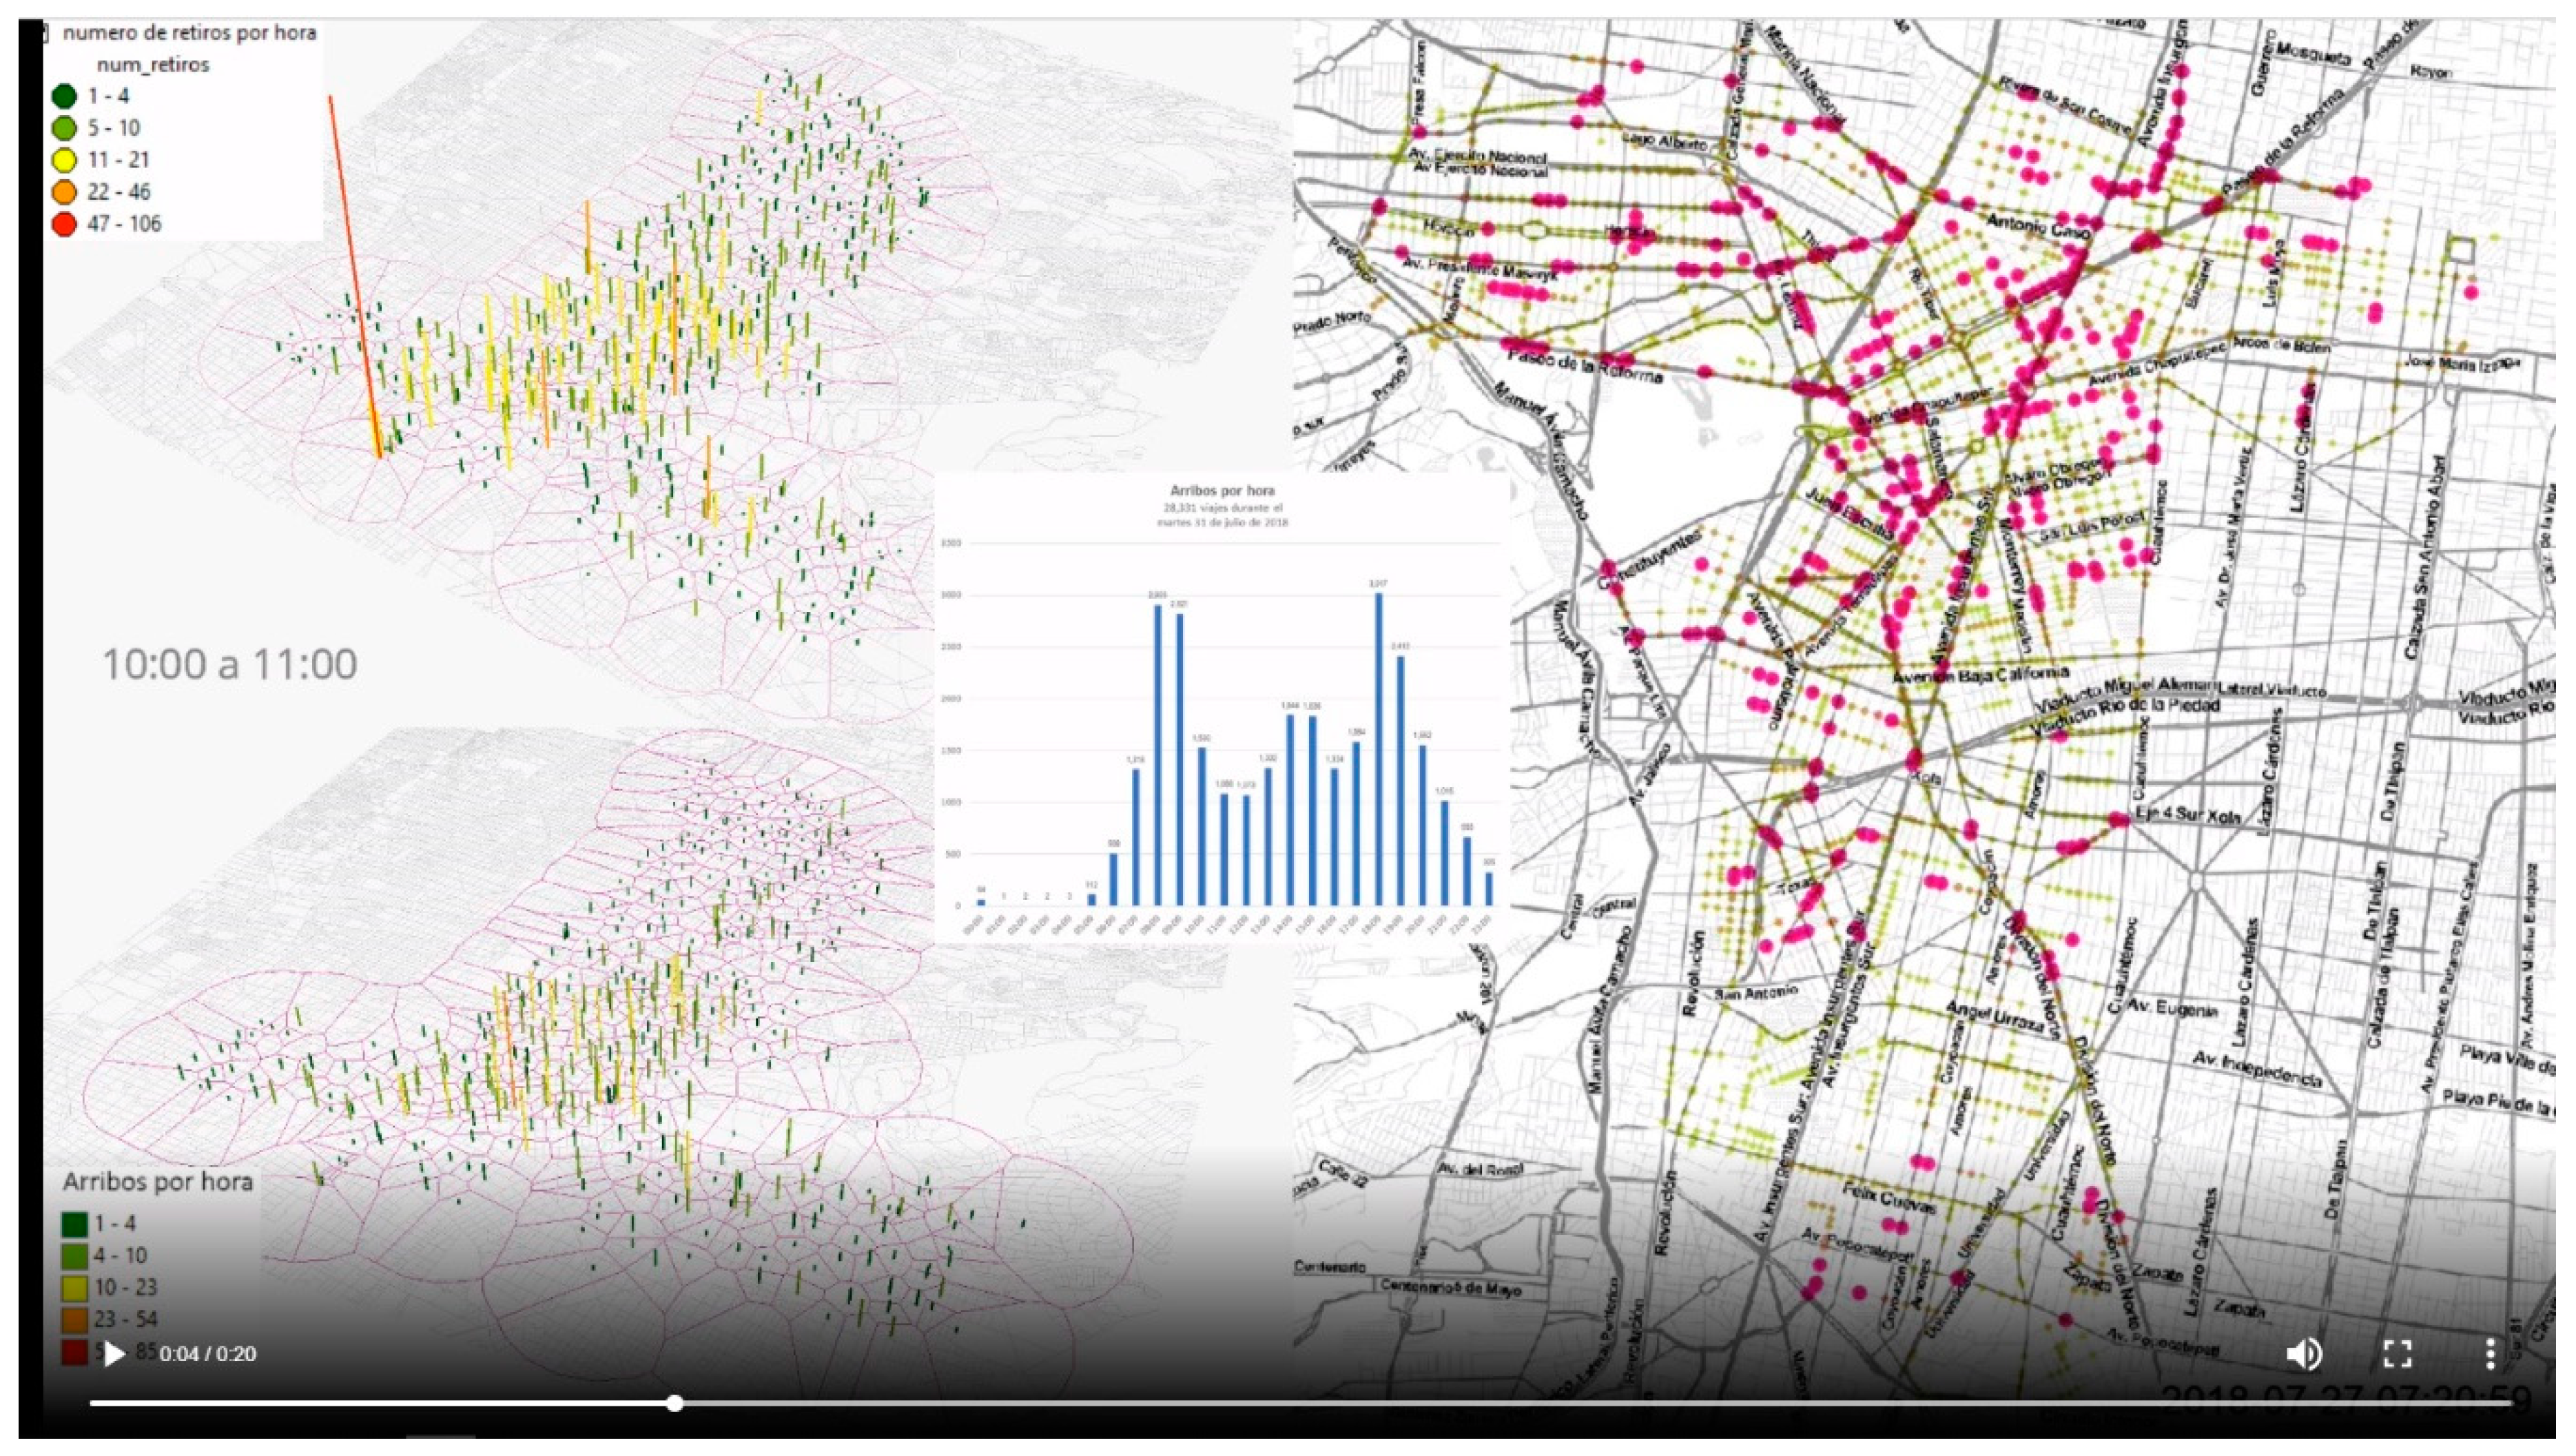
Figure 8.
The “Peer-reviewed cartographic cube” proposed in this research for the era of Artificial Intelligence, with instances of online cartographic products for the visualization of geospatial data. This cube builds upon the well accepted McEachren cubic representation of Cartography [11] (see Figure 1). A vast majority of cartographic journals are positioned towards the "Communication" direction along the double-arrowed "visualization - communication" diagonal, with low FAIR characteristics. Most of them are situated in the "Static map" area. Journals linked to the Geofacets platform (Elsevier Publisher) may reach the "3D / dynamic map" area. By contrast, the Terra Digitalis journal is situated towards the "Visualization" direction, in the "Interactive map / story map" area, offering high FAIR characteristics.
Disclaimer/Publisher’s Note: The statements, opinions and data contained in all publications are solely those of the individual author(s) and contributor(s) and not of MDPI and/or the editor(s). MDPI and/or the editor(s) disclaim responsibility for any injury to people or property resulting from any ideas, methods, instructions or products referred to in the content. |
© 2024 by the authors. Licensee MDPI, Basel, Switzerland. This article is an open access article distributed under the terms and conditions of the Creative Commons Attribution (CC BY) license (https://creativecommons.org/licenses/by/4.0/).
Copyright: This open access article is published under a Creative Commons CC BY 4.0 license, which permit the free download, distribution, and reuse, provided that the author and preprint are cited in any reuse.


