
Submitted:
26 July 2024
Posted:
29 July 2024
You are already at the latest version
Abstract
Traffic anomaly detection is crucial for urban management, yet current research is often confined to small-scale endeavors. This study collected nine months of real-time Wuhan traffic monitoring data from Amap. We proposed Traffic-ConvLSTM, a multi-scale spatial-temporal technique based on long and short-term memory networks (LSTM) and convolutional neural networks (CNN) to effectively achieve long-term anomaly detection at the city level. First, we convert the traffic flow data into image representation, which enables the capture of the spatial correlation between traffic flow and roads and the correlation between traffic flow and roads, as well as the surrounding environment. Second, The model utilizes convolution kernels of different sizes to extract spatial features at road-level, regional-level, and city-level scales, while incorporating temporal features of different time steps to capture hourly, daily, and weekly dynamics. Additionally, varying weights are assigned to the convolution kernels and temporal features of varying spatio-temporal scales to capture the heterogeneous strengths of spatio-temporal correlations within patterns of traffic anomalies. The proposed Traffic-ConvLSTM model exhibits improved performance over existing techniques in the task of identifying long-term and large-scale traffic anomaly occurrences. Furthermore, the analysis reveals significant traffic anomalies during holidays and urban sporting events. The diverse travel patterns observed in response to various activities offer insights for large-scale urban traffic anomaly management, providing recommendations for city-level traffic control strategies.
Keywords:
traffic anomalies
; real-time traffic data
; deep learning
; artificial intelligence
; multiple spatio-temporal scales
1. Introduction
Traffic congestion has become an increasingly serious problem with the continuously increasing global urbanization. Previous studies have shown that abnormal traffic congestion is the leading cause of large-scale traffic congestion [3]. However, for a long time, the transportation field has focused more on prediction and optimization under normal conditions. Anomalous traffic events receive comparatively little attention. Thus, timely identification of abnormal traffic congestion is necessitated, as it helps prevent the escalation of traffic issues into large-scale problems, thereby mitigating urban congestion and improving overall traffic conditions in the city.
Traffic anomalies currently lack a clear and unified definition. For large cities with stably developed urban forms, urban activities tend to show regular spatial patterns and time cycles. Consequently, the traffic flows generated by these activities inherit similar spatial and temporal patterns, resulting in traffic events with predictable periodic characteristics. In this paper, we define periodic and predictable traffic patterns as the normal traffic events of the city. These events may be the congestion of a certain hot road during the peak commuting hours, the steady flow of traffic on the city ring road, or the long-lasting smoothness of a certain section of the highway. We can easily predict the next congestion’s moment, duration, and location. Conversely, traffic anomalies deviate from these normal patterns in daily urban flows. These anomalous events are influenced by various factors such as spatial location, environment, time, and participants’ subjective perceptions. They exhibit significant variations in occurrence patterns, duration, and spatial extent, lacking the spatial and temporal periodicity characteristic of normal traffic patterns. Consequently, these anomalies are particularly challenging to predict accurately.
Previous approaches for detecting anomalies in traffic flow can be broadly categorized into three groups: time series, tensor decomposition, and deep learning-based methods. The time series approach mainly utilizes the Autoregressive Integrated Moving Average (ARIMA) model and its variants [5,6,7]. These methods focus on the temporal aspects of traffic flow but often overlook spatial characteristics, leading to suboptimal results. The tensor decomposition method [8,9,10] can effectively capture spatio-temporal abnormalities, but their performance is susceptible to complex parameter settings, with improper configurations easily compromising analysis accuracy. In recent years, researchers have increasingly turned to deep learning-based methods for traffic anomaly detection, inspired by the remarkable success of deep learning in computer vision and other domains. Unlike traditional parameter-based methods, deep learning models extract intrinsic features from vast raw data using a multi-layer network architecture. Several studies [11,12,13] aimed to directly extract normal traffic patterns from key features of the original data to predict traffic flow. In some other works, they combined convolutional neural networks and long short-term memory networks with an attention mechanism to build hybrid deep learning models [14,15,16,17,18,19] that allow a comprehensive analysis of the spatio-temporal characteristics in the data. Overall, these models strive to improve the understanding and interpretation of spatio-temporal relationships in traffic flow data, addressing the fundamental challenges in traffic anomaly detection.
However, current research on traffic anomaly detection is predominantly limited to specific road segments or small areas, focusing on short-term fluctuations rather than addressing urban-scale patterns over longer periods. It would potentially compromise the ability of models to capture the full complexity of diverse traffic patterns and anomalies across different urban contexts. To address this gap, we collected nine months of real-time Wuhan traffic monitoring data from Amap. To effectively achieve long-term anomaly detection at the city level, we proposed Traffic-ConvLSTM, a multi-scale spatial-temporal technique based on long and short-term memory networks (LSTM) and convolutional neural networks (CNN). In this study, the main contributions could be summarized as follows:
- We have developed a data processing algorithm that converts low-frequency trajectory data into an image-like data structure for further analysis.
- To effectively identify traffic anomaly patterns at multiple temporal and spatial scales, we propose an improved ConvLSTM [20], and results show that the model can effectively identify traffic anomalies with a case study in Wuhan.
2. Related Work
As previously mentioned, the primary methods include the time series approach, tensor decomposition technique, and deep learning strategy.
The time series method, which is the most commonly used, is grounded in the autoregressive integral moving average model. As a classic time series prediction model, ARIMA model is applied to the anomaly identification of highways and urban arterial roads [21,22]. Various improvements to the ARIMA model have been proposed to enhance the performance and scope of the application. For instance, the KARIMA model, which combines the Kohonen network with the ARIMA model [5], and the ARIMAX model, which integrates the ARIMA model with explanatory variables [7], are examples of such improvements. Additionally, a unified spatio-temporal model based on the spatio-temporal autoregressive integrated moving average (STARIMA) has been proposed to capture road traffic’s intricate spatio-temporal correlation structure [6]. These advancements aim to address the ARIMA model’s inherent limitations, such as its inability to handle nonlinear data and disregard for spatial information
The tensor decomposition methodology aims to develop an effective time series model that captures the inherent spatio-temporal pattern, transforms traffic data into high-dimensional vectors, and identifies anomalies by calculating good feature numbers. Presently, tensor decomposition-based traffic anomaly pattern recognition approaches are categorized into two groups: methods based on feature factors [8,9] and methods based on reconstruction errors [10]. The method based on feature factors decomposes the original data, compares it with historical data, and identifies any values exceeding a predetermined threshold as anomalies [8]. On the other hand, the method based on reconstruction errors asserts that traffic data can be separated into typical urban activities and disturbances caused by anomalies. By extracting the abnormal tensor from the traffic data, the time and location of the anomalous events can be determined, and the events can be further analyzed [23].
Deep learning techniques can be broadly applied in traffic anomaly detection, divided into two stages. Early researchers aimed to extract features from traffic flow data in order to identify anomalous patterns directly. Various methods, such as stacked autoencoders (SAE) [11], long and short-term memory networks (LSTM) [12], and convolutional neural networks (CNN), have been proposed to analyze traffic flow data [13]. However, these methods utilize a relatively simple network structure, making it challenging to effectively leverage the intricate space-time relationships present in traffic flow data. As a result, their ability to detect anomalous traffic patterns is limited. Subsequent work has sought to integrate the characteristics of convolutional methods and recurrent neural networks. These models capture the spatial characteristics of traffic flow in a region using convolutional neural networks and then transfer the extracted features to LSTM networks to extract temporal characteristics. This allows for creating a hybrid deep learning model with an attention mechanism [14,15,16] that comprehensively analyzes the spatio-temporal features in the data. Other work has attempted to capture the spatial features in the data using generative adversarial networks (GAN) [17,18,19], which has greatly improved the model’s practicality and detection accuracy. However, abnormal traffic pattern recognition is a complex task that differs from ordinary classification tasks. It is influenced by various factors, including spatial location, environment, time, and participants’ subjective feelings, making it challenging for researchers to define abnormal traffic events accurately. Drawing inspiration from previous work on anomaly detection and video frame prediction in surveillance videos [20,25,26,27,28,29,30,31], we developed the Traffic-ConvLSTM model. This unsupervised ConvLSTM model learns normal traffic patterns from daily traffic flow and identifies abnormal traffic patterns based on this information. Unlike existing work, the model employs a variable convolution kernel to extract features of traffic events at different spatial scales, and matches the temporal scale of the events with the spatial scale to analyze the spatio-temporal features of the events in an integrated manner. This enables the model to capture multi-scale spatial features and time cycle characteristics while maintaining the robustness of the model at each time and space scale.
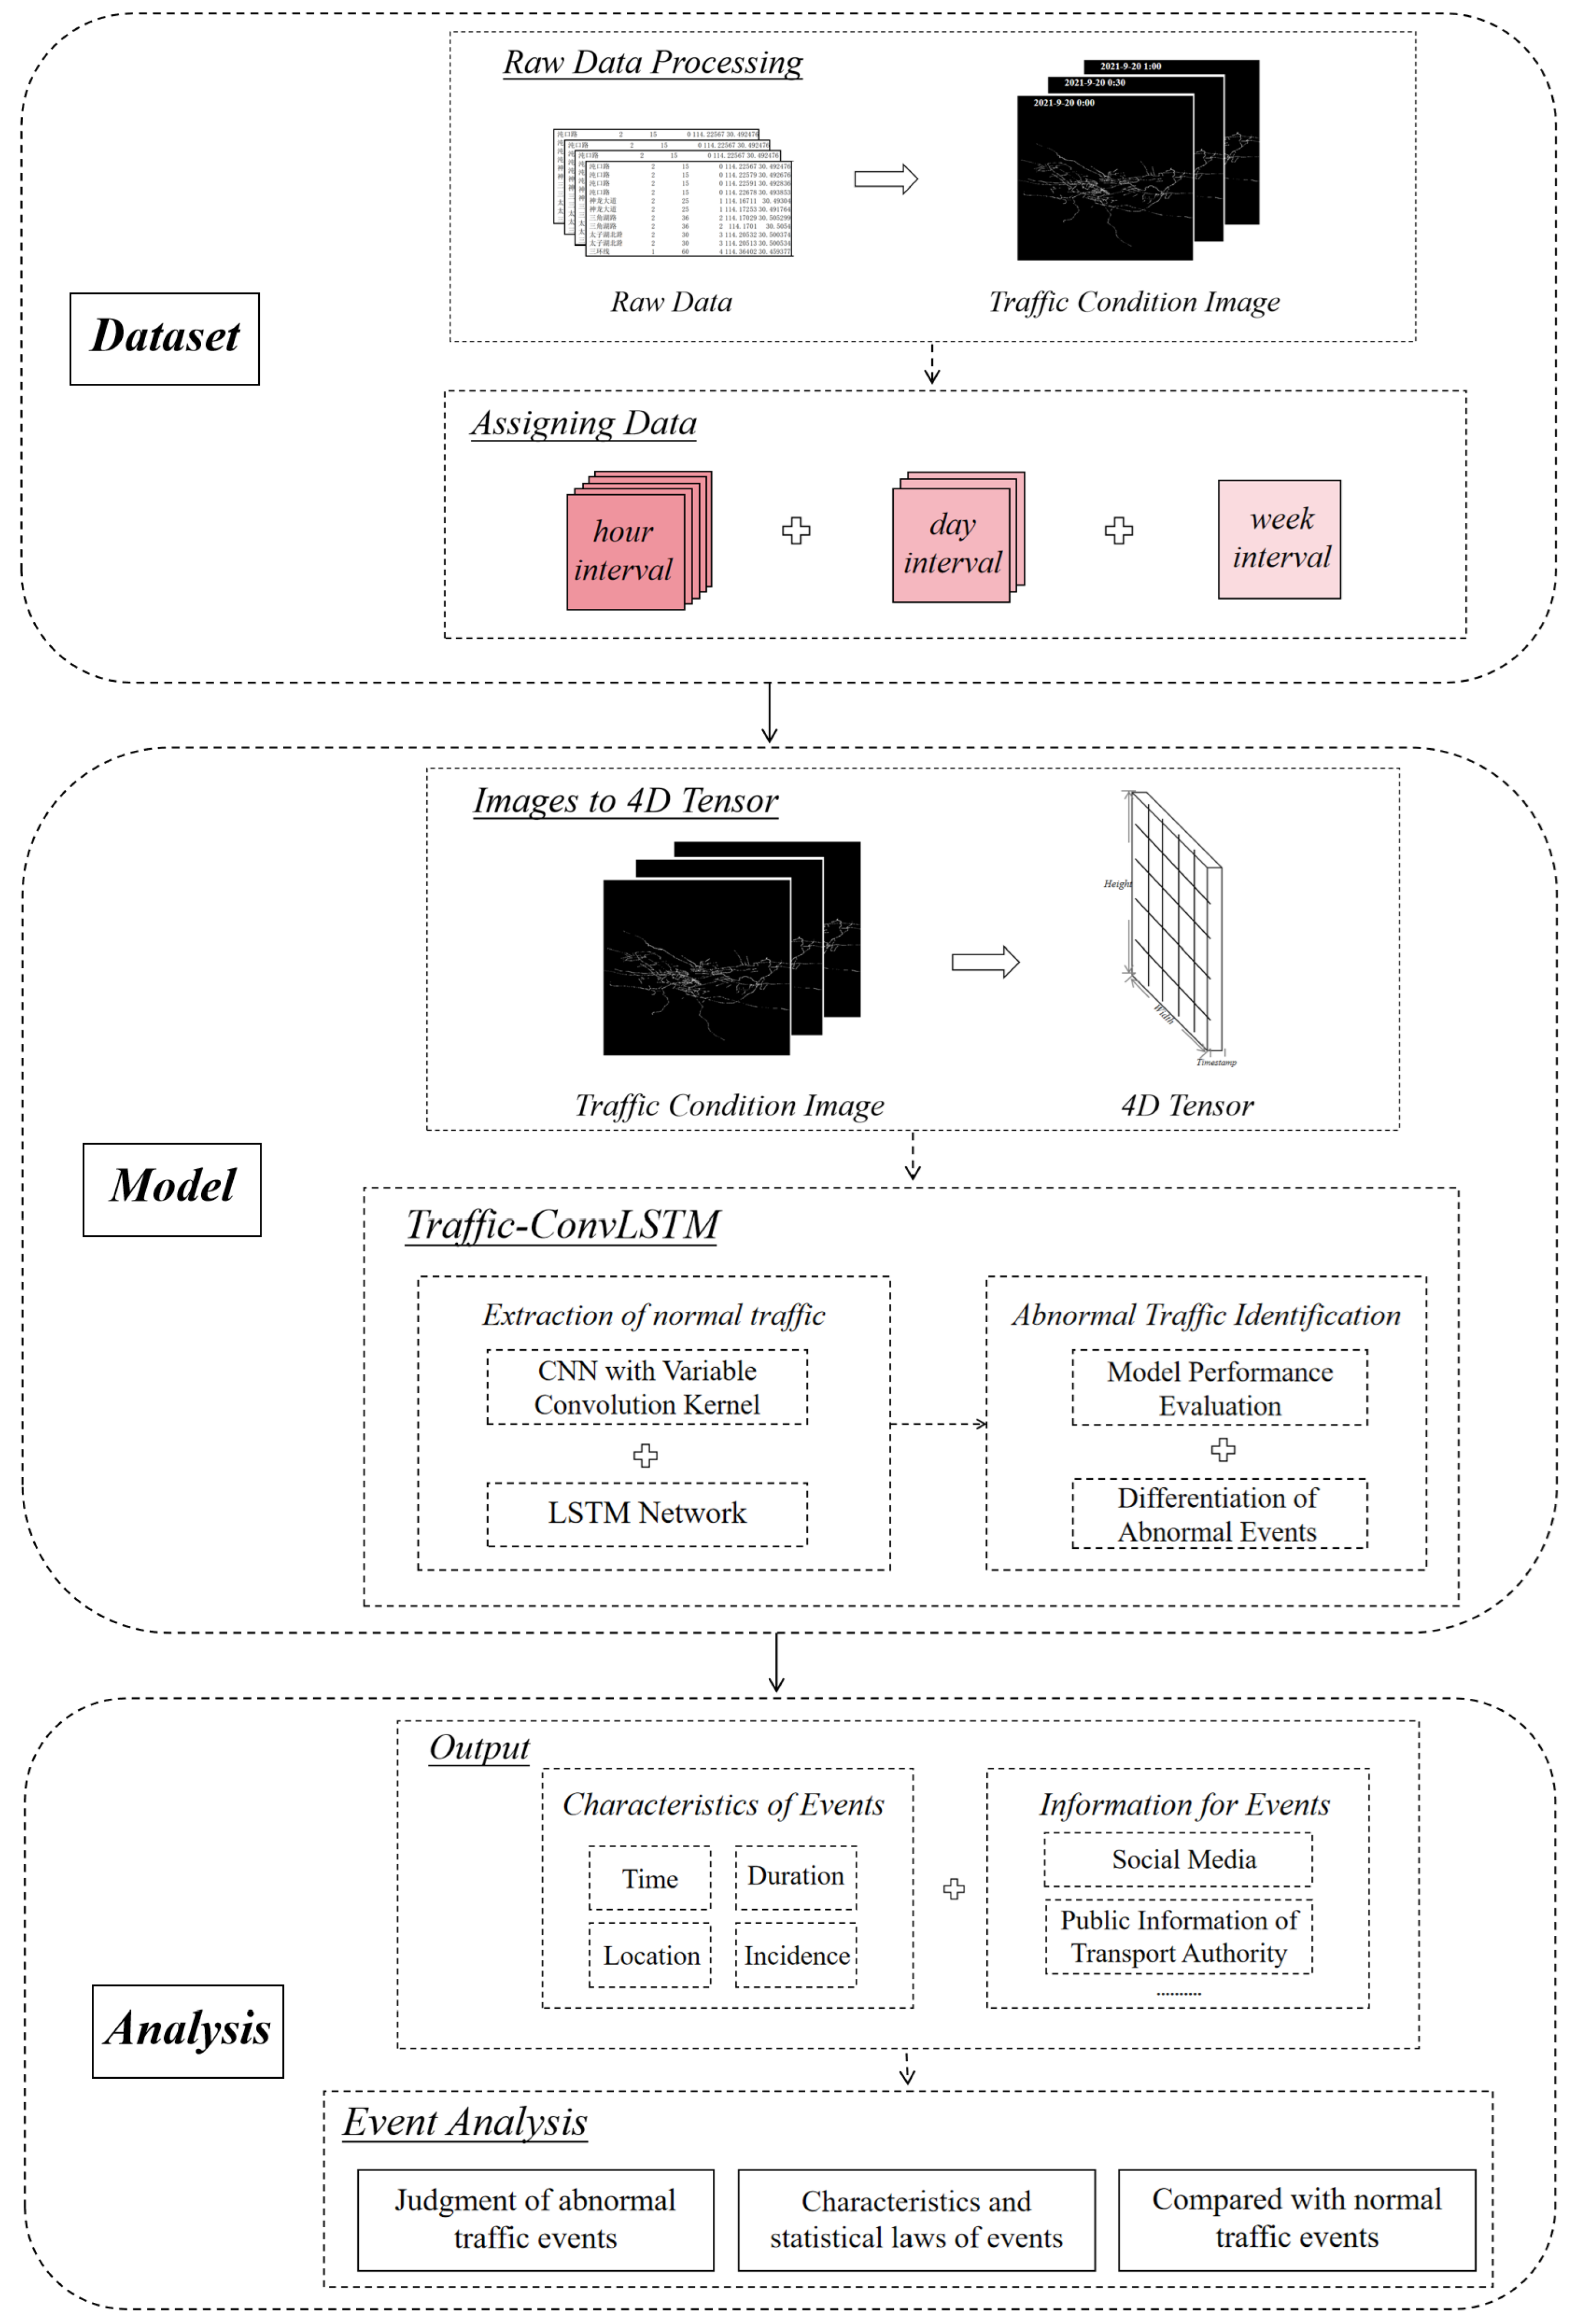
Figure 1.
Overview of urban traffic anomalies detection and analysis framework.
3. Data and Method
Traditional traffic flow data has many deficiencies in expressing the spatial and temporal characteristics of traffic events. To better extract the features of traffic events, we transform the traffic flow data into a traffic condition image according to certain rules. Based on the traffic condition image model, we will learn the features of the normal traffic pattern and then realize the detection of abnormal traffic events.
3.1. Data Description and Preprocessing
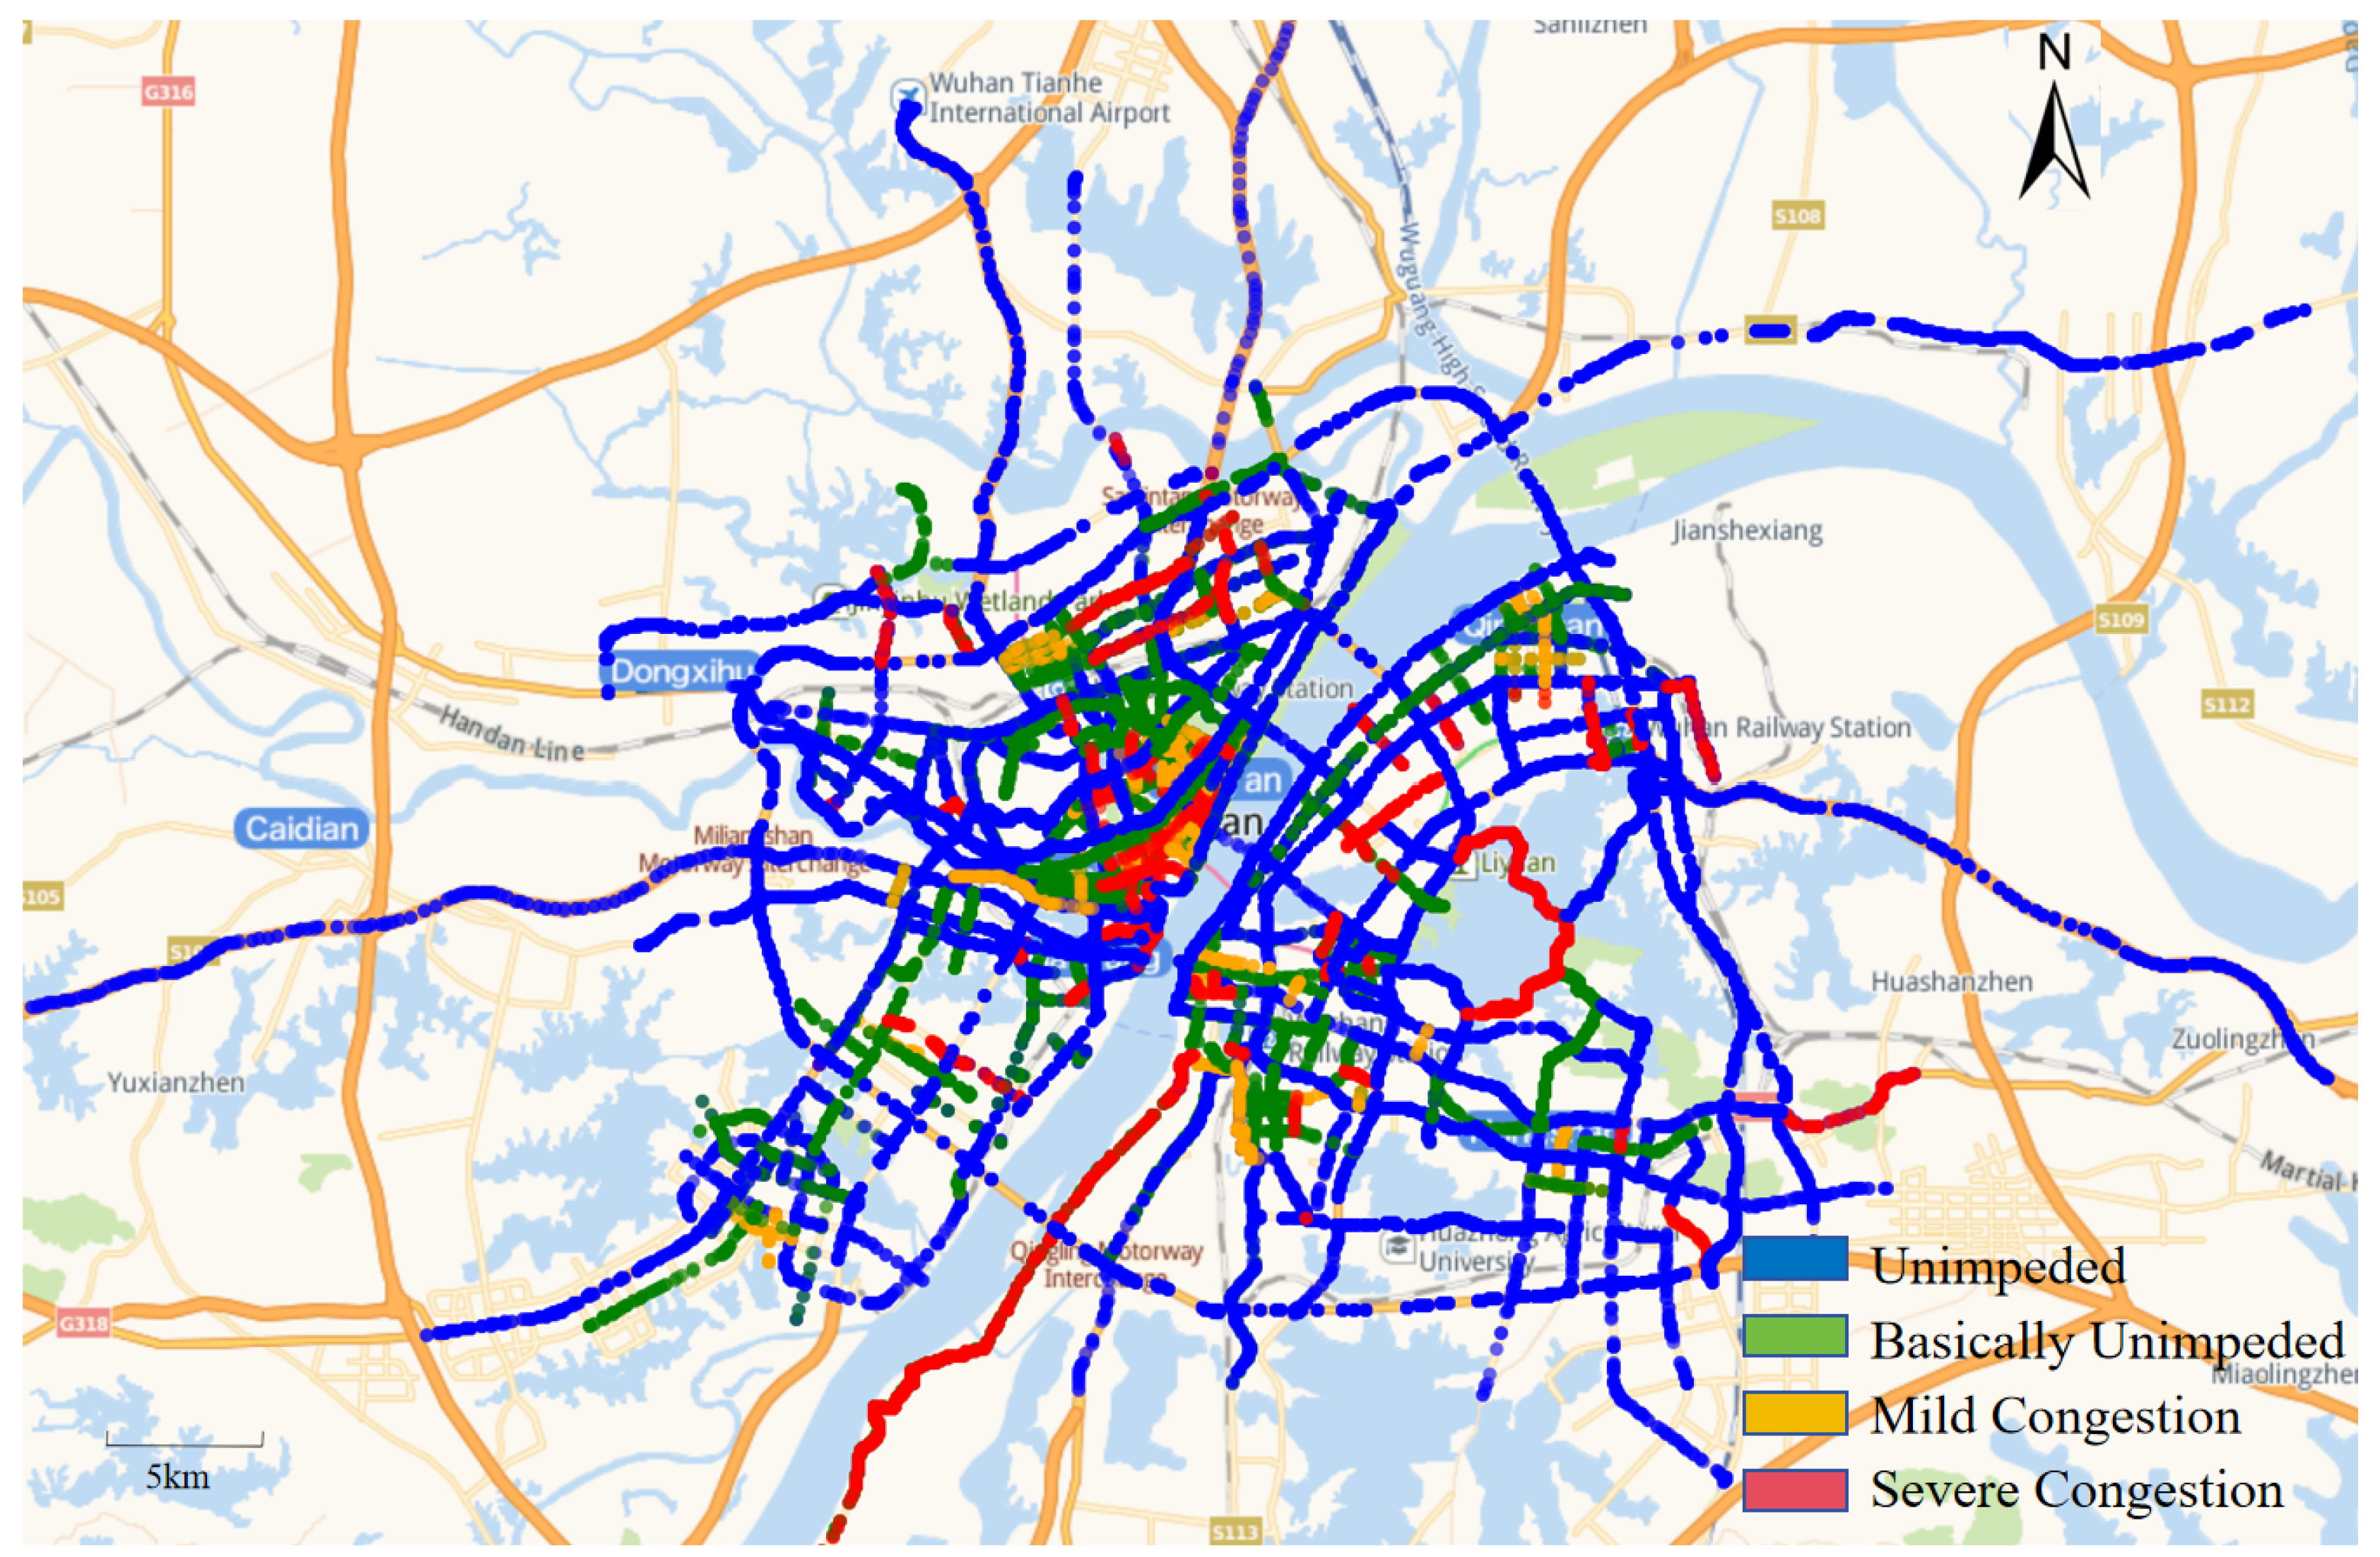
From September 20, 2021 to June 17, 2022, we collected real-time traffic data of the main roads in Wuhan by using Amap API. The coverage of the data is shown in Figure 2. The spatial range of the sampling points is -N and -E. The dataset is uniformly sampled every half an hour in Wuhan, and about 60000 real-time traffic data are obtained each time, amounting to approximately 60 million records over the study period. As shown in Table 1, the data set details include sampling time, road section, speed, longitude, and latitude of the vehicle.
Figure 2.
Real-time traffic data collection area.
In order to address the scarcity of trajectory point data needed to convey the spatio-temporal characteristics of traffic flow, it is crucial to preprocess the raw data to accommodate subsequent analytical methods. A considerable number of studies [13,17,18,24] have demonstrated the effectiveness of converting trajectory points into images to capture the spatial characteristics of traffic flow in deep learning techniques. This paper proposes an algorithm that maps the original traffic data to a traffic image, which is the input for deep-learning methods
We divide the study area into square grid cells; the side length of the grid cells is , which is marked as , where , , and roads in the study area are denoted as . The pixel values of the traffic condition images(TCI) are calculated as follows:
where is the speed of the track point, is the road speed, which represents the average of the speeds of all track points on the road at a given time. is the relative road speed, which is used to characterize the level of congestion in the area in which the track point is located at that moment in time, and is the pixel value of the traffic condition images at i,j. After obtaining the traffic condition images, standard image processing techniques can be employed to resize the images to the desired dimensions.
To better learn the temporal characteristics of traffic events, we constructed three time-series with different time steps to represent the hourly, daily, and weekly temporal characteristics of traffic patterns, respectively. Generally, the impact between two events with shorter event intervals should be stronger. Therefore, we combine the three time-series in a certain ratio to construct a training set of the model to simulate the impact of different time-scale features on events in actual traffic events. In the new dataset, the hourly, daily, and weekly time series data ratio is 16:3:1.
3.2. Traffic-ConvLSTM
A number of studies have demonstrated a significant relationship between the intensity of natural events and the probability of their occurrence. Generally, when the intensity is higher, the likelihood of occurrence or the probability is lower. Therefore, we propose a hypothesis for the relationship between the event size of traffic anomalies and the frequency of events better to accomplish the task of anomalous traffic pattern recognition. Specifically, we postulate that when there is no external influence, the probability of an event decreases as its scale increases. In other words, as an event’s temporal and spatial impact expands, the likelihood of its occurrence decreases, and the time interval between events will increase. Therefore, if a traffic event extends beyond normal spatial boundaries, it is considered as an anomalous traffic event. In layman’s terms, if many people in a large neighborhood change their travel from their daily habits, then the event that causes this change to occur has a high probability of being an anomalous traffic event.
With on the above assumptions, we propose the Trafic-ConvLSTM model. It is used to learn normal traffic patterns from daily traffic flow for abnormal traffic pattern identification. The model uses three different sizes of convolution kernels to extract spatial features of traffic flow hierarchically: the largest convolution kernel is used to extract the largest city-level anomalous events, the smaller convolution kernel is used to extract the smaller regional-level anomalous events, and the smallest convolution kernel is used to extract the road-level traffic events. The spatial features at different spatial scales are extracted from the traffic condition images by different-sized convolution kernels, and the extracted spatial features are connected to the LSTM network to learn the long-time dependency in the traffic flow data. The convolutional filtering process can be represented as follows:
where is the weight of the filter, is the input traffic image at time t, is the bias, and is the output of the convolution layer. The following passage describes a method for extracting spatial features from traffic flow data.
The structure of the Traffic-ConvLSTM model proposed in this article is shown in Figure 3, and the calculation formula in the ConvLSTM layer is as follows:
Figure 3.
Traffic-ConvLSTM Modeling Structural Framework.
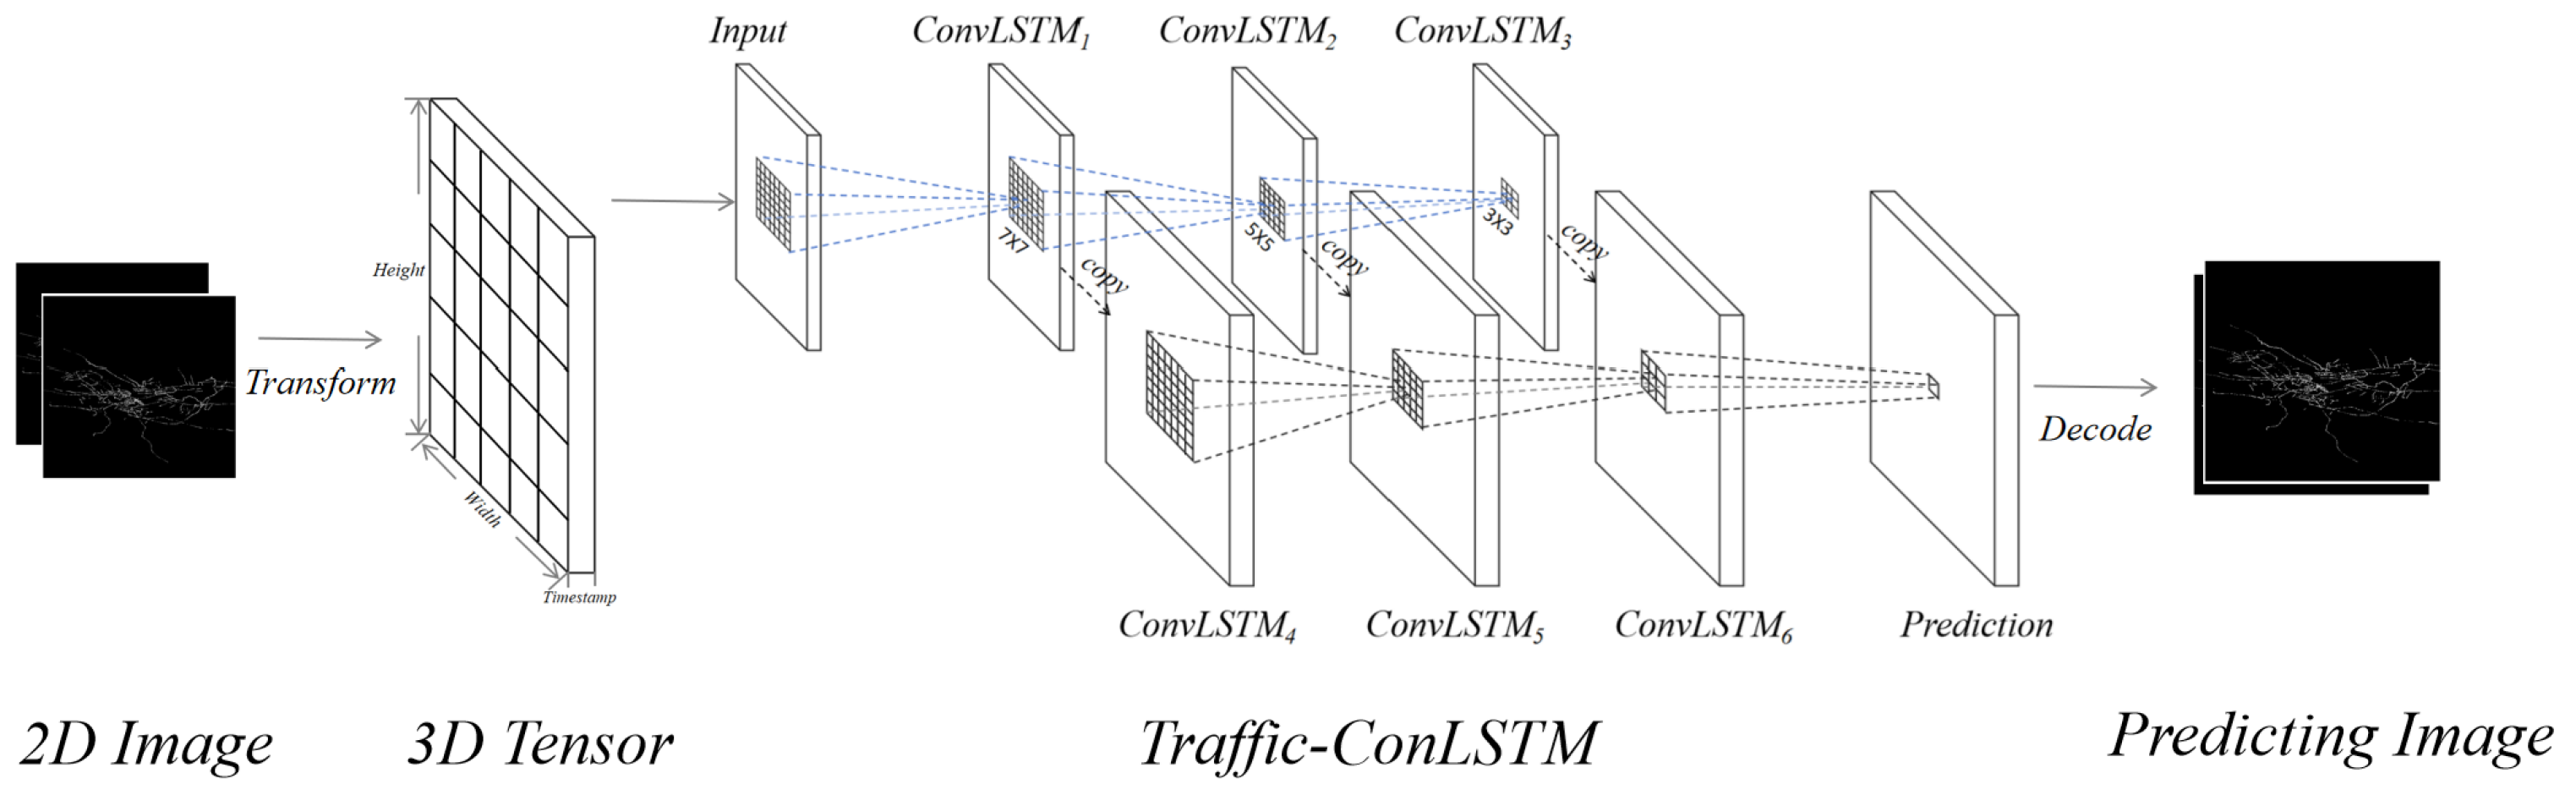
The primary objective of the model is to decrease the influence of spatial features obtained from large convolution kernels on predictions, as well as the share of large-scale features in time series data. This procedure serves two purposes. First, as per the refined first law of geography [32], the larger the spatial distance and time gap between two geographical occurrences in the same city, the weaker the association between the two occurrences. Hence, when the spatio-temporal proximity of two traffic events is limited, the weight of using the state of event A to predict event B should be lesser. Second, as per this assumption, the feature values extracted at a larger spatio-temporal scale are vulnerable to interference from traffic anomalies, and the spatio-temporal correlation between roads is easily disregarded at a larger scale, which hinders the accuracy of model learning. In terms of model performance, this reduces the impact of significant traffic anomaly events on model learning, allowing the model to accurately identify traffic anomaly events at multiple temporal and spatial scales.
The model utilizes the Structural Similarity Index (SSIM) as its loss function for training purposes. Specifically, it uses SSIM to determine if an intersection occurs at time t. The SSIM algorithm evaluates the similarity between two images by assessing their brightness, contrast, and structure. It considers factors such as flow, structure, and patency of the regional traffic flow. To account for distortion caused by image sampling during training, the relative traffic flow model calculated the SSIM index at 48 time points for all dates, and used the average of these indices at each time point as the standard SSIM index for that time point. In total, 7 *48 standard SSIM indices were obtained. To detect traffic anomalies, the model calculates the difference between the SSIM index of a particular area at time t and the standard SSIM index. If the difference exceeds the threshold, it indicates the occurrence of a traffic anomaly in that area.
3.3. Index of Performance
To evaluate the performance of our proposed model in identifying unusual traffic events, we employ two commonly used classification evaluation metrics: accuracy and precision. The specific formulas for these evaluation metrics are as follows:
where denotes the number of traffic anomalies correctly identified by the model, denotes the total number of traffic anomalies output by the model, and denotes the total number of traffic anomalies included in the selected examples.
4. Experiment
Our experiments utilize the Keras [34] deep learning library for model construction, and choose Tensorflow [35] as the tensor manipulation library. The model processes traffic condition images sampled at 30-minute intervals, generating 48 daily detection results. We conduct quantitative performance evaluations based on these outputs relative to baseline methods. Moreover, the detected long-term anomalies are analyzed comprehensively at both city and road levels
4.1. Evaluation Results
We compare our proposed Traffic-ConvLSTM model with three common baseline models for anomalous traffic detection to validate the performance of the models.
Stacked Autoencoder (SAE) [11]: the model learns the implicit information in the original data through multiple stacked encoders, and we use a greedy hierarchical unsupervised learning algorithm to train the deep SAE network.
CNN-LSTM model [12]: the model combines a convolutional neural network (CNN) with a long short-term memory network (LSTM), the spatial features of the traffic flow are extracted by a convolutional neural network and the features are fed into the LSTM layer, the spatial and temporal features of the data are processed by two independent neural networks respectively.
Bidirectional Long Short-Term Memory Network (bi-LSTM) [15]: the model combines the outputs of both forward and backward LSTM networks to capture bidirectional dependencies in sequences, and utilizes more periodic features to improve the predictive performance of the model through forward and backward passes of the Bi-LSTM module.
Table 2 compares the detection results of different traffic anomaly detection algorithms at city-level and road-level scales. The experimental results show that the CNN-LSTM model has the worst detection precision and accuracy at both spatial scales, which is due to the fact that the model uses two independent neural network modules to process the spatio-temporal features of the data, and fails to learn the spatio-temporal correlation in the traffic anomaly events well. bi-LSTM model extracts the temporal features of the traffic flow with its unique neuron unit and neural network structure, which improves detection accuracy, but still performs poorly in terms of detection accuracy. The stacked autoencoder (SAE) model shows a large improvement in both detection precision and accuracy, and this improved performance may be because SAE is able to extract more nonlinear features from the traffic data. Among the four models, our proposed Traffic-ConvLSTM model has the best precision and accuracy, and compared with the SAE model, we introduce the spatio-temporal correlation of anomalous traffic events into the model and improve anomaly detection accuracy. In Table 2, we give the results of the evaluation of the model’s detection ability, and we can find that our model has high accuracy and good precision in identifying city-level abnormal events, which is of practical value.
4.2. Result Description and Analysis
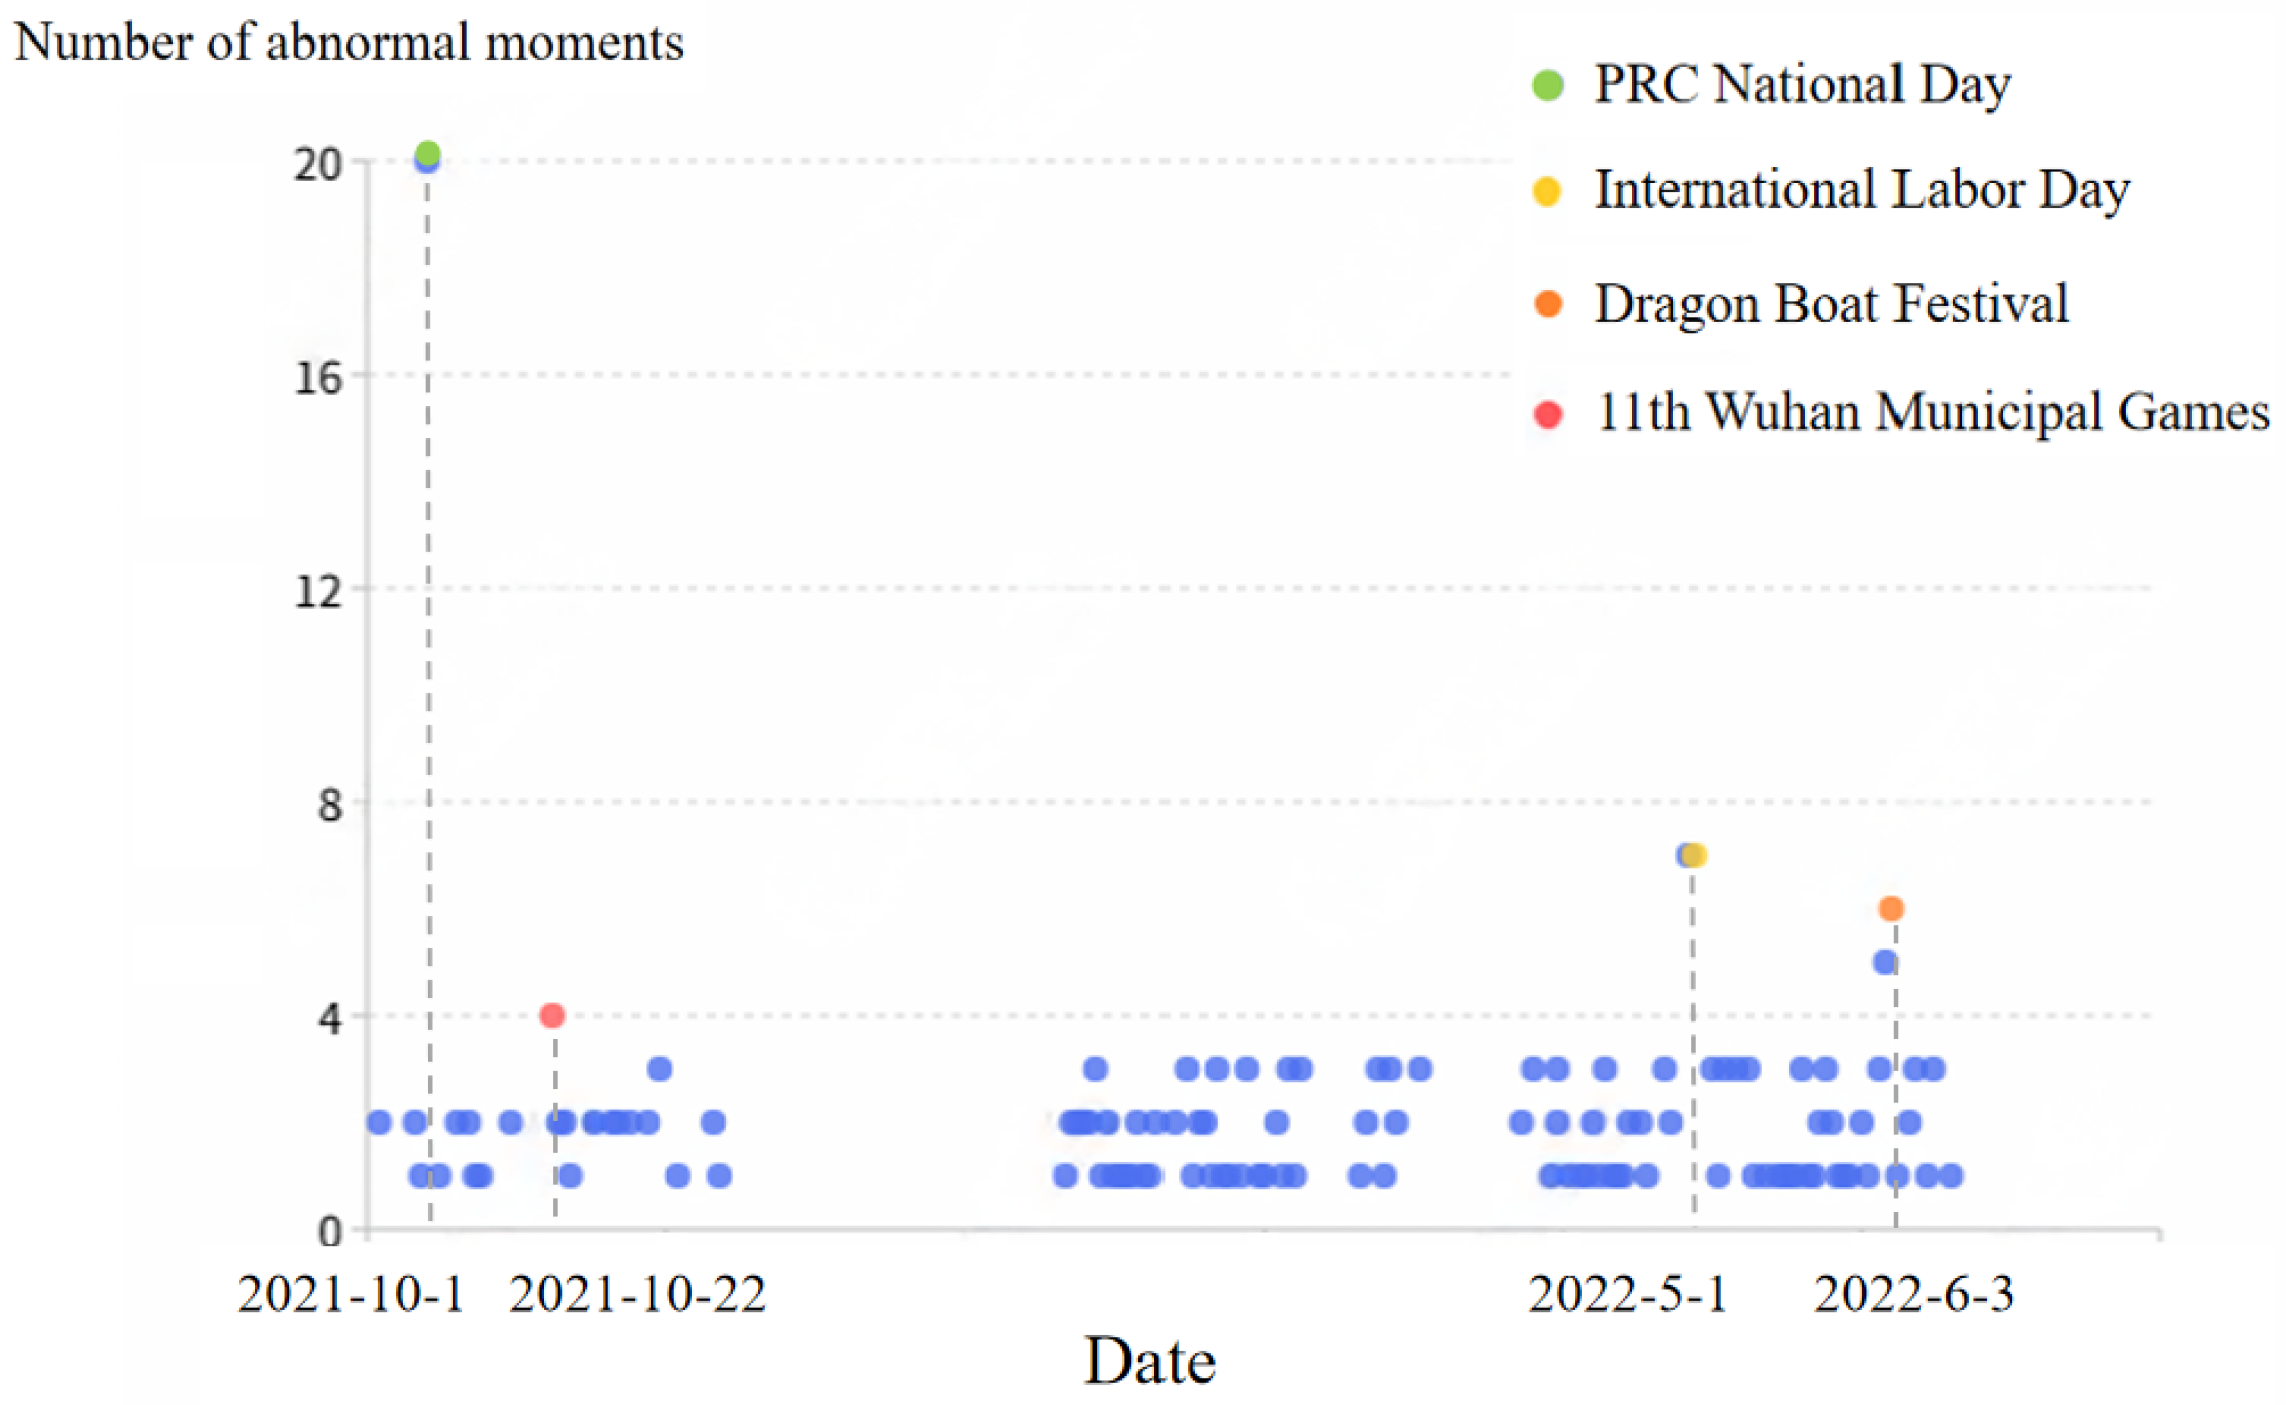
At the city-level scales, we then calculated the daily count of these anomaly points. Figure 4 presents a scatter plot illustrating the number of daily traffic anomaly points in Wuhan over the study period, with different colors highlighting the causes of the most significant anomalies. Four primary triggers for large-scale traffic anomalies were recognized: major holidays and one public event with a large number of participants. As shown in Figure 4, the PRC National Day holiday represented the highest number of traffic anomalies, exceeding other days by more than twofold. Similarly, the International Labor Day and the Dragon Boat Festival showed slightly elevated anomaly counts, albeit significantly lower than the National Day. Interestingly, the number of anomalies correlated positively with the duration of these holidays. This is evidenced by the National Day, Labor Day, and Dragon Boat Festival holidays, lasting 7, 5, and 3 days, respectively, corresponding to 20, 7, and 6 anomalous events. This finding suggests the need for heightened traffic management during holidays, with more stringent measures implemented for longer holidays. The 11th Wuhan Municipal Games also resulted in four anomalous events, indicating that large-scale sporting events can significantly alter urban traffic patterns.
Figure 4.
City-level traffic anomaly event statistics for September 2021-June 2021, with typical event causes that triggered city-level traffic anomalies during the period labeled in the figure.
Figure 4.
City-level traffic anomaly event statistics for September 2021-June 2021, with typical event causes that triggered city-level traffic anomalies during the period labeled in the figure.
On a road-level scale, we selected several major roads in Wuhan. We used the traffic flow data of the roads as inputs to the model to detect road-level traffic events that occurred during the period and triggered local traffic anomalies. Compared with city-level traffic anomalies, road-level traffic anomalies tend to have a smaller impact area and a shorter duration, resulting in short-term traffic anomalies in the event section and its neighboring intersection area. The triggering factors of road-level traffic anomalies are mostly sporadic individual accidents, such as small-scale traffic accidents. Both road-level and city-level traffic anomalies are characterized by unpredictable spatial and temporal periodicity of traffic anomalies, as well as unpredictable spatial location, time of occurrence, and duration of the event.
In order to better illustrate the characteristics of traffic anomalies, four typical images of traffic conditions at the time of traffic anomalies are shown in Figure 5. We use event stamps to label the locations where the traffic anomalies occurred, and show the time of the events and the traffic congestion in Wuhan at that moment. The selected traffic anomalies are all abnormal traffic congestion caused by a large number of abnormal travel traffic flows. Figure 5 compares the abnormal traffic with the traffic flow in normal traffic mode, which can prove that these traffic anomalies have caused traffic congestion in a larger area. The spatial pattern, impact range, and timing of these congestion events differ significantly from regular traffic congestion observed under the normal traffic pattern. This divergence underscores the distinct spatial and temporal characteristics of anomalous traffic events.
Figure 5.
Typical city-level traffic anomaly cases from September 2021 to June 2021, the left figure shows an overview of the traffic conditions in Wuhan at that moment in time, and the right figure shows the details of a traffic anomaly area corresponding to the left figure, which is marked with an event stamp.
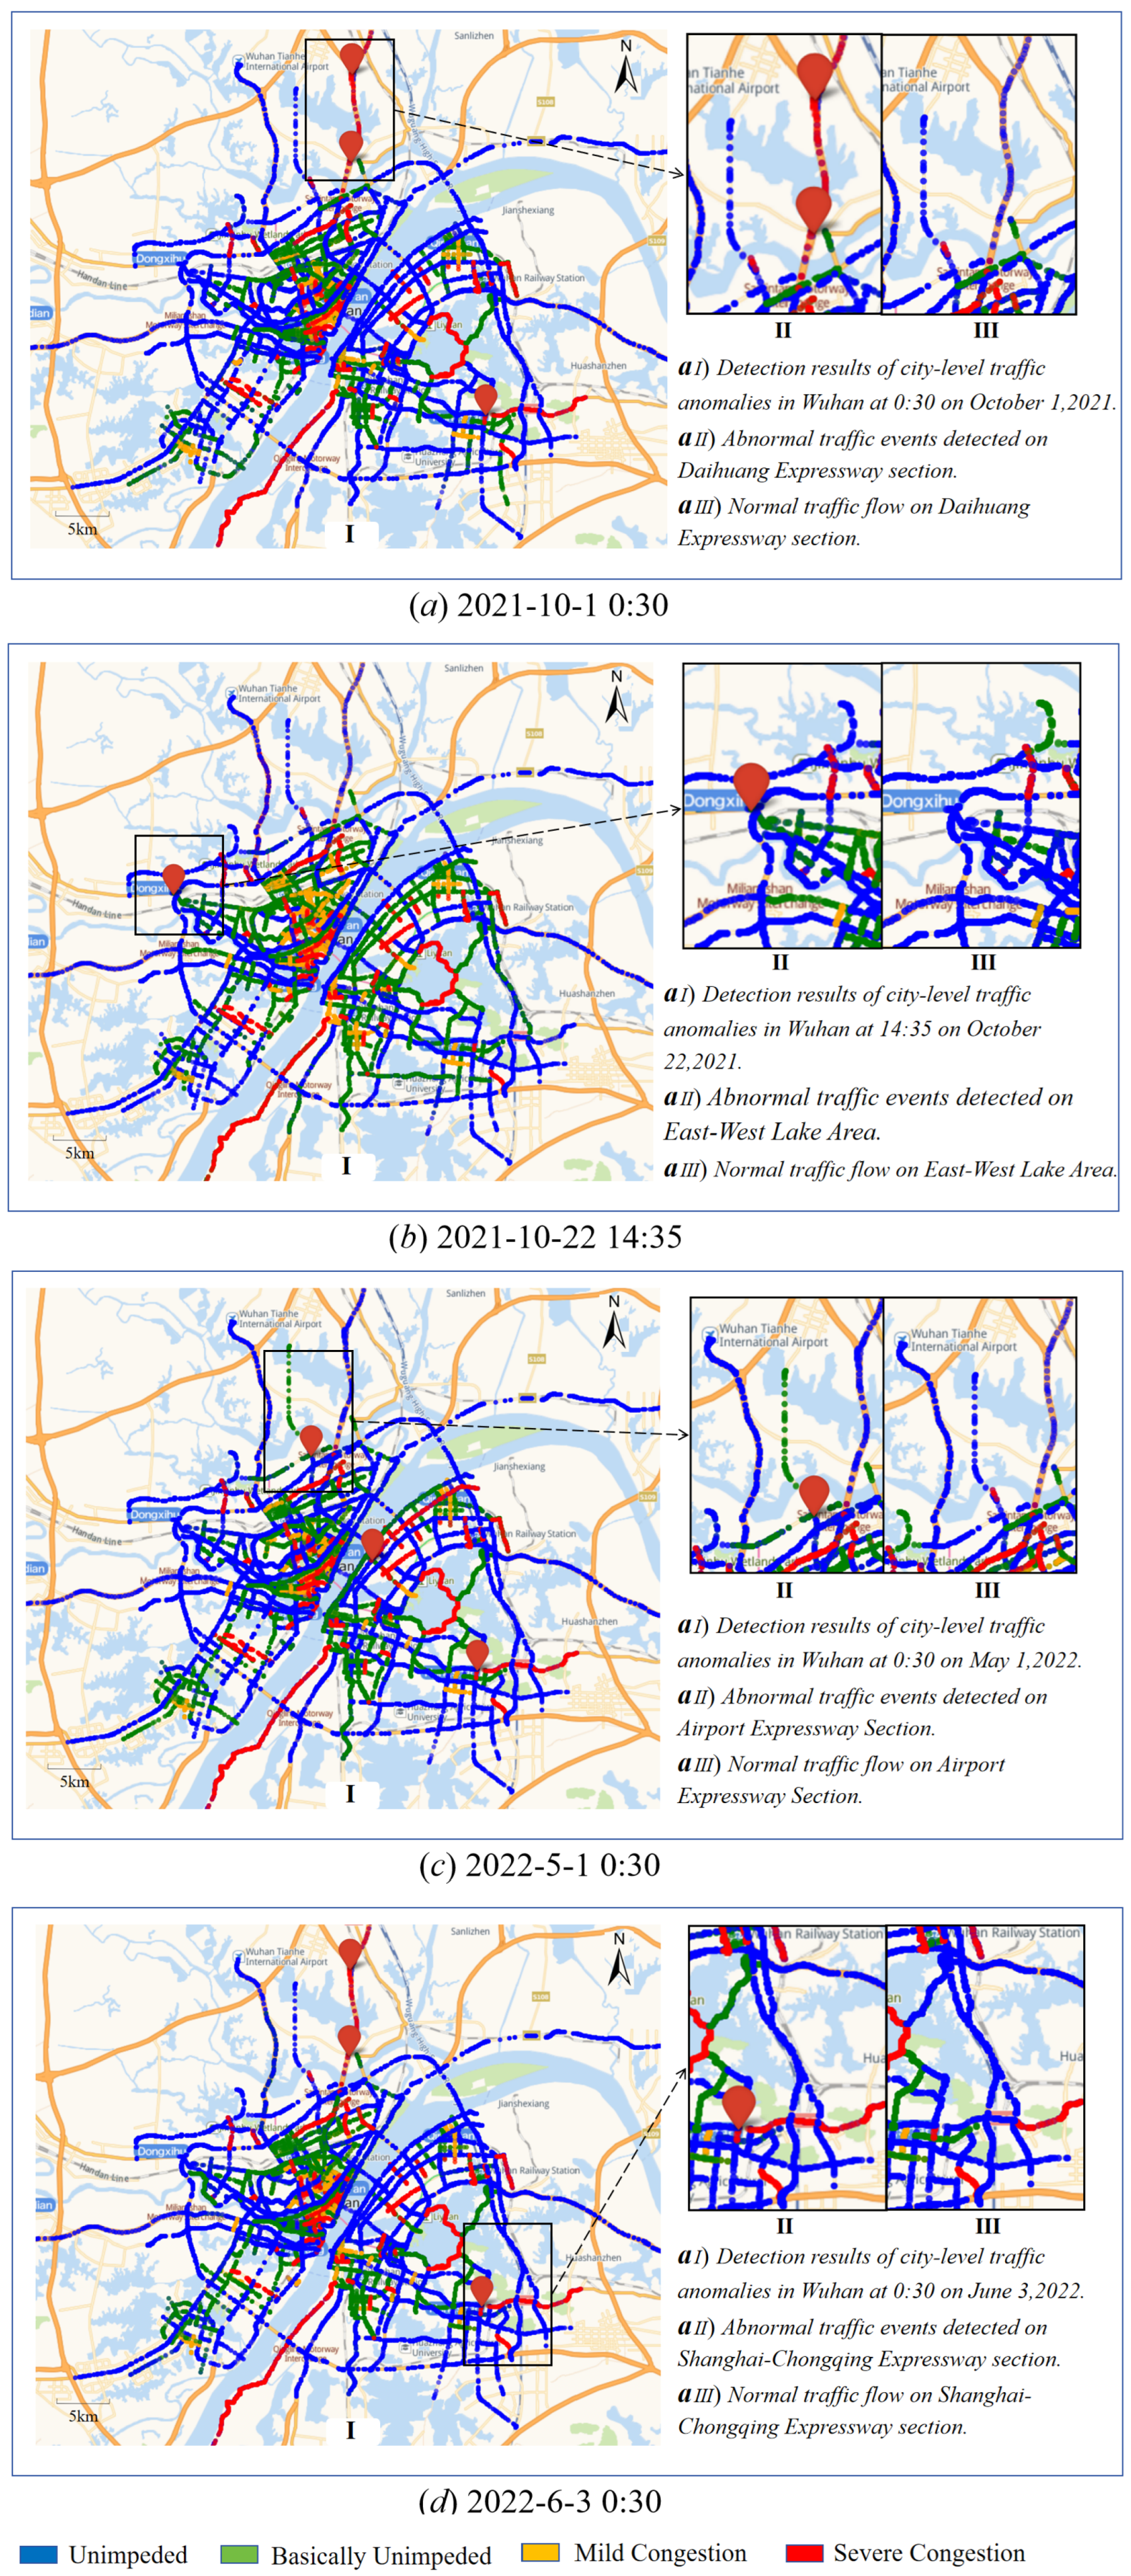
In addition, it can be found that the traffic anomalous events in Figure 5a,d show obvious spatio-temporal similarities. In the images collected at the same moment, the traffic anomalous events occurred at the toll gates and turnoffs of the Daihuang, Expressway (Wuhan section) in northern Wuhan and the Shanghai-Yuzhou Expressway’s city entry in southeastern Wuhan. These similarities likely stem from common underlying causes. October 1, 2021 and June 3,2022 are the National Day and Dragon Boat Festival, respectively, which are traditional Chinese holidays, characterized by significant intercity travel as people return to their hometowns for family reunions. The Daihuang and Shanghai-Yuzhou Expressways, connecting Wuhan to two densely populated areas in North and Southeast China, respectively, serve as main corridors for intercity travel in Wuhan city. Therefore. when the inter-city traffic flow in Wuhan increased significantly due to the homecoming, traffic anomalies occurred at the entrance areas of these two expressways.
In contrast, the traffic anomalous events presented in Figure 5c exhibit similarities and differences compared to those in Figure 5a and 5d. Although the traffic anomalous events similarly occurred in the entry section of the Huyu Expressway in southeast Wuhan, the other two anomalous events differ significantly in their spatial distribution. This distinction also arises from the nature of the holiday involved. May 1, 2022 is International Labor Day, a relatively short holiday, not a traditional Chinese holiday. Consequently, many people opt for intra-city leisure activities rather than inter-city travel, resulting in increased traffic flow both within and between cities. Crowd travel is reflected in the traffic flow by a significant increase in intra-city and inter-city traffic flow, which triggers traffic anomalies in the original region with poor traffic conditions. In contrast, Figure 5b illustrates a fundamentally different type of traffic anomaly associated with the 11th Wuhan Municipal Games. In this anomaly distribution, there is a clear point source of traffic disruption. i.e., the spatial location marked by the event stamp, with congestion spreading from the source point to all adjacent roads. This traffic anomaly was caused by the 11th Wuhan City Games held in the East and West Lake District of Wuhan City, where a large amount of people converged, leading to large-scale traffic congestion in the area.
5. Conclusions
This study proposes a deep-learning model for identifying and analyzing anomalous traffic events. The main contributions encompass proposing a data processing technique that transforms multi-source trajectory data into traffic condition visualizations. Traffic-ConvLSTM, a deep learning model, has been introduced to identify anomalous traffic patterns across multiple spatial and temporal dimensions. A traffic pattern evaluation method founded on the Structural Similarity Index (SSlM) has also been introduced. The experimental assessment on real-world datasets achieved satisfactory recognition outcomes at both urban and road levels. Developing these precise traffic anomaly detection algorithms can significantly improve urban safety, optimize resources, enhance user experience, and emergency response planning. Additionally, our analysis of large-scale traffic anomalies revealed distinct patterns closely associated with major holidays and significant public events. These findings underscore the importance of context-specific approaches in urban traffic management and planning.
Author Contributions
Conceptualization, L.B. and M.Y.; methodology, M.Y.; software, M.Y.; validation, M.Y.; formal analysis, M.Y.; investigation, L.B.; resources, L.B.; data curation, M.Y.; writing—original draft preparation, M.Y. and Y.S.; writing—review and editing, M.Y.; visualization, M.Y., Y.S. and L.B.; supervision, L.B.; project administration, L.B.; funding acquisition, L.B. All authors have read and agreed to the published version of the manuscript.
Data Availability Statement
Data can be provided upon request.
Conflicts of Interest
The authors declare no conflicts of interest.
References
- Central Committee of the Communist Party of China, State Council of the People’s Republic of China. Outline of the Construction of a Strong Transportation State; People’s Publishing House: Beijing, China, 2019. [Google Scholar]
- Mingyang Zhang, Tong Li, Yue Yu, Yong Li, Pan Hui, and Yu Zheng. Urban anomaly analytics: Description, detection, and prediction. IEEE Transactions on Big Data 2022, 809–826.
- Emily Parkany and Chi Xie. A complete review of incident detection algorithms their deploy- ment: What works and what doesn ’t. 2005.
- Zhihan Jiang, Yan Liu, Xiaoliang Fan, Cheng Wang, Jonathan Li, and Longbiao Chen. Understanding urban structures and crowd dynamics leveraging large-scale vehicle mobility data. Frontiers of Computer Science 2020, 14. [Google Scholar]
- Mascha Van Der Voort, Mark Dougherty, and Susan Watson. Combining kohonen maps with arima time series models to forecast traffic flow. Transportation Research Part C: Emerging Technologies 1996, 307–318.
- Peibo Duan, Guoqiang Mao, Weifa Liang, and Degan Zhang. A unified spatio-temporal model for short-term traffic flow prediction. IEEE Transactions on Intelligent Transportation Systems 2019, 20, 3212–3223. [Google Scholar] [CrossRef]
- Billy M. Williams and Lester A. Hoel. Modeling and forecasting vehicular traffic flow as a seasonal arima process: Theoretical basis and empirical results. Journal of Transportation Engineering 2003, 664–672. [Google Scholar]
- Chaoguang Lin, Qiuhan Zhu, Shunan Guo, Zhuochen Jin, Yu-Ru Lin, and Nan Cao. Anomaly detection in spatiotemporal data via regularized non-negative tensor analysis. Data Mining and Knowledge Discovery 2018, 32, 1056–1073. [Google Scholar] [CrossRef]
- Ming Xu, Jianping Wu, Haohan Wang, and Mengxin Cao. Anomaly detection in road networks using sliding-window tensor factorization. IEEE Transactions on Intelligent Transportation Systems 2019, 20, 4704–4713. [Google Scholar] [CrossRef]
- Yang Wang, Yong Zhang, Xinglin Piao, Hao Liu, and Ke Zhang. Traffic data reconstruction via adaptive spatial-temporal correlations. IEEE Transactions on Intelligent Transportation Systems 2019, 1531–1543.
- Yisheng Lv, Yanjie Duan, Wenwen Kang, Zhengxi Li, and Fei-Yue Wang. Traffic flow prediction with big data: A deep learning approach. IEEE Transactions on Intelligent Transportation Systems 2014, 1–9.
- Xinqiang Chen, Huixing Chen, Yongsheng Yang, Huafeng Wu, Wenhui Zhang, Jiansen Zhao, and Yong Xiong. Traffic flow prediction by an ensemble framework with data denoising and deep learning model. Physica A: Statistical Mechanics and its Applications 2021, 125574.
- Fangzhou Sun, Abhishek Dubey, and Jules White. Dxnat —deep neural networks for explaining non-recurring traffic congestion. In 2017 IEEE International Conference on Big Data (Big Data) 2017.
- Zheng Fang, Qingqing Long, Guojie Song, and Kunqing Xie. Spatial-temporal graph ode networks for traffic flow forecasting. In Proceedings of the 27th ACM SIGKDD Conference on Knowledge Discovery amp; Data Mining 2021.
- Haifeng Zheng, Feng Lin, Xinxin Feng, and Youjia Chen. A hybrid deep learning model with attention-based conv-lstm networks for short-term traffic flow prediction. IEEE Transactions on Intelligent Transportation Systems 2021, 6910–6920.
- Shengnan Guo, Youfang Lin, Ning Feng, Chao Song, and Huaiyu Wan. Attention based spatial- temporal graph convolutional networks for traffic flow forecasting. Proceedings of the AAAI Conference on Artificial Intelligence 2019, 922–929.
- Yingxue Zhang, Yanhua Li, Xun Zhou, Xiangnan Kong, and Jun Luo. Curb-gan: Conditional urban traffic estimation through spatio-temporal generative adversarial networks. In Proceedings of the 26th ACM SIGKDD International Conference on Knowledge Discovery amp; Data Mining 2020.
- Yingxue Zhang, Yanhua Li, Xun Zhou, Xiangnan Kong, and Jun Luo. Trafficgan: Off- deployment traffic estimation with traffic generative adversarial networks. In 2019 IEEE International Conference on Data Mining (ICDM) 2019.
- Yuxuan Zhang, Senzhang Wang, Bing Chen, Jiannong Cao, and Zhiqiu Huang. The title of the cited article. IEEE Transactions on Intelligent Transportation Systems 2021, 219–230. [Google Scholar]
- Aniekan Essien and Cinzia Giannetti. A deep learning model for smart manufacturing using convolutional lstm neural network autoencoders. IEEE Transactions on Industrial Informatics 2020, 6069–6078. [Google Scholar]
- Moshe Levin and Yen-Der Tsao. On forecasting freeway occupancies and volumes (abridgment). Transportation Research Record, Transportation Research Record 1980.
- Mohammad, M. Hamed, Hashem R. Al-Masaeid, and Zahi M. Bani Said. Short-term prediction of traffic volume in urban arterials. Journal of Transportation Engineering 1995, 121, 249–254. [Google Scholar]
- Zilong Zhao, Luliang Tang, Chang Ren, Xue Yang, Zihan Kan, and Qingquan Li. Diagnosing urban traffic anomalies by integrating geographic knowledge and tensor theory. GIScience & Remote Sensing 2023.
- Xiaolei Ma, Ziqi Dai, Zhengbing He, Jihui Na, Yong Wang, and Yunpeng Wang. Learning traffic as images: A deep convolutional neural network for large-scale transportation network speed prediction. Cornell University - arXiv, Cornell University - arXiv 2017.
- JeffersonRyan Medel and Andreas Savakis. Anomaly detection in video using predictive con- volutional long short-term memory networks. arXiv: Computer Vision and Pattern Recogni- tion, arXiv: Computer Vision and Pattern Recognition 2016.
- Xingjian Shi, Zhourong Chen, Hao Wang, Dit-Yan Yeung, W.C. Wong, and Wang-chun Woo. Convolutional lstm network: A machine learning approach for precipitation nowcasting. arXiv: Computer Vision and Pattern Recognition, arXiv: Computer Vision and Pattern Recognition 2015.
- Hongmei Song, Wenguan Wang, Sanyuan Zhao, Jianbing Shen, and Kin-Man Lam. Pyramid Dilated Deeper ConvLSTM for Video Salient Object Detection. Computer Vision – ECCV 2018,Lecture Notes in Computer Science 2018, 744–760.
- Ming Zhao, Tie Luo, Bingxue Zhou, and Jeng-Shyang Pan. A Novel Algorithm for Video Frame Prediction Based on Convolutional Neural Network. Advances in Intelligent Information Hiding and Multimedia Signal Processing, Smart Innovation, Systems and Technologies 2023, 187–193.
- Connor Robertson, JaredL. Wilmoth, Scott Retterer, and Miguel Fuentes-Cabrera. Performing video frame prediction of microbial growth with a recurrent neural network.2022.
- Zufan Zhang, Zongming Lv, Chenquan Gan, and Qingyi Zhu. Human action recognition using convolutional lstm and fully-connected lstm with different attentions. Neurocomputing 2020, 304–316.
- Steven Elsworth and Stefan Güttel. Time series forecasting using lstm networks: A symbolic approach. arXiv: Learning, arXiv: Learning 2020.
- LI Xiao-wen. The First Law of Geography and Spatial-Temporal Proximity. Chinese Journal of Nature 2007, 29, 69–71. [Google Scholar]
- Z. Wang, A.C. Bovik, H.R. Sheikh, and E.P. Simoncelli. Image quality assessment: From error visibility to structural similarity. IEEE Transactions on Image Processing 2004, 600–612.
- François Chollet. Keras: The python deep learning library. Astrophysics Source Code Library, Astrophysics Source Code Library, 2018.
- Martín Abadi, Ashish Agarwal, Paul Barham et al. Tensorflow: Large-scale machine learning on heterogeneous distributed systems. 2016.

Table 1.
Wuhan Real-time Traffic Dataset.
| Date | velocity | Vehicle location | Speed1 | longitude | latitude |
|---|---|---|---|---|---|
| 2021-9-21 | 0:00 | Third Ring Road | 70 | 114.442 | 30.467 |
| 2021-9-21 | 0:30 | Zhushan Lake Avenue | 35 | 114.133 | 30.462 |
| 2021-9-22 | 8:30 | Shenlong Avenue | 25 | 114.172 | 30.491 |
14.1cm 1 The unit of speed is km/h.
Table 2.
Accuracy and Precision of Four Models for Unusual Traffic Event Detection at City-Level and Road-Level Scales.
Table 2.
Accuracy and Precision of Four Models for Unusual Traffic Event Detection at City-Level and Road-Level Scales.
| Traffic-ConvLSTM | SAE | CNN+LSTM | Bi-LSTM | |
|---|---|---|---|---|
| city-precision | 92.875% | 85.714% | 67.857% | 71.428% |
| city-accuracy | 83.871% | 75.000% | 51.351% | 52.778% |
| road-precision | 88.889% | 83.761% | 78.632% | 84.615% |
| road-accuracy | 92.035% | 80.991% | 63.889% | 70.714% |
Disclaimer/Publisher’s Note: The statements, opinions and data contained in all publications are solely those of the individual author(s) and contributor(s) and not of MDPI and/or the editor(s). MDPI and/or the editor(s) disclaim responsibility for any injury to people or property resulting from any ideas, methods, instructions or products referred to in the content. |
© 2024 by the authors. Licensee MDPI, Basel, Switzerland. This article is an open access article distributed under the terms and conditions of the Creative Commons Attribution (CC BY) license (https://creativecommons.org/licenses/by/4.0/).
Copyright: This open access article is published under a Creative Commons CC BY 4.0 license, which permit the free download, distribution, and reuse, provided that the author and preprint are cited in any reuse.


