Submitted:
25 July 2024
Posted:
26 July 2024
You are already at the latest version
Abstract
Proteomics is the study of cellular proteome by investigating how different proteins interact with each other and the roles they play in the organism. For mRNA expression levels do not always correlate well with protein expression levels, and the study of mRNA does not consider protein posttranslational modifications (PTMs), complex formation and localization; all of which are key to protein function. Quantitative proteomics uses mass spectrometry to identify and quantify proteins so as to find differentially expressed proteins under different condition. This allows us to gain biological insights under stress or other pathological conditions. posttranslational modifications, such as lysine acetylation, succinylation and lactylation, occur after protein biosynthesis and play vital roles in protein activity and cell physiology regulation. Here we present the mass spectrometry analysis in detail to unveil protein acylase and deacylase’ roles in metabolic regulation based on PTMomics lysine acetylome and suincylome.
Keywords:
quantitative proteomics
; mass spectrometry
; post translational modifications (PTMs)
; acetylation
; succinylation
; lactylation
Procedures
Reagents Preparation
PBS (0.01M): 8g NaCl, 0.2g KCl, 1.44g Na2HPO4, 0.24g KH2PO4, dissolved in 900 ml water, then adjust pH to 7.4 using HCl, finally add water to 1L.
Sodium citrate buffer: 10mM sodium citrate, 0.025% Triton X-100.
Lysis buffer: 8M urea, 2mM EDTA, 5mM DTT and 1% Protease Inhibitor Cocktail III, 3μM TSA, 50mM NAM.
Dissolution buffer: 8M urea, 100mM triethylammonium bicarbonate (TEAB), pH8.0.
NETN buffer:100 mM NaCl, 1 mM EDTA, 50 mM Tris-HCl, 0.5% NP-40, pH 8.0.
Trichloroacetic acid (TCA), acetone, protein quantification kit, DTT (dithiothreitol), iodoacetamide (IAA), acetonitrile (ACN), trifluoroacetic acid (TFA), formic acid (FA), trypsin, Xylene, iodoacetamide, 100% ethanol, TMT Kit, antibody beads.
Workflow Step by Step
- 1.
- Protein Extraction and Trypsin Digestion
Cells were grown and harvested by centrifugation. The collected cells were first frozen using liquid nitrogen and then transferred to 50ml centrifuge tubes for high intensity ultrasonication in lysis buffer. Cell debris was removed by centrifugation at 12,000 g at 4 °C for 10 min. Finally, the protein was precipitated with cold 15% trichloroacetic acid for 2 h at -20 °C. After centrifugation at 4 °C for 10 min, the supernatant was discarded. The remaining precipitate was washed with cold acetone three times. The protein was redissolved in dissolution buffer, and the protein concentration was determined.
For digestion, the protein solution was reduced with 10 mM DTT for 1 h at 37 °C and alkylated with 20 mM iodoacetamide for 45 min at room temperature in the dark. Then protein samples were diluted by adding 100 mM TEAB to urea at a concentration less than 2 M. Finally, trypsin was added at 1:50 trypsin-to-protein mass ratio for the first digestion overnight and 1:100 trypsin-to-protein mass ratio for a second 4h digestion.
- 2.
- TMT Labeling and Affinity Enrichment
After trypsin digestion, peptides were desalted by a Strata X C18 SPE column (Phenomenex) and vacuum dried. Peptides were reconstituted in 0.5 M TEAB and processed according to the manufacturer’s protocol with a 6-plex TMT kit. Briefly, one unit of TMT reagent (defined as the amount of reagent required to label 1 mg of peptide) was thawed. The peptide mixtures were then incubated for 2 h at room temperature, pooled, desalted, and dried by vacuum centrifugation. To enrich KSuc peptides, tryptic peptides dissolved in NETN buffer were incubated with prewashed antibody beads at 4 °C overnight with gentle shaking. The beads were washed four times with NETN buffer and twice with ddH2O. The bound peptides were eluted from the beads with 0.1% TFA. The eluted fractions were combined and vacuum dried. The resulting peptides were cleaned with C18 ZipTips according to the manufacturer’s instructions, followed by LC-MS/MS analysis.
- 3.
- LC-MS/MS Analysis
Peptides were dissolved in 0.1% formic acid (Sigma-Aldrich) then directly loaded onto a reversed-phase pre-column (Acclaim PepMap 100, C18, 75-m inner diameter, 2-cm length, Thermo Scientific). Peptide separation was performed using a reversed-phase analytical column (Acclaim PepMap RSLC, C18, 50-m inner diameter, 15-cm length, Thermo Scientific). The gradient was comprised of an increase from 6% to 22% solvent B (0.1% formic acid in 98% acetonitrile) for 26 min, 22% to 35% for 8 min, and climbing to 80% in 3 min then holding at 80% for the last 3 min, all at a constant flow rate of 300 nl/min on an EASY-nLC 1000 UPLC system (Thermo Fisher Scientific). The resulting peptides were analyzed by a Q ExactiveTM Plus hybrid quadrupole-Orbitrap mass spectrometer (Thermo Fisher Scientific). The peptides were subjected to a nano-spray-ionization source followed by tandem mass spectrometry (MS/MS) in Q ExactiveTM Plus (Thermo Fisher Scientific) coupled online to the UPLC. Intact peptides were detected in the Orbitrap at a resolution of 70,000. Peptides were selected for MS/MS using the normalized collision energy setting 31; ion fragments were detected in the Orbitrap at a resolution of 17,500. A data-dependent procedure that alternated between one MS scan followed by 20 MS/MS scans was applied for the top 20 precursor ions above a threshold ion count of 1E4 in the MS survey scan with 15.0 s dynamic exclusion. The electrospray voltage applied was 2.0 kV. Automatic gain control was used to prevent overfilling of the ion trap; 5E4 ions were accumulated to generate MS/MS spectra. For MS scans, the m/z scan range was 350 to 1800. Fixed first mass was set as 100 m/z.
- 4.
- Database Search
The resulting MS/MS data was processed using MaxQuant with integrated Andromeda search engine (v.1.4.1.2). Trypsin/P was specified as cleavage enzyme allowing up to 4 missing cleavages, 5 modifications per peptide and 5 charges. Mass error was set to 20 ppm for first search, 5 ppm for main search and 0.02 Da for fragment ions. Carbamidomethylation on Cys was specified as fixed modification and oxidation on Met, acetylation on Lys and acetylation on protein N-terminal were specified as variable modifications. False discovery rate (FDR) thresholds for protein, peptide and modification site were specified at 1%. Minimum peptide length was set at 7. All the other parameters in MaxQuant were set to default values. The site localization probability was set as > 0.75.
- 5.
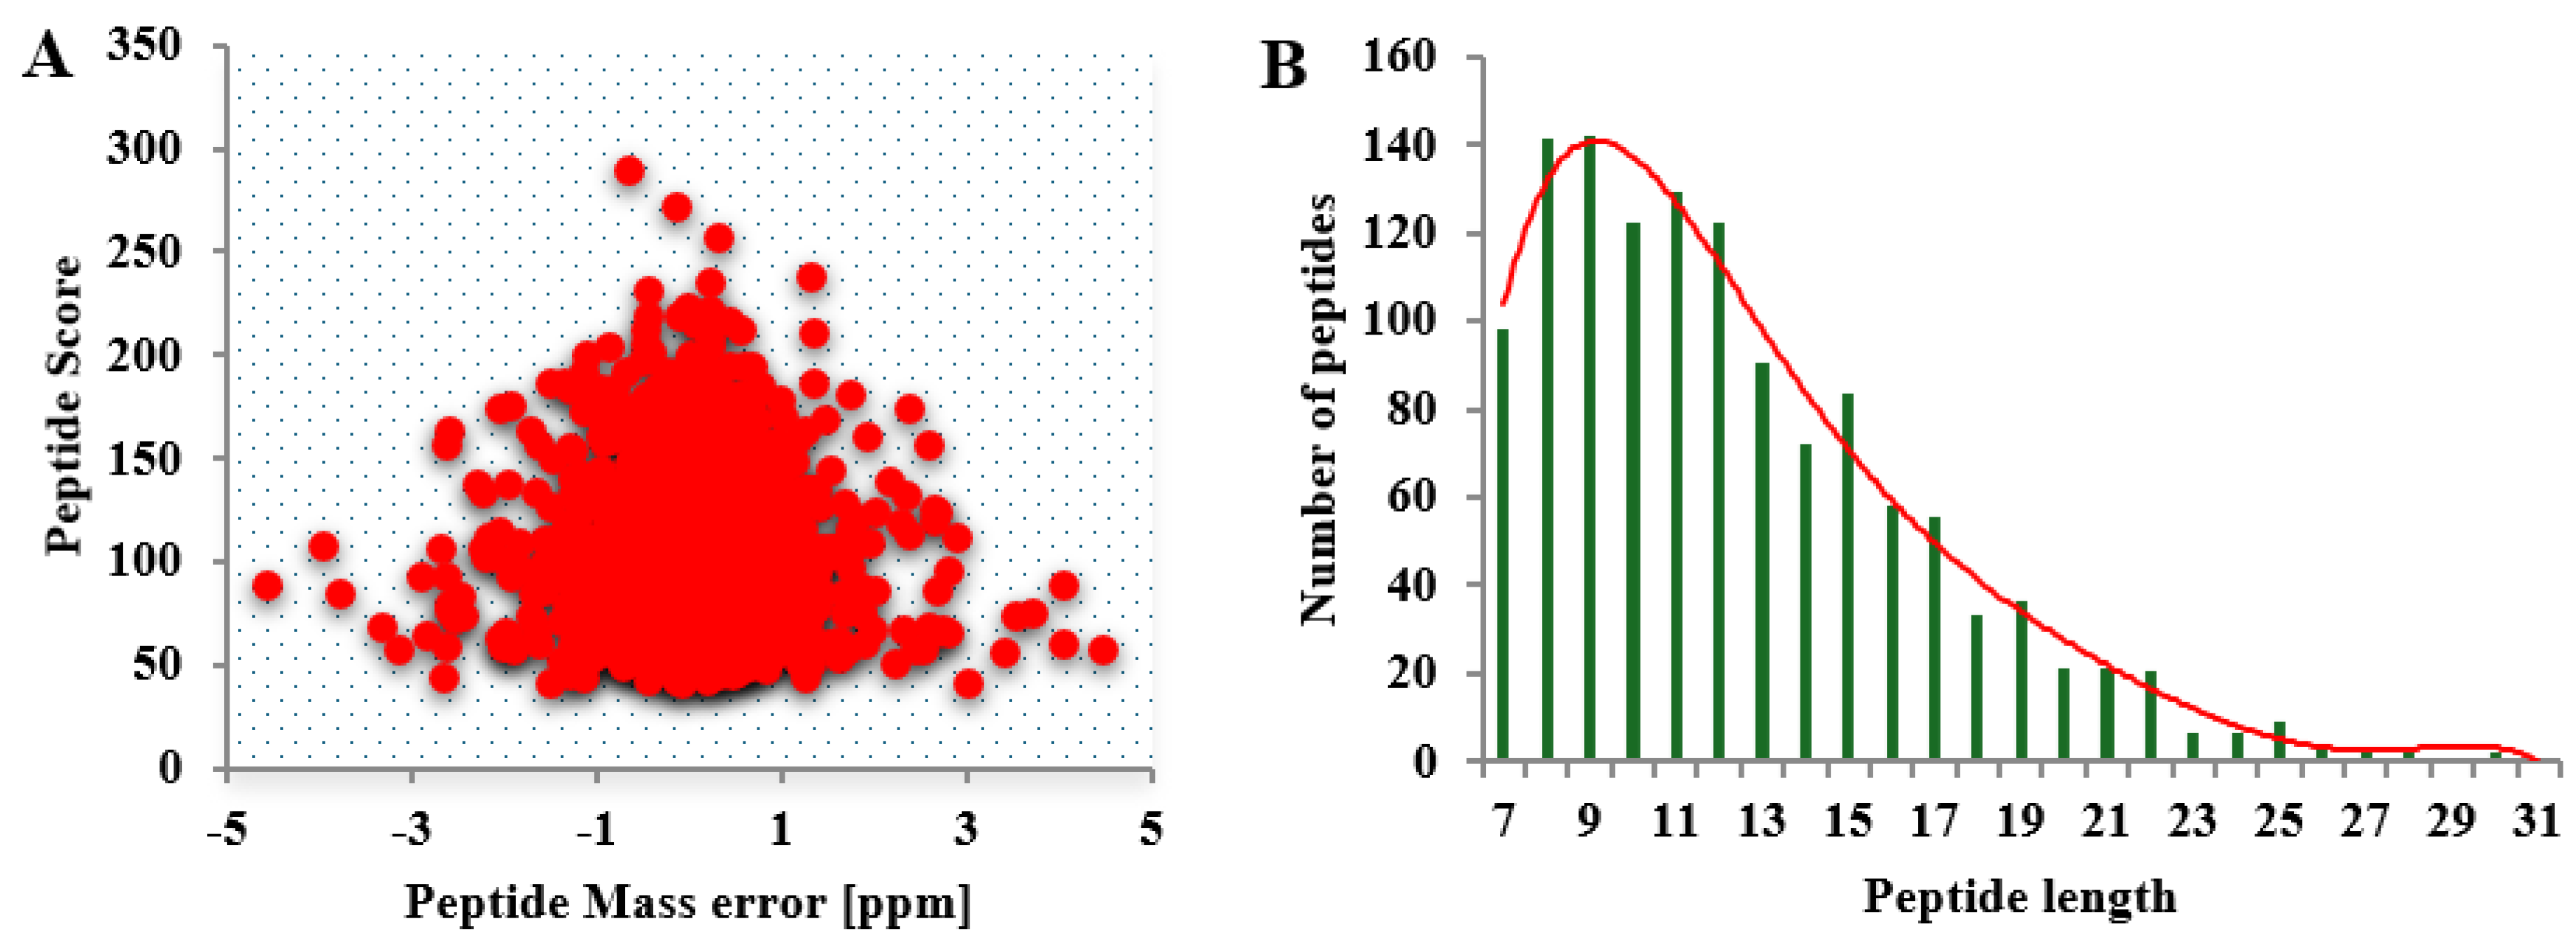
- QC Validation of MS Data
The MS data validation was shown in Figure 2. Firstly, we checked the mass error of all the identified peptides. The distribution of mass error is near zero and most of them are less than 0.02 Da which means the mass accuracy of the MS data fit the requirement. Secondly, the length of most peptides distributed between 8 and 20, which agree with the property of tryptic peptides, that means sample preparation reach the standard.
- 6.
-
Bioinformatics Analysis
- 6.1.
- GO Annotation
Gene Ontology (GO) annotation proteome was derived from the UniProt-GOA database (www. http://www.ebi.ac.uk/GOA/). Firstly, Converting identified protein ID to UniProt ID and then mapping to GO IDs by protein ID. If some identified proteins were not annotated by UniProt-GOA database, the InterProScan would be used to annotate protein’s GO based on protein sequence alignment method. Then proteins were classified by Gene Ontology annotation based on three categories: biological process, cellular component and molecular function.
- 6.2.
- Domain Annotation
A protein domain is a conserved part of a given protein and structure that can evolve, function and exist independently of the rest of the protein chain. Each domain forms a compact three-dimensional structure and often can be independently stable and folded. Many proteins consist of several structural domains. One domain may appear in a variety of different proteins. These may be recombined in different arrangements to create proteins with different functions. Domains vary in length from between about 25 amino acids up to 500 amino acids.
Identified proteins domain functional description were annotated by InterProScan (a sequence analysis application) based on protein sequence alignment method, and the InterPro domain database was used. InterPro (http://www.ebi.ac.uk/interpro/) is a database that integrates diverse information about protein families, domains and functional sites, and makes it freely available to the public via Web-based interfaces and services.
- 6.3.
- Subcellular Localization
The cells of eukaryotic organisms are elaborately subdivided into functionally distinct membrane bound compartments. Some major constituents of eukaryotic cells are: extracellular space, cytoplasm, nucleus, mitochondria, Golgi apparatus, endoplasmic reticulum (ER), peroxisome, vacuoles, cytoskeleton, nucleoplasm, nucleolus, nuclear matrix and ribosomes. The most common localizations referred to include the cytoplasm, the cytoplasmic membrane, the cell wall and the extracellular environment. We used woLF PSORT a subcellular localization predicator to predict subcellular localization.
- 6.4.
- Motif Analysis
Program motif-X and IceLogo were used to analysis the model of sequences constituted with amino acids in specific positions of modifier-21-mers (10 amino acids upstream and downstream of the site) in all protein sequences. And all the database protein sequences were used as background database parameters.
Results
Figure 1.
Workflow for the proteomics and PTMomics.
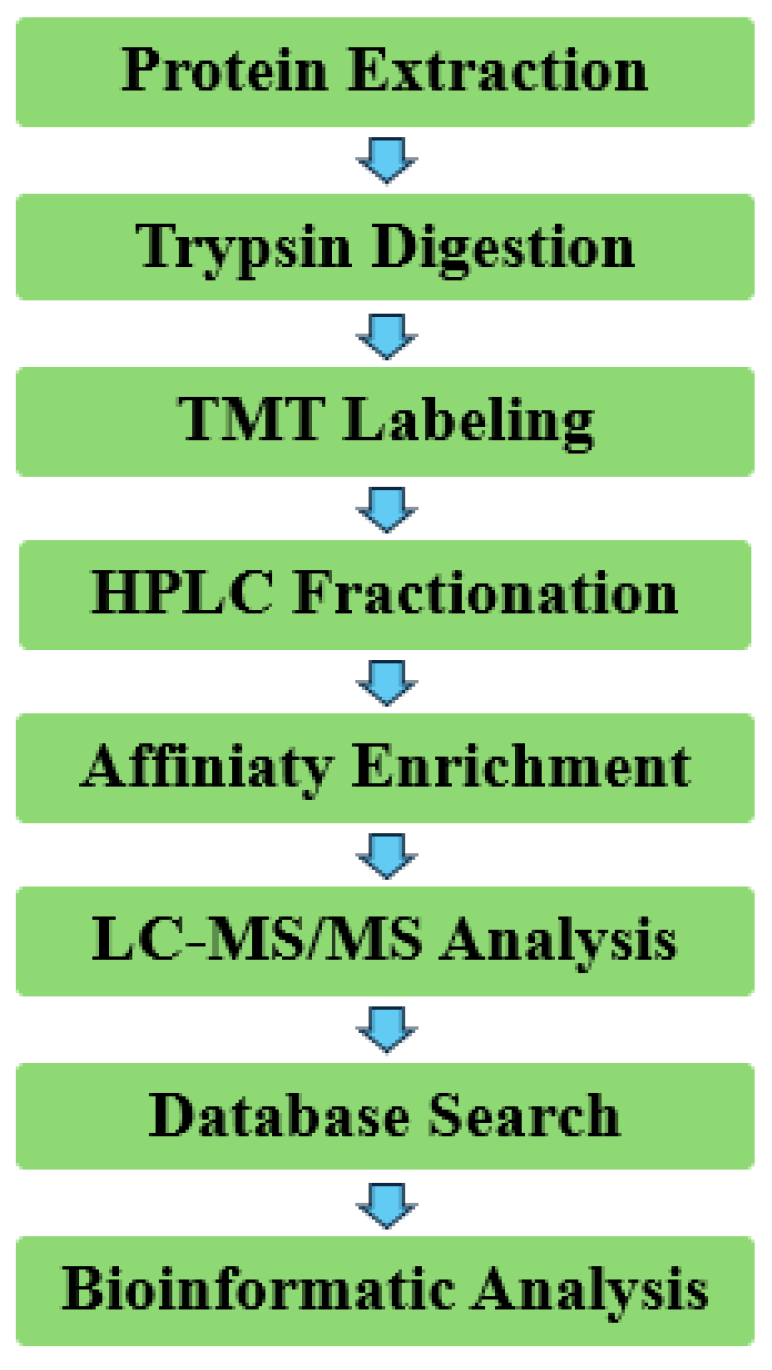
Figure 2.
QC validation of MS data. (A) Mass error distribution of all identified peptides, (B) Peptide length distribution.
Figure 2.
QC validation of MS data. (A) Mass error distribution of all identified peptides, (B) Peptide length distribution.
References
- Karpov, O.A.; Stotland, A.; Raedschelders, K.; Chazarin, B.; Ai, L.; Murray, C.I.; Van Eyk, J.E. Proteomics of the Heart. Physiological Reviews 2024, 104, 931–982. [Google Scholar] [CrossRef]
- Gygi, S.P.; Rochon, Y.; Franza, B.R.; Aebersold, R. Correlation between protein and mRNA abundance in yeast. Molecular and cellular biology 1999. [CrossRef] [PubMed]
- Li, P.; Zhang, H.; Zhao, G.-P.; Zhao, W. Deacetylation enhances ParB–DNA interactions affecting chromosome segregation in Streptomyces coelicolor. Nucleic Acids Research 2020, 48, 4902–4914. [Google Scholar] [CrossRef]
- Yang, X.-J.; Seto, E. Lysine acetylation: codified crosstalk with other posttranslational modifications. Molecular cell 2008, 31, 449–461. [Google Scholar] [CrossRef] [PubMed]
- Yang, Y.; Zhang, H.; Guo, Z.; Zou, S.; Long, F.; Wu, J.; Li, P.; Zhao, G.-p.; Zhao, W. Global insights into lysine acylomes reveal crosstalk between lysine acetylation and succinylation in streptomyces coelicolor metabolic pathways. Molecular & Cellular Proteomics, 2021; 20. [Google Scholar]
- Zhang, H.; Li, P.; Ren, S.; Cheng, Z.; Zhao, G.; Zhao, W. ScCobB2-mediated Lysine Desuccinylation Regulates Protein Biosynthesis and Carbon Metabolism in Streptomyces coelicolor*[S]. Molecular & Cellular Proteomics 2019, 18, 2003–2017. [Google Scholar]
- Zhang, D.; Tang, Z.; Huang, H.; Zhou, G.; Cui, C.; Weng, Y.; Liu, W.; Kim, S.; Lee, S.; Perez-Neut, M. Metabolic regulation of gene expression by histone lactylation. Nature 2019, 574, 575–580. [Google Scholar] [CrossRef]
Disclaimer/Publisher’s Note: The statements, opinions and data contained in all publications are solely those of the individual author(s) and contributor(s) and not of MDPI and/or the editor(s). MDPI and/or the editor(s) disclaim responsibility for any injury to people or property resulting from any ideas, methods, instructions or products referred to in the content. |
© 2024 by the authors. Licensee MDPI, Basel, Switzerland. This article is an open access article distributed under the terms and conditions of the Creative Commons Attribution (CC BY) license (http://creativecommons.org/licenses/by/4.0/).
Copyright: This open access article is published under a Creative Commons CC BY 4.0 license, which permit the free download, distribution, and reuse, provided that the author and preprint are cited in any reuse.


