

Submitted:
22 July 2024
Posted:
24 July 2024
You are already at the latest version
Abstract
Background: Diagnosis of acute kidney injury (AKI) relies on serum creatinine (SCr) changes. This study investigated if urinary aminopeptidases are early and predictive biomarkers of cardiac surgery associated-AKI (CSA-AKI). Methods: Glutamyl aminopeptidase (GluAp), alanyl aminopeptidase (AlaAp), dipeptidyl peptidase-4 (DPP4), proteinuria, albuminuria, N-acetyl-β-D-glucosaminidase (NAG) and neutrophile gelatinase-associated lipocalin (NGAL) were measured in urine samples from 44 patients at arrival in Intensity Care Unit (ICU) after cardiac surgery. Sensitivity, specificity, positive and negative predictive value for diagnosis of stages 1, 2 and 3 of AKI were analyzed for the highest quartile of each marker. We also studied the relationship with SCr after surgery, 6- and 12-months glomerular filtration rate (GFR) and other long-term events over the next 5 years. Results: GluAp diagnosed the maximal number of patients that developed stage 2 or 3 of AKI, increasing diagnostic sensitivity from 0 to 75 %. Besides, GluAp and DPP4 was related to the decrease in GFR at 6- or 12-months after surgery. Conclusions: Urinary aminopeptidases are a potential tool for the early diagnosis of CSA-AKI, being GluAp the most effective marker for diagnosing stages 2 or 3 of AKI at ICU admission. GluAp and DPP4 serve as predictive biomarkers for the decrease in GFR.
Keywords:
acute kidney injury
; aminopeptidases
; biomarkers
; tubular lesions
; glomerular filtration rate
; renal replacement therapy
1. Introduction
Acute kidney injury (AKI) is the most common major complication of cardiac surgery [1]. Each year, more than 2 million cardiac surgeries are performed worldwide [2] and the incidence of cardiac surgery-associated AKI (CSA-AKI) varies from 5% to 42% [3]. CSA-AKI is the second most common cause of AKI after sepsis in the intensive care setting and is independently associated with increased morbidity and mortality [4]. CSA-AKI is characterized by an abrupt deterioration in kidney function, which is evidenced by a reduction in glomerular filtration rate (GFR) [4].
Criteria for diagnosing AKI have been based on the Acute Kidney Injury Network (AKIN) and/or the Risk, Injury, Failure, Loss, End Stage Kidney Disease (RIFLE) criteria to define AKI. These criteria are based on serum creatinine (SCr) changes (SCr ≥ 0.3mg/dl or 26.5µmol/l within 48h, or SCr increase by at least 1.5 times baseline) and urine output (<0.5 ml/kg/h for at least 6 hours) [5]. According to the Kidney Disease Improving Global Outcomes (KDIGO) organization, patients that fulfill these criteria are considered to be in stage 1 of AKI [8]. Unfortunately, in patients who have undergone cardiac surgery, the application of these criteria is controversial because fluid resuscitation and fluid loading from the pump priming step during cardiopulmonary bypass are universal. Thus, SCr changes owing to fluid balance can lead to AKI being underdiagnosed [6]. Furthermore, the RIFLE criteria classify all patients who have undergone renal replacement therapy (RRT) as being in the ‘failure’ stage, but the criteria used to initiate RRT are not standardized [9].
SCr level is traditionally used as a biomarker for renal impairment, but it can be affected not only by physiological processes (for example, urinary clearance of creatinine, or muscle mass) but also by drugs that block the tubular secretion of creatinine and by some underlying medical conditions, such as diabetes and liver disease [9]. Furthermore, SCr is considered by some authors as a delayed biomarker because it rises when renal dysfunction is patent and it cannot distinguish the etiology of the lesion. [7]
Clinical nephrology claims for highly sensitive and specific diagnostic and prognostic biomarkers for acute and chronic kidney damage. The early detection of renal disease and the analysis of its progression are important objectives to improve the time course of renal injury.
Injured tubular cells excrete enzymes and other proteins in the urine that are potential biomarkers for the early detection of renal disease [10]. These cells contain aminopeptidases, mainly alanyl aminopeptidase (AlaAp) and glutamyl aminopeptidase (GluAp), that have been described as early and predictive urinary biomarkers of renal injury severity in different animal models [11,12,13].
Dipeptidyl peptidase-4 (DPP4), also called CD26, is a serine protease membrane glycoprotein with exopeptidase activity [14]. DPP4 is expressed on the surface of several cell types, including epithelial, endothelial cells, and lymphocytes [14,15]. This peptidase also exists as a soluble circulating form (sDPP4) in plasma and other body fluids [16]. A strong expression of DPP4 has been observed in the kidney [15], predominantly in the glomeruli and S1–S3 segments of the nephron [17], as well as in vascular endothelial cells, suggesting that this protein may play a role in renal and cardiovascular function [18], as well as in diabetes, hypertension, and chronic kidney disease progression [17].
This work aimed to investigate if the determination of GluAp, AlaAp and/or DPP4 in urine collected at admission in the intensive care unit (ICU) could be useful in the early diagnosis of CSA-AKI, comparing their diagnostic sensitivity and specificity with AKIN criteria and other urinary markers such as proteinuria, albuminuria, NAG and NGAL. Besides, we analyzed their relationship with the needing of RRT, the length of stay in ICU, the glomerular filtration rate (GFR) determined 6 and 12 months after surgery, as well as with subsequent hospitalizations, cardiovascular events, and exitus in the following 5 years.
2. Materials and Methods
2.1. Study Design
44 patients undergoing cardiac surgery without a previous history of renal dysfunction were selected for the study. Blood samples were taken before surgery, at income in ICU, at 12, at 48 hours, at 6 months and at 12 months after surgery. Urine samples were collected at income in ICU. SCr was measured in blood samples. GFR was calculated at 6 and 12 months after surgery using CKD-EPI equation. Creatinine, proteinuria, albuminuria, GluAp, AlaAp, DPP4, N-acetyl-β-D-glucosaminidase (NAG) activity and neutrophil gelatinase-associated lipocalin (NGAL) were measured in all urine samples at income in ICU.
SCr values were used to classify patients in their corresponding stage of AKI: stage 1 (increased creatinine of ≥ 0.3 mg/dl or increase to ≥150%-200% from baseline); stage 2 (increased creatinine from >200%-300%) and stage 3 (increased creatinine to >300% from or SCr ≥ 4 mg/dl). For statistical purposes, patients classified as stage 3 were included in the same group as stage 2 throughout the manuscript.
2.2. Analytical Procedures
Blood samples were centrifugated 15 minutes at 1000 g and SCr was measured immediately in Clinical Laboratory Unit of the hospital.
Urine samples were centrifugated at 1000 g during 15 minutes and frozen at -80 ºC until analysis. No special aditives were added.
Urinary creatinine, proteinuria, albuminuria and NAG activity were determined by an autoanalyzer Spin120. Reagents for proteinuria (ref. MI1001025), albuminuria (ref. 1107170), and creatinine-Jaffé method (ref. MI1001111) were provided by Spinreact (Barcelona, Spain). The reagent for NAG (ref. DZ062A-K) was purchased from Dyazyme Laboratories (Poway, CA, U.S.A.). GluAp was measured in urine samples using a commercial kit of ELISA purchased from GeneBio Systems (Burlington, ON, Canada). DPP4 was measured in urine samples using a commercial kit of ELISA purchased from Assaypro (St. Charles, MO, USA). AlaAp and NGAL were measured with a kit of ELISA from Boster Bio (Pleasanton, CA, USA). All analytes were measured in duplicate.
2.3. Statistical Analysis
We used t test for the analysis of continuous variables with normal distribution and Mann-Whitney W (Wilcoxon) test when data did not correspond to a normal distribution. Simple ANOVA with Bonferroni’s test or Kruskal- Wallis were used when comparing more than 2 groups. Differences were considered statistically significant at P<0.05 level.
Comparison of different rates between groups was carried out using χ2 test. Differences were considered statistically significant at P<0.05 level.
Factorial ANOVA for paired data was used to compare the evolution of SCr and GFR taking AKI as inter-subject factor and each time-point as intra-subject factor. Differences were analyzed with Bonferroni’s test and were considered statistically significant at P<0.05 level. The same analysis was used to compare the evolution of SCr and GFR taking the high quartile of each marker as inter-subject factor.
All statistical analysis were carried out with StatGraphics 19 ®.
3. Results
3.1. Demographic Characteristics and Long-Term Events in Patients that Developed Aki And Patients that Did Not Develop Aki After Cardiac Surgery
43.2 % of patients (n=19) developed AKI after surgery. AKI patients were found to be significantly older than patients that did not develop AKI, although no differences were found in gender distribution (Table 1). Patients that developed AKI displayed a higher percentage of needing renal replacement therapy and exitus, but there were not any significant differences in the length of stay in ICU after surgery, subsequent hospitalizations or cardiovascular events.
25 % of patients (n=11) were diagnosed with stage 1 of AKI, 11.4 % of patients (n=5) developed AKI stage 2 and 6.82 % (n=3) of patients developed AKI stage 3. Patients in stage 2 or 3 (n=8) were treated as an only group for statistical purposes. In this group, a significant percentage of patients needed RRT, but there were no significant differences in the rest of the long-term events (Table 2).
3.2. Evolution of SCr after Cardiac Surgery
AKI patients (n=19) showed a significant increase in SCr concentrations at income in ICU, 12 and 48 hours after surgery when compared with patients that did not develop AKI (No AKI, n=25). SCr was also increased 12 and 48 hours after surgery when it was compared to their own basal levels (Figure 1a). SCr concentration was significantly increased 12 and 48 hours after surgery in patients that developed stage 2 or 3 of AKI (n=8). Nevertheless, patients in stage 1 of AKI (n=11) showed a transient increase in SCr at income in ICU and 12 hours after surgery, but there were not any significant differences 48 hours after surgery in comparison with their own basal levels or with patients that did not develop AKI (Figure 1b).
3.3. Evolution of Glomerular Filtration Rate
AKI patients showed a significant decrease in GFR 6 months after surgery in comparison with patients that did not develop AKI, but there were not any statistical differences in GFR in comparison with their own basal levels in any group of patients (Figure 2a). GFR was decreased in AKI-1 and AKI-2+3 at 6 and 12 months after surgery, but differences did not reach significance (Figure 2b).
3.4. Urinary Markers at Income in ICU
To analyze if urinary markers can contribute to early diagnosis of AKI, proteinuria, albuminuria, NAG, NGAL, GluAp, AlaAp and DPP4 were measured in urine samples obtained at income in ICU. These results are displayed in Table 3 and Table 4.
Albuminuria was the only marker significantly increased in the urine of AKI patients at income in ICU in comparison with patients that did not develop AKI (Table 3). Patients that developed stage 2 or 3 of AKI displayed a higher excretion of GluAp and NAG activity at income in ICU in comparison with No AKI or AKI-1 patients. The other tubular enzymes, AlaAp and DPP4, were also increased in urine but differences were not statistically significant (Table 4).
3.5. Sensitivity and Specificity of Urinary Biomarkers at Income in ICU
Cut-off value (COV), positive predictive value (PPV, %), negative predictive value (NPV, %), sensitivity (Sens, %), specificity (Spec, %) and percentage of patients correctly diagnosed of AKI (CDP) were calculated for the highest quartile of each biomarker at income in ICU. Albuminuria, NAG, GluAp and DPP4 could correctly diagnose 63.6 % of patients, a greater percentage than AKIN criteria that was 61.4 %, maintaining specificity over 80 % and increasing sensitivity from 10.5 % to 36.8 % (Table 5).
In the case of stage 2 or 3 of AKI, GluAp was the marker that served to correctly diagnose a higher percentage of patients at income in ICU (84.1 %) showing a sensitivity of 75 % with 86.1 % of specificity and the highest positive (54.5 %) and negative (93.9 %) predictive values. On the contrary, AKIN criteria were not useful to diagnose any patient with stage 2 or 3 of AKI at income in ICU, because none of these patients displayed more than a 200 % of increase in SCr at this point. Therefore, determination of urinary GluAp at income in ICU is a better diagnostic tool than other urinary markers or even AKIN criteria for stage 2 or 3 of AKI.
3.6. Urinary Markers and Evolution of SCr after Cardiac Surgery
Patients that showed a higher excretion of GluAp, AlaAp, DPP4 and NAG at income in ICU, included in the highest quartile of each marker, displayed a significant increase in SCr at different points after surgery in comparison not only with their own basal level of SCr but also with patients that excreted low levels of these tubular enzymes (Figure 3). Furthermore, patients with low levels of these three enzymes did not show a significant increase in SCr at any time point after surgery.
On the contrary, patients with high levels of proteinuria, albuminuria or NGAL did not show any significant increase in SCr when compared with the group of patients that excreted low levels of these markers. Furthermore, patients that excreted low or medium levels of proteinuria and NGAL showed a significant increase in SCr in comparison with their own basal level (Figure 4).
3.7. Urinary Biomarkers and Evolution of GFR
Patients that showed a higher excretion of GluAp at income in ICU displayed a significant decrease in GFR determined 6 and 12 months after surgery in comparison with patients that excreted low levels of GluAp (Figure 5a). Besides, patients with higher levels of DPP4 showed a significant decrease in GFR 12 months after surgery in comparison not only with patients that excreted low levels of DPP4 but also when it was compared with their own basal levels (Figure 5c). We also observed that patients that excreted higher levels of NAG displayed a decreased GFR before surgery and 12 months after surgery when compared with patients that excreted lower levels of NAG at income in ICU. GFR was not decreased in comparison with their basal levels, because it was already decreased before surgery in these patients (Figure 5c).
Patients that excreted higher levels of proteinuria and NGAL at income in ICU displayed a decreased GFR 12 months after surgery when compared with patients that excreted lower levels of both markers at income in ICU, but it was not decreased in comparison with their own basal levels. We did not find any significant difference in GFR at any point in the case of albuminuria (Figure 6).
3.8. Urinary Biomarkers and Long-Term Events
There were not any significant differences in the length of stay in ICU (Table 7), subsequent hospitalizations (Table 8), needing of RRT (Table 9), cardiovascular events (Table 10) or exitus (Table 11) between patients that displayed higher levels of the markers at income in ICU and the rest of patients. Nevertheless, it is remarkable that the percentage of patients that needed RRT was 6-fold higher (Table 9) in the case of patients that excreted higher levels of GluAp at income in ICU and the percentage of exitus was 3-fold higher (Table 11) than patients that exhibited low levels of GluAp at income in ICU.
4. Discussion
The main finding in this study is that GluAp, AlaAp and DPP4 are early biomarkers of cardiac surgery-associated AKI. Furthermore, the determination of GluAp in urine collected at income in ICU just after surgery increased diagnostic sensitivity for stage 2 or 3 of AKI compared with other urinary markers or with AKIN criteria, increasing the total number of correctly diagnosed patients. Besides, the excretion of GluAp and DPP4 at income in ICU was found to be related to the decrease in GFR 6 and/or 12 months after surgery.
GluAp, AlaAp and DPP4 are enzymes that are present in brush-border cells of proximal renal tubule [19,20,21,22]. Therefore, acute kidney injury would evoke apoptosis and/or necrosis of these cells and a higher excretion in urine of these tubular proteins. Accordingly, Westhuyzen et al. [23] reported that urinary NAG levels in addition to other tubular enzymes were highly sensitive in detecting AKI in a population of critically ill adult patients, preceding increases in SCr. The usefulness of GluAp and AlaAp as early biomarkers was demonstrated in our laboratory in cisplatin-treated rats, an experimental model of AKI [11,12]. In this previous study, GluAp and AlaAp urinary enzymatic activities were found to be increased 24 hours after cisplatin-injection and these activities could predict the rise in SCr and the renal lesions in cisplatin-treated animals.
In the present work, we have investigated the role of GluAp, AlaAp and DPP4 as biomarkers of CSA-AKI analyzing their diagnostic sensitivity and specificity not only for patients that develop AKI at all stages, but also for patients that develop stage 2 or 3 of AKI. In AKI patients, including any stage of AKI, we found that albuminuria, NAG, GluAp and DPP4 were the markers with the greatest sensitivity (36.8 %). Nevertheless, a higher sensitivity for urinary NGAL was found in other studies when it was determined 12 hours after surgery [24].
Patients that develop stage 2 or 3 of AKI did not show any significant differences in SCr at income in ICU in our study according to the statement that SCr accumulates over time and that changes in creatinine concentration become apparent only when the kidneys have lost 50% of their functional capacity [25,26]. Therefore, the finding of markers that improve the number of correctly diagnosed patients at this point takes special relevance. In this way, it is remarkable that the four urinary markers that stem from renal tubules (GluAp, AlaAp, DPP4 and NAG) were augmented at income in ICU in the patients that showed the highest levels of SCr at 12 or 48 hours after surgery. Nevertheless, a higher excretion of proteinuria, albuminuria and NGAL was not found to be related to the rise in SCr. These findings demonstrate that tubular lesions induced during cardiac surgery are related with the later development of AKI, as suggested by some authors [7,27] and that tubular enzymes can be considered as early biomarkers of AKI. Besides, these results show that the probability to develop AKI is lower in patients with an intact tubular epithelium after surgery. In our study, GluAp at income in ICU was the tubular enzyme that exhibited the greatest diagnostic sensitivity (75 %) for patients that develop stage 2 or 3 of AKI, whereas AKIN criteria were not able to diagnose any patient at this point. Similarly, other authors found that SCr started to rise in AKI patients 48 hours after cardiopulmonary bypass [28], but they did not find any differences in SCr 24 hours after surgery. GluAp increased to 84.1 % of the total number of correctly diagnosed patients in our study, maintaining specificity over 80 % at the same time. Note that AKIN criteria displays 100 % of specificity at income in ICU because these are the criteria for diagnosis of AKI so all patients that did not develop AKI were included as true negative patients, and no other marker can reach the diagnostic specificity of the criteria that is actually used to classify the stage of AKI..
In our study, the percentage of patients that needed RRT and the percentage of exitus were significantly higher in patients that developed AKI coinciding with the findings of Hobson et al. [3]. We also found that patients with AKI displayed a decrease in TFG 6 months after surgery, although there were not any statistical differences at 12 months. This relationship between AKI and chronic kidney disease (CKD) has been previously reported by several authors [29,30]. Besides, we analyzed if the excretion of the different markers could be related with long-term events, finding a significant relationship between a higher excretion of GluAp at income in ICU and the decrease in TFG 6 months after surgery. Several markers (GluAp, DPP4, NAG, proteinuria and NGAL) were found to be related with the decrease in TFG 12 months after surgery. These findings demonstrate that tubular lesions are related to the decrease in renal function and the development of CKD. Therefore, the determination of these markers at different time points after surgery could be a potential tool to evaluate the progression of renal disease in these patients.
The main limitation of the study is that the percentage of patients that develop AKI in stage 2 or 3 after cardiac surgery constitutes approximately 20 % of the total patients. This fact supposes a clear limitation for statistical analysis that we have solved, at least in part, by comparing the higher quartile of each marker not only with the rest of quartiles but also with the own basal level of SCr or TFG, yielding more reliable statistical results. Anyway, the scarce number of patients in some long-term events like exitus or needing of RRT makes difficult to reach statistical significance even when the percentage of patients that suffer these events is clearly higher for the highest quartile of some markers like GluAp.
Future studies that include a higher number of patients undergone to cardiac surgery should be accomplished to further investigate aminopeptidasic enzymes as markers of AKI and to analyze their predictive role over long-term events. In this way, the determination of these enzymes at different time points after cardiac surgery could serve to study the status of tubular epithelium after surgery in these patients, because our findings demonstrate a direct relationship between the excretion of tubular enzymes and the fall of renal function. Besides, the determination of these enzymes in urine could be of interest in other pathologies or events that induce AKI.
5. Conclusions
We conclude that urinary aminopeptidases are useful in the early diagnosis of CSA-AKI because of their high sensitivity and specificity at arrival in ICU just after surgery. Our results also demonstrate that tubular lesions, which are quantified by these urinary markers, are present in patients that reach the highest concentrations of SCr and that tubular lesions are related to the long-term fall in renal function. GluAp was the best marker in our study for the diagnosis of stage 2 or 3 of AKI at income in ICU. Both GluAp and DPP4 were related to the decrease in TFG at 6 or 12 months after surgery.
6. Patents
Rosemary Wangensteen and Antonio Osuna are co-inventors of the patent “Aminopeptidases as markers of renal damage” granted on 2013/08/05 with publication number 2382960. There is not any other relevant declaration related to employment, consultancy, patents, products in development, or modified products.
Author Contributions
All authors have made substantial contributions to conceptualization, F.M., A.O., M.C.R.F. and R.W.; methodology, N.R.C., E.P., M.M.J.Q., F.M., M.C.R.F. and R.W.; formal analysis, E.P., F.M., A.O., M.C.R.F and R.W.; investigation, N.R.C., E.P., M.M.J.Q., F.M. and R.W.; resources, N.R.C., E.P., F.M., A.O., M.C.R.F. and R.W.; data curation, N.R.C., E.P., M.M.J.Q., F.M. and R.W.; writing—original draft preparation, N.R.C., R.W.; writing—review and editing, N.R.C., E.P., F.M., M.M.J.Q., A.O., M.C.R.F. and R.W.; visualization, X.X.; supervision, X.X.; funding acquisition, A.O. and R.W. All authors have read and agreed to the published version of the manuscript.”.
Funding
This research was funded by the Carlos III Health Institute of Spain grant number PI18/01715 and the Cooperative Research Network RICORS2040, RD21/0005/0015.
Institutional Review Board Statement
“The study was conducted in accordance with the Declaration of Helsinki, and approved by the Ethics Committee of Virgen de las Nieves University Hospital with approval ID PI-0668-2013 on 01/05/2013.
Informed Consent Statement
Informed consent was obtained from all subjects involved in the study.
Data Availability Statement
The data presented in this study are available in https://docs.google.com/spreadsheets/d/1vhtNR-dx3wSBHaT-heeSOrxH6gGJpkcO/edit?usp=sharing&ouid=113469746811828789402&rtpof=true&sd=true.
Acknowledgments
This study was supported by the grant PI18/01715 from the Carlos III Health Institute of Spain and the Cooperative Research Network RICORS2040, RD21/0005/0015.
Conflicts of Interest
The authors declare no conflict of interest.
References
- Bove, T.; Monaco, F.; Covello, R.D.; Zangrillo, A. Acute renal failure and cardiac surgery. HSR Proc. Intensive Care Cardiovasc. Anesth. 2009, 1, 13–21. [Google Scholar]
- Weisse, A.B. Cardiac surgery: a century of progress. Tex. Heart Inst. J. 2011, 38, 486–490. [Google Scholar] [PubMed]
- Hobson, C.E.; Yavas, S.; Segal, M.S.; Schold, J.D.; Tribble, C.G.; Layon, A.J.; Bihorac, A. Acute kidney injury is associated with increased long-term mortality after cardiothoracic surgery. Circulation. 2009, 119, 2444–2453. [Google Scholar] [CrossRef] [PubMed]
- Mao, H.; Katz, N.; Ariyanon, W.; Blanca-Martos, L.; Adýbelli, Z.; Giuliani, A.; Danesi, T.H.; Kim, J.C.; Nayak, A.; Neri, M.; Virzi, G.M.; Brocca, A.; Scalzotto, E.; Salvador, L.; Ronco, C. Cardiac surgery-associated acute kidney injury. Cardiorenal Med. 2013, 3, 178–199. [Google Scholar] [CrossRef] [PubMed]
- Lopes, J.A.; Jorge, S. The RIFLE and AKIN classifications for acute kidney injury: a critical and comprehensive review. Clin. Kidney J. 2013, 6, 8–14. [Google Scholar] [CrossRef] [PubMed]
- Englberger, L.; Suri, R.M.; Li, Z.; Casey, E.T.; Daly, R.C.; Dearani, J.A.; Schaff, H.V. Clinical accuracy of RIFLE and Acute Kidney Injury Network (AKIN) criteria for acute kidney injury in patients undergoing cardiac surgery. Crit. Care. 2011, 15, R16. [Google Scholar] [CrossRef]
- Vaidya, V.S.; Ferguson, M.A.; Bonventre, J.V. Biomarkers of acute kidney injury. Annu. Rev. Pharmacol. Toxicol. 2008, 48, 463–493. [Google Scholar] [CrossRef] [PubMed]
- Haase-Fielitz, A.; Bellomo, R.; Devarajan, P.; Story, D.; Matalanis, G.; Dragun, D.; Haase, M. Novel and conventional serum biomarkers predicting acute kidney injury in adult cardiac surgery - a prospective cohort study. Crit. Care Med. 2009, 37, 553–560. [Google Scholar] [CrossRef] [PubMed]
- Samra, M.; Abcar, A.C. False estimates of elevated creatinine. Perm. J. 2012, 16, 51–52. [Google Scholar] [CrossRef]
- Lisowska-Myjak, B. Serum and urinary biomarkers of acute kidney injury. Blood Purif. 2010, 29, 357–365. [Google Scholar] [CrossRef]
- Quesada, A.; Vargas, F.; Montoro-Molina, S.; O’Valle, F.; Rodríguez-Martínez, M.D.; Osuna, A.; Prieto, I.; Ramírez, M.; Wangesteen, R. Urinary aminopeptidase activities as early and predictive biomarkers of renal dysfunction in cisplatin-treated rats. PLoS One. 2012, 7, e40402. [Google Scholar] [CrossRef] [PubMed]
- Montoro-Molina, S.; Quesada, A.; Zafra-Ruiz, P.V.; O’Valle, F.; Vargas, F.; de Gracia, M. del C. ; Osuna, A.; Wangesteen, R. Immunological detection of glutamyl aminopeptidase in urine samples from cisplatin-treated rats. Proteomics Clin Appl. 2015, 9, 630–635. [Google Scholar] [CrossRef]
- Pérez-Abud, R.; Rodríguez-Gómez, I.; Villarejo, A.B.; Moreno, J.M.; Wangensteen, R.; Tassi, M.; O’Valle. F.; Osuna, A.; Vargas, F. Salt sensitivity in experimental thyroid disorders in rats. Am J Physiol Endocrinol Metab. 2011, 301, E281–287. [Google Scholar] [CrossRef] [PubMed]
- Lambeir, A.M.; Durinx, C.; Scharpé, S.; De Meester, I. Dipeptidyl-peptidase IV from bench to bedside: an update on structural properties, functions, and clinical aspects of the enzyme DPP IV. Crit Rev Clin Lab Sci. 2003, 40, 209–294. [Google Scholar] [CrossRef]
- Kenny, A.J.; Booth, A.G.; George, S.G.; Ingram, J.; Kershaw, D.; Wood, E.J.; Young, A.R. Dipeptidyl peptidase IV, a kidney brush-border serine peptidase. Biochem J. 1976, 157, 169–182. [Google Scholar] [CrossRef] [PubMed]
- Iwaki-Egawa, S.; Watanabe, Y.; Kikuya, Y.; Fujimoto, Y. Dipeptidyl peptidase IV from human serum: purification, characterization, and Nterminal amino acid sequence. J Biochem. 1998, 124, 428–433. [Google Scholar] [CrossRef] [PubMed]
- Nistala, R.; Savin, V. Diabetes, hypertension, and chronic kidney disease progression: role of DPP4. Am J Physiol Renal Physiol. 2017, 312, F661–F670. [Google Scholar] [CrossRef]
- Zhong, J.; Rao, X.; Rajagopalan, S. An emerging role of dipeptidyl peptidase 4 (DPP-4) beyond glucose control: potential implications in cardiovascular disease. Atherosclerosis. 2013, 226, 305–314. [Google Scholar] [CrossRef]
- Kenny, A.J.; Maroux, S. Topology of microvillar membrane hydrolases of kidney and intestine. Physiol Rev. 1982, 62, 91–128. [Google Scholar] [CrossRef]
- Song, L.; Ye, M.; Trovanovskava, M.; Wilk, S. Rat kidney glutamyl aminopeptidase (aminopeptidase A): molecular identity and cellular localization. Am J Physiol. 1994, 267, F546–F557. [Google Scholar] [CrossRef]
- Liu, R.; Zhang, W.; Luo, M.; Qin, X.; Yang, F.; Wei, Q. iTRAQ-based proteomics and in vitro experiments reveals essential roles of ACE and AP-N in the renin-angiotensin system-mediated congenital ureteropelvic junction obstruction. Exp Cell Res. 2020, 393, 112086. [Google Scholar] [CrossRef]
- Xie, S.; Song, S.; Liu, S.; Li, Q.; Zou, W.; Ke, J.; Wang, C. (Pro)renin receptor mediates tubular epithelial cell pyroptosis in diabetic kidney disease via DPP4-JNK pathway. J Transl Med. 2024, 22, 26. [Google Scholar] [CrossRef] [PubMed]
- Westhuyzen, J.; Endre, Z.H.; Reece, G.; Reith, D.M.; Saltissi, D.; Morgan, T.J. Measurement of tubular enzymuria facilitates early detection of acute renal impairment in the intensive care unit. Nephrol. Dial. Transplant. 2003, 18, 543–551. [Google Scholar] [CrossRef] [PubMed]
- Zhou, F.; Luo, Q.; Wang, L.; Han, L. Diagnostic value of neutrophil gelatinase-associated lipocalin for early diagnosis of cardiac surgery-associated acute kidney injury: a meta-analysis. Eur J Cardiothorac Surg. 2016, 49, 746–755. [Google Scholar] [CrossRef]
- Bonventre, J.V.; Vaidya, V.S.; Schmouder, R.; Feig, P.; Dieterle, F. Next generation biomarkers for detecting kidney toxicity. Nat Biotechnol. 2010, 28, 436–440. [Google Scholar] [CrossRef] [PubMed]
- Devarajan, P. Emerging biomarkers of acute kidney injury. Contrib Nephrol. 2007, 156, 203–212. [Google Scholar] [CrossRef]
- Pickkers, P.; Darmon, M.; Hoste, E.; Joannidis, M.; Legrand, M.; Ostermann, M.; Prowle, J.R.; Schneider, A.; Schetz, M. Acute kidney injury in the critically ill: an updated review on pathophysiology and management. Intensive Care Med. 2021, 47, 835–850. [Google Scholar] [CrossRef]
- Bennett, M.; Dent, C.L.; Ma, Q.; Dastrala, S.; Grenier, F.; Workman, R.; Syed, H.; Ali, S.; Barasch, J.; Devarajan, P. Urine NGAL predicts severity of acute kidney injury after cardiac surgery: a prospective study. Clin J Am Soc Nephrol. 2008, 3, 665–673. [Google Scholar] [CrossRef]
- Chawla, L.S.; Eggers, P.W.; Star, R.A.; Kimmel, P.L. Acute kidney injury and chronic kidney disease as interconnected syndromes. N Engl J Med. 2014, 371, 58–66. [Google Scholar] [CrossRef]
- James, M.T.; Bhatt, M.; Pannu, N.; Tonelli, M. Long-term outcomes of acute kidney injury and strategies for improved care. Nat Rev Nephrol. 2020, 16, 193–205. [Google Scholar] [CrossRef]
Figure 1.
Serum creatinine (SCr) concentration (mg/dl) before surgery, at income in Intensity Care Unit (ICU), 12 hours and 48 hours after surgery in: (a) Patients that did not develop AKI (No AKI, n=25) and patients that developed AKI (n=19). (b) Patients that did not develop AKI (No AKI, n=25), patients that developed stage 1 of AKI (AKI-1, n=11) and patients that developed stage 2 or 3 of AKI (AKI-2+3, n=8). Mean ± SEM are displayed. * p<0.05 vs. patients at their own basal level. + p<0.05 vs. patients that did not develop AKI.
Figure 1.
Serum creatinine (SCr) concentration (mg/dl) before surgery, at income in Intensity Care Unit (ICU), 12 hours and 48 hours after surgery in: (a) Patients that did not develop AKI (No AKI, n=25) and patients that developed AKI (n=19). (b) Patients that did not develop AKI (No AKI, n=25), patients that developed stage 1 of AKI (AKI-1, n=11) and patients that developed stage 2 or 3 of AKI (AKI-2+3, n=8). Mean ± SEM are displayed. * p<0.05 vs. patients at their own basal level. + p<0.05 vs. patients that did not develop AKI.
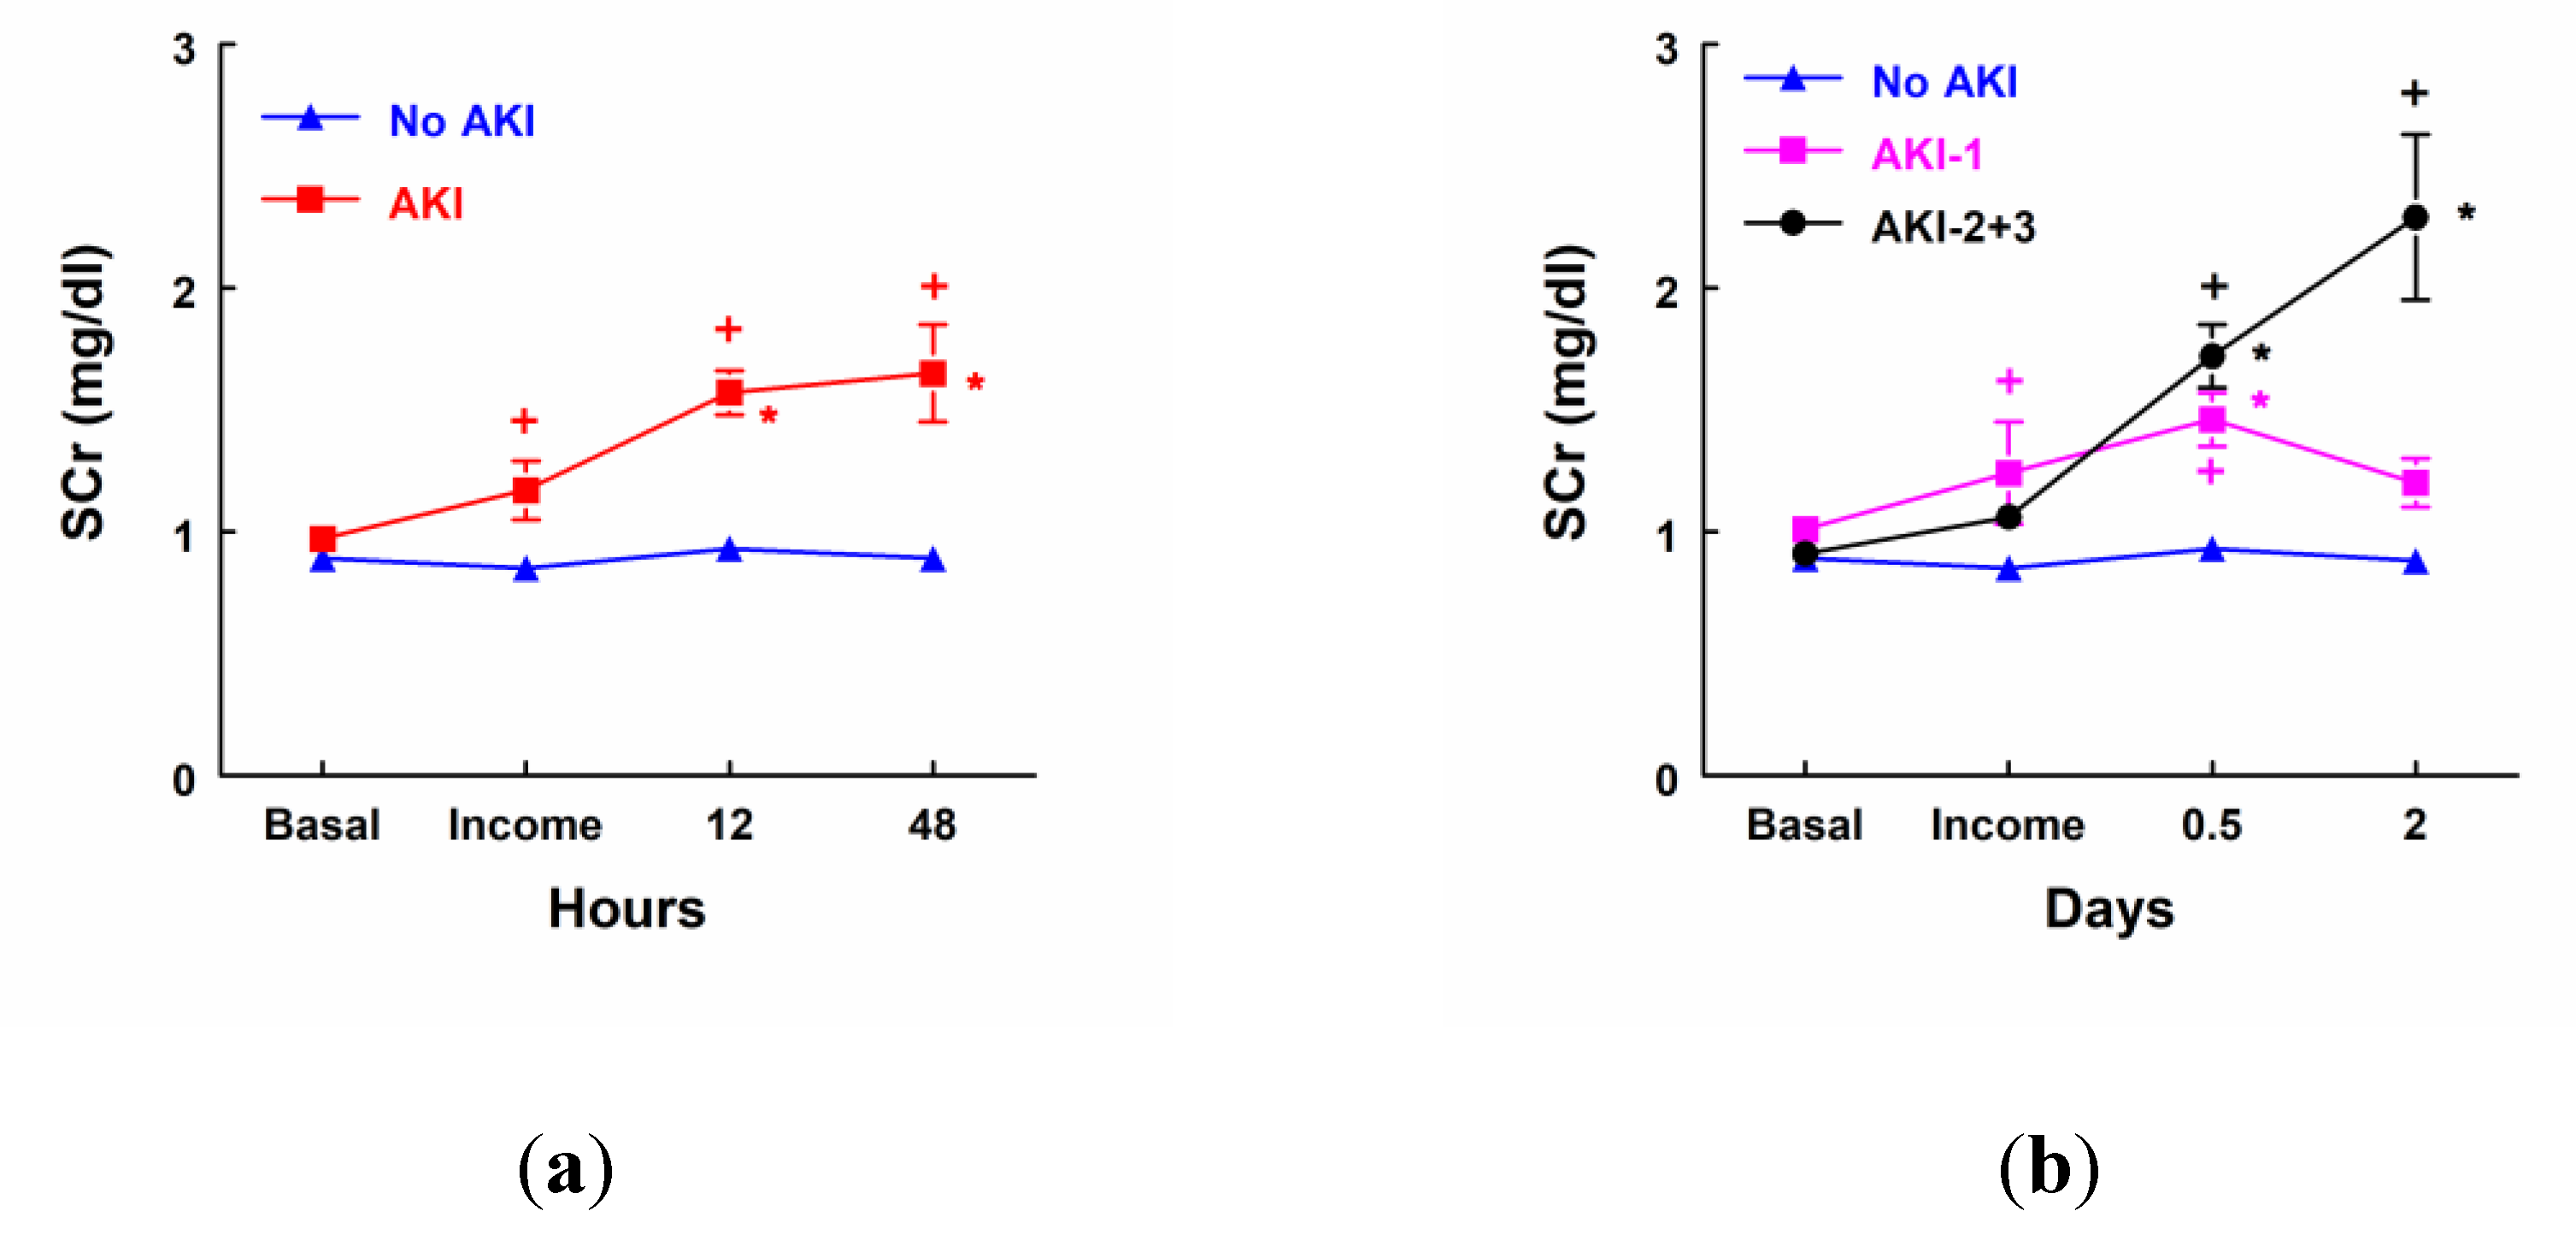
Figure 2.
Glomerular filtration rate (GFR) before surgery, 6 months and 12 months after surgery in: (a) Patients that did not develop AKI (n=23) and patients that developed AKI (n=12). (b) Patients that did not develop AKI (No AKI, n=23), patients that developed stage 1 of AKI (AKI-1, n=7) and patients that developed stage 2 or 3 of AKI (AKI-2+3, n=5). + p<0.05 vs. patients that did not develop AKI. Mean ± SEM are displayed. + p<0.05 vs. patients that did not develop AKI.
Figure 2.
Glomerular filtration rate (GFR) before surgery, 6 months and 12 months after surgery in: (a) Patients that did not develop AKI (n=23) and patients that developed AKI (n=12). (b) Patients that did not develop AKI (No AKI, n=23), patients that developed stage 1 of AKI (AKI-1, n=7) and patients that developed stage 2 or 3 of AKI (AKI-2+3, n=5). + p<0.05 vs. patients that did not develop AKI. Mean ± SEM are displayed. + p<0.05 vs. patients that did not develop AKI.
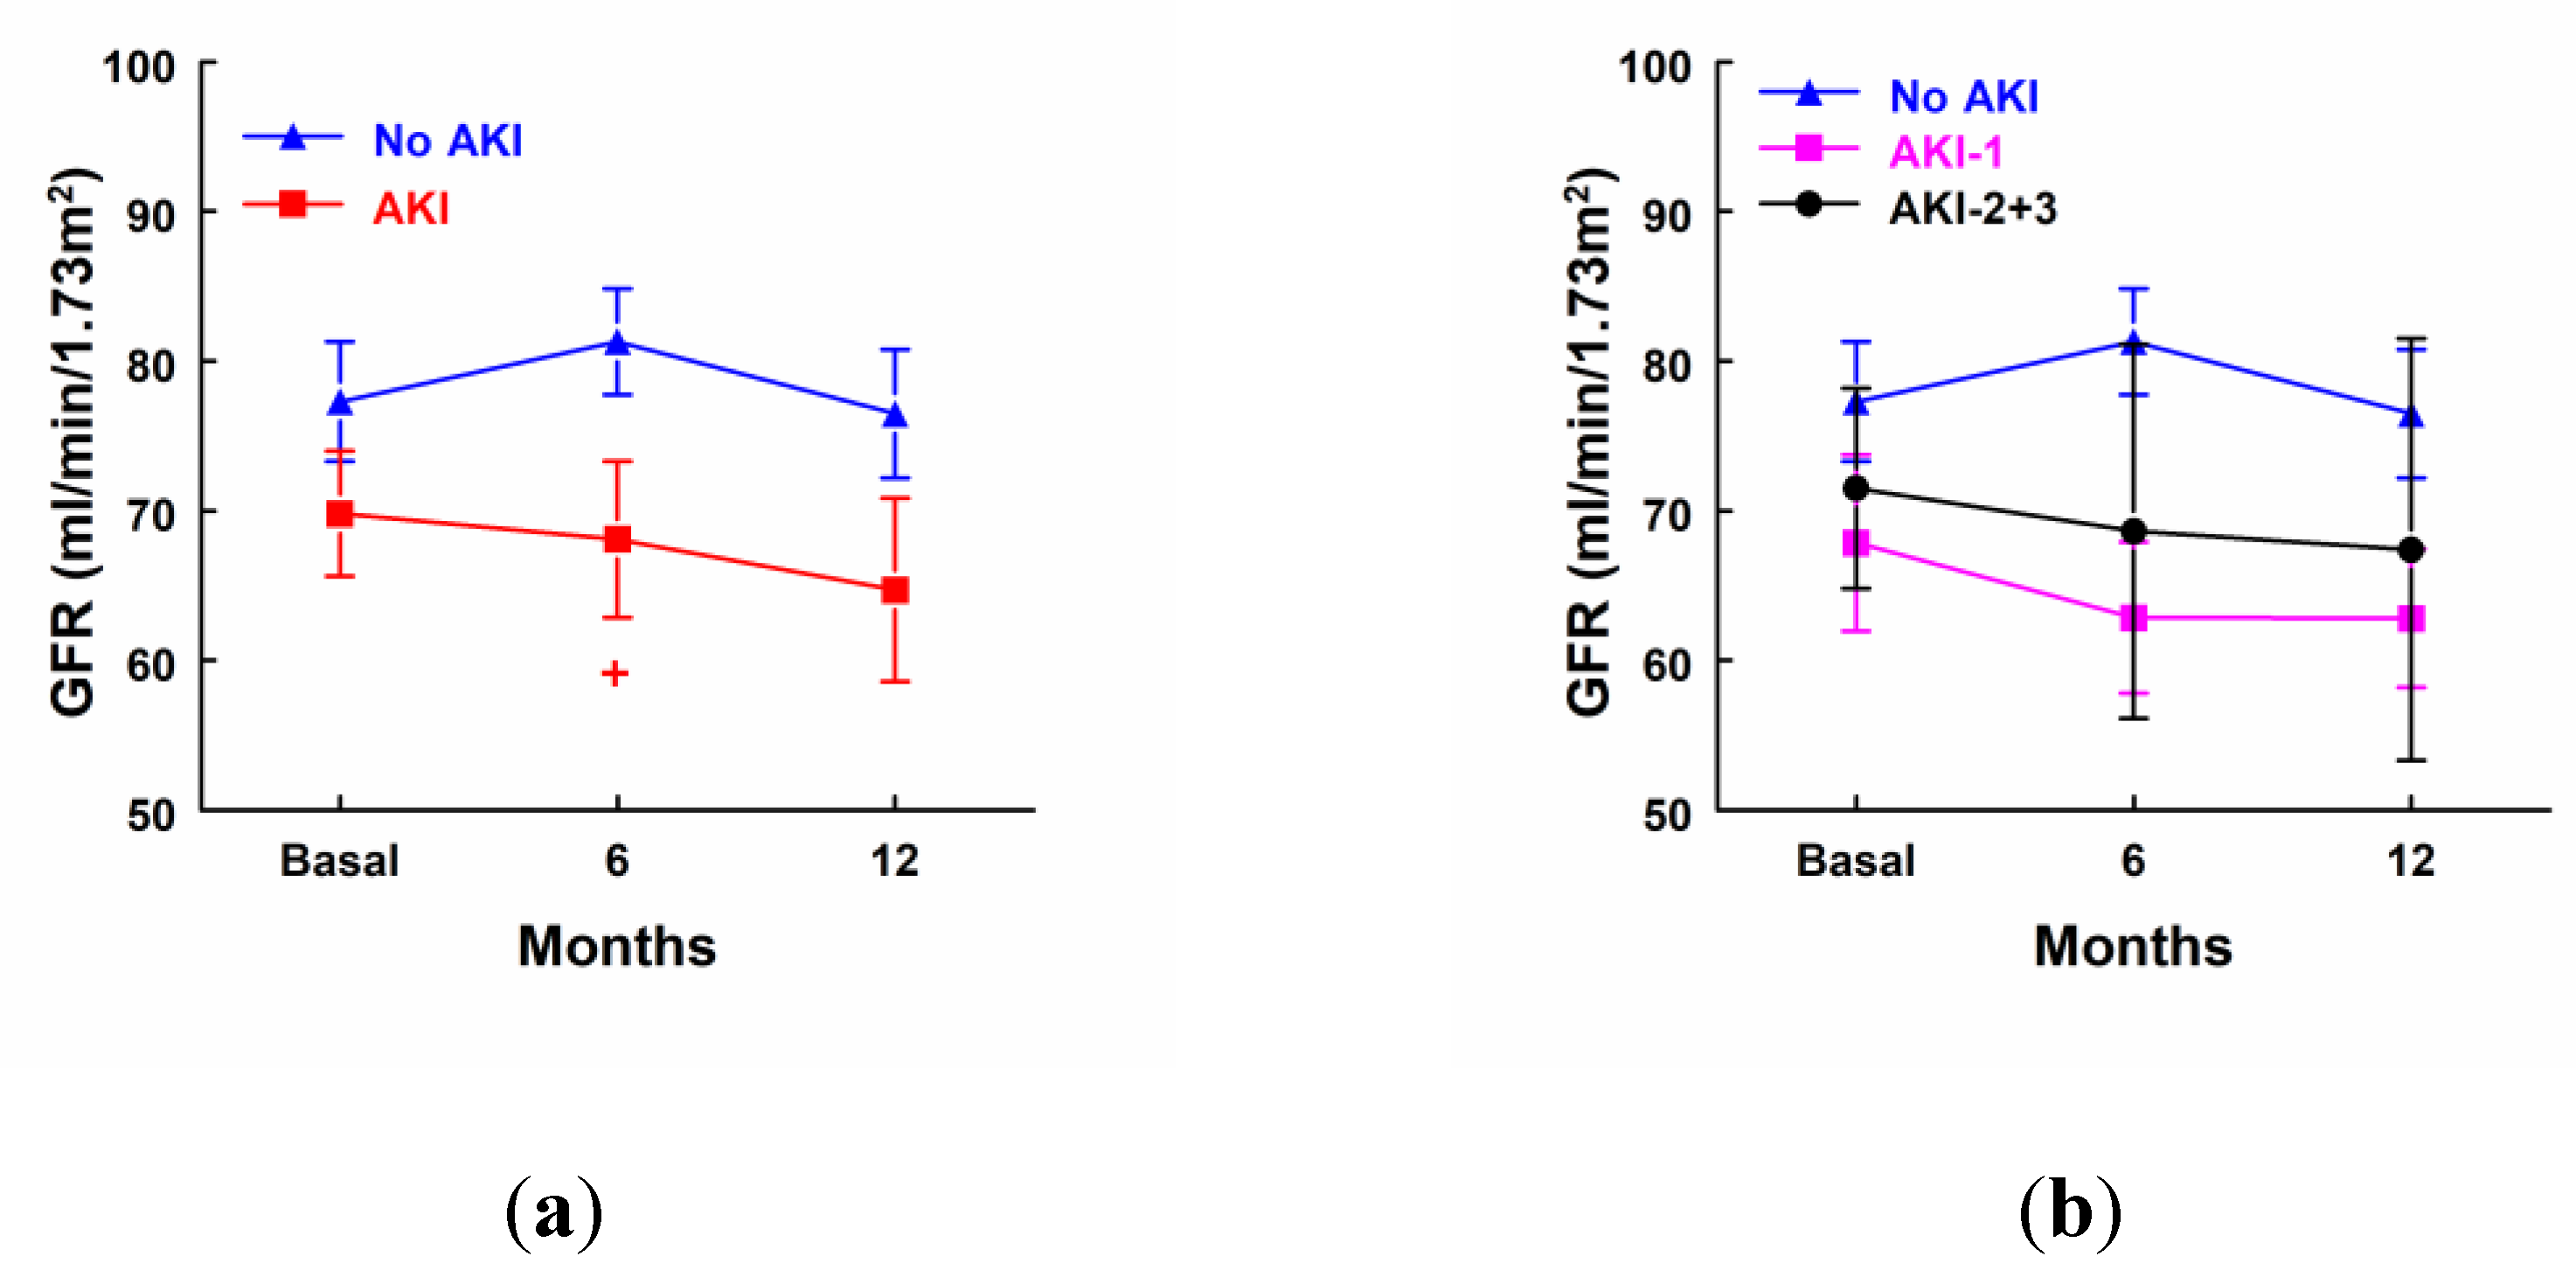
Figure 3.
Concentration of SCr (mg/dl) in patients that showed high levels of GluAp (a), AlaAp (b), DPP4 (c) and NAG (d) at income in ICU (highest quartile, n=11), and patients with low or medium levels of these markers (n=33). Mean ± SEM are displayed. * p<0.05 vs their own basal level. + p<0.05 vs its corresponding Low+Medium cluster.
Figure 3.
Concentration of SCr (mg/dl) in patients that showed high levels of GluAp (a), AlaAp (b), DPP4 (c) and NAG (d) at income in ICU (highest quartile, n=11), and patients with low or medium levels of these markers (n=33). Mean ± SEM are displayed. * p<0.05 vs their own basal level. + p<0.05 vs its corresponding Low+Medium cluster.
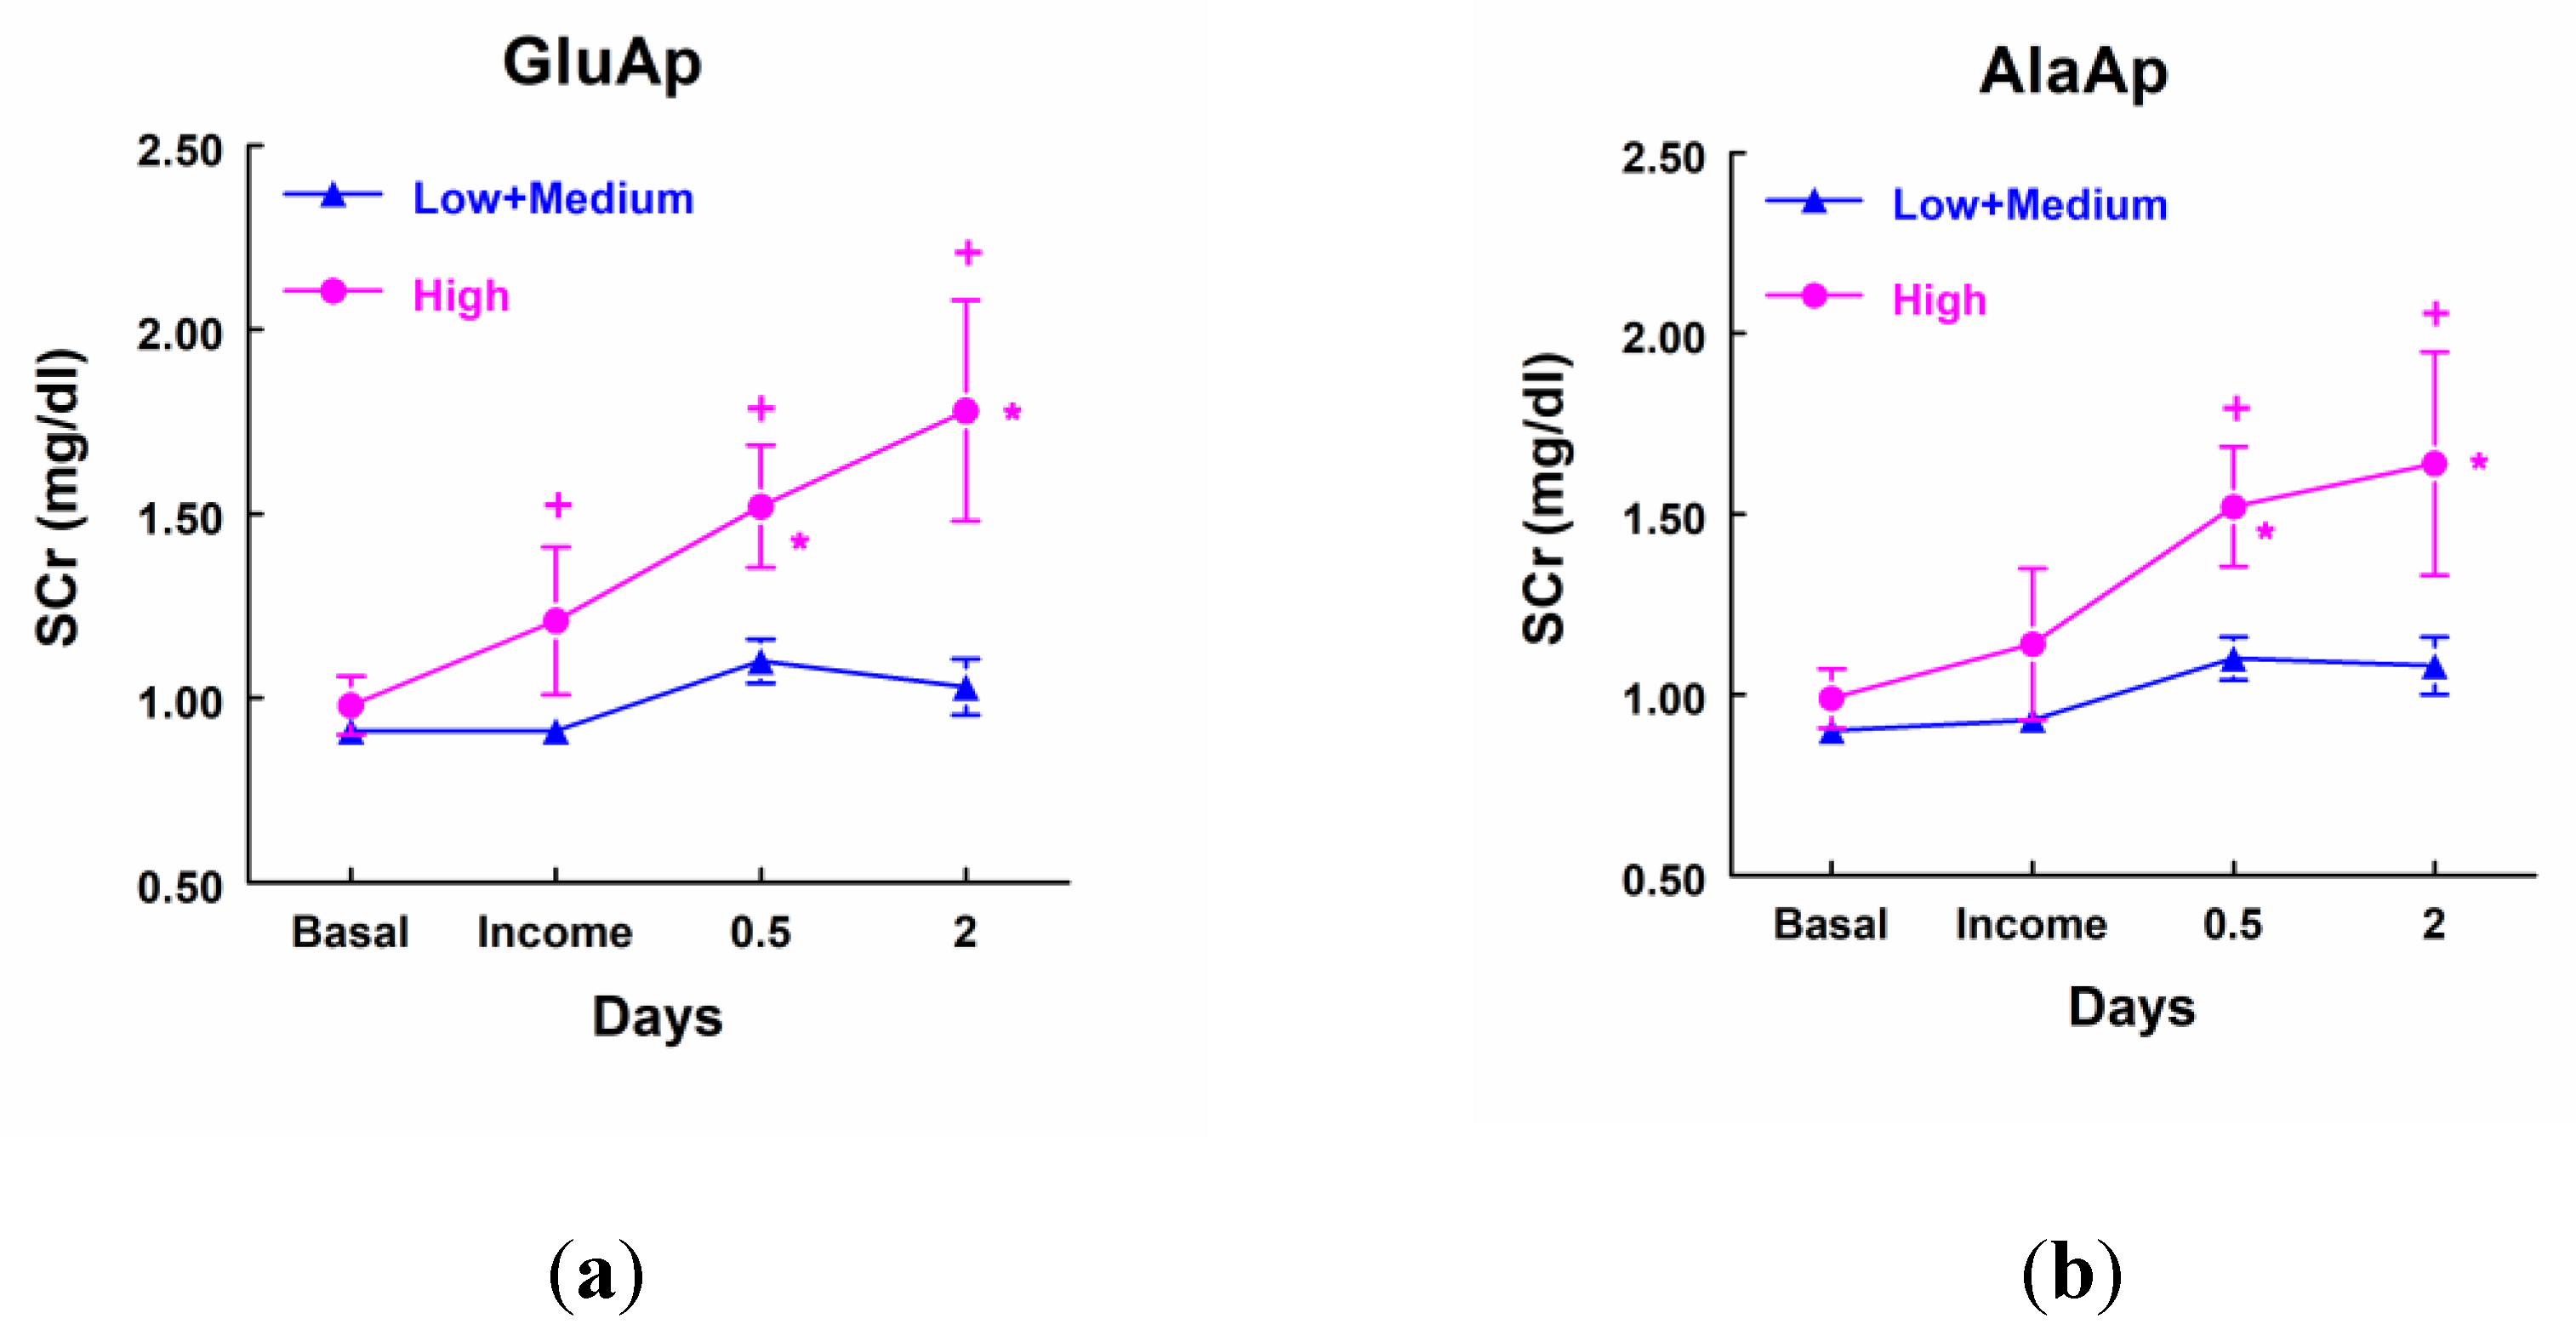
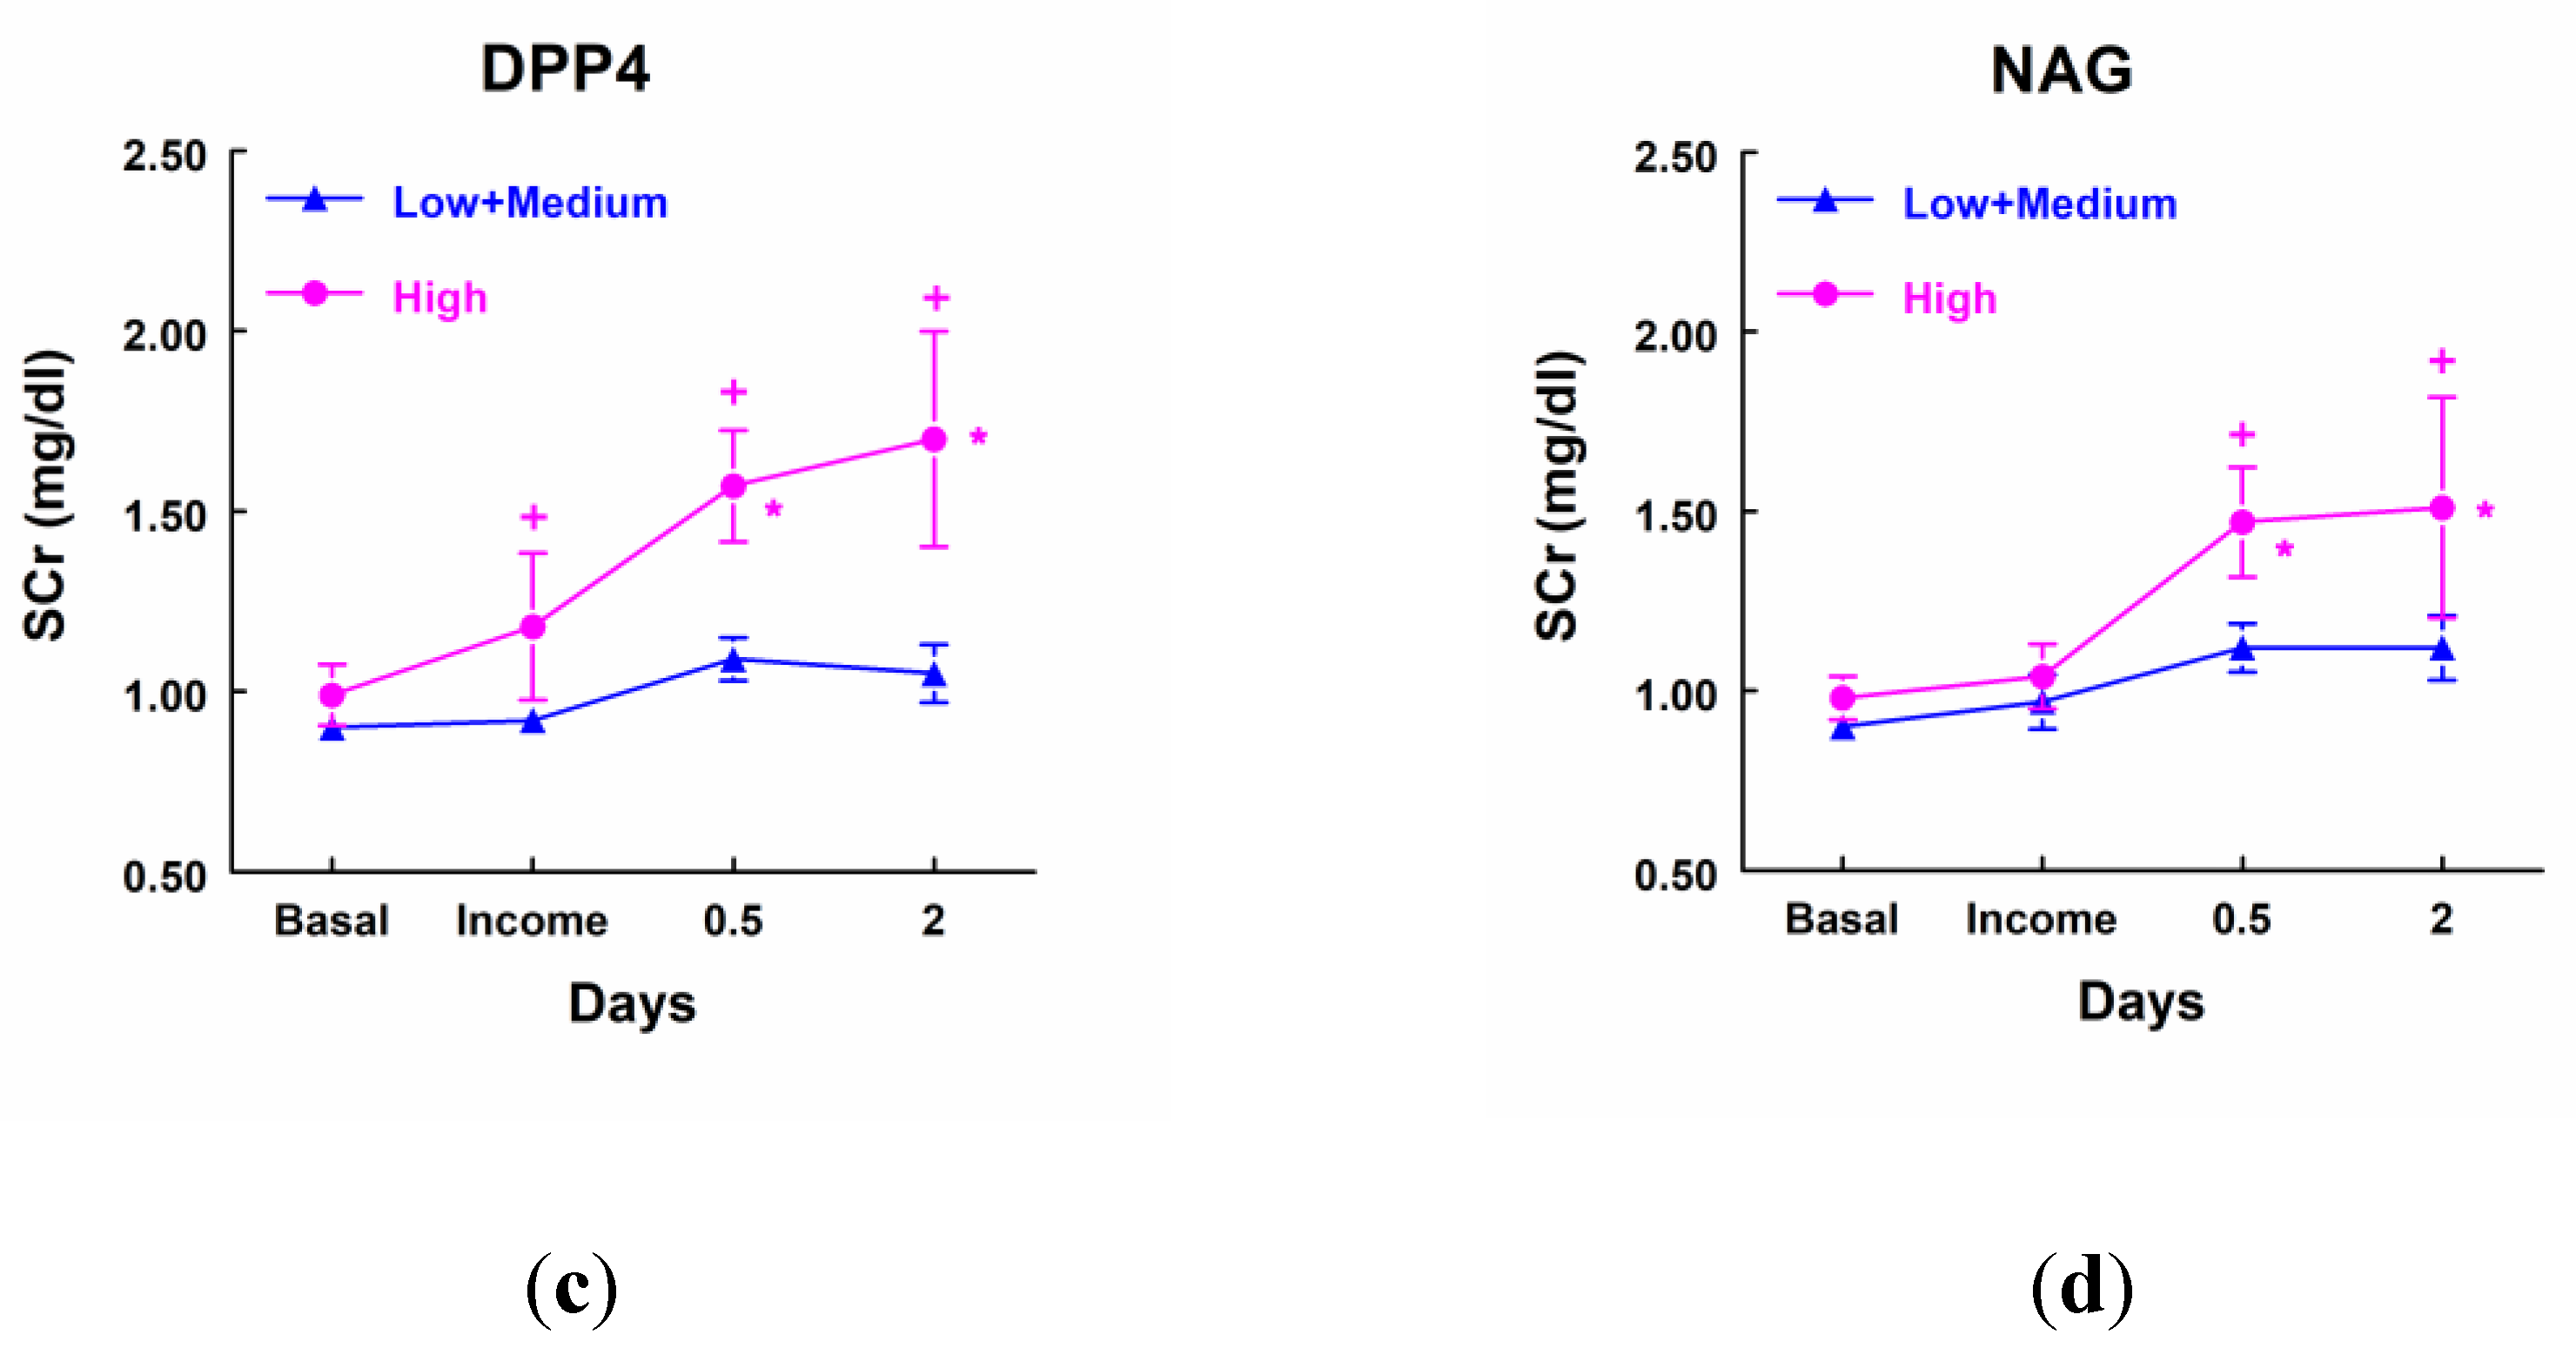
Figure 4.
Concentration of SCr (mg/dl) in patients that showed high levels of proteinuria (a), albuminuria (b) and NGAL (c) at income in ICU (highest quartile, n=11), and patients with low or medium levels of these markers (n=33). Mean ± SEM are displayed. * p<0.05 vs their own basal level.
Figure 4.
Concentration of SCr (mg/dl) in patients that showed high levels of proteinuria (a), albuminuria (b) and NGAL (c) at income in ICU (highest quartile, n=11), and patients with low or medium levels of these markers (n=33). Mean ± SEM are displayed. * p<0.05 vs their own basal level.
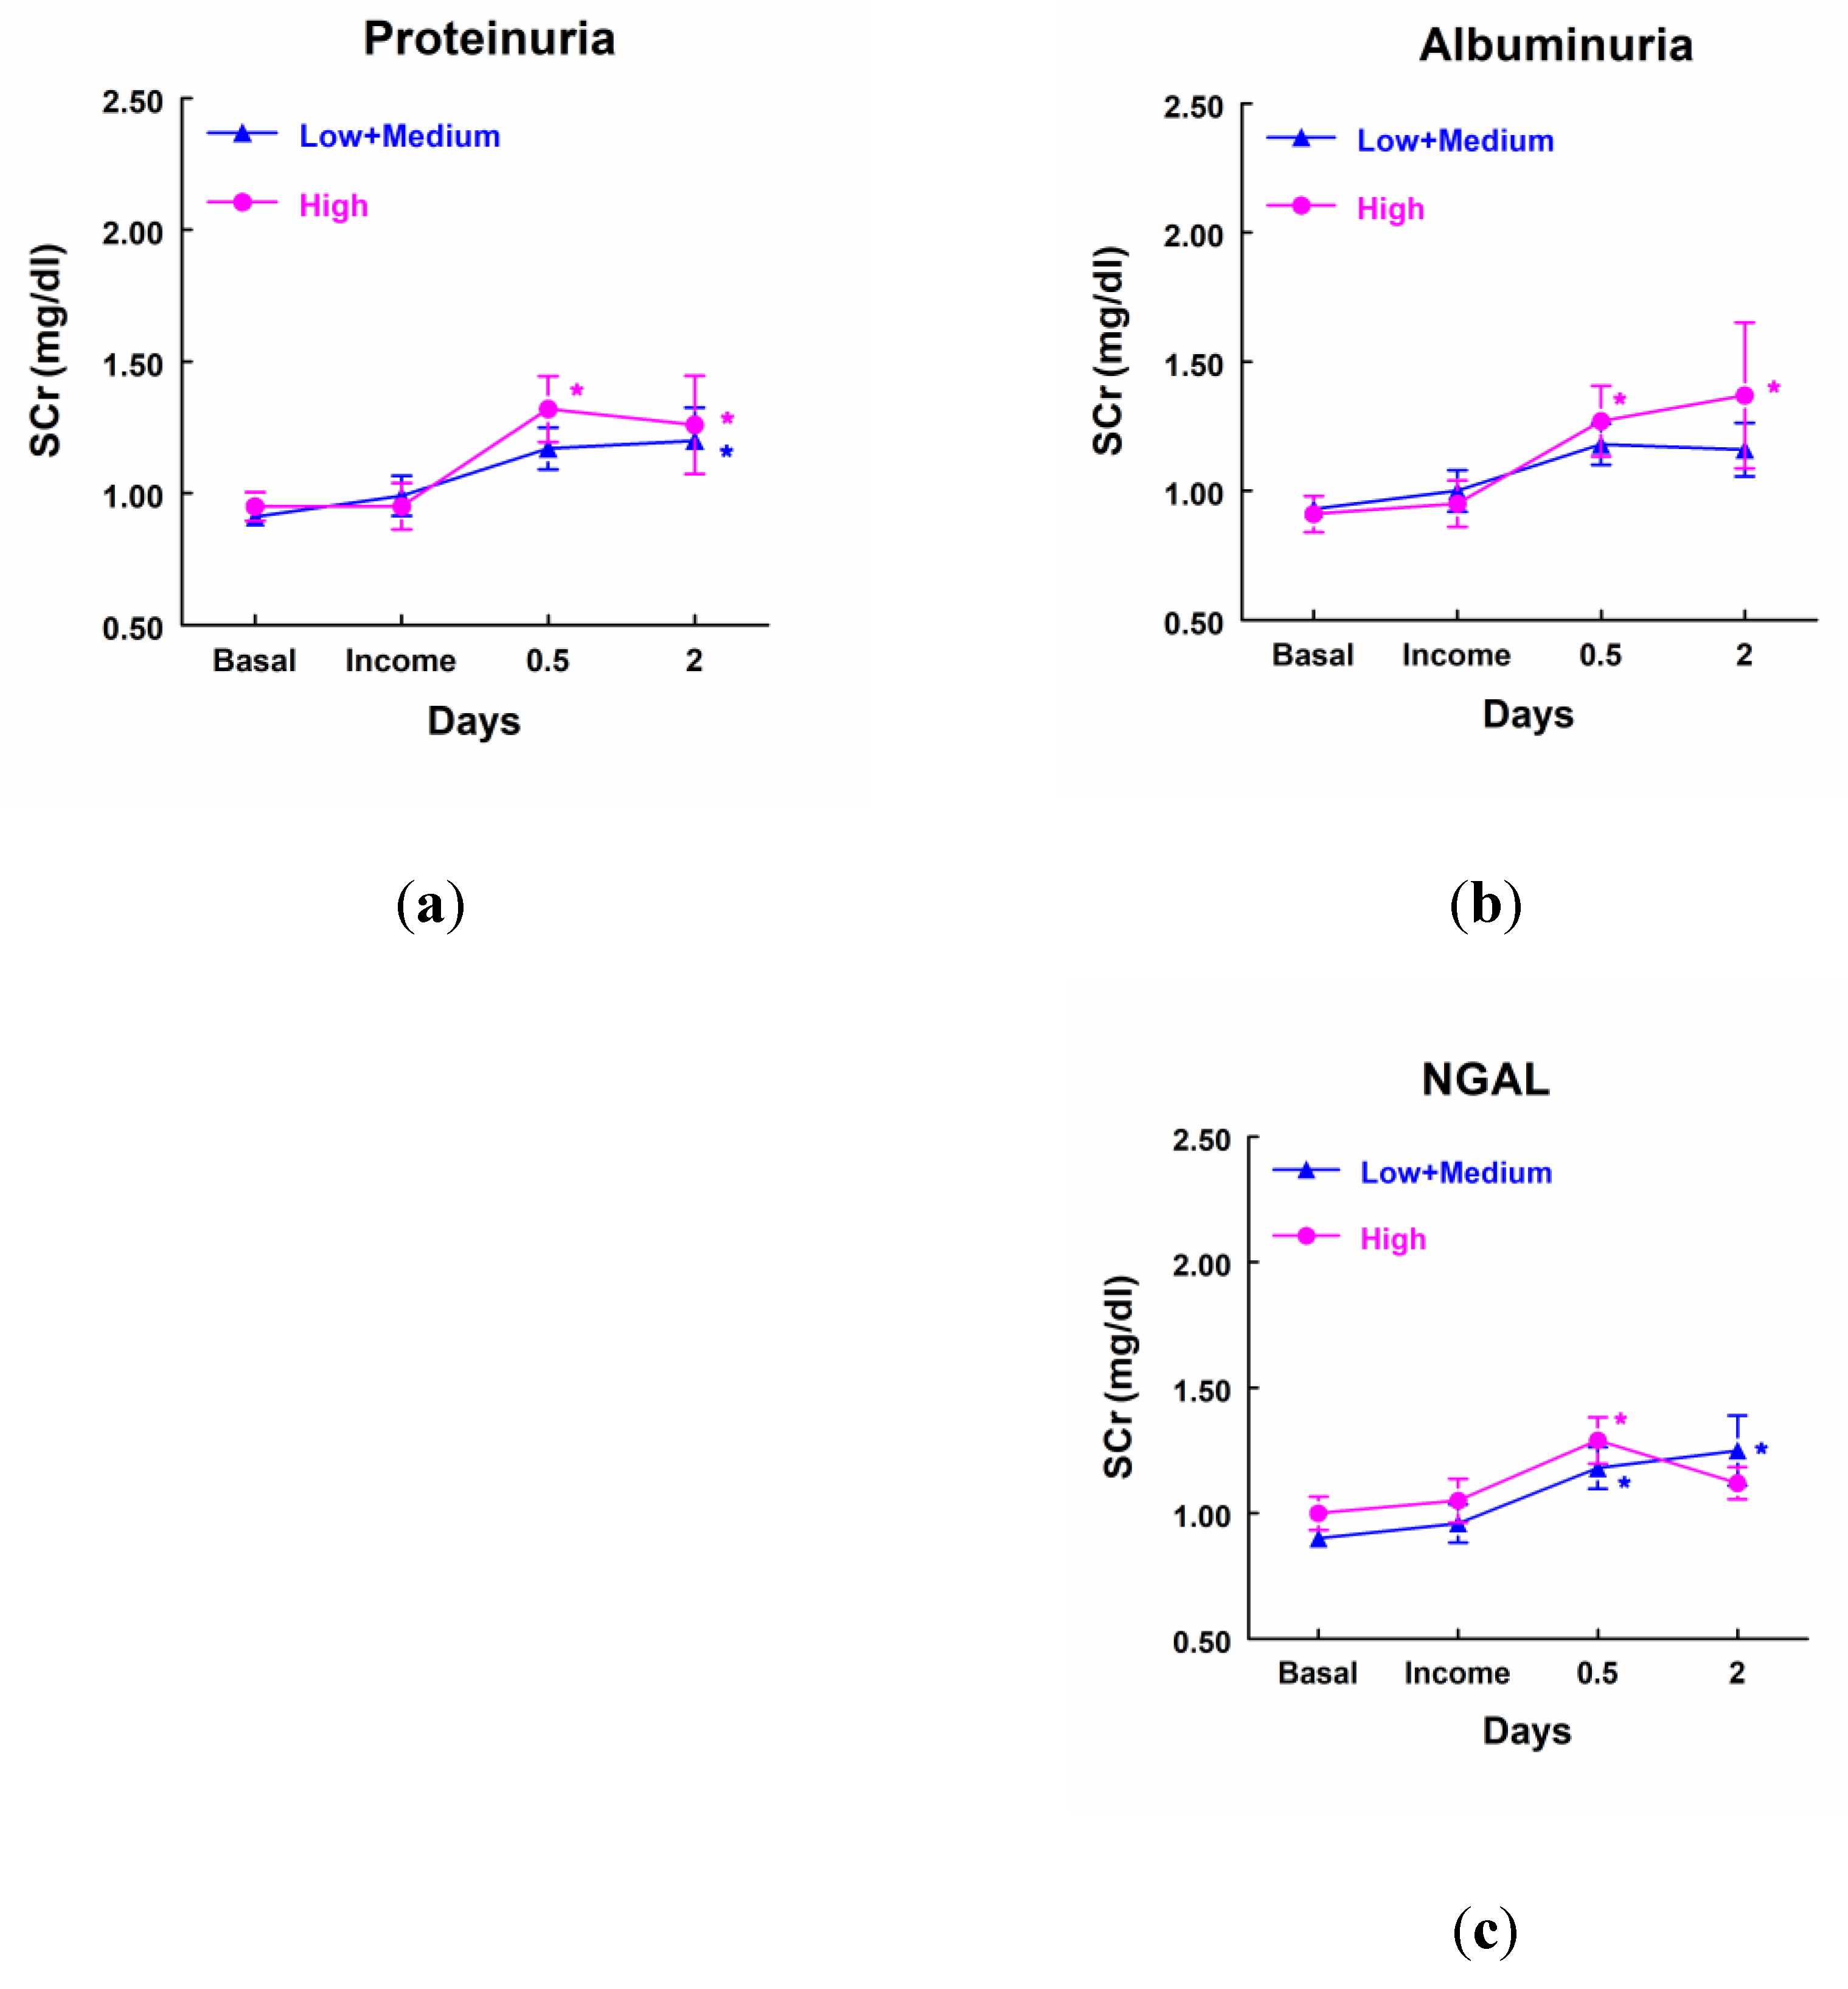
Figure 5.
Glomerular filtration rate (ml/min/1.73 m2) in patients that showed high levels of GluAp (a), AlaAp (b), DPP4 (c) and NAG (d) at income in ICU (highest quartile, n=10), and patients with low or medium levels of these markers (n=25). Mean ± SEM are displayed. * p<0.05 vs their own basal level. + p<0.05 vs its corresponding Low+Medium cluster.
Figure 5.
Glomerular filtration rate (ml/min/1.73 m2) in patients that showed high levels of GluAp (a), AlaAp (b), DPP4 (c) and NAG (d) at income in ICU (highest quartile, n=10), and patients with low or medium levels of these markers (n=25). Mean ± SEM are displayed. * p<0.05 vs their own basal level. + p<0.05 vs its corresponding Low+Medium cluster.
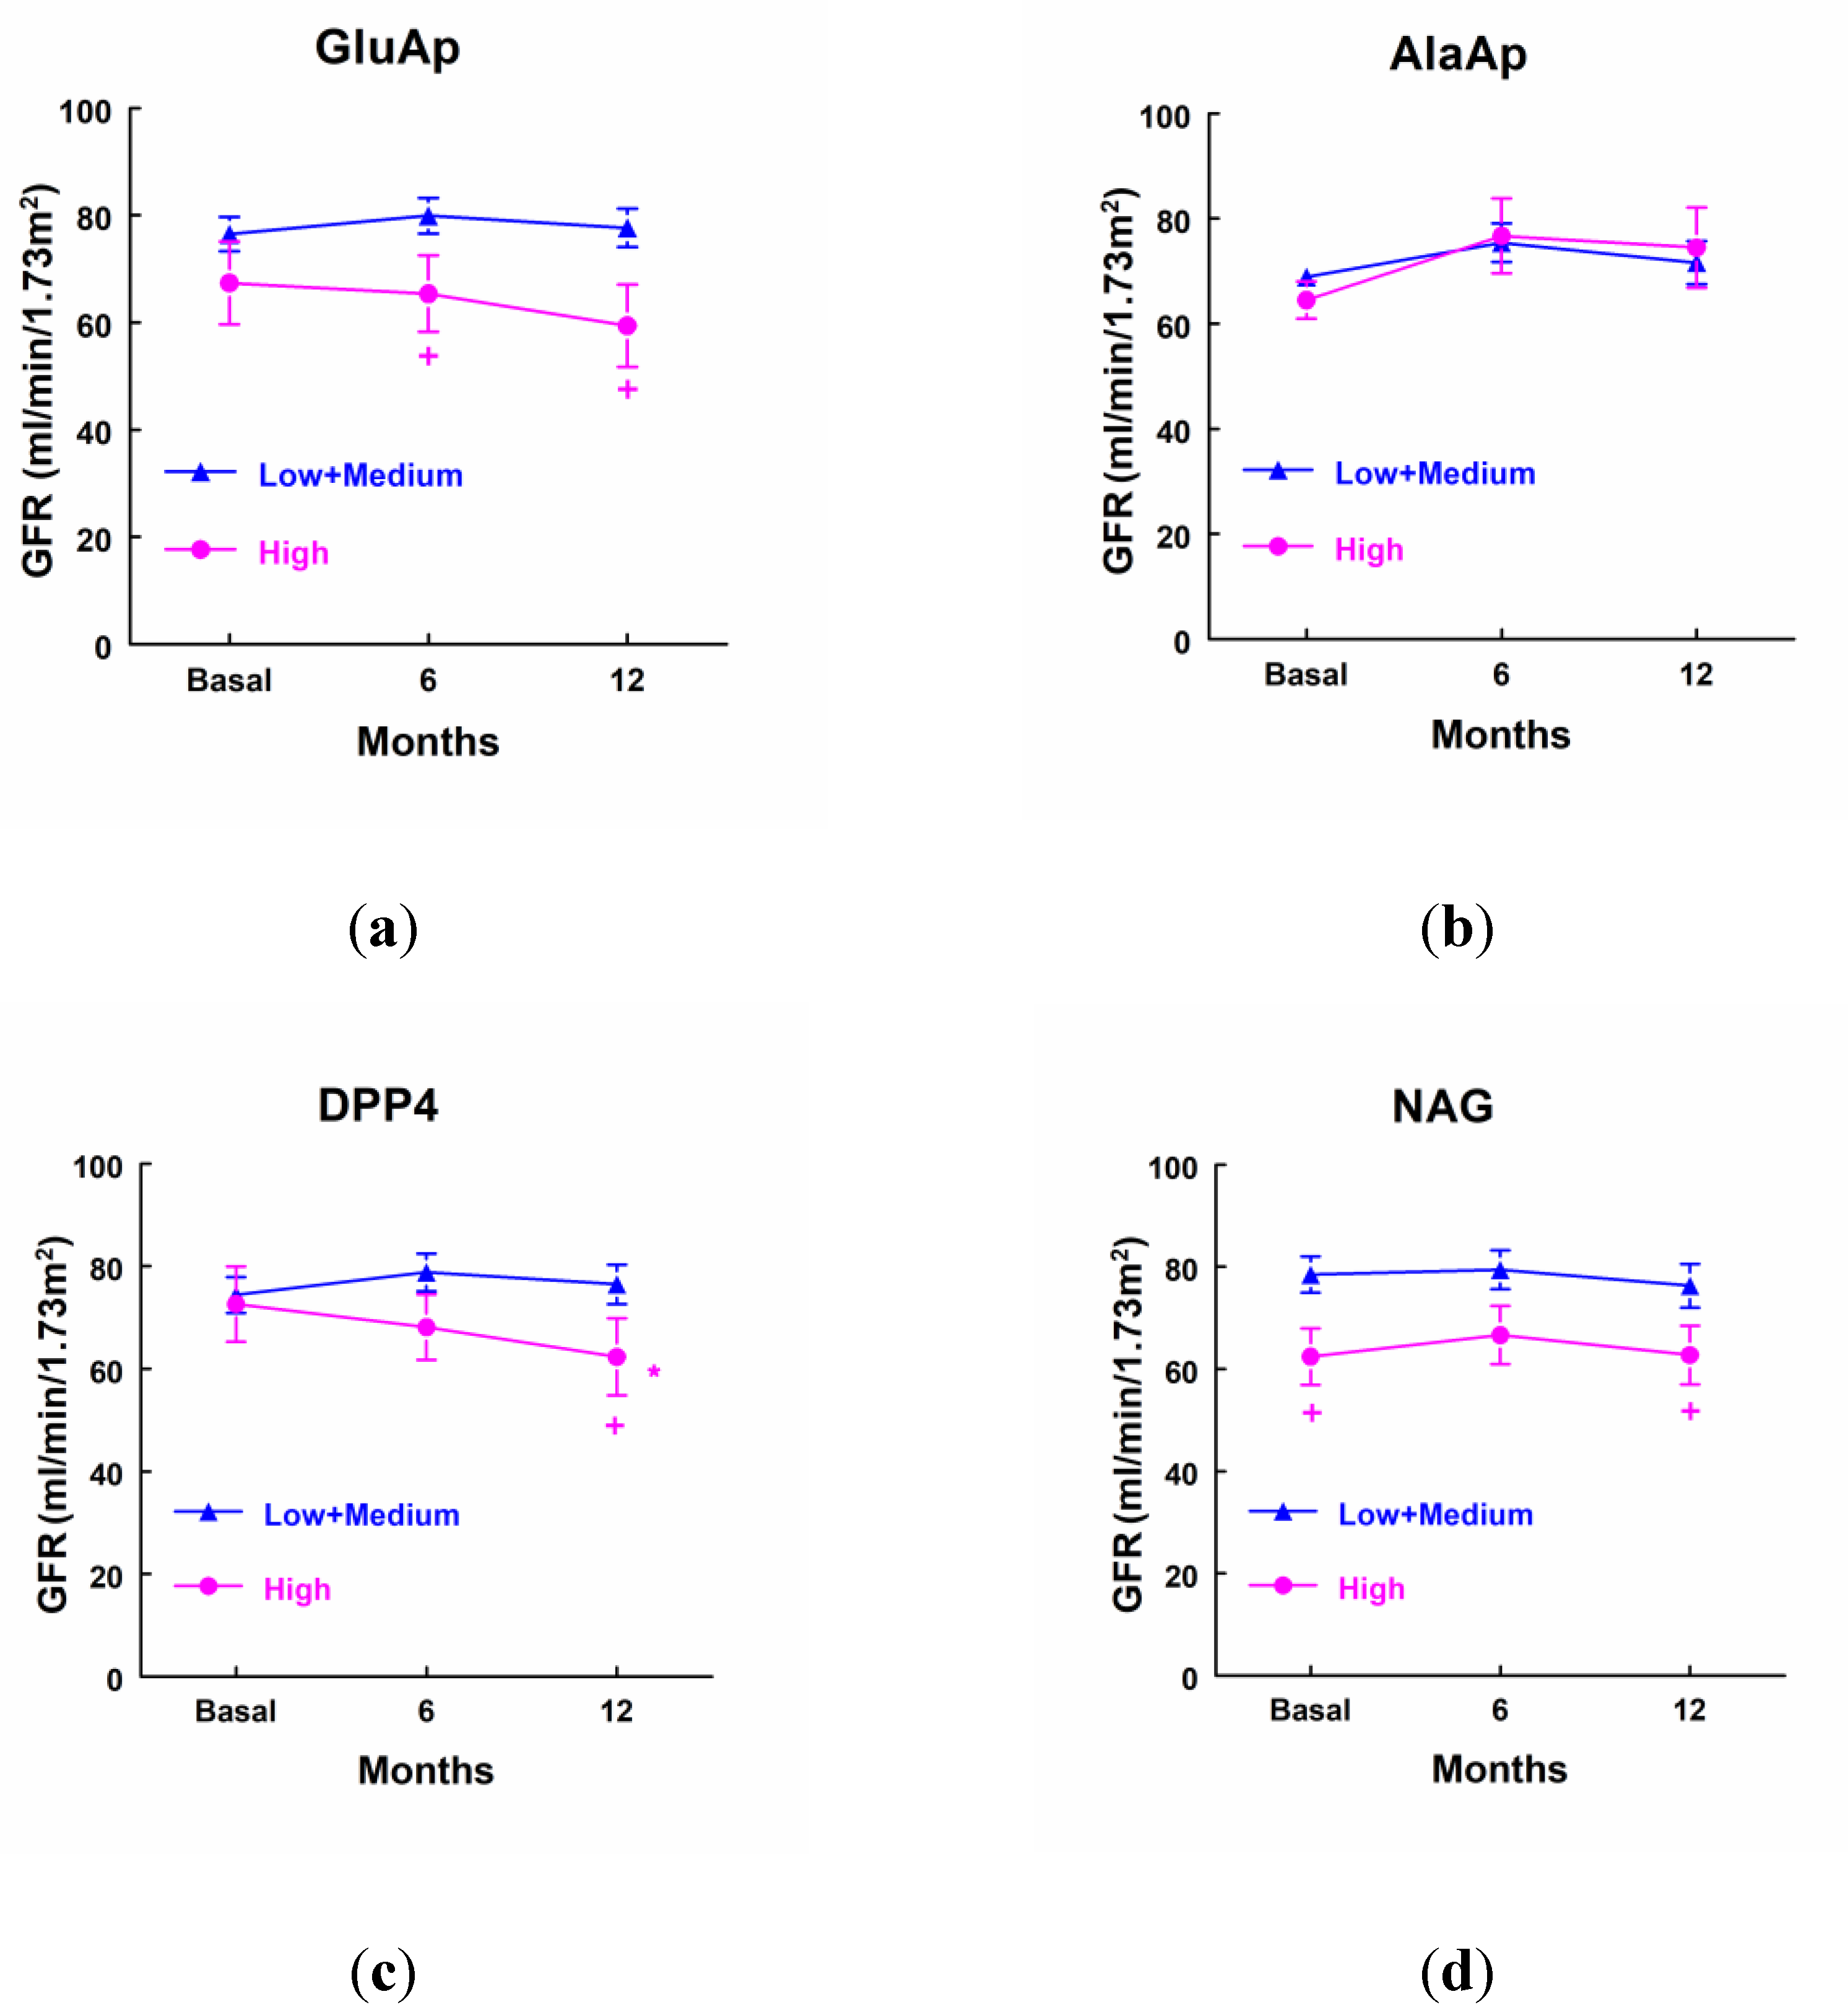
Figure 6.
Glomerular filtration rate (ml/min/1.73 m2) in patients that showed high levels of proteinuria (a), albuminuria (b), NAG (c) and NGAL (d) at income in ICU (highest quartile, n=10), and patients with low or medium levels of these markers (n=25). Mean ± SEM are displayed. + p<0.05 vs its corresponding Low+Medium cluster.
Figure 6.
Glomerular filtration rate (ml/min/1.73 m2) in patients that showed high levels of proteinuria (a), albuminuria (b), NAG (c) and NGAL (d) at income in ICU (highest quartile, n=10), and patients with low or medium levels of these markers (n=25). Mean ± SEM are displayed. + p<0.05 vs its corresponding Low+Medium cluster.
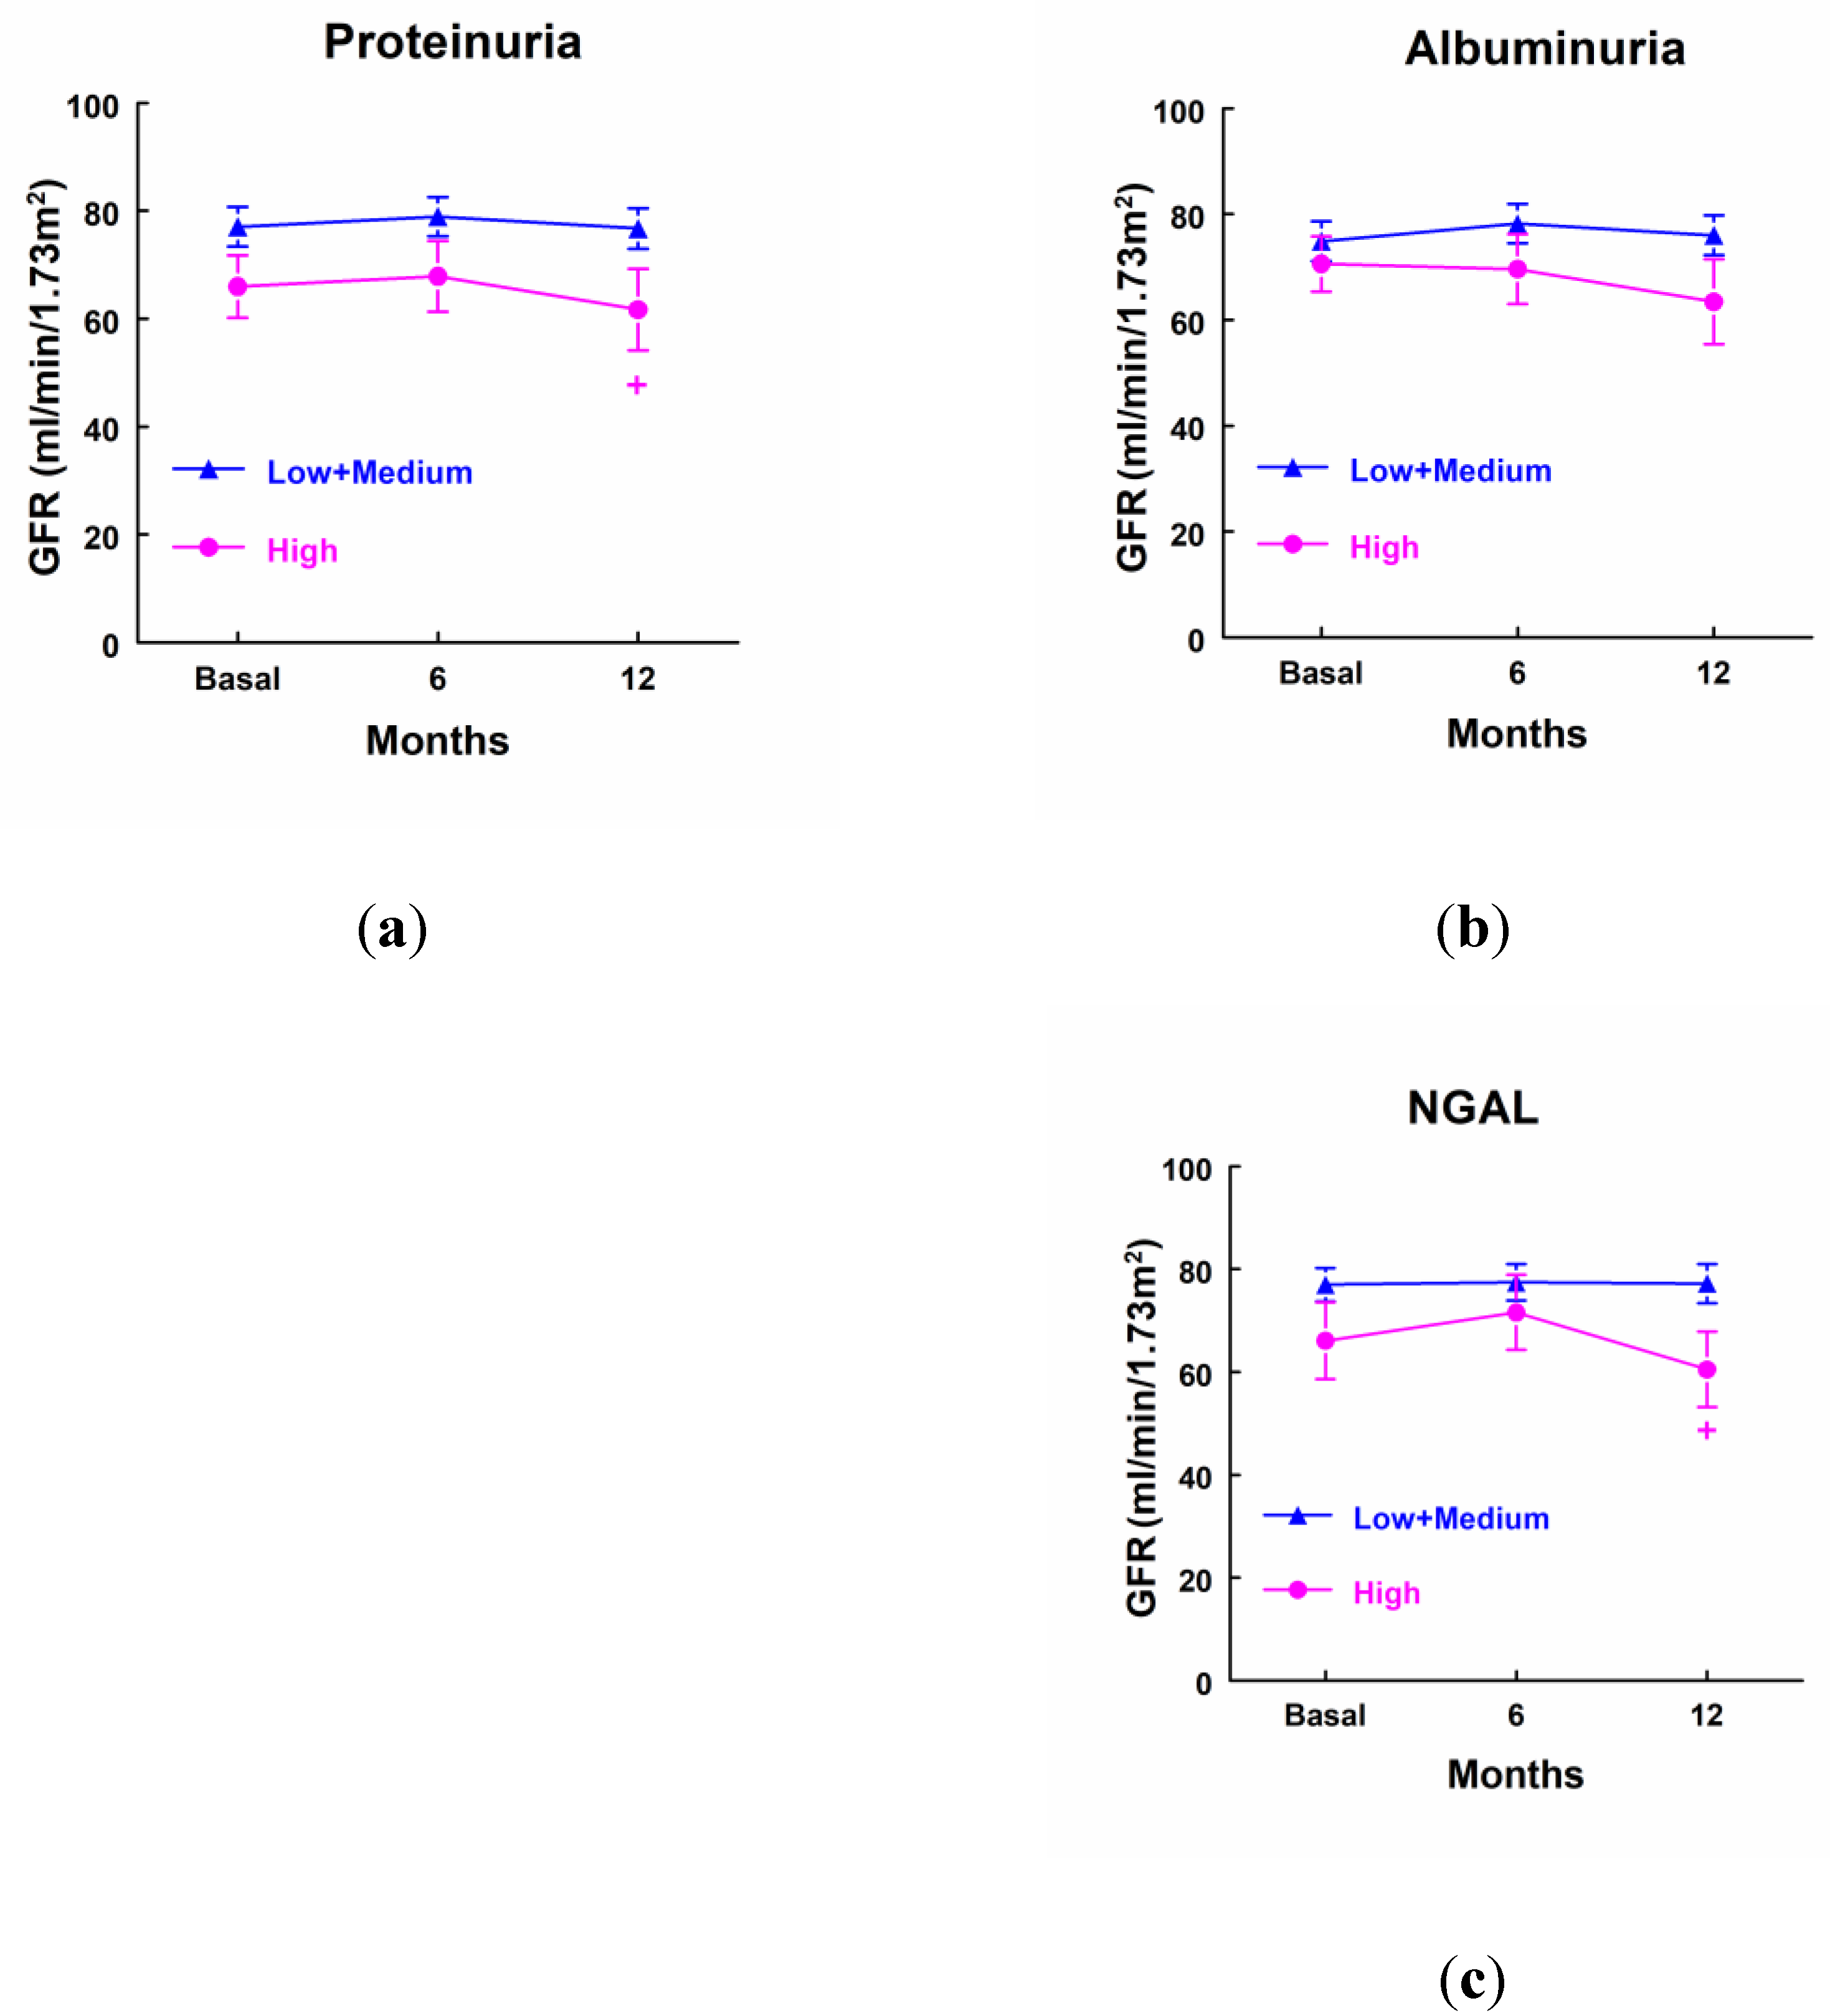

Table 1.
Demographic characteristics and long-term events in patients that developed AKI (n=19) and patients that did not develop AKI (n=25) after cardiac surgery.
Table 1.
Demographic characteristics and long-term events in patients that developed AKI (n=19) and patients that did not develop AKI (n=25) after cardiac surgery.
| No AKI (n=25) | AKI (n=19) | |
|---|---|---|
| Age (years) | 65.6 ± 2.31 | 71.7 ± 1.64* |
| Gender (Male/Female, %) | 36/64 | 47.4/52.6 |
| Needing of RRT (%) | 0 | 15.8* |
| Stay in ICU (days) | 9.25 ± 0.84 | 13.6 ± 2.87 |
| Subsequent hospitalizations (%) | 25 | 35.3 |
| Cardiovascular events (%) | 12.5 | 23.5 |
| Exitus (%) | 0 | 21.1* |
Mean ± SEM or percentage are displayed. *p<0.05 vs. patients that did not develop AKI.
Table 2.
Demographic characteristics and long-term events in patients that did not develop AKI (No AKI, n=25), patients that developed stage 1 of AKI (AKI-1, n=11), and patients that developed stage 2 or 3 of AKI (AKI-2+3, n=8).
Table 2.
Demographic characteristics and long-term events in patients that did not develop AKI (No AKI, n=25), patients that developed stage 1 of AKI (AKI-1, n=11), and patients that developed stage 2 or 3 of AKI (AKI-2+3, n=8).
| No AKI (n=25) | AKI-1 (n=11) | AKI-2+3 (n=8) | |
|---|---|---|---|
| Age (years) | 65.6 ± 2.31 | 72.3 ± 2.08 | 71.0 ± 2.80 |
| Gender (Male/Female, %) | 36/64 | 55/45 | 37.5/62.5 |
| Needing of RRT (%) | 0 | 9.09 | 25* |
| Stay in ICU (days) | 9.25 ± 0.84 | 10.7 ± 2.03 | 17.6 ± 6.20 |
| Subsequent hospitalizations (%) | 25 | 40 | 28.6 |
| Cardiovascular events (%) | 12.5 | 20 | 28.6 |
| Exitus (%) | 0 | 18.2 | 25 |
Mean ± SEM or percentage are displayed. *p<0.05 vs. patients that did not develop AKI.
Table 3.
Proteinuria (g/g Cr), albuminuria (mg/g Cr), NAG (U/g Cr), NGAL (mg/g Cr), GluAp (mg/g Cr), AlaAp (mg/g Cr) and DPP4 (mg/g Cr) in urine samples obtained at income in ICU in patients that did not develop AKI (n=25), and in patients that developed AKI (n=19).
Table 3.
Proteinuria (g/g Cr), albuminuria (mg/g Cr), NAG (U/g Cr), NGAL (mg/g Cr), GluAp (mg/g Cr), AlaAp (mg/g Cr) and DPP4 (mg/g Cr) in urine samples obtained at income in ICU in patients that did not develop AKI (n=25), and in patients that developed AKI (n=19).
| No AKI (n=25) | AKI (n=19) | |
|---|---|---|
| Proteinuria (g/g Cr) | 11.6 ± 2.04 | 15.8 ± 3.42 |
| Albuminuria (mg/g Cr) | 626 ± 95.8 | 966 ± 113* |
| NAG (U/g Cr) | 114 ± 23.7 | 211 ± 47.4 |
| NGAL (mg/g Cr) | 15.1 ± 2.09 | 36.8 ± 12.5 |
| GluAp (mg/g Cr) | 1.82 ± 0.80 | 17.8 ± 13.4 |
| AlaAp (mg/g Cr) | 265 ± 82.3 | 432 ± 145 |
| DPP4 (mg/g Cr) | 70.0 ± 11.5 | 150 ± 40.6 |
Mean ± SEM are displayed. * p<0.05 vs patients that did not develop AKI.
Table 4.
Proteinuria (g/g Cr), albuminuria (mg/g Cr), NAG (U/g Cr), NGAL (mg/g Cr), GluAp (mg/g Cr), AlaAp (mg/g Cr) and DPP4 (mg/g Cr) in urine samples obtained at income in ICU in patients that did not develop AKI (n=25), and in patients that developed AKI in stage 1 (n=11) and stage 2 or 3 (n=8).
Table 4.
Proteinuria (g/g Cr), albuminuria (mg/g Cr), NAG (U/g Cr), NGAL (mg/g Cr), GluAp (mg/g Cr), AlaAp (mg/g Cr) and DPP4 (mg/g Cr) in urine samples obtained at income in ICU in patients that did not develop AKI (n=25), and in patients that developed AKI in stage 1 (n=11) and stage 2 or 3 (n=8).
| No AKI or AKI-1 (n=36) | AKI-2+3 (n=8) | |
|---|---|---|
| Proteinuria (g/g Cr) | 13.3 ± 2.25 | 13.8 ± 2.36 |
| Albuminuria (mg/g Cr) | 723 ± 81.1 | 979 ± 198 |
| NAG (U/g Cr) | 129 ± 21.1 | 277 ± 94.4* |
| NGAL (mg/g Cr) | 27.8 ± 6.81 | 9.50 ± 2.45 |
| GluAp (mg/g Cr) | 2.32 ± 1.06 | 37.5 ± 31.5* |
| AlaAp (mg/g Cr) | 261 ± 62.5 | 679 ± 313 |
| DPP4 (mg/g Cr) | 71.9 ± 8.43 | 251.4 ± 85.8 |
Mean ± SEM are displayed. * p<0.05 vs patients that did not develop AKI.
Table 5.
Cut-off value (COV), predictive positive value (PPV, %), predictive negative value (PNV, %), sensitivity (Sens, %), specificity (Spec, %) and percentage of correctly diagnosed patients (CDP) for diagnosis of AKI at income in ICU for the highest quartile of each biomarker and AKIN criteria. Patients that developed AKI were taken as true positive (n=19) and No AKI patients were taken as true negative (n=25).
Table 5.
Cut-off value (COV), predictive positive value (PPV, %), predictive negative value (PNV, %), sensitivity (Sens, %), specificity (Spec, %) and percentage of correctly diagnosed patients (CDP) for diagnosis of AKI at income in ICU for the highest quartile of each biomarker and AKIN criteria. Patients that developed AKI were taken as true positive (n=19) and No AKI patients were taken as true negative (n=25).
| Marker | COV | PPV (%) | NPV (%) | Sens (%) | Spec (%) | CDP (%) |
|---|---|---|---|---|---|---|
| Proteinuria (g/g Cr) | 16.2 | 54.5 | 60.6 | 31.6 | 80 | 59.1 |
| Albuminuria (mg/g Cr) | 1246 | 63.6 | 63.6 | 36.8 | 84 | 63.6 |
| NAG (U/g Cr) | 174 | 63.6 | 63.6 | 36.8 | 84 | 63.6 |
| NGAL (mg/g Cr) | 23.1 | 54.6 | 60.6 | 31.6 | 80 | 59.1 |
| GluAp (mg/g Cr) | 1.840 | 63.6 | 63.6 | 36.8 | 84 | 63.6 |
| AlaAp (mg/g Cr) | 323 | 54.6 | 60.6 | 31.6 | 80 | 59.1 |
| DPP4 (mg/g Cr) | 105 | 63.6 | 63.6 | 36.8 | 84 | 63.6 |
| AKIN Criteria | 100 | 59.5 | 10.5 | 100 | 61.4 |
Table 6.
Cut-off value (COV), predictive positive value (PPV, %), predictive negative value (PNV, %), sensitivity (Sens, %), specificity (Spec, %) and percentage of correctly diagnosed patients (CDP) for diagnosis of stage 2 or 3 of AKI at income in ICU for the highest quartile of each biomarker and AKIN criteria. Patients that developed stage 2 or 3 of AKI were taken as true positive (n=8). No AKI patients and patients in stage 1 of AKI were taken as true negative (n=36).
Table 6.
Cut-off value (COV), predictive positive value (PPV, %), predictive negative value (PNV, %), sensitivity (Sens, %), specificity (Spec, %) and percentage of correctly diagnosed patients (CDP) for diagnosis of stage 2 or 3 of AKI at income in ICU for the highest quartile of each biomarker and AKIN criteria. Patients that developed stage 2 or 3 of AKI were taken as true positive (n=8). No AKI patients and patients in stage 1 of AKI were taken as true negative (n=36).
| Marker | COV | PPV (%) | NPV (%) | Sens (%) | Spec (%) | CDP (%) |
|---|---|---|---|---|---|---|
| Proteinuria (g/g Cr) | 16.2 | 27.3 | 84.8 | 37.5 | 77.8 | 70.5 |
| Albuminuria (mg/g Cr) | 1246 | 36.4 | 87.8 | 50 | 80.6 | 75 |
| NAG (U/g Cr) | 174 | 27.3 | 84.8 | 37.5 | 77.8 | 70.5 |
| NGAL (mg/g Cr) | 23.1 | 0 | 75.8 | 0 | 69.4 | 56.8 |
| GluAp (mg/g Cr) | 1.840 | 54.5 | 93.9 | 75.0 | 86.1 | 84.1 |
| AlaAp (mg/g Cr) | 323 | 36.4 | 87.8 | 50 | 80.6 | 75 |
| DPP4 (mg/g Cr) | 105 | 45.5 | 90.9 | 62.5 | 83.3 | 79.5 |
| NGAL (mg/g Cr) | 23.1 | 0 | 75.8 | 0 | 69.4 | 56.8 |
| AKIN Criteria | 0 | 81.8 | 0 | 100 | 81.8 |
Table 7.
Length of stay in ICU (days) in patients that showed higher levels of urinary biomarkers at income in ICU (n=11) in comparison with patients that showed lower or medium levels of biomarkers (n=33).
Table 7.
Length of stay in ICU (days) in patients that showed higher levels of urinary biomarkers at income in ICU (n=11) in comparison with patients that showed lower or medium levels of biomarkers (n=33).
| Low+Medium (n=33) | High (n=11) | |
|---|---|---|
| Proteinuria (g/g Cr) | 9.47 ± 0.82 | 16.2 ± 4.65 |
| Albuminuria (mg/g Cr) | 9.56 ± 0.86 | 15.9 ± 4.63 |
| NAG (U/g Cr) | 11.1 ± 1.78 | 11.5 ± 1.58 |
| NGAL (mg/g Cr) | 11.6 ± 1.79 | 9.91 ± 1.47 |
| GluAp (mg/g Cr) | 9.50 ± 0.88 | 16.1 ± 4.57 |
| AlaAp (mg/g Cr) | 10.3 ± 1.75 | 13.8 ± 1.57 |
| DPP4 (mg/g Cr) | 9.38 ± 0.83 | 16.5 ± 4.60 |
Table 8.
Subsequent hospitalizations (%) in patients that showed higher levels of urinary biomarkers at income in ICU (n=10) in comparison with patients that showed lower or medium levels of biomarkers (n=31).
Table 8.
Subsequent hospitalizations (%) in patients that showed higher levels of urinary biomarkers at income in ICU (n=10) in comparison with patients that showed lower or medium levels of biomarkers (n=31).
| Low+Medium (n=31) | High (n=10) | |
|---|---|---|
| Proteinuria (g/g Cr) | 35.5 | 10.0 |
| Albuminuria (mg/g Cr) | 35.5 | 10.0 |
| NAG (U/g Cr) | 29.0 | 30.0 |
| NGAL (mg/g Cr) | 32.3 | 20.0 |
| GluAp (mg/g Cr) | 32.3 | 20.0 |
| AlaAp (mg/g Cr) | 25.8 | 40.0 |
| DPP4 (mg/g Cr) | 29.0 | 30.0 |
Table 9.
Needing of RRT (%) in patients that showed higher levels of urinary biomarkers at income in ICU (n=11) in comparison with patients that showed lower or medium levels of biomarkers (n=33).
Table 9.
Needing of RRT (%) in patients that showed higher levels of urinary biomarkers at income in ICU (n=11) in comparison with patients that showed lower or medium levels of biomarkers (n=33).
| Low+Medium (n=33) | High (n=11) | |
|---|---|---|
| Proteinuria (g/g Cr) | 6.06 | 9.09 |
| Albuminuria (mg/g Cr) | 9.09 | 0 |
| NAG (U/g Cr) | 9.09 | 0 |
| NGAL (mg/g Cr) | 9.09 | 0 |
| GluAp (mg/g Cr) | 3.03 | 18.2 |
| AlaAp (mg/g Cr) | 6.06 | 9.09 |
| DPP4 (mg/g Cr) | 6.06 | 9.09 |
Table 10.
Cardiovascular events (%) in patients that showed higher levels of urinary biomarkers at income in ICU (n=10) in comparison with patients that showed lower or medium levels of biomarkers (n=31).
Table 10.
Cardiovascular events (%) in patients that showed higher levels of urinary biomarkers at income in ICU (n=10) in comparison with patients that showed lower or medium levels of biomarkers (n=31).
| Low+Medium (n=31) | High (n=10) | |
|---|---|---|
| Proteinuria (g/g Cr) | 22.6 | 0 |
| Albuminuria (mg/g Cr) | 22.6 | 0 |
| NAG (U/g Cr) | 19.4 | 10.0 |
| NGAL (mg/g Cr) | 19.4 | 10.0 |
| GluAp (mg/g Cr) | 22.6 | 0 |
| AlaAp (mg/g Cr) | 16.1 | 20.0 |
| DPP4 (mg/g Cr) | 19.4 | 10.0 |
Table 11.
Exitus (%) in patients that showed higher levels of urinary biomarkers at income in ICU (n=11) in comparison with patients that showed lower or medium levels of biomarkers (n=32).
Table 11.
Exitus (%) in patients that showed higher levels of urinary biomarkers at income in ICU (n=11) in comparison with patients that showed lower or medium levels of biomarkers (n=32).
| Low+Medium (n=32) | High (n=11) | |
|---|---|---|
| Proteinuria (g/g Cr) | 9.38 | 9.09 |
| Albuminuria (mg/g Cr) | 12.5 | 0 |
| NAG (U/g Cr) | 12.5 | 0 |
| NGAL (mg/g Cr) | 12.5 | 0 |
| GluAp (mg/g Cr) | 6.25 | 18.2 |
| AlaAp (mg/g Cr) | 9.38 | 9.09 |
| DPP4 (mg/g Cr) | 9.38 | 9.09 |
Disclaimer/Publisher’s Note: The statements, opinions and data contained in all publications are solely those of the individual author(s) and contributor(s) and not of MDPI and/or the editor(s). MDPI and/or the editor(s) disclaim responsibility for any injury to people or property resulting from any ideas, methods, instructions or products referred to in the content. |
© 2024 by the authors. Licensee MDPI, Basel, Switzerland. This article is an open access article distributed under the terms and conditions of the Creative Commons Attribution (CC BY) license (http://creativecommons.org/licenses/by/4.0/).
Copyright: This open access article is published under a Creative Commons CC BY 4.0 license, which permit the free download, distribution, and reuse, provided that the author and preprint are cited in any reuse.


