
Submitted:
23 July 2024
Posted:
23 July 2024
You are already at the latest version
Abstract
Evaluating flood risk though numerical simulations in areas where hydrometric and bathymetric data are scarcely available is a challenge. This is however of paramount importance, particularly in urban areas, where huge losses of human life and extensive damage can occur. This paper focuses on the June 2-3, 2023 event at Léogâne in Haiti, where the Rouyonne River partly flooded the city. Water depths in the river were recorded since April 2022 and a few discharges were measured manually but it was not sufficient to produce a reliable rating curve. Using a uniform flow assumption combined with the BaRatin method (Bayesian rating curve), it was possible to extrapolate the existing data to higher discharges. From there, a rainfall-runoff relation was developed for the site using the AtHyS distributed hydrological model, which allowed to determine the discharge of the June 2023 event, which was estimated as twice the maximum conveying capacity of the river in the measurement section. Bathymetric data were obtained using drone-based photogrammetry and two-dimensional simulations were carried out using the WATLAB computational environment to represent the flooded area and the associated water depths. By comparing the water depths of 21 measured high-water marks with the simulation results, we obtain KGE and NSE criteria of, respectively, 0.890 and 0.882. This allows us to conclude that the model is sufficiently accurate and could be used by flood managers and decision-makers to assess flood risk and vulnerability in Haiti.
Keywords:
Flood modelling
; Rouyonne river
; Haiti
; Hydrological modelling
; Rating curve
; Drone-based topography measurement
1. Introduction
Urban flooding is a subject of major concern to both the scientific community and the public. To improve urban planning and manage these risks, it is important to have digital tools capable of simulating flood events for better decision-making. Hydraulic modelling tools can predict the spatial and temporal evolution of river behavior during a flood event, and the resulting flood extent [1,2,3], provided that prior calibration of the model can be achieved. There are various approaches for modelling river flooding events, including simpler one-dimensional models [4,5], requiring less data, and more detailed two-dimensional [6,7,8] models. The choice of approach must be consistent with the scale under study and with the risks involved [9].
This research study concerns a stretch of the Rouyonne River along the town of Léogâne in Haiti (Figure 1a). Fed by a mountainous upper watershed of 46.45 km2 (Figure 1b), the river flows to the Caribbean Sea via an 8.2 km-long channelized reach that begins at the upper watershed outlet (X= 754280 m; Y= 2044471 m, coordinate system WGS 84/UTM zone 18N) and ends at the sea (X= 747693 m; Y= 2049408 m). While the river is rather sinuous in the mountainous upper watershed, the downstream part of the Rouyonne River (the channel) is nearly straight with an average slope of 0.62%. The lower course of the river was indeed artificially channelized and confined by embankments, precisely to prevent inundations. The upper watershed is very hilly, with 75% of its surface area situated between 250 and 950 meters above sea level (Figure 1c). The city of Léogâne lies in the flood plain zone, close to the channelized part of the river. Unfortunately, the embankments are frequently overflown, which explains the recurrent flooding of the city.
The topographical and bathymetric data available for the site were the official data from CNIGS (Centre National des Informations Géospatiales – National Center for Geospatial Information) covering the entire country, dating back to 2016 and issued from a measurement campaign that was started in January 2014 by IGN France International (IGN FI), with funding from the World Bank. However, since the data acquisition, many strong morphological changes were observed in the main rivers of Haiti, caused by extreme climatic events.
The June 3, 2023, event resulted in the death of almost twenty people in the city of Léogâne, a lot of injuries and considerable damage (Figure 2a-b). In just 32 hours and 30 minutes, the average rainfall recorded in the watershed amounted to 142.1 mm. This value exceeds the monthly average rainfall of around 100 mm for the month of June in the municipality of Léogâne. Consequently, significant overflows have been observed during this event, inundating the flood plains and finally a part of the city. Immediately after the event, high-water marks have been measured in the city and along the river (Figure 2c).
The aim of this research study is to develop hydraulic modelling of the study site combined with hydrologic tools to reconstruct missing data in order to reproduce the June 2023 event in Léogâne and from there, initiate a methodology to characterize the flood risk in the region. The paper is organized as follows: first the data collection is presented, including drone-based measurements for the bathymetry and hydrological modelling to evaluate the discharges; then a hydraulic model is constructed, and simulations of the June 2023 event are conducted. The results are compared to field measurements and finally conclusions are drawn on the long-term perspective regarding possible flood forecasting systems for the city of Léogâne, to predict what might happen when heavy rainfall is announced, and to establish risk maps.
2. Materials and Methods
The simulation of June 2-3, 2023, event is performed by adopting the following approach: (i) topographic data acquisition; (ii) determination of the discharge as upstream hydraulic boundary condition and (iii) construction of the hydraulic model used for the simulation. All these points are presented in the following sub-sections.
2.1. Topographic Data
The 1.5 m resolution digital terrain model (DTM) from the CNIGS was used for hydrological modelling of the upper watershed. However, due to important morphological changes in the last years in the lower reach, this DTM has become too inaccurate for hydraulic modelling of this reach. Therefore, a drone-based survey of the river was conducted during the dry season, when the river is empty (Figure 3a), and photogrammetry was applied using the image processing software “Agisoft Metashape pro”. Aerial images were taken from a drone (DJI marvic Air 2) equipped with a GoPro Hero 4 camera (Figure 3b), which are all low-cost and easy to handle devices, well suited for such field conditions.
Each drone flight had a duration of about 10 minutes, depending on battery autonomy, with a speed of 5 m/s and a capture frequency of one image every two seconds. Image overlap between successive flights is 80% at the front and 60% at the side [10]. These overlaps provide sufficient information for the spatial reconstruction of the scenes studied, with a total of 300 images on average for a flight plan. The accurate georeferencing of the imagery was performed by the GNSS (Global Navigation Satellite System) positioning of at least 15 GCPs (Ground Control Points) for each flight plan, used for image georeferencing during photogrammetric processing. For more information on the processing procedure and assessment of this method at sites in Haiti, see [11,12,13,14,15,16].
Two drone-based surveys were conducted in 2020 and 2022, respectively. The drone-based technique was found to be very accurate, with a RMSE of 0.18 m on 80 verification points. A comparison between a manual survey of cross section 54-54 and photogrammetric data is illustrated in Figure 4a-b. The strong morphological evolution of the river at this cross-section is illustrated in Figure 4c, where the official DTM (2014-2016) is compared to the 2020 and 2022 surveys. In particular, it can be observed that the left bank, that was destroyed during hurricane Matthew in 2016 and then reconstructed, was again completely eroded between 2020 and 2022.
One day after the June 2023 event, 21 high-water marks were recorded at locations illustrated in Figure 5. These will be used to validate the hydraulic model.
2.2. Discharge Estimation
To run the hydraulic model, we need the flood hydrograph for the June 2-3, 2023, event at the system inlet. Ideally, the discharge should be obtained from a hydrometric station, which is unfortunately not the case at Léogâne. Only data from a limnimeter (OTT PLS probe: pressure sensor) installed at the measurement section (at the channel inlet) since April 2022 are available. At this location, an OTT “MF Pro” magnetic induction current meter was used to take a range of flow measurements at shallow water depths, below 40 cm. Beyond this depth, measurements become dangerous, and therefore the number of stage-discharge points available to construct a rating curve is not sufficient. It is thus necessary to extrapolate the few points of the rating curve for greater water depths. The construction of the rating curve is based on the assumption of uniform flow in the measurement section and was complemented with the BaRatin (Bayesian Rating curve) method [17,18] developed by INRAE since 2010, allowing to assess the uncertainty associated with this approach.
However, it is also important to be able to predict the flow from rainfall measurements when the water level station is dysfunctional: this was indeed the case during the June 2-3, 2023, event, as the probe was destroyed. To achieve this, the rainfall data recorded at three rain gauges on the Rouyonne river catchment were used to establish a rainfall-discharge relationship for this watershed using the AtHyS (Atelier Hydrologique Spatialisé) software developed at IRD Montpelier [19]. The key parameters of this hydrological model are: V0 (m/s) that can be estimated as the velocity of flood wave propagation; S (mm) the total ground reservoir capacity which depends on soil characteristics; ds (day-1) the proportionality coefficient between reservoir level and emptying intensity; ω (dimensionless) the fraction of the underground reservoir emptying that participates in hypodermic flow; and K0 (dimensionless) a proportionality constant between diffusion time and transfer time. These parameters are calibrated and validated using two other events before the June 2023 event. The performance of the hydrological model is assessed using the classic criteria most widely used in hydrology studies [20,21,22,23], i.e. NSE (Nash-Sutcliffe Efficiency) proposed by [24] and KGE (Kling-Gupta Efficiency) [25], used in other hydrological studies [26,27,28]. The KGE criterion was used to select the best parameter set during calibration and assess the hydrological model performance. Once validated, the rainfall-discharge relationship can be used to predict flows resulting from given rainfall events.
2.3. Hydraulic MODEL AND SIMULATION TOOL
Based on the DTM, a hydraulic model is built using a triangular mesh (Figure 6). Different sizes are defined for the computational cells: (1) the riverbed with a 1 m resolution), (2) the floodplain with a 40 m resolution and (3) the transition zone between the Rouyonne riverbed and the floodplain, where the dikes can be identified, with an intermediate 3 m resolution. This mesh is then used for numerical simulations within the WATLAB environment developed at UCLouvain/iMMC (https://sites.uclouvain.be/hydraulics-group/watlab/index.html), solving the two-dimensional shallow-water equations using a finite-volume scheme for unstructured meshes.
The hydraulic model roughness was characterized through two different values of Mannings’ coefficient: nc = 0.048 sm-1/3 for the main channel and nf = 0.05 sm-1/3 for the floodplain. As regards the upstream boundary conditions, the flood hydrograph generated using AtHyS was used because no complete hydrograph could be established from the limnimetric data recording as this had stopped at the time when the probe cable broke.
2.4. Summary of Data Used In This Study
All data used in this study are summarized in Table 1, that describes the origin of the data and the time or space resolution, as applied in the simulations.
3. Results
3.1. Rating Curve for the Rouyonne River
The cross-section of the Rouyonne River at the location of the limnimetric station is illustrated in Figure 7. It has an almost regular trapezoidal shape, and based on the uniform flow assumption, a stage-discharge relation could be constructed using Manning’s equations, after calibrating the roughness using the 8 manually measured stage-discharge values for water depths of up to 0.40 m. As the maximum discharge that was manually measured was much below the probable discharge that occurred during the June 2023 event, it was necessary to assess the quality of the rating curve established using the uniform flow assumption. Therefore, the BaRatin method [17,18] combining all sources of uncertainties related to rating curves, was used.
Figure 8 shows the rating curve obtained with the uniform-flow assumption calibrated on the few measured points and the rating curve calculated with the Baratin method, as well as the associated uncertainties. The parametric uncertainty expresses the uncertainty related only to the estimation of the curve parameters, while the total uncertainty is the combination of parametric uncertainty and the uncertainty induced by the remnant error.
Unfortunately, the water level gauge failed during the June 2023 event when the water level reached 2.43 m, making it impossible to use the rating curve to calculate the corresponding hydrograph. Therefore, a rainfall-discharge relation is required.
3.2. Rainfall-Discharge Relationship
The AtHyS hydrological model was run on one event that occurred in August 2022 to calibrate the model parameters, and then applied to an event in September 2022 for validation. The comparisons between the estimated flows using the rating curve of Figure 8 and the hydrological model results are shown in Figure 9. The values of the calibrated parameters are given in Table 2, as well as the KGE and NSE scores.
Using this validated model, the complete hydrograph of the June 2-3, 2023, event was built and the results are illustrated in Figure 10. It can already be observed that the agreement between the observations and the model is very good in the period when the limnimetric station was working properly. The simulated maximum flow (Q=168 m³/s) for this event, at the measuring section, is two times larger than the maximum flow (Q=84 m³/s) that the river can convey without overflowing as this point.
3.3. Hydraulic Modelling of the June 3, 2023 Flood Hydrograph
The simulation results are illustrated in Figure 11: it can be observed that the Rouyonne River indeed overflows the dikes and induces severe flooding of the surrounding areas, including the city of Léogâne. The extent of the inundated area appears to be well reproduced by the model, as the points where high-water marks were recorded are indeed located in the inundated area (yellow points in Figure 11).
The comparison of simulated and measured water depths at the 21 high-water marks (Figure 12) shows that the model provides a good estimate of the water depth in the study area. With KGE and NSE values of 0.890 and 0.882 respectively, based on these 21 comparison points, the model is considered as satisfactory.
4. Discussion
The rating curve was established using a few measured points and considering uniform flow assumption, which is a questionable assumption as the flow is highly unsteady, especially during rapid floods. Still the validity of the curve was confirmed by the use of Baratin method, that allowed to estimate the related uncertainty, especially considering the limited number of gauging points. A similar situation is observed in [29], where the authors verified the beginning of their rating curve with water depths of no more than 0.50 m for a total section height of around 1.20 m.
This rating curve was then successfully applied to determine the parameters of the AtHyS hydrological model. The optimal parameters (Table 2) allow for a very good reproduction of both the validation case and the beginning of the June 2023 hydrograph. Still, the very high value of the velocity V0, equal to 5.43 m/s, is questionable. It could be explained by the very steep slopes in the upper catchment, as well as by significant deforestation that prevents slowing down runoff water by vegetation. The calibrated value of S = 82.44 mm corresponds to a CN close to 75, which is in agreement with classical values for the type of soil and vegetation cover in the catchment, where the hydrological conditions of the cultivated surfaces were medium.
The simulation identified three major overflow points on the Rouyonne river, that are highlighted in Figure 13: two points on the right bank (Figure 13a), responsible for flooding the town center, and one point on the left bank (Figure 13b), close upstream of the gauging station. This last overflow point explains why the probe was torn off, interrupting water depth recording at the measuring section.
From the good agreement between simulated and measured water depth (Figure 12), the hydraulic model can be considered as satisfactory. However, the accuracy of the results could be further improved by using a more refined mesh, for example reducing the size of the cells in the floodplain, however at the cost of a great increase in calculation time. Also, the buildings in the city of Léogâne are not properly accounted for. As shown in the work of [6,7], various local aspects can influence the modelled water height, such as spatialized roughness in the floodplain and the effect of buildings in the city. Consequently, our results may underestimate the water depths in some places. This is a prospect for further studies in Haiti.
5. Conclusions
Combining different sources of data and low-cost field measurement techniques, it was possible to develop a hydraulic model for the Rouyonne catchment that reproduced the inundation of the city following the June 2023 event. This shows that the model could now be used to draw up flood zone maps for the city of Léogâne. Using rainfall events, or synthetic rainfalls, with given return periods, it is possible to derive the corresponding hydrographs and to characterize the possible flooded area for different return periods. Such rainfall data with known return periods and not available for the moment but could be used in the future.
Author Contributions
Conceptualization, methodology, validation, R.L; S.S-F. and Y.Z.; software, investigation, R.L., A.J., Y.Z., S.S-F. and N.G.; formal analysis, resources, data curation, R.L., S.S-F. and Y.Z.; writing—original draft preparation, R.L.; writing—review and editing, S.S-F. and Y.Z.; visualization, supervision, N.G. and A.J.; project administration, funding acquisition, N.G., Y.Z. and S.S-F. All authors have read and agreed to the published version of the manuscript.
Funding
This research was funded by ARES (Académie de Recherche et d’Enseignement Supérieur), RISCRUE project, grant number COOP-CONV-22-190.
Acknowledgments
The authors would like to thank ARES-CCD for funding this study through the RISCRUE research project in Haiti and also thank the assistance of Dauphin Géthro, Asie Louis Raymond, Jacky Dolciné and Lamour Frantz for the data collection in field, the team of Civil Engineering and Environment of the UCLouvain and the team of the Rural Engineering Department of the State University of Haiti for their help in the realization of this study.
Conflicts of Interest
The authors declare no conflicts of interest.
References
- Lhomme, J. Modélisation des inondations en milieu urbain : approches unidimensionnelle, bidimensionnelle et macroscopique. Thèse de doctorat. Université de Montpellier II, Sciences et Techniques du Languedoc, Montpellier, France, décembre 2006.
- Mathieu, G. Développement d’une méthodologie pour la cartographie du risque d’inondation : application à la rivière de Cavaillon en Haïti, thèse doctorale, Université Catholique de Louvain, Belgique, janvier 2023.
- Joseph, A.; Gonomy, N.; Zech, Y.; Soares-Frazão, S. Modelling and analysis of the flood risk at Cavaillon City, Haiti. Houille Blanche 2018, 104(2), 68–75. [Google Scholar] [CrossRef]
- Crispino, G.; Gisonni, C.; Iervolino, M. Flood hazard assessment: comparison of 1D and 2D hydraulic models. Int. J. River Basin Manag. 2015, 13(2), 153–166. [Google Scholar] [CrossRef]
- Horritt, M.S.; Bates, P.D. Evaluation of 1D and 2D numerical models for predicting river flood inundation. J. Hydrol. 2002, 268, 87–99. [Google Scholar] [CrossRef]
- Lhomme, J.; Soares-Frazão, S.; Guinot, V.; Zech, Y. Large scale modelling of urban floods and 2D shallow-water model with porosity. Houille Blanche 2007, 93, 104–110. [Google Scholar] [CrossRef]
- Soares-Frazão, S.; Lhomme, J.; Guinot, V.; Zech, Y. Two-dimensional shallow-water model with porosity for urban flood modelling. J. Hydraul. Res. 2008, 46, 45–64. [Google Scholar] [CrossRef]
- Pinos, J.; Timbe, L. Performance assessment of two-dimensional hydraulic models for generation of flood inundation maps in mountain river basins. Water Sci. Eng. 2019, 12, 11–18. [Google Scholar] [CrossRef]
- Apel, H.; Aronica, G.T.; Kreibich, H.; Thieken, A. Flood risk analyses—how detailed do we need to be? Nat Hazards 2009, 49, 79–98. [Google Scholar] [CrossRef]
- Agisoft Metashape. Available online: https://www.agisoft.com/pdf/metashape-pro_1_8_en.pdf (accessed on 14 march 2023).
- Louis, R.; Dauphin, G.; Zech, Y.; Joseph, A.; Gonomy, N.; Soares-Frazão, S. Assessment of UAV-based photogrammetry for bathymetry measurements in Haiti: comparison with manual surveys and official data. In Proceedings of the 39th IAHR World Congress from Snow to Sea, Granada, Spain, from 19/6/2022 to 24/6/2022. ISBN: 978-90-832612-1-8; pp. 565–574. [Google Scholar]
- Verhoeven, G. Taking computer vision aloft—Archaeological three-dimensional reconstructions from aerial photographs with photoscan. Archaeol. Prospect. 2011, 18(1), 67–73. [Google Scholar] [CrossRef]
- Lowe, D. G. Distinctive Image Features from Scale-Invariant Keypoints. Int. J. Comput. Vis. 2004, 60(2), 91-110.
- Snavely, N.; Seitz, S. M.; Szeliski, R. Photo Tourism: Exploring Photo Collections in 3D. ACM Trans. Graph. 2006, 25(3), 835–846. [Google Scholar] [CrossRef]
- Snavely, N.; Seitz, S. M.; Szeliski, R. Modeling the World from Internet Photo Collections. Int. J. Comput. Vis. 2008, 80(2), 189–210. [Google Scholar] [CrossRef]
- Westoby, M. J.; Brasington, J.; Glasser, N. F.; Hambrey, M. J.; Reynolds, J. M. ‘Structure-from-Motion’ photogrammetry: A low-cost, effective tool for geoscience applications. Geomorphology (Amst.) 2012, 179, 300–314. [Google Scholar] [CrossRef]
- Le Coz, J.; Renard, B.; Bonnifait, L.; Branger, F.; Le Boursicaud, R. Combining hydraulic knowledge and uncertain gaugings in the estimation of hydrometric rating curves: a Bayesian approach, J. Hydrol. 2014, 509, 573–587. [Google Scholar] [CrossRef]
- Horner, I.; Renard, B.; Le Coz, J.; Branger, F.; McMillan, H.K.; Pierrefeu, G. Impact of stage measurement errors on streamflow uncertainty, Water Resour. Res. 2018, 54, 1952–1976. [Google Scholar]
- Bourvier, C.; Delclaux, F. ATHYS: a hydrological environment for spatial modelling and coupling with GIS. Proc. HydroGIS’96, Vienna-Austria, IAHS Publication. 1996, 235, 19-28.
- Mathevet, T. ; Gupta, H. ; Perrin, C. ; Andréassian, V. ; Le Moine, N. Assessing the performance and robustness of two conceptual rainfall-runoff models on a worldwide sample of watersheds. J. Hydrol. 2020, 585, (7-8)124698.
- Orth, R.; Staudinger, M.; Seneviratne, S. I.; Seibert, J.; Zappa, M. Does model performance improve with complexity? A case study with three hydrological models. J. Hydrol. 2015, 523, 147–159. [Google Scholar] [CrossRef]
- Worqlul, A. W.; Ayana, E. K.; Maathuis, B. H. P.; MacAlister, C.; Philpot, W. D.; Osorio Leyton, J. M.; Steenhuis, T. S. Performance of bias corrected MPEG rainfall estimate for rainfall-runoff simulation in the upper Blue Nile Basin, Ethiopia. J. Hydrol. 2018, 556, 1182–1191. [Google Scholar] [CrossRef]
- Tegegne, G.; Park, D. K.; Kim, Y.O. Comparison of hydrological models for the assessment of water resources in a data-scarce region, the Upper Blue Nile River Basin. J. Hydrol. 2017, 14, 49–66. [Google Scholar] [CrossRef]
- Nash, J.E.; Sutcliffe, J.V. River flow forecasting through conceptual models part I – a discussion of principles. J. Hydrol 1970, 10(3), 282–290. [Google Scholar] [CrossRef]
- Gupta, H. V.; Kling, H.; Yilmaz, K. K.; Martinez, G. F. Decomposition of the mean squared error and NSE performance criteria: Implications for improving hydrological modelling. J. Hydrol. 2009, 377, 80–91. [Google Scholar] [CrossRef]
- Reis, A. A.; Weerts, A.; Ramos, M.H.; Wetterhall, F.; Fernandes, W.S. Hydrological data and modeling to combine and validate precipitation datasets relevant to hydrological applications. J. Hydrol. 2022, 44, 101–200. [Google Scholar] [CrossRef]
- de Lavenne, A.; Lindström, G.; Strömqvist, J.; Pers, C.; Bartosova, A.; Arheimer, B. Evaluation of overland flow modelling hypotheses with a multi-objective calibration using discharge and sediment data. Hydrol. Process. 2022, 36(12), e14767. [Google Scholar] [CrossRef] [PubMed]
- Peredo, D.; Ramos, M.-H.; Andréassian, V.; Oudin, L. Investigating hydrological model versatility to simulate extreme flood events. Hydrol. Sci. J. 2022, 67(4), 628–645. [Google Scholar] [CrossRef]
- Langhammer, J.; Bernsteinová, J.; Miřijovský, J. Building a High-Precision 2D Hydrodynamic Flood Model Using UAV Photogrammetry and Sensor Network Monitoring. Water 2017, 9, 861. [Google Scholar] [CrossRef]
Figure 1.
Study area: (a) Study site location in Haiti; (b) Rouyonne river channel and its upper watershed; (c) Altitude distribution in the upper watershed.
Figure 1.
Study area: (a) Study site location in Haiti; (b) Rouyonne river channel and its upper watershed; (c) Altitude distribution in the upper watershed.
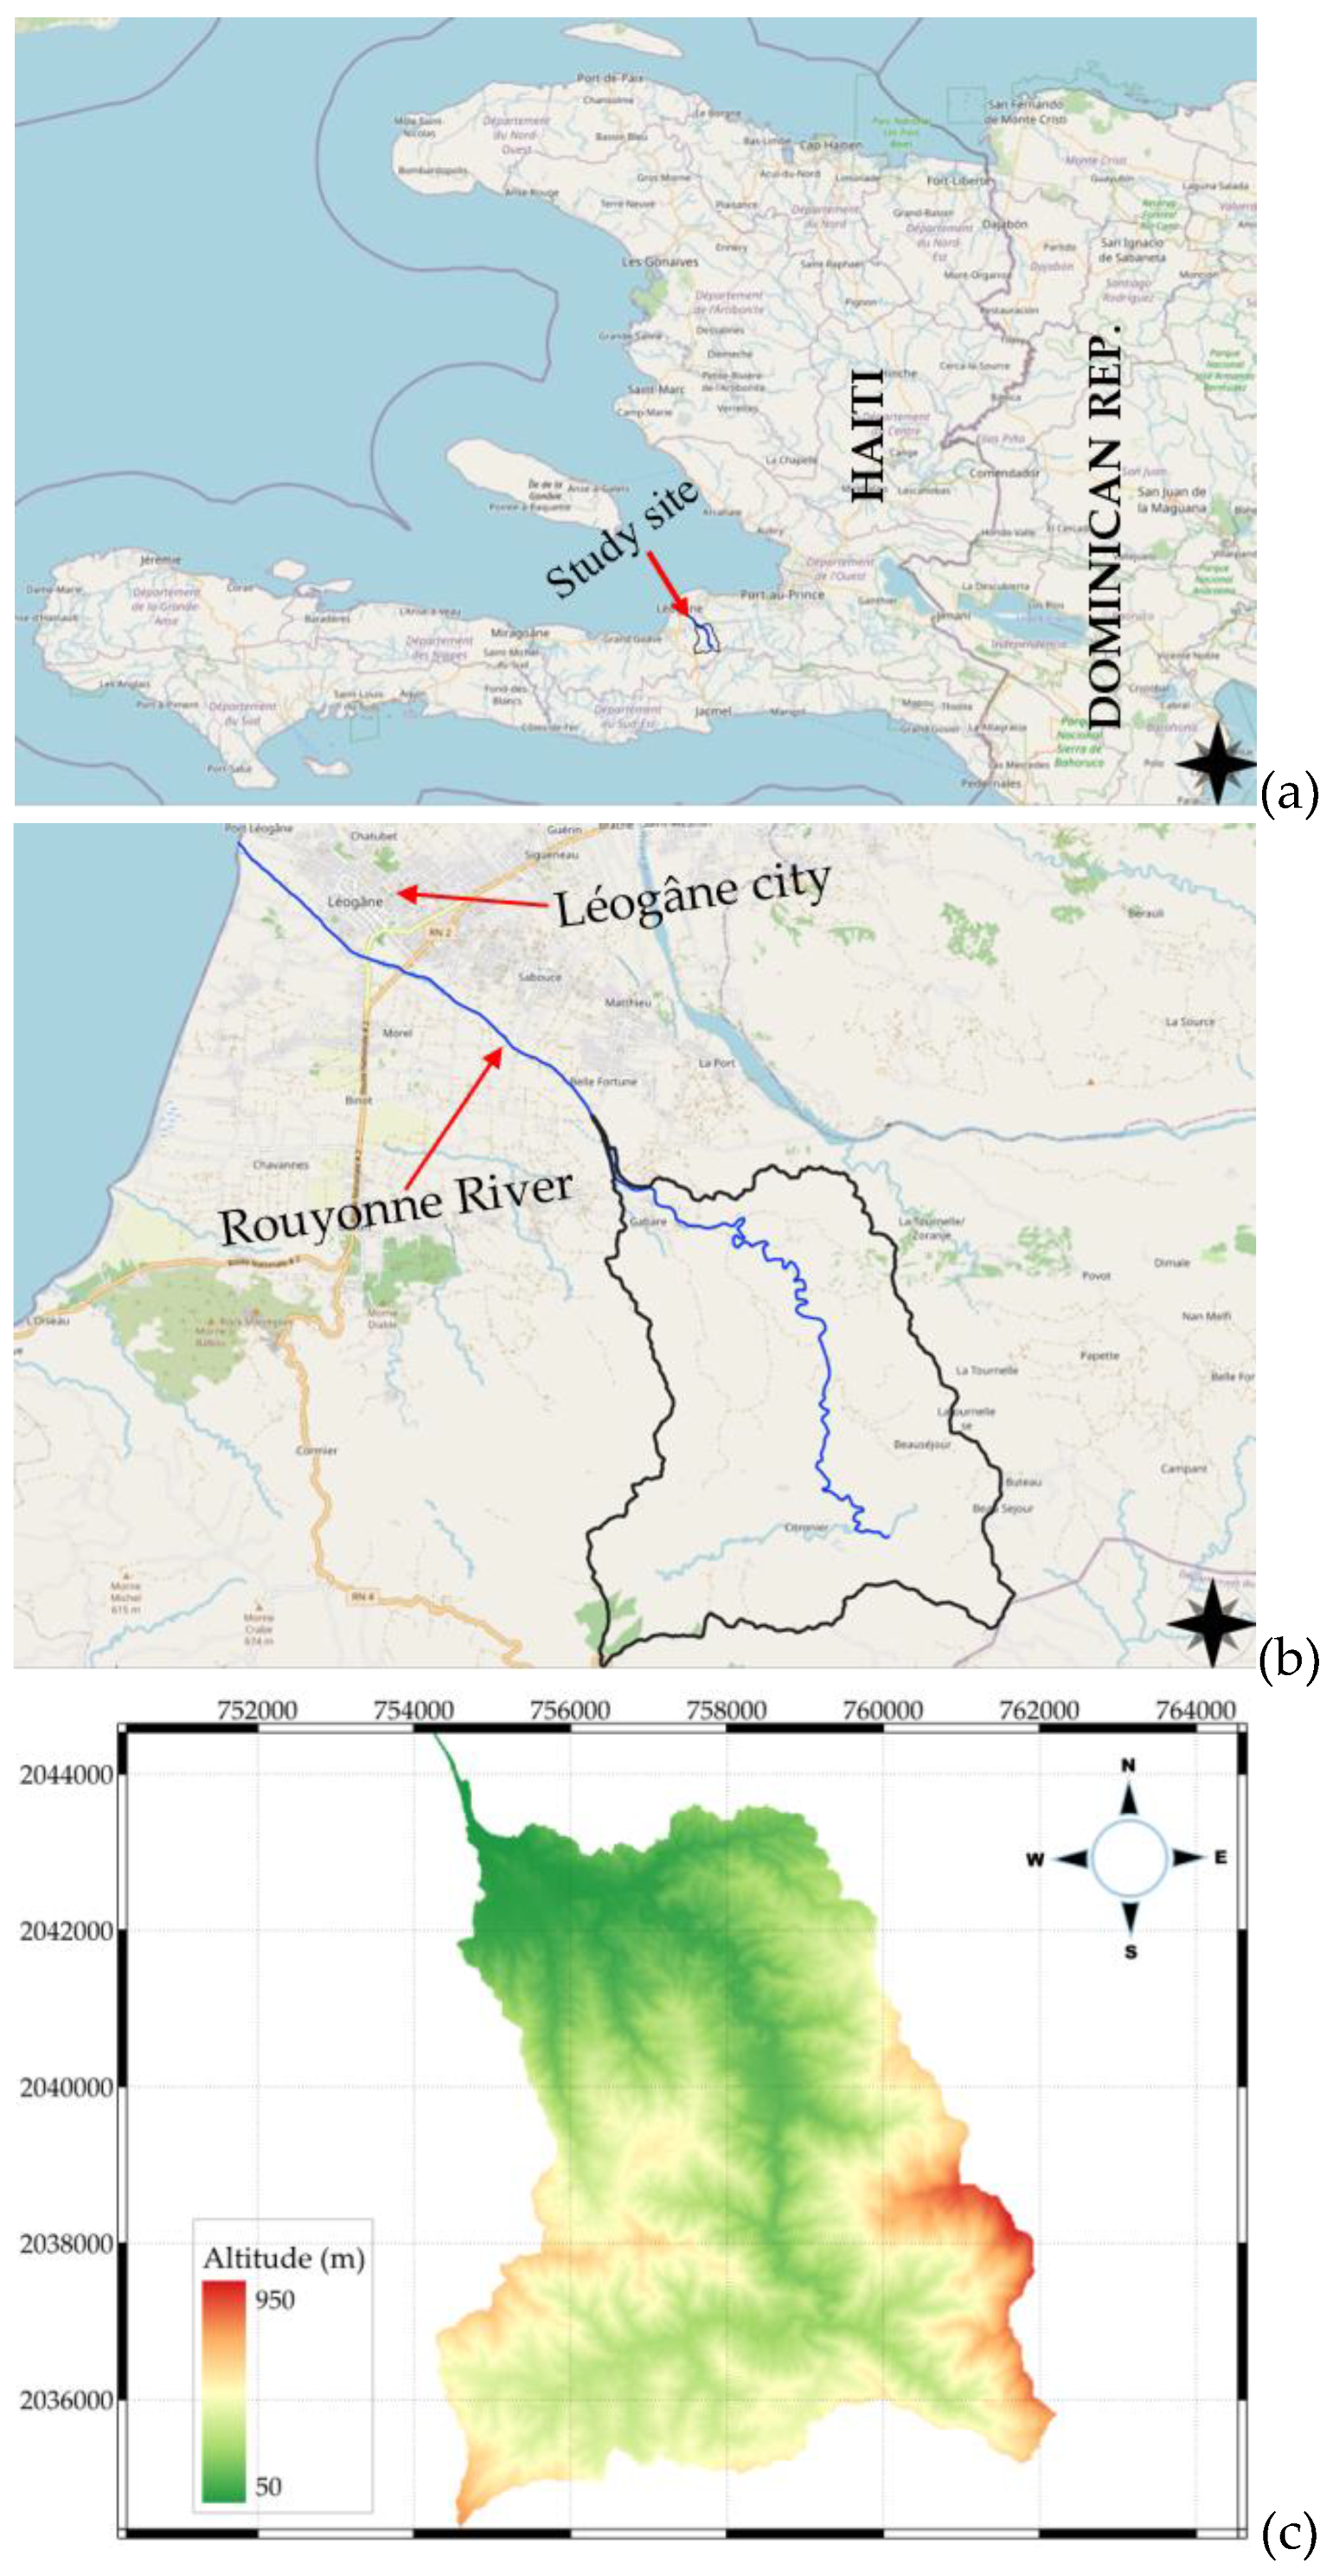
Figure 2.
Illustration of the damage caused by the June 3, 2023, event: (a) Buildings destroyed by the flood in the town of Léogâne; (b) Pressure sensor broken by flood at the measuring section; (c) High-water mark measurement.
Figure 2.
Illustration of the damage caused by the June 3, 2023, event: (a) Buildings destroyed by the flood in the town of Léogâne; (b) Pressure sensor broken by flood at the measuring section; (c) High-water mark measurement.
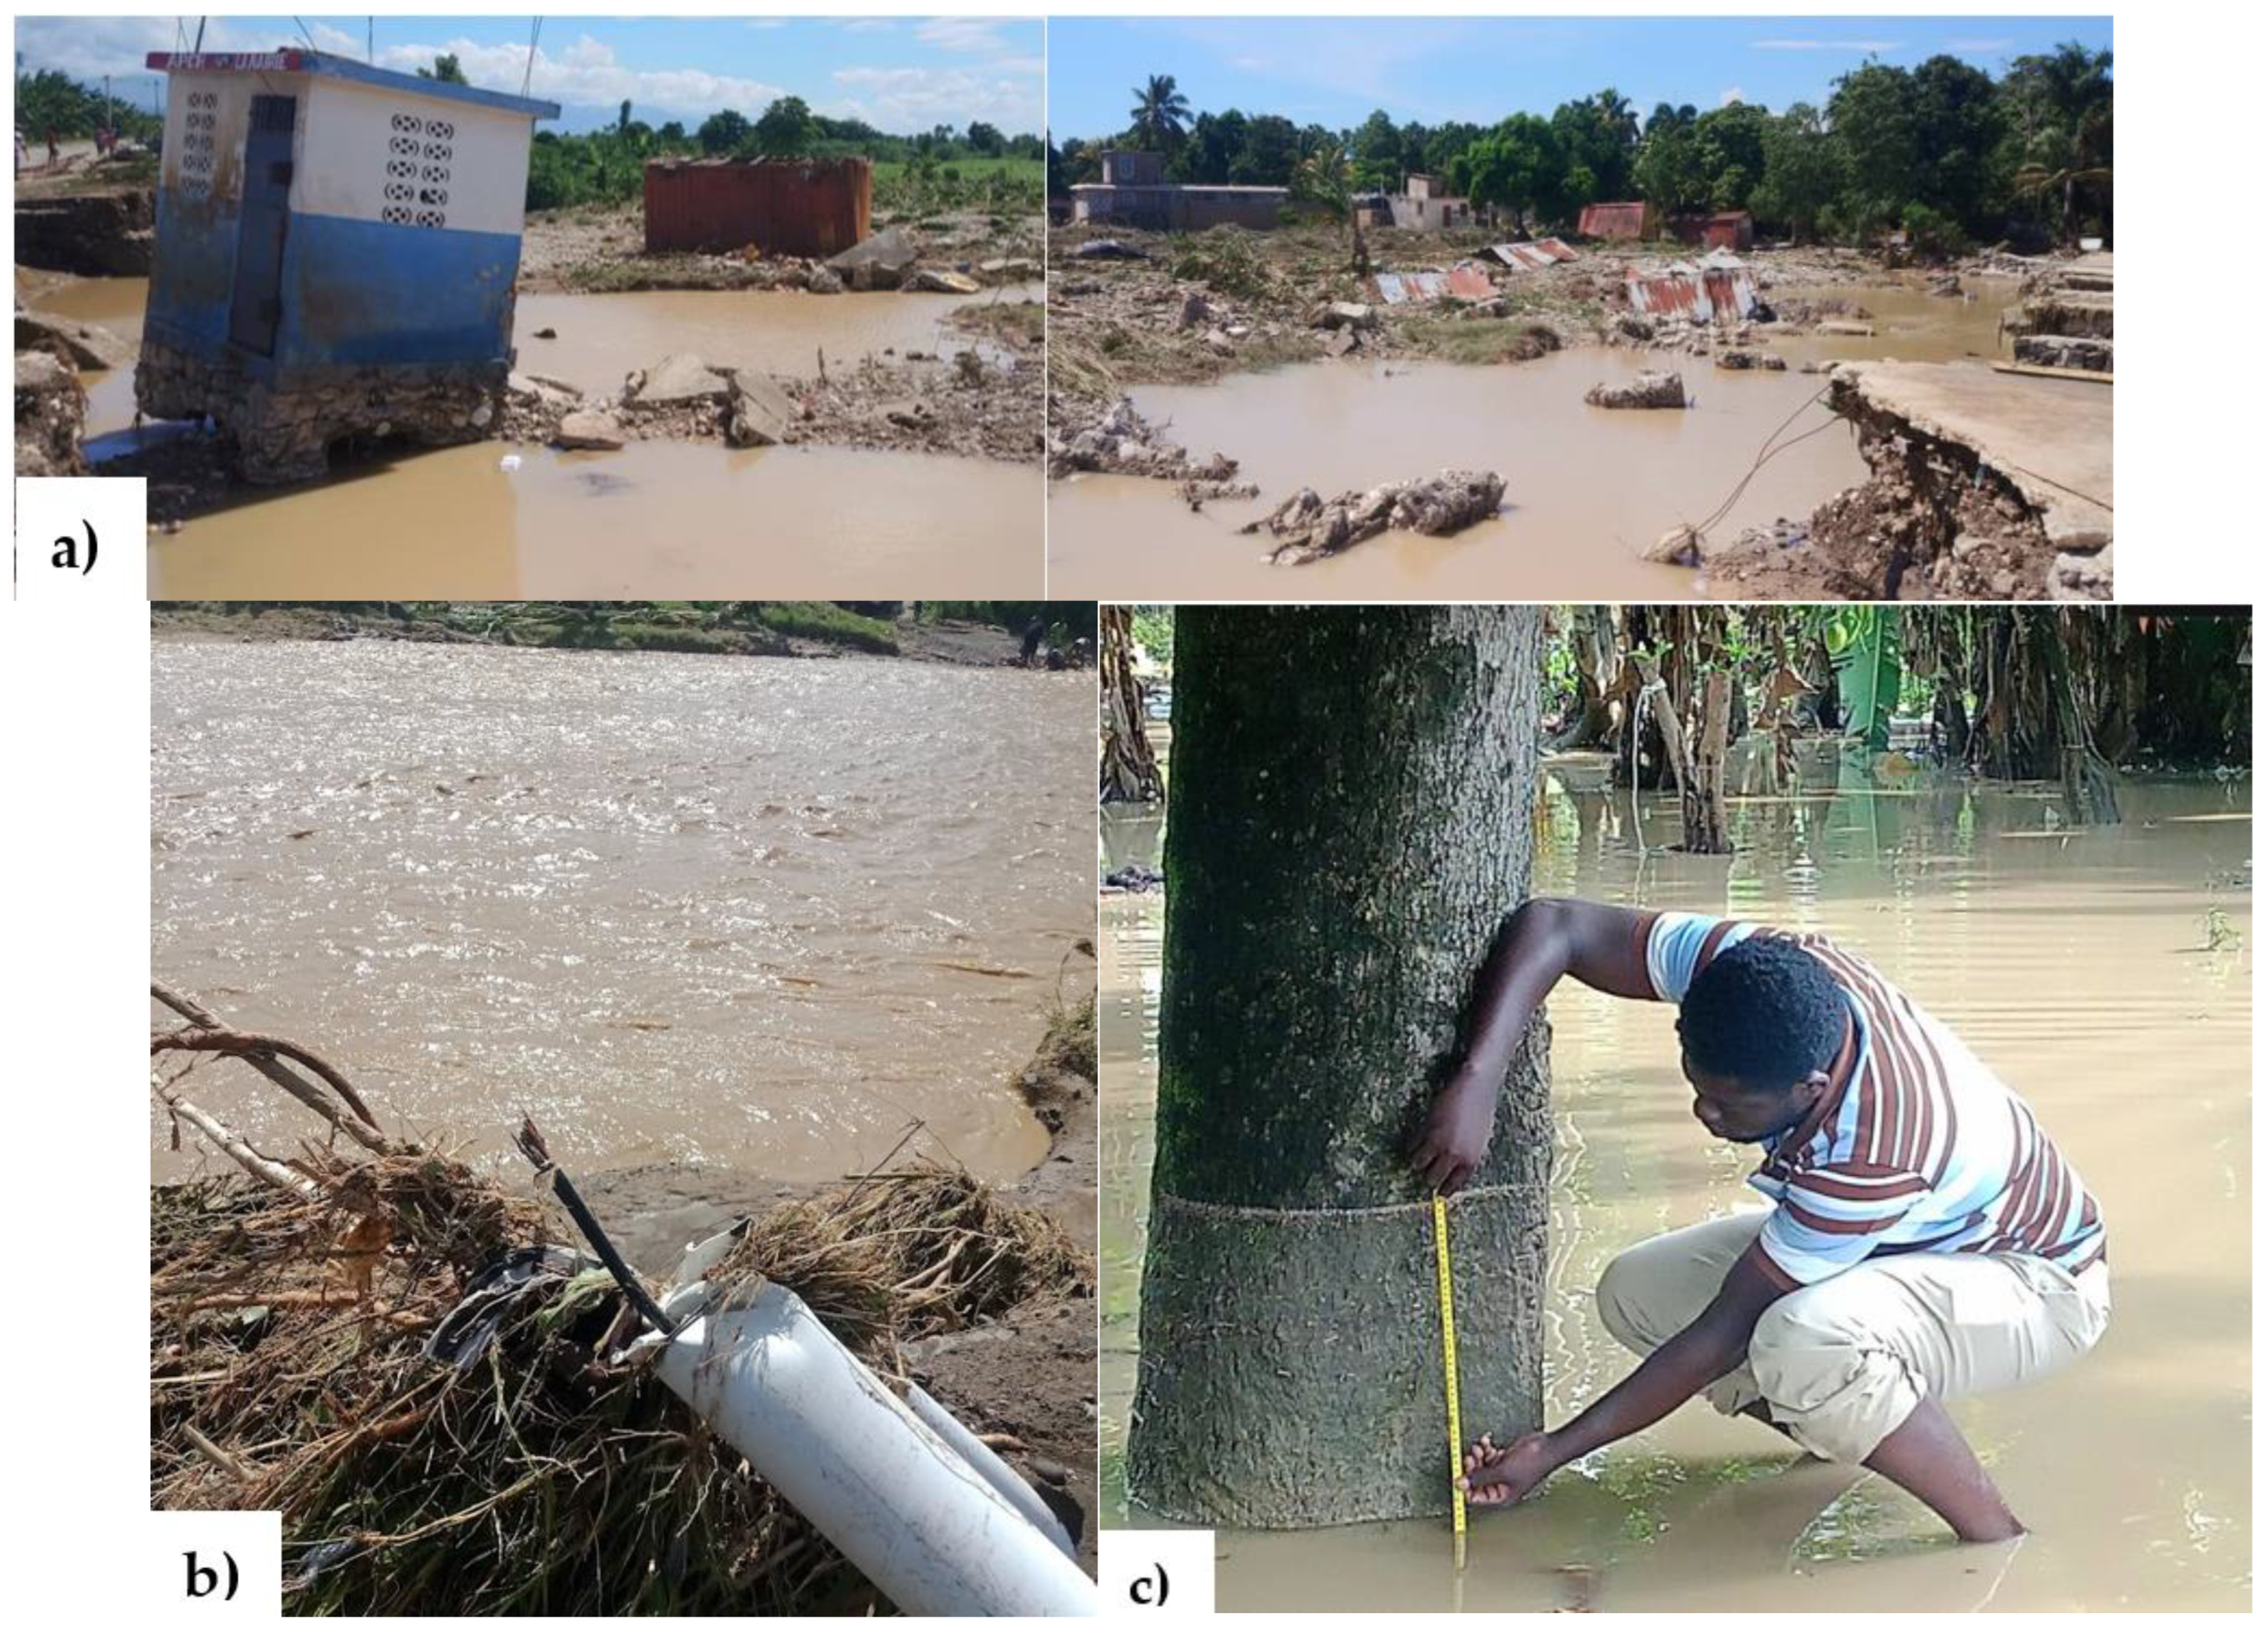
Figure 3.
Illustration of image acquisition: (a) pre-processing image of river during the dry season; (b) DJI drone equipped with a GoPro Camera (sensor type: 1/2.3" CMOS; camera type: Sport/action camera; Equivalent focal length: 16.41 mm; Lens type: Wide angle; Aperture: f/2.8).
Figure 3.
Illustration of image acquisition: (a) pre-processing image of river during the dry season; (b) DJI drone equipped with a GoPro Camera (sensor type: 1/2.3" CMOS; camera type: Sport/action camera; Equivalent focal length: 16.41 mm; Lens type: Wide angle; Aperture: f/2.8).
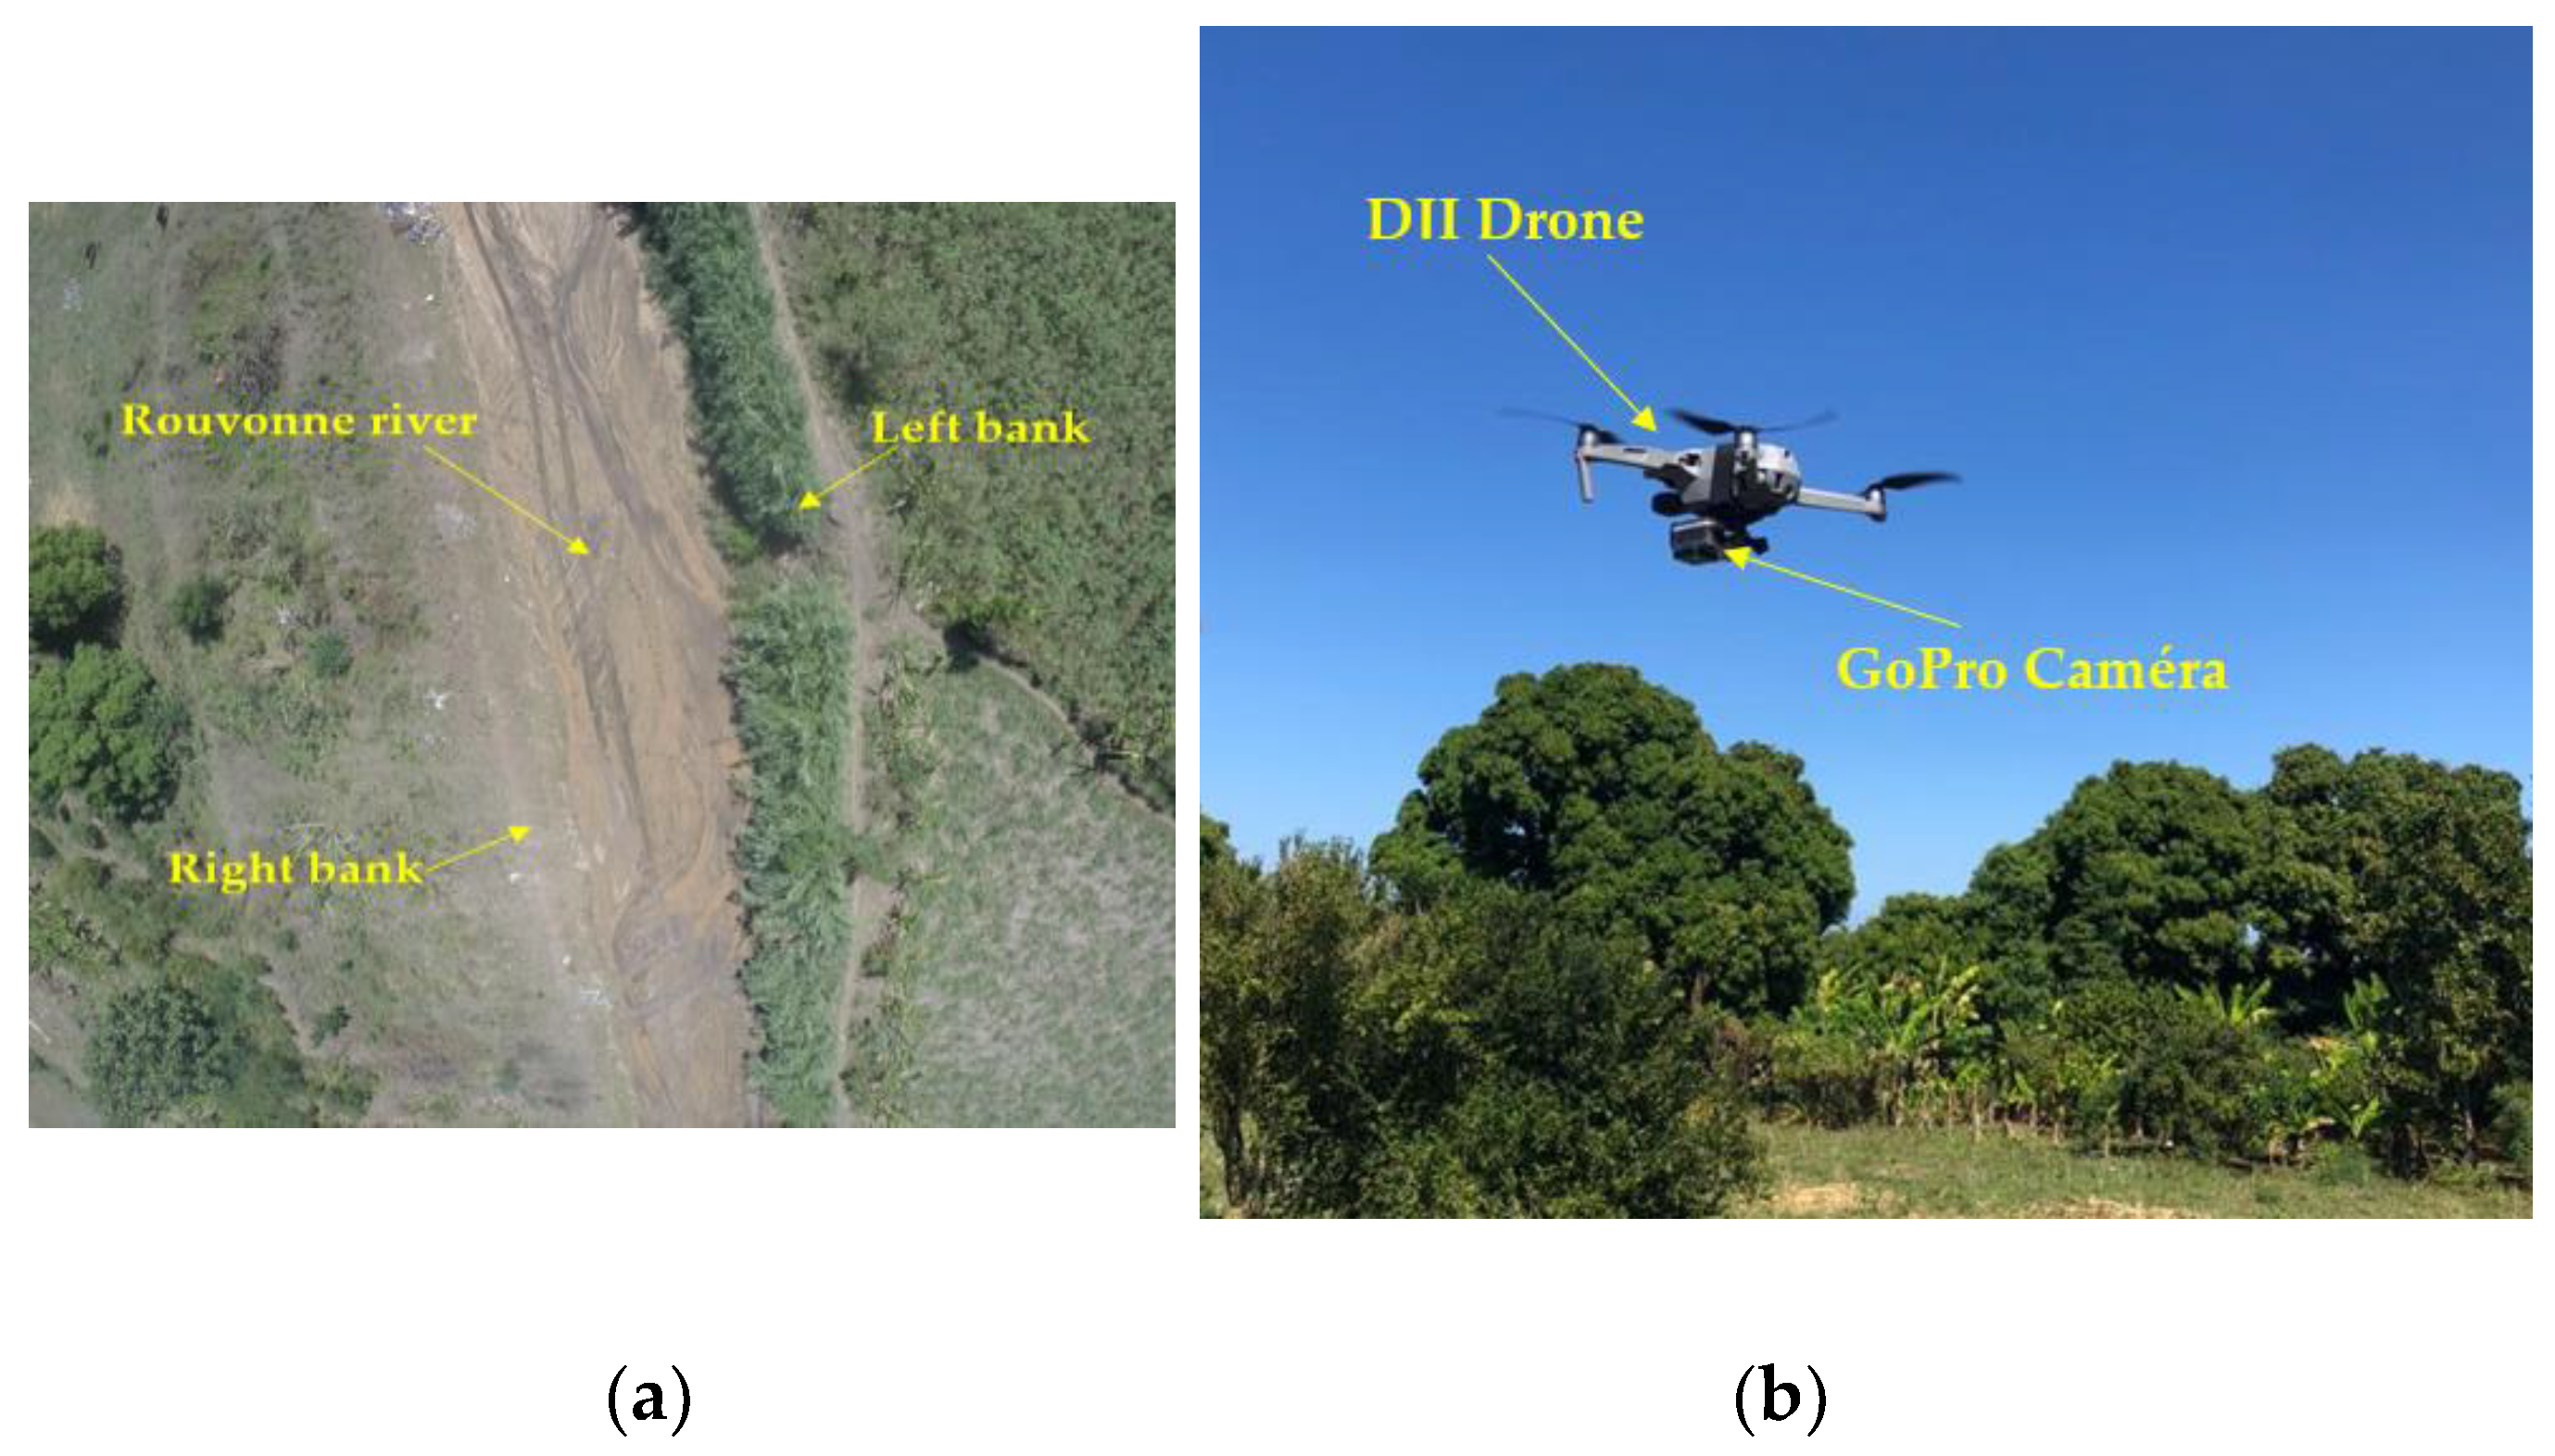
Figure 4.
Illustration of morphological changes in the Rouyonne river channel: (a) Pre-processing image of cross section 54-54 of Rouyonne River; (b) Bathymetric data comparison between UAV photogrammetry DTM (2022) and manual survey (2022); (c) Evolution of morphological changes between 2014 and 2022 in the cross-section 54-54.
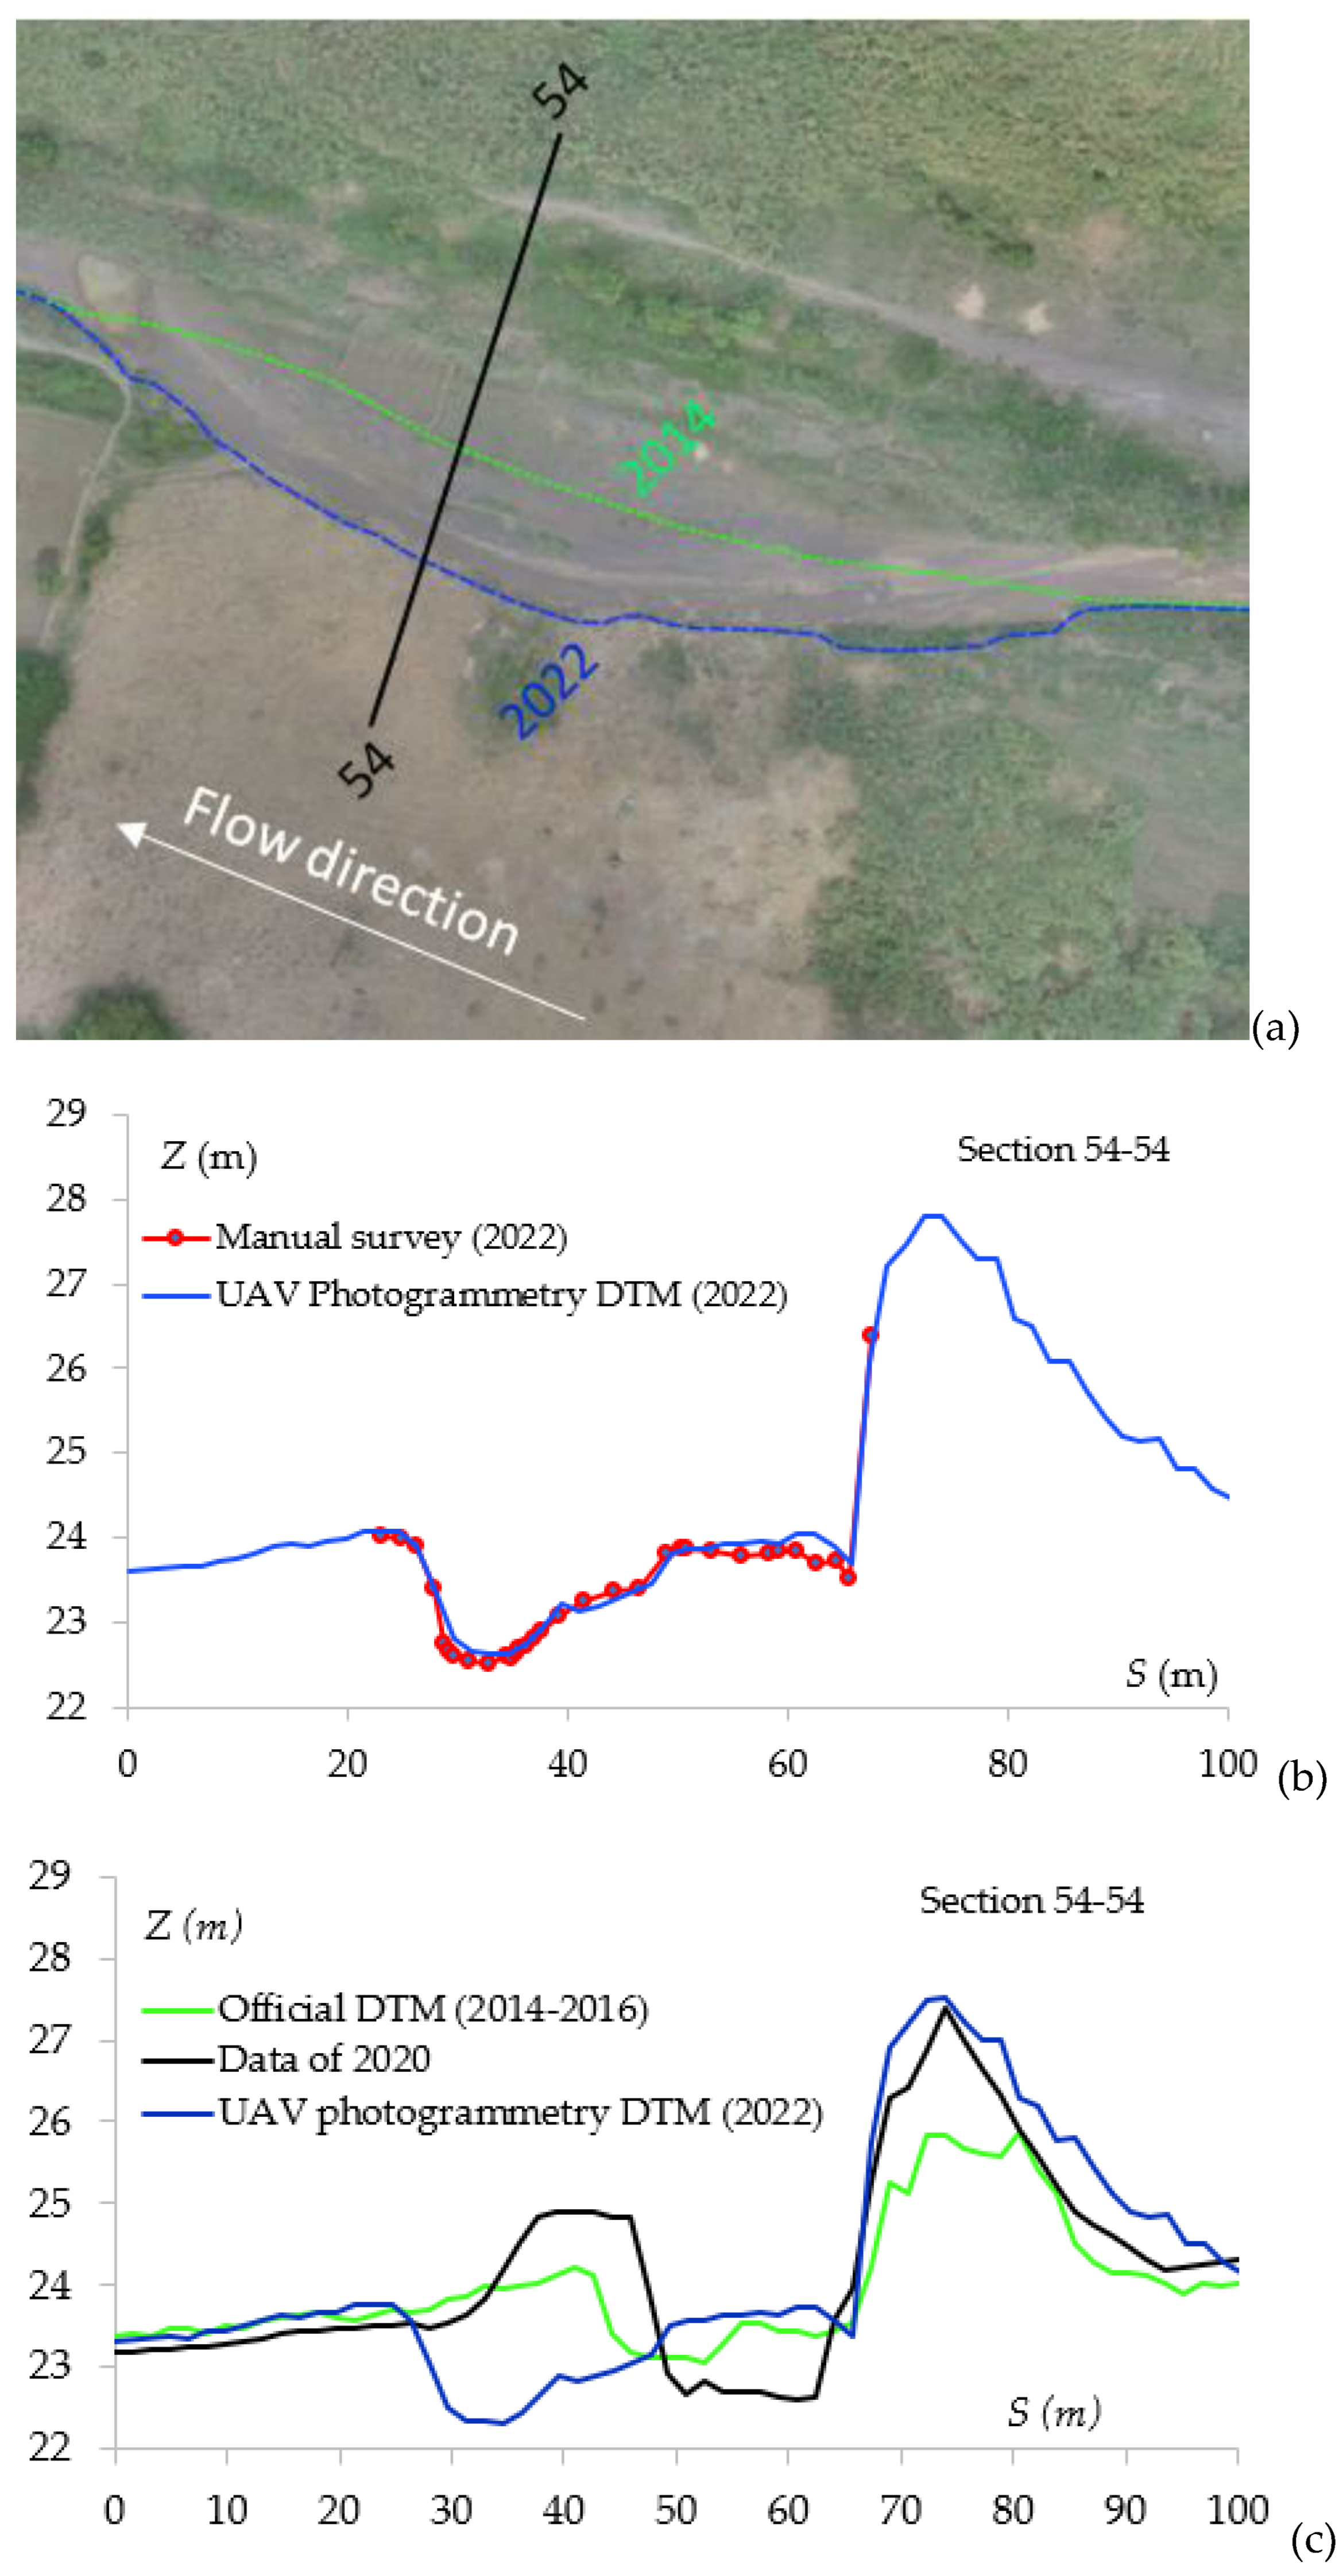
Figure 5.
Spatial repartition of high-water marks measured for June 2-3, 2023 event.
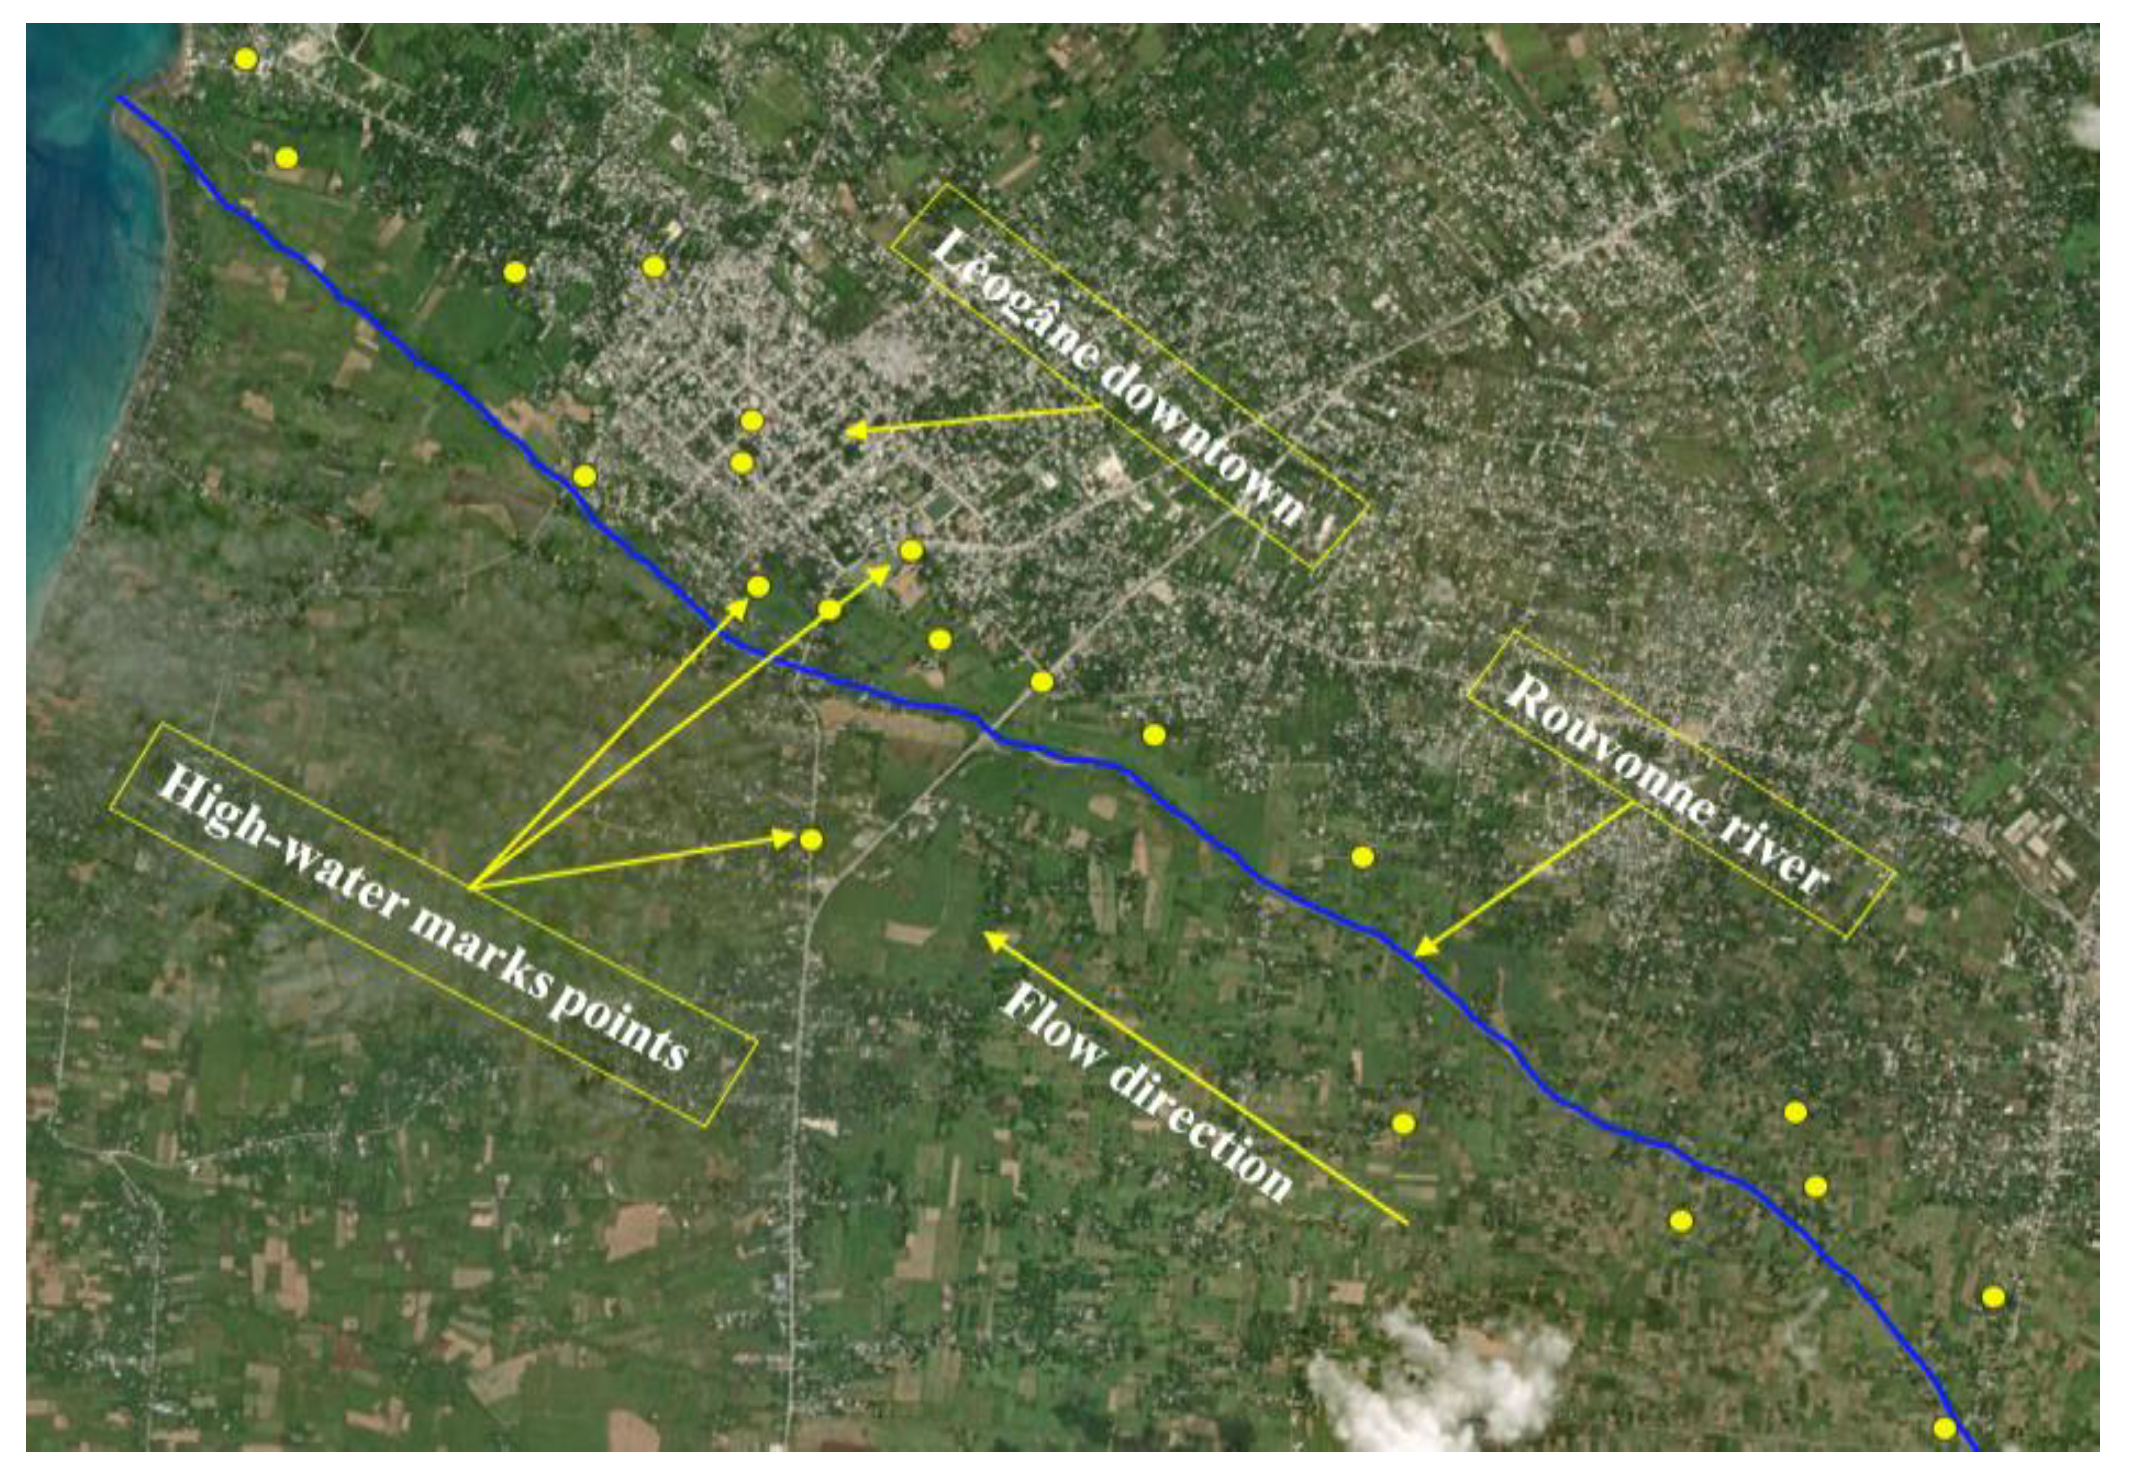
Figure 6.
Illustration of the unstructured mesh of the study area.
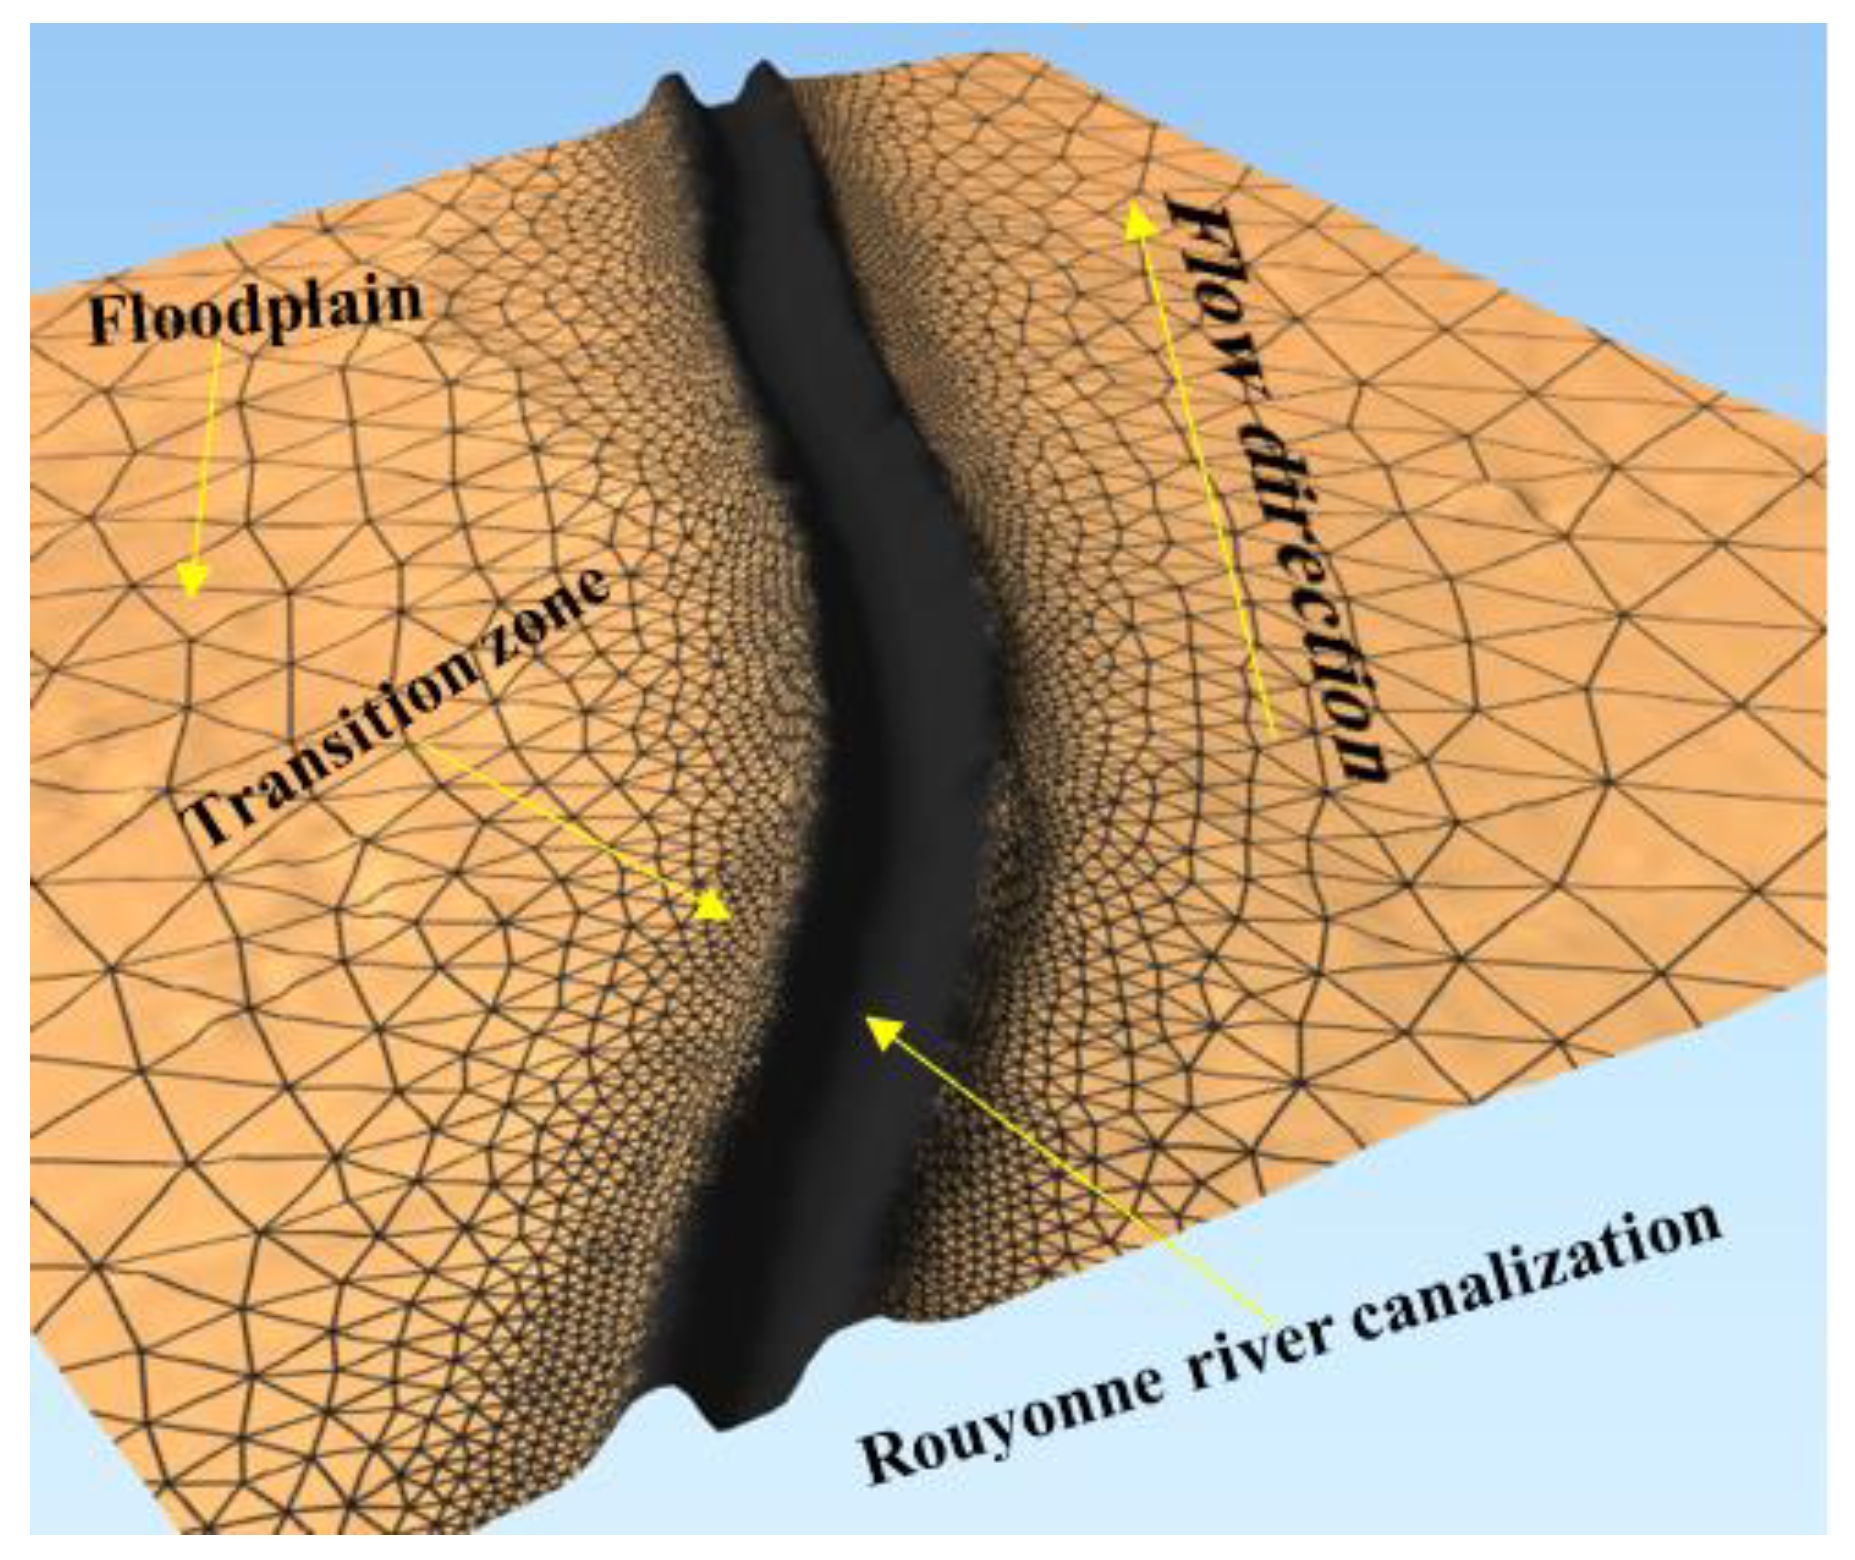
Figure 7.
Cross-section at the limnimetric station with the equivalent rectangle (discontinuous black line) used in the BaRatin method.
Figure 7.
Cross-section at the limnimetric station with the equivalent rectangle (discontinuous black line) used in the BaRatin method.
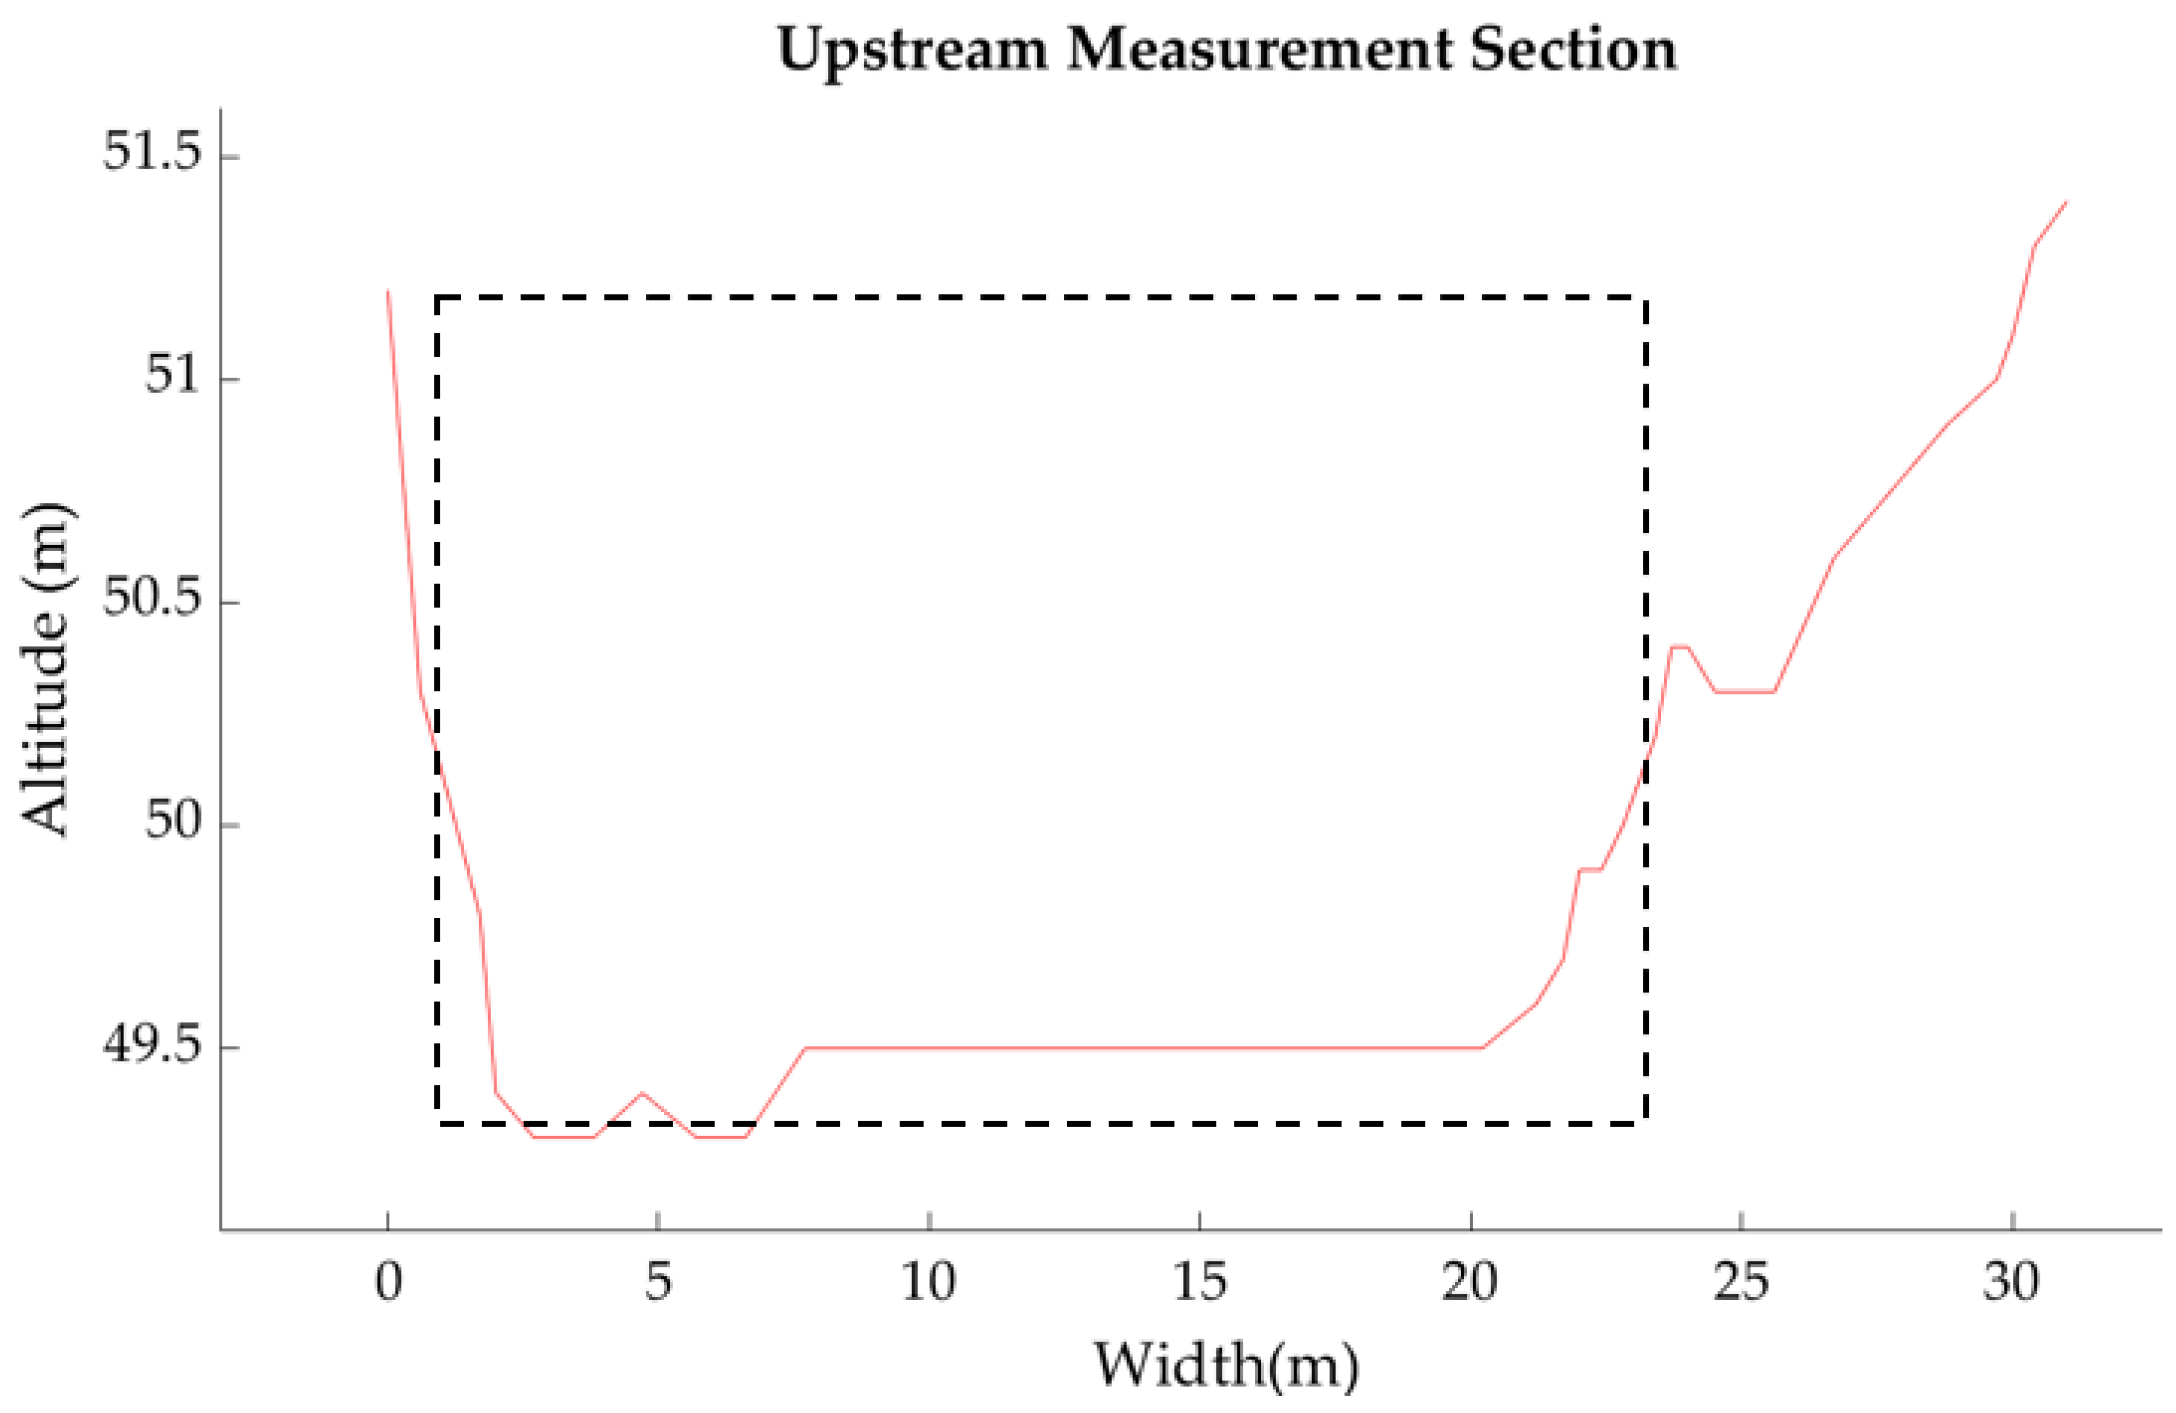
Figure 8.
Relationships between water depth and discharge at the measurement section: Comparison of Bayesian rating curve with uncertainties and uniform flow assumption.
Figure 8.
Relationships between water depth and discharge at the measurement section: Comparison of Bayesian rating curve with uncertainties and uniform flow assumption.
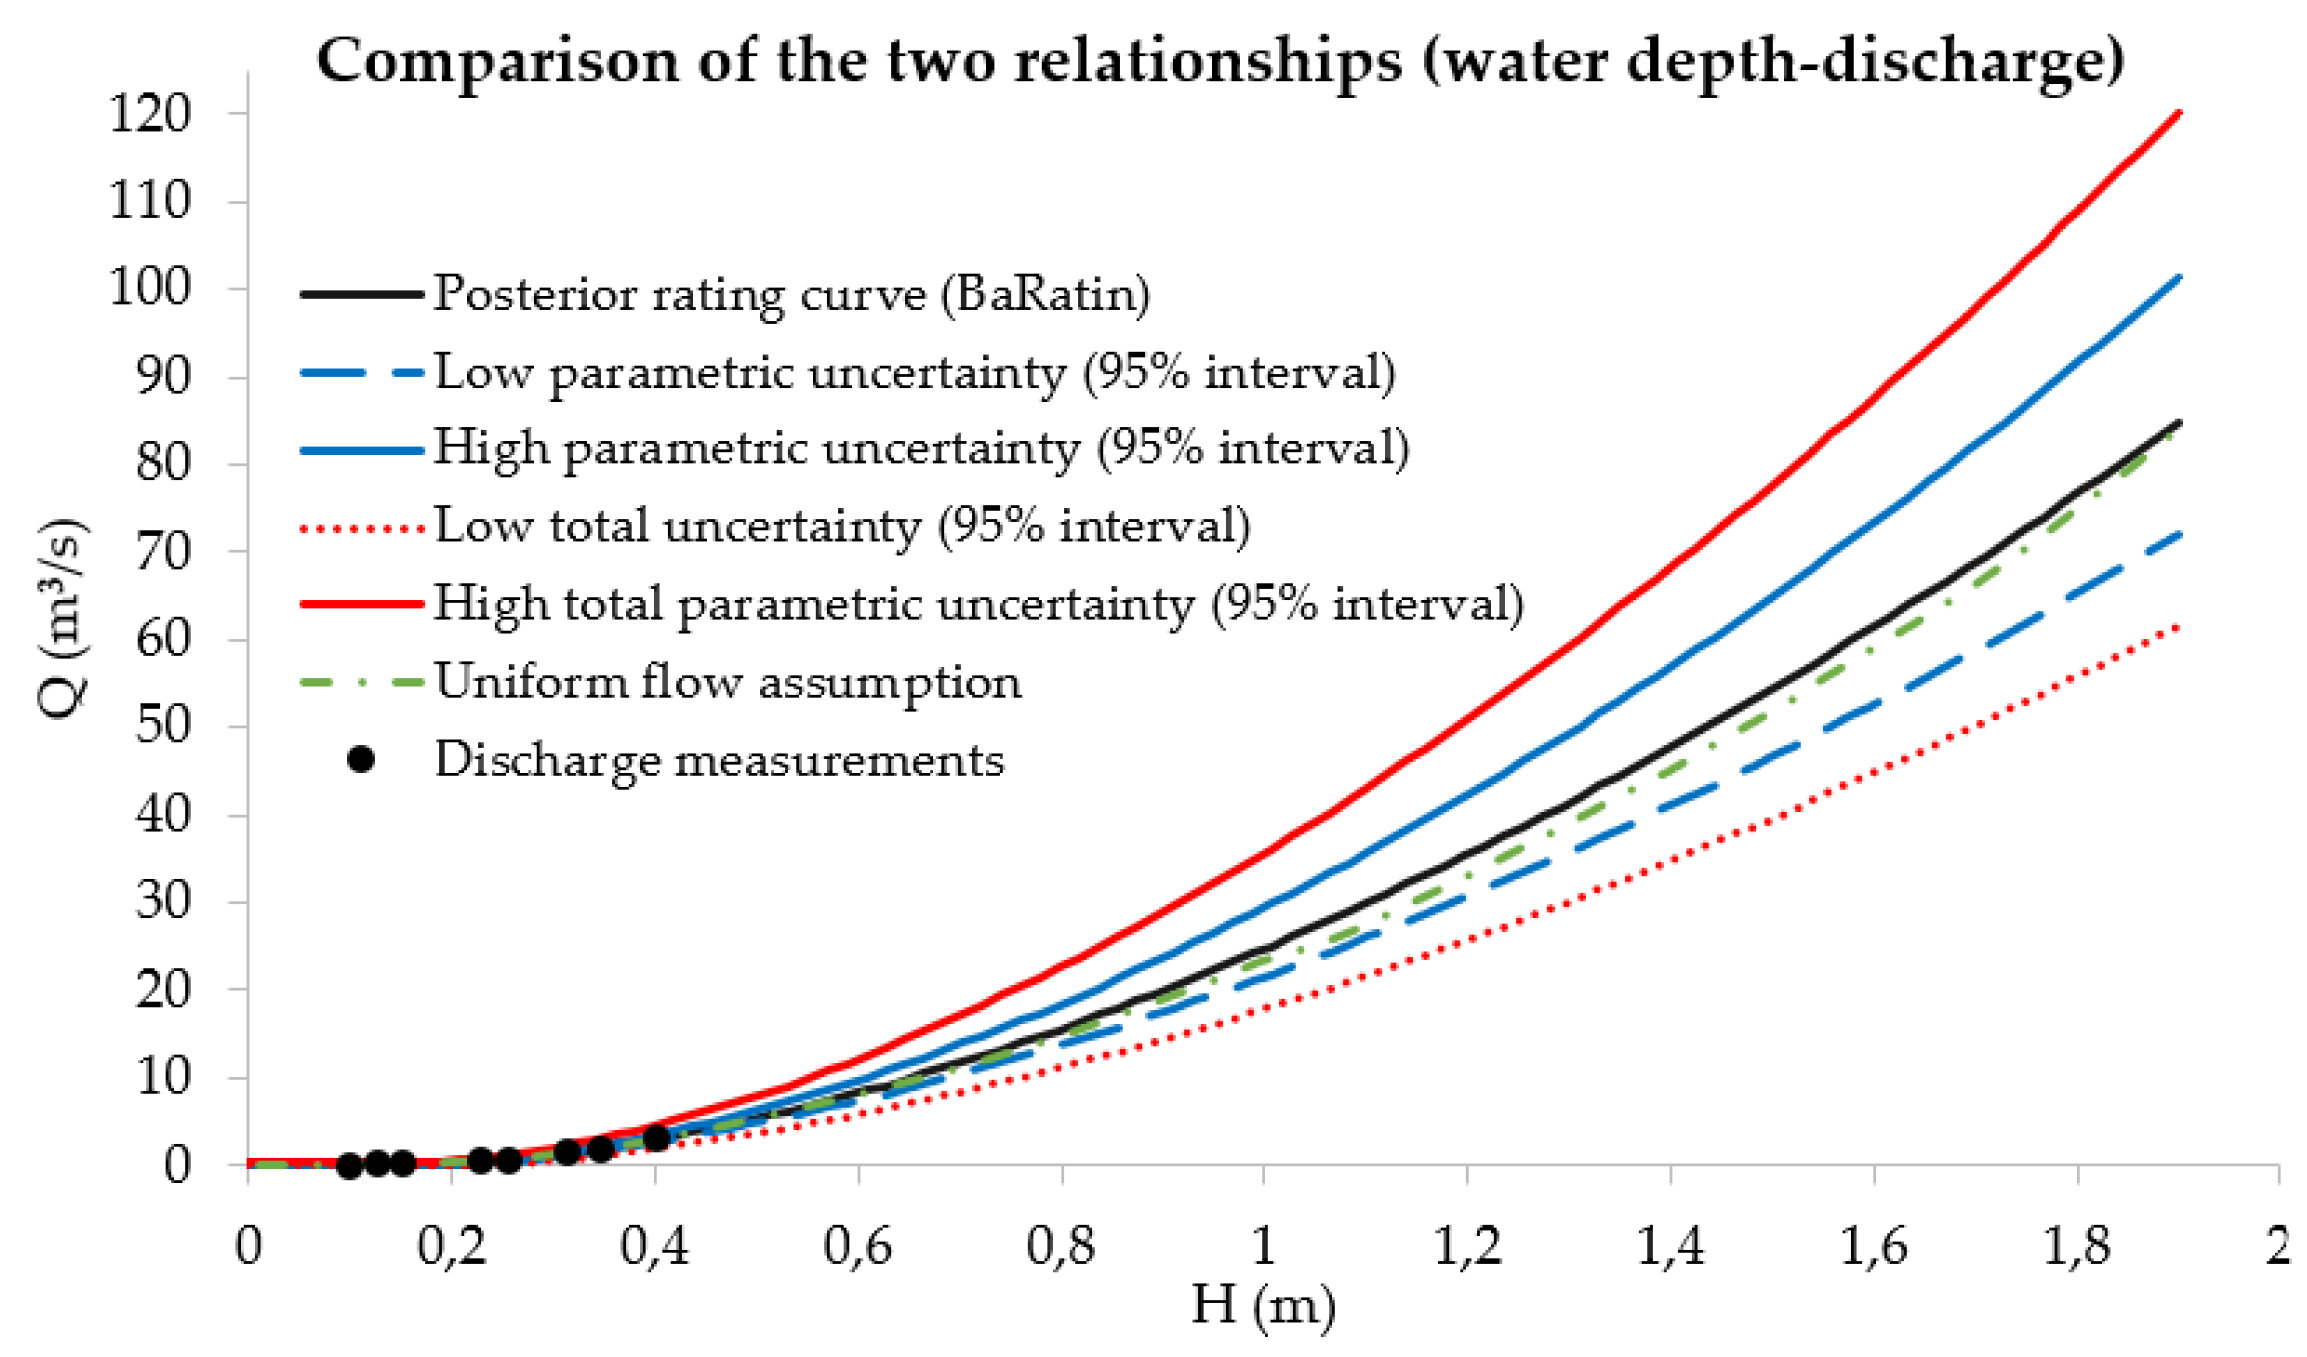
Figure 9.
Hydrological modelling: (a) calibration (August 2022); (b) validation (September 2022)
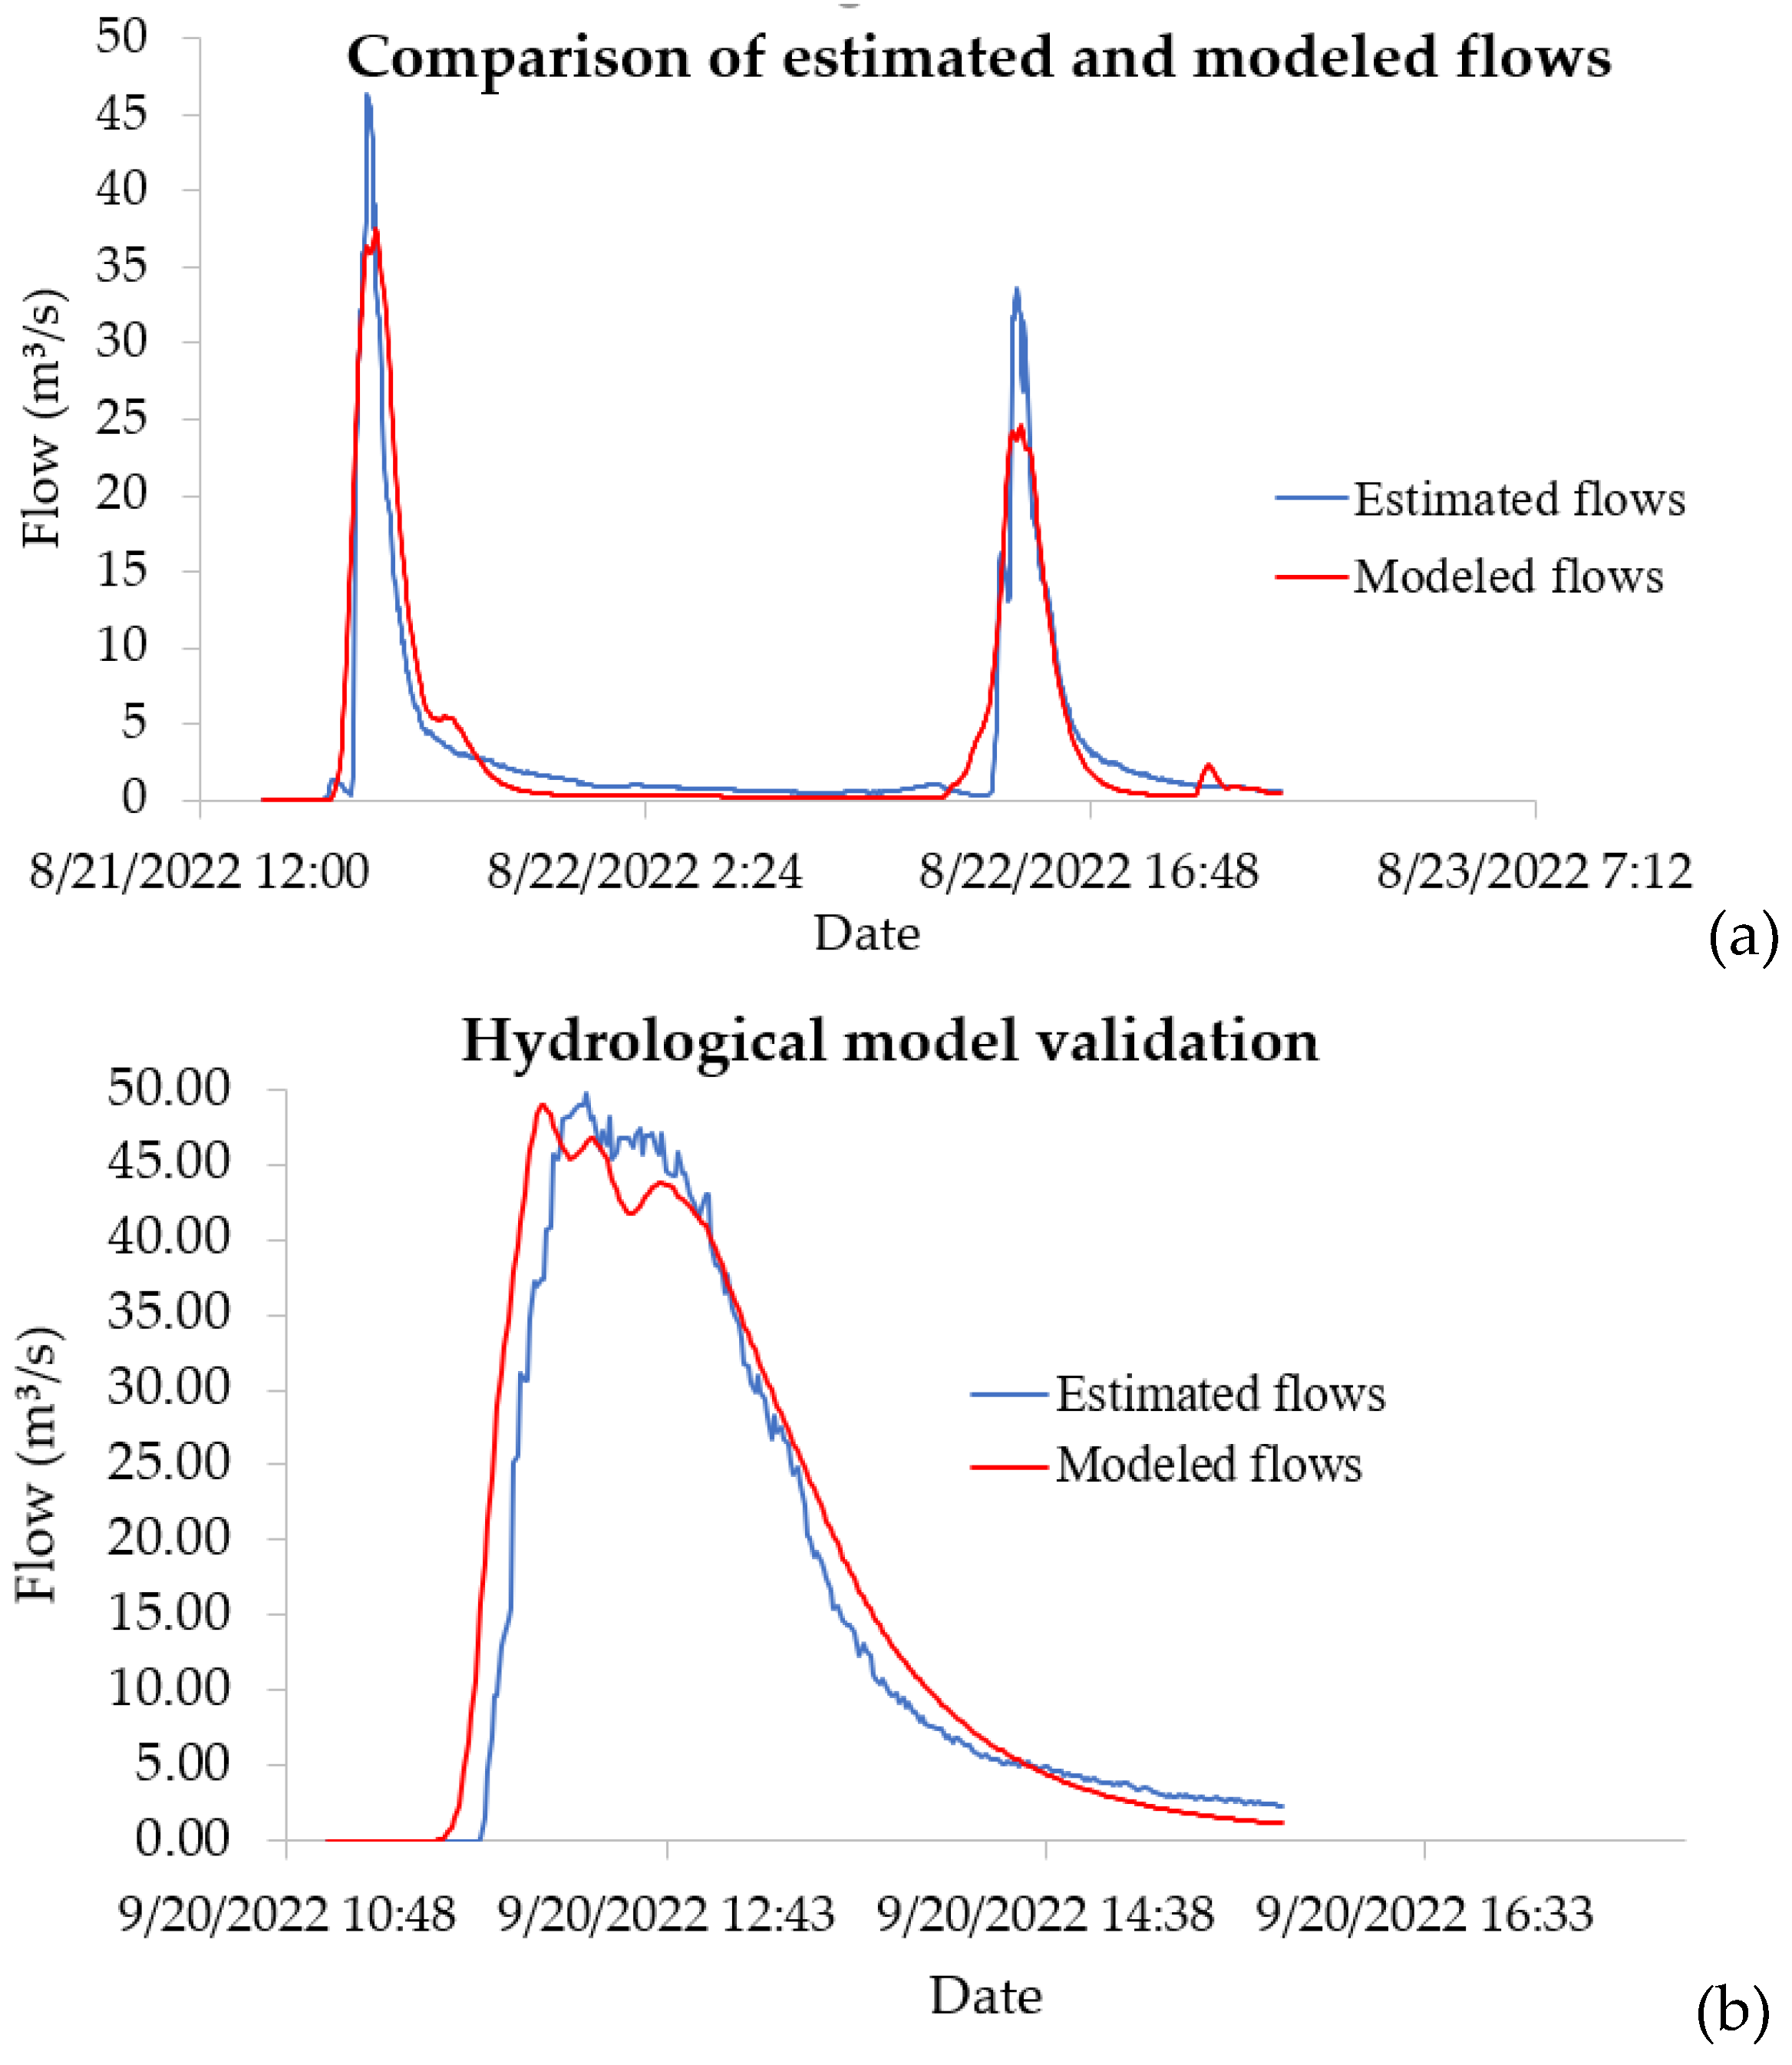
Figure 10.
Hydrological modelling applied to the event of June 2-3, 2023.
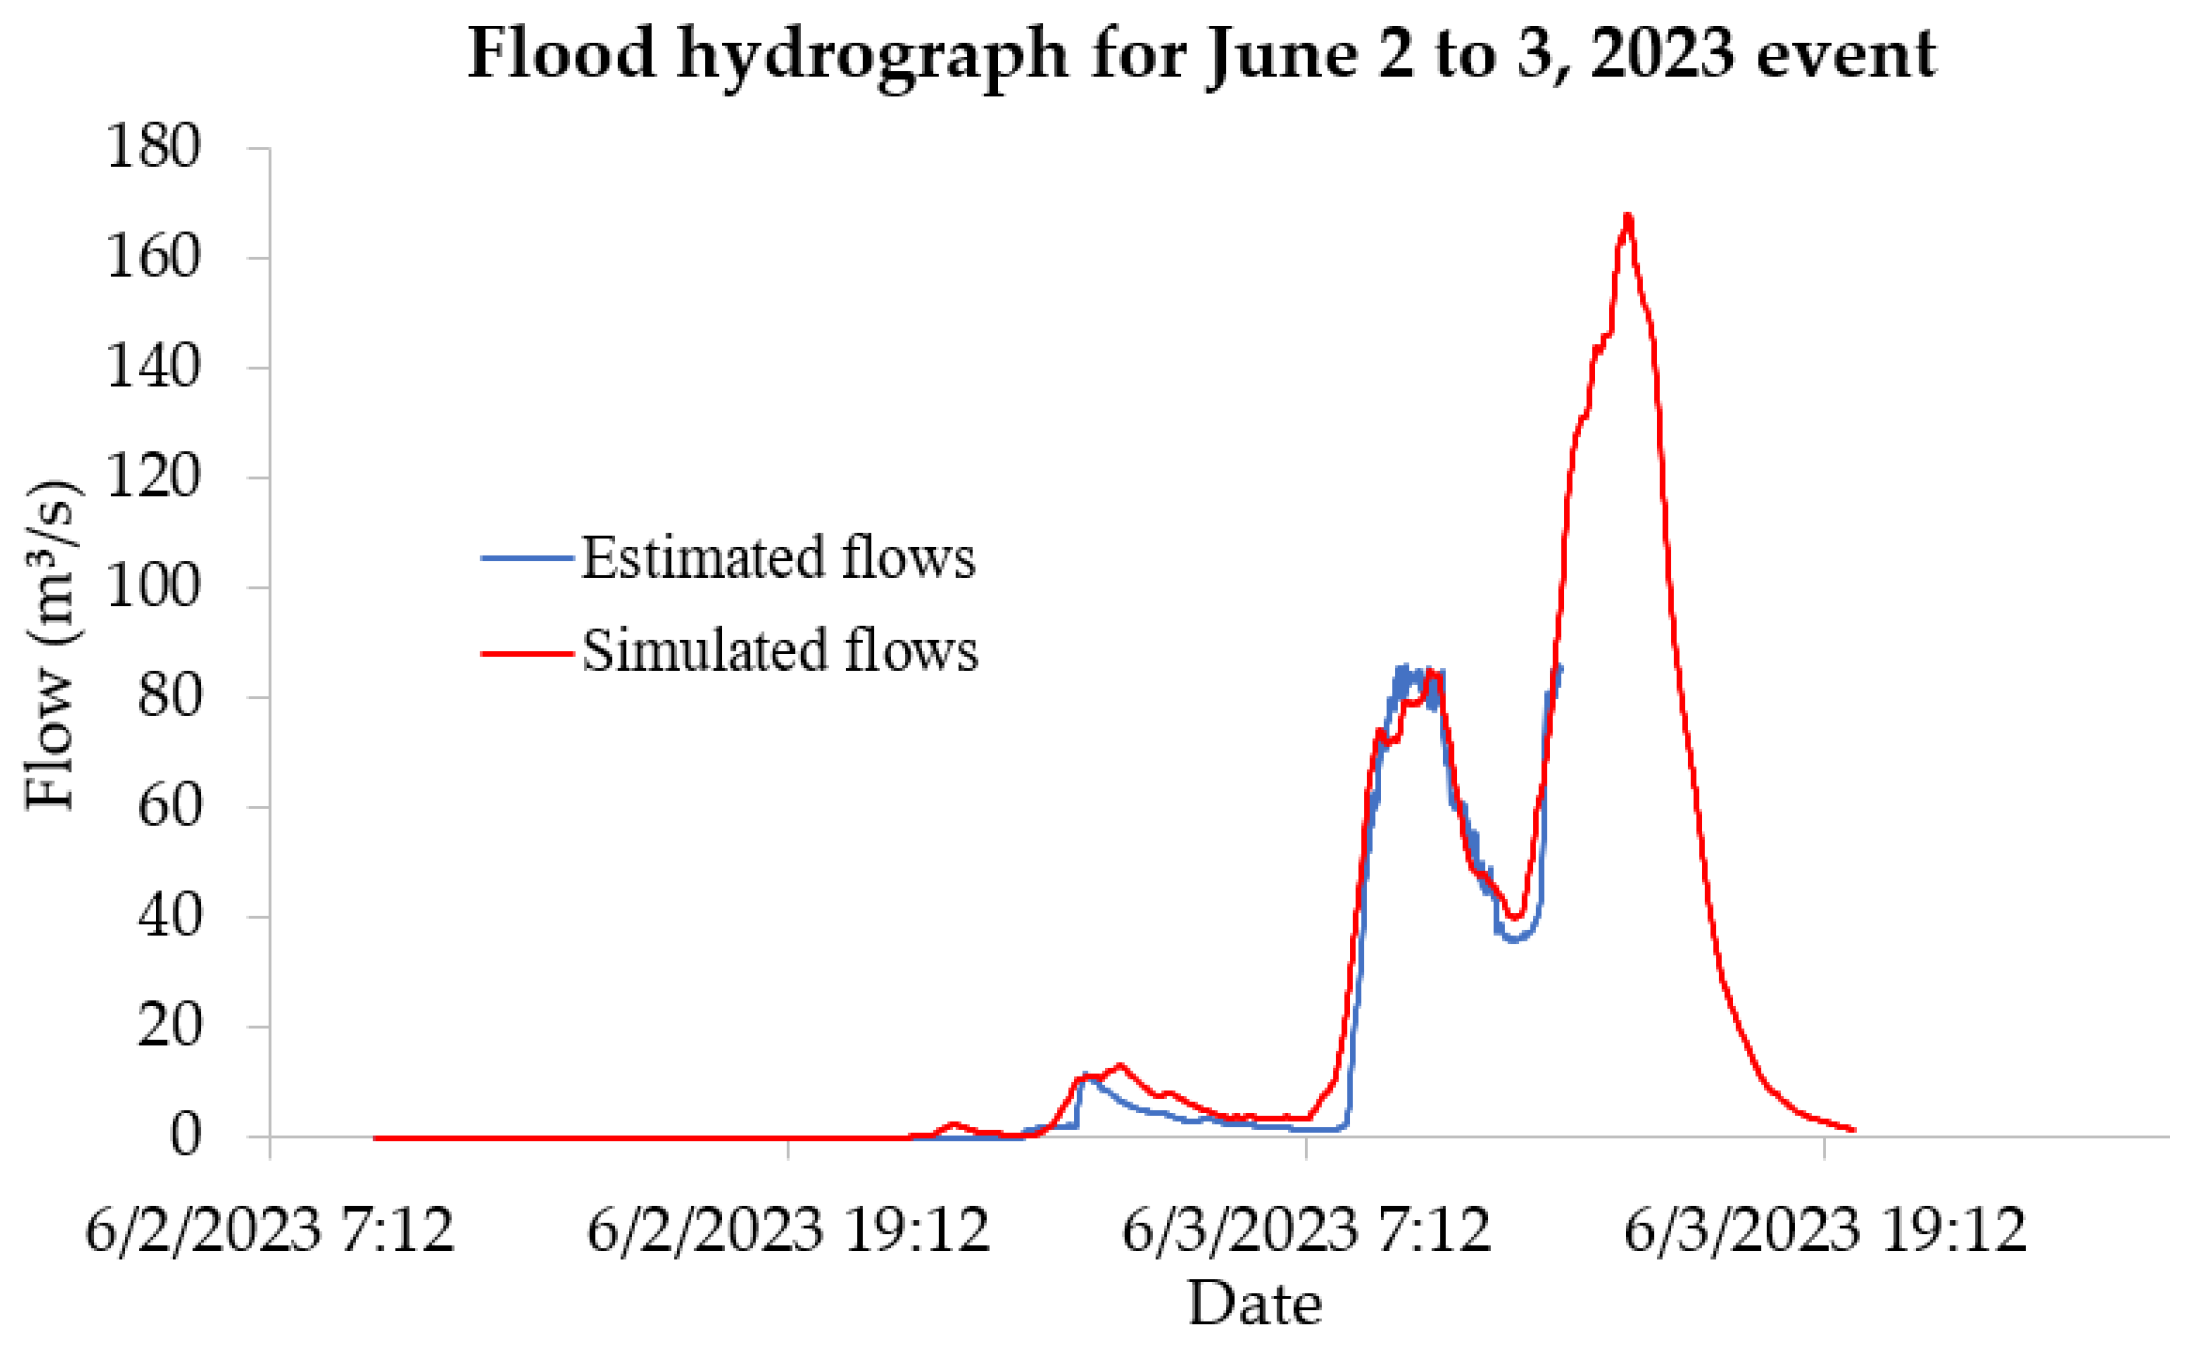
Figure 11.
Illustration of June 2-3, 2023, event simulation.
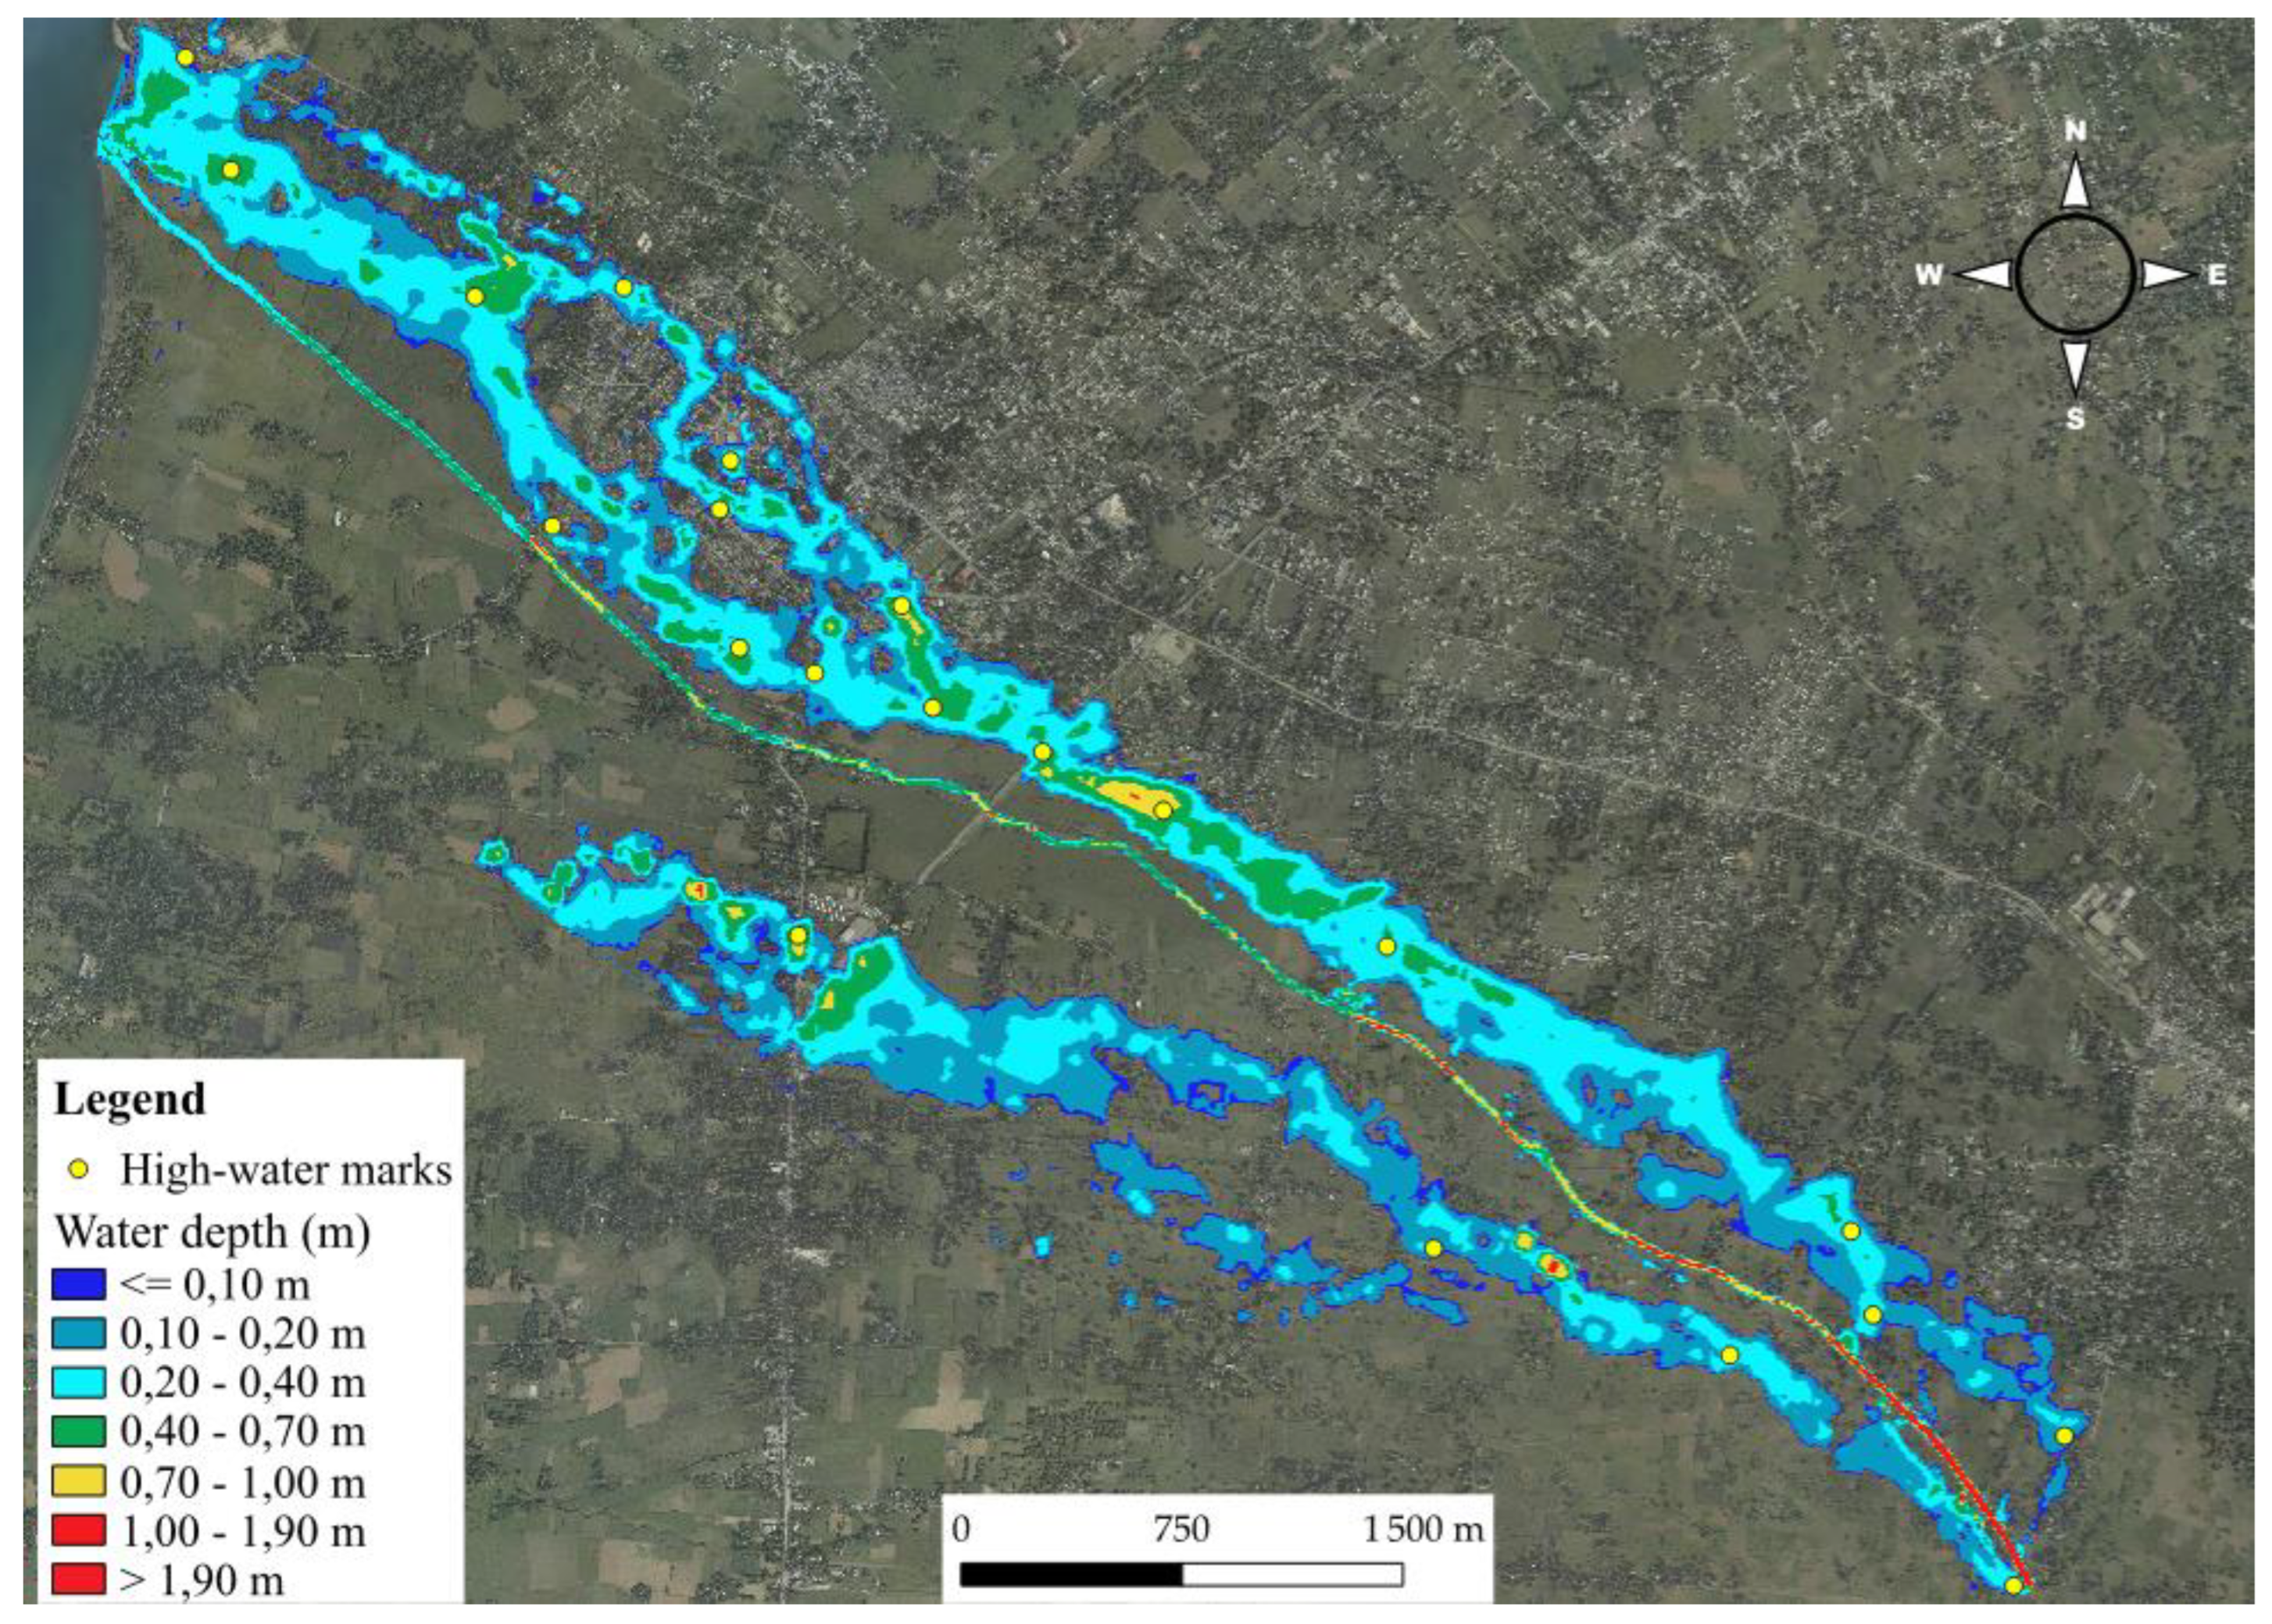
Figure 12.
comparison between observed and modeled water depth.
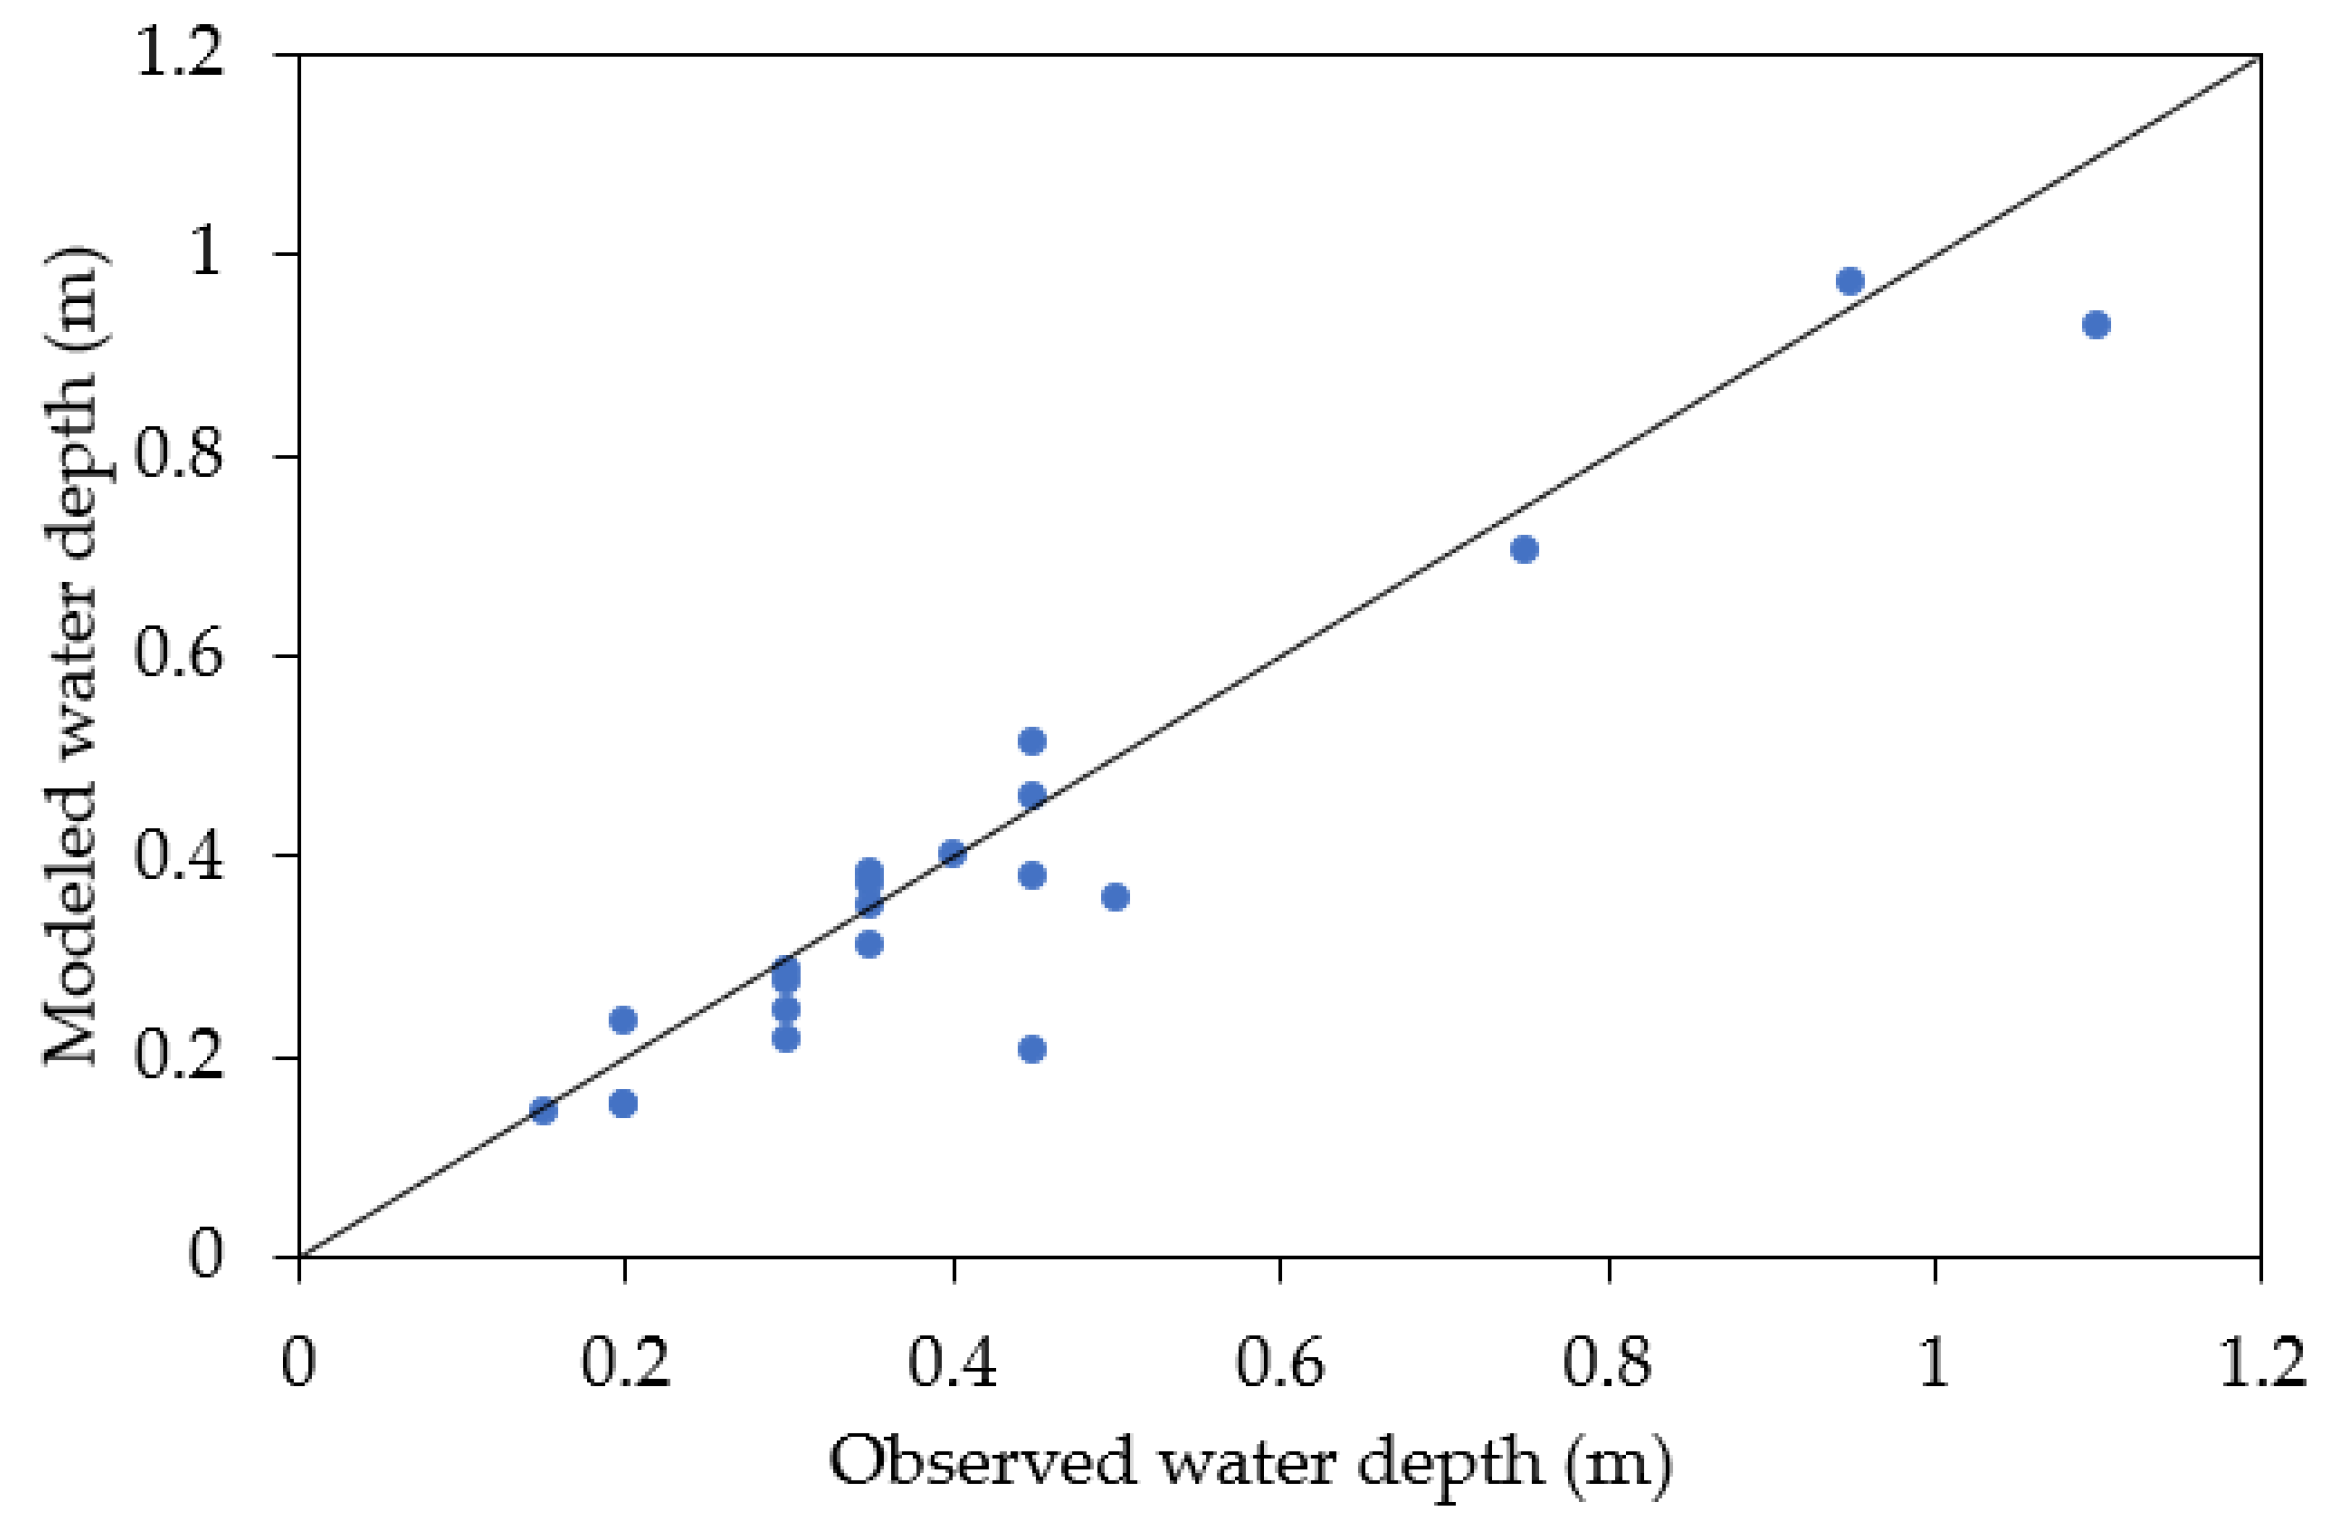
Figure 13.
Identification of overflow points on the Rouyonne river: (a) right bank overtopping to Léogâne downtown; (b) Left bank overtopping where the probe was installed.
Figure 13.
Identification of overflow points on the Rouyonne river: (a) right bank overtopping to Léogâne downtown; (b) Left bank overtopping where the probe was installed.
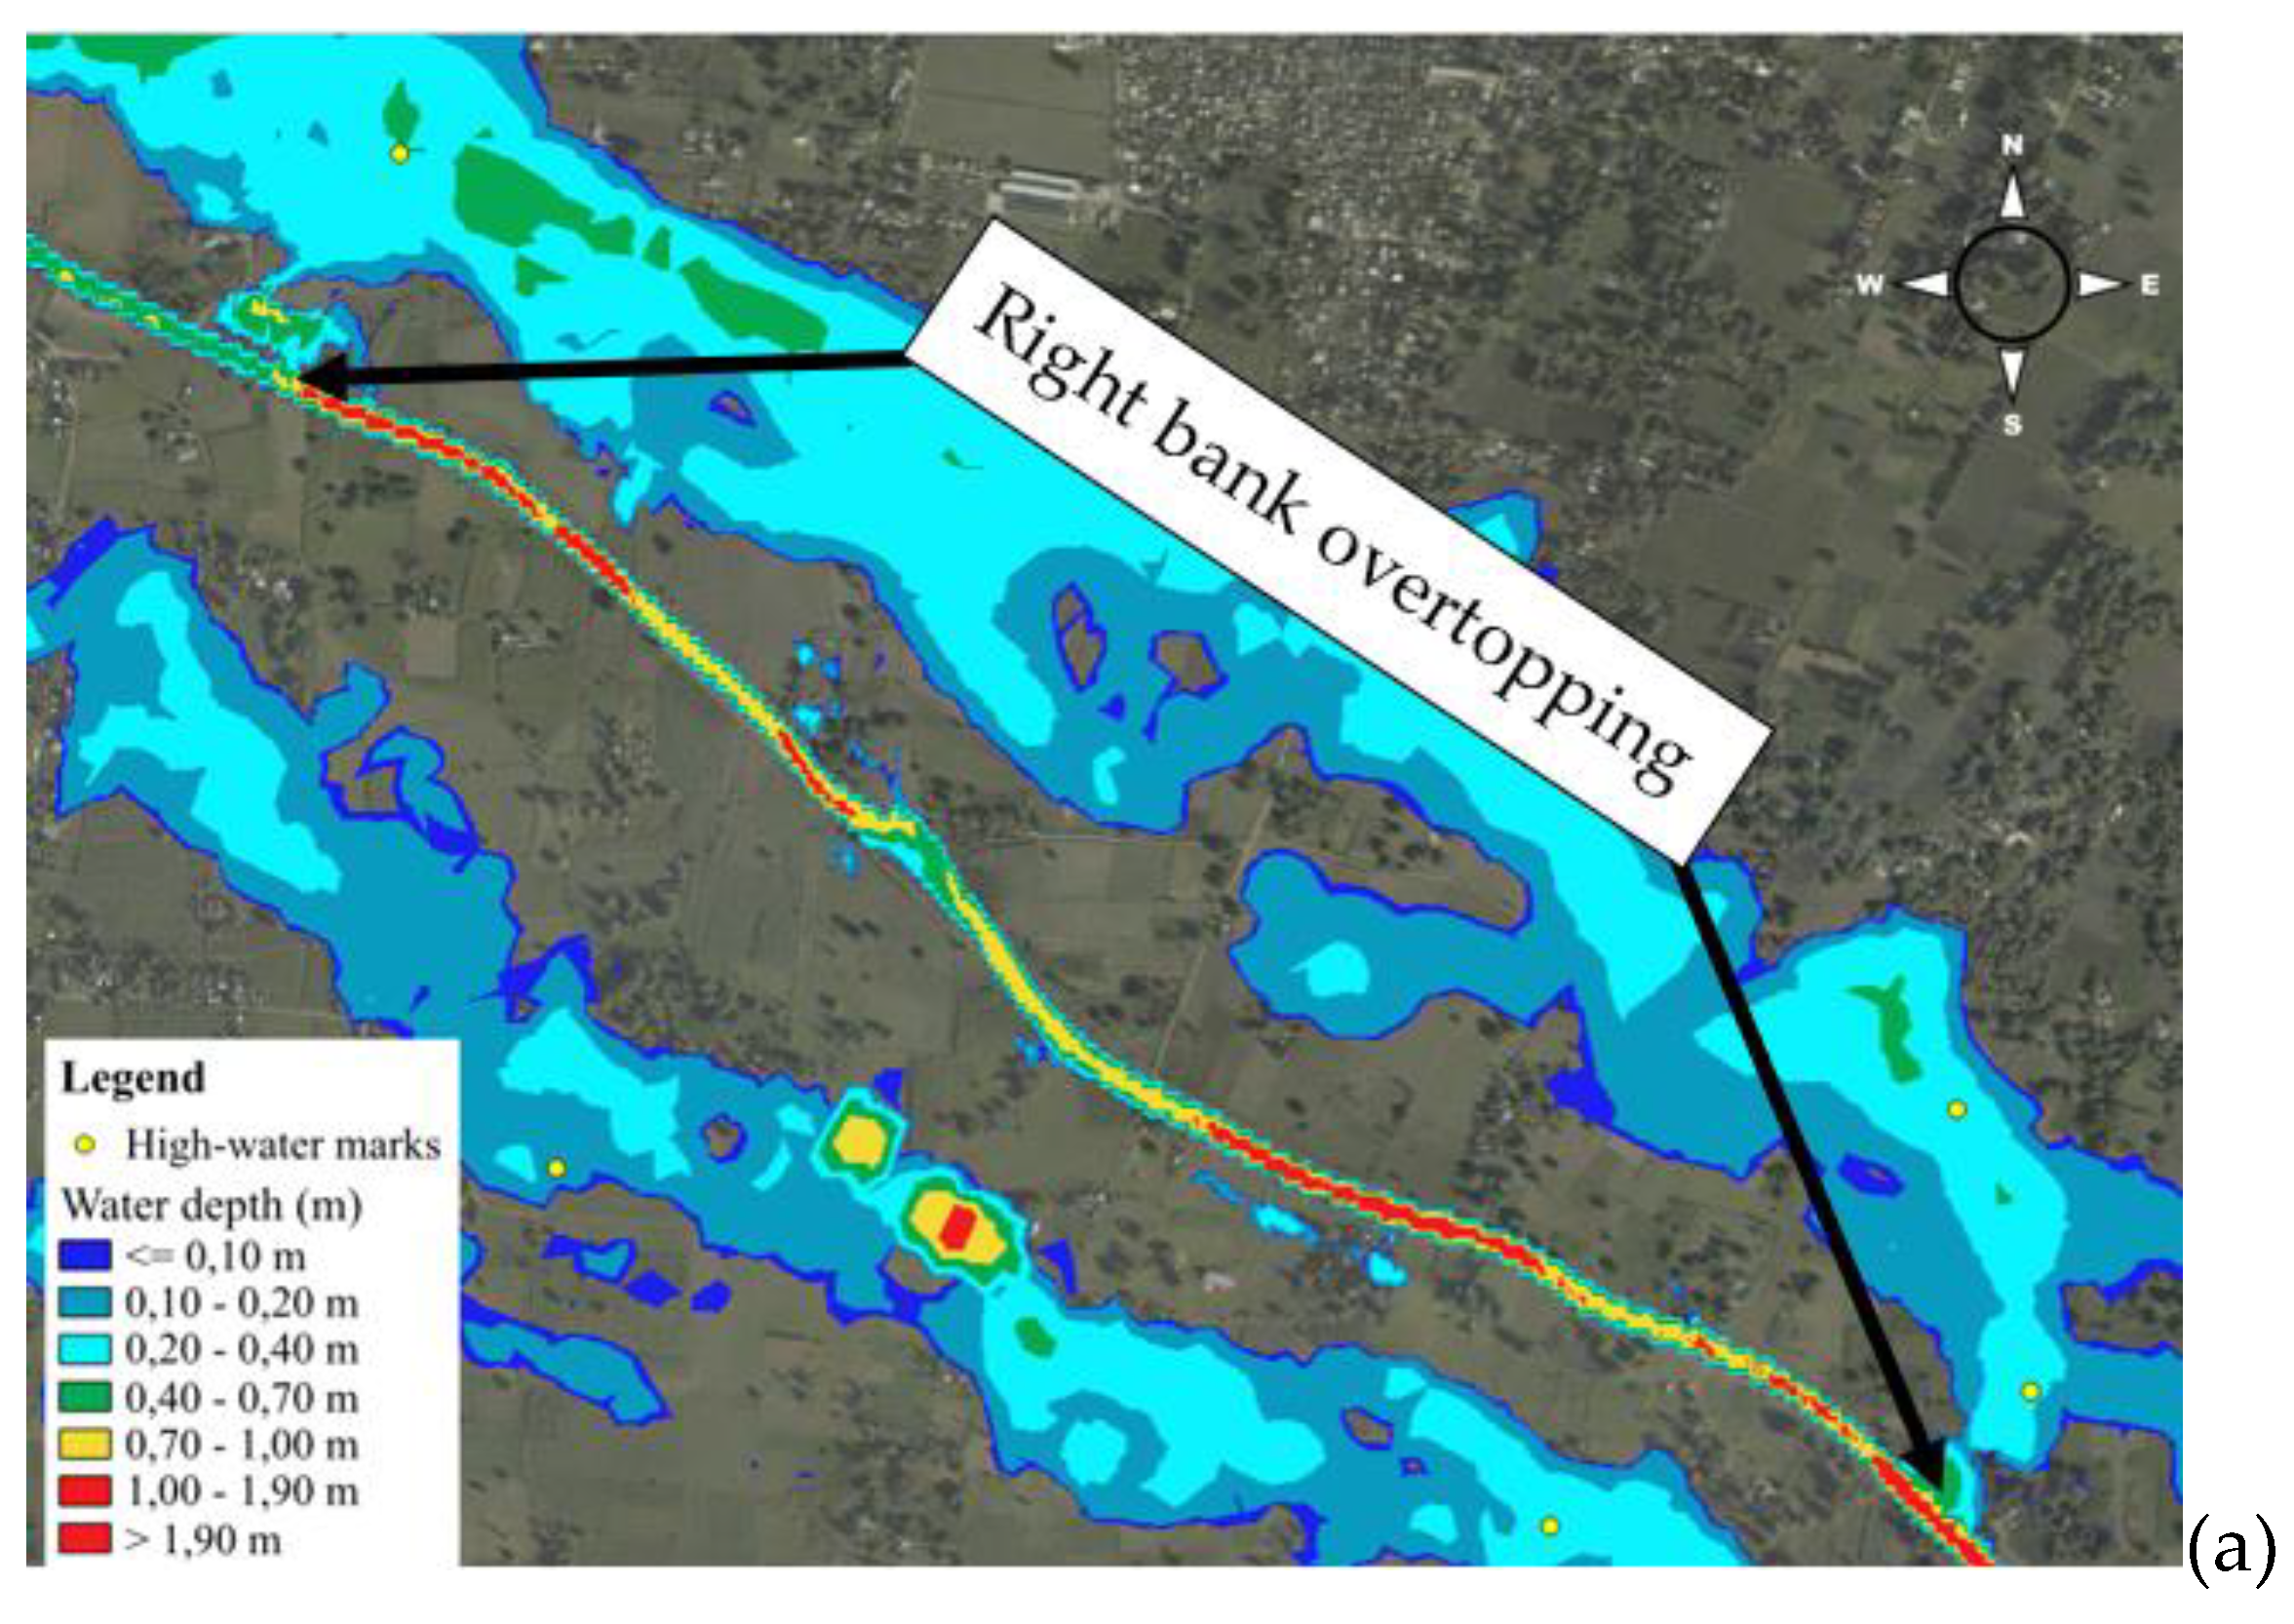
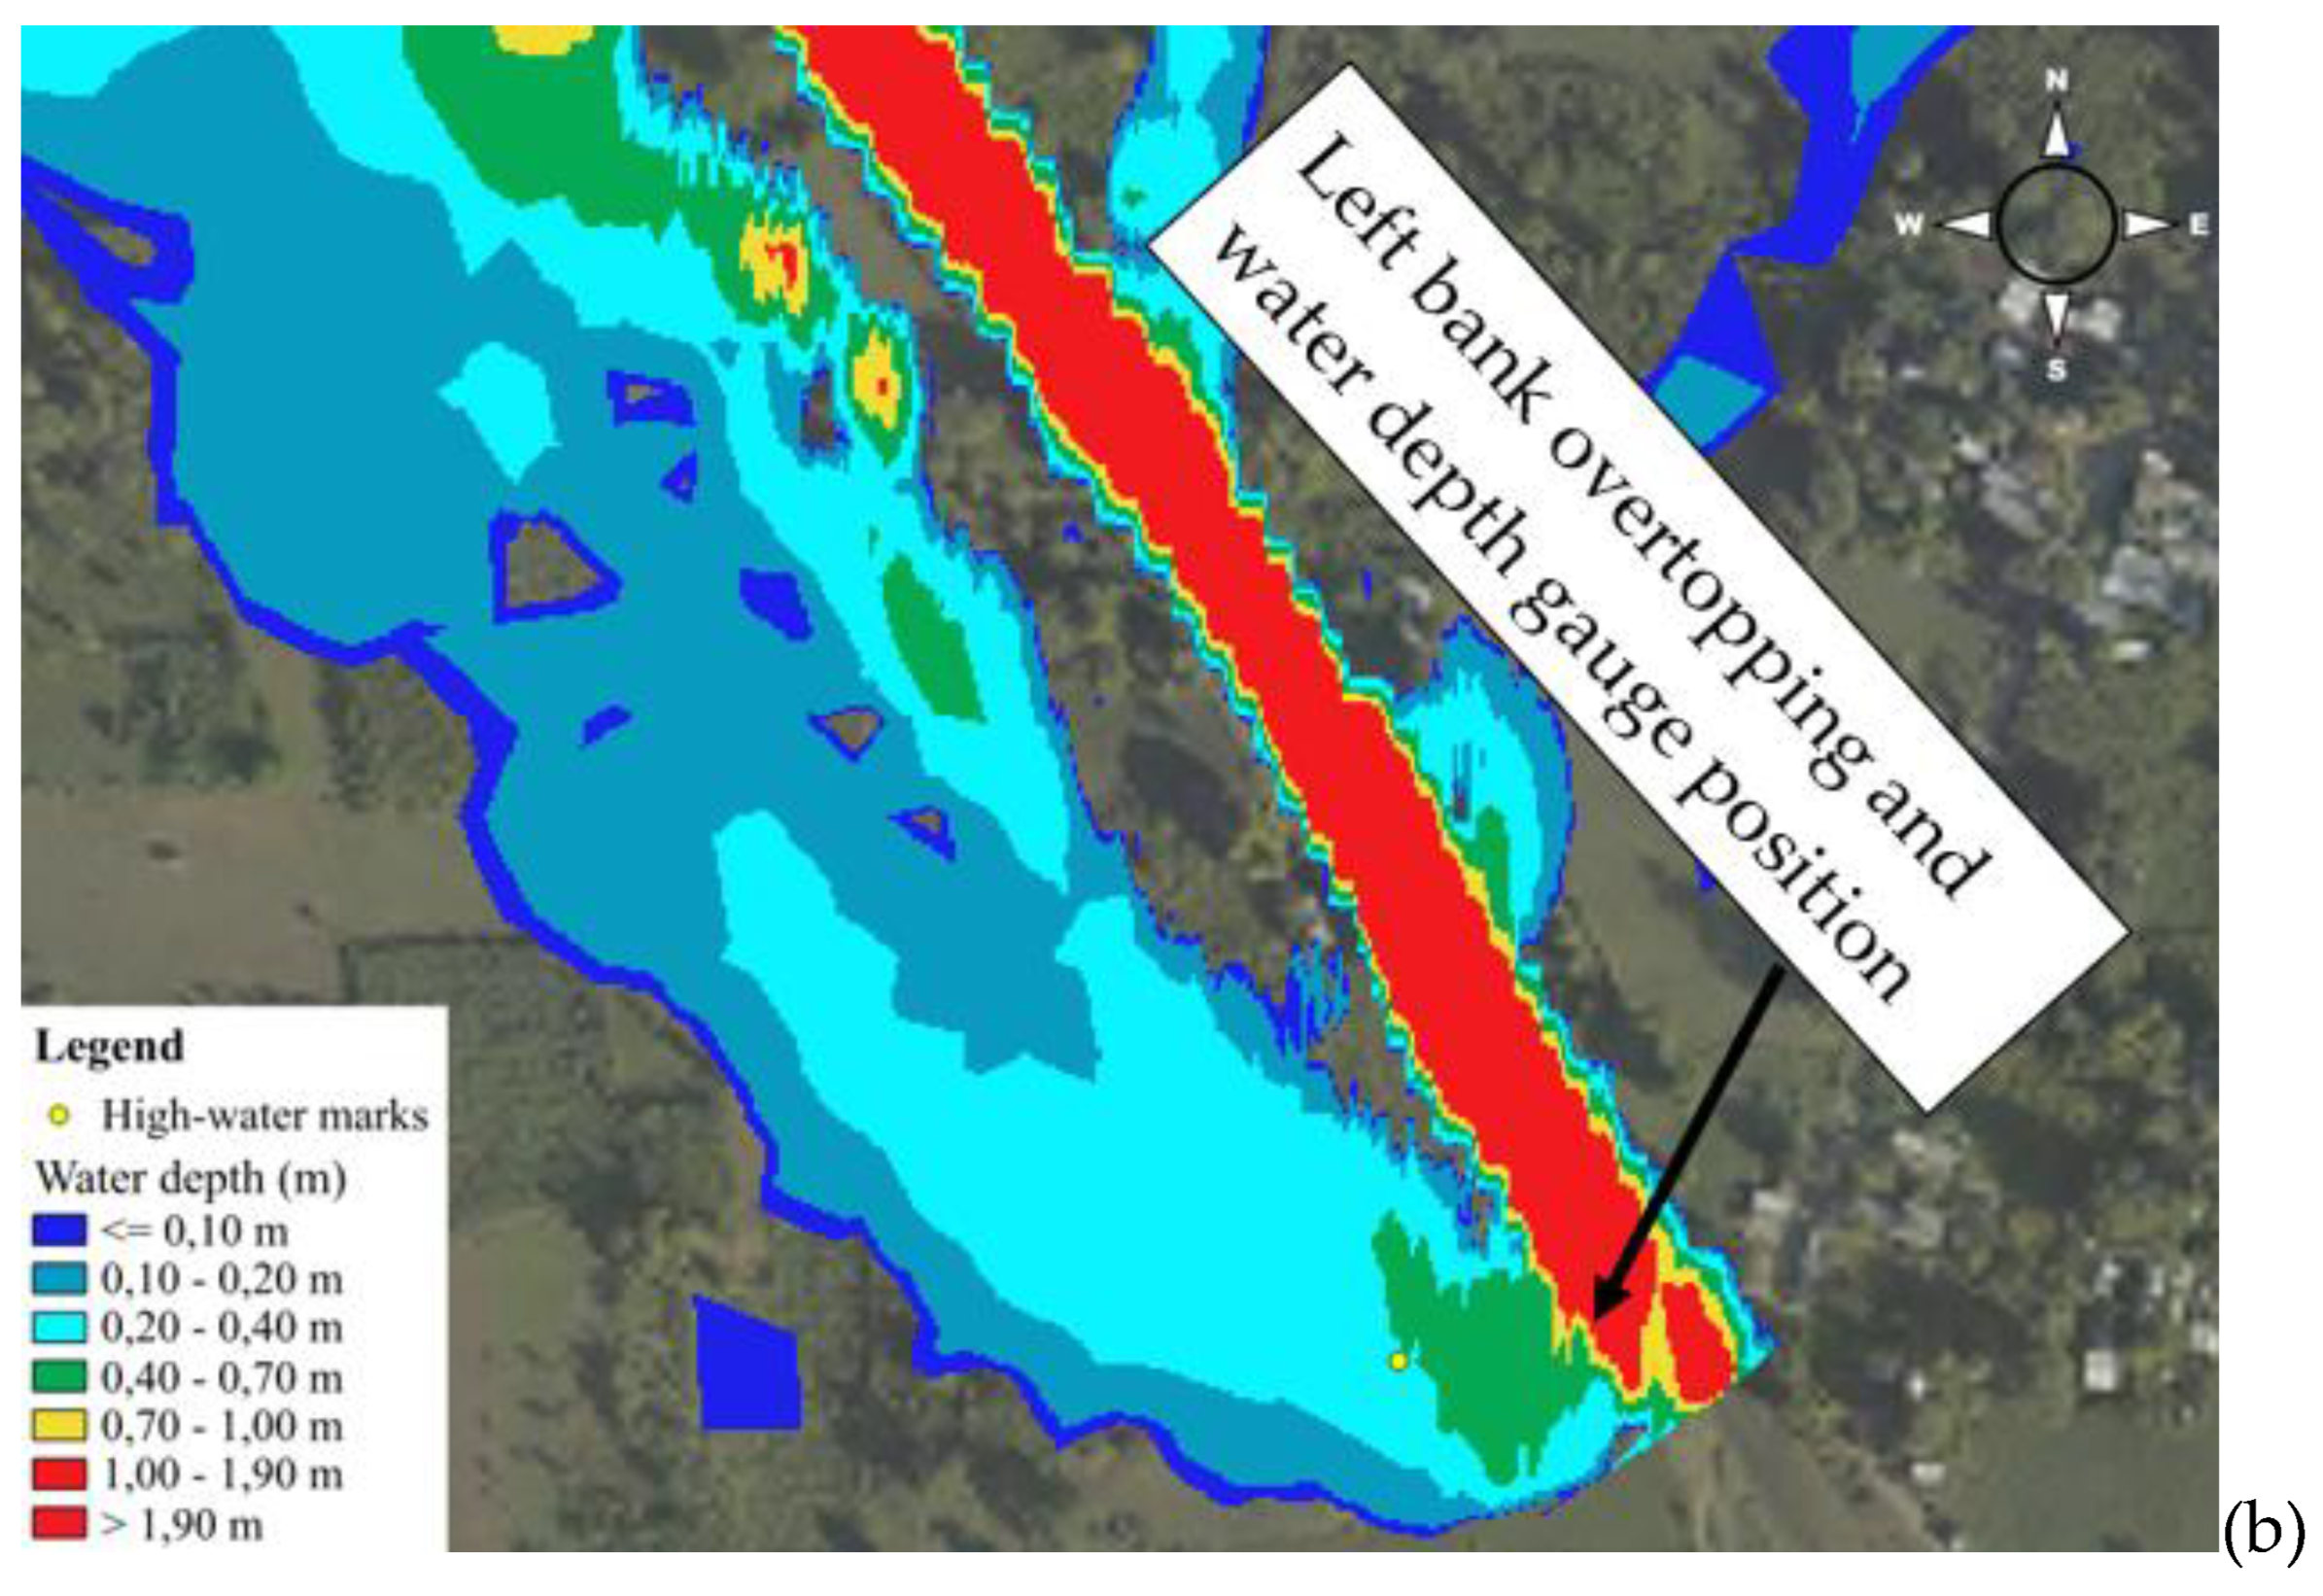

Table 1.
Data used in this study
| Data | Sources | Resolution | Explanations |
| Terrain data | DTM of CNIGS | 1.5 m | Official data based on LiDAR survey in 2014-2016 by IGN FI. |
| Drone Photogrammetry | 0.1 m | Data was constructed during this study to update the bathymetry of the Rouyonne River. | |
| Rainfall data | 3 rain gauges | 1 min | Calibration of the hydrological model (21-22 August, 2022), validation (September 20, 2022), application to the flood event (June 2-3, 2023). |
| Hydrometric data | OTT PLS pressure sensor | 1 min | Three sets of water level data for the same dates at the measuring station. |
| Magnetic induction current meter “MF Pro” | Maximum water depth sampled for construction of water depth-discharge relationship: 0.40 m. | ||
| Inundation data | Field measurement | 21 water level measurement points were collected (24 hours after the June 2-3, 2023, event) from high-water marks. |
Table 2.
Hydrological model assessment.
| Calibrated parameters | |||||
| S = 82.44 mm | V0 = 5.43 m/s | ds = 1 | = 0.02 | K0 = 0.73 | |
| Statistical scores: calibration | |||||
| KGE | 0.923 | ||||
| NSE | 0.878 | ||||
| Statistical scores: validation | |||||
| KGE | 0.906 | ||||
| NSE | 0.925 | ||||
Disclaimer/Publisher’s Note: The statements, opinions and data contained in all publications are solely those of the individual author(s) and contributor(s) and not of MDPI and/or the editor(s). MDPI and/or the editor(s) disclaim responsibility for any injury to people or property resulting from any ideas, methods, instructions or products referred to in the content. |
© 2024 by the authors. Licensee MDPI, Basel, Switzerland. This article is an open access article distributed under the terms and conditions of the Creative Commons Attribution (CC BY) license (http://creativecommons.org/licenses/by/4.0/).
Copyright: This open access article is published under a Creative Commons CC BY 4.0 license, which permit the free download, distribution, and reuse, provided that the author and preprint are cited in any reuse.


