
Submitted:
21 July 2024
Posted:
22 July 2024
You are already at the latest version
Abstract
Studying the multi-function bacterial implications on the natural phytochemicals could be among the best solutions for producing clean-label functional juices. This study aimed to develop a high-quality mulberry juice with enhanced antioxidant capacity through fermentation. The juice was fermented using mono- and co-cultures of Lactobacillus casei (LC), L. plantarum (LP), L. paracasei (LPC), L. acidophilus (LA), and L. helveticus (LH) at different time intervals (24, 48, 72, and 96 h). The total phenolic content (TPC), total flavonoid content (TFC), flavonols, anthocyanins, and proan-thocyanidins were determined, along with the antioxidant activity assays and FTIR analysis. The results revealed significant changes in molecular interactions and functional group presence post-fermentation, indicating microbial incorporation's effect on the juice's functional profile. These changes were attributed to the formation of new compounds during fermentation, such as organic acids, alcohols, glycerol, and phenols, as evidenced by the FTIR spectra. Besides, LC-LA and LC-LPC co-culture treatments yield the most substantial stability in TPC, TFC, and TF after 48 h compared to 24 h and 72 h. After 48 h, the co-cultures of LPC-LH (1265.5 GAE/L) and LPC-LA (1145 GAE/L) were increased the TPC after 48 h than the single cultures. Conclusively, LC-LPC and LP-LPC co-culture fermentation was recommended as a cost-effective method to enhance the an-tioxidant potential and the overall phytochemical capacity of mulberry products. The findings of this study provide valuable insights into the potential of fermented mulberry juice as a functional food with improved health benefits.

Keywords:
Fermentation
; mulberry juice
; antioxidant activity
; co-culture
; L. plantarum
; L. casei
; L. acidophilus
; L. paracasei
; L. helveticus
1. Introduction
Plants containing a plethora of biologically active polyphenolic moieties play a significant role in human health. Various studies have reported a nutraceutical effect of plant material as it reduces cancer, cardiovascular diseases (CVDs), aging and other worsening diseases related to the phenolic compounds and their antioxidant activity of in foods[1]. Mulberry is a fast-growing woody perennial plant from Moraceae family, and its major origin is China and India. The plants are widely distributed globally and have been cultivated in China for more than 5,000 years. Mulberry and Silk worm Committee of China has registered 29 mulberry varieties and 10 have been released by other agency in China [2]. Mulberry is regarded to be a nutraceutical food in China and is used in Chinese medicines for eyesight improvement, control CVDs, blood pressure maintenance, liver protection and as antifever [3]. In old herbal medicine of China, this fruit is used to treat different diseases like anemia, diabetes, arthritis and hypertension. Mulberries are rich in macro and micro-nutrients and possess strong antioxidant properties due to their high polyphenol, pectin, and flavonoid content [4]. Different nutritive compounds like amino acids minerals, vitamins, fatty acids and compounds like chlorogenic acid, rutin, qurecitin, anthocyanin and polysaccharides are present in mulberry fruit. Notably, mulberries contain significant amounts of iron, which is rare in most berries and essential for hemoglobin production and oxygen transport in the body [5]. Anthocyanins in mulberries contribute to their color and have neuroprotective, anti-inflammatory, antimicrobial, and antioxidant properties[5]. Fresh mulberries, rich in biologically active compounds and flavor, deteriorate quickly post-harvest, necessitating immediate processing to preserve their quality. Traditional processing methods like pasteurization and cooking can alter the physico-chemical and nutritional properties of the juice. Fermentation with probiotic microorganisms offers a promising alternative, enhancing the nutritional profile, extending shelf life, and improving sensory attributes [6,7]. Fermented fruit juices, which combine probiotic and nutritional benefits, are increasingly used to deliver live microorganisms [8]. However, incorporating probiotics into plant-based products poses challenges, making the selection of suitable food matrices and probiotic strains crucial [9,10]
Researchers are increasingly becoming more interested to understand the mechanism of biotransformation and metabolites functions in food products through Lactic Acid Bacteria (LAB) fermentation [11]. Different LAB strains show selectivity for various dietary matrices [12]. Using LAB for fermentation is a beneficial, low-cost, and sustainable method to improve the sensory and nutritional aspects of raw materials, while also extending the shelf-life of fruits and vegetables under sanitary conditions[13]. Probiotic bacteria offer a viable solution to meet consumer demands, enhance shelf-life, and maintain or improve the sensory and nutritional qualities of raw fruits. LAB co-cultures specifically improve the texture, structure, rheology, and thermal profile of products such as corn dough [11,14].
Lactic acid fermentation is one of the ancient means of food storage and is quite inexpensive in rural areas. Lactic acid fermentation enhances fragrance compounds, sensory qualities, nutritional components (primarily folate, riboflavin, cobalamin, and ascorbic acid), low-calorie polyols (mannitol and sorbitol), and decreases anti-nutritive chemicals [15]. In the indigenous vegetable Momordica charantia (bitter melon), lactic acid (LAB) fermentation enhanced flavonoids, total phenols and antioxidant activity [16]. Camu-camu (Myrciaria dubia) lactic acid-fermented indigenous fruit and soymilk revealed anti-diabetic and antioxidant effect by suppressing α-glucosidase and α-amylase activity [17] Fermentation of African nightshade (Solanum Scabrum) and (Solanum Americanum) with L. plantarum BFE 5092 and Lactobacillus fermentum BFE 6620 starter strains had a substantial influence on bacterial composition by lowering spoilage and harmful microorganism populations owing to pH decrease and lactic acid generation [18]. Probiotic characteristics may be found in LAB strains, and lactic-fermented foods are advantageous to human gastrointestinal health [18]. Furthermore, the acidification of foods by organic acids created by LAB stains and bacteriocins during fermentation might lengthen shelf-life and improve product safety [19]. It is generally understood that fermentation modifies the content of the food product and can drastically modify aromatic molecules and, as a result, sensory qualities [20].
Although there are findings on the influence of fermentation on the polyphenolic and antioxidant characteristics of plant-based foods, further research is required (Kwaw et al., 2018). Limited work has been done on the impact of lactic acid fermentation (single and co-culture) on the antioxidant properties of mulberry juice. Given the significance of lactic acid fermentation, particularly co-culture, and its capacity to improve the antioxidant profile and shelf-life of mulberry juice, biotechnological uses of lactic acid bacteria could be beneficial in enhancing its functionality and availability.
Co-cultures (LAB-LAB) have not been extensively studied, even though they appear to be superior to single cultures due to the collaborative action of the different metabolic pathways of the strains involved. We conducted a comparison of co-culture with monoculture to determine their effectiveness in enhancing the antioxidant profile of mulberry juice.
2. Materials and Methods
The Mulberry fruits were obtained from a farm in Zhenjiang, Jiangsu Province, China, in May 2023. The fully ripened fruits were manually picked, sorted, and washed with distilled water for further use. The fruits were stored at -18°C until processing. Crushing and juice extraction were carried out using a juicer (FW100; TAISITE, Co., Tianjin, China). The juice was sieved through a 0.180 mm sieve, and the retained fraction was used for further experiments. Lactobacillus casei (L. casei), Lactobacillus plantarum (L. plantarum), Lactobacillus paracasei (L. paracasei), Lactobacillus acidophilus (L. acidophilus), and Lactobacillus helveticus (L. helveticus) were purchased from DuPont China Holding Co. Ltd (Shanghai, China). These strains were propagated in Man Rogosa Sharpe (MRS) broth (Sinopharm Chemical Co., Shanghai, China) at 37°C and stored at 4°C. All chemicals used in the study were of analytical grade and were purchased from Sigma-Aldrich (Burlington, Massachusetts, USA).
2.1. Fermentation Conditions
Isolated L. casei (LC), L. plantarum (LP), L. paracasei (LPC), L. acidophilus (LA), and L. helveticus (LH) were grown in liquid MRS medium and incubated (HZQ-F160; Shanghai, China) to a bacterial concentration of 107–108 cfu/mL. A 2% bacterial culture was added to the mulberry juice, which was then incubated at 37°C for 1-4 days, with the incubator set to 60 rpm, as shown in Table 1. Lactic Acid Bacteria (2%) (L. casei, L. plantarum, L. paracasei, L. helveticus, L. acidophilus) were used individually (2%) and in combination as co-cultures (1% each) for the fermentation of mulberry juice. These were compared with a control sample (without bacteria). Figure 1 presents the study overall flowchart.
2.2. Total phenolic Contents (TPCs)
The phenolic content of mulberry juice was determined following the procedure of [1]with modifications. Briefly, 1 mL of Folin–Ciocalteu (FC) reagent, 3 mL of sodium carbonate (20% w/v), 12 mL of H₂O, and 200 μL of the sample were mixed and placed in a water bath at 70°C for 10 min. Finally, a SpectraMax i3 spectrophotometer (Molecular Devices, Silicon Valley, CA, United States) was used to measure the absorbance at 765 nm. Gallic acid was used as a standard, and the results were expressed in mg of Gallic acid equivalents per mL of sample.
2.3. Total flavonoid Contents (TFCs)
The total flavonoid contents (TFCs) of fermented mulberry juice were evaluated as per the method of [21] with modifications. Briefly, 25 μL of the sample, 0.1 mL of H₂O, and 10 μL of NaNO₂ (5%) were mixed and allowed to rest for 5 min. Then, 15 μL of AlCl₃ (10%), 50 μL of NaOH, and 50 μL of H₂O were added. The absorbance was measured at 510 nm using a SpectraMax i3 spectrophotometer. The TFCs were calculated using quercetin as the standard, and the results were expressed in mg of rutin equivalents per mL of sample.
2.4. Total flavonols Contents (TFlavCs)
The TFlavCs of fermented mulberry juice were ascertained using the procedure described by [22] with some modifications. Briefly, 2 mL of AlCl₃, 3 mL of CH₃COONa, and 2 mL of the sample were mixed and stored at 20°C for 150 min. The absorbance was then measured at 440 nm using a SpectraMax i3 spectrophotometer. The TFlavCs were calculated using quercetin as the standard, and the results were expressed in mg of quercetin equivalents per mL of sample.
2.5. Total Anthocyanin Contents (TACs)
The TACs of fermented mulberry juice were determined by the method of [23]through pH differential method with modifications. Briefly, two buffer solutions KCl (0.025mol/l) and Sodium acetate (0.4mol/l) were prepared with pH 1 and pH 4.5, respectively. 200μl was added in two sets of tubes followed by 1.8mL of KCl buffer in one tube while 1.8 mL of sodium acetate buffer in other tube. The tubes were vortex, and the absorbance of each tube was measured at 700nm and 520 nm by using spectrophotometer (SpectraMax i3). The results were addressed as mg of cyanidin 3-glucoside equivalent/mL of sample. The calculation can be done through the following formula:
where K1= Absorbance at 520 nm, pH1,
K2= pH1, Absorbance at 700 nm, C3= pH4.5, Absorbance at 520 nm, C4= pH4.5, Absorbance at 700 nm, MW= Molecular weight of cyanidin 3glucoside, DF= Dilution factor, Ɛ= molar extinction, L= path length.
2.6. Proanthocyanidins Contents Determination (PACCs)
The proanthocyanidin contents (PACCs) of fermented mulberry juice were determined using the method of [24], with modifications. Briefly, 1 mL of the sample, 3 mL of HCl, and 6 mL of vanillin were mixed and stored at 25°C for 15 min. The absorbance was then measured at 500 nm using a SpectraMax i3 spectrophotometer. The PACCs were calculated using catechin as the standard, and the results were expressed in mg of catechin equivalents per mL of sample.
2.7. Reducing Power Ability (Rp-A)
The reducing power assay (Rp-A) of fermented mulberry juice was determined using the method of [25], with modifications. Briefly, 1 mL of the sample, 50 μL of HCl, 400 μL of potassium ferricyanide (C₆N₆FeK₃), 400 μL of FeCl₃, and 700 μL of H₂O were mixed and incubated in the dark at 37°C for 30 min. The absorbance was then measured at 720 nm using a SpectraMax i3 spectrophotometer. The results were expressed in mM of ascorbic acid equivalents.
2.8. Copper Reducing Power Ability (Cu-Rp)
The cupric reducing power (Cu-RP) of fermented mulberry juice was determined using the method of[24] ,[26] with modifications. Briefly, 250 μL of CuCl₂ (0.01 M), 250 μL of neocuproine (7.5 mM), 250 μL of ammonium acetate (1 M), and various concentrations of the sample were mixed. The solution was allowed to rest at room temperature for 30 min, and the absorbance was measured at 450 nm using a spectrophotometer.
2.9. Determination of DPPH Scavenging Activity
The 2,2-diphenyl-1-picrylhydrazyl (DPPH) radical scavenging activity of the fermented mulberry juice was determined using the method described by [27], with modifications. First, DPPH (0.1 mM) was prepared in methanol. Then, 120 μL of the sample was mixed with 4.2 mL of the DPPH solution. The mixture was allowed to rest for 30 min at 25°C, and the absorbance was measured at 517 nm using a spectrophotometer. The fermented juice without DPPH solution was used as a control. The scavenging activity was calculated using the following formula:
2.10. Determination of Ferric Reducing Antioxidant Power (FRAP)
The ferric reducing antioxidant power (FRAP) of the fermented mulberry juice was evaluated using the method described by Benzie and Strain, 1996,[28] with modifications. Briefly, the FRAP solution was prepared by mixing 25 mL of acetate buffer (0.3 M, pH 3.6), 2.5 mL of TPTZ (10 mM in 40 mM HCl), and 2.5 mL of FeCl₃·6H₂O (20 mM). Then, 0.3 mL of the FRAP solution was mixed with 1 mL of the sample and 0.3 mL of H₂O. The mixture was incubated at 37°C in a water bath for 30 min, and the absorbance was measured at 595 nm using a spectrophotometer. The results were expressed in mg of trolox equivalents per mL of sample.
2.11. Attenuated total Reflectance-Fourier Transforms Infrared (ATR-FTIR) Spectroscopy
The FTIR spectra of all samples were obtained using an ATR-FTIR spectrometer (Thermo Scientific, Nicolet iS50, Waltham, Massachusetts, USA) equipped with an attenuated total reflectance (ATR) accessory. The spectra were recorded in the range of 4000 to 700 cm⁻¹.
2.12. Statistical Analysis
The results obtained for each parameter were statistically analyzed using the OriginPro 8.5 software package and presented as mean ± standard deviation. Analysis of variance (ANOVA) and a Completely Randomized Design (CRD) were employed to determine the level of significance at 95% confidence. All analyses were performed in triplicate.
2.13. Molecular docking Analysis
The molecular docking technique was conducted via the educational version of MOE software, 2015, USA. The molecular interactions were performed between the structure of bacterial peptidoglycan (PDB ID: 2MTZ) as macromolecule receptor and cyanidin 3 rutinoside (C3R; PubChem CID: 4481459) as ligand which were retrieved protein data bank (https://www.rcsb.org/) and PubChem Database (https://pubchem.ncbi.nlm.nih.gov/). Both structures were then optimized by combining fractional charges, and energy was minimized using Protonate-3D and MMFF94X force fields, and H2O was removed, structure refining, energy minimization, and 3D protonation via MOE. The process was repeated for the composites, and thereafter 4-5 appropriate docked postures were created which were visualized and analyzed then for their hydrophobicity, electrostatics potential, H-bonds, and heat-map structure fluctuations via heatmapper (http://heatmapper.ca/expression/). Molecular dynamic simulation (MDs) runs were kept every 10 ns for a total of 50 ns, and the root mean square deviation (RMSD) was then expressed. Peptidoglycan-C3R geometry was first optimized via M062X operate with the 6-31G (d, p) aiding by Gauss 09 package. Alcalase was randomly located around peptidoglycan, double-minimized, and performed using GROMACS, ver., 5.1.4, GNU, Netherlands [29].
3. Results
3.1. Total Phenolic Content
The present study found a significant increase in total phenolic levels under different fermentation treatments, as shown in Figure 2a. Among the various treatments, LC-LPC (1115.3±27.01 mg GAE/L) and LP-LPC (1145.3±27.01 mg GAE/L) fermentation improved total phenolic content up to 48 h, showing a significant difference when compared to unfermented samples. When compared to other treatments, 24-hour fermentation produced higher total phenolics under LC-LPC (873.21±19.35 mg GAE/L) and LP-LPC (714.23±23.07 mg GAE/L). Overall, the effect of fermentation was noticeably improved after 24 and 48 h. Co-cultures of LPC-LH (1265.5±19.35 mg GAE/L), LC-LP (1142.4±27.04 mg GAE/L), LPC-LA (1145±30.76 mg GAE/L), LP-LH (1139.9±19.35 mg GAE/L), and LP-LA (1129.6±23.07 mg GAE/L) produced more total phenolics after 48 h compared to single cultures. Among all fermentation treatments, the LC-LPC co-treatment was the most effective in increasing total phenolic contents compared to the other groups.
3.2. Total Flavonoid Content
The effect of different fermentation treatments on total flavonoid content was significant, as shown in Figure 2b. Among all fermentation treatments, the following co-treatments performed the best: LP-LA (3278.8±39.02 mg RE/L), LC-LPC (1982.5±16.97 mg RE/L), LP-LPC (1675.1±44.44 mg RE/L), LA-LH (1545.5±16.97 mg RE/L), LPC-LA (1538.1±27.96 mg RE/L), and LC (1489.9±72.29 mg RE/L). After 48 h of treatment, these co-treatments yielded the highest concentration of total flavonoids. In co-cultures, 48 h of fermentation resulted in the highest total flavonoid concentration. All other fermentation treatments produced more total flavonoids than unfermented samples after 48 h.
3.3. Total Flavonols
The effect of different fermentation treatments on flavonol content was outstanding, as shown in Figure 2c. Among all fermentation treatments, the co-culture treatments proved to be the most effective. The LC-LPC treatment resulted in flavonol contents of 1517.7±30.55 mg QE/L after 24 h and 1424.4±20 mg QE/L after 48 h. The LP-LPC treatment produced 1371.1±41.63 mg QE/L after 24 h and 1231.1±30.55 mg QE/L after 48 h. The LP-LH treatment yielded 1094.4±10 mg QE/L after 24 h and 1197.7±30.45 mg QE/L after 48 h. The LPC-LH treatment resulted in flavonol contents of 951.07±50.33 mg QE/L after 24 h and 1071.1±50.33 mg QE/L after 48 h. Lastly, the LPC-LA treatment produced 785.73±18.03 mg QE/L after 24 h and 1004.4±20 mg QE/L after 48 h. These results indicate that the LC-LPC co-culture treatment was the most effective in producing the highest concentrations of flavonols, followed closely by LP-LPC and LP-LH treatments, which also significantly increased flavonol production after both 24 and 48-hour intervals.
3.4. Anthocyanins Content
Fermentation showed improved production of anthocyanins after 24 h of treatment, particularly under LC-LPC (32.888±0.011 mg/L) and LP-LPC (28.308±0.019 mg/L) co-culture treatments, as compared to other treatments (Figure 2d). Additionally, the LPC-LH (25.743±0.01 mg/L), LC-LP (25.295±0.02 mg/L), LC (24.948±0.01 mg/L), and LP (24.623±0.012 mg/L) treatments also increased anthocyanin production after 24 h. However, extending the fermentation to 48, 72, and 96 h did not show any significant increase in anthocyanin production.
3.5. Proanthocyanidins
Proanthocyanidins production has been improved significantly under the various co-culture treatments after 24 h and 48 h compared to the 94 h of fermentation period (Figure 3). Specifically, the LC-LPC treatment resulted in 962.17±25.16 mg/L after 24 h and 1055.5±27.83 mg/L after 48 h. The LP-LPC treatment yielded 1075.5±26.45 mg/L after 24 h and 1298.8±32.14 mg/L after 48 h. The LC-LP treatment produced 923.83±16.07 mg/L after 24 h and 1038.8±20.20 mg/L after 48 h. The LC-LA treatment resulted in 692.17±40.41 mg/L after 24 h and 895.50±31.22 mg/L after 48 h (Figure 3). The improvement in proanthocyanidins production was more pronounced after 48 h compared to the 24-hour treatment.
3.6. Antioxidant Activity
The effects of LC-LPC (3.4667±0.011) and LP-LPC (3.3800±0.03) co-culture treatments on reducing power have been observed to be remarkable, as shown in Figure 3b. Additionally, the LP-LA (3.3633±0.035), LPC-LA (3.3367±0.035), LA-LH (3.2633±0.015), LC-LP (3.2467±0.035), and LPC-LH (3.12±0.03) treatments also demonstrated significant reducing power ability. Both co-culture and mono-culture treatments increased reducing power after 24 h. However, extending the fermentation to 48, 72, and 96 h did not show any significant impact on reducing power.
In the present study, the co-culture treatments LC-LPC (32.858±0.498 mM Trolox equivalents), LP-LPC (32.027±0.38 mM Trolox equivalents), LC-LP (31.195±0.627 mM Trolox equivalents), and LPC-LH (30.613±0.498 mM Trolox equivalents) demonstrated a significant increase in ferric reducing antioxidant power (FRAP) after 24 h of fermentation treatment (Figure 3b). Overall, other single and co-culture treatments also showed an increase in FRAP after 24 h of fermentation. However, a decrease in FRAP was observed in samples treated for 48, 72, and 96 h.
In the present study, the co-culture treatments LC-LPC (5612.8±254.58 μM Trolox equivalents and 5096.1±642.54 μM Trolox equivalents) and LP-LPC (5096.1±642.54 μM Trolox equivalents) showed a significant increase in CuCl₂ reducing power after 24 h of fermentation treatment (Figure 3b). Overall, there was a notable improvement in CuCl₂ reducing power in comparison to the unfermented samples.
The fermentation treatments used in this study had a significant impact on DPPH radical scavenging activity (Figure 3b). Various treatments showed notable increases in DPPH activity after 24 h of fermentation. Specifically, the LC treatment resulted in 0.6511±0.017, LC-LH in 0.629±0.009, LC-LPC in 0.5532±0.014, LP-LPC in 0.5305±0.011, LPC in 0.5204±0.010, LP in 0.4933±0.080, LA in 0.4925±0.013, LPC-LH in 0.4702±0.009, LP-LA in 0.4694±0.009, LP-LH in 0.4605±0.010, and LPC-LA in 0.4493±0.009. All these treatments significantly increased DPPH activity, demonstrating their potential in enhancing the antioxidant properties of the fermented mulberry juice after 24 h of treatment.
3.7. Structural Integrity Through ATR-FTIR
FTIR spectroscopy is one of the best techniques for understanding molecular interactions, identifying functional groups, confirming different molecules, and observing changes due to fermentation in samples. The FTIR spectra (4000–700 cm−1) of the fermented samples were analyzed (Figures 4,5,6). Where, several differences occurred in the band position and intensity after incorporating the bacteria. The mulberry juice displays distinctive peaks at 3278, 2921, 1339, 1240, and 1027 cm⁻¹. The changes in the LC group were not significant (Figure 4a) compared to the highly significant shift in 2919 cm-1 after the treatment with LP (Figure 4b), LPC (Figure 4c), LA (Figure 4d), and LH (Figure 4e) monocultures.
In addition, for the co-cultures, as presented in Figure 5 and Figure 6, the broad peak at 3278 cm⁻¹ indicates strong stretching vibrations of OH functional groups, which is characteristic of water, as fresh juice contains a significant amount of water in the treated juice with LC-LP (Figure 5a), LP-LPC (Figure 5b), LC-LH (Figure 5c), and LP-LPC (Figure 5e) compared with the changes in the LC-LH (Figure 5d). The peak at 2921 cm⁻¹ displays the presence of C-H and OH bending/stretching, which comprises aromatic alcohols and alkanes, while 1339 cm⁻¹ indicates moderate OH ability of phenols and alcohols [30]. The strong peaks at 1241 cm⁻¹ and 1027 cm⁻¹ showed the presence of C-O and C-N stretching, indicating the presence of amines and ethers [31].
While, the presence of weak shoulders at 1404-1230 cm⁻¹ in LP-LA (Figure 6a), LP-LH (Figure 6b), LPC-LA (Figure 6c), LPC-LH (Figure 6d), and LA-LPC (Figure 6e) could be attributed to strong C-H and OH bending, which is related to the anomeric configuration of secondary protein structure and is more prominent in co-culture fermented mulberry juice. The presence of organic acid confirmed at 1711 cm⁻¹ represents the C=O bond of carboxylic acid and is regarded as a novel peak due to bacterial inoculation, potentially indicating the stretching vibrations of alkene groups, carboxylic acid, and carbonyl groups.
Consequently, the absorbance at 1408 cm⁻¹ was attributed to formed linkages between the microbial proteins and the juice’s phenolics. The strong shoulder at 3270 cm⁻¹ indicates O-H stretching due to alcohols and carboxylic acids and indicates the reduction of water and its conversion into other compounds. The change of the peak from 3278 to 3270 cm⁻¹ after bacterial fermentation represents the interaction to generate intermolecular hydrogen bonding. The peaks at 2920 cm⁻¹ represent gallic acid, while the change of wavelength from 1339 to 1408 cm⁻¹ indicates an increase in alcohols and phenols, referencing the presence of OH functional groups. The peak at 1150 cm⁻¹ represents saccharides in the sample, and the peak at 1594 cm⁻¹ indicates the amine group, specifically N-H bending. There were some peaks shown at the beginning, mostly at 866 and 817 cm⁻¹, because of bacterial action during fermentation, showing the vibration of CH₂. Absorbances mainly related to C-O bond stretching are related to the fingerprint region.
3.8. Molecular docking Stimulation
Figure 7 presents a detailed visualization of the peptidoglycan-C3R interaction including a variety of analyses to clarify the molecular dynamics and binding affinities associated with this interaction and highlighting their binding sites. Peptidoglycans interact with C3R via different forces, indicating a strong binding potential that enables the formation of peptidoglycan-C3R conjugates. The analysis of binding affinity is essential, as it offers valuable insights into the strength and stability of the protein-protein interaction. The binding score of -1.02 and an energy affinity of -1.83 kcal/mol suggest a stable interaction, indicating a moderate binding strength that may impact the functional properties of the conjugates. There are notable differences in the binding interactions when comparing the heat map of peptidoglycan alone to the peptidoglycan-C3R conjugates. The modified patterns in the heat map indicate that C3R was well interacted with peptidoglycan, where this interaction might be responsible for maintaining the stability of C3R and other polyphenols (agreeing well with our experimental results). The analysis conducted by the MDs provides additional support, as it demonstrates the RMSD over time. The RMSD plot provides insights into the structural stability and conformational fluctuations of the peptidoglycan-C3R conjugates throughout the MD simulations. The consistent RMSD values indicate that the conjugates retain their structural integrity over time. Elaborate diagrams highlight precise interactions within peptidoglycan-C3R conjugates. H-bonding is essential for maintaining the stability of protein structures.
The diagram illustrates the amino acids that play a crucial role in these interactions, demonstrating the impact of protein binding on their overall conformation and stability. For example, Lys140 and Arg144 of peptidoglycan directly interacted with the anthocyanin structure. Hydrophobic interactions play a crucial role in maintaining the structural integrity of proteins. The visualization demonstrates the alterations in hydrophobic regions, indicating the impact of the conjugation with C3R on the hydrophobic core of peptidoglycan. Electrostatic interactions play a crucial role in determining the strength and selectivity of protein-protein interactions, where other 8 amino acids of peptidoglycan interacted with C3R. The visualization of electrostatic potentials demonstrates the changes in charge distribution that occur during binding, impacting the strength of binding and functional properties of the conjugates [32].
3.9. Multivariate Analysis and Correlations
The principal component analysis (PCA) among all studied groups is presented in Figure 8a, and the differences among groups were evaluated according to the contribution rate of PC factors [33]. According to the loadings the TPCs and TFL showed the highest significant (p < 0.05) patterns on the different group variances compared to the control. This outcome can be attributed to the significant effect of the co-cultures in changing the phytochemical distribution in the mulberry media.
The Pearson's correlation coefficients matrix of the fundamental physicochemical, bioactive components, and antioxidant activities of mulberry juice fermented for 24 h revealed that TPC was highly significantly positively correlated with TFC**, TAC**, RP-A**, CU-A**, FRAP**, and DPPH** (p < 0.01) (Figure 8b). Additionally, it was negatively correlated with PACs. TFC was highly significantly positively correlated with TAC**, RP-A**, FRAP**, and DPPH** (p < 0.01) and negatively correlated with CU-A. Both TPC and TFC play key roles in antioxidant activity. TFLAV is highly significantly positively correlated with PACs**, TAC*, RP-A** (p < 0.01) and negatively correlated with CU-A and DPPH. PACs are highly positively correlated with TAC** (p < 0.01) and negatively correlated with CU-A and DPPH. TAC is highly significantly positively correlated with RP-A** and FRAP** (p < 0.01) and negatively correlated with CU-A. RP-A is highly significantly positively correlated with FRAP** and DPPH** (p < 0.01). FRAP is highly significantly positively correlated with DPPH** (p < 0.01).
4. Discussion
Numerous scientific investigations have been conducted to date with the goal of developing and producing new types of fermented foods with probiotic and functional qualities [34]. Fermentation is a complex system comprising several distinct processes, each with its own continuity, linkage, and interaction. During fermentation, individual component breakdown, structural changes, and the creation of new compounds occur. Various parameters, such as microbial strains, substrate composition, and fermentation conditions, influence the nature and degree of these changes.
The different profiles of enzymes released by bacteria during fermentation can significantly impact the amount and composition of phenolic compounds. Microbial enzymes can liberate phenolics from their bound forms, increasing the concentration of free phenolics [35,36]. This enzymatic activity enhances the nutritional and functional qualities of the fermented product, making it richer in bioactive compounds with potential health benefits.
Lactobacillaceae are the chief organisms during fermentation in most foods; however, the pathways for changes in different compounds like polyphenolics by lactobacilli have only been characterized in the last two decade [37]. In the current study, LAB significantly boosted phytochemicals such as TPC, TFC, flavonols, anthocyanins, and proanthocyanins, with the greatest production reported under LC-LPC and LP-LPC co-treatments. Numerous studies align with these findings, indicating that LAB co-cultures not only enhance fermentation ability without compromising product quality but also increase the production of bioactive peptides [38]. For instance, Kwaw et al., 2018 reported that lactic acid fermentation significantly impacts the beverage's total phenolic, anthocyanin, and flavonoid content. Previous research has suggested that fermentation using a complex of strains is superior to single-strain [39]. Mixed cultures have been shown to promote the growth of Lactobacillus plantarum, which is directly linked to the production of nutrients such as vitamins. For example, mixed cultures of L. plantarum AF1, L. plantarum LP3, and L. plantarum were used to ferment bergamot juice, resulting in the highest radical scavenging and DPPH activity [40]. Fermentation increased the reducing power of soluble phenolics and antioxidant activity, demonstrating the beneficial effects of fermentation.
In the current study, co-cultures significantly improved the phytocompounds and antioxidant activity of the juice. [41]proposed that fermentation by L. plantarum was an effective procedure for increasing the concentration of phenolic components in fermented cowpea (Vigna sinensis) flour. LAB can transform polyphenolic chemicals into smaller molecules with greater bioavailability and release conjugated phenolic compounds from cell walls [42]. Fermentation hydrolyzes macromolecules into their building blocks, liberating attached phenolics due to microbial influence [43]. Another study on soy seeds suggested that microbial fermentation increases phenolic content by 120-135%, possibly due to detoxification, degradation, or lignin remobilization. Bacterial fermentation of soy whey by L. plantarum mobilizes phenolics and flavonoids, resulting in higher total phenolic contents [44].
Another study in line with the current research found that LABs affect the phenolic profile of the juice (Kwaw et al., 2018). Increased antioxidant activity of fermented juice under LAB co-culture has been observed. Different antioxidant components may operate through various mechanisms against oxidative agents, requiring multiple antioxidant capacity tests to comprehensively assess the antioxidant capability of fermented mulberry juice. Assays such as FRAP and DPPH showed high activity under LC-LPC and LP-LPC co-cultures. The rise in free form phenolic compounds and the formation of other byproducts during LAB fermentation may be responsible for the increase in antioxidant capacity [45]. Zhou et al., 2020 indicated that phenolic and flavonoid content was responsible for enhancing DPPH and FRAP scavenging capabilities. L. plantarum altered the phenolic profile [46].
The current study demonstrates that co-cultures of LC-LPC and LP-LPC act as free radical inhibitors or scavengers, potentially functioning as major antioxidants. It was found that a larger synthesis of phenolic chemicals correlates with stronger antioxidant activity. Natural antioxidants' activity in terminating free radical processes has been documented [47]. According to Yao et al., 2010, fermented legume products containing Bacillus sp. showed greater FRAP activity during fermentation [48]. Vadivel et al., (2011) reported that antioxidant capacity might be connected to phenolic concentration, suggesting that juice extracts with higher phenolic concentration may exhibit higher FRAP and DPPH activity [49].
Treatments with LC-LPC and LP-LPC co-cultures boosted reducing power. The reducing capacity of polyphenolic compounds was closely connected to their antioxidant activity [43,50]. Lee et al., 2008 found that the hydrogen-donating capacity of the reductones present was strongly linked to reducing power. The fermentation process may have produced reductants that interacted with free radicals to stabilize and terminate radical chain reactions, resulting in high reducing power in fermented mulberry juice with high phenolic contents. Additionally, the initial organism's intracellular antioxidants, peptides, and hydrogen-donating capacity might contribute to its improved reducing ability [47].
In the present study, a clear decline in all phytochemicals and antioxidant activity was observed after 72 h of treatment. This decrease can be attributed to LAB bacteria depolymerizing macromolecular phenolics or converting specific phenolic compounds [11]. Scientists discovered a significant reduction in phytochemicals after 72 h of fermentation, consistent with other [51]. Microbial metabolism and enzymatic activities can change phenolic compounds during fermentation, with specific enzymes potentially degrading or modifying phenolics, leading to their reduction. Some studies suggest that phenolic degradation may occur after an optimal fermentation period, causing a decrease in their content after a peak [52]. After an initial increase, certain phenolic compounds may undergo additional reactions or transformations, reducing their concentration over time.
Fermentation with probiotics produces aromatic amine groups, indicating the presence of bacterial proteins in the final fermented product, which have antibacterial properties in different fermented samples[53]. Studies by [54] and [55] found various phenol groups, aliphatic amines, alcohols, and carboxylic acids at 1000, 1250, and 3270 cm⁻¹ peaks in fruit and purple sweet potato (Ipomoea batatas L.) extracts. During fermentation, bond rearrangements occur, such as C-H stretching vibration changes from 2928 cm⁻¹ to 2925 cm⁻¹, indicating hydrogen bond formation. Ma et al. (2022) revealed that hydrogen bonding at the glycosidic bond between the oxygen atom and the presence of the OH group at the 886 cm⁻¹ absorption peak.
Many positive chemical changes occur during fermentation, improving intermolecular crosslinking and sometimes altering molecular structure to create new covalent bonds, protein interactions, and bioactive compounds [56]. Fermentation changes hydrogen bonding and increases intermolecular covalent cross-linking, ultimately enhancing juice quality. FTIR results are supported by [55], who fermented sapote fruit to produce wine, identifying peaks at 1201, 1459, 2847, 2925, and 3025 cm⁻¹ linked to secondary amides, aromatic esters, O-H stretching compounds, and C-H stretching. These differences mainly occur between 700-2000 cm⁻¹, directly linked to fermentation and the formation of new compounds like phenols, organic acids, glycerol, and alcohol. Peaks at 1352 and 1644 cm⁻¹ indicated amide II and amide I, linked to interactions between amino and hydroxyl groups that modified the secondary structure of pullulan film. The peak at 1148 cm⁻¹ represented a typical saccharide structure [56].
5. Conclusions
In the present study, metabolites from mulberry fruit juice fermentation in co-culture were dramatically increased, demonstrating higher DPPH free radical scavenging activity and ferric reducing antioxidant power. The results indicated that co-cultures of LC-LPC and LP-LPC performed best across all fermentation treatments, with the greatest improvement in metabolites occurring after 48 and 24 h of fermentation, respectively, followed by a decline in metabolite synthesis. The fermentation process strengthened hydrogen bonding and intermolecular covalent crosslinking, improving the juice's properties, as shown by FTIR data. These changes were attributed to the formation of new chemicals such as alcohol, organic acids, phenols, and glycerol. The study provides valuable insights into the process design for transforming mulberry fruit into innovative functional foods, offering theoretical and practical guidance for enterprises seeking to improve fermentation processes for high-quality products. Future research should focus on optimizing fermentation conditions, exploring different probiotic strains, and understanding the molecular mechanisms underlying phenolic biotransformation. Additionally, examining the long-term stability of bioactive compounds, conducting clinical trials to validate health benefits, developing diverse fermented products, and assessing the environmental impact of production will further enhance the potential of fermented mulberry juice as a functional food. Addressing these directions will help fully realize the health benefits and consumer demand for nutritious and innovative mulberry-based products.
Author Contributions
Conceptualization, S.Y., Y.M.; methodology, S.Y., M.M.G., I.K., K.A.A., Y.M.; validation, M.M.G., B.M., A.I., T.A., I.K., Y.M.; formal analysis, M.M.G., B.M., A.I., M.S.M., K.A.A., I.K., Y.M.; investigation, S.Y., B.M., A.I., M.S.M., K.A.A., A.R., T.A.B., T.A.; data curation, S.Y., M.M.G., I.K., Y.M.; writing—original draft preparation, S.Y., M.M.G., A.R., T.A., I.K., Y.M.; writing—review and editing, S.Y., M.M.G., T.A.B., T.A., I.K., Y.M.; visualization, M.M.G., I.K.; supervision, M.M.G., I.K., Y.M.; funding acquisition, M.M.G., I.K., Y.M. All authors have read and agreed to the published version of the manuscript.
Funding
This research was funded by National Natural Science Foundation of China (Grant No. 42301210. Also, it was funded by the “Belt and Road” joint project fund between Zhejiang University, China, and National Research Centre, Egypt (Project No: SQ2023YFE0103360). The authors appreciate the support from Researchers Supporting Project number (RSPD2024R641), King Saud University, Riyadh, Saudi Arabia.
Institutional Review Board Statement
Not applicable.
Informed Consent Statement
Not applicable.
Data Availability Statement
Data will be available upon request.
Acknowledgments
The authors extend their appreciation to Jiangsu University central labs for facilitating several experiments of the current study.
Conflicts of Interest
The authors declare no conflicts of interest.
References
- Mehmood, A.; Ishaq, M.; Zhao, L.; Yaqoob, S.; Safdar, B.; Nadeem, M.; Munir, M.; Wang, C. Impact of ultrasound and conventional extraction techniques on bioactive compounds and biological activities of blue butterfly pea flower (Clitoria ternatea L.). Ultrasonics sonochemistry 2019, 51, 12–19. [Google Scholar] [CrossRef]
- Rohela, G.K.; Jogam, P.; Mir, M.Y.; Shabnam, A.A.; Shukla, P.; Abbagani, S.; Kamili, A.N. Indirect regeneration and genetic fidelity analysis of acclimated plantlets through SCoT and ISSR markers in Morus alba L. cv. Chinese white. Biotechnology reports 2020, 25, e00417. [Google Scholar] [CrossRef]
- Kwaw, E.; Ma, Y.; Tchabo, W.; Apaliya, M.T.; Wu, M.; Sackey, A.S.; Xiao, L.; Tahir, H.E. Effect of lactobacillus strains on phenolic profile, color attributes and antioxidant activities of lactic-acid-fermented mulberry juice. Food chemistry 2018, 250, 148–154. [Google Scholar] [CrossRef]
- Wei-Guo, Z.; Xue-Xia, M.; Bo, Z.; Zhang, L.; Yi-Le, P.; Huang, Y.-P. Construction of fingerprinting and genetic diversity of mulberry cultivars in China by ISSR markers. Acta Genetica Sinica 2006, 33, 851–860. [Google Scholar]
- Eyduran, S.P.; Ercisli, S.; Akin, M.; Beyhan, O.; Geçer, M.K.; Eyduran, E.; Erturk, Y. Organic acids, sugars, vitamin C, antioxidant capacity, and phenolic compounds in fruits of white (Morus alba L.) and black (Morus nigra L.) mulberry genotypes. Journal of Applied Botany and Food Quality 2015, 88. [Google Scholar]
- Ranjith, F.H.; Ariffin, S.H.; Muhialdin, B.J.; Yusof, N.L.; Mohammed, N.K.; Marzlan, A.A.; Hussin, A.S.M. Influence of natural antifungal coatings produced by Lacto-fermented antifungal substances on respiration, quality, antioxidant attributes, and shelf life of mango (Mangifera indica L.). Postharvest Biology and Technology 2022, 189, 111904. [Google Scholar] [CrossRef]
- Rodríguez, L.G.R.; Gasga, V.M.Z.; Pescuma, M.; Van Nieuwenhove, C.; Mozzi, F.; Burgos, J.A.S. Fruits and fruit by-products as sources of bioactive compounds. Benefits and trends of lactic acid fermentation in the development of novel fruit-based functional beverages. Food Research International 2021, 140, 109854. [Google Scholar] [CrossRef]
- Perricone, M.; Bevilacqua, A.; Altieri, C.; Sinigaglia, M.; Corbo, M.R. Challenges for the production of probiotic fruit juices. Beverages 2015, 1, 95–103. [Google Scholar] [CrossRef]
- Aspri, M.; Papademas, P.; Tsaltas, D. Review on non-dairy probiotics and their use in non-dairy based products. Fermentation 2020, 6, 30. [Google Scholar] [CrossRef]
- Vinderola, G.; Burns, P.; Reinheimer, J. Probiotics in nondairy products. In Vegetarian and plant-based diets in health and disease prevention; Elsevier: 2017; pp. 809-835.
- Kaprasob, R.; Kerdchoechuen, O.; Laohakunjit, N.; Sarkar, D.; Shetty, K. Fermentation-based biotransformation of bioactive phenolics and volatile compounds from cashew apple juice by select lactic acid bacteria. Process Biochemistry 2017, 59, 141–149. [Google Scholar] [CrossRef]
- Wang, Z.; Feng, Y.; Yang, N.; Jiang, T.; Xu, H.; Lei, H. Fermentation of kiwifruit juice from two cultivars by probiotic bacteria: Bioactive phenolics, antioxidant activities and flavor volatiles. Food Chemistry 2022, 373, 131455. [Google Scholar] [CrossRef]
- Yaqoob, S.; Liu, H.; Zhao, C.; Liu, M.; Cai, D.; Liu, J. Influence of multiple freezing/thawing cycles on a structural, rheological, and textural profile of fermented and unfermented corn dough. Food Science & Nutrition 2019, 7, 3471–3479. [Google Scholar]
- Yaqoob, S.; Liu, H.; Liu, M.; Zheng, M.; Awan, K.A.; Cai, D.; Liu, J. The effect of lactic acid bacteria and co-culture on structural, rheological, and textural profile of corn dough. Food Science & Nutrition 2022, 10, 264–271. [Google Scholar]
- Fessard, A.; Remize, F. Genetic and technological characterization of lactic acid bacteria isolated from tropically grown fruits and vegetables. International journal of food microbiology 2019, 301, 61–72. [Google Scholar] [CrossRef]
- Gao, H.; Wen, J.-J.; Hu, J.-L.; Nie, Q.-X.; Chen, H.-H.; Nie, S.-P.; Xiong, T.; Xie, M.-Y. Momordica charantia juice with Lactobacillus plantarum fermentation: Chemical composition, antioxidant properties and aroma profile. Food Bioscience 2019, 29, 62–72. [Google Scholar] [CrossRef]
- Degrain, A.; Manhivi, V.; Remize, F.; Garcia, C.; Sivakumar, D. Effect of lactic acid fermentation on color, phenolic compounds and antioxidant activity in African nightshade. Microorganisms 2020, 8, 1324. [Google Scholar] [CrossRef]
- Wafula, E.N.; Franz, C.; Rohn, S.; Huch, M.; Mathara, J.M.; Trierweiler, B. Fermentation of African indigenous leafy vegetables to lower post-harvest losses, maintain quality and increase product safety. African Journal of Horticultural Science 2016, 9, 1–13. [Google Scholar]
- Srionnual, S.; Yanagida, F.; Lin, L.-H.; Hsiao, K.-N.; Chen, Y.-s. Weissellicin 110, a newly discovered bacteriocin from Weissella cibaria 110, isolated from plaa-som, a fermented fish product from Thailand. Applied and Environmental Microbiology 2007, 73, 2247–2250. [Google Scholar] [CrossRef]
- Wei, M.; Wang, S.; Gu, P.; Ouyang, X.; Liu, S.; Li, Y.; Zhang, B.; Zhu, B. Comparison of physicochemical indexes, amino acids, phenolic compounds and volatile compounds in bog bilberry juice fermented by Lactobacillus plantarum under different pH conditions. Journal of food science and technology 2018, 55, 2240–2250. [Google Scholar] [CrossRef]
- Chen, G.-L.; Chen, S.-G.; Xiao, Y.; Fu, N.-L. Antioxidant capacities and total phenolic contents of 30 flowers. Industrial Crops and Products 2018, 111, 430–445. [Google Scholar] [CrossRef]
- Kumaran, A.; Karunakaran, R.J. In vitro antioxidant activities of methanol extracts of five Phyllanthus species from India. LWT-Food Science and Technology 2007, 40, 344–352. [Google Scholar] [CrossRef]
- Tchabo, W.; Ma, Y.; Kwaw, E.; Zhang, H.; Li, X.; Afoakwah, N.A. Effects of ultrasound, high pressure, and manosonication processes on phenolic profile and antioxidant properties of a sulfur dioxide-free mulberry (Morus nigra) wine. Food and Bioprocess Technology 2017, 10, 1210–1223. [Google Scholar] [CrossRef]
- Sun, J.-S.; Tsuang, Y.-H.; Chen, I.-J.; Huang, W.-C.; Hang, Y.-S.; Lu, F.-J. An ultra-weak chemiluminescence study on oxidative stress in rabbits following acute thermal injury. Burns 1998, 24, 225–231. [Google Scholar] [CrossRef]
- Natić, M.M.; Dabić, D.Č.; Papetti, A.; Akšić, M.M.F.; Ognjanov, V.; Ljubojević, M.; Tešić, Ž.L. Analysis and characterisation of phytochemicals in mulberry (Morus alba L.) fruits grown in Vojvodina, North Serbia. Food chemistry 2015, 171, 128–136. [Google Scholar] [CrossRef]
- Apak, R.; Güçlü, K.; Özyürek, M.; Karademir, S.E. Novel total antioxidant capacity index for dietary polyphenols and vitamins C and E, using their cupric ion reducing capability in the presence of neocuproine: CUPRAC method. Journal of agricultural and food chemistry 2004, 52, 7970–7981. [Google Scholar] [CrossRef]
- Ramirez, J.E.; Zambrano, R.; Sepúlveda, B.; Kennelly, E.J.; Simirgiotis, M.J. Anthocyanins and antioxidant capacities of six Chilean berries by HPLC–HR-ESI-ToF-MS. Food Chemistry 2015, 176, 106–114. [Google Scholar] [CrossRef]
- If, B. The ferric reducing ability of plasma (FRAP) as a measure of" antioxidant power": the FRAP assay. Anal biochem 1996, 239, 70–76. [Google Scholar]
- Khalifa, I.; Nilsuwan, K.; Prodpran, T.; Benjakul, S. Covalently phenolated-β-lactoglobulin-pullulan as a green halochromic biosensor efficiency monitored Barramundi fish's spoilage. International Journal of Biological Macromolecules 2023, 243. [Google Scholar] [CrossRef]
- Gouda, M.; Chen, K.; Li, X.; Liu, Y.; He, Y. Detection of microalgae single-cell antioxidant and electrochemical potentials by gold microelectrode and Raman micro-spectroscopy combined with chemometrics. Sensors and Actuators B: Chemical 2021, 329, 129229. [Google Scholar] [CrossRef]
- Gouda, M.; Zu, L.; Ma, S.; Sheng, L.; Ma, M. Influence of bio-active terpenes on the characteristics and functional properties of egg yolk. Food Hydrocolloids 2018, 80, 222–230. [Google Scholar] [CrossRef]
- Ansari, M.A.; Asiri, S.M.M. Green synthesis, antimicrobial, antibiofilm and antitumor activities of superparamagnetic γ-Fe2O3 NPs and their molecular docking study with cell wall mannoproteins and peptidoglycan. International Journal of Biological Macromolecules 2021, 171, 44–58. [Google Scholar] [CrossRef]
- Gouda, M.; Lv, J.-M.; Huang, Z.; Chen, J.-C.; He, Y.; Li, X. Bioprobe-RNA-seq-microRaman system for deep tracking of the live single-cell metabolic pathway chemometrics. Biosensors and Bioelectronics 2024, 261. [Google Scholar] [CrossRef]
- Gallo, M.; Nigro, F.; Passannanti, F.; Salameh, D.; Schiattarella, P.; Budelli, A.; Nigro, R. Lactic fermentation of cereal flour: feasibility tests on rice, oat and wheat. Applied Food Biotechnology 2019, 6, 165–172. [Google Scholar]
- Khan, S.A.; Zhang, M.; Liu, L.; Dong, L.; Ma, Y.; Wei, Z.; Chi, J.; Zhang, R. Co-culture submerged fermentation by lactobacillus and yeast more effectively improved the profiles and bioaccessibility of phenolics in extruded brown rice than single-culture fermentation. Food chemistry 2020, 326, 126985. [Google Scholar] [CrossRef]
- Leonard, W.; Zhang, P.; Ying, D.; Adhikari, B.; Fang, Z. Fermentation transforms the phenolic profiles and bioactivities of plant-based foods. Biotechnology advances 2021, 49, 107763. [Google Scholar] [CrossRef]
- Gaur, G.; Gänzle, M.G. Conversion of (poly) phenolic compounds in food fermentations by lactic acid bacteria: Novel insights into metabolic pathways and functional metabolites. Current Research in Food Science 2023, 6, 100448. [Google Scholar] [CrossRef]
- Loghman, S.; Moayedi, A.; Mahmoudi, M.; Khomeiri, M.; Gómez-Mascaraque, L.G.; Garavand, F. Single and co-cultures of proteolytic lactic acid bacteria in the manufacture of fermented milk with high ACE inhibitory and antioxidant activities. Fermentation 2022, 8, 448. [Google Scholar] [CrossRef]
- Ouwehand, A.C.; Invernici, M.M.; Furlaneto, F.A.; Messora, M.R. Effectiveness of multi-strain versus single-strain probiotics: current status and recommendations for the future. Journal of clinical gastroenterology 2018, 52, S35–S40. [Google Scholar] [CrossRef]
- Yang, W.; Liu, J.; Zhang, Q.; Liu, H.; Lv, Z.; Zhang, C.; Jiao, Z. Changes in nutritional composition, volatile organic compounds and antioxidant activity of peach pulp fermented by lactobacillus. Food Bioscience 2022, 49, 101894. [Google Scholar] [CrossRef]
- Dueñas, M.; Fernández, D.; Hernandez, T.; Estrella, I.; Muñoz, R. Bioactive phenolic compounds of cowpeas (Vigna sinensis L). Modifications by fermentation with natural microflora and with Lactobacillus plantarum ATCC 14917. Journal of the Science of Food and Agriculture 2005, 85, 297–304. [Google Scholar] [CrossRef]
- Mantzourani, I.; Kazakos, S.; Terpou, A.; Alexopoulos, A.; Bezirtzoglou, E.; Bekatorou, A.; Plessas, S. Potential of the probiotic Lactobacillus plantarum ATCC 14917 strain to produce functional fermented pomegranate juice. Foods 2018, 8, 4. [Google Scholar] [CrossRef] [PubMed]
- Chandrasekara, A.; Naczk, M.; Shahidi, F. Effect of processing on the antioxidant activity of millet grains. Food Chemistry 2012, 133, 1–9. [Google Scholar] [CrossRef]
- McCUE, P.; Horii, A.; SHETTY, K. Solid-state bioconversion of phenolic antioxidants from defatted soybean powders by Rhizopus oligosporus: role of carbohydrate-cleaving enzymes. Journal of Food Biochemistry 2003, 27, 501–514. [Google Scholar] [CrossRef]
- Wu, C.; Li, T.; Qi, J.; Jiang, T.; Xu, H.; Lei, H. Effects of lactic acid fermentation-based biotransformation on phenolic profiles, antioxidant capacity and flavor volatiles of apple juice. Lwt 2020, 122, 109064. [Google Scholar] [CrossRef]
- Zhou, Y.; Wang, R.; Zhang, Y.; Yang, Y.; Sun, X.; Zhang, Q.; Yang, N. Biotransformation of phenolics and metabolites and the change in antioxidant activity in kiwifruit induced by Lactobacillus plantarum fermentation. Journal of the Science of Food and Agriculture 2020, 100, 3283–3290. [Google Scholar] [CrossRef]
- Lee, I.-H.; Hung, Y.-H.; Chou, C.-C. Solid-state fermentation with fungi to enhance the antioxidative activity, total phenolic and anthocyanin contents of black bean. International Journal of Food Microbiology 2008, 121, 150–156. [Google Scholar] [CrossRef]
- Yao, Q.; JIN, X.-n.; Heui, D.P. Comparison of antioxidant activities in black soybean preparations fermented with various microorganisms. Agricultural Sciences in China 2010, 9, 1065–1071. [Google Scholar]
- Vadivel, V.; Stuetz, W.; Scherbaum, V.; Biesalski, H. Total free phenolic content and health relevant functionality of Indian wild legume grains: Effect of indigenous processing methods. Journal of Food Composition and Analysis 2011, 24, 935–943. [Google Scholar] [CrossRef]
- Marazza, J.A.; Nazareno, M.A.; de Giori, G.S.; Garro, M.S. Enhancement of the antioxidant capacity of soymilk by fermentation with Lactobacillus rhamnosus. Journal of functional foods 2012, 4, 594–601. [Google Scholar] [CrossRef]
- Xu, H.; Feng, L.; Deng, Y.; Chen, L.; Li, Y.; Lin, L.; Liang, M.; Jia, X.; Wang, F.; Zhang, X. Change of phytochemicals and bioactive substances in Lactobacillus fermented Citrus juice during the fermentation process. Lwt 2023, 180, 114715. [Google Scholar] [CrossRef]
- Melini, F.; Melini, V. Impact of fermentation on phenolic compounds and antioxidant capacity of quinoa. Fermentation 2021, 7, 20. [Google Scholar] [CrossRef]
- Vaithilingam, M.; Chandrasekaran, S.; Mehra, A.; Prakash, S.; Agarwal, A.; Ethiraj, S.; Vaithiyanathan, S. Fermentation of beet juice using lactic acid bacteria and its cytotoxic activity against human liver cancer cell lines HepG2. Current Bioactive Compounds 2016, 12, 258–263. [Google Scholar] [CrossRef]
- Ray, R.C.; Panda, S.K.; Swain, M.R.; Sivakumar, P.S. Proximate composition and sensory evaluation of anthocyanin-rich purple sweet potato (Ipomoea batatas L.) wine. International journal of food science & technology 2012, 47, 452–458. [Google Scholar]
- Panda, S.K.; Sahu, U.C.; Behera, S.K.; Ray, R.C. Fermentation of sapota (Achras sapota Linn.) fruits to functional wine. Nutrafoods 2014, 13, 179–186. [Google Scholar] [CrossRef]
- Kang, L.; Liang, Q.; Rashid, A.; Qayum, A.; Chi, Z.; Ren, X.; Ma, H. Ultrasound-assisted development and characterization of novel polyphenol-loaded pullulan/trehalose composite films for fruit preservation. Ultrasonics Sonochemistry 2023, 92, 106242. [Google Scholar] [CrossRef]
Figure 1.
presents the study overall flowchart.
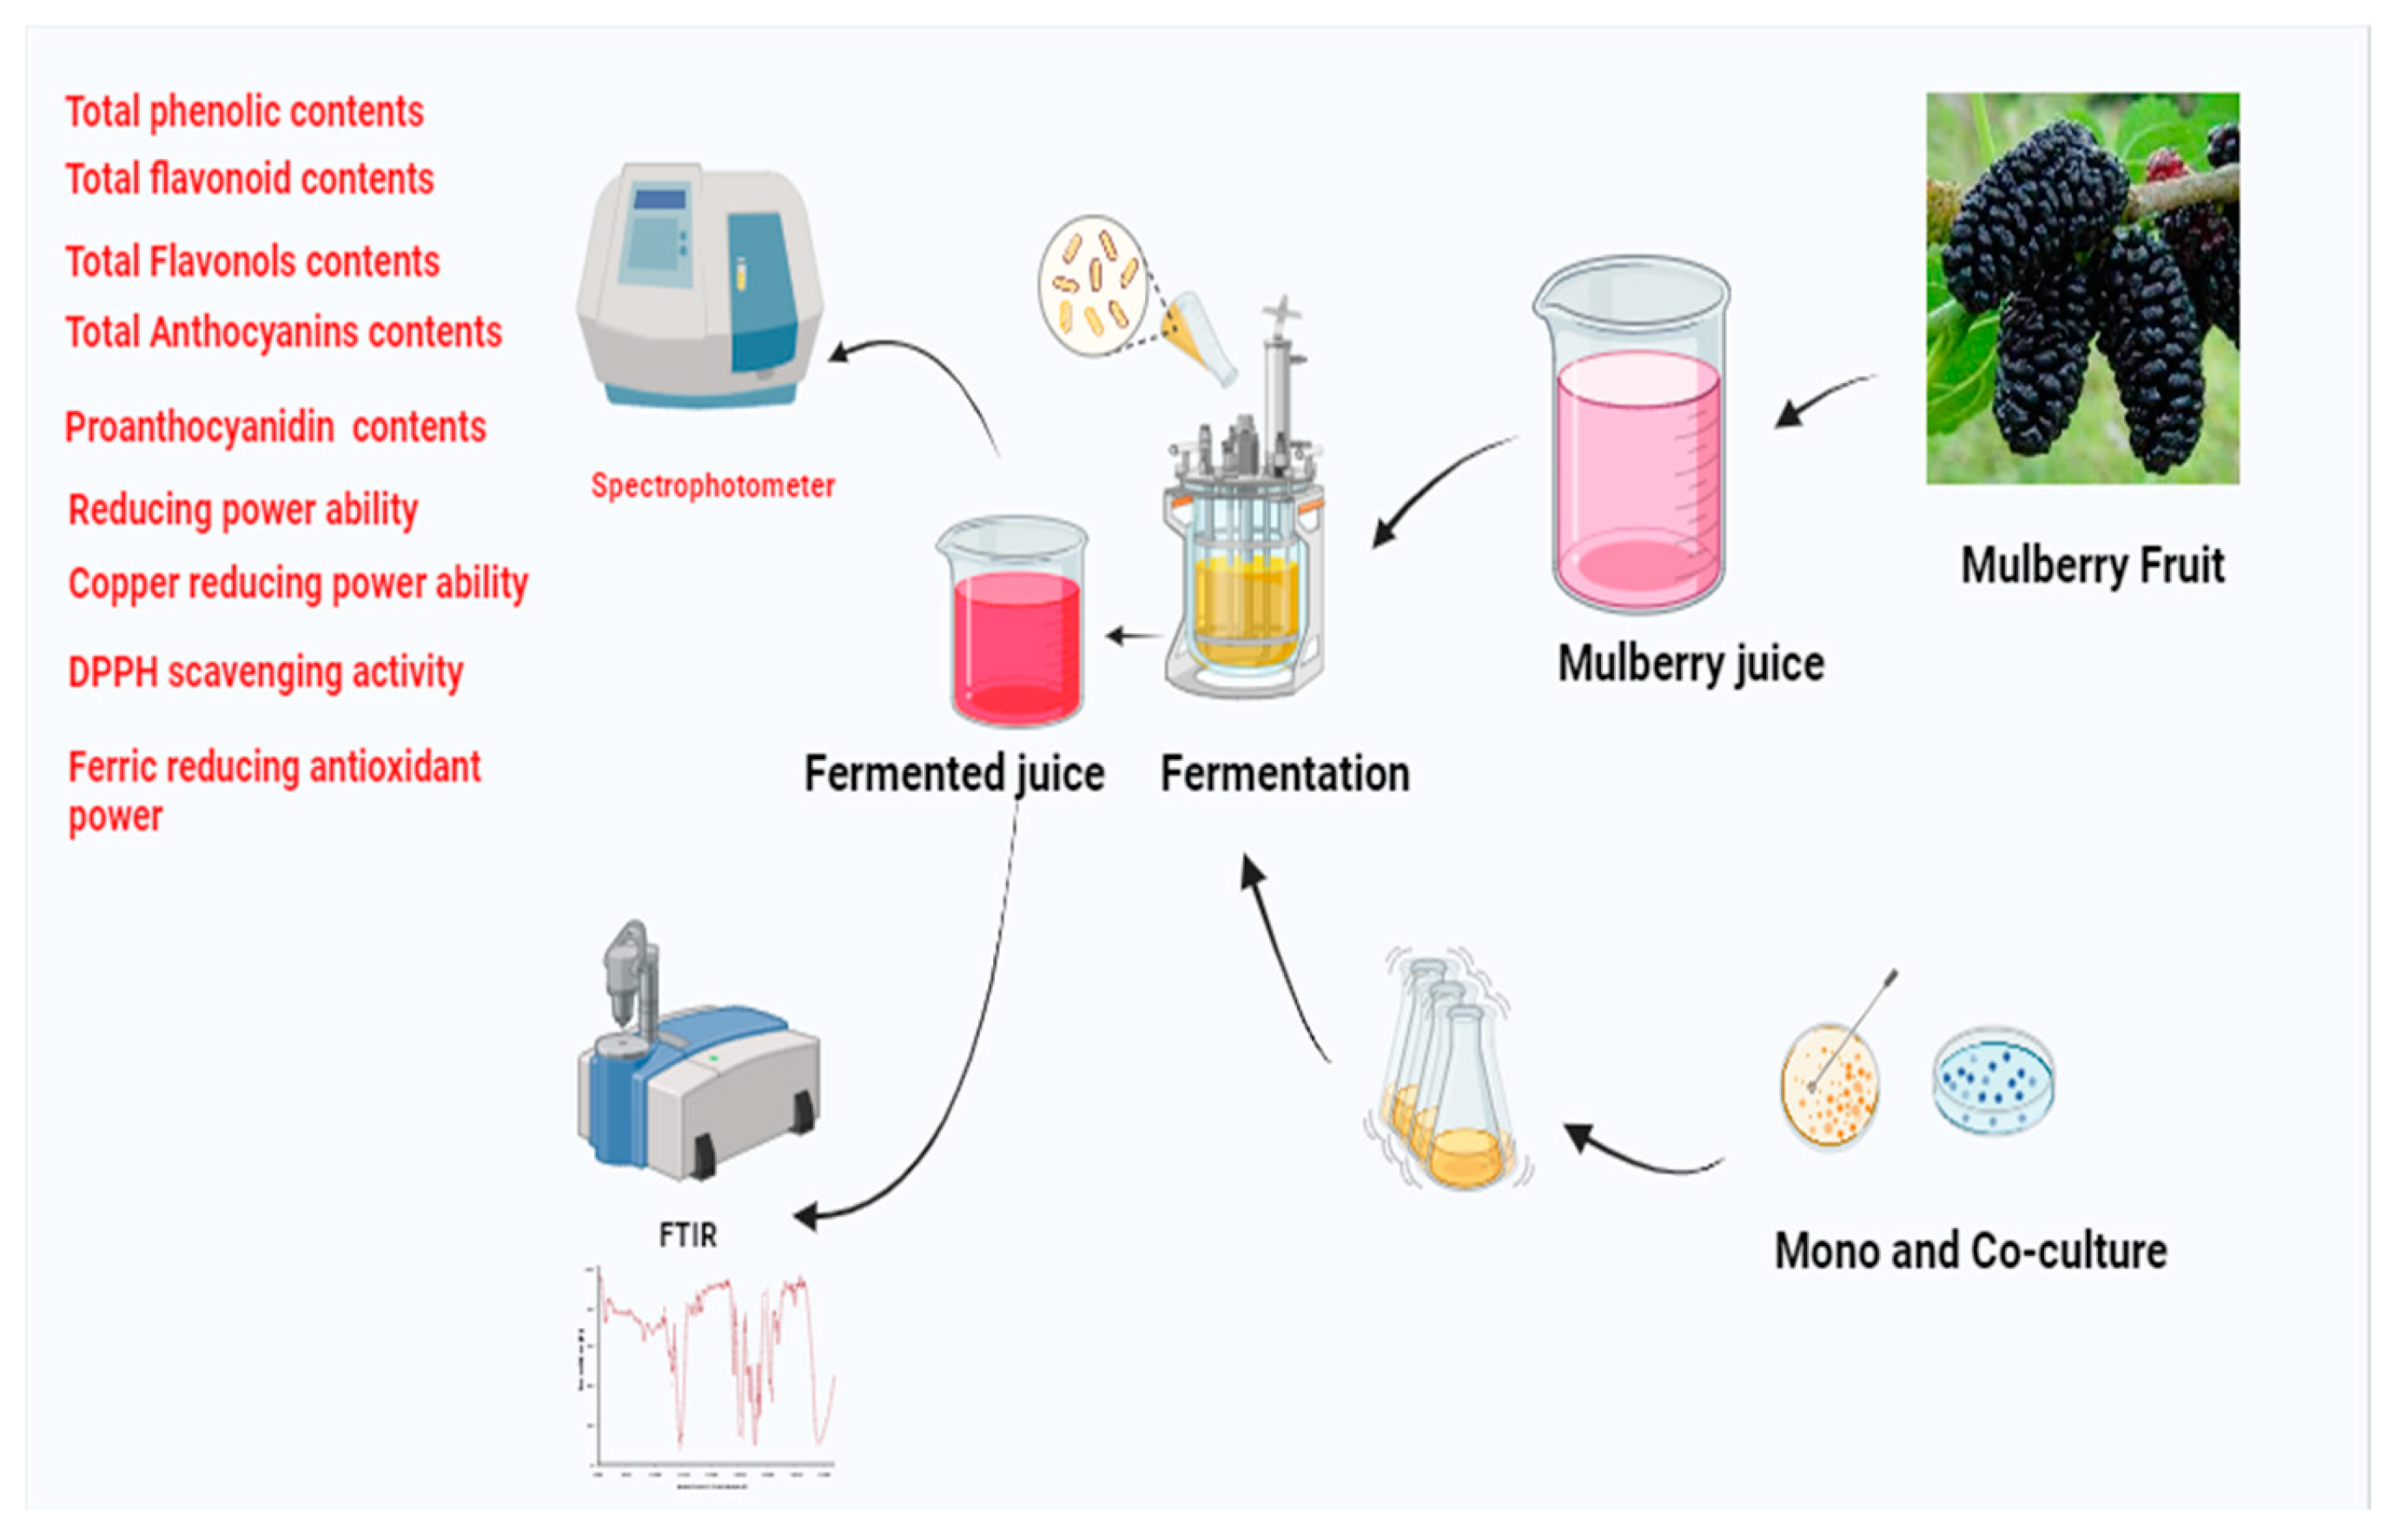
Figure 2.
The effect of fermentation time on the chemical compositions of mulberry juice with mono and co-culture of different lactic acid bacteria at 24 h, 48h, 72h, and 96h of fermentation. (a) Total phenolic content (mg gallic equivalent/mL of mulberry juice); (b) total flavonoid content (mg rutin equivalent/mL of mulberry juice); (c) total flavonol content (mg quercetin equivalent/mL of mulberry juice); (d) The total anthocyanin content (mg cyanidin 3-glucoside equivalent/mL of mulberry juice). C-Control; LC-Lactobacillus casei; LP-Lactobacillus plantarum; LPC-Lactobacillus paracasei; LA-Lactobacillus acidophilus LH-Lactobacillus helveticus; LC-LP Lactobacillus casei-Lactobacillus plantarum; LC-LPC Lactobacillus casei- Lactobacillus paracasei; LC-LA Lactobacillus casei- Lactobacillus acidophilus ; LC-LH Lactobacillus casei- Lactobacillus helveticus; LP-LPC Lactobacillus plantarum- Lactobacillus paracasei; LP-LA Lactobacillus plantarum-Lactobacillus acidophilus;;LP-LH Lactobacillus plantarum-Lactobacillus helveticus; LPC-LA Lactobacillus paracasei- Lactobacillus acidophilus;LPC-LH Lactobacillus paracasei - Lactobacillus helveticus ;LA-LH Lactobacillus acidophilus - Lactobacillus helveticus.
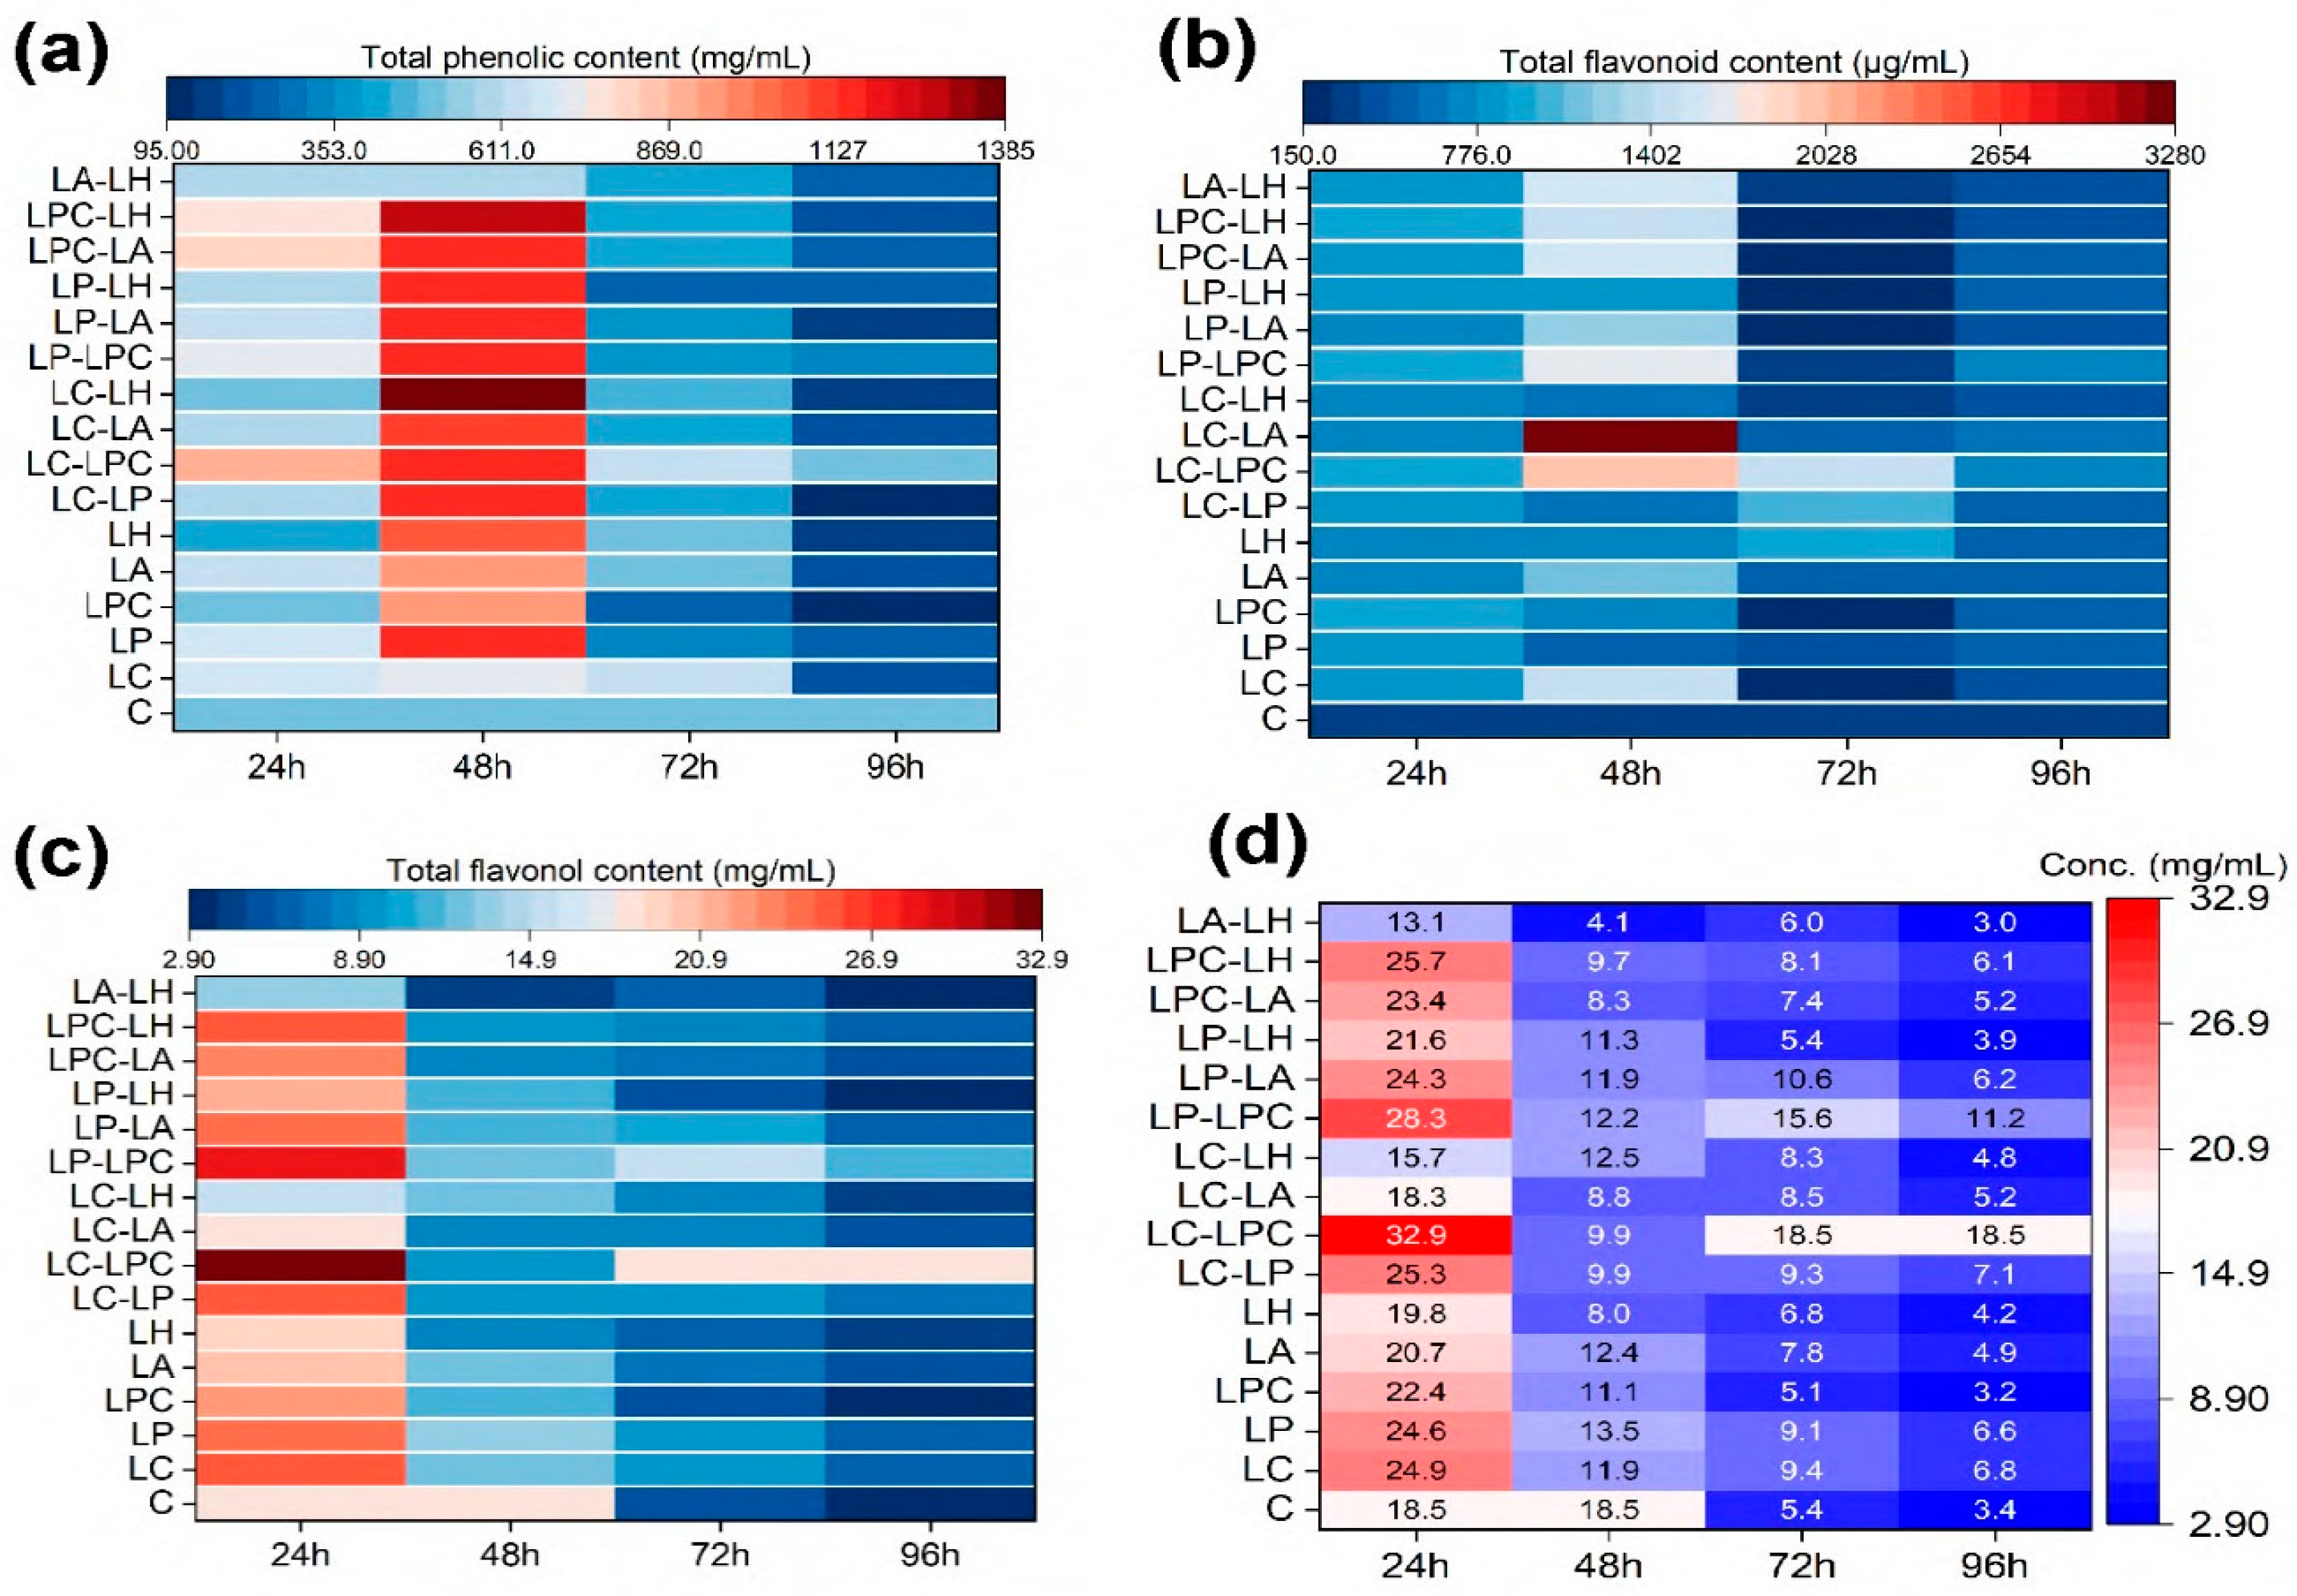
Figure 3.
(a) the correlation implication of the proanthocyanidins content (mg catechin equivalent/mL of mulberry juice) changes during the fermentation period on the mulberry juice with mono and co-culture of different lactic acid bacteria. (b) The reducing power ability (RP), ferric reducing antioxidant power (RAP), CuCl2-reducing power (Cu), and DPPH radical scavenging activity (mg trolox equivalent/mL of mulberry juice) with mono and co-culture of different lactic acid bacteria at 24 h, 48 h, 72 h, and 96 h of fermentation period. Other abbreviations can be found in Figure 2 legend.
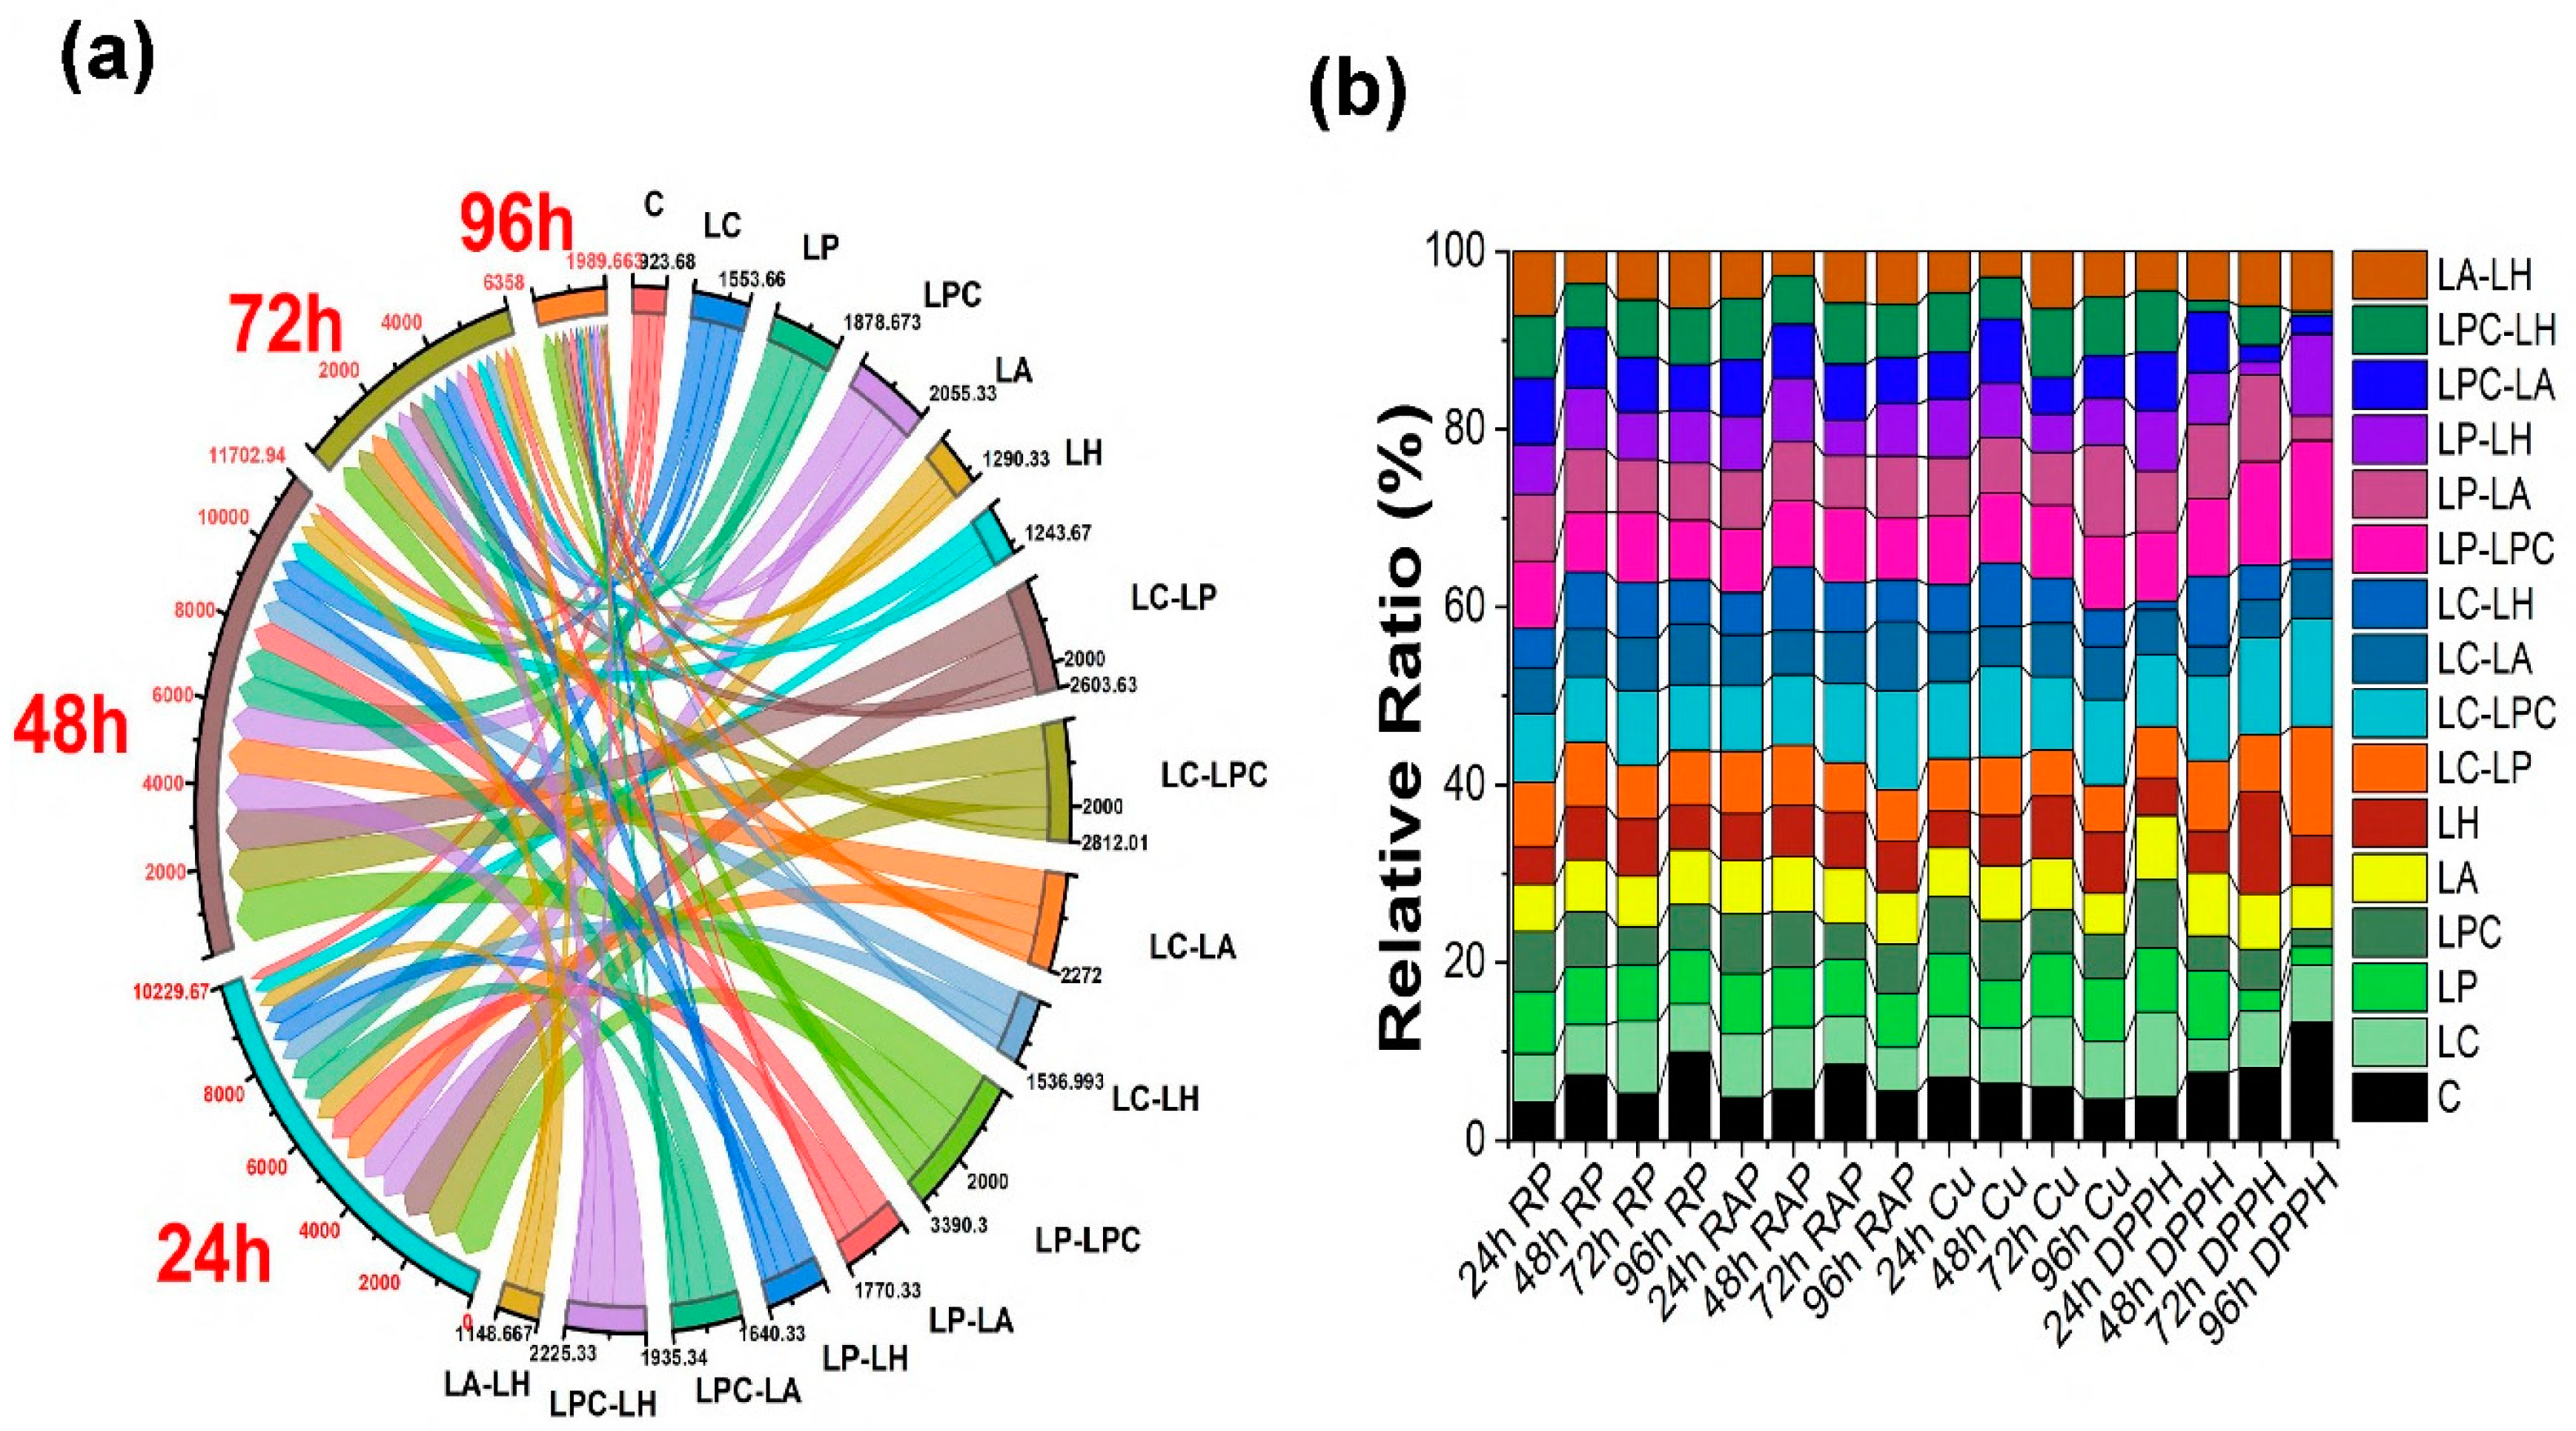
Figure 4.
FTIR spectra of different fermentation time on the chemical compositions of mulberry juice with mono culture of different lactic acid bacteria. (a) LC: Control; (b) LP: Lactobacillus plantarum; (c) LPC: Lactobacillus paracasei; (d) LA: Lactobacillus acidophilus; (d) LH: Lactobacillus helveticus.
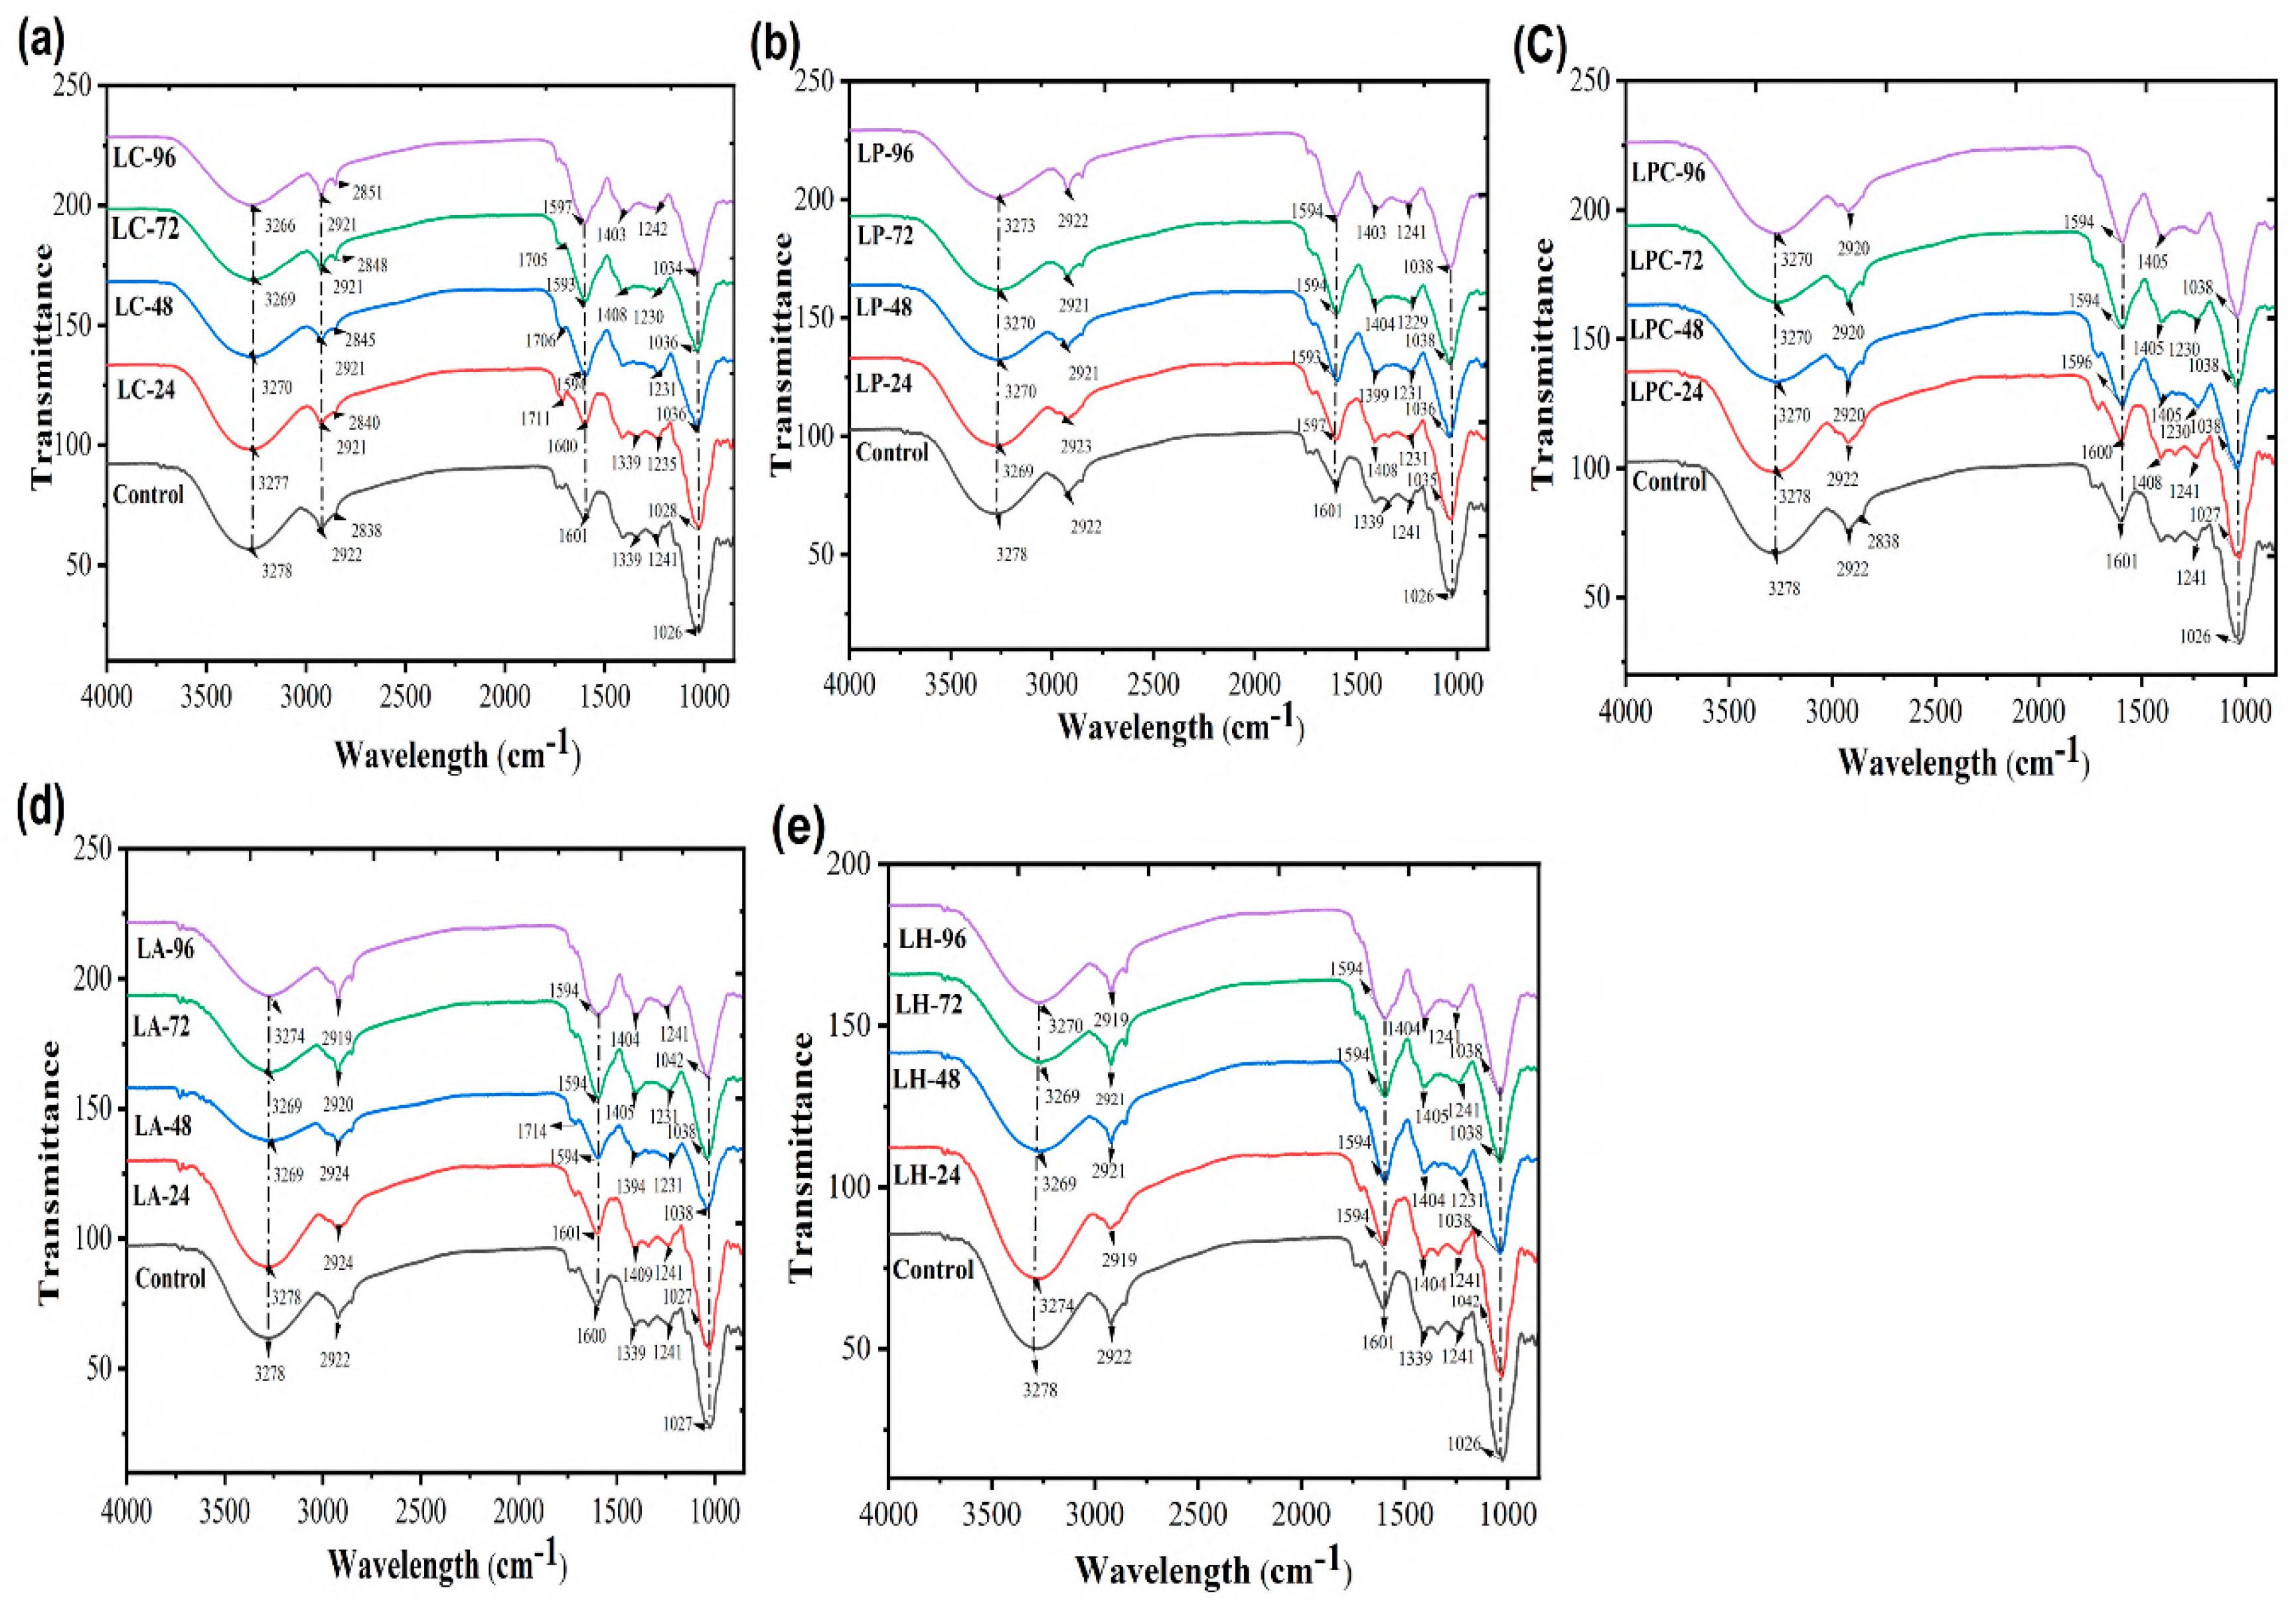
Figure 5.
FTIR spectra of different fermentation time on the chemical compositions of mulberry juice with mono culture of different lactic acid bacteria. (a) LC-LP; (b) LP-LPC; (c) LC-LA; (d) LC-LH; (d) LP-LPC. LC: Control; LP: Lactobacillus plantarum; LPC: Lactobacillus paracasei; LA: Lactobacillus acidophilus; LH: Lactobacillus helveticus.
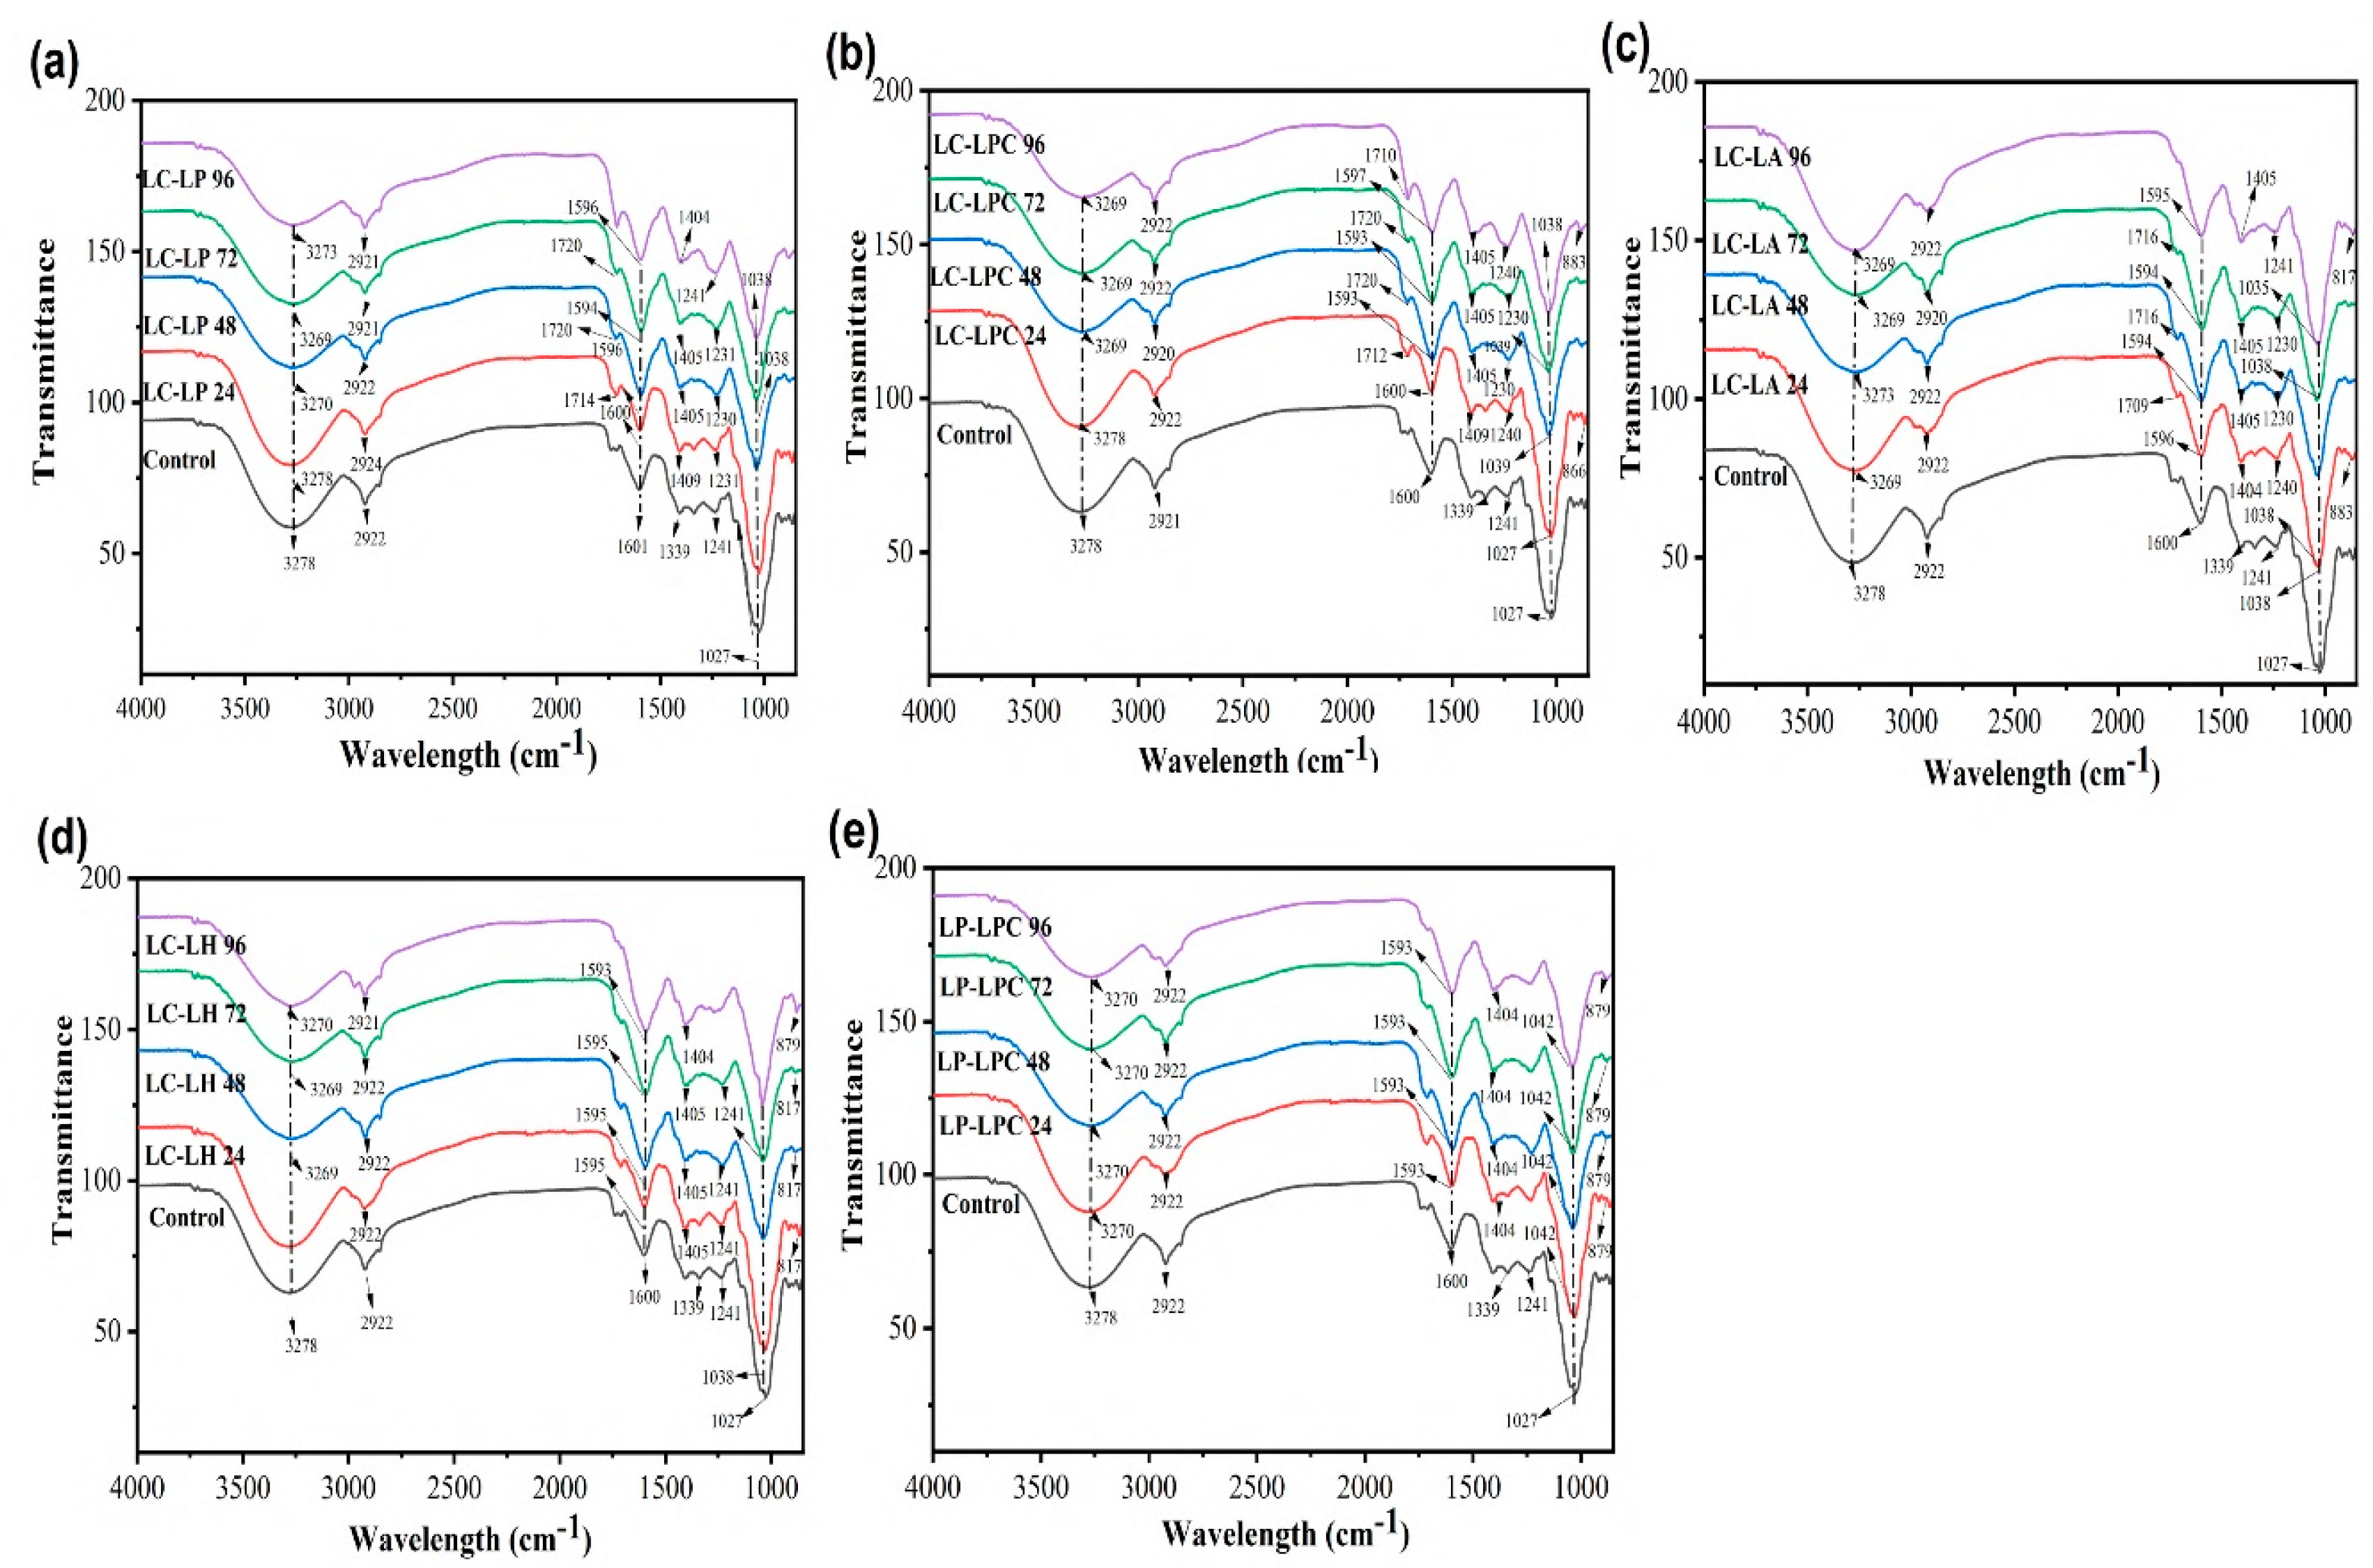
Figure 6.
FTIR spectra of different fermentation time on the chemical compositions of mulberry juice with mono culture of different lactic acid bacteria. (a) LP-LA; (b) LP-LH; (c) LPC-LA; (d) LPC-LH; (d) LA-LPC. LC: Control; LP: Lactobacillus plantarum; LPC: Lactobacillus paracasei; LA: Lactobacillus acidophilus; LH: Lactobacillus helveticus.
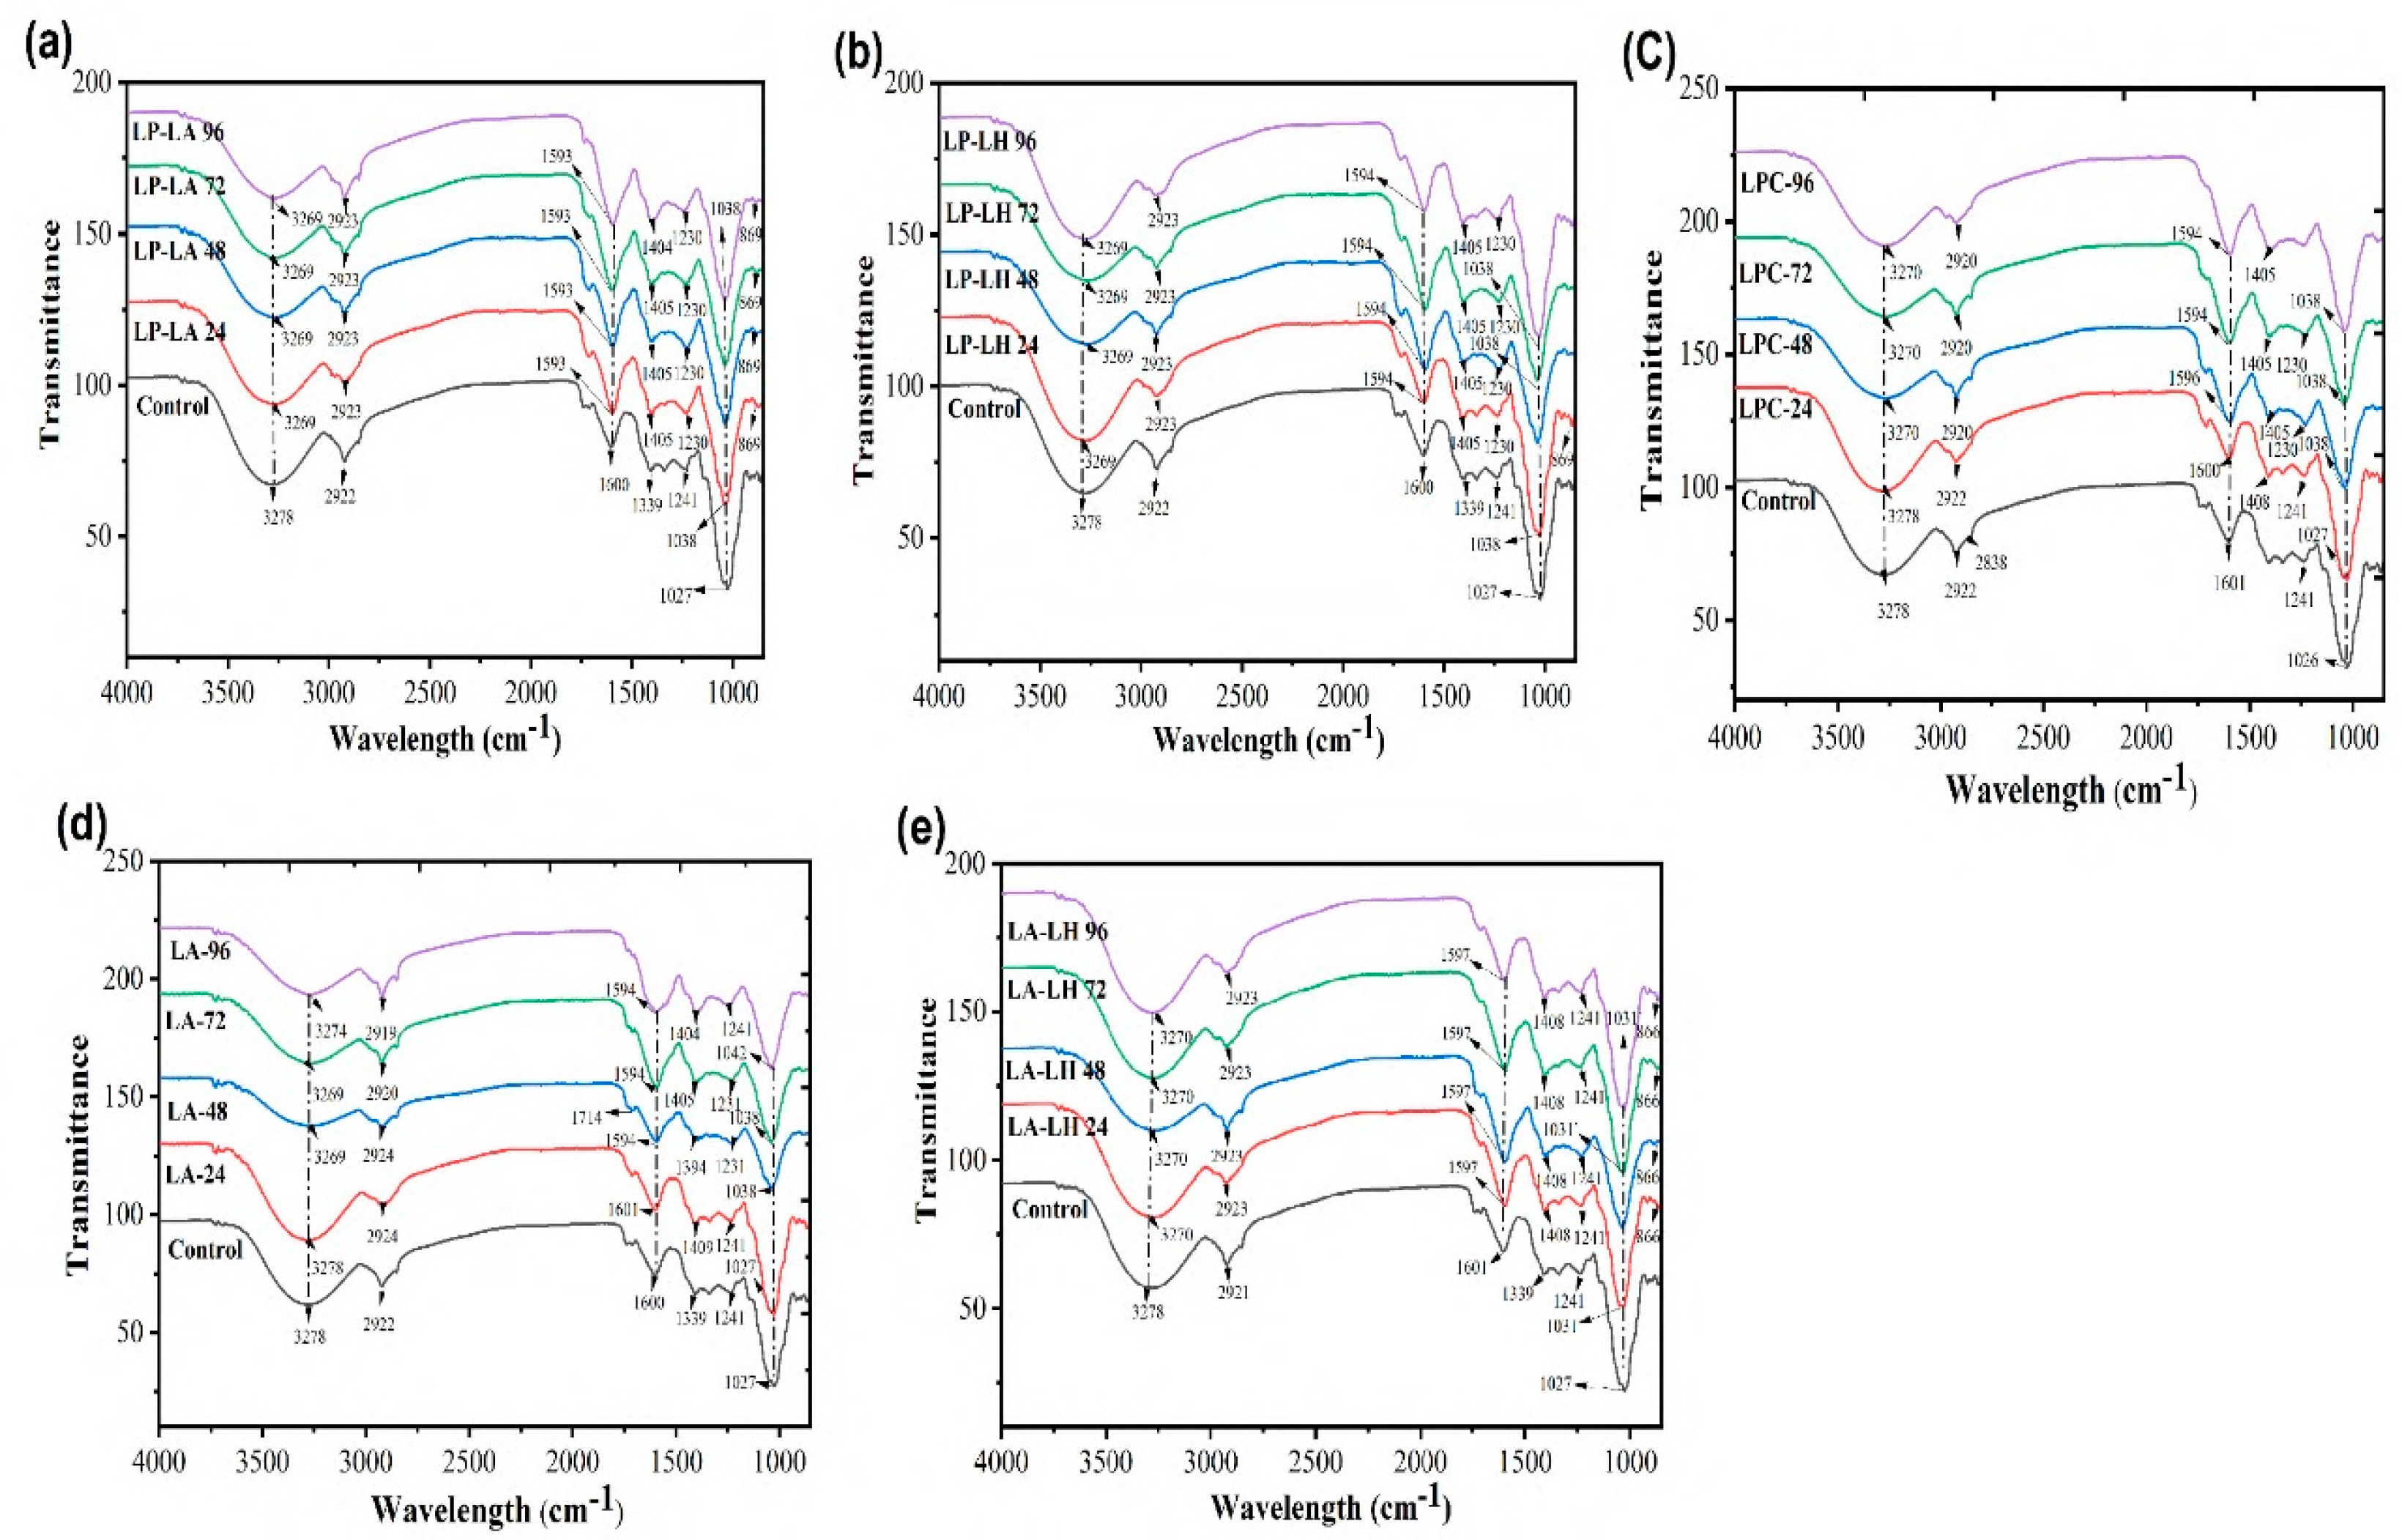
Figure 7.
Peptidoglycan-C3R interaction scheme of the bacterial cell wall and anthocyanin structures with representing their binding affinity, overall conjugates, hydrophobicity alterations, electrostatic potentials, H-bonding, heat-map analysis, and MDs-analysis. The end conjugates showed a binding score and energy affinity of -1.02 and -1.83 kcal/mol, separately.
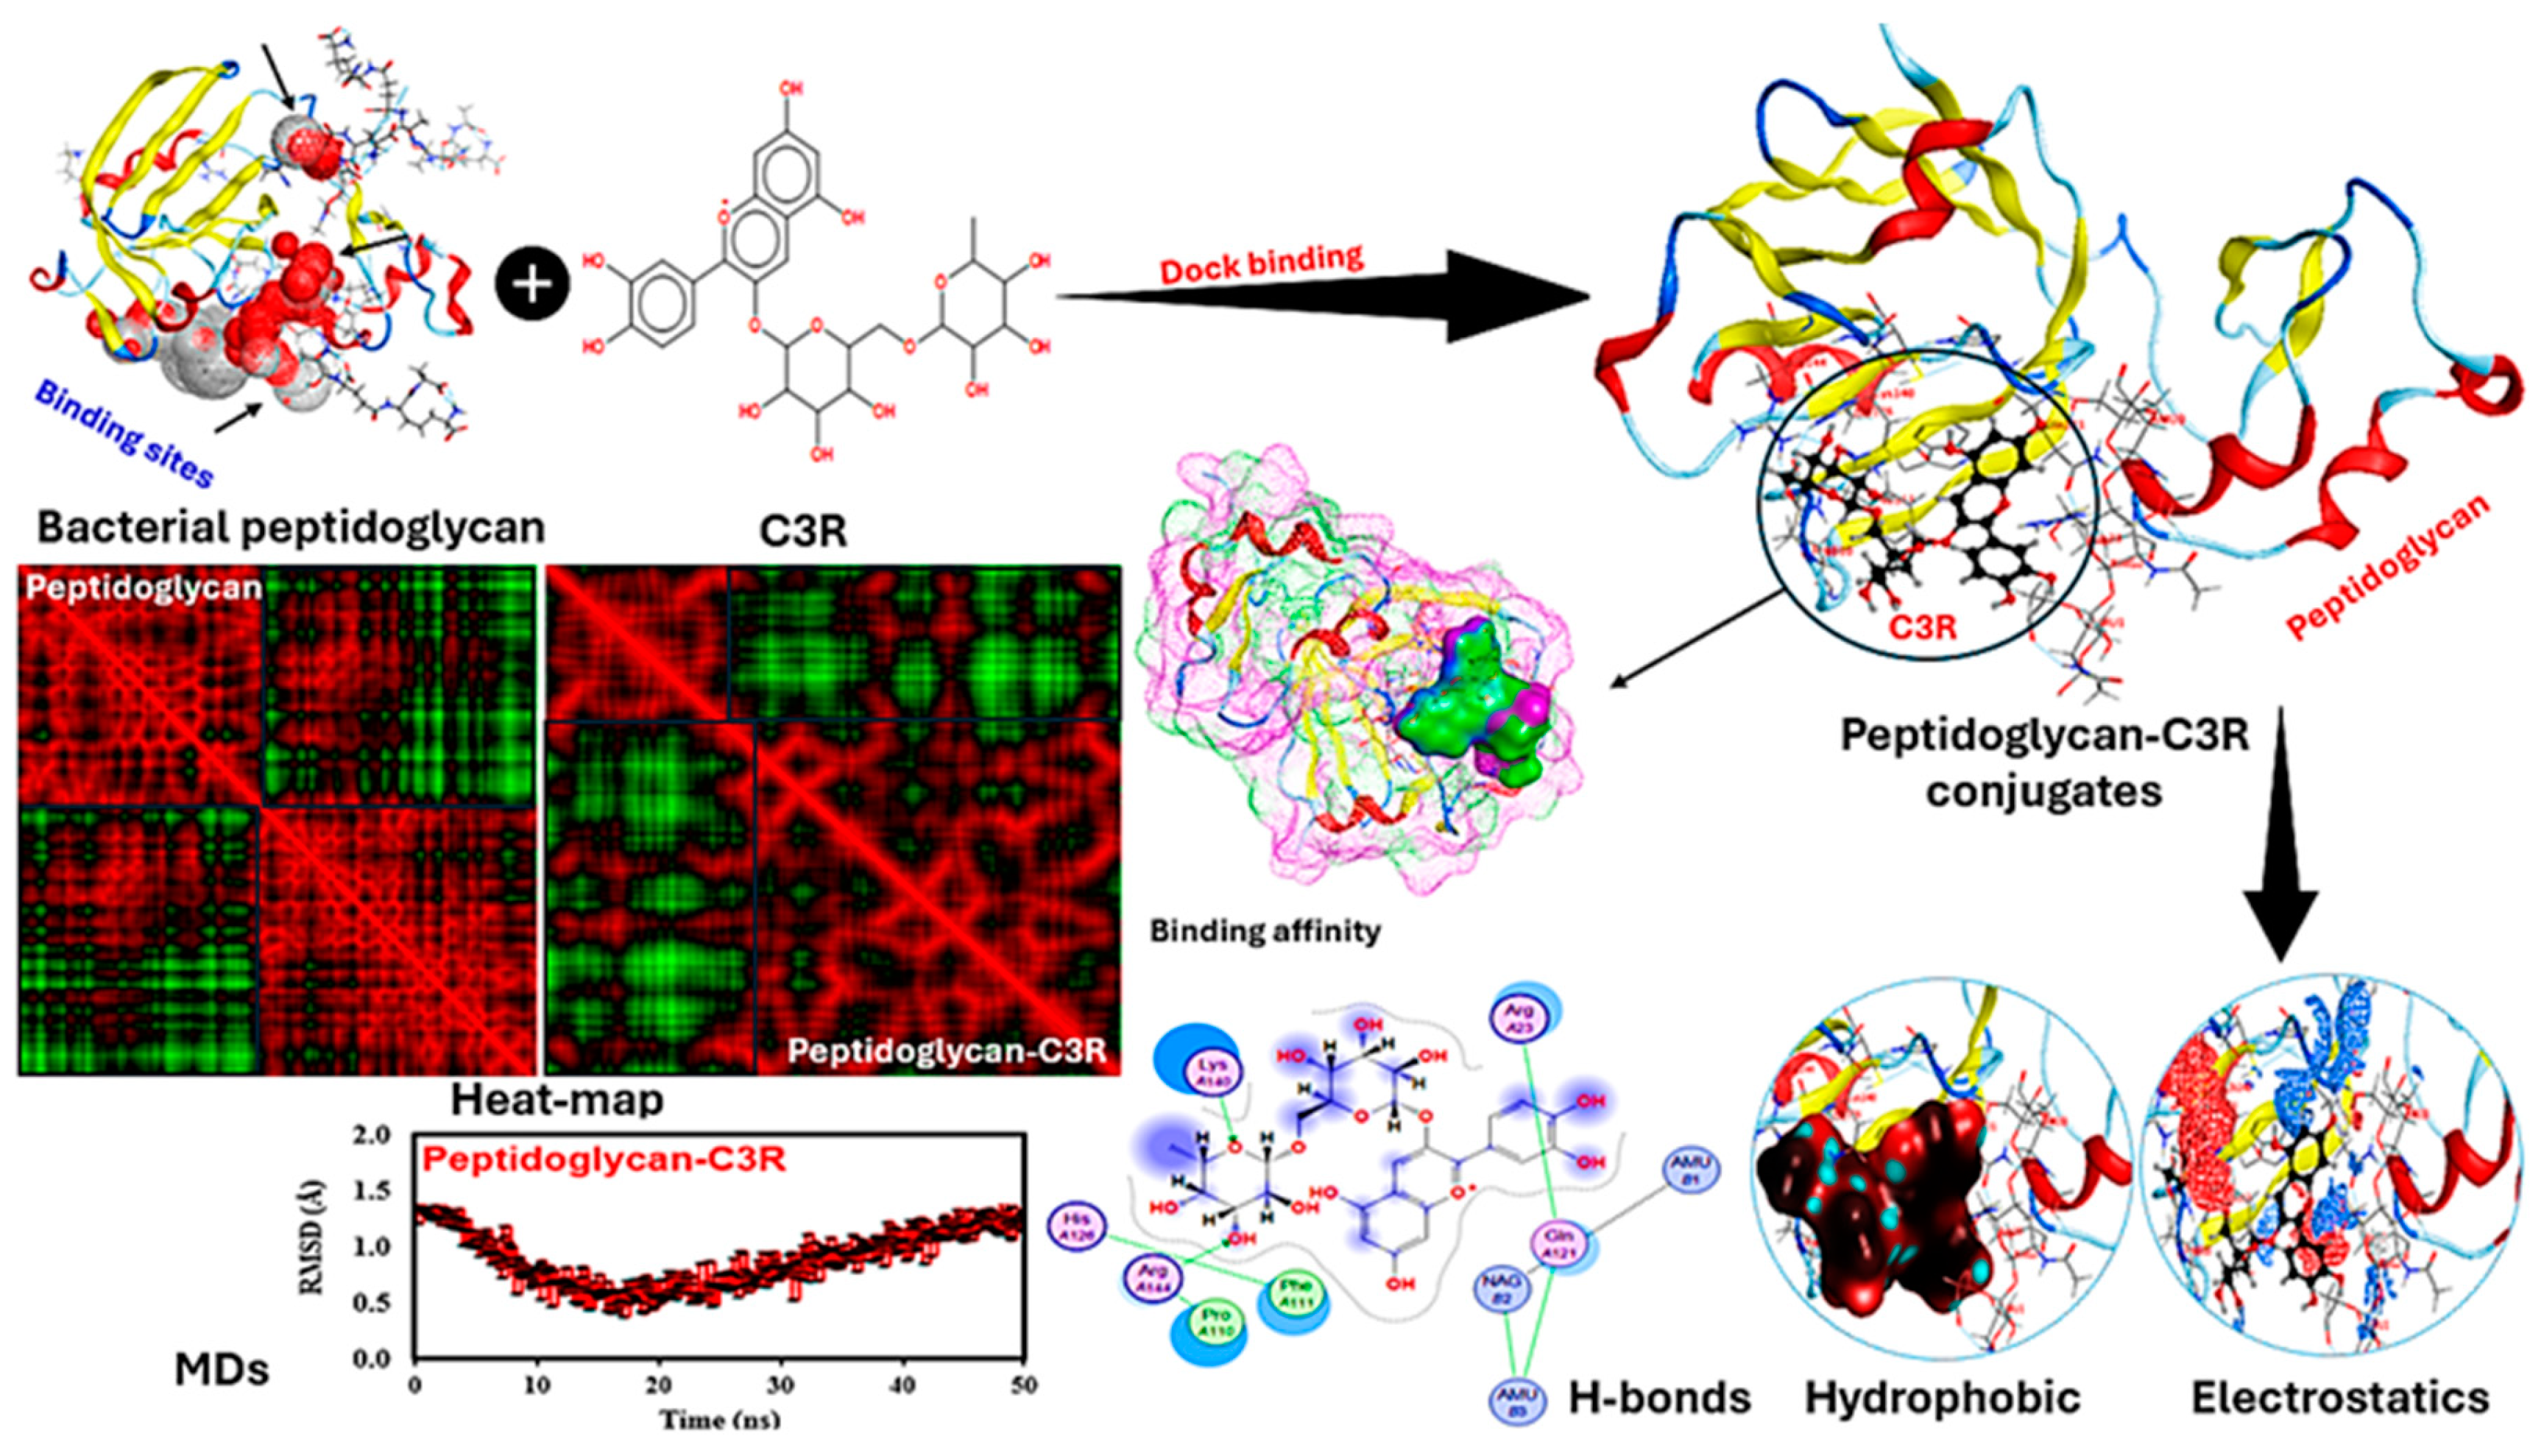
Figure 8.
Pearson correlation and Principal component analysis. *, **, and *** are the significant levels of 0.05, 0.01, and 0.001, orderly.
Figure 8.
Pearson correlation and Principal component analysis. *, **, and *** are the significant levels of 0.05, 0.01, and 0.001, orderly.
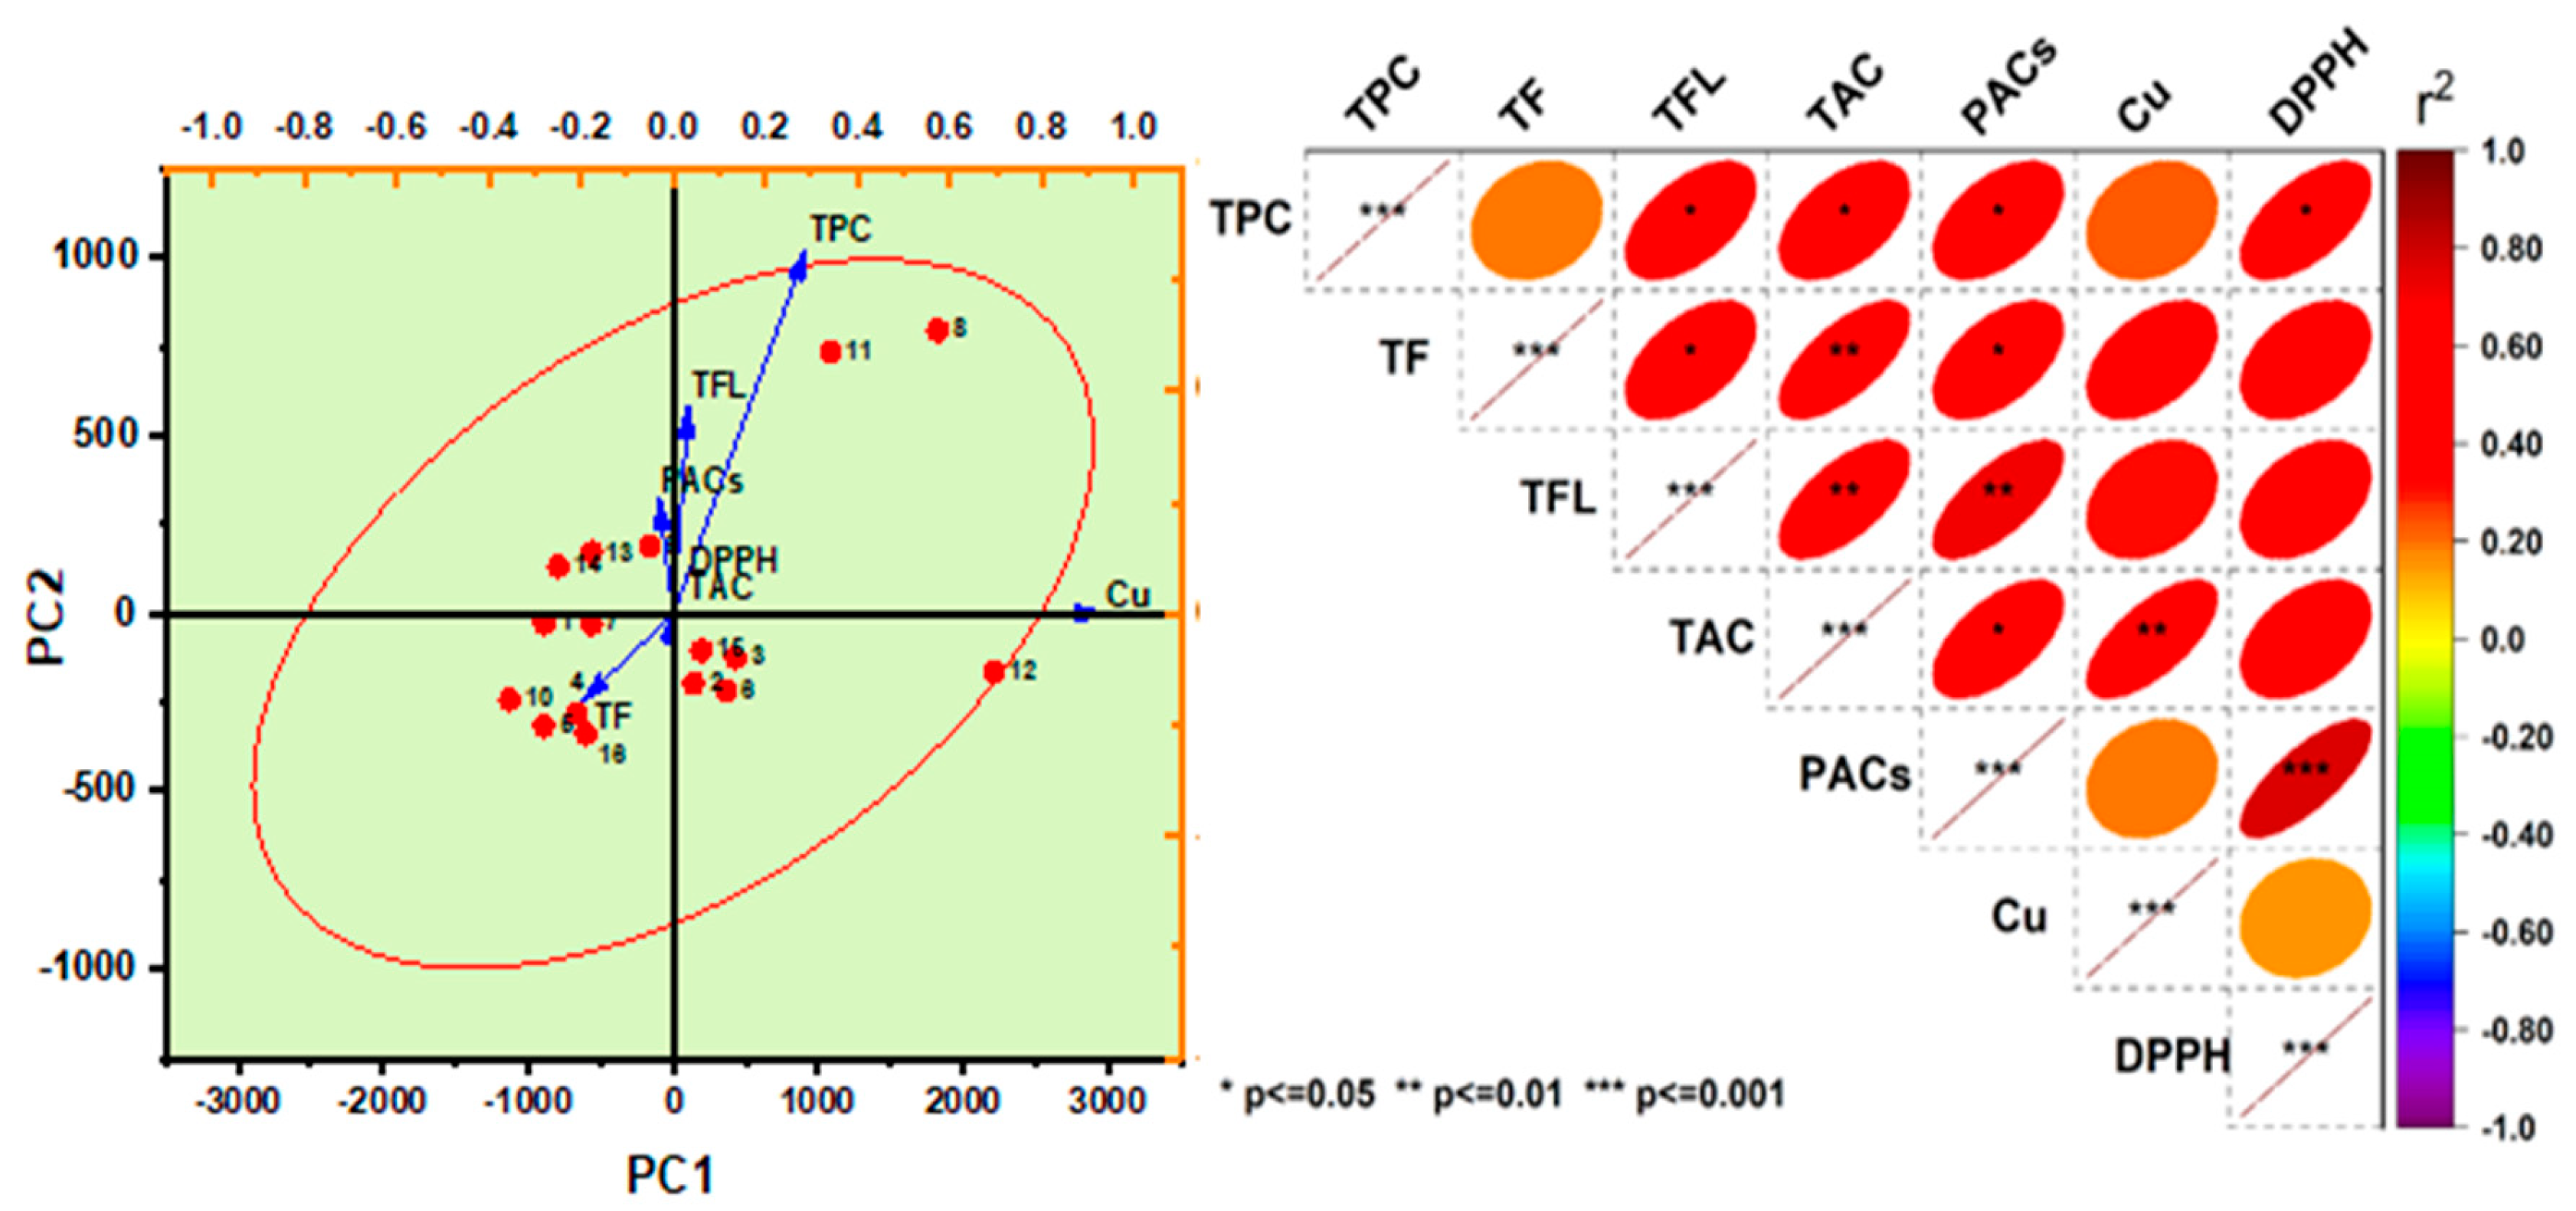

Table 1.
shows the number of fermentation treatments of with mono and co-culture of different lactic acid bacteria.
Table 1.
shows the number of fermentation treatments of with mono and co-culture of different lactic acid bacteria.
| No. | Treatment | L. casei | L. plantarum | L. paracasei | L. helveticus | L. acidophilus |
|---|---|---|---|---|---|---|
| 1 | C | - | - | - | - | - |
| 2 | LC | 20 mL | - | - | - | - |
| 3 | LP | - | 20 mL | - | - | - |
| 4 | LPC | - | - | 20 mL | - | - |
| 5 | LA | - | - | - | - | 20 mL |
| 6 | LA | - | - | - | 20 mL | |
| 7 | LC-LP | 10 mL | 10mL | - | - | - |
| 8 | LC-LPC | 10 mL | - | 10 mL | - | - |
| 9 | LC-LA | 10 mL | - | - | - | 10 mL |
| 10 | LC-LH | 10 mL | - | - | 10 mL | - |
| 11 | LP-LPC | - | 10 mL | 10 mL | - | - |
| 12 | LP-LA | - | 10 mL | - | - | 10 mL |
| 13 | LP-LH | - | 10 mL | - | 10 mL | - |
| 14 | LPC-LA | - | - | 10 mL | - | 10 mL |
| 15 | LPC-LH | - | - | 10 mL | 10 mL | - |
| 16 | LA-LH | - | - | - | 10 mL | mL |
1.C-Control; 2. LC-Lactobacillus casei; 3. LP-Lactobacillus plantarum; 4. LPC-Lactobacillus paracasei; 5. LA-Lactobacillus acidophilus 6. LH-Lactobacillus helveticus 7. LC-LP Lactobacillus casei-Lactobacillus plantarum; 8. LC-LPC Lactobacillus casei- Lactobacillus paracasei; 9. LC-LA Lactobacillus casei- Lactobacillus acidophilus ; 10. LC-LH Lactobacillus casei- Lactobacillus helveticus; 11. LP-LPC Lactobacillus plantarum- Lactobacillus paracasei; 12. LP-LA Lactobacillus plantarum-Lactobacillus acidophilus;;13. LP-LH Lactobacillus plantarum-Lactobacillus helveticus; 14. LPC-LA Lactobacillus paracasei- Lactobacillus acidophilus;15. LPC-LH Lactobacillus paracasei - Lactobacillus helveticus ;16. LA-LH Lactobacillus acidophilus - Lactobacillus helveticus. Note: These respective values are for 1000 mL mulberry juice.
Disclaimer/Publisher’s Note: The statements, opinions and data contained in all publications are solely those of the individual author(s) and contributor(s) and not of MDPI and/or the editor(s). MDPI and/or the editor(s) disclaim responsibility for any injury to people or property resulting from any ideas, methods, instructions or products referred to in the content. |
© 2024 by the authors. Licensee MDPI, Basel, Switzerland. This article is an open access article distributed under the terms and conditions of the Creative Commons Attribution (CC BY) license (http://creativecommons.org/licenses/by/4.0/).
Copyright: This open access article is published under a Creative Commons CC BY 4.0 license, which permit the free download, distribution, and reuse, provided that the author and preprint are cited in any reuse.


