Submitted:
21 July 2024
Posted:
22 July 2024
You are already at the latest version
Abstract
The Antarctic photopsychrophile, Chlamydomonas priscuii UWO241 is adapted to extreme environmental conditions, including permanent low temperatures, high salt and shade. During long-term exposure to this extreme habitat, UWO241 appears to have lost several short-term mechanisms in favor of constitutive protection against environmental stress. This study investigated physiological and growth responses of UWO241 to high light conditions, evaluating the impacts of long-term acclimation to high light, low temperature, and high salinity on its ability to manage short-term photoinhibition. We found that UWO241 significantly increased its growth rate and photosynthetic activity at growth irradiances far exceeding native light conditions. Furthermore, UWO241 exhibited robust protection against short-term photoinhibition, particularly in photosystem I. Last, pre-acclimation to high light or low temperatures, but not high salinity, enhanced photoinhibition tolerance. These findings extend our understanding for stress tolerance in extremophilic algae. In the past 2 decades climate change-related increasing glacial stream flow has perturbed long-term stable conditions: in the form of has been associated with lake level rise, thinning of ice covers, and expansion of ice-free perimeters. Our findings have implications on phytoplankton survival and response to change scenarios in the light-limited environment of Antarctic ice-covered lakes.
Keywords:
photoinhibition
; photo-acclimation
; extremophile
; cyclic electron flow
; environmental change
1. Introduction
Most photosynthetic organisms encounter marked light fluctuations, ranging from insufficient to excessive, occurring over broad timescales. Short-term fluctuations (eg. minutes to hours) in irradiance can result in variations by up to one thousand times the daily average irradiance, representing an acute stressor [1]. Under optimal light intensities photosynthetic organisms balance photosynthetic energy production with metabolic needs; however, light levels which exceed energy consumption rates by downstream metabolism can cause photooxidative damage to components of the photosynthetic electron transport chain [2,3]. Moreover, light requirements for photosynthesis are significantly altered in the presence of environmental stressors, such as heat, chilling, nutrient deprivation, and salinity [4].
Photooxidative stress generates reactive oxygen molecules (ROS) that can damage various proteins of the photosynthetic electron transport chain, with photosystem II (PSII) being the primary target, leading to a reduction in electron flux capacity [5,6]. Specifically, D1 and D2 reaction center proteins have several amino acid targets which are modified by the ROS hydroxyl radicals (HO·) and superoxide anions (O2·-) [7,8]. Accordingly, plants and algae have evolved an efficient repair system to rapidly replace damaged PSII centers [9]. A vast body of knowledge has been generated on PSII photodamage and repair. On the other hand, photosystem I (PSI) is generally considered to be more stable compared to PSII; however, PSI appears to be very sensitive to oxidative damage under specific environmental conditions (e.g. low temperature, fluctuating light, drought) [6,10,11,12,13]. Thus, PSI damage can contribute to losses in photosynthetic efficiency photochemistry, particularly under stress conditions [14]. For example, several chilling sensitive crop species exhibit irreversible PSI damage under low temperature/mediate light, a typical condition during winter and spring. PSI damage is also fundamentally different from that of PSII: it involves destruction of the iron-sulfur centers, followed by destruction of other electron acceptors [15]. Therefore, there isn’t an efficient PSI repair cycle and PSI photoinhibition results in slower recovery and higher energy costs [16].
Efficient photosynthesis requires photostasis, or balance between light absorption and turnover of ATP and NADPH via metabolic processes. Plants and algae have evolved numerous strategies to mediate potential imbalances in light absorption and utilization during exposure to high light intensities, fluctuating light, or additional environmental stress conditions which influence light utilization. These mechanisms include reduced light harvesting, state transitions, non-photochemical quenching (NPQ), and PSI cyclic electron flow (CEF) [2,11,17,18]. Collectively known as photoprotective mechanisms, these strategies may be induced across different timescales to mediate damage or rebalance energy production to energy needs.
While excess light is a stressor for all photosynthetic organisms, the intensity of light that induces stress is highly variable between organisms and is largely dependent on the native light environment [19]. Additionally, pre-acclimation to certain environmental conditions can impact an organism’s tolerance and response to photoinhibition [6,20,21,22,23]. For example, combined low temperature and high light stress can cause enhanced photoinhibition of PSII and PSI; however, pre-acclimation to low temperature prior to short-term high light exposure confers increased resistance to high light stress [6,21]. This resistance to photoinhibition can be further enhanced by acclimation to low temperature and high light [22]. On the other hand, acclimation to some stressors appears to exacerbate high light sensitivity: high salt stress can increase photoinhibition by impairing the D1 repair cycle [20,23]. While extensive research has been conducted on model organisms to understand the impact of light stress, there is growing interest in how organisms with high tolerance to permanent environmental stressors mediate their stress response [24]. Exploring the physiological diversity of a larger range of photosynthetic organisms may uncover novel approaches for improving stress resistance in crop species. Thus, work characterizing these “non-model organisms” and their response to photoinhibition could provide greater insights into how robust photosynthesis can be maintained in suboptimal or even extreme conditions.
Chlamydomonas priscuii (formerly Chlamydomonas sp. UWO241; hereafter UWO241) is an extremophilic alga isolated from Lake Bonney in the McMurdo Dry Valleys, Antarctica. Lake Bonney has a permanent ice cover (3 – 5 m thick) that results in a perennially stratified water column characterized by steep gradients in nutrient and ion chemistry, temperature, and light [25]. Within this unique habitat, UWO241 has been isolated under permanent low temperature, high salt, and extreme shade [4]. Both low temperature and high salt stress induce oxidative stress; conversely, low light would be associated with lower oxidative stress, but also limits photosynthetic activity [26]. Moreover, Lake Bonney is experiencing climate-related change, driven by summer glacial melt, which could lead to complex changes in the light, nutrients and salinity environment experienced by the phytoplankton communities.
For over three decades, UWO241 has been the subject of intensive research interest due to its unique structural and functional features within its photochemical apparatus, which enable its survival in such an extreme environment [4,27,28]. Specifically, UWO241 exhibits constitutively high rates of CEF which is supported by the formation of a PSI-Cyt b6f supercomplex and can support increased ATP production under salt stress [29,30]. UWO241 also lacks capacity for the short-term mechanism of state transitions despite the presence of Stt7 and Stl1 kinases [31,32]. Recently, Stahl-Rommel et al. [33] reported that NPQ, CEF and the ascorbate glutathione cycle contribute to the ability of UWO241 to grow under low temperatures, high salt, and high light. These findings are also supported by previous reports that UWO241 employs CEF and NPQ as long-term protective strategies [4,30,34]. The reliance on CEF for long-term stress acclimation is distinct from other model algae and higher plants, which typically activate these mechanisms in response to short-term high light stress [35,36]. Overall, research so far suggest that UWO241 has forgone a broader range of photoprotective mechanisms in favor of increased capacity of a few key mechanisms. While photoprotective mechanisms which are constitutively “on” is a benefit under a climate regime favoring extreme, stable conditions of Lake Bonney, reduced physiological flexibility could limit the organism’s ability to respond to future scenarios of environmental variation.
UWO241 represents a key phytoplankton taxon in the dry valley lake food web, as well as a resource for understanding stress-adapted photosynthesis. The majority of previous literature on UWO241 has focused on implications of its tolerance for low temperature [32,34,37,38] or high salinity [30,39]. Climate change-associated thinning ice-covers and increasing ice-free lake perimeter will shift the light environment to higher and more variable summer irradiance regimes [40]. Moreover, these changes in light environment will be associated with variability in other conditions, including temperature and salinity. Here, we evaluated the implications of long-term high light acclimation on growth and photochemical function of UWO241 as well as the impact of adaptation and acclimation to low temperature, high salt or high light on the short-term high light stress response. Notably, we found that UWO241 shows an increased growth rate and concomitant increased O2 evolution under high light conditions. We also showed that not only does UWO241 retain the ability to mediate short-term high light stress, but it is highly resistant to PSI photoinhibition. Additionally, acclimation to high growth light and low temperature confer increased resistance to PSII photoinhibition during short-term high light stress whereas high salt increased photoinhibition. Thus, adaptation of UWO241 to extreme conditions has implications on its ability to tolerate short-term photoinhibition as well as survival under climate-driven variability in temperature and salinity.
2. Results
2.1. Growth Patterns under High Light Conditions
To determine how increased light availability would impact the growth kinetics of UWO241 we monitored its growth under control (50 μmol m-2 s-1) and high light conditions (250 μmol m-2 s-1). These light conditions were chosen to represent typical native light conditions under the ice versus light levels in the ice-free, open-water perimeter moats which form at the perimeters of the Antarctic lakes during the late summer, respectively (Figure A1; 34). When compared with low light growth conditions, UWO241 grown under high light conditions exhibited a lag phase of one day shorter and a 1.2-fold increase in growth rate (Figure 1A, Table 1). While the high light-grown cultures also had a lower total chlorophyll concentration (Table 1, p<0.0005), there was no significant change in chlorophyll a/b ratio between high light vs. control cultures (Table 1, p=0.25). Maximum photochemical efficiency (FV/FM) was reduced by 1.40-fold in the high light versus control cultures.
Photosynthetic activity was probed with oxygen evolution and photosynthetic irradiance curves. Under high light there was a 4.5-fold increase in the maximum rate of oxygen evolution relative to that of the control (Figure 1B, p<0.0005). A similar trend was seen in the respiration rate, with a 6.0-fold increase in rates seen in response to the higher growth light (Figure 1B, p<0.0005).
Rapid light curves revealed distinct saturation characteristics for both PSII and PSI in high light- versus control-grown cultures of UWO241. Compared to control conditions, high light-grown cultures exhibited moderately lower values of [Y(II)], which reflected a reduction of the energy fraction used for PSII photochemistry. This trend was coupled with an increase in the quantum yield of regulated energy dissipation, Y(NPQ). On the other hand, non-regulated energy dissipation, [Y(NO)], remained relatively constant across all light intensities (Figure 2A,B).
The quantum yield of PSI [Y(I)] revealed that control-grown cultures exhibited higher PSI sensitivity to increasing light intensities. Under excess light, the minimum value for Y(I) was lower in control (18%) vs. high light-grown (26%) cultures. Lower Y(I) values in the control cultures were associated with both donor and acceptor-side limitation [Y(ND) and Y(NA), respectively], with both parameters reaching 60% at excess light levels (Figure 2C,D). In contrast, high light-grown cultures exhibited a maximum Y(ND) of 40% and minimal changes in Y(NA) over the light curves (Figure 2D).
2.2. Impact of Short-Term High Light on PSI and PSII
While the native habitat of UWO241 is one of permanent shade, the light environment of Lake Bonney is undergoing change and in the future phytoplankton communities may be exposed to ice-free/full sunlight. An earlier study reported that while UWO241 is sensitive to short-term high light, it exhibited a surprising capacity for recovery of PSII following photoinhibition treatment [45]. Here we extended these findings to probe the consequences of short-term high light stress on both PSII and PSI. Given the complex combination environmental factors experienced by UWO241 in its native environment, we also tested its tolerance to high light following pre-acclimation to long-term stress (low temperature, high light or high salt). Specifically, UWO241 was grown under long-term stress conditions of low temperature (LT; 2˚C), high salt (HS; 700mM), or high light (HL; 250 μmol*m−2 *s−1) growth conditions. Last, we compared photoinhibition responses between UWO241 and the model alga, C. reinhardtii.
Prior to the photoinhibition assays, we compared abundances of three major photosynthetic proteins between UWO241 grown under non-stressed/control conditions (CT) and C. reinhardtii (CR). Relative abundance of PSI and PSII core proteins (PsaA and PsbA) and light harvesting complex (Lhcbm5) for all conditions were compared prior to the short-term stress (Figure 3A). Western blots showed CT UWO241 cells had comparable levels of the PSII core and light harvesting protein, PsbA and Lhcbm5, respectively, as C. reinhardtii; however, UWO241 exhibited 1.3-fold lower levels of the PSI core protein, PsaA compared with control-grown cells of C. reinhardtii (Figure 3C; p=0.002).
Abundance of PsbA, PsaA and LhcM5 were also evaluated in UWO241 cultures grown under control conditions versus long-term stress (low temperature, high salt, high light) (Figure 3B). Relative to control conditions, abundance of all three proteins was lower in UWO241 when acclimated to all three stress conditions; however, only low temperature or high salt was significantly different from control (p<0.001, p=0.034, respectively).
For photoinhibition assays, control-grown cultures from UWO241 and C. reinhardtii as well as UWO241 grown under various long-term stress conditions were exposed to short-term high light stress of 1000 μmol m−2 s−1/8˚C. Results were expressed as relative change in either FV/FM (representing PSII capacity) or ΔA820 (representing PSI capacity) after 120 mins of photoinhibition, followed by 90 mins or recovery at growth conditions (Figure 4). The choice of treatment conditions was determined based on previous study [41]. C. reinhardtii and UWO241 grown under control conditions exhibited similar trends in high light-induced 31 and 52% loss in PSII capacity, respectively, followed by full recovery (Figure 4A). Pre-acclimation of UWO241 to either low temperature or high light eliminated the photoinhibitory-induced reduction in FV/FM. However, high salt-acclimated cells exhibited increased sensitivity of PSII capacity and failed to fully recover following photoinhibition treatment (Figure 4).
In contrast with PSII, C. reinhardtii exhibited higher sensitivity of PSI in response to photoinhibition, compared to UWO241. C. reinhardtii exhibited a 30% reduction in PSI capacity which did not recover (Figure 4B). In contrast, control-grown UWO241 exhibited a 20% increase in PSI capacity in response to the photoinhibition treatment, which was maintained through the recovery period. Pre-acclimation to stress conditions generally did not affect the PSI response of UWO241. One exception was that similar to control-grown cells, high light-grown cultures also showed an increase in PSI activity during the recovery period (p=0.003).
While the results of Figure 4 showed that UWO241 has a robust response to short term high light at the level of both PSII and PSI capacity, other PSII parameters exhibited high sensitivity to high light stress (Figure 5). PSII redox state (qL) and quantum yield of PSI (ΦPSII) exhibited significant reductions after only 30 mins exposure to 300 μmol m−2 s−1 (Figure 5). Loss in ΦPSII was accompanied by an increase in ΦNPQ. Moreover, full recovery of FV/FM after exposure to short-term high light (Figure 4A), no relaxation of qL was observed after 2 hr recovery, suggesting that the PQ pool remained over reduced after short-term high light treatment. This result was also accompanied by persistence of low ΦPSII, indicating PSII remained downregulated. Similarly, ΦNPQ remained relatively high (Figure 5B).
Re-reduction rates of P700 were monitored as an estimate of PSI-driven cyclic electron flow (ie. CEF) in response to photoinhibition exhibited strain- and treatment-specific trends. Overall UWO241 exhibited significantly faster P700 re-reduction rates, ie. higher CEF, compared with C. reinhardtii. In response to photoinhibitory treatment, control-grown C. reinhardtii responded with a modest (0.23-fold) increase in CEF (Figure 6). All cultures of UWO241 maintained relatively high CEF throughout the treatment. High salt grown UWO241 initially had lower rates of CEF than any other growth condition but reached comparable rates after 30 minutes of stress.
2.3. ROS Levels and Response to Chemical Oxidants
A recent paper reported on the capacity of UWO241 for maintaining low ROS levels through relatively high activity of the glutathione-ascorbate pathway [33]. We monitored levels of H2O2 as a proxy for ROS during short-term photoinhibition. C. reinhardtii and UWO241 were exposed to high light (1000 μmol m-2 s-1) for 45 and 120 minutes. While both strains exhibited an increase in H2O2 in response to high light stress, C. reinhardtii showed a significantly higher rise in ROS. UWO241 cultures grown under either HS or HL exhibited no significant change in ROS (Figure 7A).
Since UWO241 exhibited a relatively high capacity to maintain low ROS (Figure 7A), sensitivity to exogenously supplied ROS was tested in the presence of chemical oxidants using an agar plate assay (Figure 7B). UWO241 sensitivity was tested in the presence of H2O2, singlet oxygen (Rose Bengal), and superoxide (Methyl Viologen). UWO241 exhibited resistance to exogenous H2O2 to all tested concentrations <500 mM H2O2. On the other hand, cells exhibited higher sensitivity to both Rose Bengal and Methyl Viologen (Figure 7B).
3. Discussion
Early literature often referred to C. priscuii UWO241 as an extremophilic alga adapted to “extreme shade” [42,43]. There was also evidence of a lack of physiological plasticity in the alga, including a requirement for low temperatures, an inability to grow in red light [44], and loss a classic short-term acclimation mechanism, state transitions [31]. Our findings support earlier reports that UWO241 can grow at light levels far greater than native conditions under the permanent ice [4]. In addition, our study agrees with Pocock et al. [45] that UWO241 possesses some capacity for tolerating short-term excessive light levels; however, the response to photoinhibition of PSII is nuanced.
UWO241 exhibited a modest increase in growth rate under high (250 μmol m-2 s-1) relative to control (50 μmol m-2 s-1) irradiance conditions. On the other hand, rates of O2 evolution increased substantially (400%) in high light-grown cultures. It is likely that other processes contributed to the high O2 production, such as the water-water cycle or chlororespiration. Stahl-Rommel et al. [33] reported that UWO241 has a highly active ascorbate cycle. In addition, HL-grown cultures showed evidence of downregulation of PSII: FV/FM was lower and Y(II) declined faster in the rapid light curves (Table 1; Figure 2). UWO241 shows no change in chl a:b ratio in response to high growth light, but rather decreases total chlorophyll levels, ultimately, decreasing in the number of reaction centers rather than adjust antennae size to regulate light harvesting capacity. This is supported by western blot analysis of PsbA and PsaA which showed lower concentrations of all proteins in the high light acclimated cultures relative to control conditions (Figure 3). Typically, adjusting the light harvesting capacity via antennae size regulation is seen as a hallmark component of long-term high light acclimation [46]. However, our results agree with previous studies that UWO241 maintains a consistently low chla:b ratio under a various stressors including differing light quality, high salinity and low temperature [33,47].
UWO241 relies mainly on constitutive protection strategies during short-term high light stress. PSII photoinhibition of the control grown cultures showed comparable rates of photoinhibition and recovery of FV/FM to C. reinhardtii. On the other hand, Y(II) remained low during the recovery period after photoinhibition (Figure 5). This suggests that while primary PSII photochemistry may have recovered, there is a nuanced response to photoinhibition within the photosynthetic electron transport chain. Persistent NPQ suggests that UWO241 maintained long-term energy dissipation capacity in the absence of high light stress. This is supported by the inability of qL to relax, suggesting ongoing issues with the electron transport chain or downstream metabolism. It is also notable that CEF rates did not relax during the recovery phase in any of the treatments (Figure 6). Together these results indicate that while UWO241 may have a capacity to protect PSII photochemistry, the photosynthetic electron transport chain is very slow to recover from short-term high light. This has implications for future ice-free scenarios in the Antarctic lakes.
Pre-acclimated of UWO241 to some stressors conferred additional photoprotection under short-term high light stress. Growth under low temperature or high light resulted in full protection of PSII photochemistry (ie. FV/FM) to photoinhibition. These data suggest that similar to other model species, long-term acclimation enhances high light tolerance in UWO241. In contrast, cells pre-acclimated to high salt exhibited higher sensitivity to photoinhibition and incomplete recovery of FV/FM. Our high salt condition matches the native salt levels within the deep photic zone of Lake Bonney where light levels are extremely. Pocock suggested that a rapid D1 repair cycle is critical to the photoinhibition response of UWO241 [45]. In this study, we also observed rapid recovery of PSII capacity apart from the high salt condition. High salt stress has been shown to impair the D1 repair cycle [20]. This suggests that elevated PSII photoinhibition seen high salt-acclimated cultures could be due to lack of repair rather than increased rates of PSII photodamage. Thus, a combined high light/high salt condition within its native habitat represents an additional stressful environment which UWO241 is not well equipped to deal with.
PSI function appears to be especially robust in UWO241. First, HL-grown UWO241 exhibited increased capacity for avoiding donor or acceptor-side limitation (Figure 2). In addition, unlike C. reinhardtii, UWO241 exhibited little to no PSI photoinhibition despite the combined low temperature and high light conditions. While PSII is the primary target of photoinhibition, combined low temperature and high light stress has been shown to induce PSI photoinhibition in cold sensitive and tolerant plants [6,21]. However, acclimation to high excitation pressure, such as the low temperature UWO241 experience in its native environment, can prime against PSI photoinhibition [21]. Pre-acclimation of UWO241 to low temperature, high light, or salt did not impact PSI activity in response to the short-term light stress. A robust PSI would be an asset in its native habitat where environmental conditions such as low temperatures and high salinity would put PSI at high risk of oxidative damage.
UWO241 exhibits two potential strategies in its photoinhibition response that could contribute to PSI photoprotection: both involve tight regulation of ROS production and/or detoxification. While C. reinhardtii showed a rise in H2O2 during exposure to short-term light stress, under all conditions UWO241 maintained very low H2O2 in response to the stress. H2O2 is produced in the thylakoid membrane via disproportionation of O2·-at PSI [48,49]. This H2O2 can then be reduced to H2O via the ascorbate glutathione cycle. Accordingly UWO241 has been shown to exhibit a highly active ascorbate glutathione cycle [33] which likely facilitates this ROS control.
CEF may also play a role in its resistance to PSI photoinhibition by alleviating both donor and acceptor-side limitation, and preventing ROS production. UWO241 exhibits constitutively high rates of CEF under low temperature, high salt and high light (Figure 4; [4,30,33]). In contrast with C. reinhardtii, CEF was not stimulated in response to short-term high light stress in UWO241, with the exception of cultures acclimated to low temperatures. Under stress, CEF can help to alleviate PSI acceptor side limitations while also contributing to pmf to drive NPQ or increase ATP production [50,51,52]. Recent studies in plants have shown that under both low temperature and high light stress, CEF tends to support photoprotection rather than energy generation [53,54]. Alternatively, UWO241 utilizes high CEF for ATP production under high salt stress [30]. This differential functioning of CEF could also contribute to the opposing influences of preacclimation to low temperature and high light versus high salt.
Our study extends the understanding of the advantages and tradeoffs of adaptation to permanent, extreme stress experienced by the photopsychrophile UWO241. UWO241 exhibits tolerance to both short- and long-term light levels which far exceed its native habitat light environment. These results suggest that the organism has some ability to respond to and survive climate-related changes to its light environment, including thinning ice and even ice-free conditions. However, there is also evidence of photoprotection of PSII and PSI photochemistry, high light does have a signficant impact on additional photosynthetic electron transport processes which are as yet not fully understood. Furthermore, other stressors, such as high salt, are modulators of this organism’s capacity for light tolerance.
4. Materials and Methods
4.1. Growth and Stress Conditions
Chlamydomonas priscuii (CCMP1619; formerly called Chlamydomonas sp. UWO241) and Chlamydomonas reinhardtii (UTEX89) cultures were grown in Bold’s Basal Media (BBM) in 250 mL glass Pyrex tubes, which were suspended in temperature-controlled aquaria, with filtered air bubbled into the tubes by aquarium pumps with a 24hr light cycle [55]. The light, temperature and salt regimes are outlined in Table 2. The high light represents the maximum light intensity experienced in the Lake Bonney water column (Figure A1) and the maximum irradiance under which UWO241 can grow [4]. Three biological replicates of each condition were grown for all experiments conducted. Culture density was measured at a wavelength of 750 nm (OD750) using a spectrophotometer (UV-1700 PharmaSpec, Shimadzu) and cell counts were monitored using an automated cell counter (Countess 3 FL, ThermoFisher).
For the short-term stress experiments, cultures were grown to mid-log phase determined by an OD750 between 0.7-1. The tubes were then transferred to a tank with a temperature-controlled aquaria with a temperature/light treatment of 8℃/1000 μmol* m−2*s−1 for 120 minutes to induce light stress. Light was supplied by full spectrum LED lights. After treatment cultures were returned to growth conditions to recover for 90 minutes.
To monitor the recovery of PSII photochemistry, mid-log phase cultures of UWO241 were exposed to short-term stress (300 µmol*m-2*s-1) for 60 mins, then allowed to recover from the stress for 2 hours. PSII redox state (qL) and energy partitioning (ΦPSII, ΦNPQ and ΦNO) were measured at regular time intervals using Chl a fluorescence.
4.2. Oxygen Evolution
Oxygen evolution was measured using the Clark-type oxygen electrode (Hansatech Instruments Ltd., UK). 2mL culture was dark adapted on ice for 5 minutes on ice with 10mM NaHCO3. Oxygen evolution was monitored for 2-3 minutes under saturating light conditions. The light was then turned off to measure respiration rates. All measurements were done at 8°C. The rate of oxygen evolution and respiration were calculated using a linear fit of 1 minute of activity and standardized to chlorophyll content.
4.3. Chlorophyll Determination
Chlorophyll concentration was calculated using the method described in Jeffrey and Humphrey [56]. Chlorophyll was extracted in 90% v/v acetone and broken via beadbeating (Biospec Inc.) with zirconia/silica beads (0.1 mm). Beadbeating was done in two 45 second cycles. Cells were iced between cycles to prevent overheating. Absorbance at 647nm and 664nm was measured to calculate chlorophyll a and b concentrations.
4.4. Western Blotting
Mid-log cultures were collected and spun down at 3200xg for 10 minutes. Thylakoids were isolated as described in [55]. All buffers contained 1mM benzamidine and 1mM caproic acid which was added immediately prior to use. Isolated thylakoids were flash frozen and stored at -80˚C until use.
SDS-PAGE was done using the Bio-Rad Mini-Protean system. Samples were loaded on an equal 6µg protein basis and run on a 12% (w/v) stacking gel containing 6M urea and 5% (w/v) stacking gel as described in [31]. The SDS_PAGE gels were transferred electrophoretically to nitrocellulose membranes on ice for 2 hours at 80V. membranes were blocked overnight at 5˚C in 20mM Tris buffer containing 15mM NaCl, 10% (w/v) powdered milk, and 0.05% (v/v) Tween 20. The membranes were then probed with PsbA, PsaA, or Lhcbm5 antibodies (Agrisera) followed by an anti-rabbit antibody conjugated to horseradish peroxidase enzyme. A chemiluminescent ECL-HRP system was used and blots were scanned using a Chemidoc imager (ChemiDoc MP, Biorad). Densitometry was performed using ImageJ software.
4.5. Room Temperature Fluorescence
All fluorescence measurements were done using a Dual-PAM-100 (Heinz Walz GmbH, Effeltrich, Germany). For PSII fluorescence measurements, 2 mL liquid culture were dark adapted for 2 minutes under far red light and supplemented with 10mM NaHCO3. Samples for PSI fluorescence were dark adapted for 10 minutes before being filtered onto a 25 mm GF/C filter (Whatman) and placed in the leaf attachment.
Photosynthetic Light Curves measuring PSI and PSII quenching parameters in control or high light grown cultures were monitored at increments of PAR from 0-830 μmol m⁻²s⁻¹.
PSII capacity was measured as FV/FM and monitored using the induction curve setting as described in [34]. All measurements were performed under temperature and light conditions equivalent to growth conditions. FV/FM measurements were taken at time 0 and every 10 minutes for the first 30 minutes of light stress and then every 30 minutes for the remainder of the treatment. The same process and time points were repeated throughout the recovery period.
4.6. P700 Measurements
P700 absorbance measurements were taken using the leaf attachment of the PAM-fluorometer to determine PSI activity and CEF rate. 10mL of culture were treated with 10μM DCMU to inhibit PSII activity, and dark adapted for 10 minutes. A volume equivalent to 5 OD750 was filtered onto a 25mm GF/C filter (Whatman). Actinic red light was used to measure absorbance changes at 820nm as outlined in [31]. ΔA820 was used as a measure of PSI activity. CEF rate was calculated as the re-reduction half time (t1/2) of P700 using Microcal Origin Software (Microcal Software) as described in [21]. PSI measurements were taken every 30 minutes throughout the treatment and recovery periods.
4.7. ROS Determination
Relative H2O2 concentrations were measured following the method described in [33]. Pelleted cells were resuspended in 10mM TRIS-HCl pH=7.3, broken via beadbeating, and stored at -80˚C. Thawed samples were normalized to 90µg protein and incubated with the fluorescent dye H2DCFDA for 30 minutes at 30˚C. Samples were excited at 485nm and fluorescence emission was measured at 535nm using a plate reader (SpectraMax iD5, Molecular Devices).
Sensitivity to exogenously supplied chemical oxidants that produce various ROS was determined using an agar plate assay according to Baroli et al. (2003). Cultures were grown to mid-log phase were serially diluted to achieve a range of total cells (105, 106, 107, 108) and spotted onto BBM plates containing variable concentrations of the pro-oxidants Rose Bengal, Methyl Viologen, or Hydrogen Peroxide. A range of concentrations of Rose Bengal (0.005 μM, 0.1 μM, 0.25 μM and 2.5 μM) were used to induce singlet oxygen while Methyl Viologen (0.01 μM, 0.02 μM, 0.05 μM and 0.5 μM) were used to induce superoxide. Hydrogen peroxide exposure was 0.01 mM, 0.02 mM, 0.05 mM and 0.5 mM. Plates were incubated for 7 days under control growth conditions. Colony growth was visually inspected daily to obtain a qualitative estimate of sensitivity to each of the chemical oxidants.
Author Contributions
Conceptualization, D.P, R.M.K.; methodology, D.P., S.D., K.W.; formal analysis, D.P.; investigation, D.P., S.D., K.W.; resources, R.M.K.; data curation, D.P.; writing—original draft preparation, D.P., S.D., R.M.K..; writing—review and editing, D.P., S.D., K.W., R.M.K..; supervision, R.M.K.; project administration, R.M.K.; funding acquisition, R.M.K. All authors have read and agreed to the published version of the manuscript.
Funding
This research was funded by the U.S. Department of Energy (DOE), grant numbers DE-SC0019464, DE-SC0019138.
Data Availability Statement
Data and strains are available upon request from the authors.
Conflicts of Interest
The authors declare no conflicts of interest.
References
- Larkum, A.W. Photosynthesis and Light Harvesting in Algae. In The Physiology of Microalgae; Borowitzka, M.A., Beardall, J., Raven, J.A., Eds.; Developments in Applied Phycology; Springer International Publishing: Cham, 2016; pp. 67–87. ISBN 978-3-319-24945-2. [Google Scholar]
- Erickson, E.; Wakao, S.; Niyogi, K.K. Light Stress and Photoprotection in Chlamydomonas reinhardtii. Plant J. 2015, 82, 449–465. [Google Scholar] [CrossRef] [PubMed]
- Raven, J.A. The Cost of Photoinhibition. Physiol. Plant. 2011, 142, 87–104. [Google Scholar] [CrossRef] [PubMed]
- Morgan-Kiss, R.M.; Priscu, J.C.; Pocock, T.; Gudynaite-Savitch, L.; Huner, N.P.A. Adaptation and Acclimation of Photosynthetic Microorganisms to Permanently Cold Environments. Microbiol. Mol. Biol. Rev. 2006, 70, 222–252. [Google Scholar] [CrossRef] [PubMed]
- Li, L.; Aro, E.-M.; Millar, A.H. Mechanisms of Photodamage and Protein Turnover in Photoinhibition. Trends Plant Sci. 2018, 23, 667–676. [Google Scholar] [CrossRef] [PubMed]
- Terashima, I.; Funayama, S.; Sonoike, K. The Site of Photoinhibition in Leaves of Cucumis Sativus L. at Low Temperatures Is Photosystem I, Not Photosystem II. Planta 1994, 193, 300–306. [Google Scholar] [CrossRef]
- Kale, R.; Hebert, A.E.; Frankel, L.K.; Sallans, L.; Bricker, T.M.; Pospíšil, P. Amino Acid Oxidation of the D1 and D2 Proteins by Oxygen Radicals during Photoinhibition of Photosystem II. Proc. Natl. Acad. Sci. 2017, 114, 2988–2993. [Google Scholar] [CrossRef] [PubMed]
- Mattoo, A.K.; Hoffman-Falk, H.; Marder, J.B.; Edelman, M. Regulation of Protein Metabolism: Coupling of Photosynthetic Electron Transport to in Vivo Degradation of the Rapidly Metabolized 32-Kilodalton Protein of the Chloroplast Membranes. Proc. Natl. Acad. Sci. 1984, 81, 1380–1384. [Google Scholar] [CrossRef] [PubMed]
- Aro, E.M.; McCaffery, S.; Anderson, J.M. Recovery from Photoinhibition in Peas (Pisum Sativum L.) Acclimated to Varying Growth Irradiances (Role of D1 Protein Turnover). Plant Physiol. 1994, 104, 1033–1041. [Google Scholar] [CrossRef] [PubMed]
- Jiao, S.; Emmanuel, H.; Guikema, J.A. High Light Stress Inducing Photoinhibition and Protein Degradation of Photosystem I in Brassica Rapa. Plant Sci. 2004, 167, 733–741. [Google Scholar] [CrossRef]
- Kono, M.; Terashima, I. Long-Term and Short-Term Responses of the Photosynthetic Electron Transport to Fluctuating Light. J. Photochem. Photobiol. B 2014, 137, 89–99. [Google Scholar] [CrossRef]
- L. Burnap, R. D1 Protein Processing and Mn Cluster Assembly in Light of the Emerging Photosystem II Structure. Phys. Chem. Chem. Phys. 2004, 6, 4803–4809. [Google Scholar] [CrossRef]
- Melis, A. Photosystem-II Damage and Repair Cycle in Chloroplasts: What Modulates the Rate of Photodamage in Vivo? Trends Plant Sci. 1999, 4, 130–135. [Google Scholar] [CrossRef] [PubMed]
- Shimakawa, G.; Miyake, C. Oxidation of P700 Ensures Robust Photosynthesis. Front. Plant Sci. 2018, 9. [Google Scholar] [CrossRef] [PubMed]
- Scheller, H.V.; Haldrup, A. Photoinhibition of Photosystem I. Planta 2005, 221, 5–8. [Google Scholar] [CrossRef] [PubMed]
- Zhang, S.; Scheller, H.V. Photoinhibition of Photosystem I at Chilling Temperature and Subsequent Recovery in Arabidopsis Thaliana. Plant Cell Physiol. 2004, 45, 1595–1602. [Google Scholar] [CrossRef] [PubMed]
- Cruz, J.A.; Avenson, T.J.; Kanazawa, A.; Takizawa, K.; Edwards, G.E.; Kramer, D.M. Plasticity in Light Reactions of Photosynthesis for Energy Production and Photoprotection. J. Exp. Bot. 2005, 56, 395–406. [Google Scholar] [CrossRef] [PubMed]
- Tikkanen, M.; Grieco, M.; Nurmi, M.; Rantala, M.; Suorsa, M.; Aro, E.-M. Regulation of the Photosynthetic Apparatus under Fluctuating Growth Light. Philos. Trans. R. Soc. B Biol. Sci. 2012, 367, 3486–3493. [Google Scholar] [CrossRef] [PubMed]
- Demmig-Adams, B.; Stewart, J.J.; Adams, W.W. Environmental Regulation of Intrinsic Photosynthetic Capacity: An Integrated View. Curr. Opin. Plant Biol. 2017, 37, 34–41. [Google Scholar] [CrossRef] [PubMed]
- Allakhverdiev, S.I.; Nishiyama, Y.; Miyairi, S.; Yamamoto, H.; Inagaki, N.; Kanesaki, Y.; Murata, N. Salt Stress Inhibits the Repair of Photodamaged Photosystem II by Suppressing the Transcription and Translation of psbAGenes in Synechocystis. Plant Physiol. 2002, 130, 1443–1453. [Google Scholar] [CrossRef]
- Ivanov, A.G.; Morgan, R.M.; Gray, G.R.; Velitchkova, M.Y.; Huner, N.P.A. Temperature/Light Dependent Development of Selective Resistance to Photoinhibition of Photosystem I. FEBS Lett. 1998, 430, 288–292. [Google Scholar] [CrossRef]
- Maxwell, D.P.; Falk, S.; Trick, C.G.; Huner, NPA. Growth at Low Temperature Mimics High-Light Acclimation in Chlorella Vulgaris. Plant Physiol. 1994, 105, 535–543. [Google Scholar] [CrossRef] [PubMed]
- Neale, P.J.; Melis, A. Salinity-Stress Enhances Photoinhibition of Photosynthesis in Chlamydomonas Reinhardtii. J. Plant Physiol. 1989, 134, 619–622. [Google Scholar] [CrossRef]
- Bailey-Serres, J.; Parker, J.E.; Ainsworth, E.A.; Oldroyd, G.E.D.; Schroeder, J.I. Genetic Strategies for Improving Crop Yields. Nature 2019, 575, 109–118. [Google Scholar] [CrossRef]
- Priscu, J.C.; Wolf, C.F.; Takacs, C.D.; Fritsen, C.H.; Laybourn-Parry, J.; Roberts, E.C.; Sattler, B.; Lyons, W.B. Carbon Transformations in a Perennially Ice-Covered Antarctic Lake. BioScience 1999, 49, 997–1008. [Google Scholar] [CrossRef]
- Neale, P.J.; Priscu, J.C. Fluorescence Quenching in Phytoplankton of the Mcmurdo Dry Valley Lakes (Antarctica): Implications for The Structure and Function Of The Photosynthetic Apparatus. In Ecosystem Dynamics in a Polar Desert: the Mcmurdo Dry Valleys, Antarctica; American Geophysical Union (AGU), 1998; pp. 241–253 ISBN 978-1-118-66831-3.
- Dolhi, J.M.; Maxwell, D.P.; Morgan-Kiss, R.M. Review: The Antarctic Chlamydomonas Raudensis: An Emerging Model for Cold Adaptation of Photosynthesis. Extremophiles 2013, 17, 711–722. [Google Scholar] [CrossRef]
- Hüner, N.P.A.; Smith, D.R.; Cvetkovska, M.; Zhang, X.; Ivanov, A.G.; Szyszka-Mroz, B.; Kalra, I.; Morgan-Kiss, R. Photosynthetic Adaptation to Polar Life: Energy Balance, Photoprotection and Genetic Redundancy. J. Plant Physiol. 2022, 268, 153557. [Google Scholar] [CrossRef]
- Szyszka-Mroz, B.; Pittock, P.; Ivanov, A.G.; Lajoie, G.; Hüner, N.P.A. The Antarctic Psychrophile Chlamydomonas Sp. UWO 241 Preferentially Phosphorylates a Photosystem I-Cytochrome B6/f Supercomplex1[OPEN]. Plant Physiol. 2015, 169, 717–736. [Google Scholar] [CrossRef]
- Kalra, I.; Wang, X.; Cvetkovska, M.; Jeong, J.; McHargue, W.; Zhang, R.; Hüner, N.; Yuan, J.S.; Morgan-Kiss, R.M. Chlamydomonas Sp. UWO 241 Exhibits High Cyclic Electron Flow and Rewired Metabolism under High Salinity. Plant Physiol. 2020, 183, 588–601. [Google Scholar] [CrossRef]
- Morgan-Kiss, R.M.; Ivanov, A.G.; Huner, N.P. The Antarctic Psychrophile, Chlamydomonas Subcaudata, Is Deficient in State I–State II Transitions. Planta 2002, 214, 435–445. [Google Scholar] [CrossRef]
- Szyszka-Mroz, B.; Cvetkovska, M.; Ivanov, A.G.; Smith, D.R.; Possmayer, M.; Maxwell, D.P.; Hüner, N.P.A. Cold-Adapted Protein Kinases and Thylakoid Remodeling Impact Energy Distribution in an Antarctic Psychrophile. Plant Physiol. 2019, 180, 1291–1309. [Google Scholar] [CrossRef]
- Stahl-Rommel, S.; Kalra, I.; D’Silva, S.; Hahn, M.M.; Popson, D.; Cvetkovska, M.; Morgan-Kiss, R.M. Cyclic Electron Flow (CEF) and Ascorbate Pathway Activity Provide Constitutive Photoprotection for the Photopsychrophile, Chlamydomonas Sp. UWO 241 (Renamed Chlamydomonas Priscuii). Photosynth. Res. [CrossRef]
- Szyszka, B.; Ivanov, A.G.; Hüner, N.P.A. Psychrophily Is Associated with Differential Energy Partitioning, Photosystem Stoichiometry and Polypeptide Phosphorylation in Chlamydomonas Raudensis. Biochim. Biophys. Acta BBA - Bioenerg. 2007, 1767, 789–800. [Google Scholar] [CrossRef] [PubMed]
- Chaux, F.; Peltier, G.; Johnson, X. A Security Network in PSI Photoprotection: Regulation of Photosynthetic Control, NPQ and O2 Photoreduction by Cyclic Electron Flow. Front. Plant Sci. 2015, 6. [Google Scholar] [CrossRef] [PubMed]
- Müller, P.; Li, X.-P.; Niyogi, K.K. Non-Photochemical Quenching. A Response to Excess Light Energy. Plant Physiol. 2001, 125, 1558–1566. [Google Scholar] [CrossRef] [PubMed]
- Cvetkovska, M.; Zhang, X.; Vakulenko, G.; Benzaquen, S.; Szyszka-Mroz, B.; Malczewski, N.; Smith, D.R.; Hüner, N.P.A. A Constitutive Stress Response Is a Result of Low Temperature Growth in the Antarctic Green Alga Chlamydomonas Sp. UWO241. Plant Cell Environ. 2022, 45, 156–177. [Google Scholar] [CrossRef]
- Hüner, N.P.A.; Szyszka-Mroz, B.; Ivanov, A.G.; Kata, V.; Lye, H.; Smith, D.R. Photosynthetic Adaptation and Multicellularity in the Antarctic Psychrophile, Chlamydomonas Priscuii. Algal Res. 2023, 103220. [Google Scholar] [CrossRef]
- Kalra, I.; Wang, X.; Zhang, R.; Morgan-Kiss, R. High Salt-Induced PSI-Supercomplex Is Associated with High CEF and Attenuation of State Transitions. Photosynth. Res. 2023. [Google Scholar] [CrossRef] [PubMed]
- Obryk, M.K.; Doran, P.T.; Priscu, J.C. Prediction of Ice-Free Conditions for a Perennially Ice-Covered Antarctic Lake. J. Geophys. Res. Earth Surf. 2019, 124, 686–694. [Google Scholar] [CrossRef]
- Sherwell, S.; Kalra, I.; Li, W.; McKnight, D.M.; Priscu, J.C.; Morgan-Kiss, R.M. Antarctic Lake Phytoplankton and Bacteria from Near-Surface Waters Exhibit High Sensitivity to Climate-Driven Disturbance. Environ. Microbiol. n/a. [CrossRef]
- Neale, P.J.; Lesser, M.P.; Cullen, J.J. Effects of Ultraviolet Radiation on the Photosynthesis Of Phytoplankton in The Vicinity Of Mcmurdo Station, Antarctica. In Ultraviolet Radiation in Antarctica: Measurements and Biological Effects; American Geophysical Union (AGU), 1994; pp. 125–142 ISBN 978-1-118-66794-1.
- Neale, P.J.; Priscu, J.C. The Photosynthetic Apparatus of Phytoplankton from a Perennially Ice-Covered Antarctic Lake: Acclimation to an Extreme Shade Environment. Plant Cell Physiol. 1995, 36, 253–263. [Google Scholar] [CrossRef]
- Morgan-Kiss, R.M.; Ivanov, A.G.; Williams, J.; Mobashsher Khan; Huner, N. P.A. Differential Thermal Effects on the Energy Distribution between Photosystem II and Photosystem I in Thylakoid Membranes of a Psychrophilic and a Mesophilic Alga. Biochim. Biophys. Acta BBA - Biomembr. 2002, 1561, 251–265. [Google Scholar] [CrossRef]
- Pocock, T.H.; Koziak, A.; Rosso, D.; Falk, S.; Hüner, N.P.A. Chlamydomonas Raudensis (UWO 241), Chlorophyceae, Exhibits the Capacity for Rapid D1 Repair in Response to Chronic Photoinhibition at Low Temperature1. J. Phycol. 2007, 43, 924–936. [Google Scholar] [CrossRef]
- Anderson, J.M. Photoregulation of the Composition, Function, and Structure of Thylakoid Membranes. Annu. Rev. Plant Physiol. 1986, 93–136. [Google Scholar] [CrossRef]
- Morgan-Kiss, R.M.; Ivanov, A.G.; Pocock, T.; Król, M.; Gudynaite-Savitch, L.; Hüner, N.P.A. The Antarctic Psychrophile, Chlamydomonas Raudensis Ettl (Uwo241) (Chlorophyceae, Chlorophyta), Exhibits a Limited Capacity to Photoacclimate to Red Light1. J. Phycol. 2005, 41, 791–800. [Google Scholar] [CrossRef]
- Mehler, A.H. Studies on Reactions of Illuminated Chloroplasts. II. Stimulation and Inhibition of the Reaction with Molecular Oxygen. Arch. Biochem. Biophys. 1951, 34, 339–351. [Google Scholar] [CrossRef] [PubMed]
- Asada, K. Production and Scavenging of Reactive Oxygen Species in Chloroplasts and Their Functions. Plant Physiol. 2006, 141, 391–396. [Google Scholar] [CrossRef] [PubMed]
- Lucker, B.; Kramer, D.M. Regulation of Cyclic Electron Flow in Chlamydomonas Reinhardtii under Fluctuating Carbon Availability. Photosynth. Res. 2013, 117, 449–459. [Google Scholar] [CrossRef] [PubMed]
- Munekage, Y.; Hojo, M.; Meurer, J.; Endo, T.; Tasaka, M.; Shikanai, T. PGR5 Is Involved in Cyclic Electron Flow around Photosystem I and Is Essential for Photoprotection in Arabidopsis. Cell 2002, 110, 361–371. [Google Scholar] [CrossRef] [PubMed]
- Munekage, Y.; Hashimoto, M.; Miyake, C.; Tomizawa, K.-I.; Endo, T.; Tasaka, M.; Shikanai, T. Cyclic Electron Flow around Photosystem I Is Essential for Photosynthesis. Nature 2004, 429, 579–582. [Google Scholar] [CrossRef] [PubMed]
- Huang, W.; Yang, Y.-J.; Hu, H.; Zhang, S.-B. Different Roles of Cyclic Electron Flow around Photosystem I under Sub-Saturating and Saturating Light Intensities in Tobacco Leaves. Front. Plant Sci. 2015, 6. [Google Scholar] [CrossRef]
- Huang, W.; Zhang, S.-B.; Xu, J.-C.; Liu, T. Plasticity in Roles of Cyclic Electron Flow around Photosystem I at Contrasting Temperatures in the Chilling-Sensitive Plant Calotropis Gigantea. Environ. Exp. Bot. 2017, 141, 145–153. [Google Scholar] [CrossRef]
- Morgan, R.M.; Ivanov, A.G.; Priscu, J.C.; Maxwell, D.P.; Huner, N.P.A. Structure and Composition of the Photochemical Apparatus of the Antarctic Green Alga, Chlamydomonas Subcaudata. Photosynth. Res. 1998, 56, 303–314. [Google Scholar] [CrossRef]
Figure 1.
Growth (A) oxygen evolution under saturating light (B) in C. priscuii UWO241 under low and high light. Cultures were acclimated and grown under control (50 μmol m-2 s-1) or high light (250 μmol m-2 s-1) conditions. (n=3; ± SD).
Figure 1.
Growth (A) oxygen evolution under saturating light (B) in C. priscuii UWO241 under low and high light. Cultures were acclimated and grown under control (50 μmol m-2 s-1) or high light (250 μmol m-2 s-1) conditions. (n=3; ± SD).
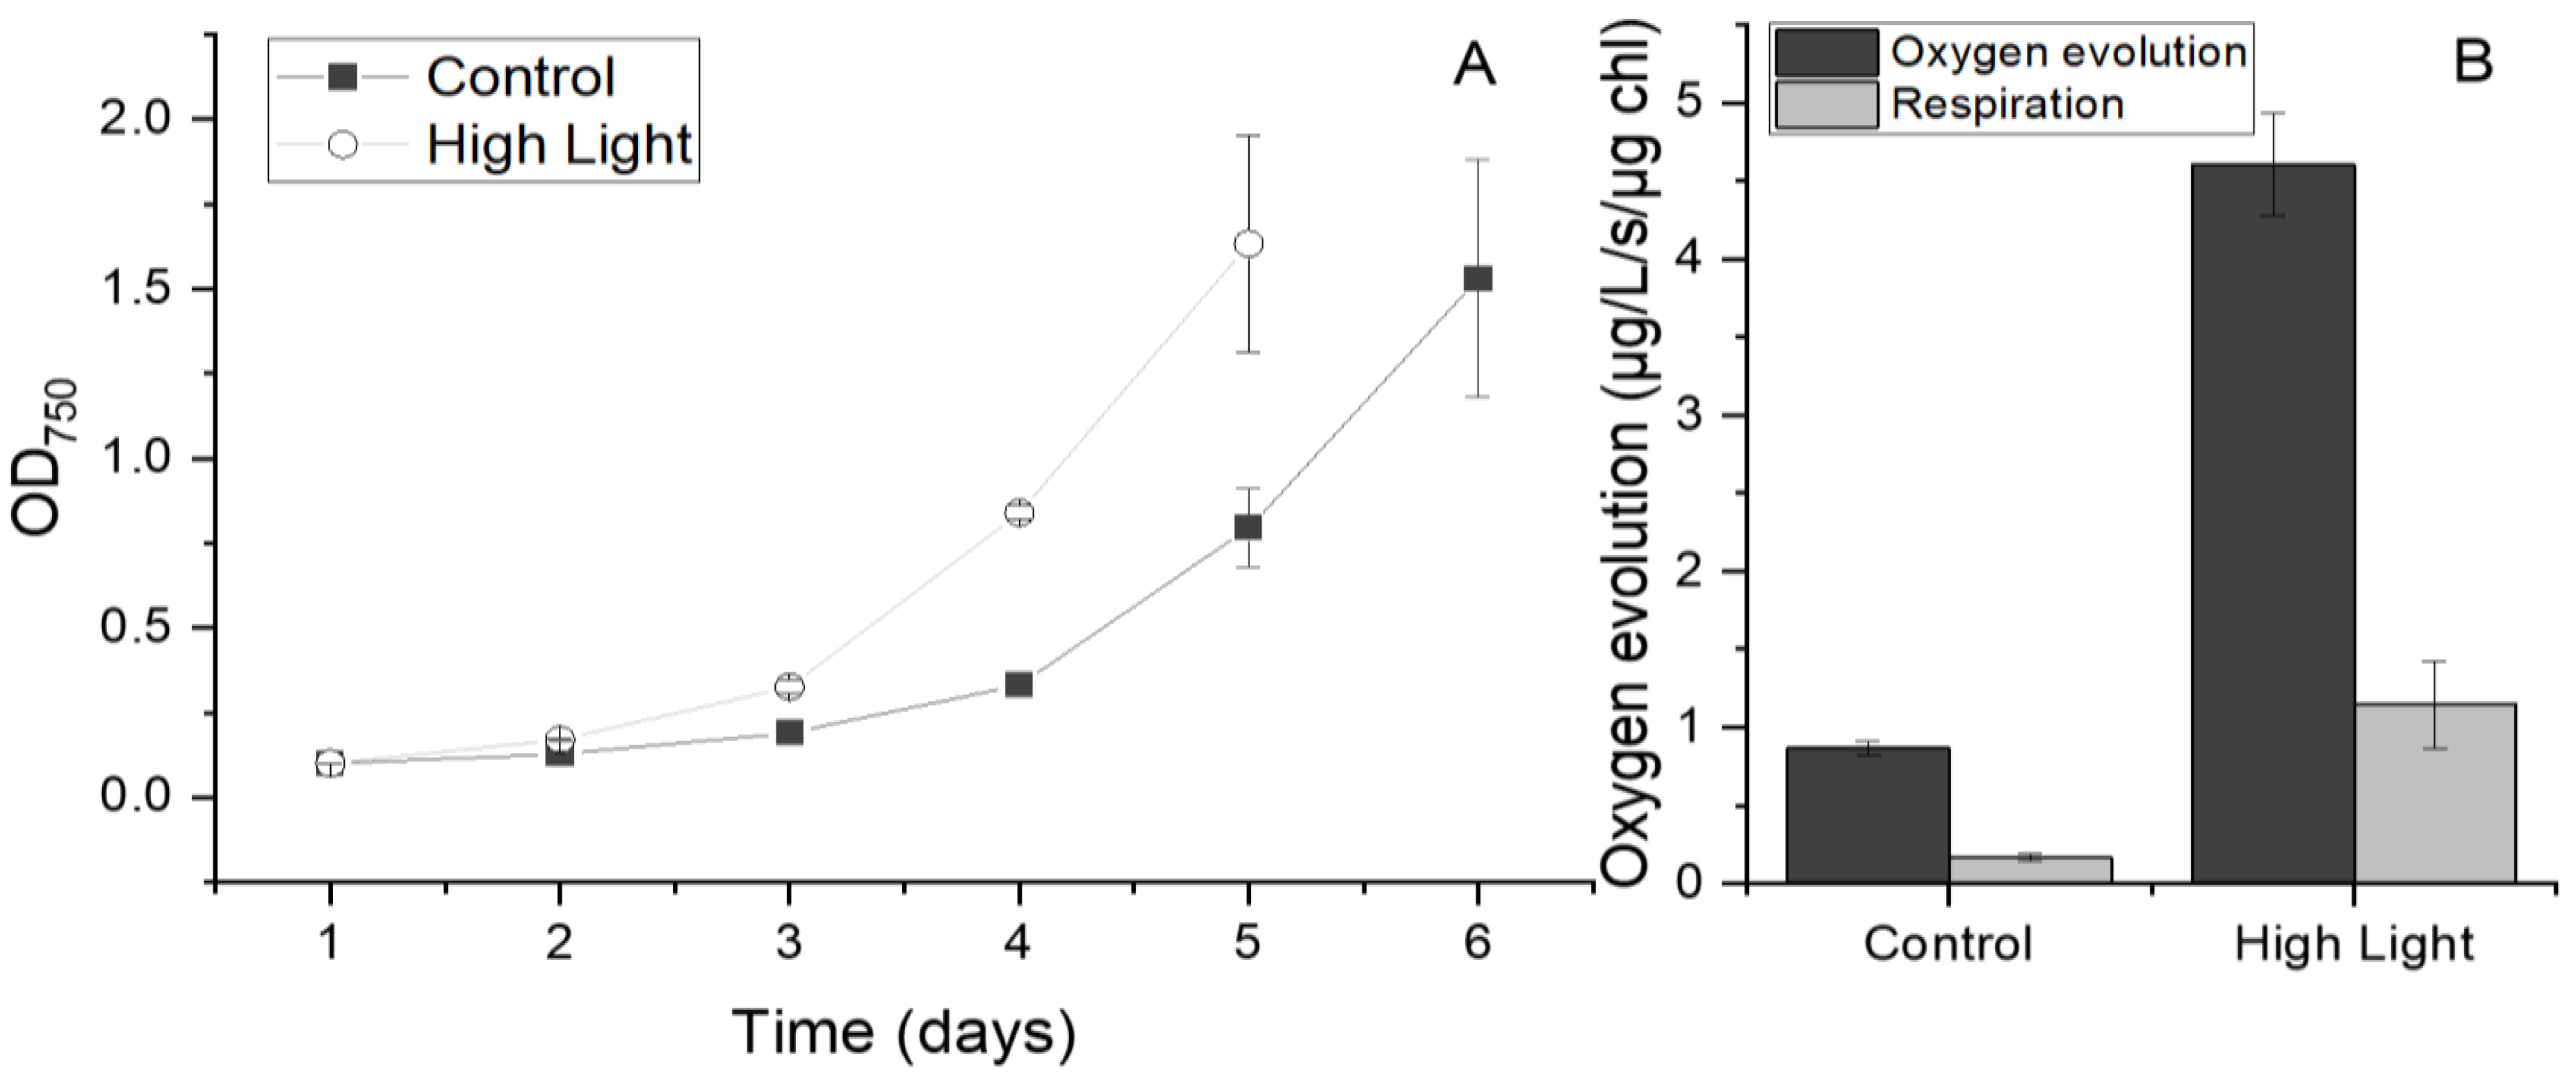
Figure 2.
Rapid light curves for PSII (A and B) and PSI (C and D) quantum yields of UWO241 acclimated to control (closed symbols) or high light (open symbols). Y(II) and Y(I), quantum yields for PSII and PSI, respectively. Y(NPQ) and Y(NO), regulated and unregulated nonphotochemical quenching of PSII, respectively; Y(ND) and Y(NA), energy loss due to donor and acceptor side limitations, respectively (n=3; ± SD).
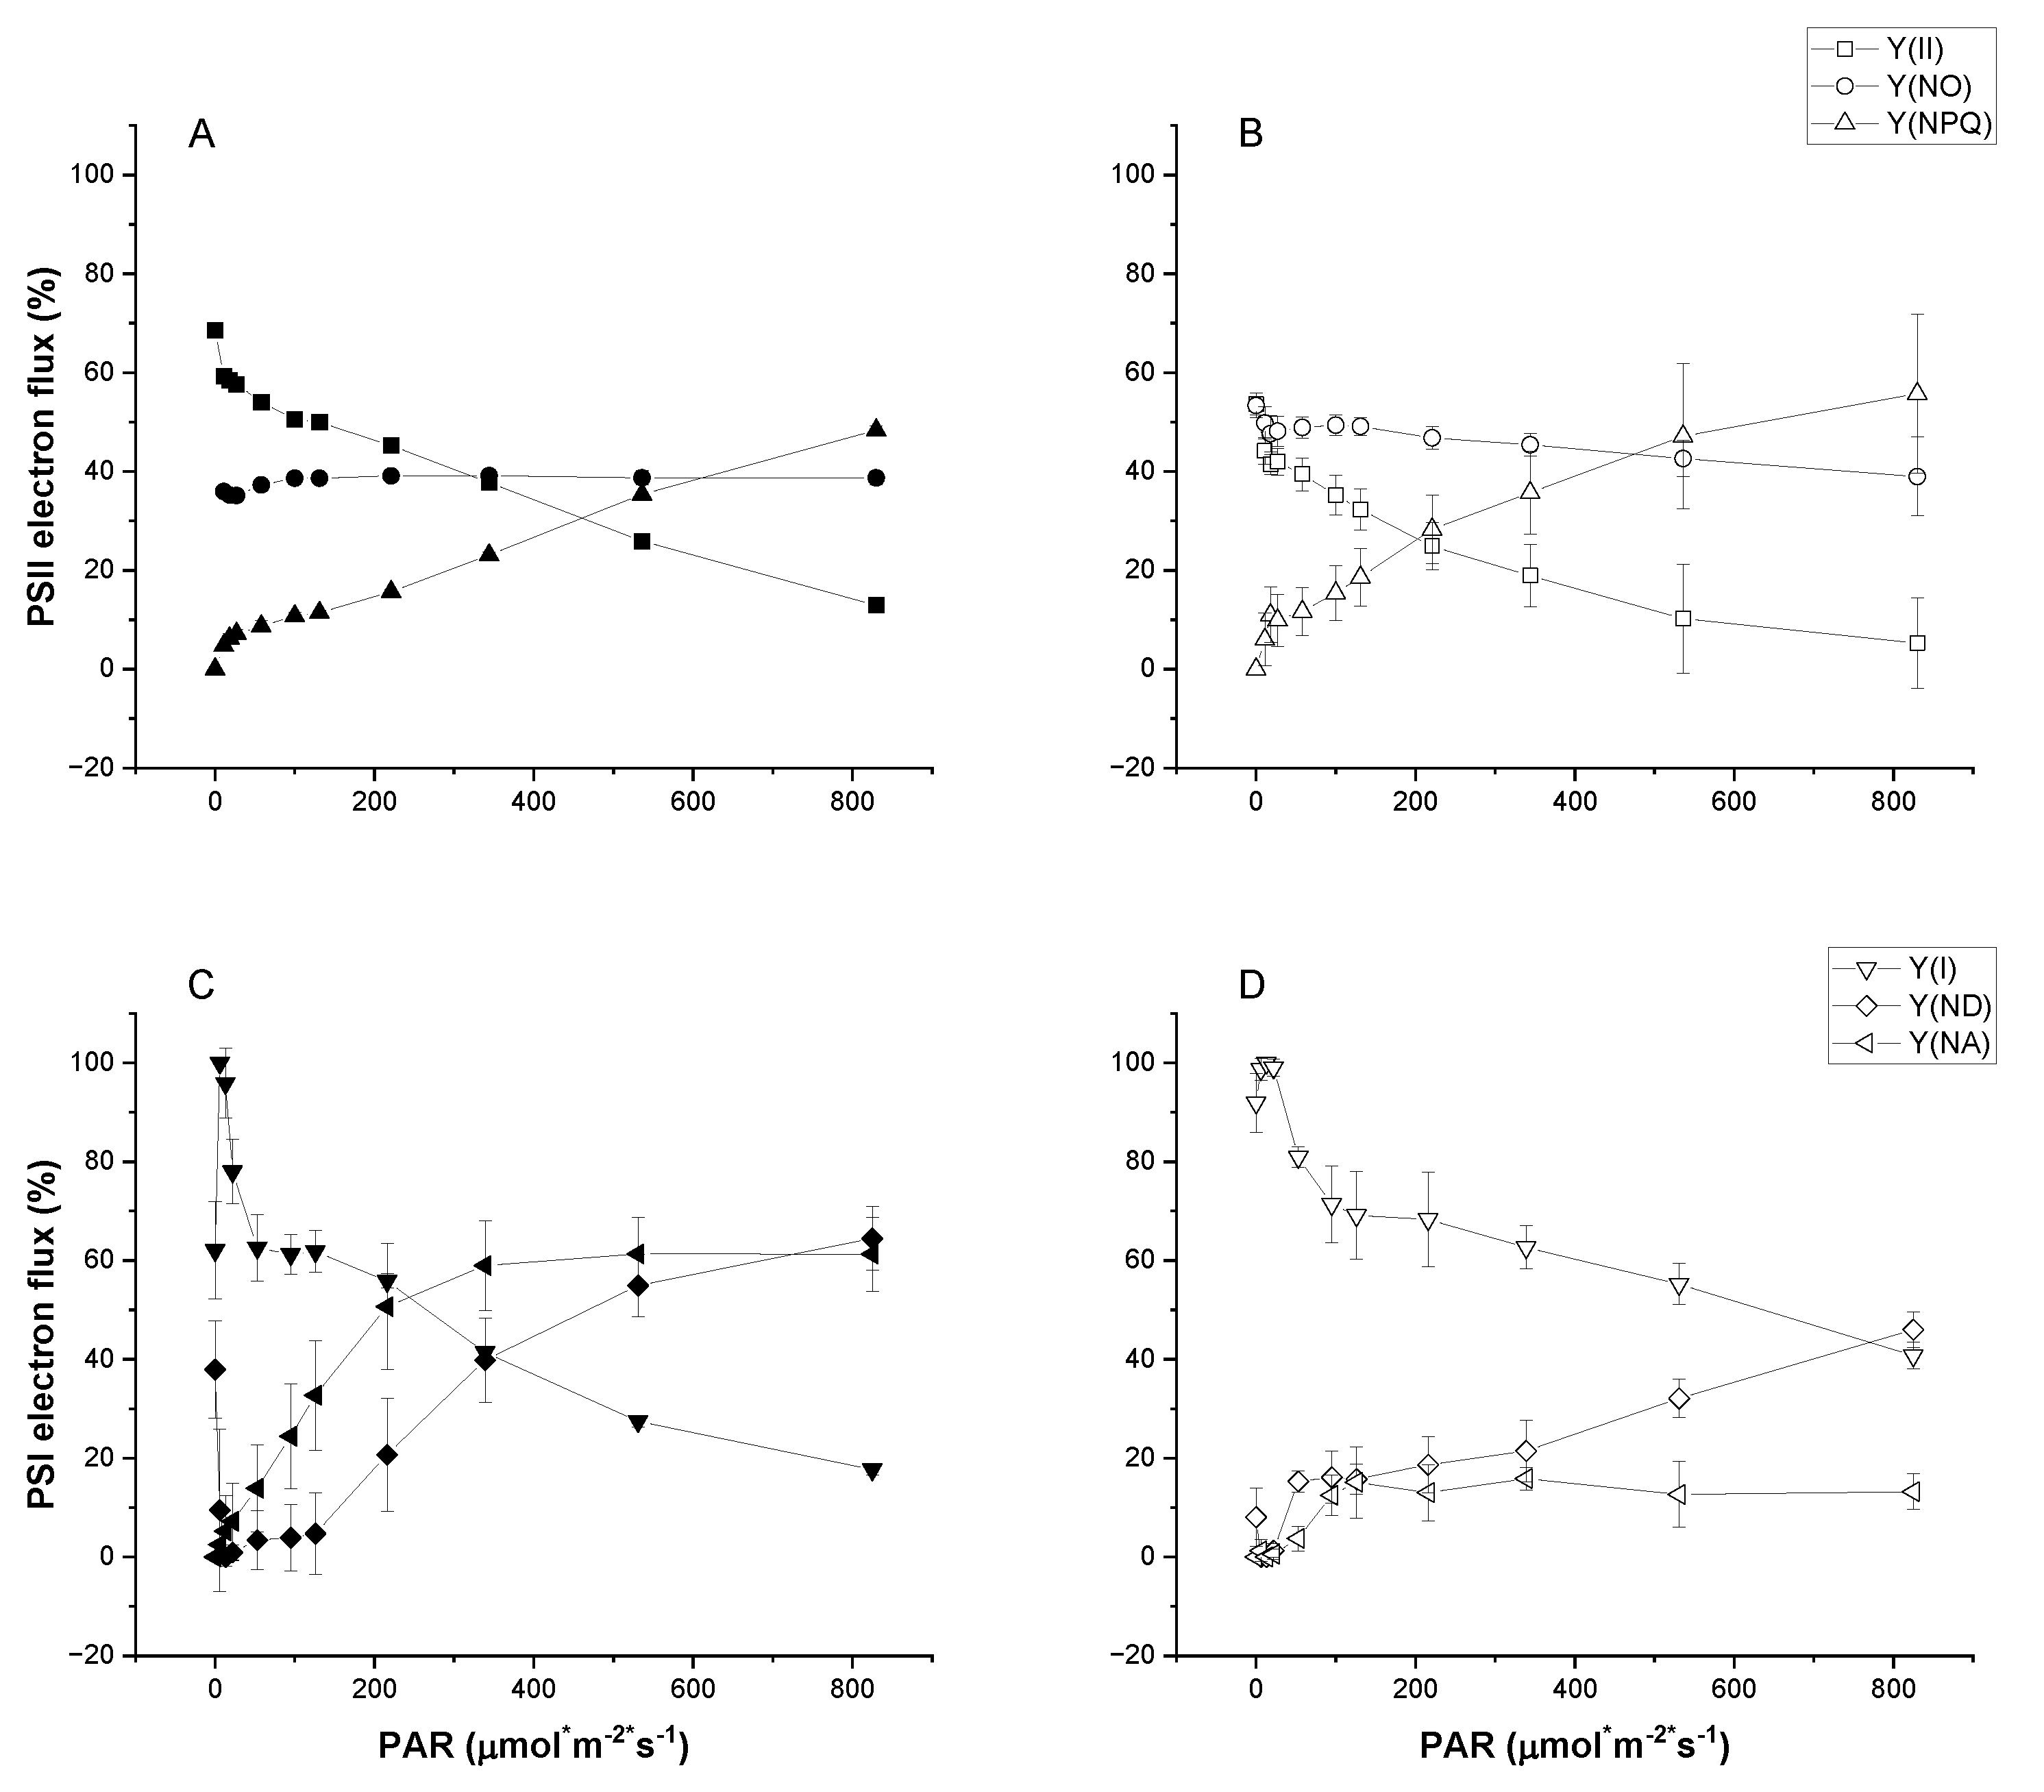
Figure 3.
Relative abundance of key photosynthetic proteins in C. reinhardtii versus UWO241 (A) and in UWO241 cultures acclimated to control, low temperature, high salt, or high light conditions (B). Thylakoid samples were normalized to 6 µg protein and run in triplicate. Densitometry was performed in ImageJ and expressed relative to C. reinhardtii. * Indicates p<0.05 based on a welch’s t-test (panel A) or ANOVA with Tukey post-hoc test (panel B) (n=3; ± SD).
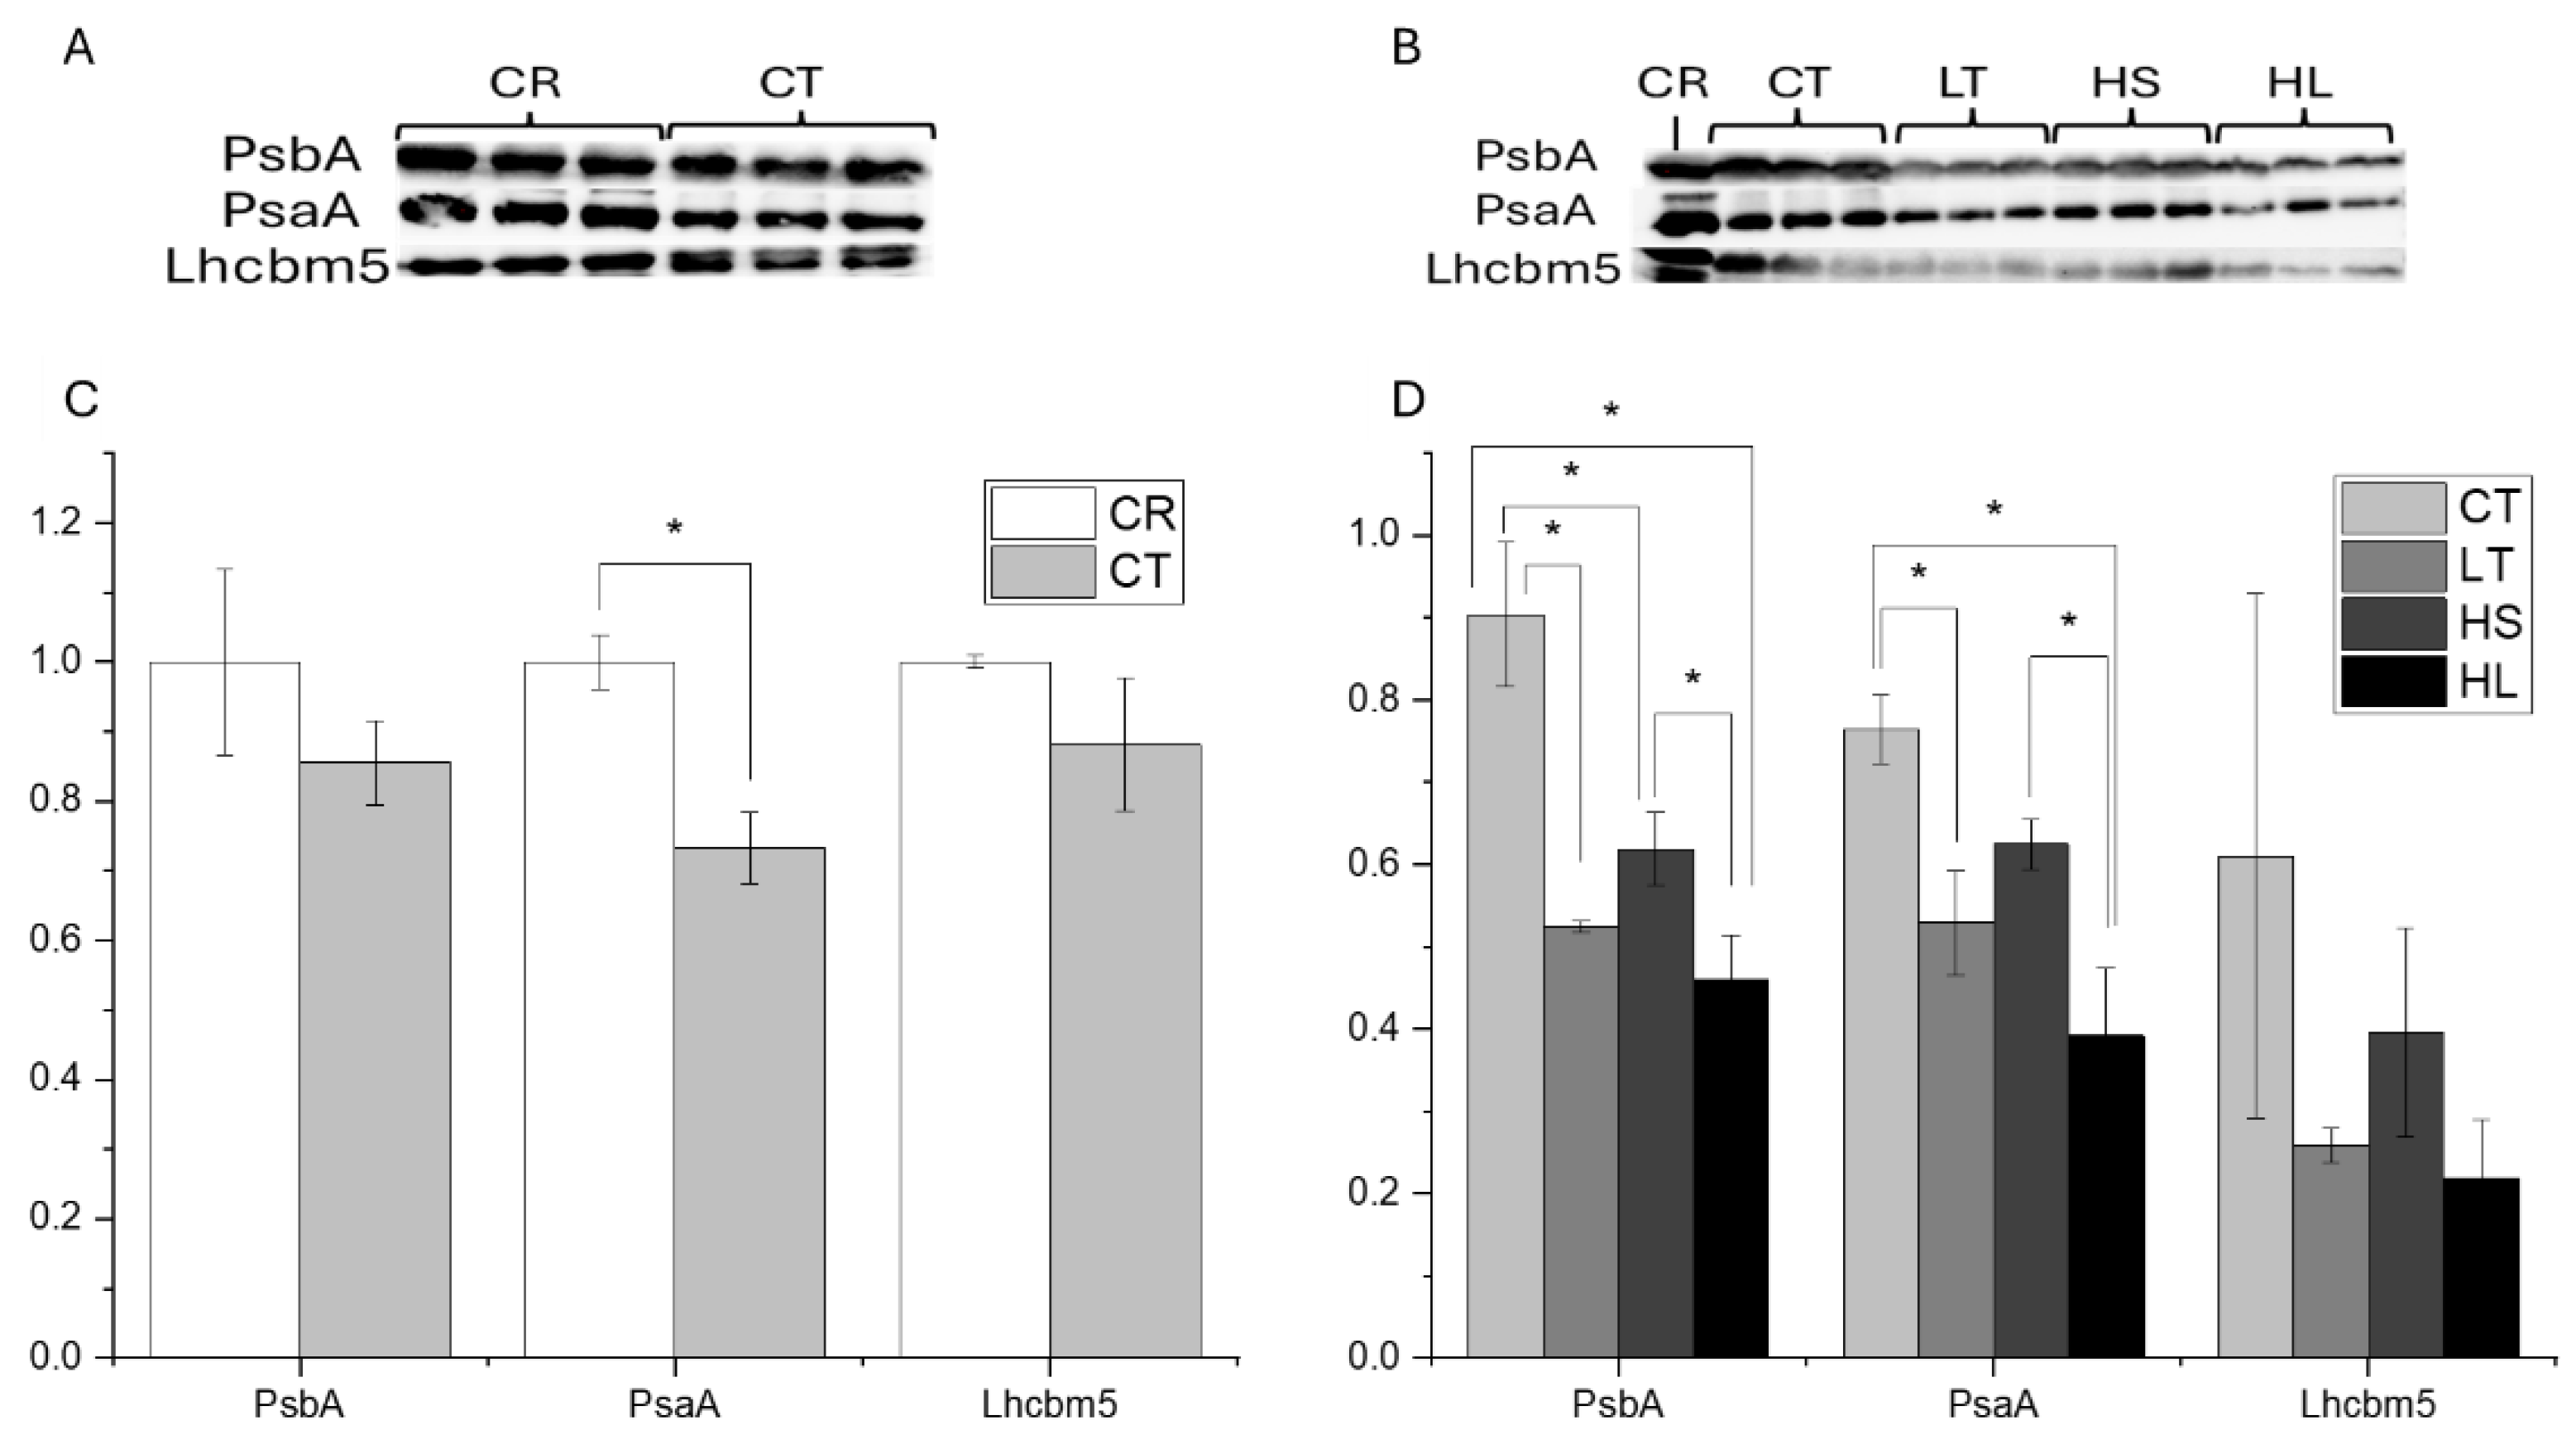
Figure 4.
Changes in photosynthetic capacity following short-term high light stress (120min 8 ˚C/1000 μmol m−2 s−1; solid bars) and recovery in (90 min. growth conditions; striped bars) (a) PSII photoinhibition shown by changes in FV/FM (n=3; ±SD); (b) PSI photoinhibition represented as change in absorbance at 820 nm, relative to pre-stress time point, t0 (n=9; ±SE). Statistical differences were calculated via two-way ANOVA with Tukey post-hoc test (p≤0.05). Solid line separates C. reinhardtii (left bars) from UWO241 (right bars). Dotted line represents the relative value (100%) for each strain or condition taken immediately prior to the photoinhibition treatment. Strain and growth conditions: CR, C. reinhardtii; CT, UWO241, control; LT, UWO241, low temperature; HS, UWO241, high salt; HL, UWO241, high light.
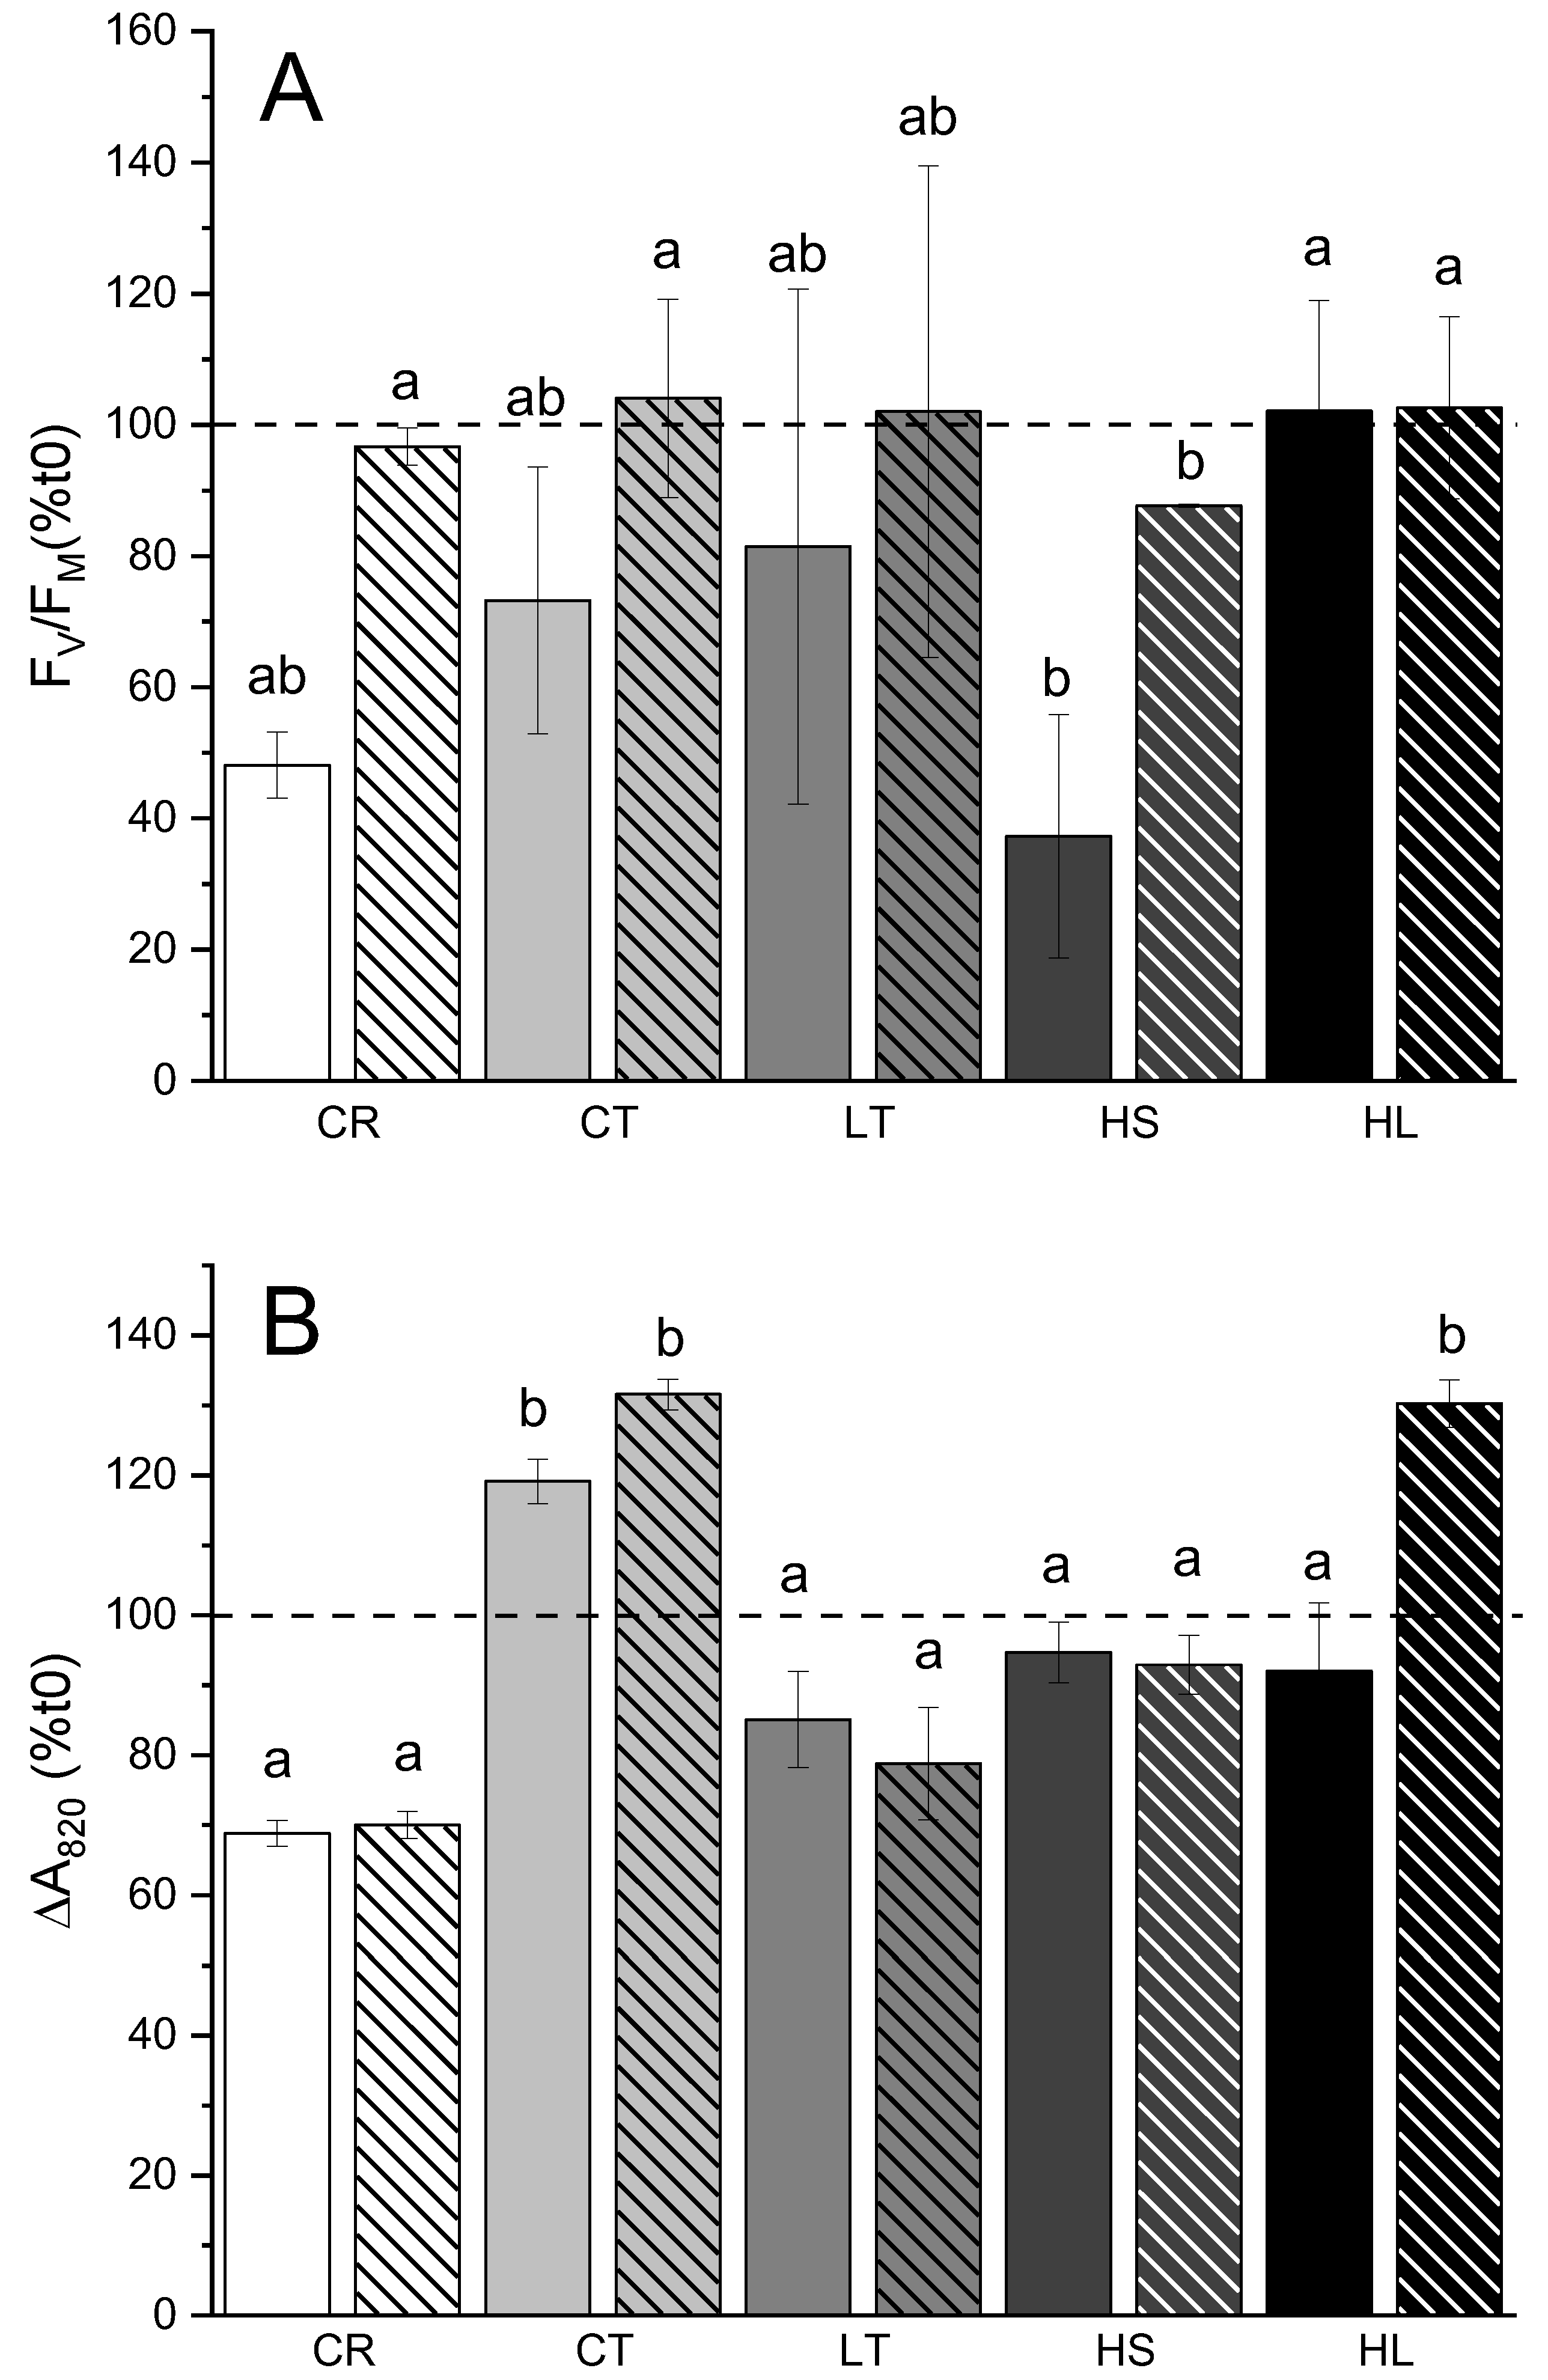
Figure 5.
Impact of photoinhibition on PSII oxidation state (A) and energy partitioning (B). Cultures of UWO241 were exposed to high light for 60 mins and then recovered in low light for 120 minutes. S0, S30, S60, high light exposure for 0, 30 and 60 mins; R15, R30, R60, and R120, recovery under growth conditions for 15, 30, 60, and 120 mins (n=3; ± SD).
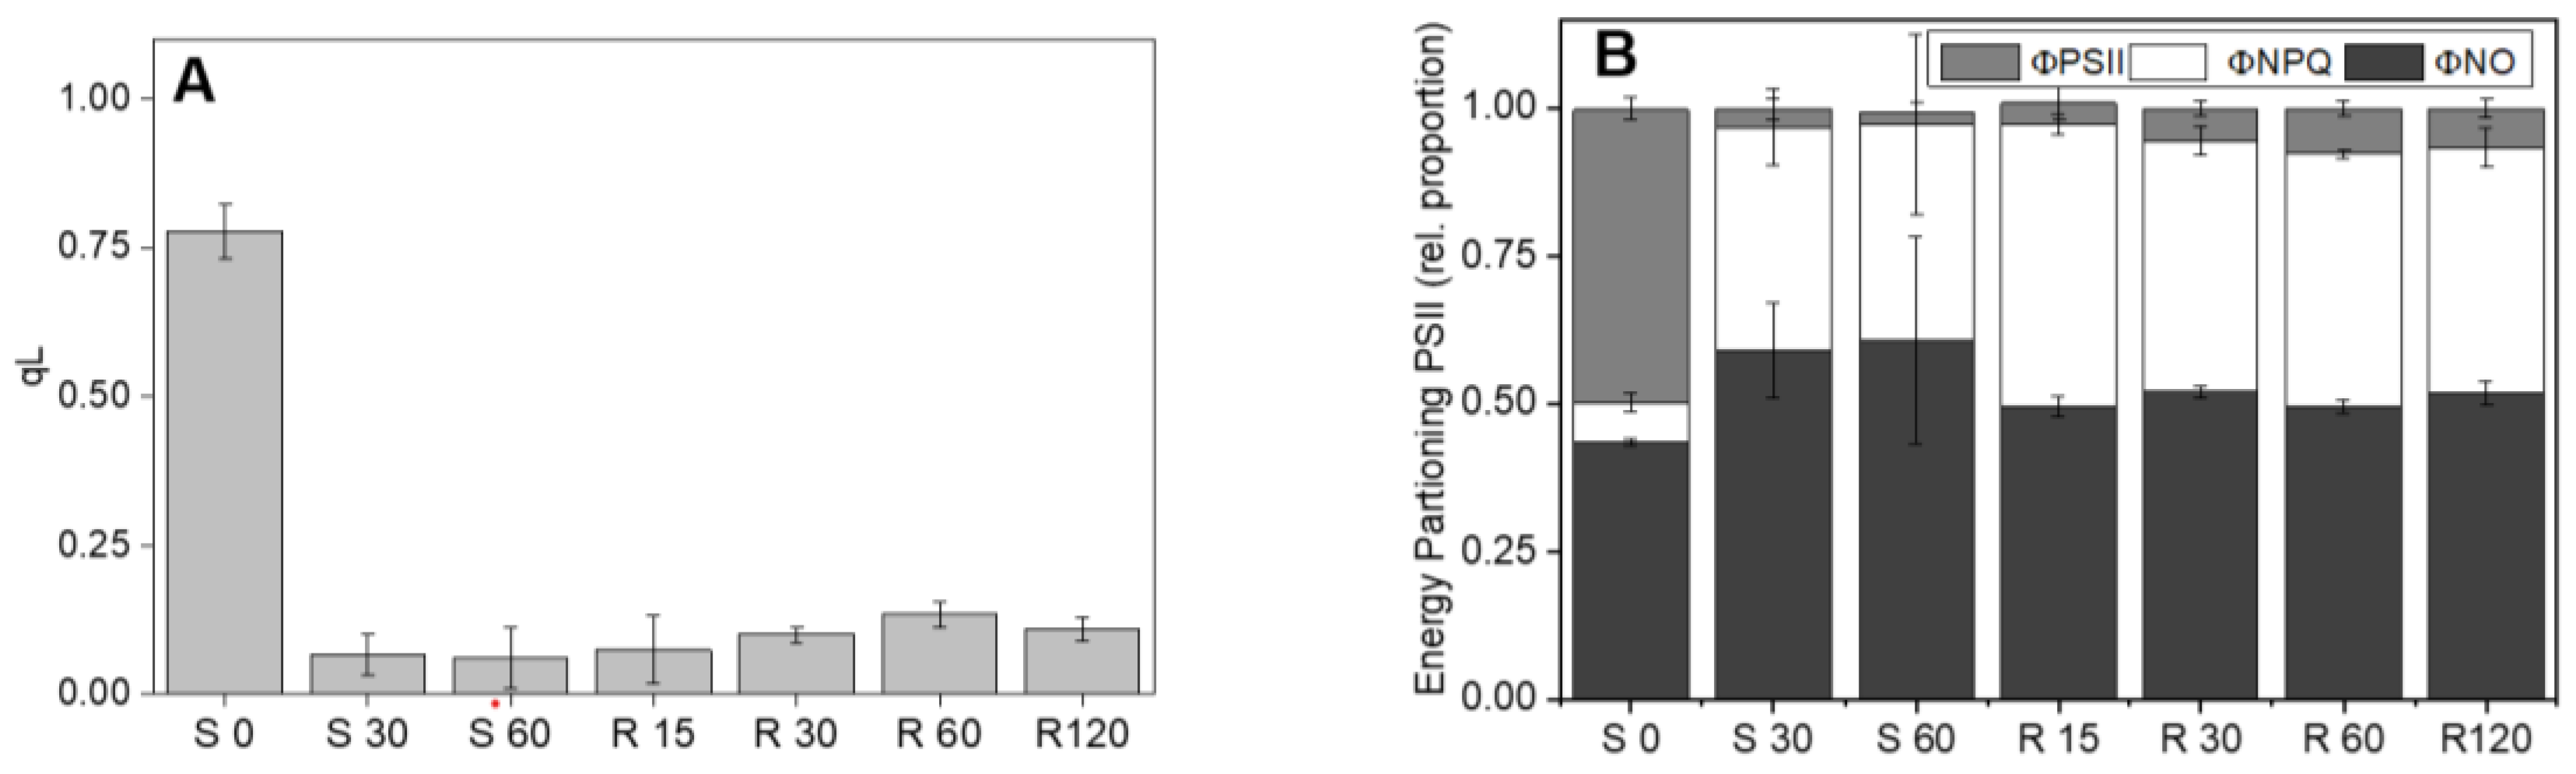
Figure 6.
Rates of CEF measured as the half-time of P700 re-reduction throughout the short-term stress (1000 μmol m−2 s−1/8˚C; white) and subsequent recovery at the respective growth conditions (grey). Strain and growth conditions: CR, C. reinhardtii; CT, UWO241, control; LT, UWO241, low temperature; HS, UWO241, high salt; HL, UWO241, high light (n=3; ± SE).
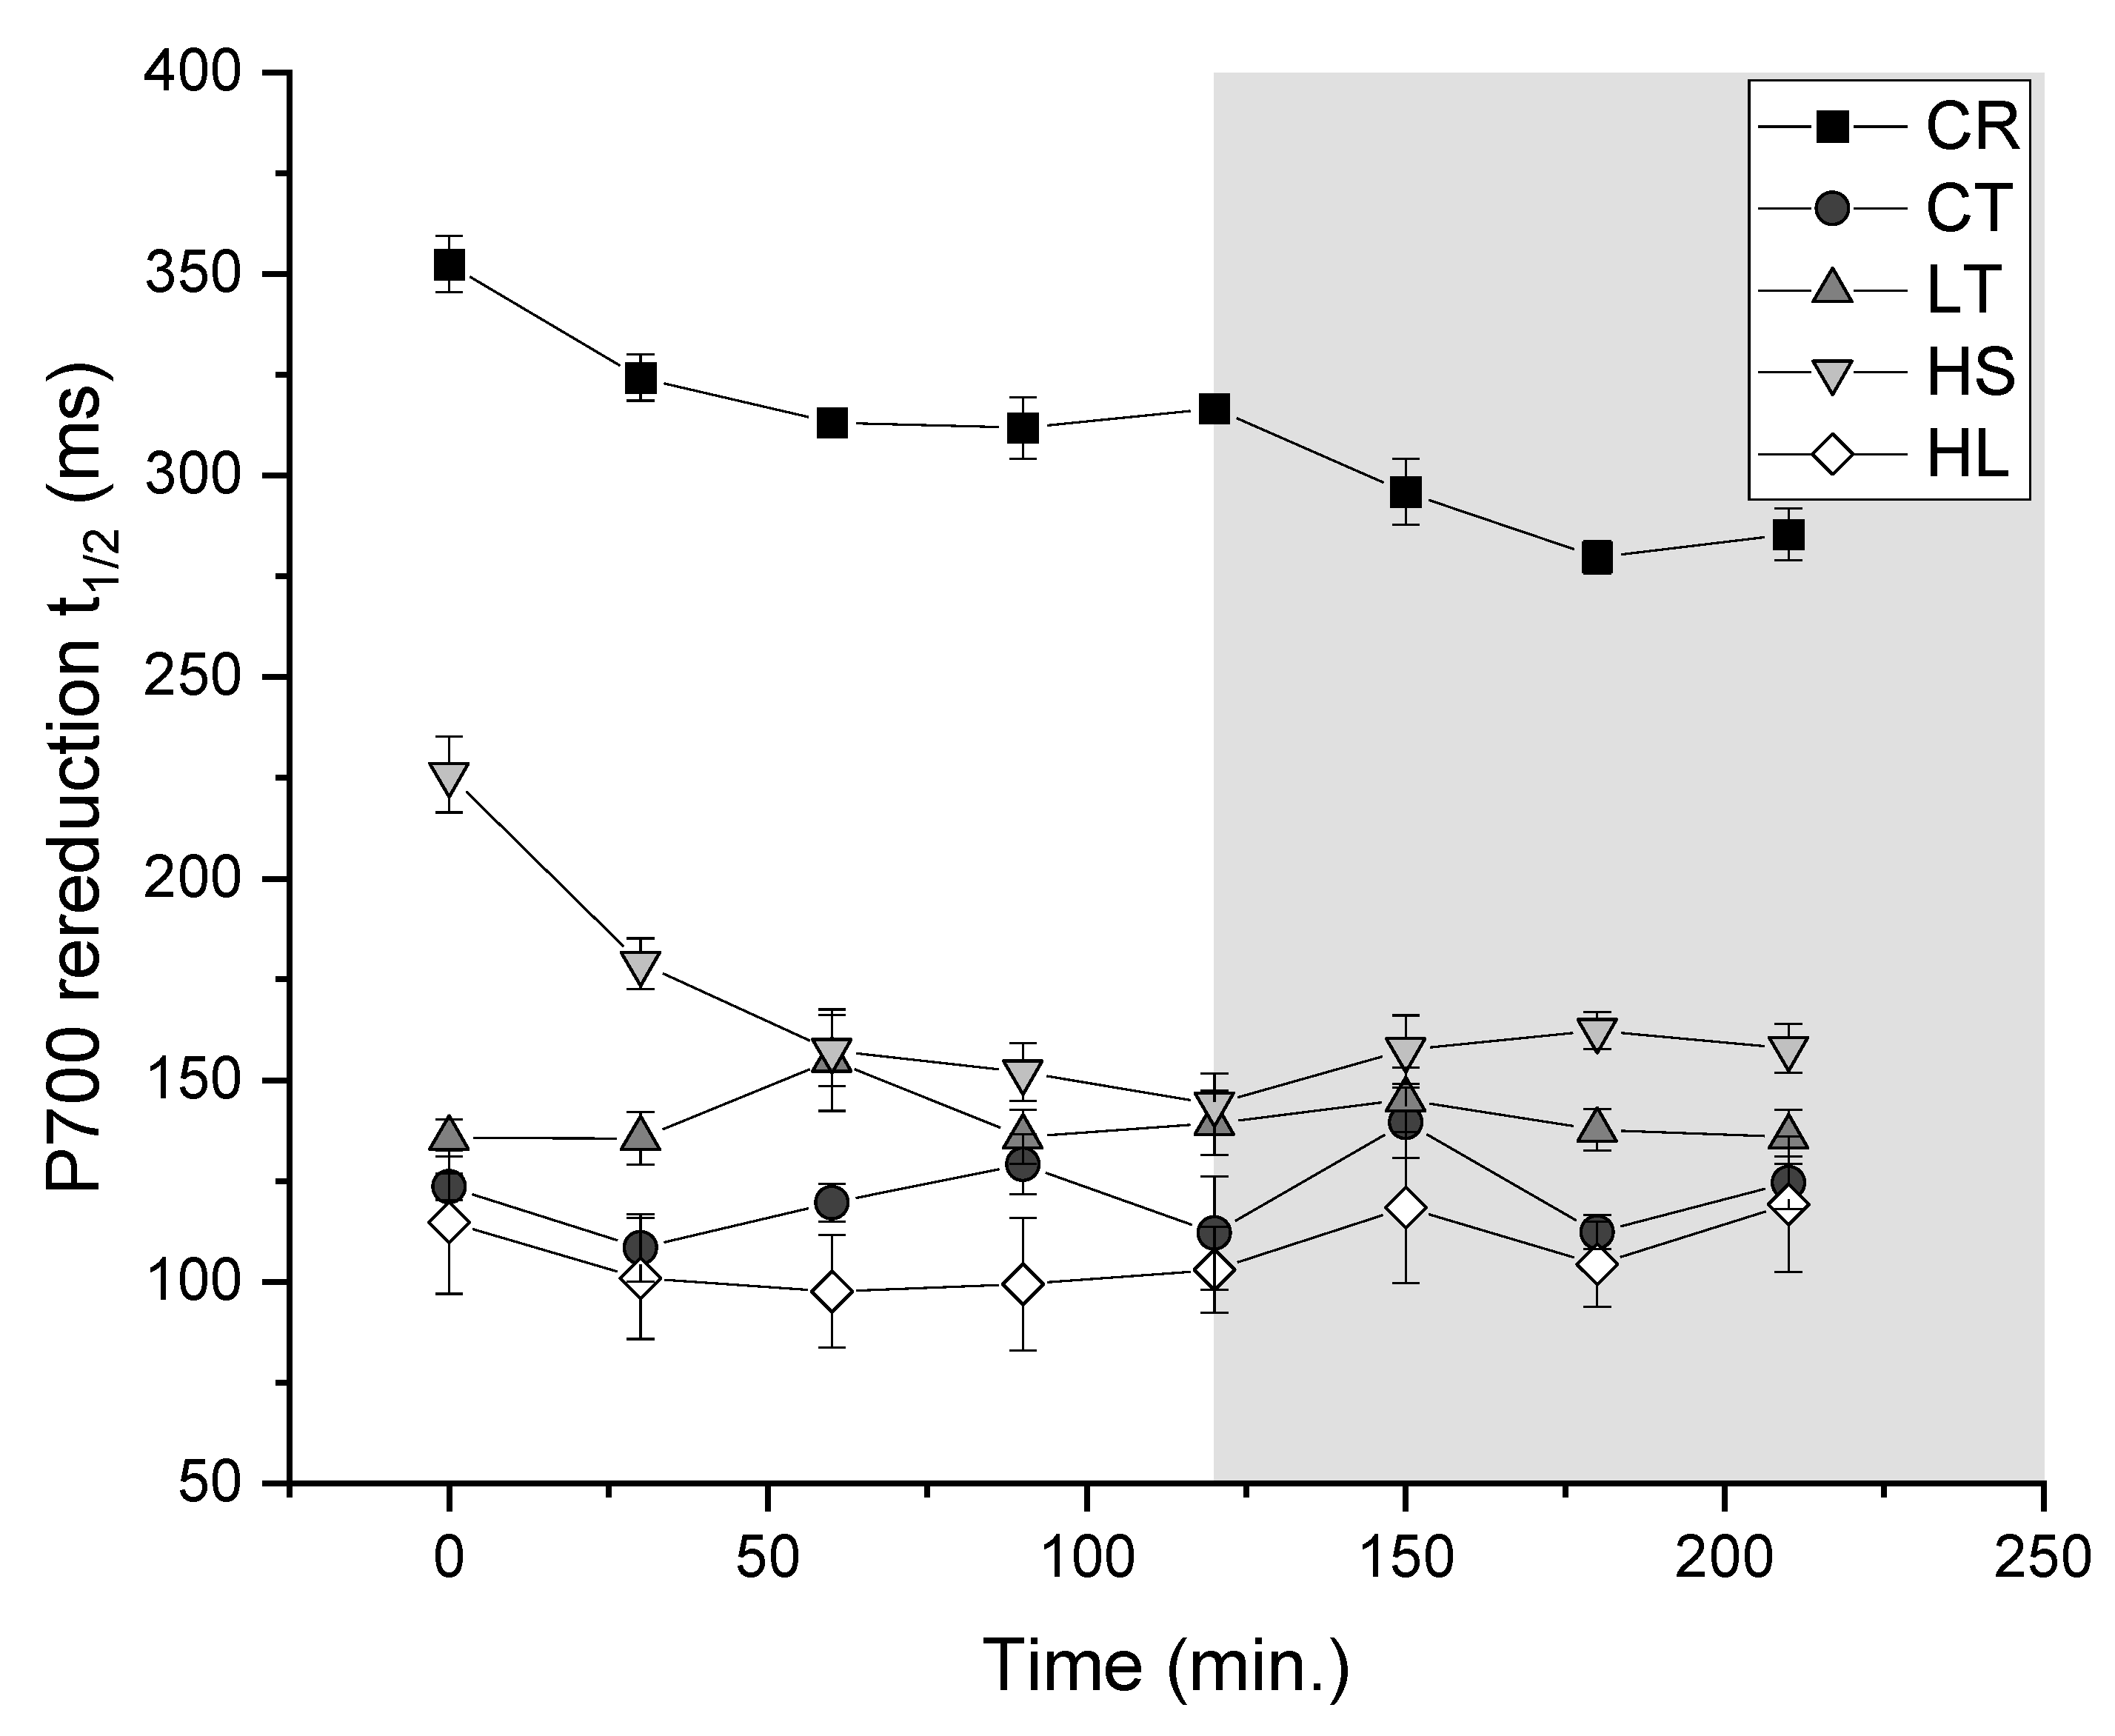
Figure 7.
A) Accumulation of H2O2 in response to the short-term high light stress as measured by fluorescence of H2DCFDA (n=9; ± SE). Statistical differences are based on a two-way ANOVA with Tukey post-hoc test (p≤0.05). B) Sensitivity of UWO241 to multiple reactive oxygen species. Cultures were spotted onto agar plates containing varying concentrations of chemical oxidants. (Rose Bengal and Methyl Viologen produce singlet oxygen and superoxide, respectively). Strain and growth conditions: CR, C. reinhardtii; CT, UWO241, control; LT, UWO241, low temperature; HS, UWO241, high salt; HL, UWO241, high light.
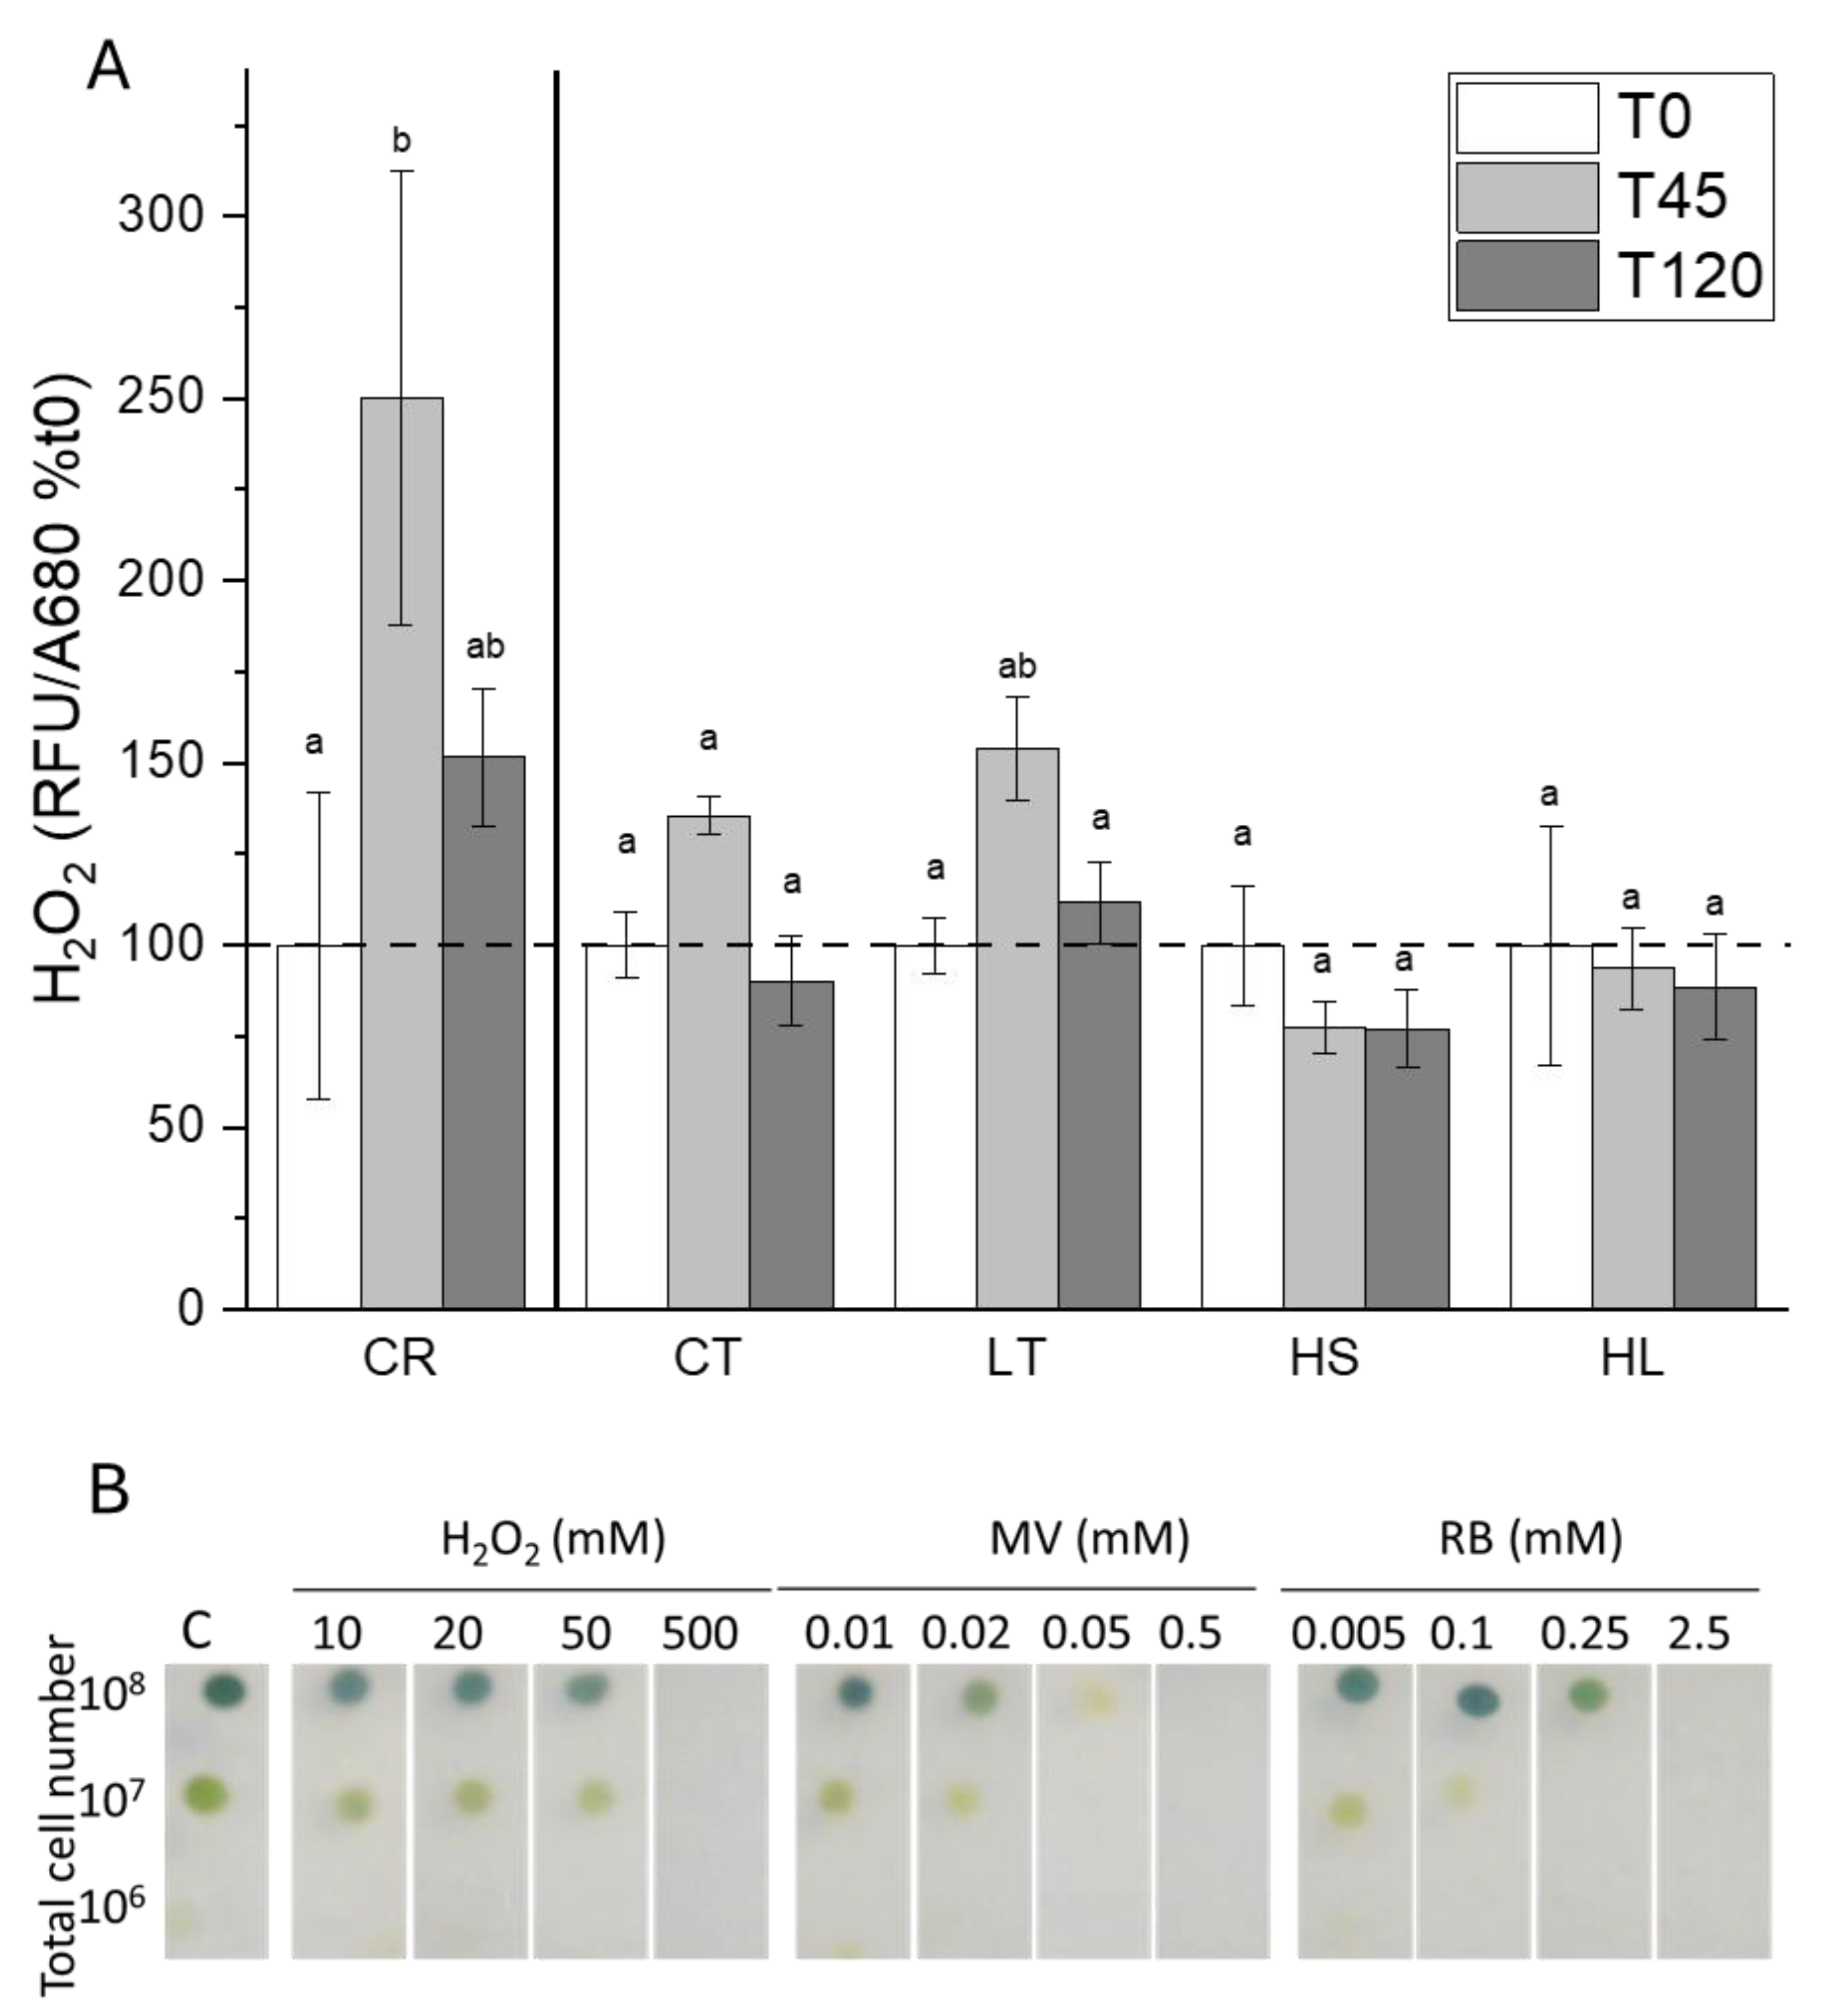

Table 1.
Comparison of physiological parameters of C. priscuii UWO241 grown under control (μmol m-2 s-1) or high light (250 μmol m-2 s-1). (n=3; ±SD).
Table 1.
Comparison of physiological parameters of C. priscuii UWO241 grown under control (μmol m-2 s-1) or high light (250 μmol m-2 s-1). (n=3; ±SD).
| Control | High Light | |
|---|---|---|
| Growth Rate (h-1) | 0.019±0.002 | 0.023±0.001* |
| Total Chl. (µg mL-1) | 8.10±2.50 | 2.96±2.08* |
| Chl. a:b | 3.65±0.106 | 4.39±0.758 |
| FV/FM | 0.664±0.008 | 0.473±0.060* |
* Indicates p<0.05 based on welch’s t-test.
Table 2.
Growth conditions of C. reinhardtii and UWO241.
| Strain/Condition | Light Intensity (μmol*m−2*s−1) | Temperature (˚C) | Salt concentration (mM NaCl) |
|---|---|---|---|
| C. reinhardtii (CR) | 50 | 20 | 0.43 |
| UWO241 Control (CT) | 50 | 8 | 0.43 |
| UWO241 Low Temperature (LT) | 50 | 2 | 0.43 |
| UWO241 High Salt (HS) | 50 | 8 | 700 |
| UWO241 High Light (HL) | 250 | 8 | 0.43 |
Disclaimer/Publisher’s Note: The statements, opinions and data contained in all publications are solely those of the individual author(s) and contributor(s) and not of MDPI and/or the editor(s). MDPI and/or the editor(s) disclaim responsibility for any injury to people or property resulting from any ideas, methods, instructions or products referred to in the content. |
© 2024 by the authors. Licensee MDPI, Basel, Switzerland. This article is an open access article distributed under the terms and conditions of the Creative Commons Attribution (CC BY) license (https://creativecommons.org/licenses/by/4.0/).
Copyright: This open access article is published under a Creative Commons CC BY 4.0 license, which permit the free download, distribution, and reuse, provided that the author and preprint are cited in any reuse.


