
Submitted:
18 July 2024
Posted:
19 July 2024
You are already at the latest version
Abstract
In the dynamic realm of HPC (High-performance computing) and cloud-native applications, ensuring optimal network performance for Kubernetes Container Network Interfaces (CNIs) is critical. Traditional manual methods for evaluating network bandwidth and latency are prone to errors, time-consuming, and lack consistency. This paper introduces a novel approach that leverages Ansible to automate and coordinate network performance tests across diverse CNIs, performance profiles, and configurations. By automating these processes, we eliminate the potential for human errors, ensure the ability to replicate the process, and significantly reduce the time required for comprehensive testing. The use of Ansible playbooks facilitates the efficient and scalable deployment, configuration, and execution of performance tests, enabling comprehensive and standardized benchmarking across various environments. The set of Ansible playbooks, which we will make available online, has a significant real-world impact by providing DevOps teams with robust and reliable tools for consistently monitoring and enhancing network performance. This, in turn, enhances the stability and efficiency of cloud-native applications, accelerates the development cycle, and ensures that Kubernetes-based infrastructures can meet the demanding performance requirements of modern applications.
Keywords:
Kubernetes
; Container Network Interfaces
; Network Performance Testing
; Ansible
; Bandwidth Measurement
; Latency Measurement
; DevOps
; Cloud-native Applications
1. Introduction
As a de facto standard for container environment management, Kubernetes simplifies deploying, managing, and scaling applications packaged in containers. With the growing dependence of organizations on Kubernetes for their production environments, it is crucial to prioritize and maintain optimal network performance. Conventional approaches to testing network bandwidth and latency typically require time-consuming manual procedures, are prone to errors, and are not readily adaptable to larger scales. This seminar paper presents a new approach to automating and coordinating the testing of network bandwidth and latency for Kubernetes container network interfaces. The methodology covers different technologies, performance profiles, and settings and utilizes Ansible.
Using Ansible to automate these tests offers substantial benefits compared to manual methods. Ansible, known for its robust automation and orchestration capabilities, guarantees consistent and replicable outcomes, minimizing the chances of human mistakes and facilitating quicker iterations. By implementing automation in the testing process, we can effectively manage intricate testing scenarios and extensive environments, which would be unfeasible to handle manually. Furthermore, automation enables the ongoing surveillance and evaluation necessary for upholding superior performance benchmarks in dynamic and scalable Kubernetes environments.
The practical impact of creating Ansible playbooks for this purpose is significant. Organizations can utilize these playbooks to obtain a more profound understanding of their network performance, rapidly detect and resolve bottlenecks, and enhance the efficiency of their Kubernetes deployments. As a result, there is an increase in application performance, better user experience, and improved operational efficiency. Therefore, implementing automated and coordinated network testing enhances the durability and strength of containerized applications, enabling organizations to accomplish their business goals confidently. This approach would be well-suited as an additional resource for performance evaluation on other platforms, like HPC. For example, contemporary research in scheduling HPC workloads might do well to implement this mechanism to get even more data on which to base ML-based Kubernetes scheduling decisions [1].
Enhancements to Ethernet networks such as Priority-based Flow Control (PFC), RDMA over Converged Ethernet (RoCE), and Enhanced Transmission Selection (ETS) on a 100 Gb/s Ethernet network configured as a tapered fat tree have been researched in the past [2]. The authors conducted tests that simulated various network operating conditions to analyze performance results. Their findings indicated that RoCE running over a PFC-enabled network significantly increased performance for bandwidth-sensitive and latency-sensitive applications compared to TCP. Additionally, they found that ETS can prevent network traffic starvation for latency-sensitive applications on congested networks. Although they did not encounter notable performance limitations in their Ethernet testbed, they concluded that traditional HPC networks still hold practical advantages unless additional external requirements drive system design.
Research has also been done regarding the Quality of Service (QoS) of Ethernet networks based on packet size, addressing the need for predictable, reliable, and guaranteed services in Ethernet networks, as standardized by IEEE 802.3 [3]. Through simulations using the Riverbed modeler 17.5, they analyzed QoS metrics like end-to-end delay, throughput, jitter, and bit error rate for varying packet sizes, mainly focusing on sizes more significant than the 1500-byte Maximum Transmission Unit (MTU) of Ethernet. The results showed distinct variations in network performance based on packet size, highlighting the importance of managing these parameters for optimizing network QoS. In their study, the authors underscore the necessity of proper segmentation to improve performance and reduce packet loss and delay.
Evaluation has also been done for network processing performance and power efficiency over 10 GbE on Intel Xeon servers [4]. Authors broke down per-packet processing overhead, revealing that driver and buffer release accounted for 46% of processing time for large I/O sizes and 54% for small I/O sizes, alongside data copy. They identified bottlenecks in the NIC driver and OS kernel using hardware performance counters. Furthermore, their study examined power consumption using a power analyzer and an external Data Acquisition System (DAQ) to profile components like CPU, memory, and NIC. These findings guided recommendations for a more efficient server I/O architecture to enhance performance and reduce power consumption in high-speed networks.
Performance measurements on 10 Gigabit Ethernet have been done using commodity hardware for high-energy physics experiments [5]. This study evaluated maximum data transfer rates through a network link, considering limitations imposed by the memory, peripheral buses, and the processing capabilities of CPUs and operating systems. Using standard and jumbo Ethernet frames, they measured TCP and UDP maximum data transfer throughputs and CPU loads for sender/receiver processes and interrupt handlers. Additionally, they simulated disk server behavior in a Storage Area Network, forwarding data via a 10 Gigabit Ethernet link. Their findings emphasized the impact of jumbo frames in reducing CPU load and improving throughput.
Researchers also explored the implementation of Energy Efficient Ethernet (EEE) in HPC systems [6]. The study analyzes EEE’s power savings and performance impact, showing that EEE can achieve up to 70% link power savings but may lead to a 15% increase in overall system power consumption due to performance overheads. The authors propose a “Power-Down Threshold” to mitigate this, reducing the on/off transition overhead from 25% to 2%, thus achieving overall system power savings of about 7.5%. Future research should optimize these strategies for better integration into HPC systems. They highlight the need for vendor-specific design decisions to fully leverage EEE in HPC environments, emphasizing the balance between energy savings and performance impacts. Challenges include addressing latency overheads and ensuring seamless integration with existing HPC infrastructure to maximize efficiency gains. Additionally, exploring adaptive mechanisms to further reduce power consumption without compromising performance is recommended.
The benchmarking study has been performed on four CNCF-recommended CNI plugins in a physical data center environment to evaluate their performance in Kubernetes [7]. The study assessed latency and average TCP throughput across various Maximum Transmission Unit (MTU) sizes, the number of aggregated network interfaces, and different interface segmentation offloading conditions. Results were compared against a bare-metal baseline, revealing significant performance variations among the plugins. Kube-Router demonstrated the highest throughput, followed by Flannel and Calico. The findings underscore the importance of selecting appropriate CNI plugins to optimize Kubernetes network performance, particularly in environments with varying network interface configurations.
Other research has been done to analyze the performance of several CNI plugins, including in Kubernetes environments [8]. Benchmarking tests conducted under various scenarios in this paper aimed to identify plugins that provided higher throughput and lower resource usage (CPU and memory), focusing on compute overhead. The study found that Kube-Router achieved the highest throughput in inter-host data exchanges, utilizing more than 90% of the nominal link bandwidth on TCP data transfer. Flannel and Calico followed in performance rankings. The research highlights the critical role of CNI plugin selection in optimizing Kubernetes network performance and resource efficiency.
A comprehensive assessment of various CNI plugins in Kubernetes, focusing on functionality, performance, and scalability, was done in 2021 [9]. The authors compared open-source CNI plugins through detailed qualitative and quantitative measurements, analyzing overheads and bottlenecks caused by interactions with the datapath/iptables and the host network stack. The study highlighted the significant role of overlay tunnel offload support in network interface cards for achieving optimal performance in inter-host Pod-to-Pod communication. Scalability with increasing Pods and HTTP workloads was also evaluated, providing valuable insights for cloud providers in selecting the most suitable CNI plugin for their environments.
A study also focused on benchmarking different network visualization architectures in Kubernetes deployments tailored for telco data plane configurations. The study evaluated the performance of various architectures, including OvS-DPDK, Single Root Input Output Virtualization (SR-IOV), and Vector Packer Processing (VPP), leveraging industry-standard testing methodologies and an open-source testing framework [10]. The research examined the effects of different resource allocation strategies on data plane performance, such as CPU-pinning, compute and storage resource variations, and Non-Uniform Memory Access (NUMA). The findings underscored the importance of optimizing resource allocation strategies to enhance data plane performance in telco Kubernetes deployments.
Researchers also investigated the sufficiency of Kubernetes’ resource management in isolating container performance, focusing on performance interference between CPU-intensive and network-intensive containers and multiple network-intensive containers [11]. Their evaluation revealed that containers experience up to 50% performance degradation due to co-located containers, even under Kubernetes’ resource management. The study identified CPU contention, rather than network bandwidth, as the root cause of performance interference. The authors recommended that Kubernetes consider CPU usage of network-related workloads in resource management to mitigate performance interference and improve overall service quality.
A GENEVE (Generic Network Virtualization Encapsulation) tunnel in a multi-cloud environment at Trans-Eurasia Internetworking (TEIN) with sites in Malaysia and South Korea was deployed for a performance evaluation [12]. The study highlighted GENEVE’s advantage in transferring larger payloads due to its smaller header size than other Layer 2 tunnels like GRE or VXLAN. They emphasized the importance of monitoring tools for network and instance performance forecasting. Machine learning algorithms can use data from these tools to predict optimal cloud and instance performance, ensuring resource sharing is efficient and not overutilized. Their implementation demonstrated that GENEVE tunnels could effectively facilitate communication and resource sharing between cloud instances.
Researchers also proposed an SDN-based optimization for VXLAN in cloud computing networks [13]. They introduced an intelligent center to enhance multicast capabilities and facilitate VM migration within the VXLAN architecture. This new architecture addresses issues like signaling overhead during multicast periods and communication interruptions with migrating VMs. Their Mininet emulation demonstrated effective load balancing and highlighted the potential improvements in VXLAN’s multicast efficiency and VM migration facilitation. This work provides a blueprint for future cloud computing networks to enhance their performance and reliability.
The Segment-oriented Connection-less Protocol (SCLP), a novel Layer 4 protocol for existing tunneling protocols like VXLAN and NVGRE, was introduced and evaluated by researchers [14]. SCLP was designed to enhance the performance of software tunneling by leveraging the Generic Receive Offload (GRO) feature in the Linux kernel, thereby reducing the number of software interrupts. The authors implemented VXLAN over SCLP and compared its performance with the original UDP-based VXLAN, NVGRE, GENEVE, and STT. Their results showed that SCLP achieved throughput comparable to STT and significantly higher than the other protocols without modifying existing protocol semantics, making it a viable alternative for high-performance software tunneling in data centers.
A research paper focused on improving the performance of Open vSwitch VXLAN in cloud data centers through hardware acceleration proposed a design that utilizes hardware acceleration methods to enhance the throughput performance of VXLAN [15]. Their implementation demonstrated a fivefold increase in performance, achieving up to 12 Gbps throughput, compared to the 2 Gbps achieved by software-only solutions. This significant improvement underscores the potential of hardware acceleration in optimizing virtualized network environment performance in cloud data centers.
Researchers also detailed the VXLAN framework for overlaying virtualized Layer 2 networks over Layer 3 networks [16]. This protocol addresses the need for scalable overlay networks within virtualized data centers, accommodating multiple tenants. VXLAN’s deployment in cloud service providers and enterprise data centers helps overcome the limitations of traditional VLANs. The protocol’s ability to encapsulate Ethernet frames in UDP packets allows for effective communication across IP networks, making it a crucial component in multi-tenant cloud infrastructures.
Challenges of measuring latencies in high-speed optical networks, particularly in scenarios requiring microsecond resolution, have also been researched [17]. Researchers propose a software-based solution for latency measurement using high-performance packet engines like DPDK, which provides a cost-effective alternative to hardware-based methods. The paper introduces a novel concept of a convoy of packet trains to measure bandwidth and latency accurately, demonstrating the feasibility of their approach in 10 Gbit/s networks.
Researchers also debated a method for real-time measurement of end-to-end path latency in Software-Defined Networks (SDN) [18]. They propose improving the looping technique by using IP TTL as a counter and measuring latency per link stored in the SDN controller. This method reduces redundant work and network overhead, providing accurate and efficient latency measurements. Their approach also includes a technique for measuring latency using queue lengths at network switches, further reducing network overhead.
Machine learning-based methods for estimating network latency that does not require explicit measurements have also been researched [19]. ML is trained using the iConnect-Ubisoft dataset and uses IP addresses as the primary input to predict latencies between nodes. Performance evaluations show high accuracy and speed, with a significant proportion of measurements falling within a low estimation error margin. This method offers a fast and efficient alternative to traditional latency measurement techniques in large-scale network systems.
In 2021, researchers developed Formullar, a novel FPGA-based network testing tool designed to measure ultra-low latency (ULL) in highly precise and flexible networking systems [20]. The tool comprises a hybrid architecture with hardware (FPGA) and software components, enabling accurate packet generation and timing control according to various traffic patterns. The hardware layer measures latency based on packet generation and reception timings, providing exact results. Evaluations indicate that Formullar achieves nanosecond precision at a bandwidth of 10 Gbps, making it suitable for time-sensitive applications requiring strict latency guarantees.
The paper “Catfish: Adaptive RDMA-Enabled R-Tree for Low Latency and High Throughput” presents an RDMA-enabled R-tree designed to handle large multidimensional datasets in distributed systems [21]. The authors address performance challenges where R-tree servers are often overloaded while networks and client CPUs are underutilized. Catfish uses RDMA to balance workloads between clients and servers, employing two fundamental mechanisms: fast messaging, which uses RDMA writes to achieve low query latency, and RDMA offloading, which offloads tree traversal to clients. The adaptive switching between these methods maximizes overall performance. Experiments demonstrate that Catfish significantly outperforms traditional TCP/IP schemes, achieving lower latency and higher throughput on InfiniBand networks. Future research is suggested to optimize adaptive mechanisms further and explore deployment in diverse network environments.
In 2019, researchers proposed LLDP-looping, a novel latency monitoring method for software-defined networks (SDNs) [22]. This method uses LLDP packets injected repeatedly in the control plane to determine latency between switches, providing continuous and accurate latency monitoring without dedicated network infrastructure. LLDP-looping minimizes overhead and achieves high measurement accuracy, with evaluations demonstrating over 90% accuracy compared to Ping in an SDN with link latency as small as 0.05 ms. The method can be applied to various networking scenarios with minimal modifications to SDN switches.
In 2020 [23], a multimodal deep learning-based method for estimating network latency in large-scale systems was also researched. The system uses a deep learning algorithm to predict latencies from a small set of RTT measurements, significantly reducing the overhead associated with traditional measurement methods. The AI model achieved high accuracy, outperforming existing techniques, with a 90th percentile relative error of 0.25 and an average accuracy of 96.1%, demonstrating its effectiveness for large-scale network latency estimation.
In 2020, researchers proposed an ultra-low latency MAC/PCS IP for high-speed Ethernet, targeting data centers with high data throughput and transmission delay requirements. The study analyzed low-latency technologies and implemented a simulation experiment to measure latency on different platforms. The proposed MAC/PCS IP showed significant latency improvements compared to existing solutions, making it suitable for applications requiring ultra-low latency in high-speed Ethernet environments.
2. Technology Overview
In this section, we’ll introduce the technology used in this paper. Specifically, we’ll discuss the three main components of our platform for performance evaluation—Ansible, MySQL, and Grafana—with a focus on Ansible. This will give us a firm understanding of why these components were selected and how they contributed to the final platform and our research. At the time of writing, the latest versions available were Ansible 2.17.1, MySQL 9.0.0, and Grafana 9.5.20. Our custom Docker image used for testing is based on Ubuntu 24.04, with added packages for testing purposes (iperf3 3.16, netperf 2.7.0).
2.1. Ansible
Ansible is a robust open-source tool for automation, orchestration, software deployment, and configuration management. It has garnered considerable attention because of its straightforwardness, effectiveness, and lack of need for an agent-based architecture. Ansible utilizes YAML for configuration, rendering it easily understandable and editable by individuals. Additionally, it functions over SSH, augmenting its security and user-friendliness [25].
The Ansible architecture is simple and comprises control nodes, managed nodes, and playbooks. The control node is where Ansible is installed and from where playbooks run, which are scripts that define the desired system configuration. Managed nodes refer to the systems configured by the control node using playbooks [26]. Ansible playbooks are designed to be idempotent, meaning they can be executed multiple times without altering the outcome beyond the initial application. This characteristic guarantees consistent and repeatable operations [27].
An essential benefit of Ansible is its agentless design. Unlike other tools for managing configurations, Ansible does not necessitate the installation of any software agents on the nodes being managed. Instead, it utilizes conventional SSH connections, streamlining the configuration process and decreasing the burden on managed systems [28]. Ansible’s agentless approach enhances security by leveraging the existing SSH infrastructure [29].
Ansible plays a crucial role in automation and orchestration. It enables the automation of intricate tasks like continuous integration and deployment (CI/CD) pipelines, as exemplified by its integration with Jenkins for automated deployment [30]. Ansible’s automation capabilities encompass server configuration management, resulting in decreased human error and increased productivity by automating repetitive tasks [31].
Ansible is proficient in managing cloud infrastructure as code (IaC). It combines with other tools like Terraform to automate setting up and configuring resources, including Hadoop clusters [32]. Ansible plays a significant role in TOSCA orchestration by simplifying multi-cloud deployments by creating playbooks from TOSCA templates [33].
It is also noteworthy that Ansible guarantees quality and security in infrastructure management. Research has demonstrated that infrastructure such as code scripts and Ansible playbooks require thorough testing to prevent configuration and security flaws [34]. Packaging Ansible configurations into secure RPM packages further improves their reliability and tamper-proof deployment [35].
In addition, although occasionally regarded as a suboptimal approach, Ansible’s utilization of imperative modules showcases its adaptability in executing tasks not inherently supported by Ansible’s default modules [36]. Ansible’s automated solutions for network configuration, including the deployment of virtual routers, demonstrate its ability to minimize human errors and enhance efficiency [37].
Furthermore, Ansible plays a crucial role in DevOps methodologies by offering server management and configuration automation, which decreases operational expenses and minimizes human mistakes [38]. Additionally, it assists in resolving typical difficulties programmers encounter in configuration as code (CaC) environments, such as managing syntax errors and provisioning instances [39].
Ansible has demonstrated its effectiveness in managing extensive quantities of servers and end stations in academic settings, highlighting its scalability and user-friendly nature [40]. The study on the frequency and consequences of code smells related to variables in Ansible infrastructure code highlights the importance of ongoing quality assessments and enhancements in Infrastructure as Code (IaC) methodologies [41].
Ansible’s incorporation into CI/CD pipelines, specifically for containerized applications, showcases its capacity to streamline continuous deployment and guarantee uninterrupted operation. It is an indispensable tool in software development and operations [42].
2.2. Backend Services—MySQL And Grafana
When MySQL and Grafana are combined, they create a formidable combination for monitoring performance, offering strong data management and enlightening visualization capabilities. MySQL is a well-known open-source relational database management system highly regarded for its exceptional performance, reliability, and user-friendly interface [43]. It effectively manages substantial data, making it well-suited for storing and overseeing various datasets [44]. Grafana is an open-source platform specifically created for monitoring and visualizing data. It enables users to create interactive and customizable dashboards [45] efficiently.
MySQL employs a client-server model, in which the server oversees the database, and the clients interact with the server to solicit data. The software supports multiple storage engines, allowing users to configure them to enhance performance according to specific usage scenarios [46]. Grafana’s architecture revolves around data source plugins, enabling it to connect with various databases, such as MySQL. Grafana fetches data from MySQL and displays it in a visually appealing and intuitive graphical representation [47].
By integrating MySQL and Grafana, an organization can significantly enhance its monitoring capabilities. MySQL functions as a dependable backend database, storing essential performance metrics, while Grafana offers real-time visualization of these metrics, allowing for rapid detection of patterns and irregularities [48]. This integration is especially advantageous in situations necessitating ongoing surveillance, such as in meteorological stations or manufacturing settings [49,50].
Integrating MySQL’s resilient data handling capabilities with Grafana’s formidable visualization tools makes it a vital configuration for real-time performance monitoring. This pair assists organizations in obtaining extensive insights into their operations, encompassing monitoring environmental conditions in laboratories and analyzing human resource data [51,52].
To summarize, combining MySQL and Grafana provides a scalable, efficient, and adaptable solution for monitoring performance. MySQL’s robust data management capabilities and Grafana’s powerful visualization capabilities enable organizations to efficiently monitor, analyze, and optimize their operations.
3. Challenges in Using Non-Automated Methodologies for Performance Evaluation
From a scientific perspective, the most significant issues when comparing automated and orchestrated performance measurement of Kubernetes container network interfaces to manual testing revolve around several key factors:
- Consistency: Manual testing is highly susceptible to variability due to human factors. Different testers may follow slightly different procedures or make unintentional errors, leading to inconsistent results. Automation ensures that procedures are followed continuously, providing consistent and reliable data.
- Scalability: Manual testing becomes increasingly impractical as the scale of the network environment grows. Large-scale Kubernetes deployments require extensive testing across numerous nodes and configurations, which is time-consuming and labor-intensive when done manually. On the other hand, automated testing can handle large volumes of tests quickly and efficiently without significant human intervention.
- Reproducibility: Reproducibility is another critical factor; automated tests can be easily repeated to verify results or test under different conditions, whereas manual tests are difficult to replicate with the same precision.
- Human Error: Human error is a persistent issue in manual testing, as even the most experienced testers can make mistakes that skew results. Automation minimizes the risk of such errors, leading to more accurate and trustworthy outcomes.
- Time Efficiency: Automated testing has a significant advantage in terms of time efficiency. Manual testing can take days or weeks, whereas orchestrated systems can perform the same tasks in a fraction of the time, freeing up valuable human resources for more strategic activities.
While manual testing of Kubernetes CNIs can provide valuable insights, the drawbacks related to consistency, scalability, reproducibility, human error, and time efficiency make it less desirable compared to automated and orchestrated approaches. Automation ensures more reliable and consistent results and significantly enhances the ability to handle large-scale environments and complex testing scenarios. By minimizing human error and reducing the time required for testing, automated methodologies empower organizations to maintain high-performance standards, optimize their deployments, and allocate their human resources more effectively. Consequently, adopting an automated and orchestrated testing approach is crucial for achieving robust and efficient network performance in Kubernetes environments.
4. Methodology
We based our methodology on default, built-in, and custom settings for performance profiles. We used five built-in performance profiles that are a part of the tuned package in Linux. We also made two custom profiles related to kernel optimizations and NIC optimizations. Every test was done five times to have some testing consistency and data. This is the list of all performance tuning profiles we used:
- Default settings
- Kernel optimizations
- NIC optimizations
- Tuned accelerator-performance profile
- Tuned HPC-compute profile
- Tuned latency-performance profile
- Tuned network-latency profile
- Tuned network-throughput profile
Then, we also paired that with different network standards:
- Gigabit Ethernet
- 10 Gigabit Ethernet
- 1 Gigabit Ethernet in Link Aggregated mode
- Fiber-to-copper 10 Gigabit Ethernet
- Local copy
Also, we paired that with multiple different packet sizes, with MTU values set to 1500 and 9000 (commonly used options):
- 64 bytes
- 512 bytes
- 1472 bytes
- 9000 bytes
- 15000 bytes
In terms of CNIs, we used:
- Antrea 2.0.0
- Flannel 0.25.4
- Cilium 1.15.6
- Calico 3.20.0
A stack of Ansible playbooks represented each set of tests in a separate directory, and we made a final playbook that included all the sub-directory playbooks, as can be seen in Figure 1:
For these tests, we made a stack of Ansible playbooks that installed all the necessary components, reviewed all these performance evaluations, and stored their results in a MySQL database. Initially, we worked with a set of CSV files for test results but quickly realized this would become impractical, considering the amount of data we needed to analyze. We are talking about a couple of thousand results that testing parameters must also average out. Then, data in the MySQL database is used by Grafana to produce real-time performance graphs we can investigate. This also made for a setup that we could use in production environments. However, this research aimed to create an Ansible-based methodology for these performance evaluations that anyone can use. For this reason, we will publish our Ansible playbooks on GitHub so everyone can evaluate and use them. They will be accompanied by simple documentation so anyone can do the necessary configuration and run their tests.
A combination of shell scripts (a small minority) and Ansible playbooks was used to implement complete functionality for this paper. Shell scripts are used only in cases where they’re the most convenient way to implement certain functionality. Specifically, three shell scripts are used for three important tasks:
- to fetch Kubernetes logs;
- to parse logs.
- to run tests.
This is a portion of the script that parses logs—the first part of the script is all about setting some variables that are going to be used through the script:
# Listing all the test optimization levels
TEST_OPTIMIZATIONS=(“1-default_settings” “2-kernel_optimizations” “3-nic_optimizations” “4-tuned_acc_performance” “5-tuned_hpc_compute” “6-tuned_latency_performance” “7-tuned_network_latency” “8-tuned_network_throughput”)
# Listing all the test configurations for which the logs will be processed
TEST_CONFIGURATIONS=(“1-gigabit” “10-gigabit” “10-gigabit-lag” “fiber-to-fiber” “local”)
# Listing all the MTU values used in the tests
TEST_MTU_VALUES=(“1500” “9000”)
# Listing all the packet sizes used in the tests
TEST_PACKET_SIZES=(“64” “512” “1472” “9000” “15000”)
# Change this value according to your needs
TEST_LOG_DIRECTORY=“../logs/doktnet01/testing_results”
# Change this value according to your needs
PARSED_LOG_DIRECTORY=“../logs/parsed.”
Now that these variables are set, we can start the workload part of the script, contained in the next excerpt:
for test_optimization in ${TEST_OPTIMIZATIONS[@]};
do
for test_configuration in ${TEST_CONFIGURATIONS[@]};
do
bandwidth_logs_directory=“${TEST_LOG_DIRECTORY}/${test_optimization}/${test_configuration}/bandwidth”
# Create the bandwidth_logs_directory
mkdir -p “${PARSED_LOG_DIRECTORY}/${test_optimization}/${test_configuration}/bandwidth”
# Find all the protocol-specific logs
for protocol in “tcp” “udp”;
do
proto_bandwidth_logs_files=$(find $bandwidth_logs_directory -name “*${protocol}*” -print)
for bandwidth_log_file in ${proto_bandwidth_logs_files[@]};
do
# From the filename, get the mtu
log_file_mtu=$(echo $bandwidth_log_file | rev | cut -d ‘/’ -f1 | rev | cut -d ‘-’ -f3)
# From the filename, get the packet size
log_file_packet_size=$(echo $bandwidth_log_file | rev | cut -d ‘/’ -f1 | rev | cut -d ‘-’ -f5 )
# From the file get bandwidth
BANDWIDTH=$(tail -n4 ${bandwidth_log_file} | head -n1 | awk ‘{print $7 $8}’)
echo $BANDWIDTH >> “${PARSED_LOG_DIRECTORY}/${test_optimization}/${test_configuration}/bandwidth/${protocol}-mtu-${log_file_mtu}-packet-${log_file_packet_size}.log”
echo “PROTO: ${protocol} - ${bandwidth_log_file} - MTU: ${log_file_mtu} - packet: ${log_file_packet_size}”
done
done
latency_logs_directory=“${TEST_LOG_DIRECTORY}/${test_optimization}/${test_configuration}/latency”
# Create the latency_logs_directory
mkdir -p “${PARSED_LOG_DIRECTORY}/${test_optimization}/${test_configuration}/latency”
# Find all the protocol-specific logs
for protocol in “tcp” “udp”;
do
proto_latency_logs_files=$(find $latency_logs_directory -name “*${protocol}*” -print)
for latency_log_file in ${proto_latency_logs_files[@]};
do
# From the filename, get the mtu
log_file_mtu=$(echo $latency_log_file | rev | cut -d ‘/’ -f1 | rev | cut -d ‘-’ -f3)
# From the filename, get the packet size
log_file_packet_size=$(echo $latency_log_file | rev | cut -d ‘/’ -f1 | rev | cut -d ‘-’ -f5 )
# From the file get the latency
LATENCY=$(tail -n4 ${latency_log_file} | head -n1 | awk ‘{print $7 $8}’)
# Save the latency to the specific log file
echo $LATENCY >> “${PARSED_LOG_DIRECTORY}/${test_optimization}/${test_configuration}/latency/${protocol}-mtu-${log_file_mtu}-packet-${log_file_packet_size}.log”
echo “PROTO: ${protocol} - ${latency_log_file} - MTU: ${log_file_mtu} - packet: ${log_file_packet_size}”
done
done
done
done
As there are many sub-loops to this process for different configurations for each CNI tested, we had to ensure that the script goes through all possible optimizations and configurations.
The next script is all about running our pre-defined tests for all the possible scenarios:
# Listing all the test optimization levels
TEST_OPTIMIZATIONS=(“1-default_settings” “2-kernel_optimizations” “3-nic_optimizations” “4-tuned_acc_performance” “5-tuned_hcp_compute” “6-tuned_latency_performance” “7-tuned_network_latency” “8-tuned_network_throughput”)
# Listing all the test configurations
TEST_CONFIGURATIONS=(“1-gigabit” “10-gigabit” “10-gigabit-lag” “fiber-to-fiber” “local”)
# Define either operating-system or Kubernetes testing
TEST_ENVIRONMENT=“kubernetes”
# Define BANDWIDTH_SERVER -> endpoint to which the tests are pointed
BANDWIDTH_SERVER=“172.16.21.2”
# Define LATENCY_SERVER -> endpoint to which the tests are pointed
LATENCY_SERVER=“172.16.21.2”
for optimization in ${TEST_OPTIMIZATIONS[@]};
do
ansible-playbook -i inventory test_optimization/$optimization/setup.yml ;
for configuration in ${TEST_CONFIGURATIONS[@]};
do
ansible-playbook -i inventory tests/test_cleanup.yml ;
ansible-playbook -i inventory test_configuration/$configuration/test.yml --extra-vars “bandwidth_server=$BANDWIDTH_SERVER” --extra-vars “latency_server=$LATENCY_SERVER” --extra-vars “test_optimization=$optimization” --extra-vars “test_environment=$TEST_ENVIRONMENT”;
done
ansible-playbook -i inventory test_optimization/$optimization/cleanup.yml ;
done
The cleanup process is also included, but this tends to be very involved if it needs to be done manually. IP addresses can be changed easily for testing in different subnets - subnets chosen in the paper are used because they weren’t used in our environment.
The Ansible part of the methodology presented in this paper starts with some variable definitions, as visible from the code excerpt below:
---
results_dir: “/testing_results”
test_configuration: “10-gigabit”
test_devices:
- “ens2f0”
- “ens1f0”
mtu_values:
- 1500:
- 9000
packet_sizes:
- 64
- 512
- 1472
- 9000
- 15000
protocols:
- “tcp”
- “udp”
This will ensure that all the necessary tests and variables are available as one file, which can be included in other Ansible playlists, simplifying the process. Also, this file can be used to change the names of network interfaces used, simplifying the process if different interfaces need to be used.
The following Ansible code for TCP and UDP handles bandwidth testing:
- name: Test information
debug:
msg:
- “Testing bandwidth with the following configuration: “
- “ - Test optimization: {{ test_optim }}”
- “ - Test configuration: {{ test_config }}”
- “ - Test endpoint: {{ test_endpoint }}”
- “ - Test port: {{ test_port }}”
- “ - Test packet size: {{ test_packet_size }}”
- “ - Test mtu: {{ test_mtu }}”
- “ - Test duration: {{ test_duration }}”
- “ - Test protocol: {{ test_protocol }}”
- “ - Test environment: {{ test_env }}”
when: ansible_hostname == “{{ test_hostname }}”
- name: Testing bandwidth over TCP
shell: “iperf3 -c {{ test_endpoint }} -p {{ test_port }} -l {{ test_packet_size }} -t {{ test_duration }} >> {{ test_log_output }}”
when: ansible_hostname == “{{ test_hostname }}” and test_protocol == “tcp” and test_env == “operating-system”
- name: Testing bandwidth over UDP
shell: “iperf3 -c {{ test_endpoint }} -p {{ test_port }} -u -l {{ test_packet_size }} -t {{ test_duration }} >> {{ test_log_output }}”
when: ansible_hostname == “{{ test_hostname }}” and test_protocol == “udp” and test_env == “operating-system”
- name: Generate random string
set_fact:
random_name: “{{ lookup(‘community.general.random_string’, length=15,upper=false, numbers=false, special=false) }}”
- name: Testing bandwidth over TCP
become: false
k8s:
state: present
kubeconfig: “{{ kubeconfig }}”
definition:
apiVersion: batch/v1
kind: Job
metadata:
name: bandwidth-tcp-{{ random_name }}
namespace: default
labels:
app: bandwidth-tcp-test
mtu: “{{ test_mtu }}”
packet: “{{ test_packet_size }}”
optimization: “{{ test_optim }}”
config: “{{ test_config }}”
protocol: “{{ test_protocol }}”
spec:
template:
metadata:
labels:
app: bandwidth-tcp-test
mtu: “{{ test_mtu }}”
packet: “{{ test_packet_size }}”
optimization: “{{ test_optim }}”
config: “{{ test_config }}”
protocol: “{{ test_protocol }}”
spec:
nodeSelector:
kubernetes.io/hostname: doktnet01
containers:
- name: iperf3
image: hpc/cni-performance-testing:1.0
command: [“iperf3”, “-c”, “{{ test_endpoint }}”, “-p”, “{{ test_port }}”,”-l”,”{{ test_packet_size }}”, “-t”, “{{ test_duration }}”]
volumeMounts:
- name: testing-results
mountPath: /testing_results
volumes:
- name: testing-results
hostPath:
path: /testing_results
type: DirectoryOrCreate
restartPolicy: Never
backoffLimit: 4
delegate_to: localhost
when: test_protocol == “tcp” and ansible_hostname == “{{ test_hostname }}” and test_env == “kubernetes”
- name: Testing bandwidth over UDP
become: false
k8s:
state: present
kubeconfig: “{{ kubeconfig }}”
definition:
apiVersion: batch/v1
kind: Job
metadata:
name: bandwidth-udp-{{ random_name }}
namespace: default
labels:
app: bandwidth-udp-test
mtu: “{{ test_mtu }}”
packet: “{{ test_packet_size }}”
optimization: “{{ test_optim }}”
config: “{{ test_config }}”
protocol: “{{ test_protocol }}”
spec:
template:
metadata:
labels:
app: bandwidth-udp-test
mtu: “{{ test_mtu }}”
packet: “{{ test_packet_size }}”
optimization: “{{ test_optim }}”
config: “{{ test_config }}”
protocol: “{{ test_protocol }}”
spec:
nodeSelector:
kubernetes.io/hostname: doktnet01
containers:
- name: iperf3
image: hpc/cni-performance-testing:1.0
command: [“iperf3”, “-c”, “{{ test_endpoint }}”, “-p”, “{{ test_port }}”,”-u”,”-l”,”{{ test_packet_size }}”, “-t”, “{{ test_duration }}”]
ports:
- containerPort: 5201
name: iperf3
volumeMounts:
- name: testing-results
mountPath: /testing_results
volumes:
- name: testing-results
hostPath:
path: /testing_results
type: DirectoryOrCreate
restartPolicy: Never
backoffLimit: 4
delegate_to: localhost
when: test_protocol == “udp” and ansible_hostname == “{{ test_hostname }}” and test_env == “kubernetes”
- name: Waiting for the testing job to finish
pause:
seconds: 40
prompt: “Waiting 40 seconds for the testing job to finish”
echo: false
when: test_env == “kubernetes” and ansible_hostname == “{{ test_hostname }}”
Testing latency is similar to this code, but it utilizes a different command and a different set of parameters, as visible from the following code:
- name: Test information
debug:
msg:
- “Testing latency with the following configuration:”
- “ - Test optimization: {{ test_optim }}”
- “ - Test configuration: {{ test_config }}”
- “ - Test endpoint: {{ test_endpoint }}”
- “ - Test mtu: {{ test_mtu }}”
- “ - Test duration: {{ test_duration }}”
- “ - Test protocol: {{ test_protocol }}”
- “ - Test environment: {{ test_env }}”
when: ansible_hostname == “{{ test_hostname }}”
- name: Testing latency over TCP
shell: “netperf -H {{ test_endpoint }} -l {{ test_duration }} -t TCP_RR -v 2 -- -o min_latency,mean_latency,max_latency,stddev_latency,transaction_rate >> {{ test_log_output }}”
when: ansible_hostname == “{{ test_hostname }}” and test_protocol == “tcp” and test_env == “operating-system”
- name: Testing latency over UDP
shell: “netperf -H {{ test_endpoint }} -l {{ test_duration }} -t UDP_RR -v 2 -- -o min_latency,mean_latency,max_latency,stddev_latency,transaction_rate >> {{ test_log_output }}”
when: ansible_hostname == “{{ test_hostname }}” and test_protocol == “udp” and test_env == “operating-system”
- name: Generate random string
set_fact:
random_name: “{{ lookup(‘community.general.random_string’, length=15,upper=false, numbers=false, special=false) }}”
- name: Testing latency over TCP
become: false
k8s:
state: present
kubeconfig: “{{ kubeconfig }}”
definition:
apiVersion: batch/v1
kind: Job
metadata:
name: latency-tcp-{{ random_name }}
namespace: default
labels:
app: latency-tcp-test
mtu: “{{ test_mtu }}”
optimization: “{{ test_optim }}”
config: “{{ test_config }}”
protocol: “{{ test_protocol }}”
spec:
template:
metadata:
labels:
app: latency-tcp-test
mtu: “{{ test_mtu }}”
optimization: “{{ test_optim }}”
config: “{{ test_config }}”
protocol: “{{ test_protocol }}”
spec:
nodeSelector:
kubernetes.io/hostname: doktnet01
containers:
- name: netperf
image: hpc/cni-performance-testing:1.0
command: [“netperf”, “-H”, “{{ test_endpoint }}”,”-l”, “{{ test_duration }}”, “-t”, “TCP_RR”, “-v”, “2”, “--”, “-o”,”min_latency,mean_latency,max_latency,stddev_latency,transaction_rate”]
volumeMounts:
- name: testing-results
mountPath: /testing_results
volumes:
- name: testing-results
hostPath:
path: /testing_results
type: DirectoryOrCreate
restartPolicy: Never
backoffLimit: 4
delegate_to: localhost
when: test_protocol == “tcp” and ansible_hostname == “{{ test_hostname }}” and test_env == “kubernetes”
- name: Testing latency over UDP
become: false
k8s:
state: present
kubeconfig: “{{ kubeconfig }}”
definition:
apiVersion: batch/v1
kind: Job
metadata:
name: latency-udp-{{ random_name }}
namespace: default
labels:
app: latency-udp-test
mtu: “{{ test_mtu }}”
optimization: “{{ test_optim }}”
config: “{{ test_config }}”
protocol: “{{ test_protocol }}”
spec:
template:
metadata:
labels:
app: latency-udp-test
mtu: “{{ test_mtu }}”
optimization: “{{ test_optim }}”
config: “{{ test_config }}”
protocol: “{{ test_protocol }}”
spec:
nodeSelector:
kubernetes.io/hostname: doktnet01
containers:
- name: netperf
image: hpc/cni-performance-testing:1.0
command: [“netperf”, “-H”, “{{ test_endpoint }}”, “-l”, “{{ test_duration }}”, “-t”, “UDP_RR”, “-v”, “2”, “--”, “-o”,”min_latency,mean_latency,max_latency,stddev_latency,transaction_rate”]
ports:
- containerPort: 5201
name: netperf
volumeMounts:
- name: testing-results
mountPath: /testing_results
volumes:
- name: testing-results
hostPath:
path: /testing_results
type: DirectoryOrCreate
restartPolicy: Never
backoffLimit: 4
delegate_to: localhost
when: test_protocol == “udp” and ansible_hostname == “{{ test_hostname }}” and test_env == “kubernetes”
- name: Waiting for the testing job to finish
pause:
seconds: 40
prompt: “Waiting 40 seconds for the testing job to finish”
echo: false
when: test_env == “kubernetes” and ansible_hostname == “{{ test_hostname }}”
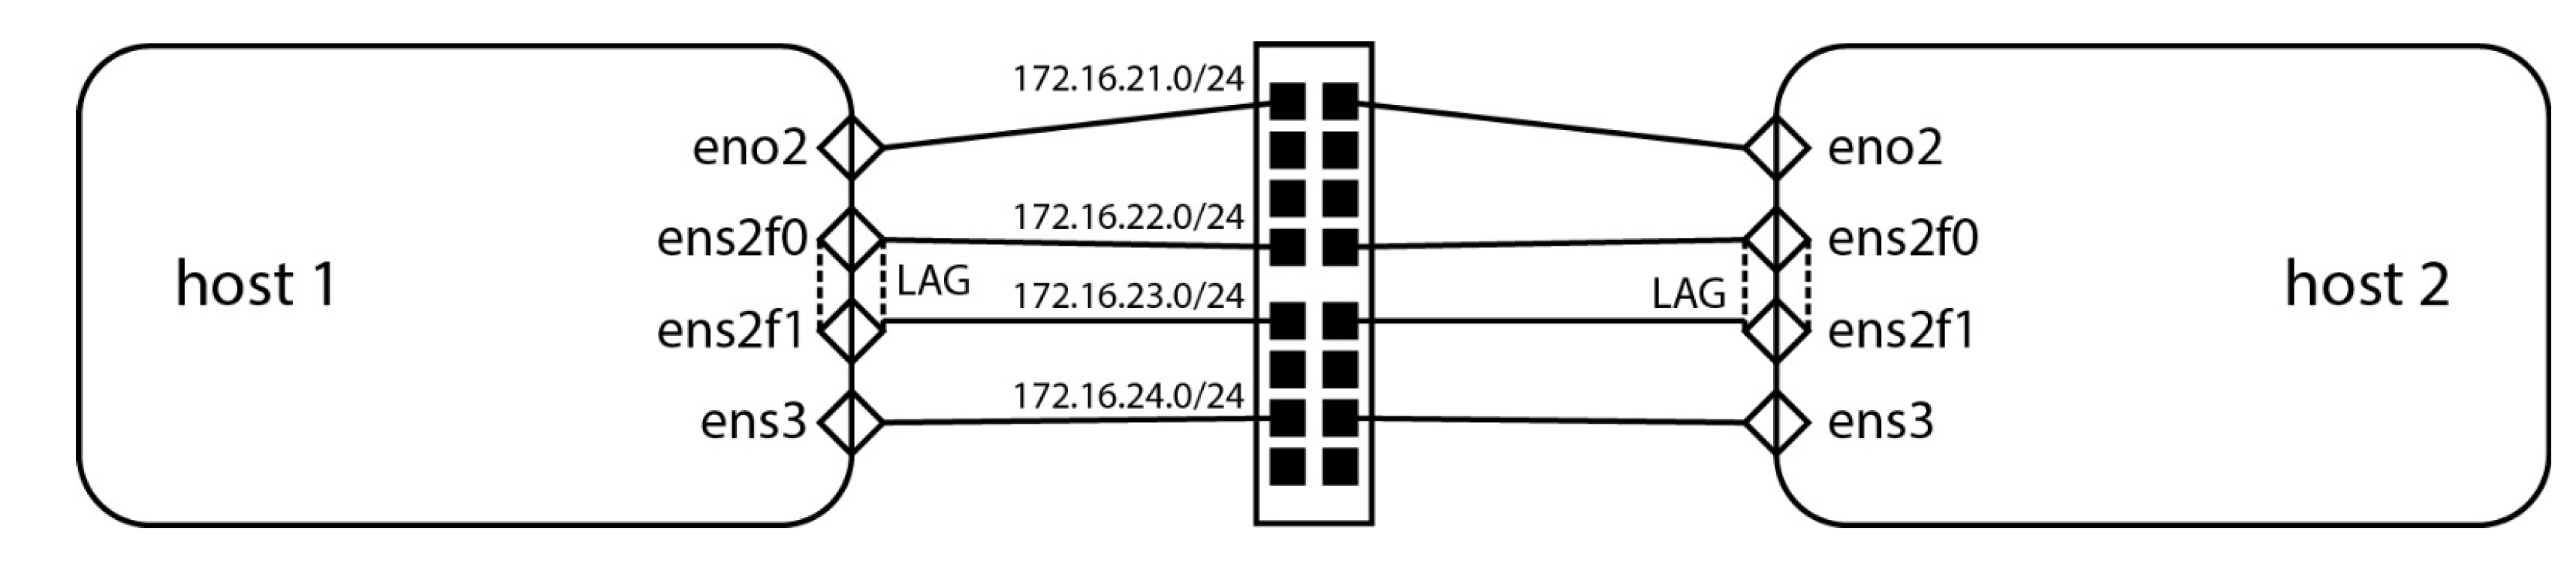
Some parts of the code need to be changed so that this code can work for every environment. However, the changes are minimal - hostnames, network interfaces, IP addresses, and code can be easily extended to test many hosts, but that mostly won’t be necessary. When designing a data center, the default design principle is to use the same hosts with the same capabilities to make them a part of the same QoS domain. For our testing environment, the network connectivity diagram is visible in Figure 2.
In the excerpts of Ansible code presented in this paper, host1 refers to doktnet1, and host 2 refers to doktnet2, as these were the two assigned hostnames for two servers used to debug and test this methodology.
5. Discussion
The most challenging part of figuring out our methodology, which applies automation and orchestration and implements it via code, was twofold. There were inherent issues related to how we envision the methodology to work, and then there’s the actual code that implements it.
When we started developing this methodology, the goal was clear—we needed the repeatability of hundreds of tests across multiple CNIs in various configurations across different power profiles, frame sizes, and interfaces. The first challenge was related to CNI installation, which has proven to be much more complex than we initially thought. The order in which we deploy packages is significant, as it always is with anything related to Kubernetes. Furthermore, configuring some of these deployment procedures to work was very challenging. Good examples are Cilium in GENEVE configuration and Calico, which require a lot of testing and error handling so that their corresponding deployment processes work reliably. That meant we also needed to write Ansible code well and document it to debug it more easily.
We deliberately went very deep into various scenarios related to the Ethernet frame sizes, as these are either excellent approximations for specific applications or represent how a physical network would be configured to a specific use case. For example, suppose we’re using an HPC application that deals with object recognition from a live video feed. In that case, this scenario includes a large set of streamed serial data, which will lend nicely to a larger Ethernet frame. It will mean better throughput as less data will be spent on headers, but an even more significant benefit will be that we’ll need to spend less compute power on package framing. We can influence this efficiency by using TCP/UDP offloading on a network interface level, but that feature isn’t always available in all situations. This will also mean we’ll need to spend more time configuring end-to-end Ethernet frame sizes, as we don’t want mismatched frame sizes leading to performance degradation. This was the only way to avoid numerous issues that we might have with our network configuration, like:
- Fragmentation or dropping,
- Frame size mismatching,
- Performance degradation,
- Path MTU discovery problems.
Regarding implementation, our most extensive set of issues was related to Netplan’s unpredictable behavior on Ubuntu 24.04, especially in more advanced network configurations such as link aggregated scenarios. On top of these issues associated with Netplan configuration for aggregation scenarios, performance was also bad. We’re not proponents of using such configurations at all, as there’s a much simpler method to increase bandwidth without a lot of additional configurations (faster network cards and switches), but we still made a set of playbooks in case people still want to do this kind of configuration.
6. Future Work
There are multiple research directions we could pursue in the future. First and foremost, there’s scope to do additional research using various offloading technologies like Intel’s Data Plane Development Kit (DPDK), various FPGA-based approaches, and SR-IOV. We could also combine this research with scaling across faster network standards by leveraging Ethernet standards faster than 10 Gbit/s, such as 25, 40, 50, 100, 200, and 400 Gigabit Ethernet, and comparing the results. This could lead to developing a model describing how this methodology scales with bandwidth. However, the primary purpose of this paper is to discuss new methods, not to do bandwidth or latency testing.
Our methodology can also be improved by using random testing instead of pre-defined testing entirely controlled by the code. This could be done by integrating a software network traffic generator to monitor and measure what happens when different streams and data types are sent over the network. Considering that this methodology was meant to be used in HPC and cloud environments, where the default design principle is to use the same hosts that build the clusters, the general use case was not the development direction taken.
Additionally, an AI (Artificial Intelligence) engine could be integrated into the methodology to learn about the environment where these tests could be done. The engine could then tune traffic generators to simulate observed trends in any network for any scenario. This would be a step in the “general use case” direction that could be very usable for many Kubernetes environments. Again, this methodology was developed for HPC-based environments so that scientists can do performance testing before building out their environments without having to study Ansible or BASH shell scripting for months.
7. Conclusions
This paper presents a methodology that uses Ansible to test Kubernetes CNIs. This approach provides a robust and practical framework for verifying network plugins’ stability, performance, and compatibility in a Kubernetes context. Installing and configuring CNIs can be difficult due to the diverse range of plugins, each with its own requirements and setup procedures. These issues necessitate scrupulous attention to detail and a thorough comprehension of the CNIs and the Kubernetes ecosystem. Moreover, the scientific community relies on these approaches regularly, yet they must be developed in a shorter time frame. They must be easily accessible for convenient assessment, allowing the emphasis to be on scientific study rather than environmental arrangement.
The complexity of composing Ansible code for testing CNIs cannot be exaggerated. Developing meticulous, reusable, and modular playbooks requires considerable proficiency, as these playbooks must manage various scenarios and contexts effectively. This intricacy is additionally exacerbated by the requirement to accommodate various Kubernetes, CNI versions, and infrastructure configurations. Notwithstanding these difficulties, investing in developing resilient Ansible playbooks is highly valuable. It dramatically improves the level of automation, guaranteeing that tests are uniform, can be repeated, and are less susceptible to human mistakes.
Automated testing is crucial in this context since it enables the execution of several test runs under different conditions. This approach offers a dependable and thorough evaluation of the performance and stability of each CNI. By utilizing Ansible, the automation of these tests not only simplifies the testing process but also guarantees that results are uniform across several iterations. Consistency plays a vital role in identifying faults, validating remedies, and maintaining the robustness of Kubernetes deployments. By automating the complex and error-prone procedures involved in CNI testing, teams may dedicate their attention to more advanced matters, fostering innovation and enhancing the system’s overall performance.
Supplementary Materials
The complete set of materials mentioned in this paper can be downloaded at https://github.com/vEddYcro/cni-performance-testing.
Author Contributions
Conceptualization, V.D.; Methodology, V.D.; Validation, M.B. and L.Z.; Formal analysis, M.B. and J.R..; Investigation, M.B., and L.Z.; Resources, J.R.; Writing—original draft, V.D. and J.R.; Writing—review & editing, V.D. and J.R.; Supervision, V.D.; Project administration, V.D. All authors have read and agreed to the published version of the manuscript.
Funding
This research received no external funding.
Data Availability Statement
Data are contained within the article.
Conflicts of Interest
The authors declare no conflict of interest.
References
- Dakić, V.; Kovač, M.; Slovinac, J. Evolving High-Performance Computing Data Centers with Kubernetes, Performance Analysis, and Dynamic Workload Placement Based on Machine Learning Scheduling. Electronics 2024, 13, 2651. [Google Scholar] [CrossRef]
- Kenny, J. , Wilke, J. J., Ulmer, C., Baker, G., Knight, S., & Friesen, J. A. (2020). An Evaluation of Ethernet Performance for Scientific Workloads. 2020 IEEE/ACM Innovating the Network for Data-Intensive Science (INDIS), 57-67. [CrossRef]
- Islam, N., Bawn, C. C., Hasan, J., Swapna, A. I., & Rahman, M. S. (2016). Quality of Service Analysis of Ethernet Network Based on Packet Size. Journal of Computational Chemistry, 4(4), 63-72. [CrossRef]
- Liao, G., & Bhuyan, L. (2012). Analyzing performance and power efficiency of network processing over 10 GbE. J. Parallel Distributed Comput., 72(10), 1442-1449. [CrossRef]
- Bencivenni, M., Bortolotti, D., Carbone, A., Cavalli, A., Chierici, A., Dal Pra, S., ... & Vistoli, M. C. (2010). Performance of 10 Gigabit Ethernet Using Commodity Hardware. IEEE Transactions on Nuclear Science, 57(2), 630-641. [CrossRef]
- Saravanan, K.P.; Carpenter, P.M.; Ramirez, A. Power/Performance Evaluation of Energy Efficient Ethernet (EEE) for High Performance Computing. 2013 IEEE International Symposium on Performance Analysis of Systems and Software (ISPASS) 2013. [CrossRef]
- Kapočius, N. (2020). Performance Studies of Kubernetes Network Solutions. 2020 IEEE Open Conference of Electrical, Elec-tronic and Information Sciences (eStream), 1-6. [CrossRef]
- Novianti, S. , & Basuki, A. (2021). The Performance Analysis of Container Networking Interface Plugins in Kubernetes. Pro-ceedings of the 6th International Conference on Sustainable Information Engineering and Technology. [CrossRef]
- Qi, S. , Kulkarni, S. G., & Ramakrishnan, K. (2021). Assessing Container Network Interface Plugins: Functionality, Performance, and Scalability. IEEE Transactions on Network and Service Management, 18(2), 656-671. [CrossRef]
- Rao, S. K. , Paganelli, F., & Morton, A. (2021). Benchmarking Kubernetes Container-Networking for Telco Usecases. 2021 IEEE Global Communications Conference (GLOBECOM), 1-7. [CrossRef]
- Kim, E., Lee, K., & Yoo, C. (2021). On the Resource Management of Kubernetes. 2021 International Conference on Information Networking (ICOIN), 154-158. [CrossRef]
- Sarwar, M. M. S. , Rivera, J. J. D., Afaq, M., & Song, W.-C. (2022). GENEVE@TEIN: A Sophisticated Tunneling Technique for Communication between OpenStack-based Multiple Clouds at TEIN. 2022 23rd Asia-Pacific Network Operations and Man-agement Symposium (APNOMS), 1-4. [CrossRef]
- Zhao, Z., Hong, F., & Li, R. (2017). SDN Based VxLAN Optimization in Cloud Computing Networks. IEEE Access, 5, 23312-23319. [CrossRef]
- Kawashima, R. , & Matsuo, H. (2015). Accelerating the Performance of Software Tunneling Using a Receive Offload-Aware Novel L4 Protocol. IEICE Trans. Commun., 98-B(11), 2180-2189. [CrossRef]
- Yan, Y. , & Wang, H. (2016). Open vSwitch Vxlan performance acceleration in cloud computing data center. 2016 5th Interna-tional Conference on Computer Science and Network Technology (ICCSNT), 567-571. [CrossRef]
- Mahalingam, M. , Dutt, D. G., Duda, K. J., Agarwal, P., Kreeger, L., Sridhar, T., Bursell, M., & Wright, C. (2014). Virtual eXtensible Local Area Network (VXLAN): A Framework for Overlaying Virtualized Layer 2 Networks over Layer 3 Networks. RFC, 7348, 1-22. [CrossRef]
- Leira, R. , Aracil, J., Vergara, J. D., Roquero, P., & González, I. (2018). High-speed optical networks latency measurements in the microsecond timescale with software-based traffic injection. Opt. Switch. Netw., 29, 39-45. [CrossRef]
- Sinha, D. , Haribabu, K., & Balasubramaniam, S. (2015). Real-time monitoring of network latency in Software Defined Net-works. 2015 IEEE International Conference on Advanced Networks and Telecommuncations Systems (ANTS), 1-3. [CrossRef]
- Mohammed, S. , Shirmohammadi, S., & Altamimi, S. (2019). Artificial Intelligence-Based Distributed Network Latency Measurement. 2019 IEEE International Instrumentation and Measurement Technology Conference (I2MTC), 1-6. [CrossRef]
- Park, T. , Shin, S., Shin, I., & Lee, K. (2021). Formullar: An FPGA-based network testing tool for flexible and precise meas-urement of ultra-low latency networking systems. Comput. Networks, 185, 107689. [CrossRef]
- Xiao, M.; Wang, H.; Geng, L.; Lee, R.; Zhang, X. Catfish: Adaptive RDMA-Enabled R-Tree for Low Latency and High Throughput. 2019 IEEE 39th International Conference on Distributed Computing Systems (ICDCS) 2019. [CrossRef]
- Liao, L. , Leung, V. C. M., & Chen, M. (2019). An Efficient and Accurate Link Latency Monitoring Method for Low-Latency Software-Defined Networks. IEEE Transactions on Instrumentation and Measurement, 68, 377-391. [CrossRef]
- Mohammed, S. , Shirmohammadi, S., & Altamimi, S. (2020). A Multimodal Deep Learning-Based Distributed Network Latency Measurement System. IEEE Transactions on Instrumentation and Measurement, 69, 2487-2494. [CrossRef]
- Yuan, D. , Kan, H., & Wang, S. (2020). Ultra Low-latency MAC/PCS IP for High-speed Ethernet. 2020 International Conference on Space-Air-Ground Computing (SAGC), 73-75. [CrossRef]
- Mysari, S. , & Bejgam, V. (2020). Continuous Integration and Continuous Deployment Pipeline Automation Using Jenkins Ansible. 2020 International Conference on Emerging Trends in Information Technology and Engineering (ic-ETITE). [CrossRef]
- S, L. (2022). Automation of Server Configuration Using Ansible. International Journal for Research in Applied Science and Engineering Technology. [CrossRef]
- Alfiandi, T. , Diansyah, T. M., & Liza, R. (2020). ANALISIS PERBANDINGAN MANAJEMEN KONFIGURASI MENGGUNAKAN ANSIBLE DAN SHELL SCRIPT PADA CLOUD SERVER DEPLOYMENT AWS. JiTEKH. [CrossRef]
- Gupta, M. , Chowdary, M. N., Bussa, S., & Chowdary, C. K. (2021). Deploying Hadoop Architecture Using Ansible and Ter-raform. 2021 5th International Conference on Information Systems and Computer Networks (ISCON). [CrossRef]
- Shvetcova, V. , Borisenko, O., & Polischuk, M. (2020). Using Ansible as Part of TOSCA Orchestrator. 2020 Ivannikov Ispras Open Conference (ISPRAS). [CrossRef]
- Hassan, M. M. , & Rahman, A. (2022). As Code Testing: Characterizing Test Quality in Open Source Ansible Development. 2022 IEEE Conference on Software Testing, Verification and Validation (ICST). [CrossRef]
- Chavan, M. P. , & Chavan, P. (2022). RPM Packaging for Ansible Automation Configuration Management in Linux. IN-TERANTIONAL JOURNAL OF SCIENTIFIC RESEARCH IN ENGINEERING AND MANAGEMENT. [CrossRef]
- Kokuryo, S. , Kondo, M., & Mizuno, O. (2020). An Empirical Study of Utilization of Imperative Modules in Ansible. 2020 IEEE 20th International Conference on Software Quality, Reliability and Security (QRS). [CrossRef]
- Sicoe, A. F. , Botez, R., Ivanciu, I., & Dobrota, V. (2022). Fully Automated Testbed of Cisco Virtual Routers in Cloud Based Environments. 2022 IEEE International Black Sea Conference on Communications and Networking (BlackSeaCom). [CrossRef]
- Khumaidi, A. (2021). IMPLEMENTATION OF DEVOPS METHOD FOR AUTOMATION OF SERVER MANAGEMENT USING ANSIBLE. [CrossRef]
- Rahman, A. , Partho, A., Morrison, P., & Williams, L. (2018). What Questions Do Programmers Ask about Configuration as Code?. 2018 IEEE/ACM 4th International Workshop on Rapid Continuous Software Engineering (RCoSE). [CrossRef]
- Kostromin, R. (2020). Survey of software configuration management tools of nodes in heterogeneous distributed computing environment. [CrossRef]
- Mašek, P. , Stusek, M., Krejci, J., Zeman, K., Pokorný, J., & Kudlacek, M. (2018). Unleashing Full Potential of Ansible Framework: University Labs Administration. 2018 22nd Conference of Open Innovations Association (FRUCT). [CrossRef]
- Opdebeeck, R. , Zerouali, A., & De Roover, C. (2022). Smelly Variables in Ansible Infrastructure Code: Detection, Prevalence, and Lifetime. 2022 IEEE/ACM 19th International Conference on Mining Software Repositories (MSR). [CrossRef]
- Cepuc, A. , Botez, R., Crãciun, O., Ivanciu, I., & Dobrota, V. (2020). Implementation of a Continuous Integration and De-ployment Pipeline for Containerized Applications in Amazon Web Services Using Jenkins, Ansible and Kubernetes. 2020 19th RoEduNet Conference: Networking in Education and Research (RoEduNet). [CrossRef]
- Wibowo, G. H. , & Widiasari, I. R. (2023). Automation of Two Ubuntu Servers with Ansible and Telegram as Notifications. Sinkron. [CrossRef]
- Horton, E. , & Parnin, C. (2022). Dozer: Migrating Shell Commands to Ansible Modules via Execution Profiling and Synthesis. 2022 IEEE/ACM 44th International Conference on Software Engineering: Software Engineering in Practice (ICSE-SEIP). [CrossRef]
- Singh, N. , Singh, A., & Rawat, V. (2022). Deploying Jenkins, Ansible and Kubernetes to Automate Continuous Integration and Continuous Deployment Pipeline. 2022 IEEE International Conference on Service Operations and Logistics, and Informatics (SOLI). [CrossRef]
- Kaewwongsri, K. , & Silanon, K. (2020). Design and Implement of a Weather Monitoring Station using CoAP on NB-IoT Network. 2020 17th International Conference on Electrical Engineering/Electronics, Computer, Telecommunications and Information Technology (ECTI-CON). [CrossRef]
- Anam, K. , Rofi, D. N., & Meiyanti, R. (2023). Monitoring System for Temperature and Humidity Sensors in the Production Room Using Node-Red as the Backend and Grafana as the Frontend. Journal of Systems Engineering and Information Technology (JOSEIT). [CrossRef]
- Sykora, M. , Doležal, Z., Kodys, P., & Kroll, J. (2022). Monitoring System of the ATLAS ITk Laboratory. Journal of Physics: Conference Series. [CrossRef]
- Mehdi, A. , Bali, M. K., Abbas, S. I., & Singh, M. (2023). Unleashing the Potential of Grafana: A Comprehensive Study on Re-al-Time Monitoring and Visualization. 2023 14th International Conference on Computing Communication and Networking Technologies (ICCCNT). [CrossRef]
- Dawodi, M. , Hedayati, M. H., Baktash, J., & Erfan, A. L. (2019). Facebook MySQL Performance vs MySQL Performance. 2019 IEEE 10th Annual Information Technology, Electronics and Mobile Communication Conference (IEMCON). [CrossRef]
- Šušter, I. , & Ranisavljević, T. (2023). Optimization of MySQL database. Journal of Process Management and New Technologies. [CrossRef]
- Matsunobu, Y. , Dong, S., & Lee, H. (2020). MyRocks: LSM-Tree Database Storage Engine Serving Facebook’s Social Graph. Proc. VLDB Endow. [CrossRef]
- Chen, M. , & Liang, H. (2020). Big Data Analysis of Human Resource Management Based on MYSQL database. 2020 International Conference on Computer Science and Management Technology (ICCSMT). [CrossRef]
- Fontenele, J. (2021). SISTEMA IOT INDUSTRIAL PARA MONITORAMENTO DE VIBRAÇÕES DE MÁQUINAS ROTATIVAS. Revista Científica Semana Acadêmica. [CrossRef]
- Park, J. , Furuta, H., Maruyama, T., Monjushiro, S., Nishikawa, K., Taira, M.,... & Yeh, M. (2020). Slow monitoring system for the JSNS$^{2}$ experiment. arXiv: Instrumentation and Detectors. [CrossRef]
Figure 1.
Set of directories per scenario containing our Ansible code.
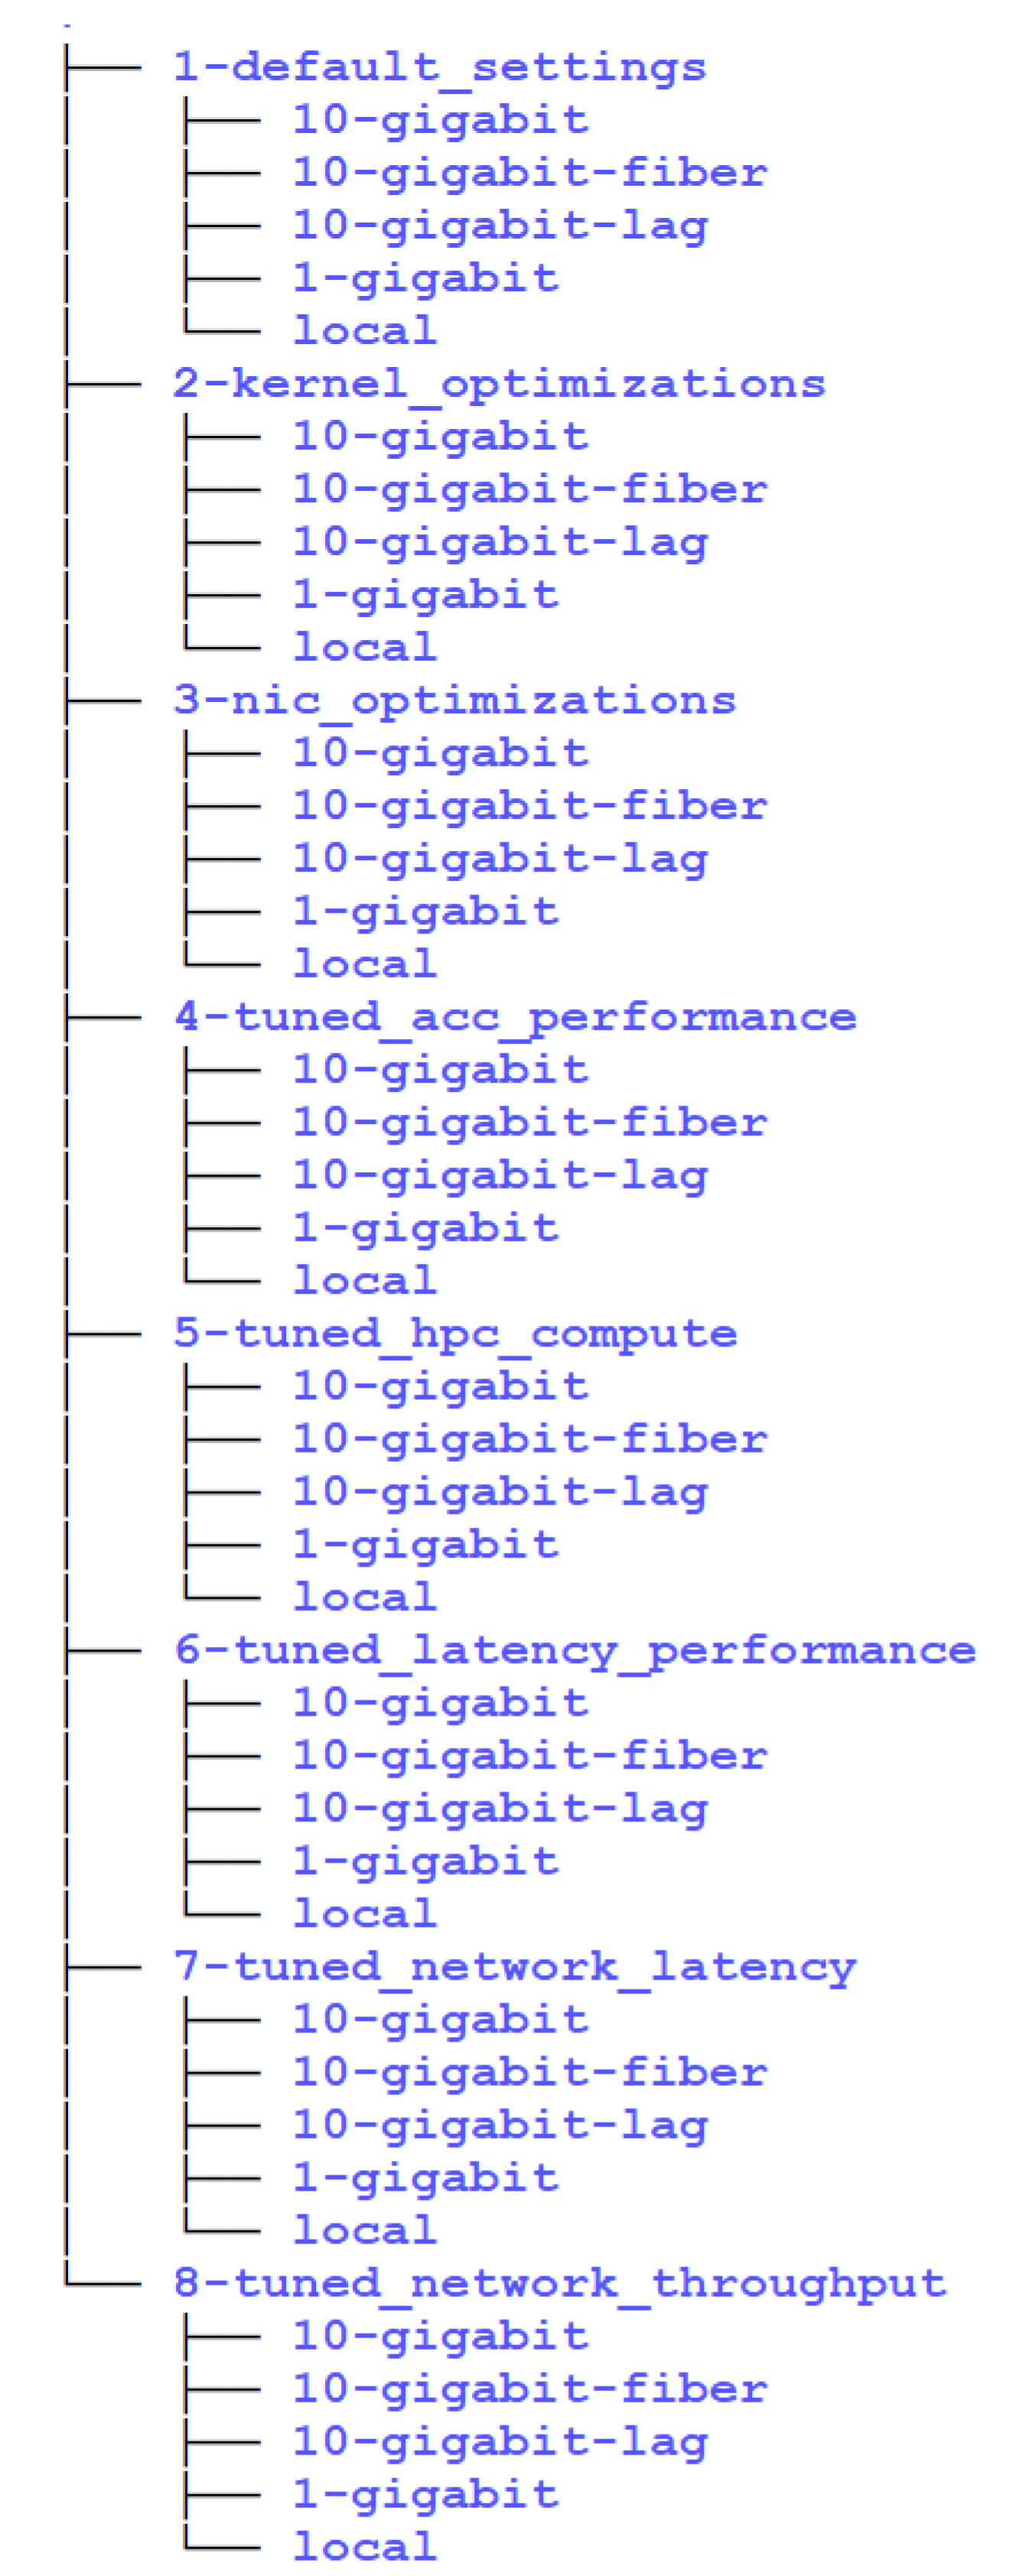
Figure 2.
Our network connectivity diagram, as referenced in the published Ansible code.
Disclaimer/Publisher’s Note: The statements, opinions and data contained in all publications are solely those of the individual author(s) and contributor(s) and not of MDPI and/or the editor(s). MDPI and/or the editor(s) disclaim responsibility for any injury to people or property resulting from any ideas, methods, instructions or products referred to in the content. |
© 2024 by the authors. Licensee MDPI, Basel, Switzerland. This article is an open access article distributed under the terms and conditions of the Creative Commons Attribution (CC BY) license (http://creativecommons.org/licenses/by/4.0/).
Copyright: This open access article is published under a Creative Commons CC BY 4.0 license, which permit the free download, distribution, and reuse, provided that the author and preprint are cited in any reuse.


