Submitted:
15 July 2024
Posted:
17 July 2024
You are already at the latest version
Abstract
This study provides a methodology for optimizing oil production and CO2 sequestration using an integrated asset model of the Farnsworth Unit field, incorporating extensive geological, geophysical, and engineering data. Sensitivity analysis identified critical parameters impacting oil recovery and CO2 storage, leading to the construction of a proxy model using polynomial regression and radial basis function neural networks, with the latter proving more effective for "What-if" analysis. The sensitivity analysis indicated that the Corey parameters impact cumulative oil produced the most. Comprehensive history matching validated the model against historical production data, ensuring reliability for forecasting and optimization. Two scenarios, "Do-Nothing" and development strategy, were forecasted over 15 years (2020-2035). The "Do-Nothing" scenario resulted in 9.57 MMSTB of oil recovery and 2,822.70 MMlbs of CO2 storage. The development strategy case improved outcomes with 13.95 MMSTB of oil recovery and 5,061.68 MMlbs of CO2 stored, and was selected for optimization using particle swarm optimization. The optimized strategy achieved 14,043,372 STB of cumulative oil and 4,832.18 MMlbs of CO2 stored, and increased the field NPV by 25.84% to $114,871,730. This study underscores the significance of integrated asset modeling in enhancing oil recovery and optimizing CO2-EOR processes, providing valuable insights into operational conditions and constraints.
Keywords:
Surface-Coupled Reservoir Modeling and Optimization
; Integrated Production System Modeling
; Surface Facility Optimization
; CO2-EOR Optimization
; Optimization of CO2-EOR
; Integrated Asset Model
1. Introduction
Human activities, particularly the combustion of fossil fuels for energy, have significantly increased the concentration of atmospheric carbon dioxide (CO2). This surge in CO2 levels is driven by the growing global energy demand and industrial activities. Fossil fuel combustion releases large quantities of CO2, a potent greenhouse gas, into the atmosphere, exacerbating the natural greenhouse effect [1]. CO2 plays a critical role in trapping solar radiation in the form of heat. When solar radiation reaches the earth’s surface, it is absorbed and then re-emitted as infrared radiation. CO2 and other greenhouse gases absorb this infrared energy, preventing it from escaping into space. This process, known as the greenhouse effect, is essential for maintaining earth’s temperature within habitable ranges [2]. However, the increased concentration of CO2 due to human activities has intensified this effect, leading to a rise in earth’s surface temperature. The rise in global temperatures above 1.5 degrees Celsius is a significant indicator of global warming. This increase in temperature has profound impacts on the climate, contributing to more frequent and severe weather patterns [3].
One of the most promising technologies that mitigate carbon dioxide (CO2) emissions is CO2-Enhanced Oil Recovery (CO2-EOR). CO2-EOR involves injecting carbon dioxide into mature oil fields to enhance oil recovery while simultaneously storing CO2 in geological formations [4]. CO2-EOR not only improves oil extraction efficiency but also offers a dual benefit by sequestering CO2 that would otherwise contribute to atmospheric GHG levels. By injecting CO2 into depleted oil reservoirs, CO2-EOR facilitates the trapping of CO2 in porous rock formations, effectively preventing it from entering the atmosphere [5]. This method leverages existing infrastructure and technological expertise, making it a viable and economically attractive option for CO2 sequestration [6].
Integrated Asset Modeling (IAM) represents a significant advancement over standalone subsurface modeling. IAM involves coupling surface network facilities with subsurface reservoir models to provide a holistic view of the entire production system [7]. This integration allows for a more accurate representation of the interactions between surface facilities and reservoir dynamics, leading to better-informed decisions regarding production optimization and CO2 management [8]. The primary advantage of IAM is its ability to capture the interdependencies between surface and subsurface components, which standalone reservoir models often overlook. IAM facilitates production optimization by enabling a comprehensive analysis of various operational scenarios. By simulating the entire production chain from the reservoir to the surface facilities, IAM helps identify the most efficient strategies for maximizing oil recovery and CO2 storage. This approach ensures that all aspects of the production system are considered, leading to more effective and sustainable resource management [8].
Several academic publications have explored the application of IAM. Primera et al. [9] emphasized the use of integrated asset modeling for the design and optimization of geological CO2 storage projects. They argue that the traditional approach of separate reservoir and surface models is not optimal as it does not consider the interaction between the two systems. The integrated approach aims to provide a more comprehensive solution for CO2 storage projects. Their study covers the storage feature, specifically in aquifer modeling, and proves the feasibility of integrating models through an integrated asset approach. Roadifer et al. [10] focused on the implementation of an integrated asset modeling (IAM) approach for reservoir management in a Miscible Water Alternating Gas (MWAG) development on Alaska’s Western North Slope. The IAM approach combines reservoir simulation models, pipeline surface network models, and process facility models to optimize overall performance and analyze the impact of decisions. They discuss the specific constraints and challenges in the asset, such as limited surface gas and water handling capacity and the need to segregate produced water from imported make-up sea water. Temizel et al. [8] focused on integrated asset modeling (IAM) through multi-reservoir optimization of offshore fields using next-generation reservoir simulators in the oil and gas industry. This involved the integration of reservoir models with surface facility models and wellbore models to accurately estimate well and field flow rates at the surface. They discuss the advantages of IAM, such as faster simulation runtime, optimized field-wide production, reduced design time, and lower capital and operational expenses. They highlight the importance of IAM in decision-making processes like concept selection, debottlenecking, and life-of-field analysis. They provide insights into the process of simultaneous simulation and optimization of multiple reservoirs using next-generation reservoir simulators and presented results comparing integrated models with individual runs. Araya et al. [11] underscored the importance of a holistic approach for underground CO2 storage. They highlighted the intricate balance required to ensure both environmental safety and economic feasibility. Carpenter [12] provided a broad view of IAM, detailing its significance in long-term production planning. His insights stress the need for strategic foresight, ensuring that both current operations and future scaling are considered.
The Southwest Regional Partnership (SWP) on carbon sequestration aims to capture and utilize CO2 in tertiary enhanced oil recovery processes, such as WAG, to recover more oil while sequestering CO2 in the formation [13]. The objective of this study is to design a complete integrated field-scale model that can advise the best-operating conditions for optimum oil recovery and CO2 storage while providing a closed-loop life cycle of all CO2 produced and injected, to measure the efficiency of its sequestration. A commercial simulator is used to investigate the impact of surface facilities on development strategies and to predict the amount of CO2 that can be stored in the formation. An integrated model with implicit flow calculations is employed to improve the stability of pressure-drop calculations at the wellhead between the surface and subsurface and provide field management opportunities [14,15,16,17,18,19,20,21].
1.1. Site Description
The Farnsworth field is in Ochiltree County, Texas, and operations are carried out in the Anadarko basin. The basin stretches about 70,000 square miles with territories in Texas and Oklahoma that extend into eastern Colorado and western Kansas [13]. The reservoir of interest in this study is the upper Morrow oil-bearing formation, labeled Morrow B, from which more than 100 million barrels of oil have been produced along with 500 billion cubic feet of gas. Bowen & Weimer [22] predicted the potential for EOR- CCUS in this field which has since been realized by the SWP projects for CO2-EOR which have been implemented in this field since December 2010. However, there is no natural access to CO2 in this field. Hence, CO2 utilized in the EOR process is obtained from two plants where it is anthropogenically produced in large quantities and transported to the field where it is injected.
1.2. Reservoir Geology and Fluid
The Morrow B formation in the uppermost sandstone layer in the upper Morrow formation of five sandstone layers separated by mudstone intervals. It is set at a depth of approximately 7,900 ft with an initial datum pressure of 2,203 psi and temperature at 168 °F. The connate reservoir has permeability ranging from 10 to 500 mD with initial connate water saturation of approximately 31.4% [13]. Fluid analysis showed a bubble-point pressure of about 2,059 psi and a formation volume factor of 1.192. A summary of the fluid components can be found in Ampomah et al. [23].
1.3. Production History
The Farnsworth field was discovered around the year 1955 and was reported to have more than 100 million barrels of oil and 415 billion cubic feet of gas in place. Operations in the Morrow B sandstone started around the middle of the twentieth century about 1955. During the first ten years, the field was produced under its natural energy with the main drive mechanism being solution-gas drive. Secondary drive was implemented in 1964 with waterflooding to keep pressure high and support oil production. However, in December 2010, the Farnsworth field entered a new phase of tertiary recovery by implementing CO2 injection along with water injection in an enhanced oil recovery technique, namely water-alternating-gas, to keep up production. Thus far, more than 19 million barrels of oil and 44 billion cubic feet of gas have been produced from the Morrow B formation [23].
2. Materials and Methods
A bottom-up approached was adopted to simulate the field, starting with the subsurface reservoir to the wells and then the surface network facilities.
Figure 1.
Model Building Workflow.

2.1. Construction of Reservoir Model
The reservoir model was initially built in commercial simulator using data gathered from the Farnsworth Field. This model has been updated in stages with each collection of additional data. Ampomah et al. [23] built the static geological model in Petrel by combining core porosity and permeability from 51 wells with seismic data acquired in the field. Porosity was upscaled using the arithmetic averaging method and permeability was upscaled using the geometric averaging method. Using the “Winland R35” method developed by Kolodzie [24], logs were generated from core porosity and permeability data. Gaussian co-simulation was used to interpolate the R35 porosity logs. The reservoir was separated into 8 hydraulic flow units (HFUs) with each having its own flow characteristics defined by its porosity-permeability relationship. The reservoir was rotated 18/108 to conform with principal stress [25]. 5 relative permeability curves were generated from 53 core plugs taken from the field by Rasmussen et al. [26] who revisited the work of Ross-Coss et al. [27] to combine HFUs 5 to 8 into one.
The resulting geological model is made up of 4 layers which focus only on the Morrow B sandstone and not the overlying and underlying shale trapping layers. The average porosity of the field is 14% and average permeability is 48.2 mD [23,28]. The average thickness of the reservoir is about 22 ft [23].
The fluid was designed to fit an EOS (Equation of State) model. This made it possible to build a compositional fluid model considering each component in its appropriate proportion. A fluid analysis conducted in 2015 by Ampomah et al. [23] showed that there are 9 components of the oil in the formation. Carbon dioxide is found in minute quantities in the range of 1 E-9.
The final model is then exported as a rescue file from Petrel and imported into a commercial software with the option to import reservoir properties too. Taking advantage of this option allows us to import pressure, phase saturations and global composition of oil in each grid block in addition to the structural grid and its static properties like porosity and permeability. From this grid, the 5 HFUs were imported as 5 different facies. Therefore, it was possible to create ranges for each HFU and assign each its own relative permeability curve.
Figure 2a,b show an aerial view of the active layers and a 3-D view of the reservoir geology respectively.
2.2. Dynamic Reservoir Model
The reservoir is initialized using the enumeration method to import saturation, composition and pressure values from the previous model which was history-matched to primary (1955 to 1964) and secondary (1964 to 2010) recovery phases. The average water saturation at the start of the history match period is approximately 31% with 93 MMSTB of oil in place. The average reservoir pressure ranges from 4,200 psi to 4,500 psi.
Figure 3.
(a) Scaled Dynamic Grid; (b) Dynamic Grid showing water saturation distribution; (c) Dynamic Grid showing pressure distribution.
Figure 3.
(a) Scaled Dynamic Grid; (b) Dynamic Grid showing water saturation distribution; (c) Dynamic Grid showing pressure distribution.
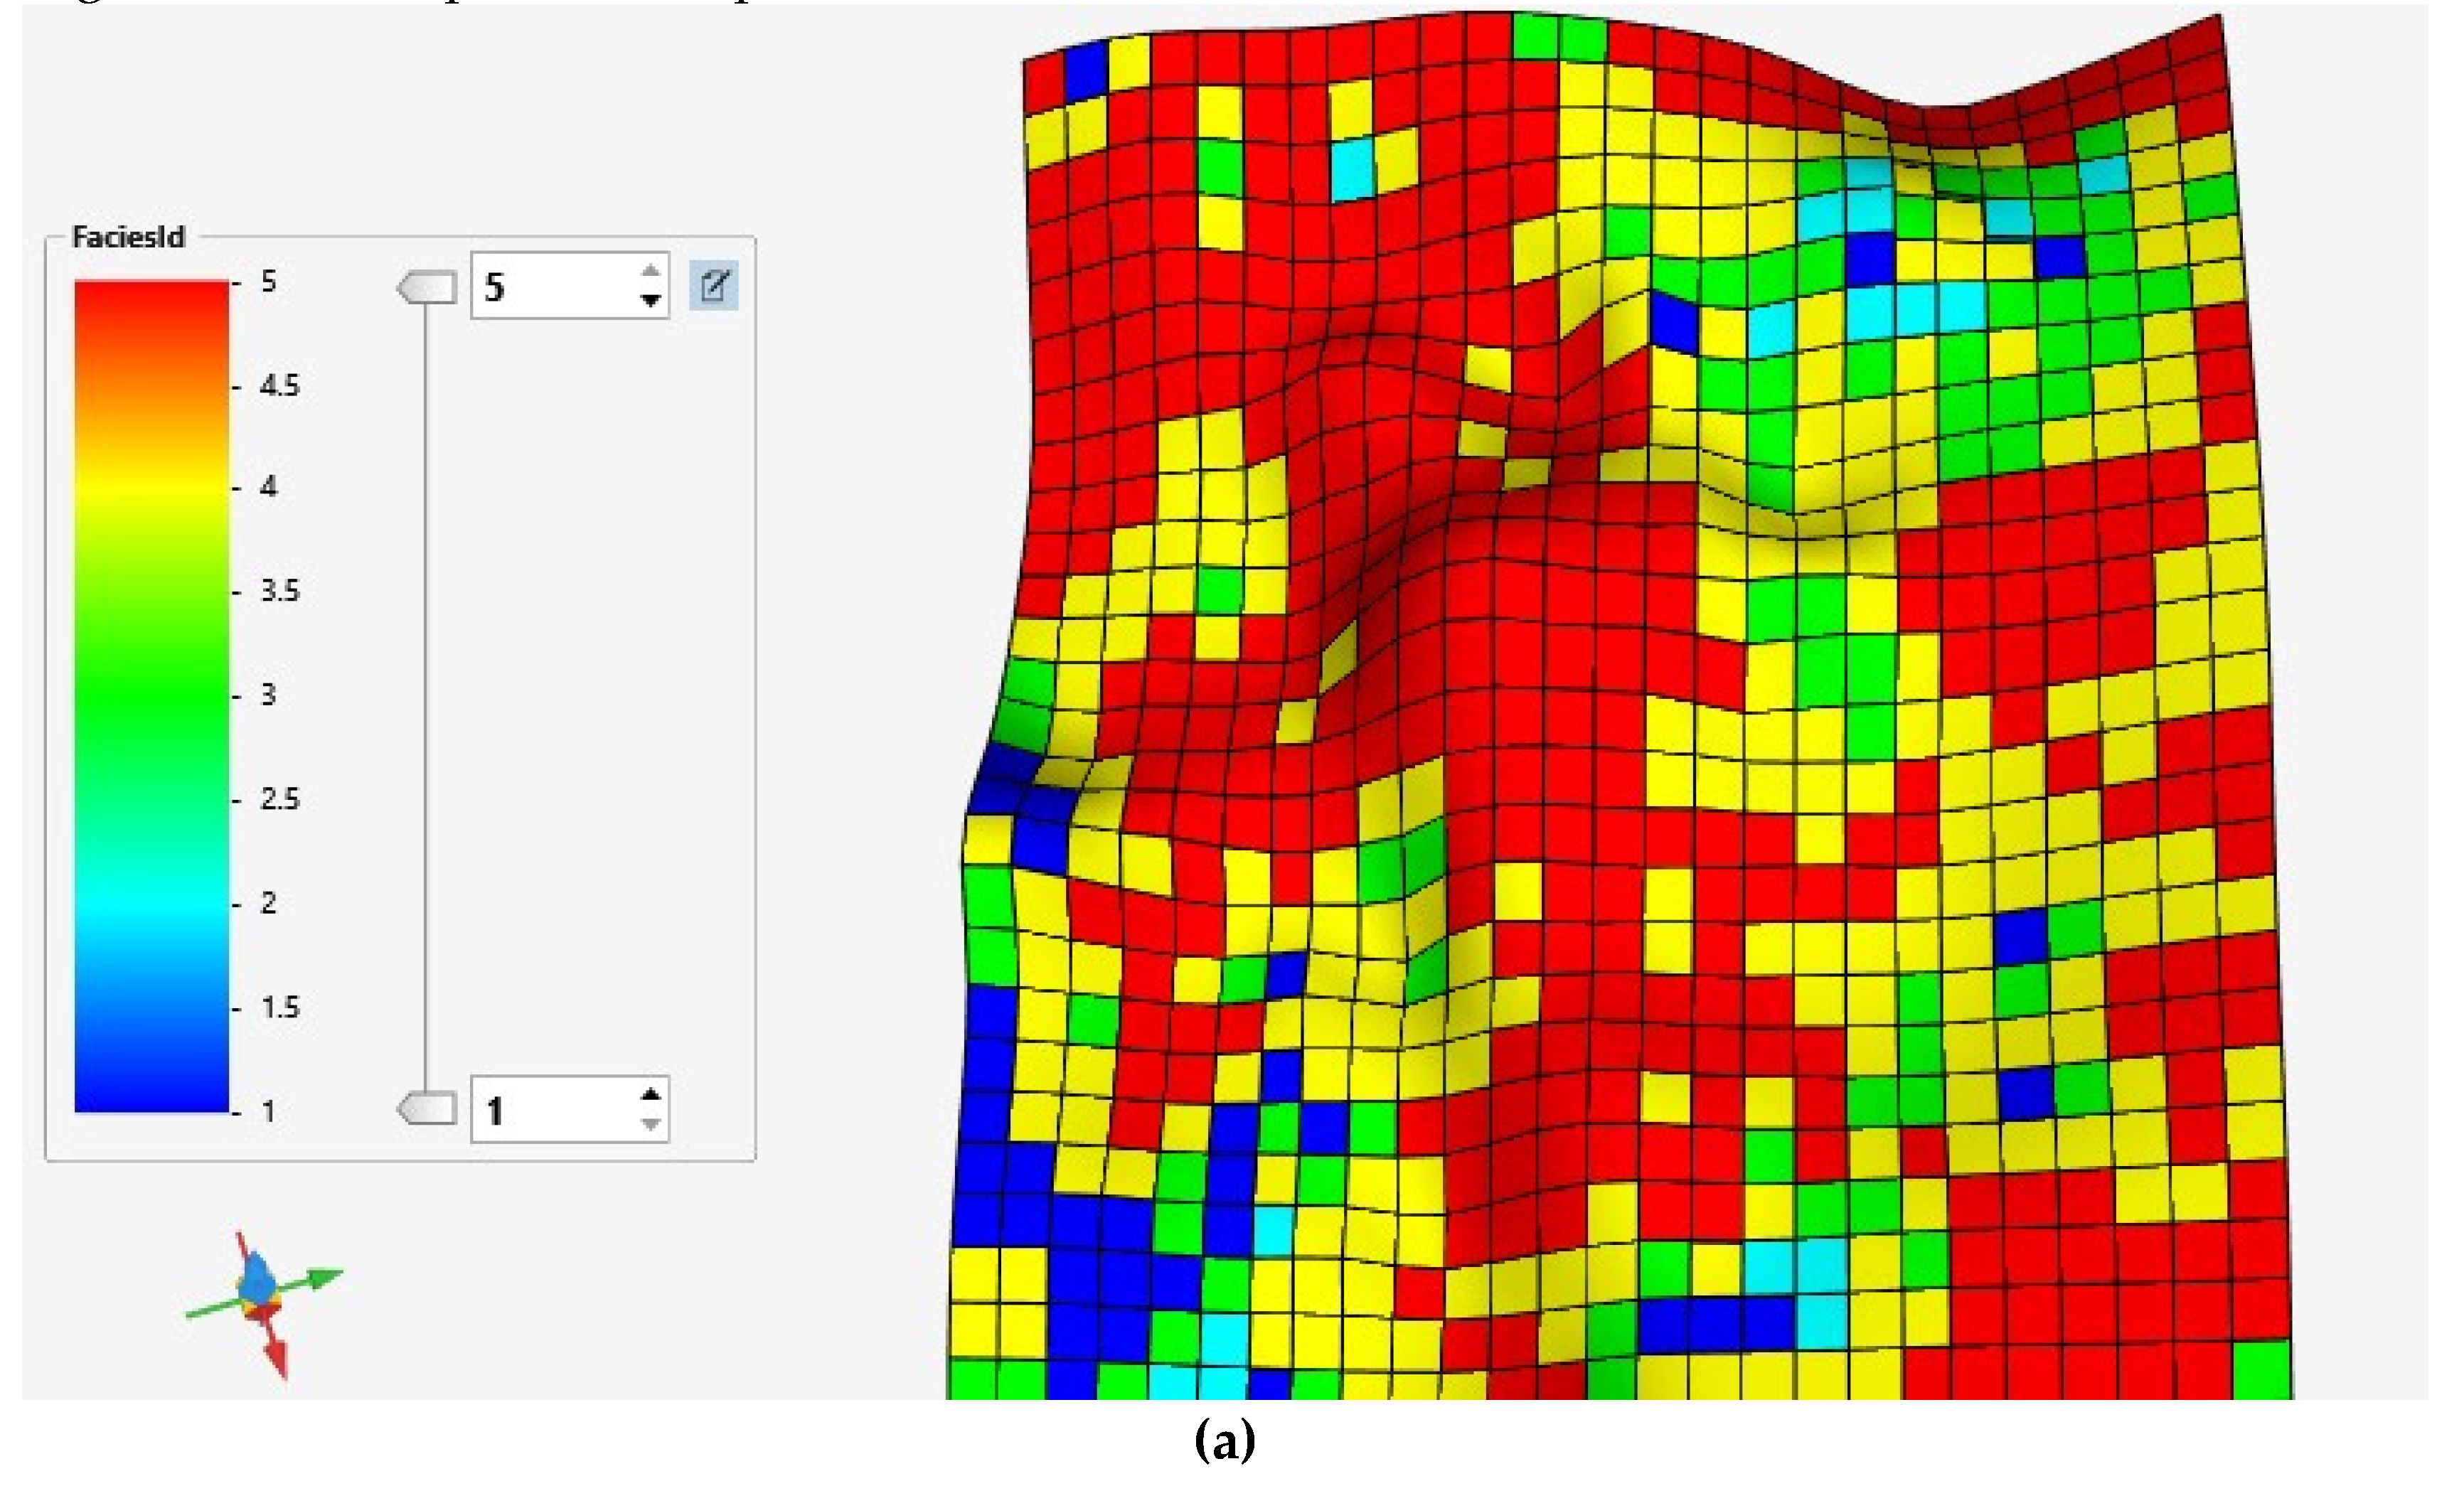
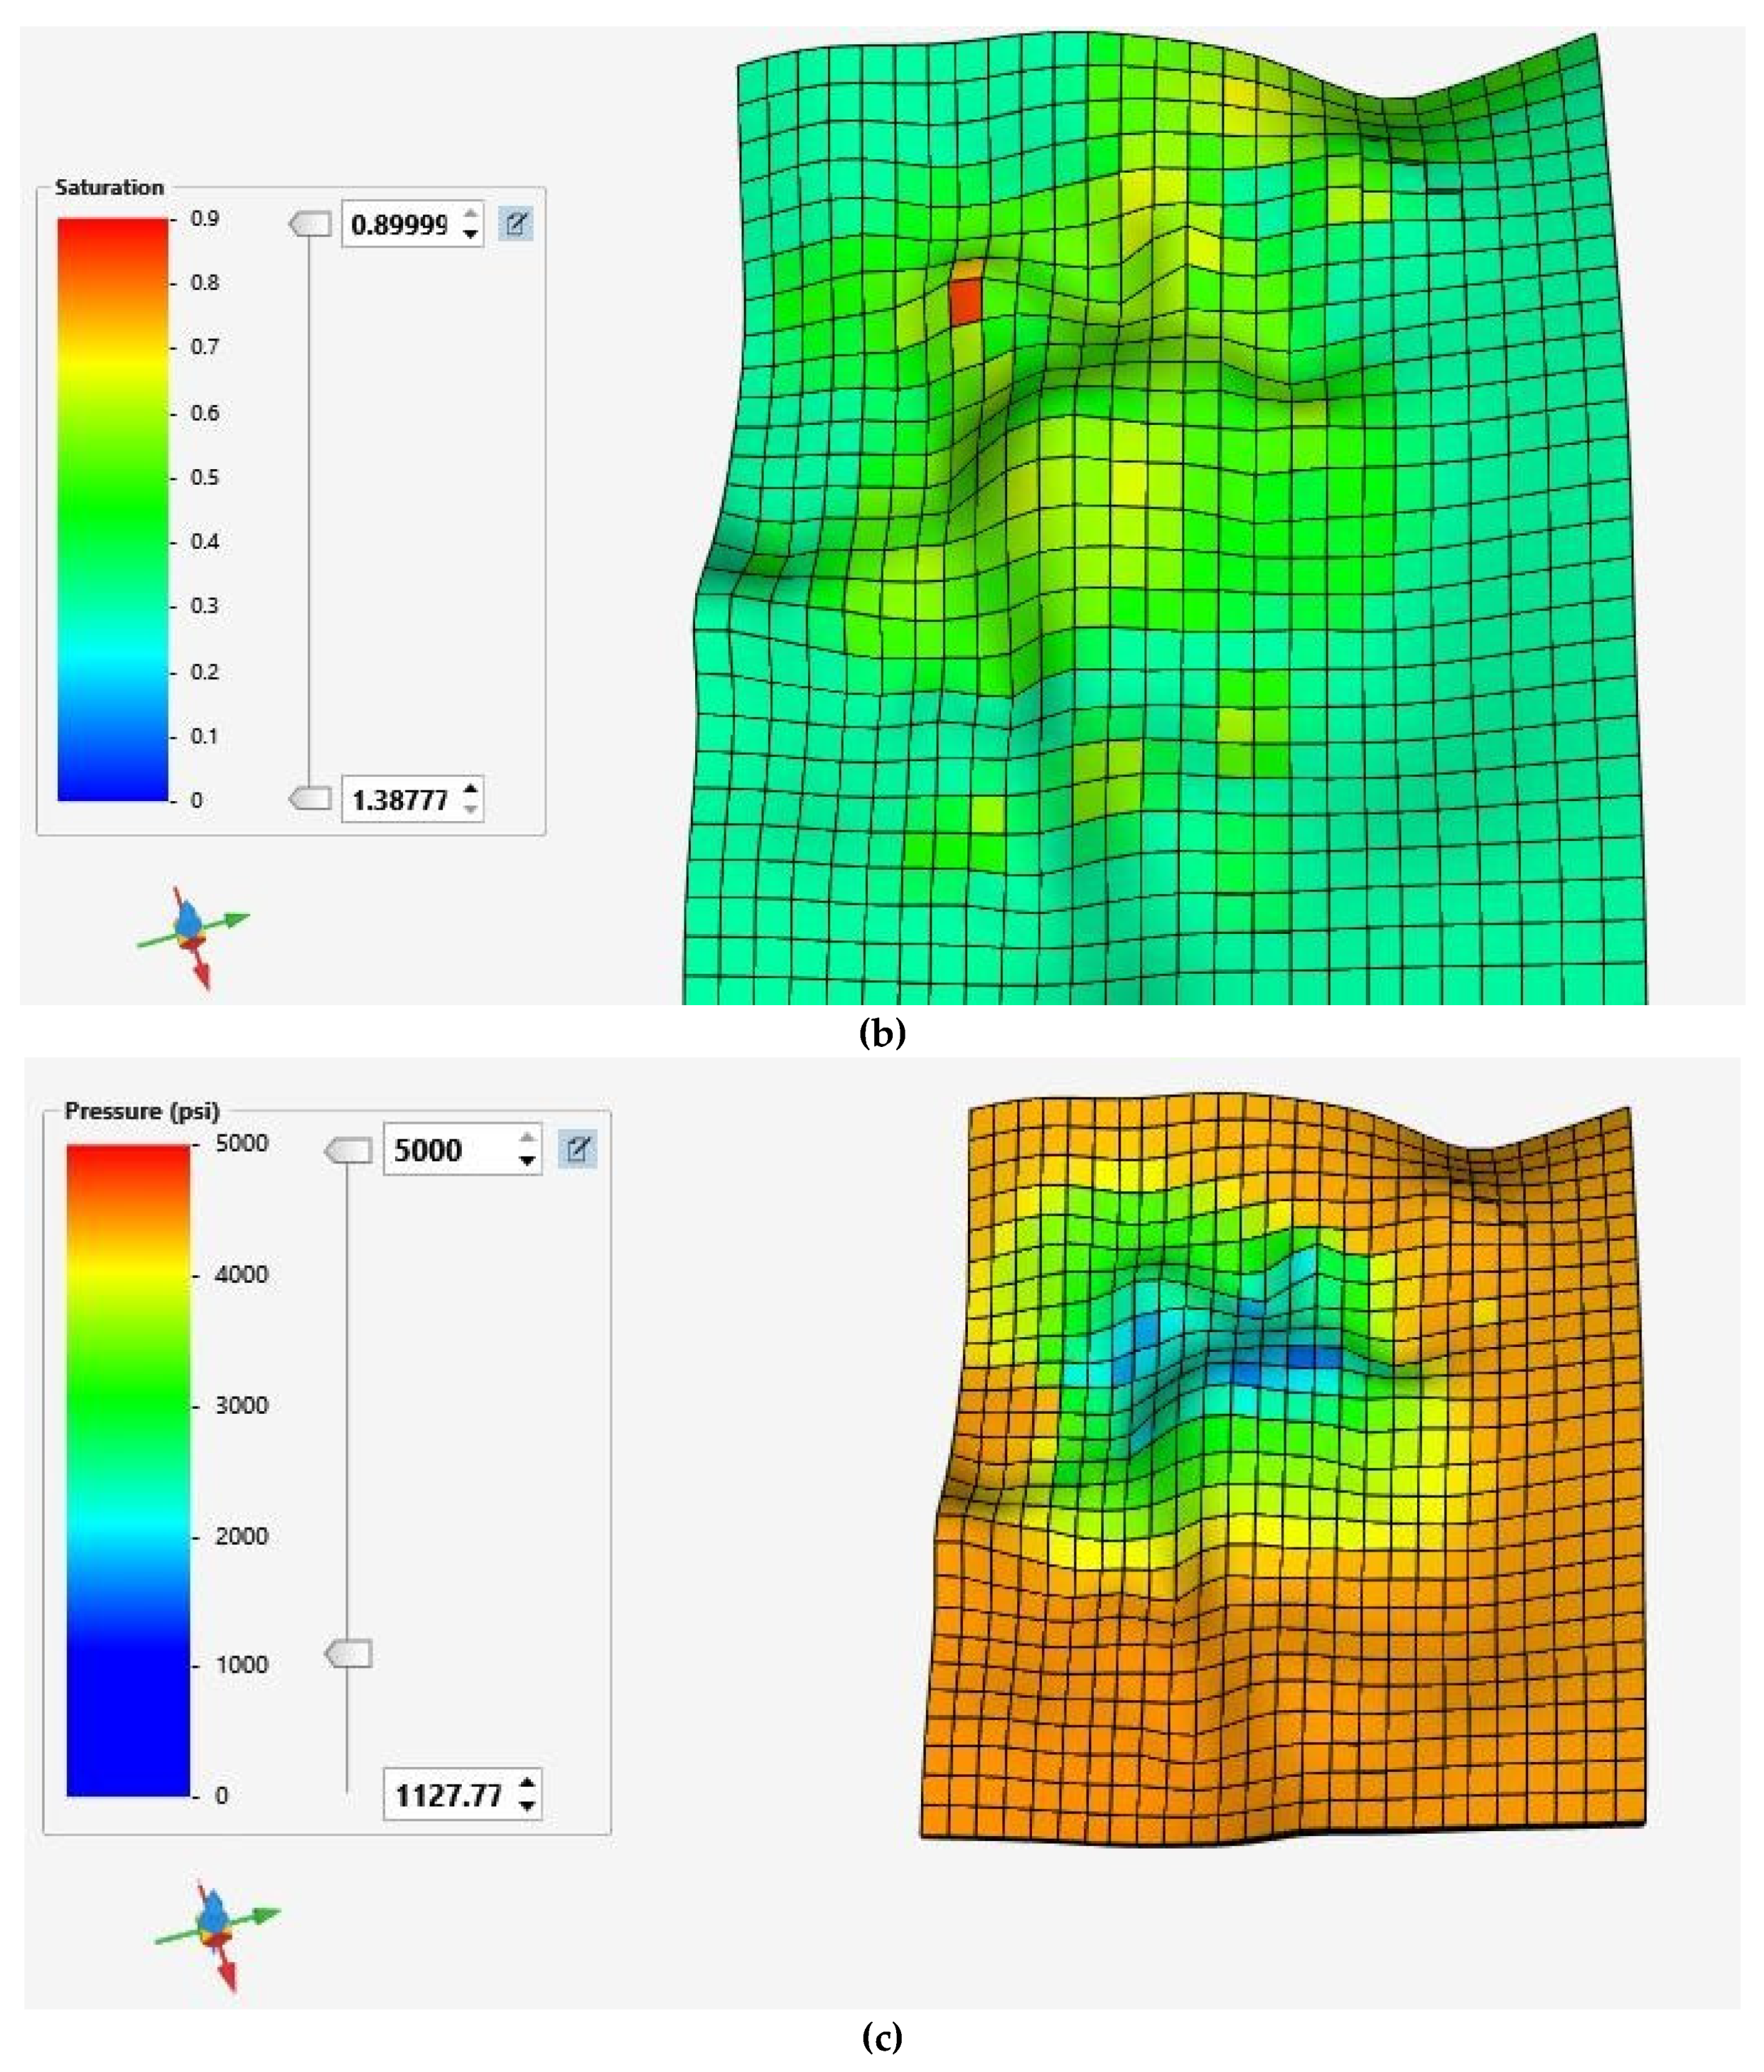
Figure 4.
(a) Reservoir Grid of Left Range showing Water Saturation Distribution; (b) Reservoir Grid of Right Range showing Water Saturation Distribution.
Figure 4.
(a) Reservoir Grid of Left Range showing Water Saturation Distribution; (b) Reservoir Grid of Right Range showing Water Saturation Distribution.
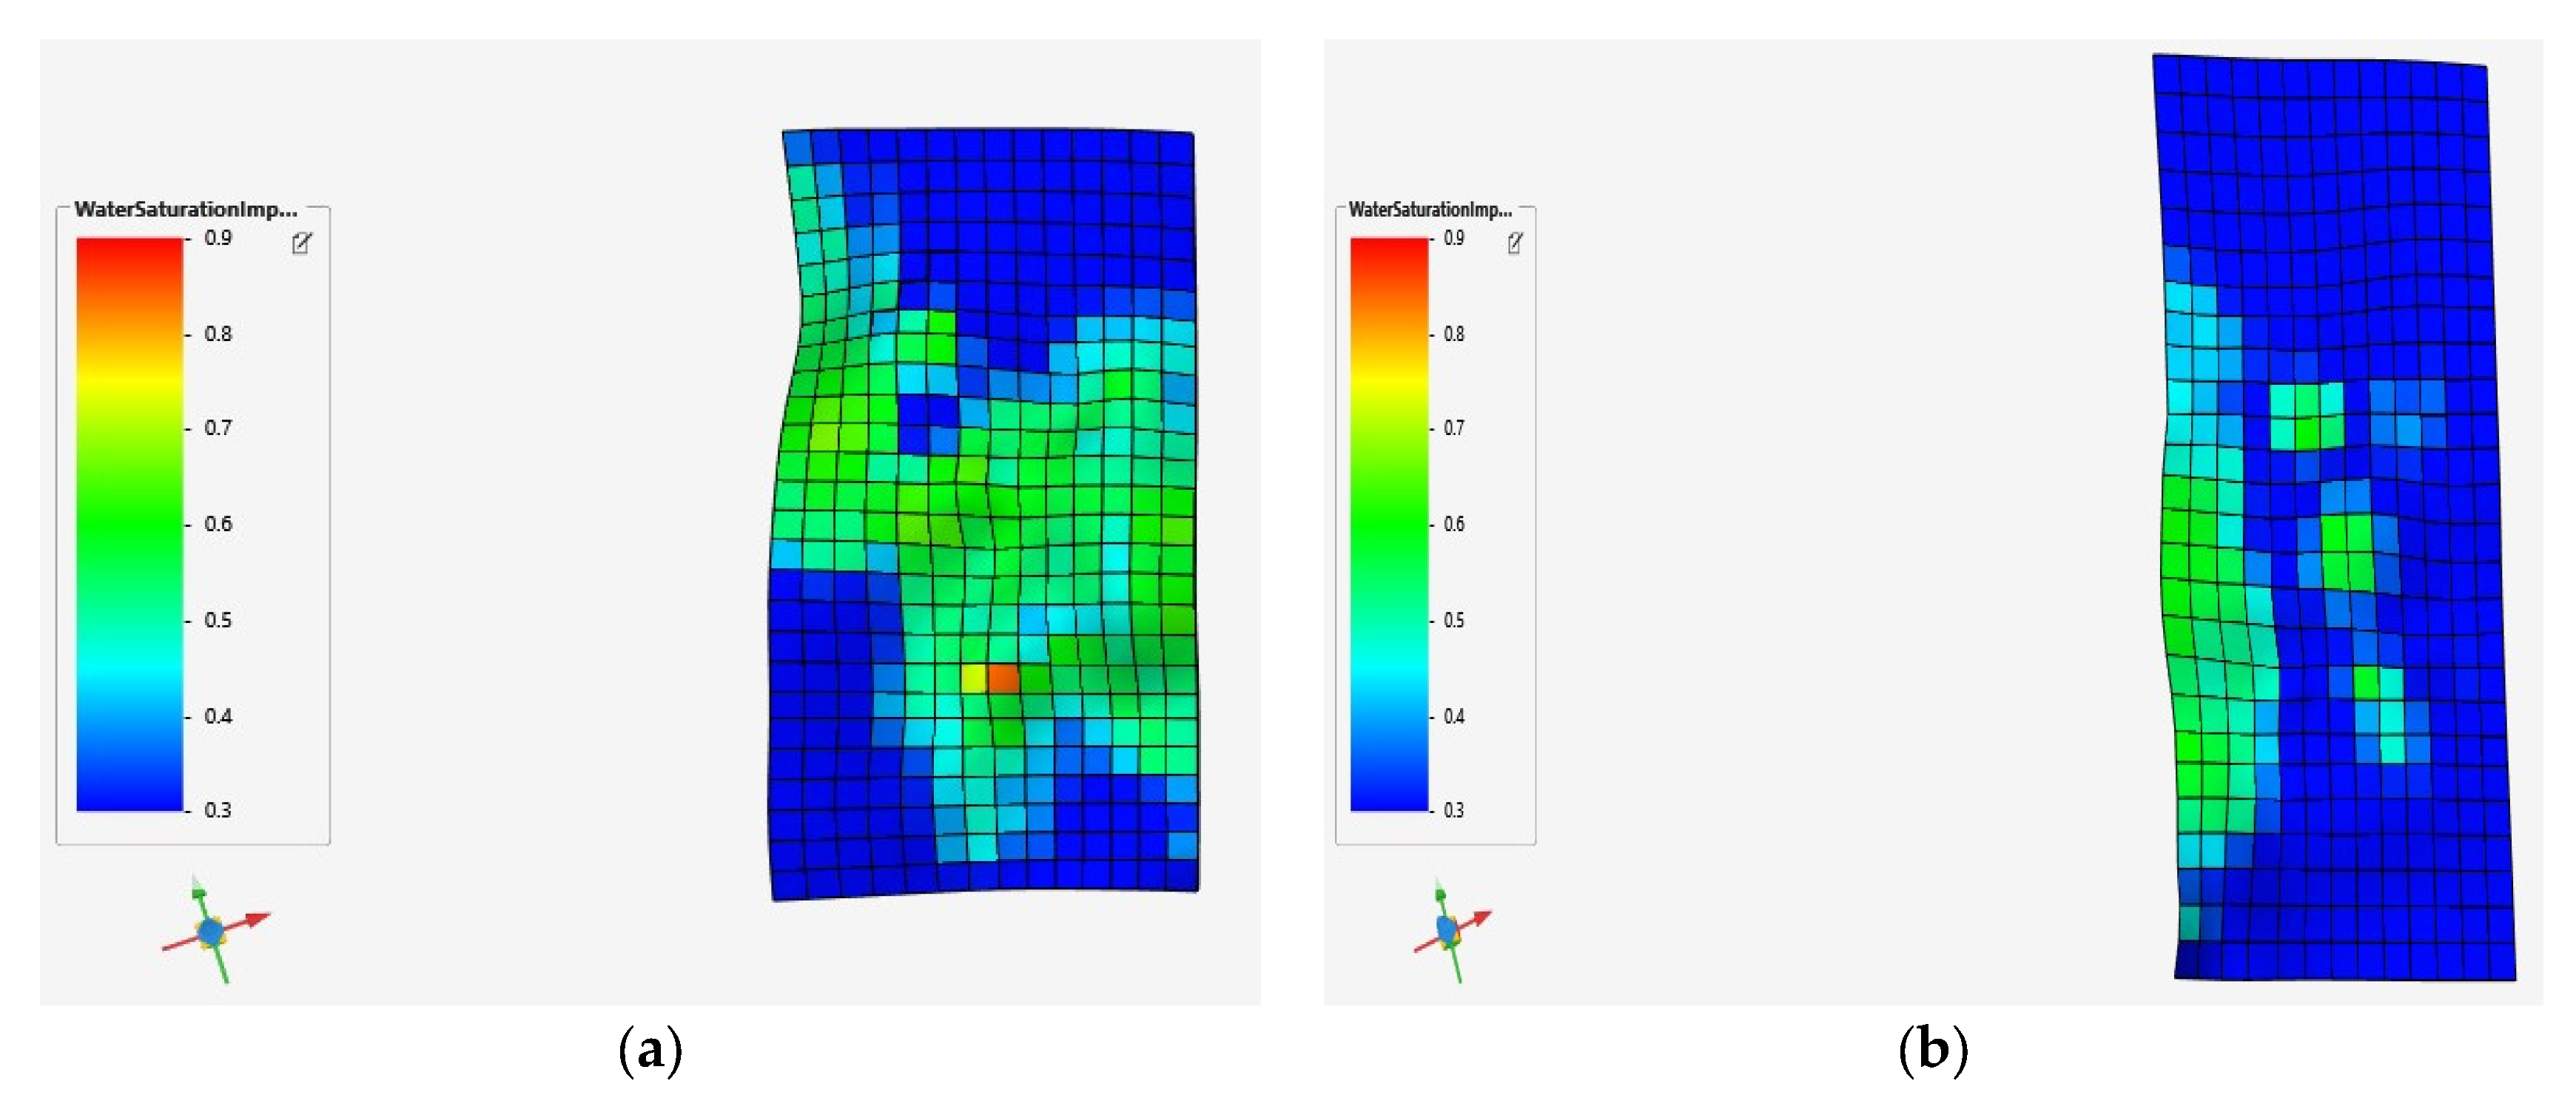
The initial relative permeability curves proved unreliable for this work. Relative permeability lab data acquired is tested on dead oil, and hence, is not conclusively representative of the relative permeability at field condition. Relative permeability of a reservoir is known to evolve with time as recovery continues. There have been two recovery stages, primary and secondary, that have taken place. The history-matching in this work focuses on the tertiary phase of production. Two relative permeability curves are used. The reservoir was divided into two—left side and right side. The left side has seen a prolonged period of CO2 injection and is in the tertiary recovery phase compared to the right side which is still in the secondary recovery phase.
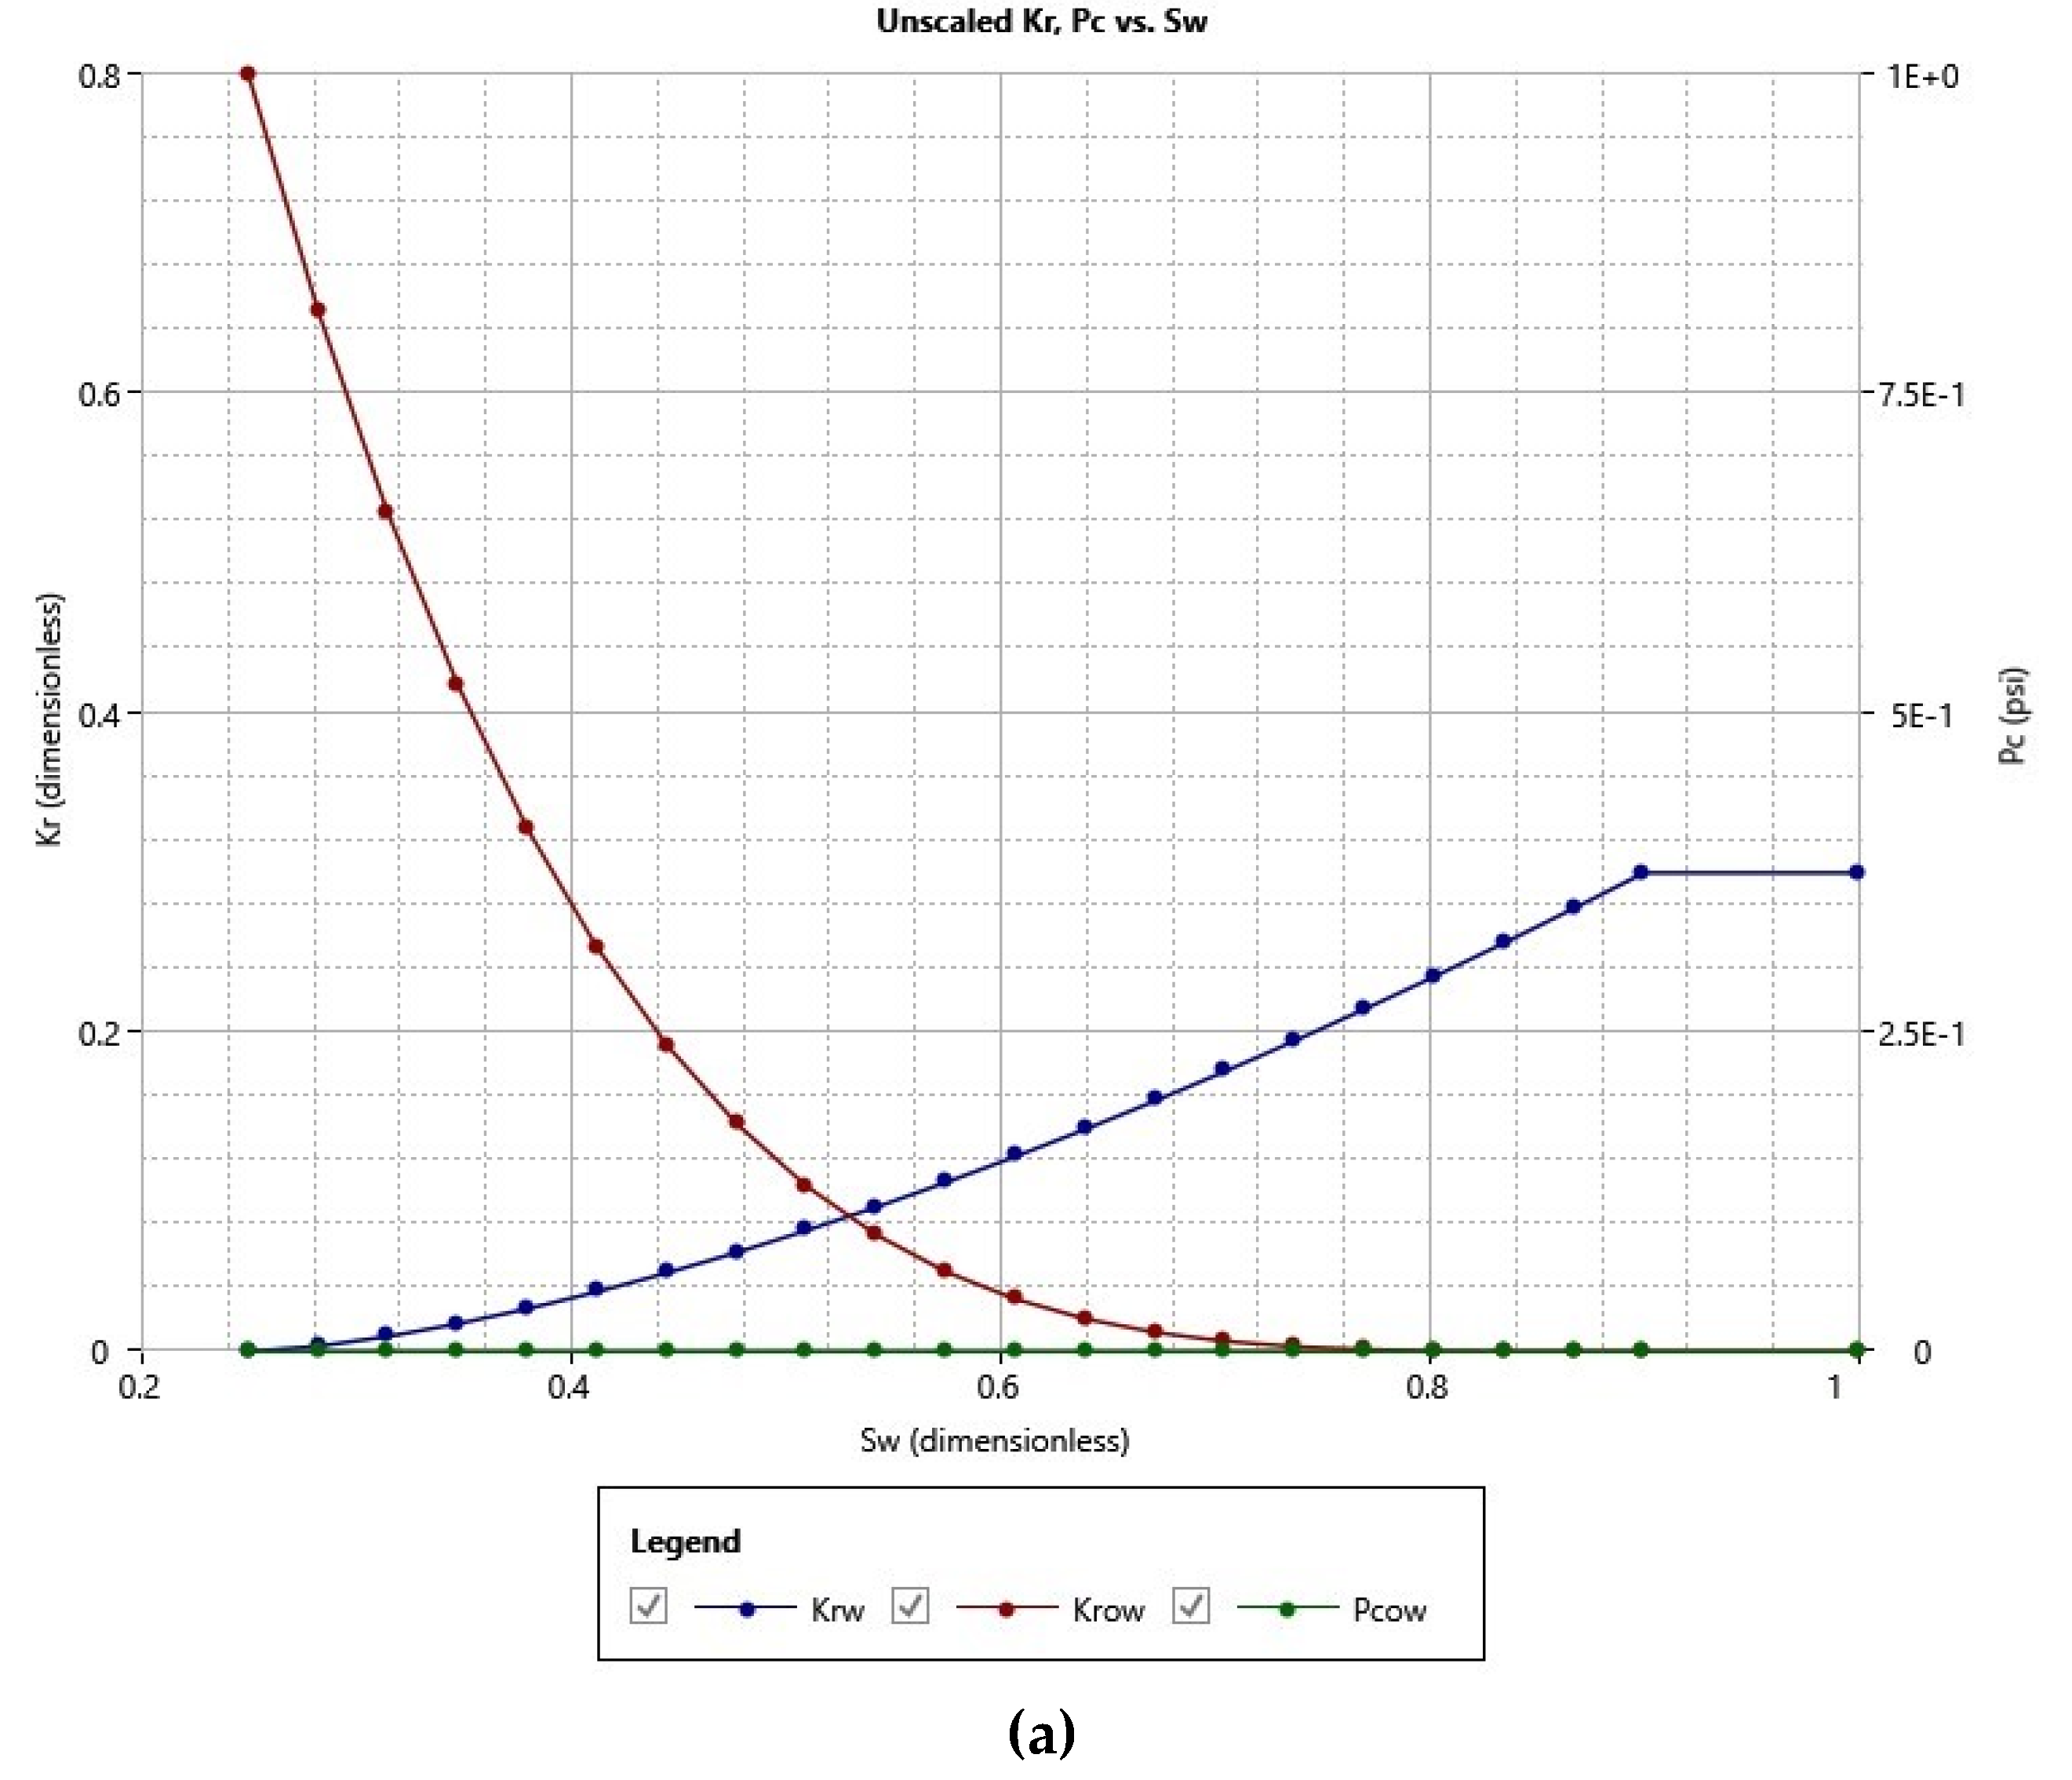
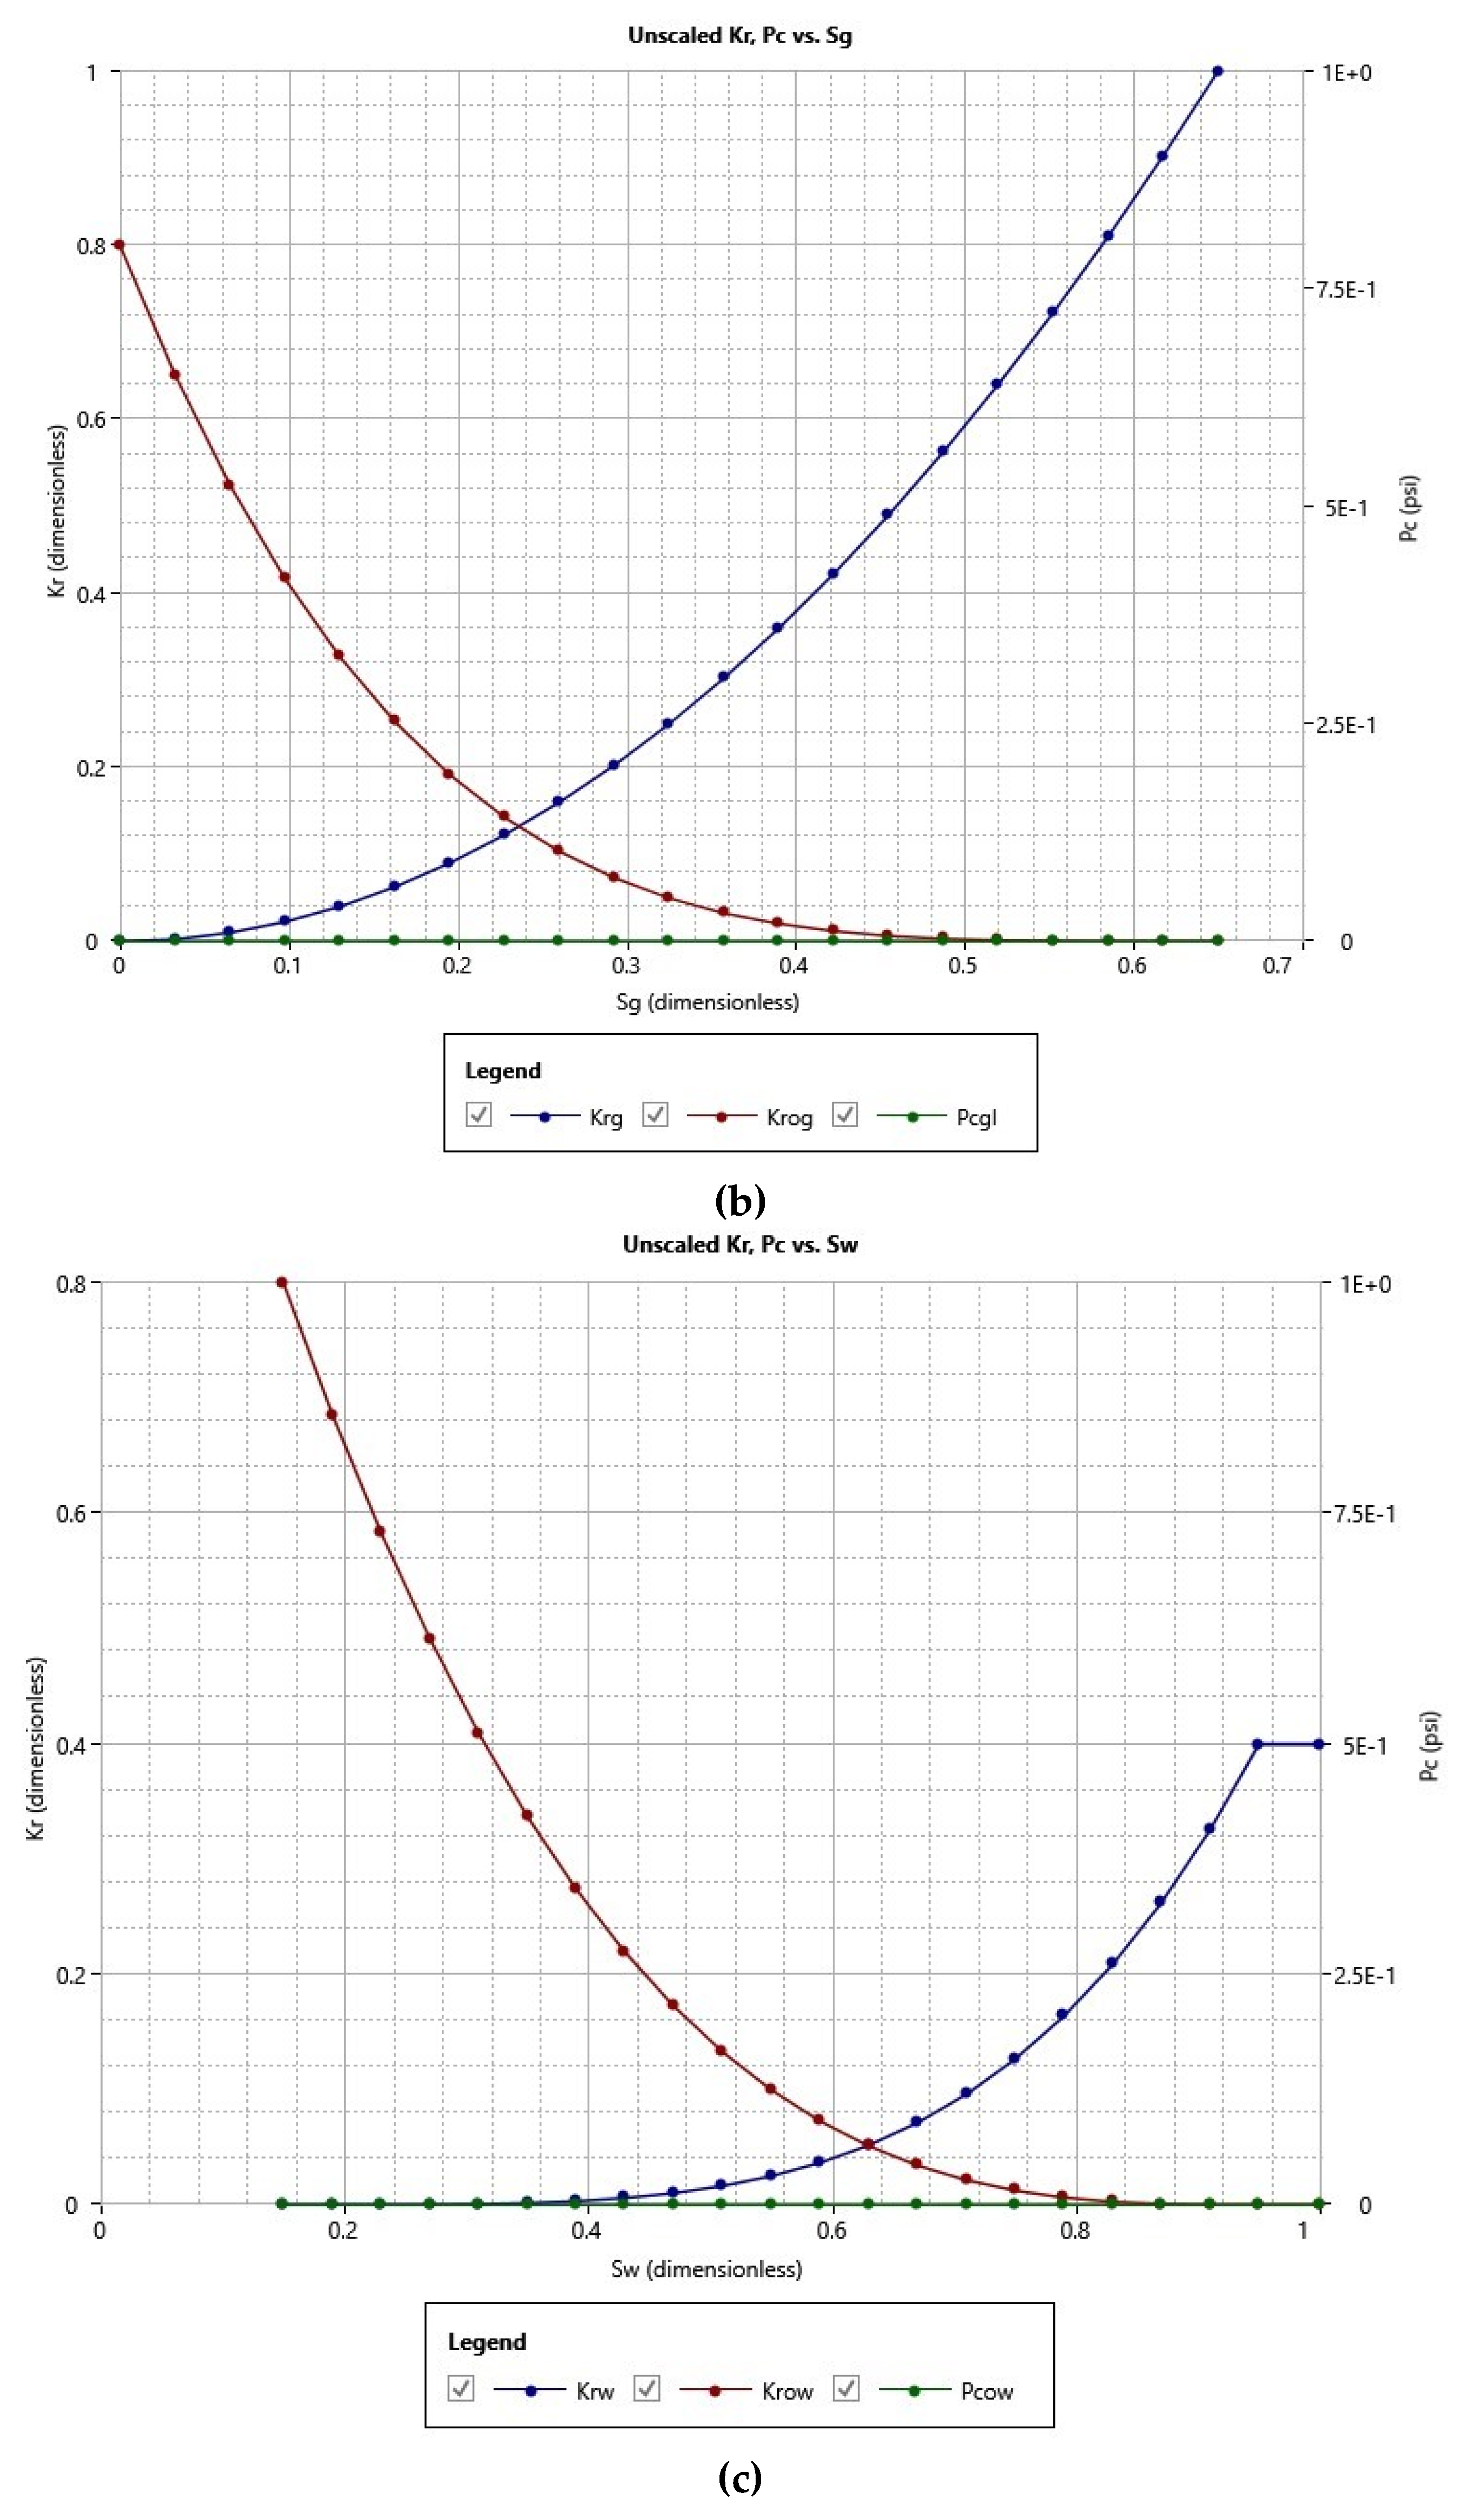
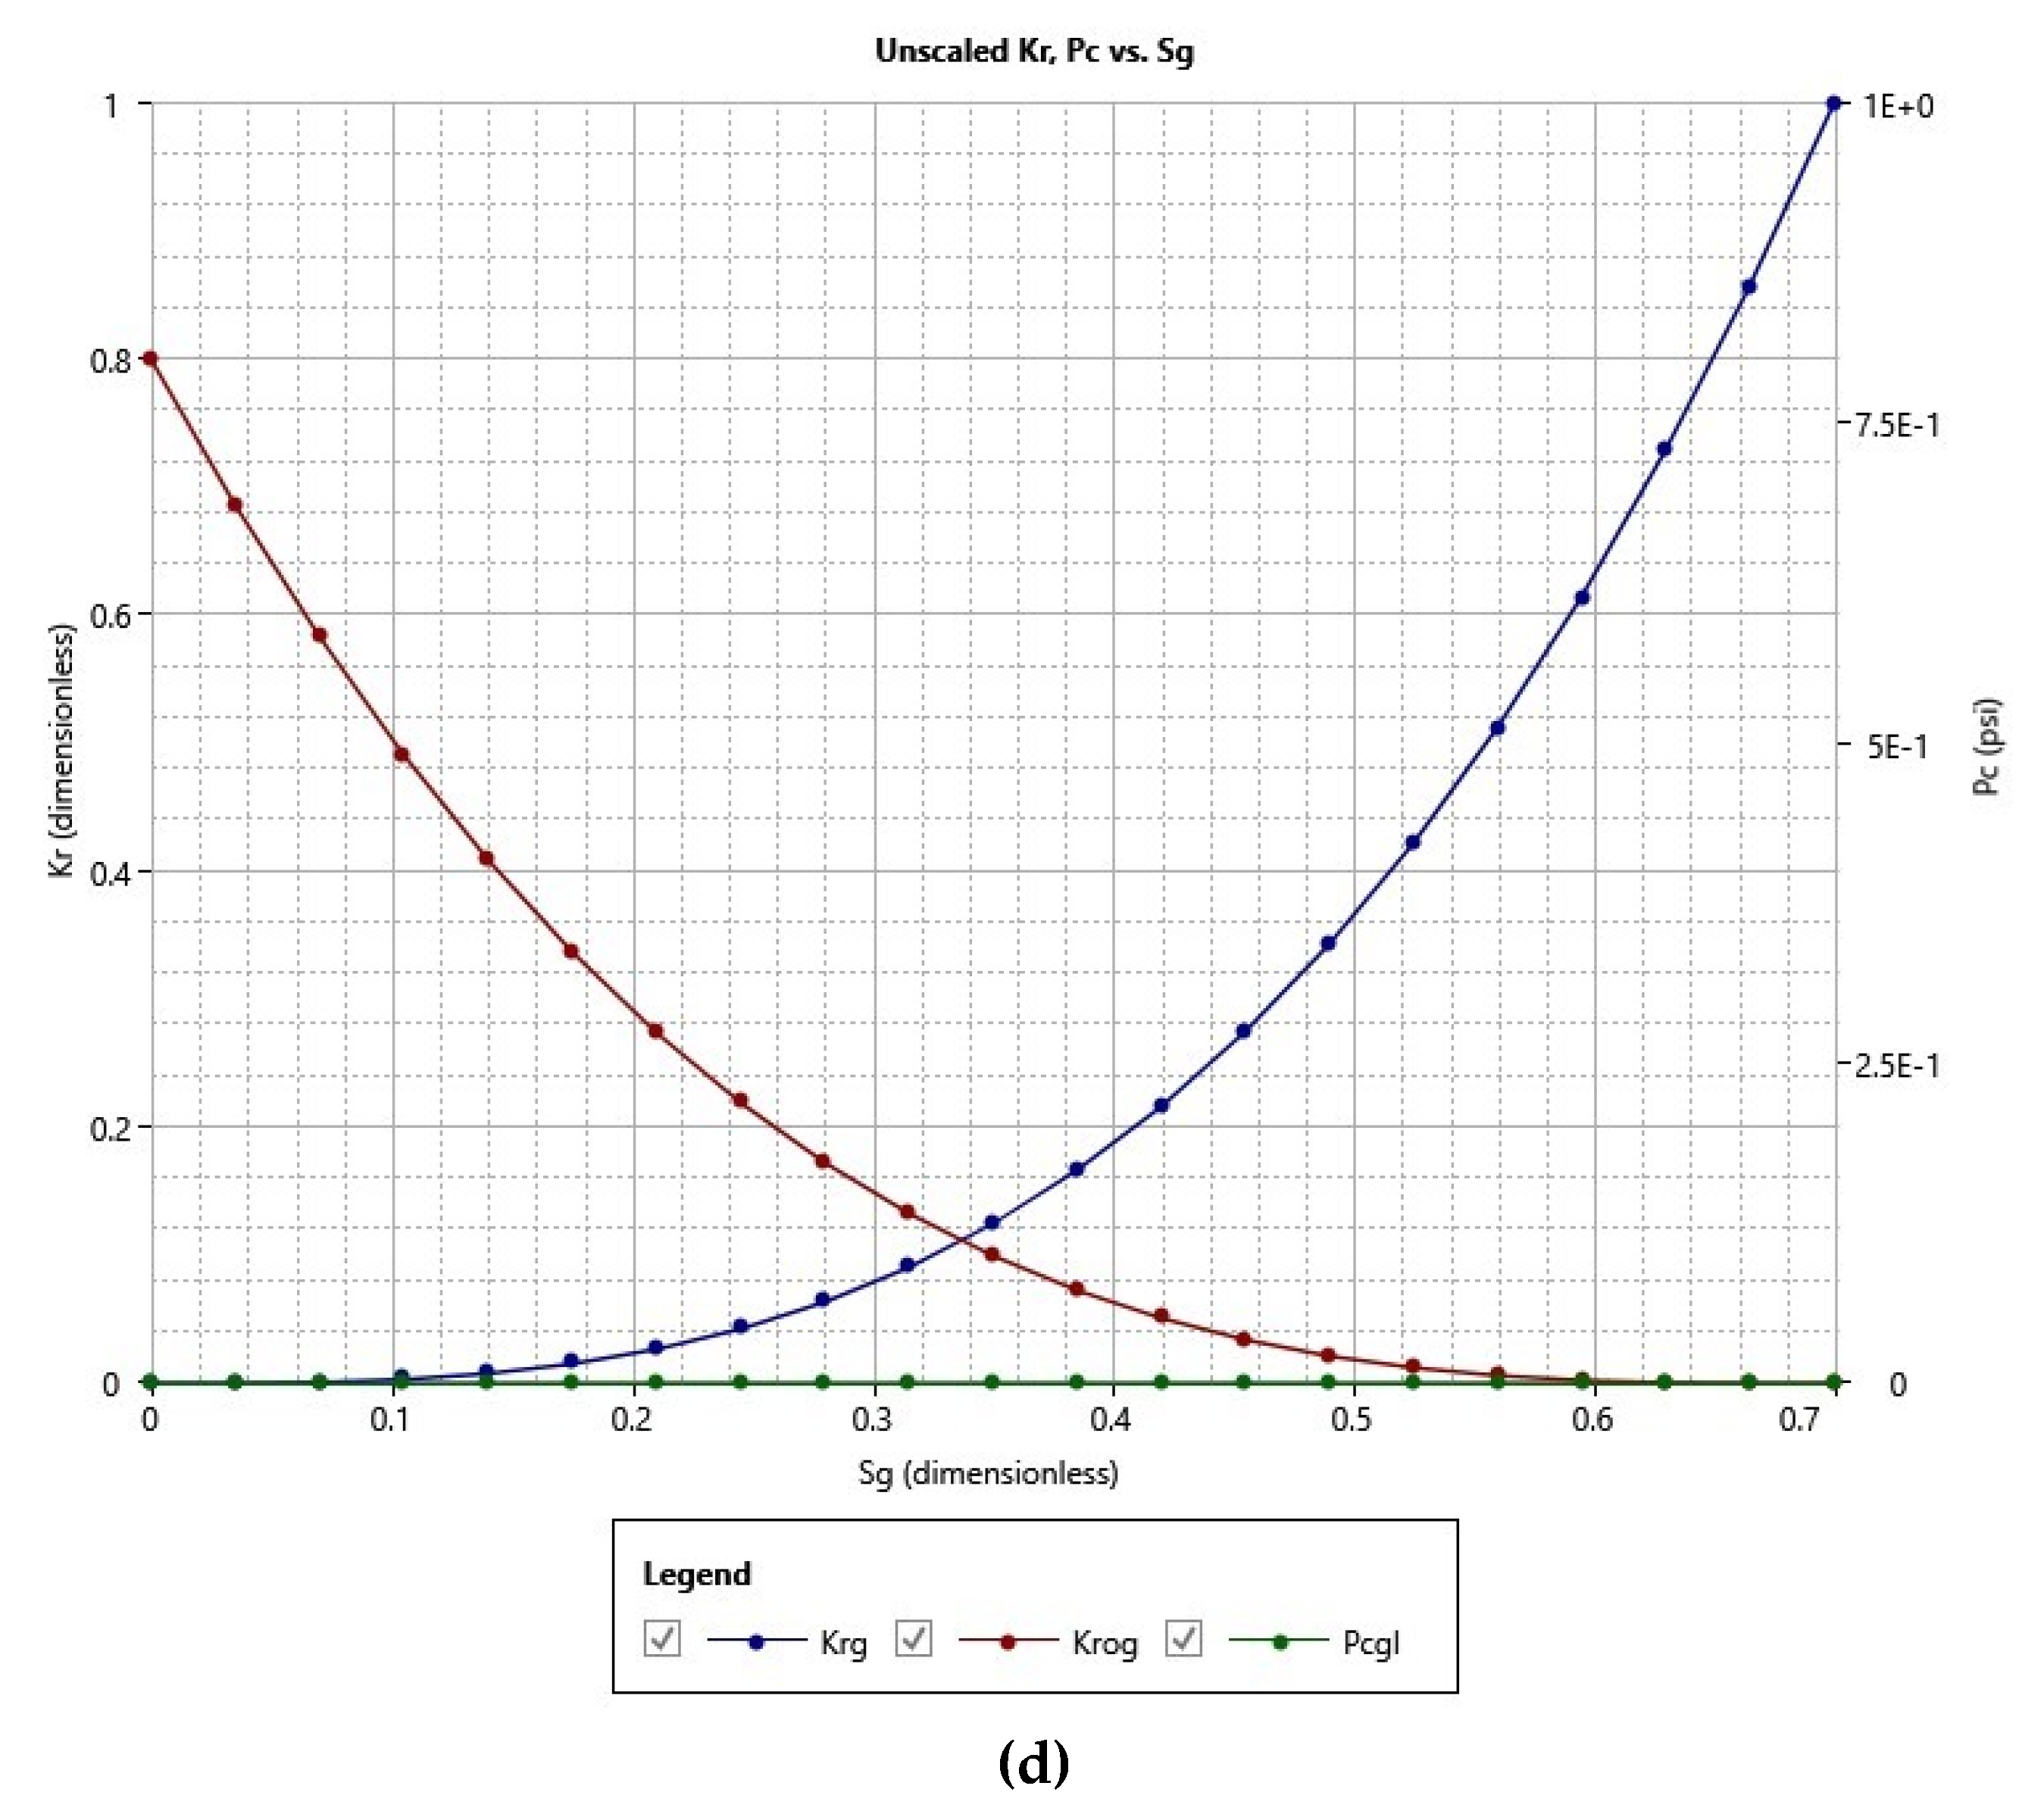
Figure 5.
(a) Oil-Water Relative Permeability Curve for Right Range; (b) Gas-Liquid Relative Permeability Curve for Right Range; (c) Oil-Water Relative Permeability Curve for Left Range; (d) Gas-Liquid Relative Permeability Curve for Left Range.
Figure 5.
(a) Oil-Water Relative Permeability Curve for Right Range; (b) Gas-Liquid Relative Permeability Curve for Right Range; (c) Oil-Water Relative Permeability Curve for Left Range; (d) Gas-Liquid Relative Permeability Curve for Left Range.
2.3. Wells
The wells were modeled using an isothermal high-fidelity pressure-drop calculation which considers pressure loss due to head, friction, and acceleration. Temperature is assumed to be constant throughout the wellbore. This model provides accurate pressure calculations with no consideration for temperature since the focus is on resolving the pressure interaction at where the wells connect to the surface facilities.
where (dp/dl)Elevation denotes pressure loss due to head, (dp/dl)Friction denotes pressure loss due to friction, (dp/dl)Acceleration denotes pressure due to acceleration, pm denote density of multiphase fluid, θ denotes degree of deviation of wellbore, fm denotes fanning friction factor, vm2 denotes velocity of fluid flow, g/gc denotes acceleration due to gravity constant, and d denotes inside diameter of pipe.
Water and gas injection rates were specified for injectors using constraints from historical injection rate data. The production constraints in producers were set to match liquid production rates.
2.4. Surface Facility
The surface facility of the field is simplified and made up of two sections, the production facility, and the injections facility. The surface facility is imposed on the subsurface and runs for a complete loop. In running the history match model, the production facility has all producer wellheads connected to a gathering center and end up in a high-pressure three-phase separator. From the separator, oil components are transferred to a sink or storage. Water and gas are also sent to their respective sinks. In the injection facility, each well has a gas source and water source connected to it through a compressor and pump respectively. Injection rates from the surface facility are controlled by specifying constraints on the connector from the gas sources and water sources individually. The constraints used are the historical injection rates for each injection component (water and CO2). This is not the ideal facility layout for injection but due to limitations in the software, this is a feasible workaround that provided the expected results.
Once the history match is complete, the surface facility is redesigned to fit the ideal and intended layout to be used in the prediction cases. In these cases, the producers are connected to a gathering center (manifold). The manifold feeds the high-pressure three-phase separator through a heat exchanger. There are two separation stages, high and low, and the oil is the only phase that is stored. The gas and water components from the separators are transferred to the injectors.
2.5. History Matching
History matching was done using an assisted history match process making use of advancements in computational power and machine learning techniques. This critical phase entails fine-tuning the model. The data gathered possesses an inherent degree of uncertainty and as such, modifications through history matching are not only anticipated but are a fundamental part of enhancing the reliability and accuracy of the model. This step was carried out in three stages: parameterization, sensitivity analysis and optimization.
- (a)
- Parameterization
A range of static and dynamic properties believed to be uncertain are selected as uncertainty parameters which would be varied within reasonable bounds to find a good match. The selected geological properties are transmissibility and permeability within specific ranges. The dynamic properties selected are the Corey parameters which define the relative permeability curves describing fluid flow in the reservoir. Table 1 summarizes the geological and dynamic properties which are selected for parameterization and the bounds between which each parameter is being varied.
- (b)
- Sensitivity Analysis and Proxy Modeling
Once the parameters have been selected, a sensitivity analysis is run using an embedded commercial optimization tool utilizing a response surface methodology to determine the degree of impact each parameter has on the objective function of the simulation. The result of this analysis is used to build a proxy model. The goal of the proxy model is to match the result of the simulation experiment. This would validate the ability of the proxy to predict the result. In a feature called “What-if Scenario”, CMOST allows us to vary each parameter within the selected bounds and see the result in real time. The dynamic properties relating to the relative permeability characteristics of the field are each assigned to a range such that all ranges, Top Left (TL), Top Right(TR), Bottom Left (BL) and Bottom Right (BR), each have their parameters as part of the sensitivity analysis.
In the selection of the proxy model, two approaches would be compared—a polynomial regression model and a Radial Basis Function (RBF) Neural Network model. The model that gives the best match is selected for the “What-if”analysis.
- (c)
- Optimization
After the sensitivity analysis, the number of parameters is trimmed to reduce the number of simulations run in the optimization process. To assist optimizing the history match, a machine learning algorithm called Particle Swarm Optimizer is used.
The accuracy of the model in matching the historical data is a measure of validity of the model. The output in this section include production and injection rates, and cumulative values. The mean absolute percentage error is used to quantify the deviation of the simulation from the actual values. It is governed by the equation below.
where, MAE denotes the mean absolute error, X denotes the simulated vale, and Y denotes the historical value.
2.6. Simulation and Forecast
Once a suitable history match has been achieved, attention moves on to forecasting and optimization. In the forecast stage, there are two cases considered.
The first case is referred to as the “Do-Nothing” case where operating conditions at the end of the history match period are used to simulate production for the next 15 years. This informs us how the model expects the reservoir to perform post-history match. From the historical data, there are 31 producers of which 27 are active and 4 are shut in due to high watercut. Also, there are 20, of which 4 are injecting water and the rest are on WAG injection cycles. The bottomhole pressures within the last three months are averaged and assigned as a constraint to the producing wells. An overall liquid production constraint of 6,000 STB is put on field production by being assigned to the outlet of the final production manifold. Keeping the reinjection facility intact, the constraint on total gas injected per day is 20MMSCF while all produced water is reinjected into the reservoir. An average reservoir pressure is set at 4,500 psi with any well injecting above the fracture pressure of 5,500 psi being shut in.
After the “Do-Nothing” case is run, an improved development scenario is designed to increase oil production and carbon dioxide storage. In this case, injection bottom-hole pressures are kept the same as in the “Do-Nothing” scenario. The difference between this improved case and the “Do-Nothing” case is the reopening of 4 shut-in producers and the conversion of 4 water injectors to WAG injection cycles. Watercut of 90% and GOR constraints of 50,000 SCF/STB are also included to reduce the proportion of volume occupied by water and gas. A sensitivity analysis is run on the improved development case to determine the components from the surface facility which most affect the objective function. The sensitive parameters are then fed into the particle swarm optimizer algorithm using CMOST to optimize the operating conditions.
Afterwards, simulation forecast runs are carried out for the two cases for 15 years, from 1st September 2020 to 31st August 2035. The liquid production is capped at 8,000 STB. This is a reasonable maximum value since it is within the deliverability of the reservoir and handling capability of the field.
2.8. Optimization of Development Strategy
The development scenario starts with all wells reopened. There are 31 producers and 20 injectors. All injectors are on WAG cycles and to be optimized. The maximum average reservoir pressure is capped 4,500 psia with a minimum of 4,200 psia so that is remains above the minimum miscibility pressure. A watercut percentage of 90% and gas-oil ratio constraint of 50,000 SCF/STB is applied to the producers. Below is table summarizing the operating conditions and WAG cycles of the base developed case.

Table 2.
Summary of Operating Conditions of Base Developed Strategy.
| Parameters | Default |
|---|---|
| Pressure on Production Manifold, psi | 90 |
| Injection Group 1 (gas/water), months | 2/2 |
| Injection Group 2 (gas/water), months | 3/1 |
| Injection Group 3 (gas/water), months | 9/1 |
| Injection Group 4 (gas/water), months | 3/3 |
| Compressor Rate, MMSCF/Day | 34 |
| High Separator Pressure, psi | 62 |
Analogous to the process in the history matching stage, a set of variables representing the operating conditions of components in the surface facility are selected and a sensitivity analysis is run on these parameters to determine the degree of impact each component has.
In this stage, a Radial Basis Function Neural Network (RBFNN) is trained using the Response Surface Methodology to build a proxy model. This proxy model would substitute complex surface-coupled flow physics and be used in determining the sensitivity of each parameter. The most impactful and sensitive parameters are selected and fed into the particle swarm optimization algorithm to give us the best possible output. Using the PSO, the selected parameters would continue to vary within the ranges they are assigned until each is an optimum position that is closest to the objective function. Below is a table summarizing the selected uncertainty parameters and the bounds within which they would be varied.
Table 3.
Optimization Parameters.
| Parameters | Default | Minimum | Maximum |
|---|---|---|---|
| Pressure on Production Manifold, psi | 90 | 60 | 120 |
| Injection Group 1 (gas/water), months | 2/2 | (1:1) | (12:3) |
| Injection Group 2 (gas/water), months | 3/1 | (1:1) | (12:3) |
| Injection Group 3 (gas/water), months | 9/1 | (1:1) | (12:3) |
| Injection Group 4 (gas/water), months | 3/3 | (1:1) | (12:3) |
| Compressor Rate, MMSCF/Day | 34 | 17 | 34 |
| High Separator Pressure, psi | 62 | 30 | 70 |
After viewing the impact of parameters on the cumulative oil recovered and mass of CO2 stored, the resulting impact of these parameters on the Net Present Value (NPV) is ascertained. For each objective, there are four plots that would be highlighted and used to address the sensitivity analysis. These four plots are the qq-plot, Monte Carlo Simulation plot, Morris Analysis, and Sobol Analysis Tornado Chart.
Looking at the impact of each parameter on the selected objective functions, a new term, Field NPV, is defined to include both objective functions, cumulative oil recovery and CO2 stored, by summing the local NPVs which are the two objective functions. The Field NPV was calculated by summing two local NPVs. These NPVs are the revenue generated from the daily oil production and the tax benefits generated from CO2 stored. The oil revenue local NPV considers gains from oil sales at $60/bbl. Losses are estimated due to facility maintenance and water management. The impact of water management and its recycling is estimated at $2.64/bbl of water. Facility maintenance and well workover is also estimated to result in approximately $20.92/bbl of oil produced. This is a simplified economic analysis which does not account for royalties and taxes. Capital expenditure is also left out since the field is mature and the facilities needed for this development are already in place. Other operating costs such as staff or labor and well workover costs are not included since this not the main focus of the study. In the second local NPV, CO2 stored, the tax benefit from CO2 sequestered is considered to be $24/t [29]. The cost of recycling and compressing CO2 is estimated at $0.4/MSCF. Smith et al. [30] estimates from analysis of various literature that the cost of transport and storage of CO2 is approximately $11.2/t via pipeline. The two local NPVs are combined in an arithmetic sum in the Field NPV.
Table 4.
Factors Considered in Calculating NPV.
| Parameters | Cost |
|---|---|
| Price of CO2 transport and storage, $/t | 11.2 |
| Recycle Compression, $/MCF | 0.4 |
| Surface Facility Maintenance and Well Workover, $/bbl | 20.92 |
| Water Management Cost, $/bbl | 2.64 |
| Price of oil, $/bbl | 60 |
| Tax Benefit for CO2 stored, $/t | 24 |
3. Results and Discussion
3.1. Proxy Modeling and Sensitvity Analysis
The results of the proxy modeling are shown in Figure 6 and Figure 7. The blue points represent the historical field data. The goal of the proxy model was to match the result of the simulation experiment (the black line). The polynomial regression plot line is a dashed line with a deep shade of green and the RBF Neural Network plot line is a dashed line with a light shade of green. In most plots from the Figure 6, the RBF Neural Network plot (dashed line with the light shade of green) overlays the black line. Although the polynomial regression plot line (deep green dashed line) follows the trend of the experimental results, it does not match it as well as the RBF Neural Network plot line. Hence, the RBF Neural Network model was selected for the “What-if” analysis.
The results of the sensitivity analysis run on the simulation are shown in Figure 8. This analysis is done to extract only the most sensitive parameters that affect the output of the simulation. However, all parameters were included in the history matching process. The relative permeability parameters on the right side of the reservoir show cumulative sensitivity of about 64% and the relative permeability of the left side of the reservoir is responsible for approximately 29%. Static properties such as the permeability in the X, Y, and Z directions and porosity multiplier contribute a combined 7% to the overall sensitivity of the parameters.
3.2. History Matching
The history matching results of the surface-coupled model demonstrate a suitable match between the historical data and the simulated outputs for liquid production, oil production, gas production, and water production. The history matching results validates the model’s reliability for forecasting and optimization purposes.
Figure 9 (a) illustrates the history matching results for liquid production rates. The model’s simulated data (red line) closely follows the historical production data (red dots) from 2011 to 2020. The observed fluctuations in liquid production rates are well captured by the model, indicating a strong correlation between the simulated and actual field data. Key production phases, including the initial ramp-up period, peak production intervals, and subsequent decline phases, are accurately represented. This consistency ensures that the model can be relied upon for future production forecasting and optimization scenarios.
Figure 9 (b) presents the history matching results for water production rates. The model’s performance in matching the historical water production data (blue dots) is good, as evidenced by the close alignment of the simulated results (blue line) with the actual data. The model accurately reflects the trends and variability in water production, including periods of increased water cut and stable production phases. This alignment is particularly important for optimizing water management strategies and predicting future water handling requirements.
Figure 9 (c) displays the history matching results for oil production rates. The simulated oil production data (green line) matches well with the historical data (green dots), capturing the key production trends from 2011 to 2020. The model effectively represents the initial production increase, peak oil production, and subsequent decline phases. This accurate history match underscores the model’s capability to predict oil recovery under various development scenarios, making it a valuable tool for optimizing CO2-WAG injection strategies and enhancing oil recovery.
Figure 9 (d) shows the history matching results for gas production rates. The model demonstrates a high degree of accuracy in replicating the historical gas production data (red dots), as indicated by the close correspondence between the simulated results (green line) and the actual production history. The model captures the significant production trends, including the initial gas breakthrough, peak gas production periods, and decline phases. This accurate history matching ensures that the model can be used confidently for forecasting future gas production and optimizing gas injection and recycling strategies.
The successful history matching of liquid, water, oil, and gas production rates validates the robustness and reliability of the surface-coupled model. The strong agreement between the simulated and historical data confirms that the model is well-calibrated and suitable for use in forecasting and optimizing production strategies in the FWU CO2-EOR process.
3.3. Simulation and Forecast
3.3.1. Do-Nothing Forecast
The results of the Do-Nothing case are shown below. The dashed blue line indicates the end of the historical period. The cumulative oil production at the end of forecast is 9.57 MMSTB. The oil production shows minimal decline, maintaining relatively stable production rates. This stability can be attributed to the high-pressure maintenance in the reservoir due to extensive water injection during the historical period (Figure 10).
Water production remains steady throughout the forecast period, without significant fluctuations. The cumulative water production reaches 50.438 MMSTB by the end of the forecast (Figure 11). The consistent water production rate suggests that the reservoir’s water handling capabilities are sufficient to support ongoing production without significant changes in water cut.
The gas production rate does not rise past 20MMSCF/D which is the injection limit for the recycling plant on the field. For the purpose of this study, gas production rate is to be controlled and keep GOR within field capacity. This knowledge is learned and implemented in the development strategy. Gas production continues to increase steadily, with periodic fluctuations due to operational constraints and gas recycling efforts. Wells producing excess gas are strategically shut-in to manage the GOR effectively (Figure 12).
Figure 12.
Do-Nothing Forecasted Gas Production Rate.
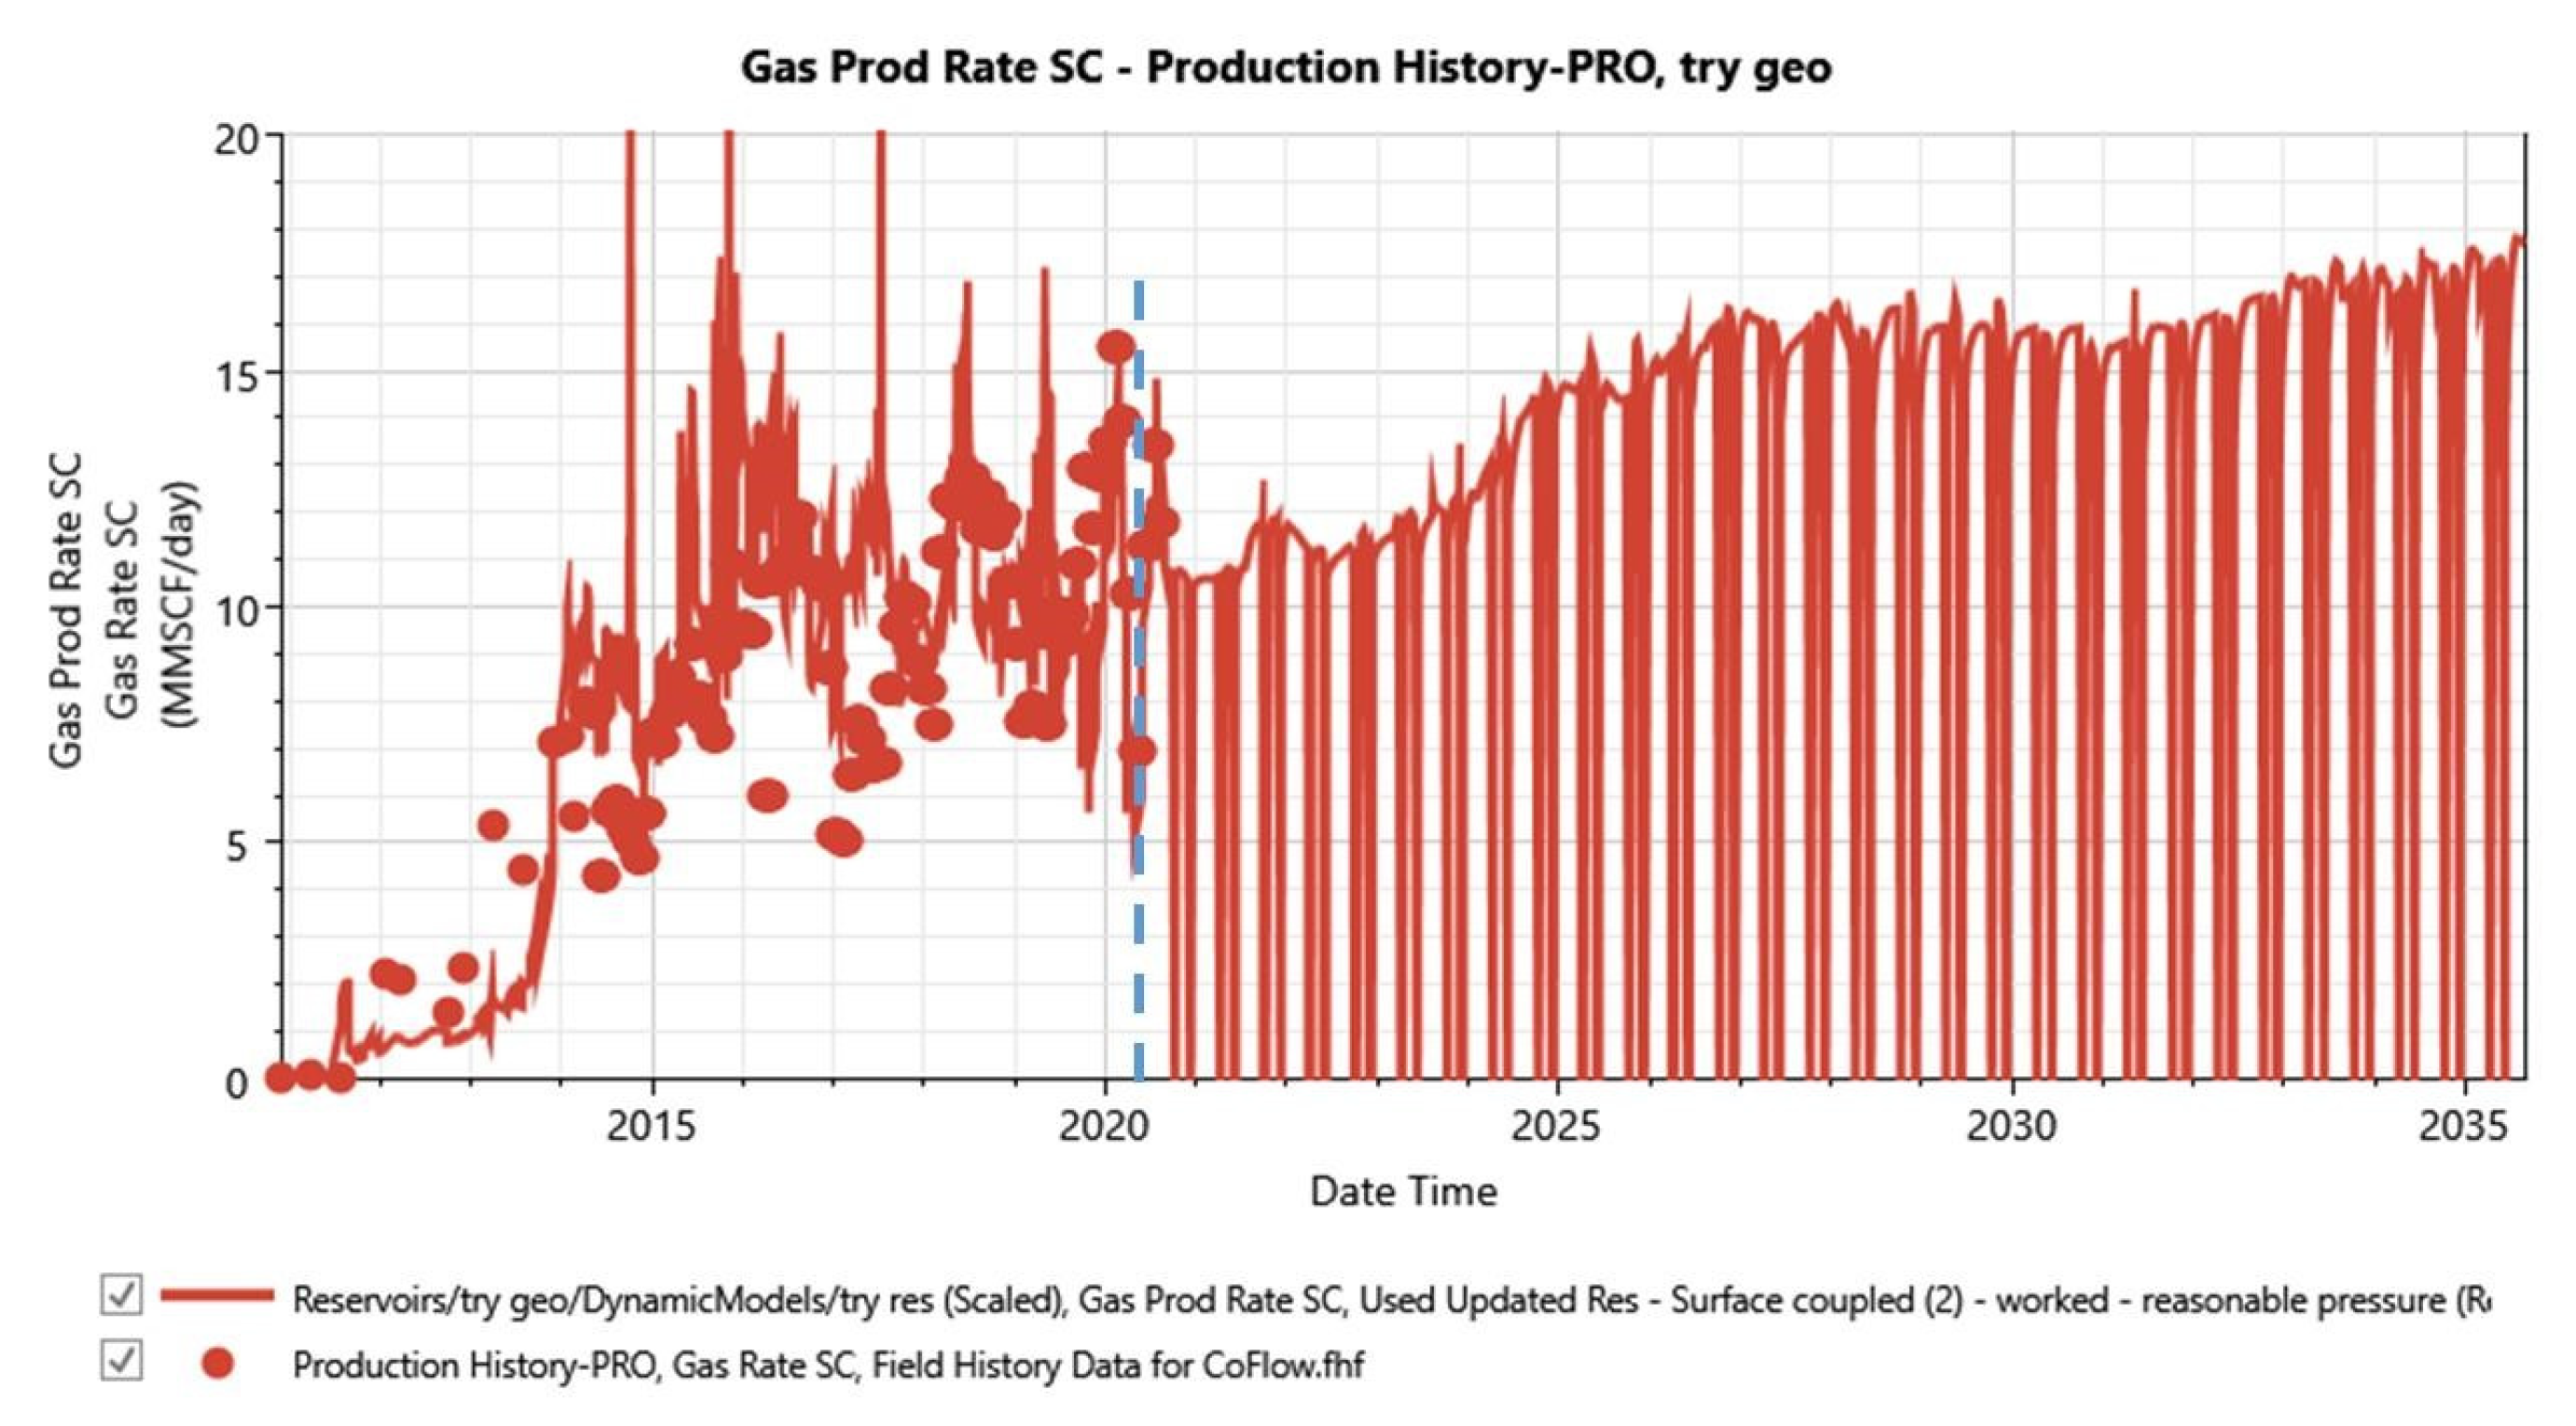
Figure 13.
Do-Nothing Forecasted Cumulative CO2 Storage.
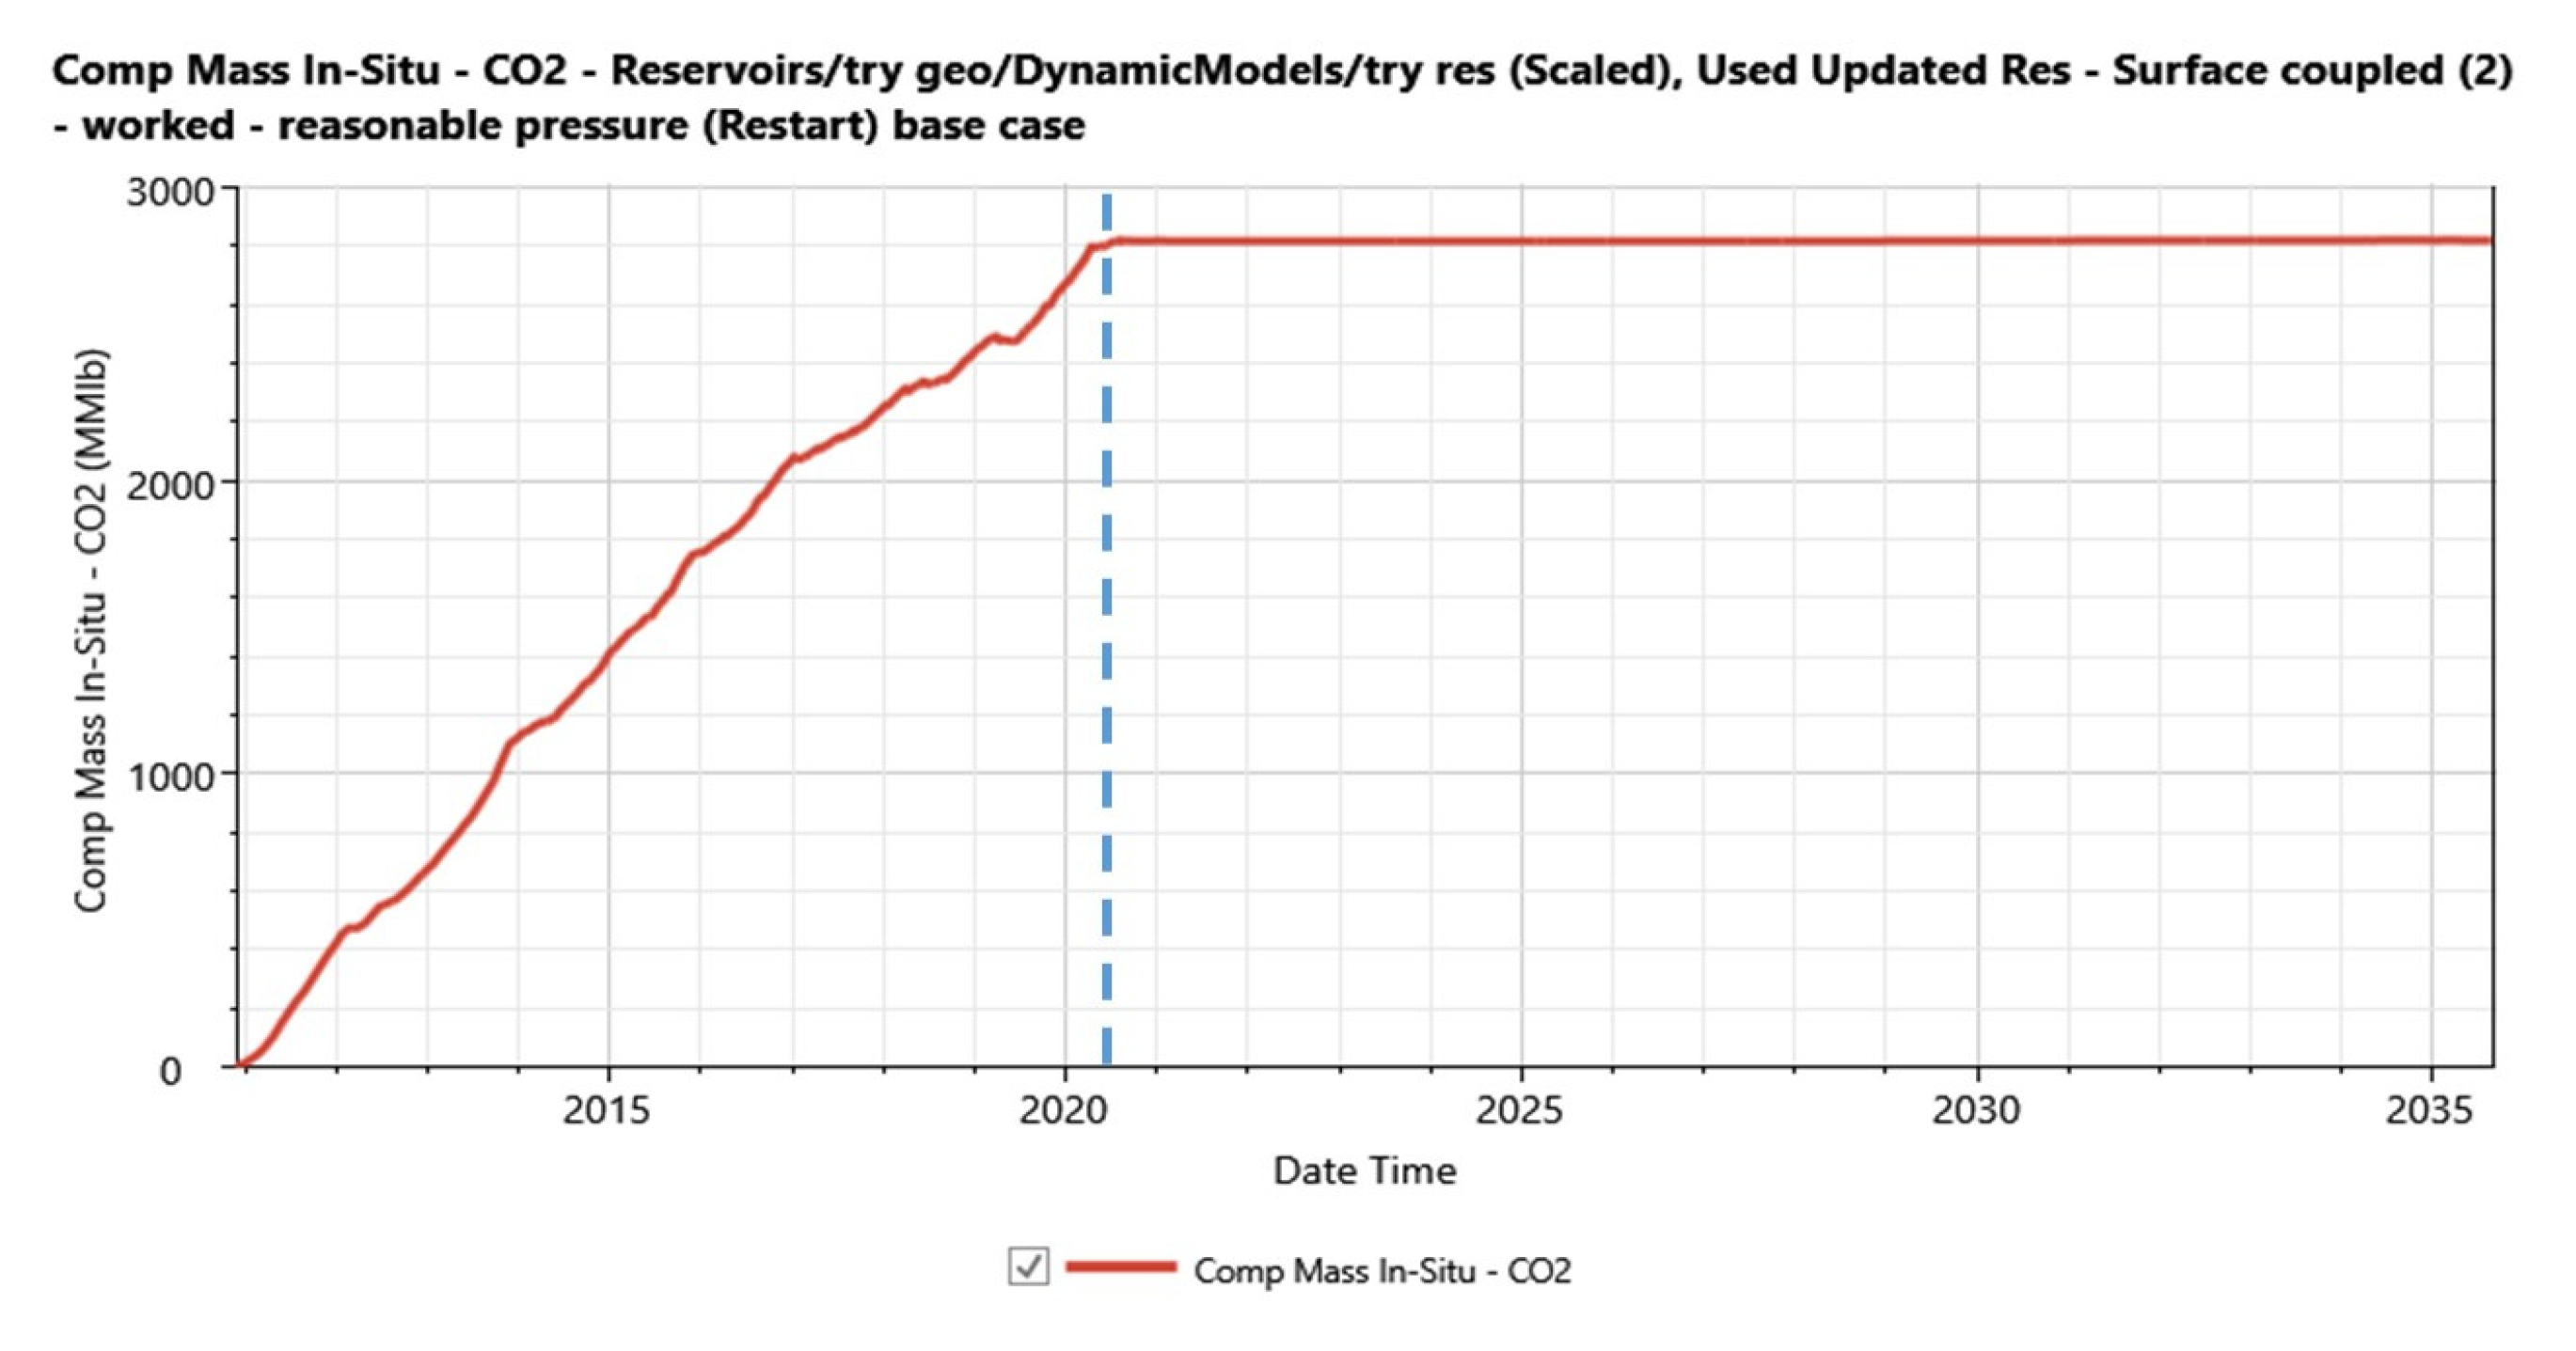
The cumulative CO2 stored at the end of the forecast period is 2,822.7 MMlbs. This amounts to 1,411,350 tons of CO2 stored. The amount of CO2 stored stalls at the end of history since no gas is injection for the do- nothing scenario.
Below is a table summarizing the cumulative values of the “Do-Nothing” forecast.
Table 5.
Summary of Do-Nothing Forecast Results.
| Parameters | Cumulative Value |
|---|---|
| Oil Production, MMSTB | 9.57 |
| Water Production, MMSTB | 50.44 |
| Gas Production, MMSCF | 94,669.58 |
| CO2 Stored, MMIbs | 2,822.70 |
3.3.2. Development Scenario Forecast
The results from the development scenario forecast are depicted below. There is an increase in the cumulative oil produced at the end of forecast using the improved development strategy. This is due to shutting in wells with high watercut and high GOR. Opening the already-closed wells also contributes to the increased production. A cumulative 13.95 MMSTB of oil was recovered which is about 4 MMSTB more oil than the Do-Nothing case.
Figure 14.
Cumulative Oil Recovered for Development Strategy.

The cumulative water production for the development strategy scenario remains steady throughout the forecast period, mirroring the trends observed in the Do-Nothing case. The total cumulative water production is 38.39 MMSTB (Figure 15). The stability in water production rates suggests that the reservoir’s water management strategies are effective and consistent with the baseline scenario, ensuring efficient handling of produced water.
Gas production under the development strategy scenario follows a trend similar to the Do-Nothing case, but with noticeable improvements due to the extended period of CO2 injection (Figure 16). The gas production rate peaks higher in this scenario, reaching the injection limit of 20 MMSCF/D. This higher gas production rate is a result of increased oil recovery, leading to more associated gas being produced and subsequently recycled. The effective management of gas production ensures that the GOR remains within optimal field capacity, further supporting enhanced oil recovery efforts.
The cumulative CO2 storage in the development strategy scenario is 5,061.68 MMlbs, which is more than the Do-Nothing case (Figure 17). This increase is attributed to the shutting-in of wells with high water cut, resulting in increased oil recovery and, consequently, more dissolved gas being evolved and recycled at the surface. CO2 is purchased and injected until the injection target of 20 MMSCF/D can be reached from recycled gas. This would eliminate the need for additional CO2 purchase from external sources. This efficient recycling process ensures that the development strategy remains economically viable while maximizing oil recovery and CO2 storage.
The summarized results of the development scenario forecast are presented in Table 6.
Based on the forecast results for the two cases, the development strategy scenario demonstrates significant improvements in oil recovery and gas management compared to the Do-Nothing scenario. The strategic interventions, such as shutting-in wells with unfavorable production characteristics contribute to the overall success of the development plan. This comprehensive analysis provides valuable insights for optimizing production strategies and enhancing the efficiency of CO2-EOR processes in the FWU field.
3.4. Optimization
3.4.1. Parameterization and Sensitivity Analysis
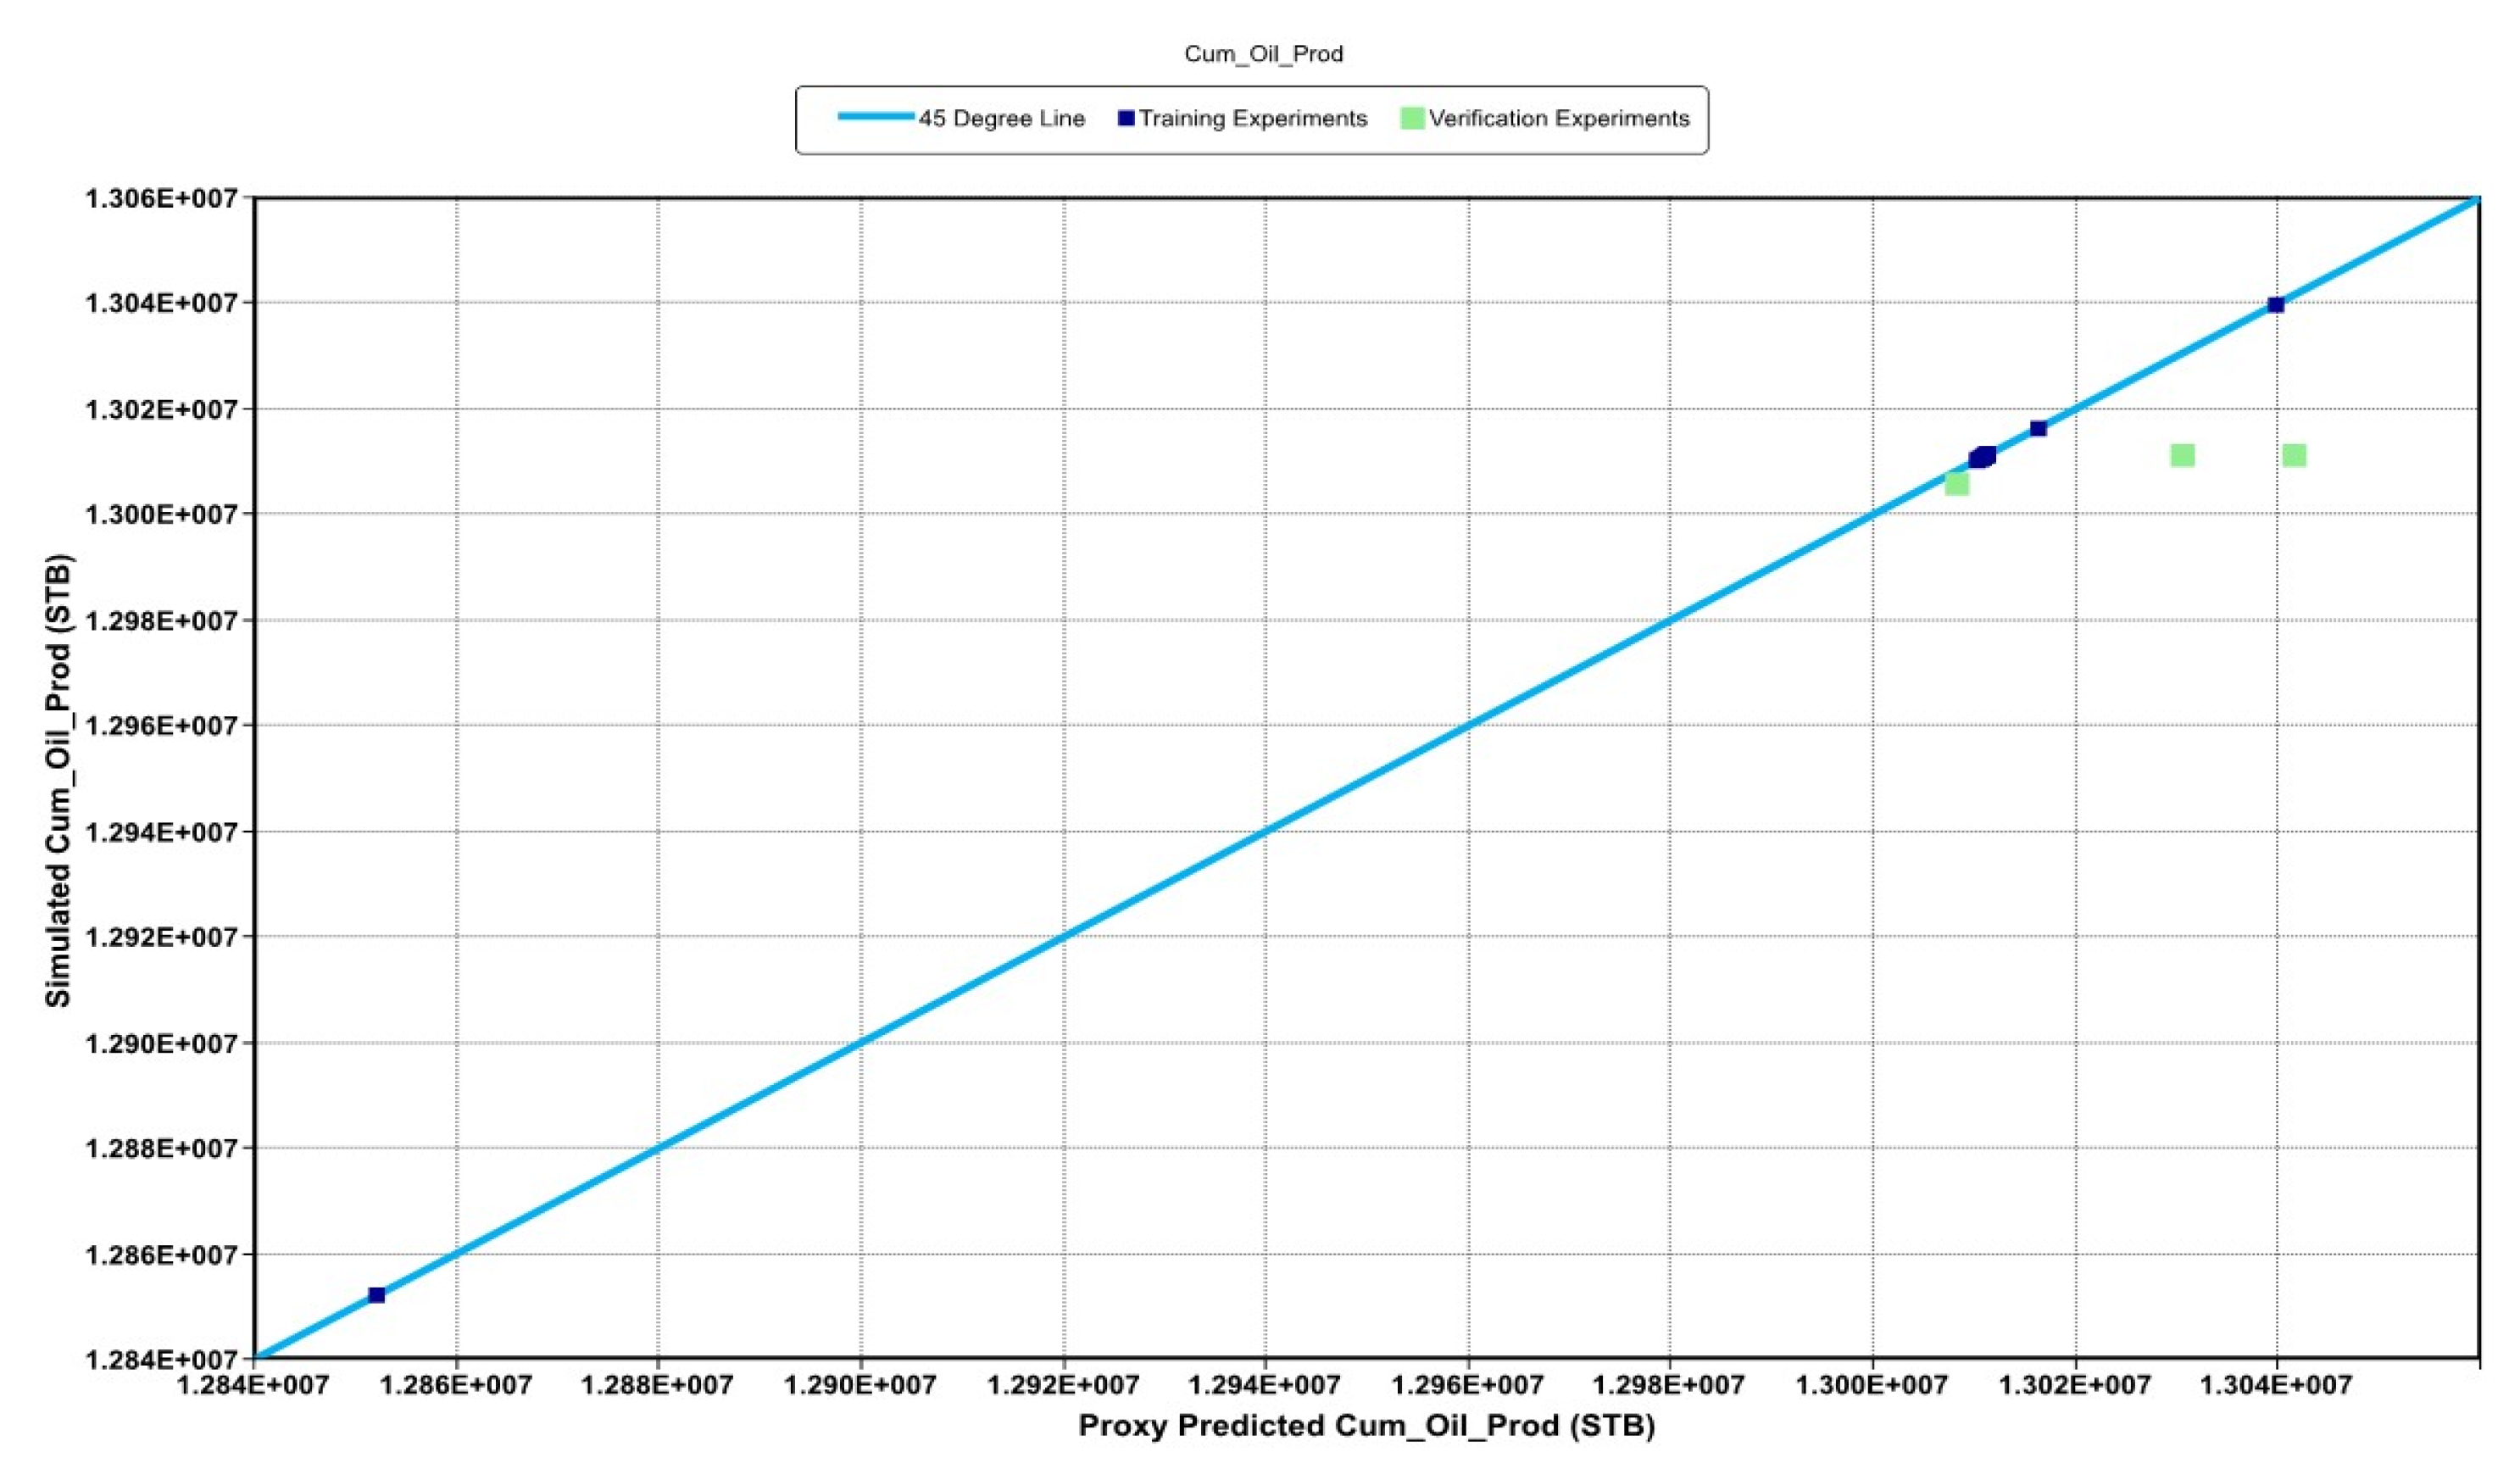
The results of the sensitivity analysis below show the effect of each parameter on the two main objectives of this study—cumulative oil recovered, and mass of CO2 stored. It can be inferred from the qq-plot of the simulated cumulative oil recovered versus proxy cumulative oil recovered that the proxy matches the high-physics calculations enough to be used suitably as a substitute in prediction.
Figure 18.
Q-Q Plot of Simulated Cumulative Oil Produced vs. Proxy Predicted Cumulative Oil Produced.
Figure 18.
Q-Q Plot of Simulated Cumulative Oil Produced vs. Proxy Predicted Cumulative Oil Produced.
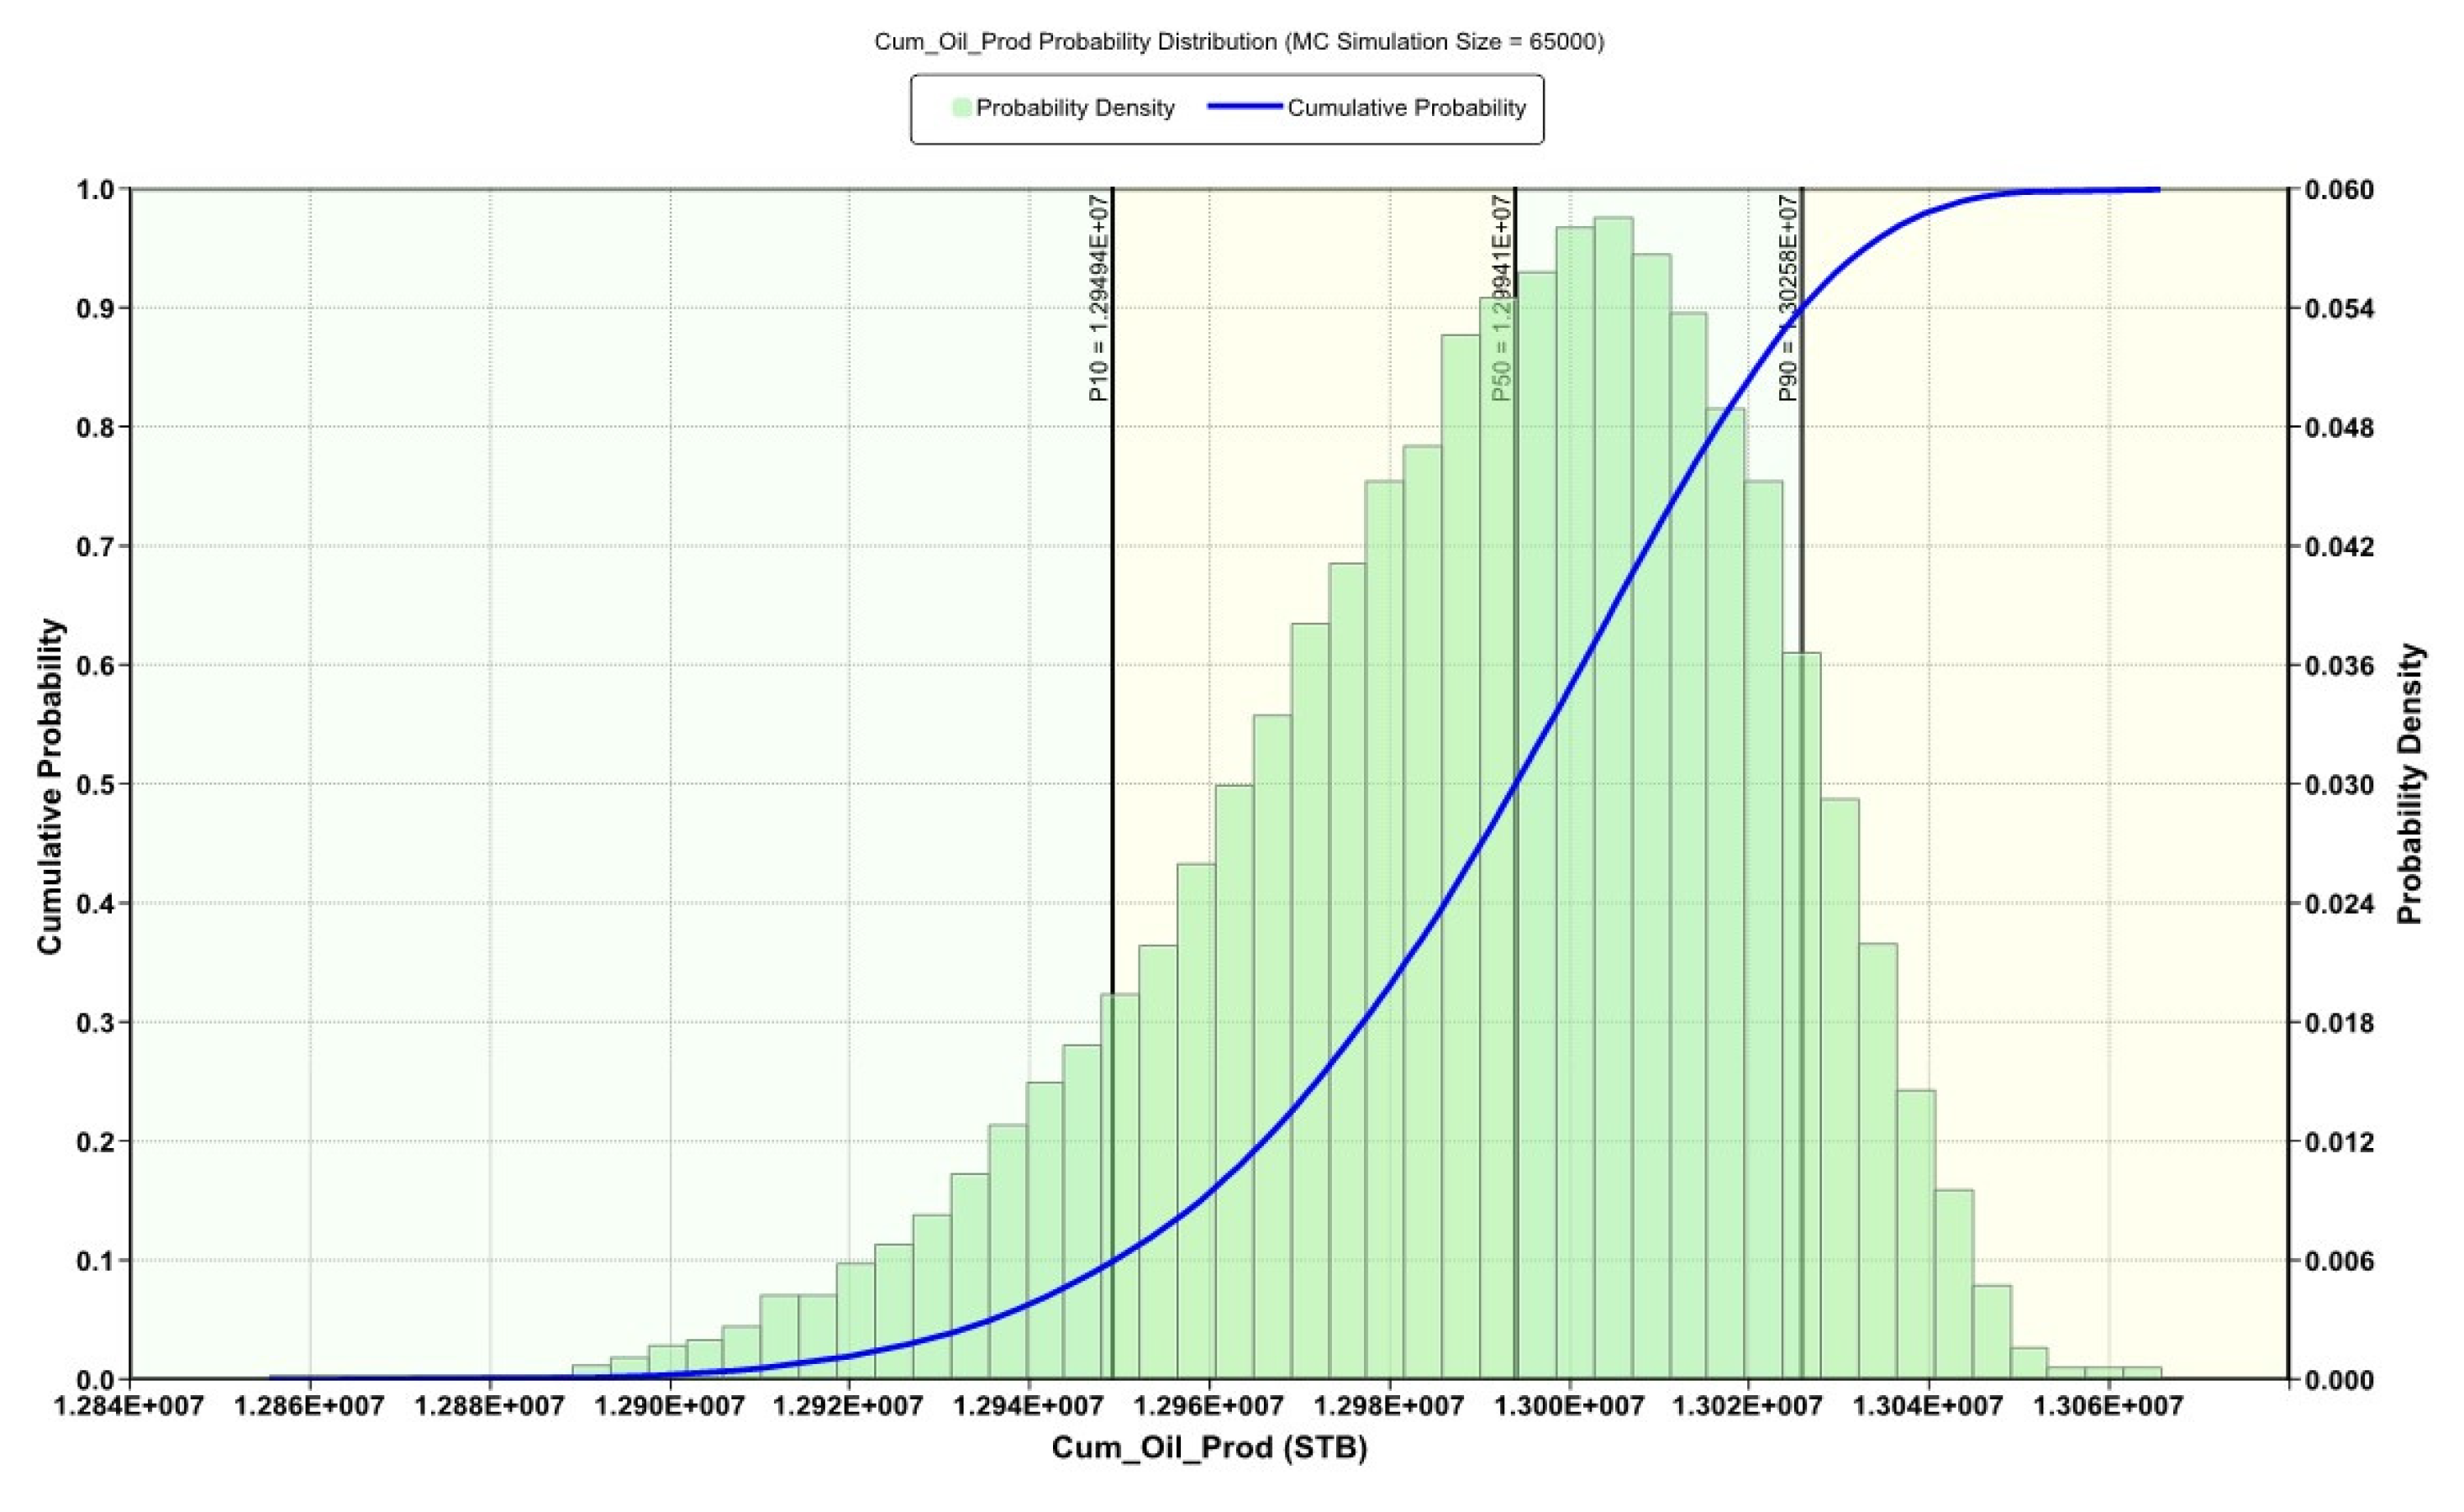
The results of the Monte Carlo plot demonstrate the robustness of the development strategy with a percentage difference of 0.587% between estimated P10 and estimated P90. With P90 standing at 1.30258 × 10⁷STB and P10 at 1.29494 × 10⁷STB, there is only a difference of 76, 400 STB.
Figure 19.
Monte Carlo Simulation Plot of Cumulative Oil Sensitivity Analysis.
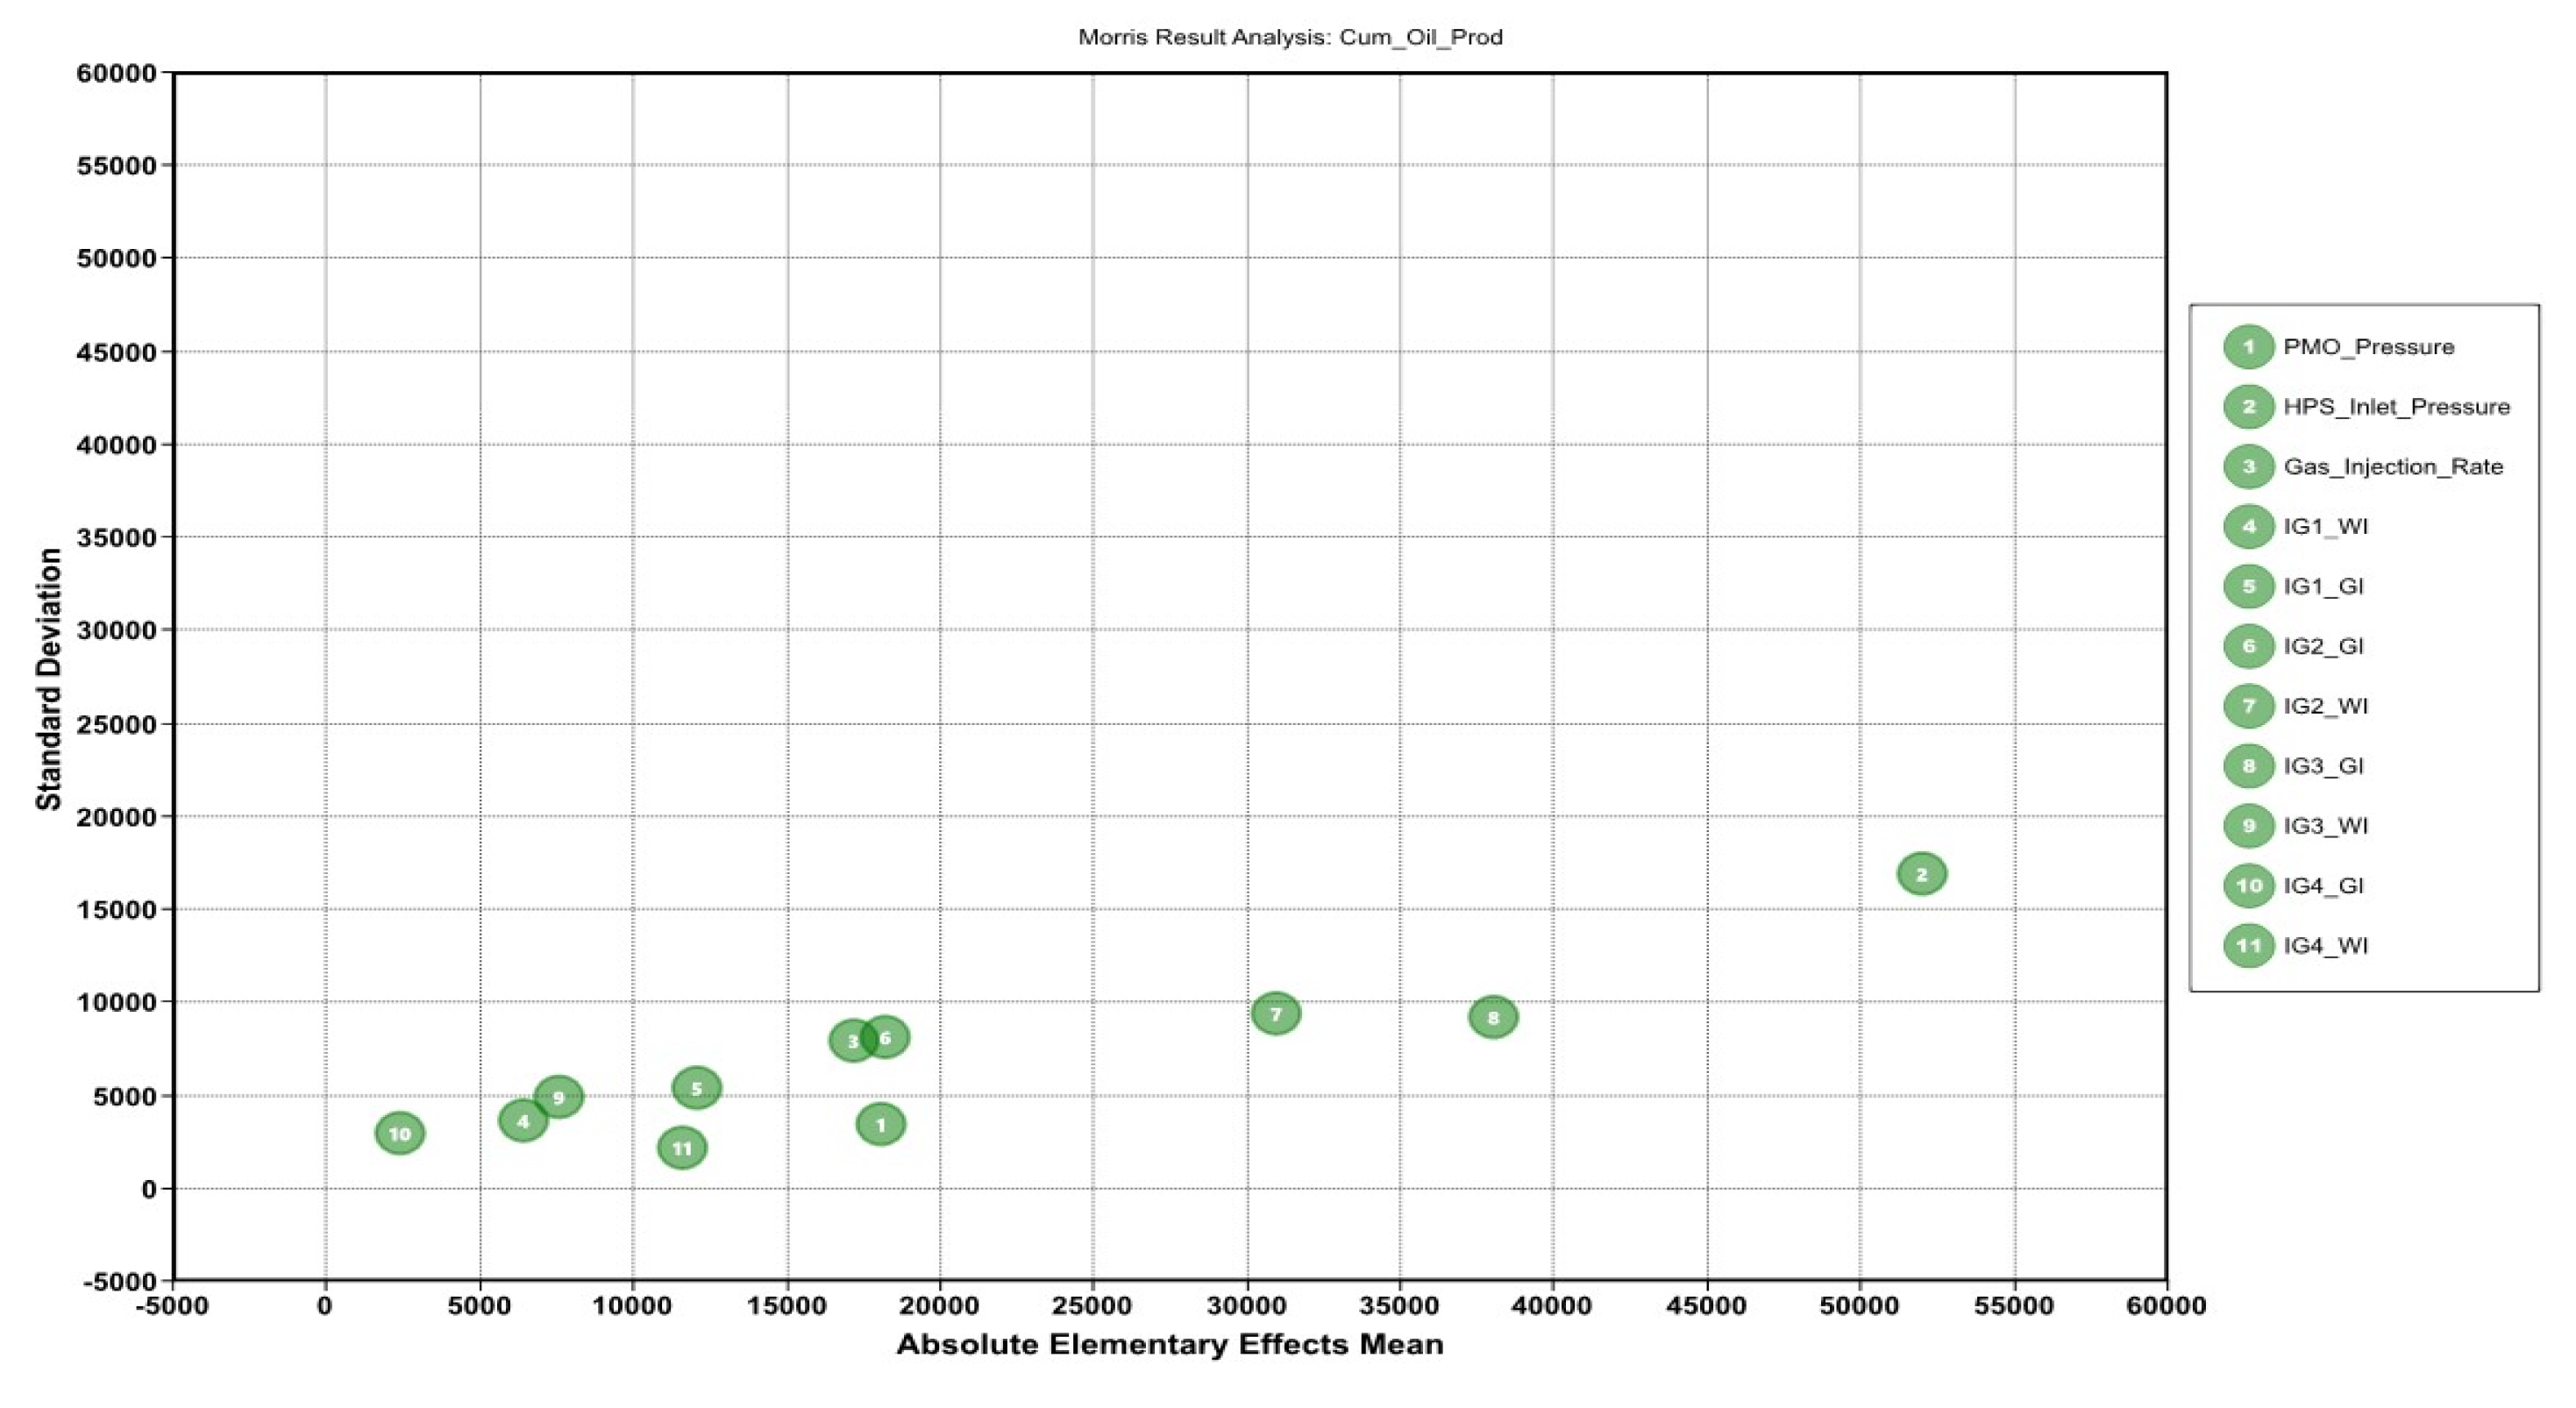
The next plot to be viewed is the results of the Morris Analysis. This plots the standard deviation which represents the non-linearity effect of each sensitive parameter against the Absolute Elementary Effect Mean (AEEM) which is quantifies the impact it has on the objective function. This uses a one-at-a-time approach to determining local sensitivity of the parameter and the impact it has on the cumulative oil produced.
Figure 20.
Plot of Morris Analysis for Cumulative Oil Produced.
where;
- PMO_Pressure = Pressure on Production Manifold
- HPS_Inlet Pressure = High Separator Pressure
- Gas_Injection_Rate = Compressor Rate
- IG1_GI = Injection Group 1—Gas Injection Cycle Duration
- IG1_WI = Injection Group 1—Water Injection Cycle Duration
- IG2_GI = Injection Group 2—Gas Injection Cycle Duration
- IG2_WI = Injection Group 2—Water Injection Cycle Duration
- IG3_GI = Injection Group 3—Gas Injection Cycle Duration
- IG3_WI = Injection Group 3—Water Injection Cycle Duration
- IG4_GI = Injection Group 4—Gas Injection Cycle Duration
- IG4_WI = Injection Group 4—Water Injection Cycle Duration
According to the Morris analysis, the most sensitive parameter is the Inlet Pressure of the high-pressure separator, which exhibits the highest AEEM and standard deviation. This is followed by the gas injection cycle of group 3 (IG3_GI) and water injection cycle of group 2 respectively (IG2_WI). Following at a distance are gas injection cycle of group 2, pressure on production manifold outlet and gas injection rate. However, the effect of pressure on the production manifold outlet exhibits less non-linearity than the other 2.
The Sobol Analysis (Figure 21) further supports the Morris Analysis findings, showing that the gas injection rate has the highest total effect at approximately 63%, followed by HPSIP at 61%. The distinction between these two is that HPSIP directly impacts cumulative oil produced, whereas the gas injection rate influences other parameters, thereby affecting the cumulative oil.
For CO2 storage, the qq-plot (Figure 22) indicates a close match between the proxy and the high-physics model, suggesting the proxy’s reliability for further analysis. Using this proxy, a plot of the Monte Carlo simulation shows a difference of 3.74% between the P90 and P10 of estimated CO2 stored. This shows a wider range in percentage than in the case of cumulative oil produced. However, this range is quantitatively small and also shows the robustness of the model. With P90 at 4452.31 × 106 and P10 at 4285.95 × 106, a difference of 166MMlb of CO2 is stored.
The Morris Analysis (Figure 24) reveals that the injection group cycles of gas and water have a more significant impact on CO2 storage than surface components such as HPSIP, Production Manifold Outlet Pressure (PMOP) and gas injection rate. This is likely due to the fact that the amount of CO2 stored depends on how much anthropogenic CO2 is purchased which in turn depends on the gas production rate. The gas production rate is heavily dependent on pressure distribution in the reservoir, gas channels and pathways and rate of oil production. These are influenced more by the amount of water (for pressure maintenance) and gas injected (for miscible flood but excess injection can lead to early gas breakthrough). An effective miscible flood would slow down the gas production and increase sweep efficiency. This would allow more CO2 to be stored since more would be purchased.
The Sobol Analysis (Figure 25) corroborates the Morris Analysis, indicating that injection group cycles have a greater influence on CO2 storage than surface components operating conditions. This analysis highlights the importance of optimizing injection strategies to maximize CO2 storage.
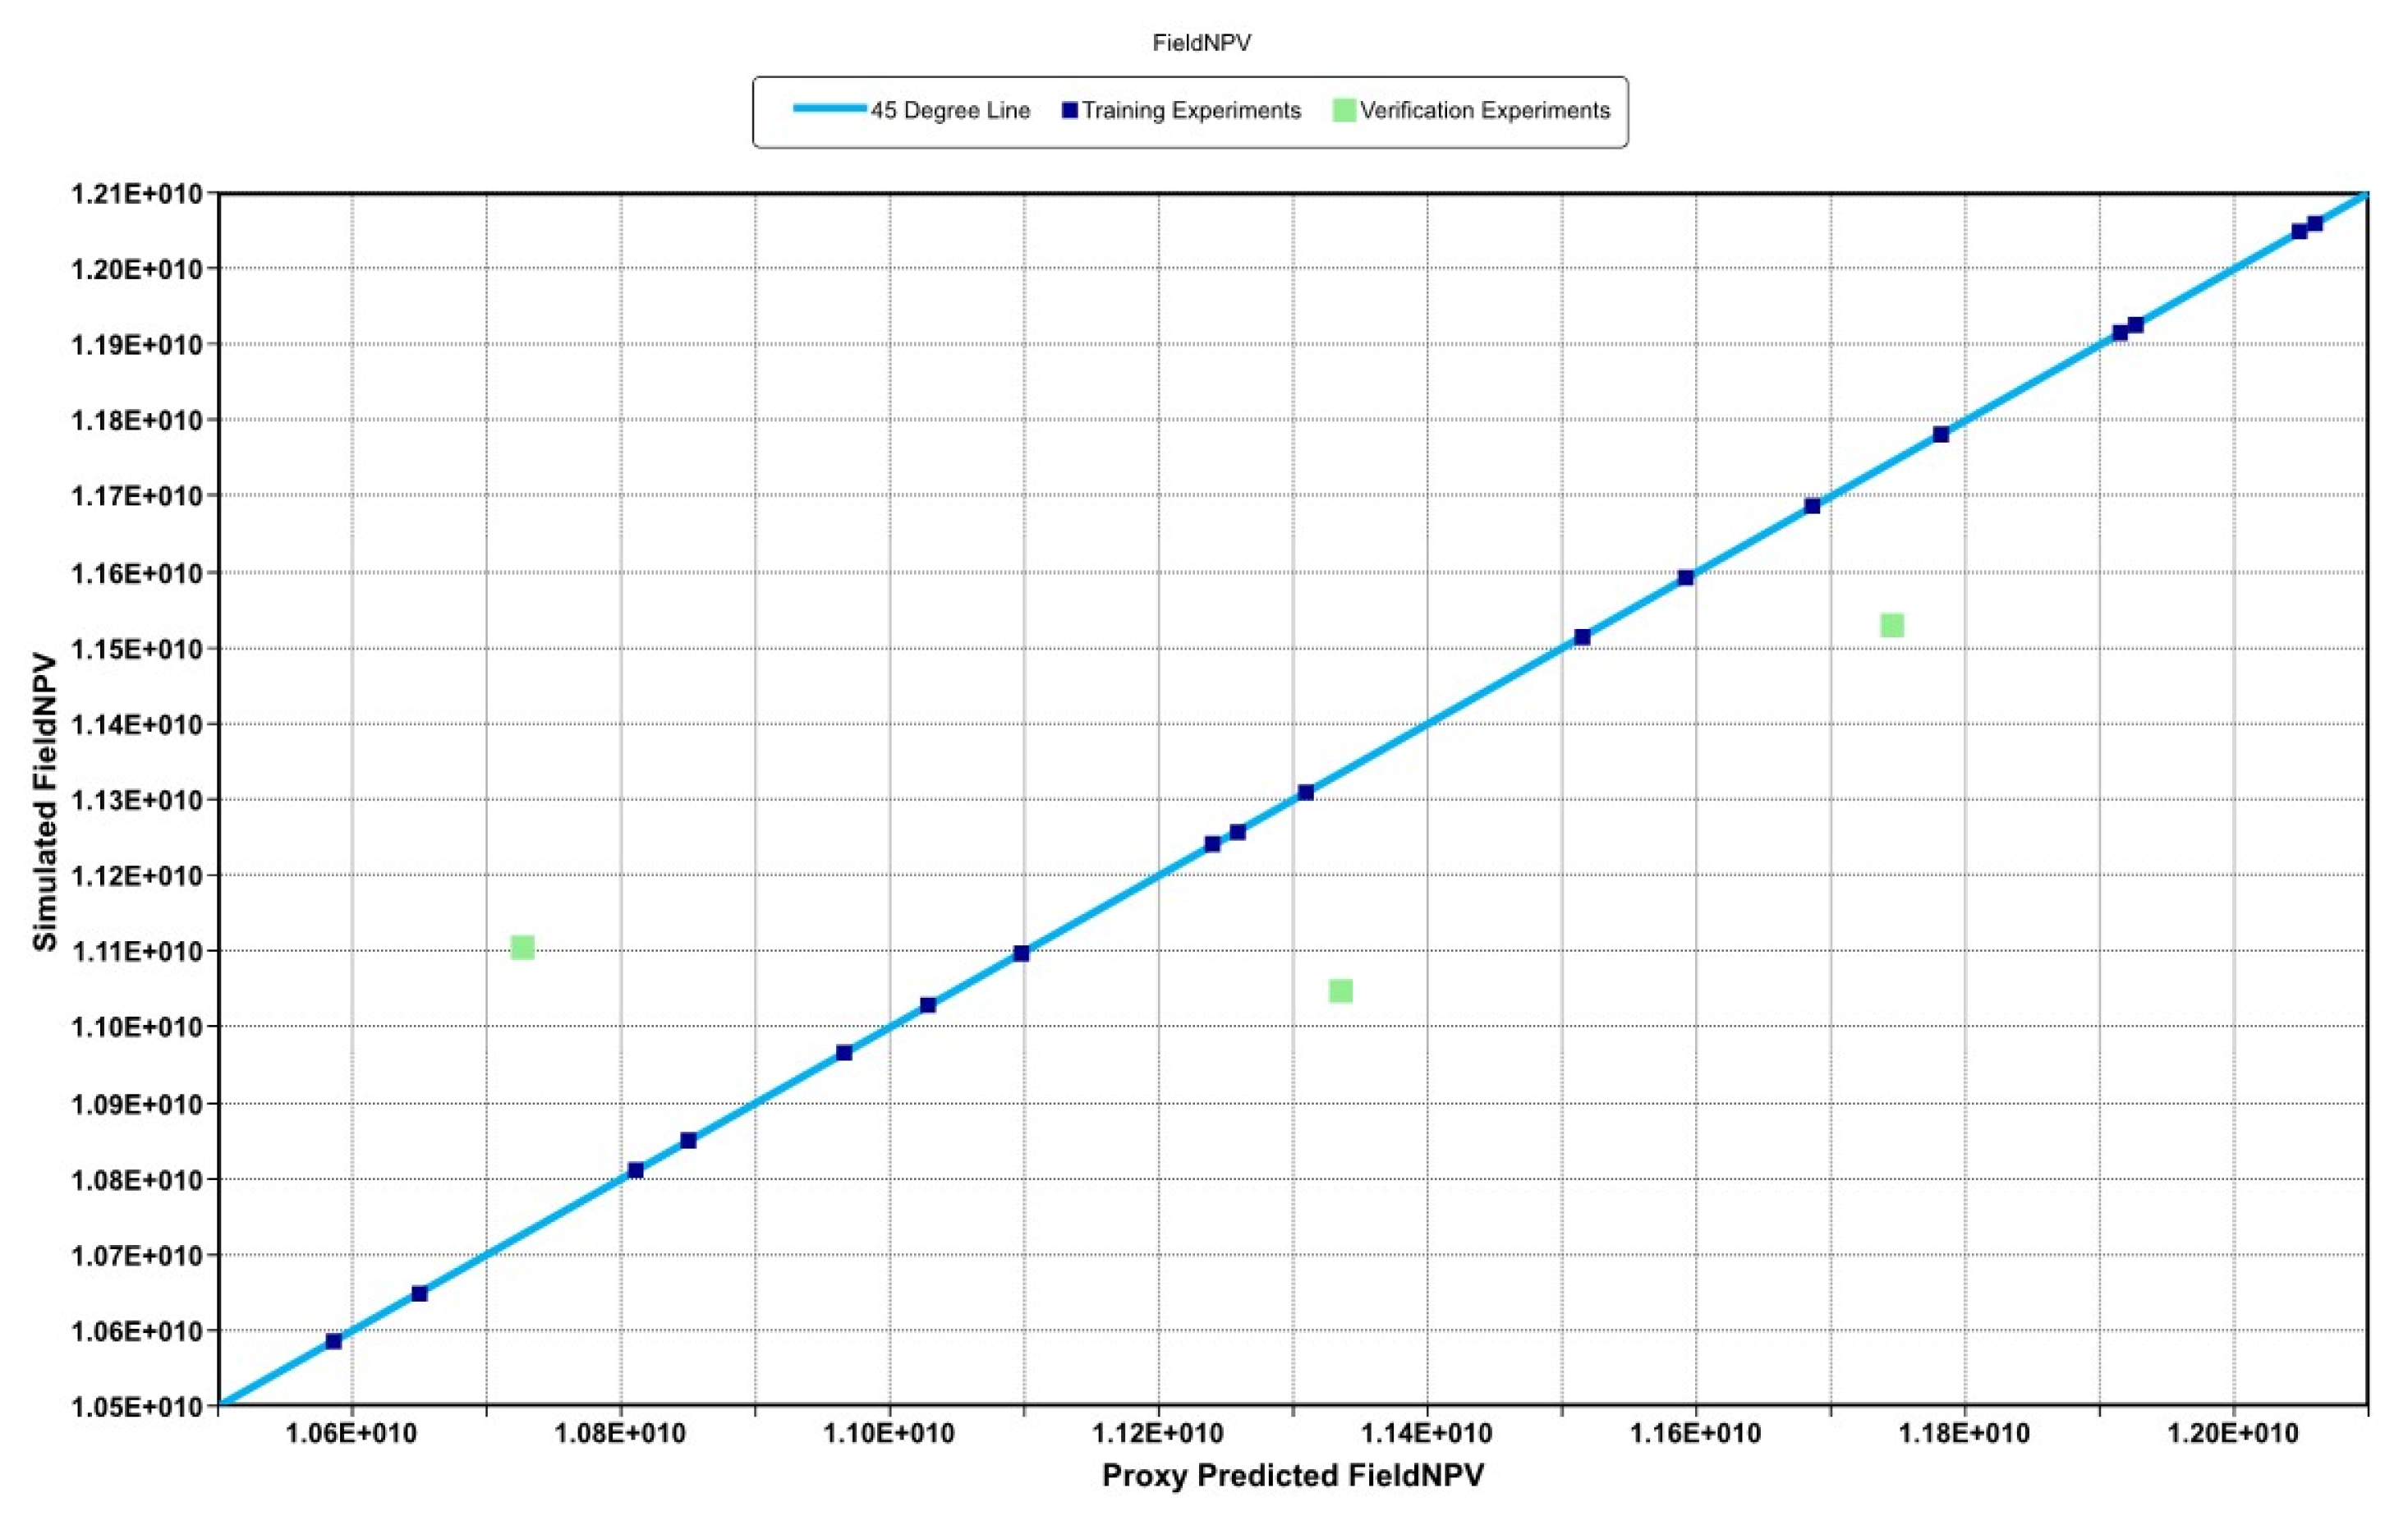
Despite this proxy model of the Field NPV showing a greater deviation than the previous two, the maximum absolute error is 3.4%. This affirms that our proxy is suitable for the investigations ahead.
Figure 26.
QQ-Plot of Proxy for Field NPV.
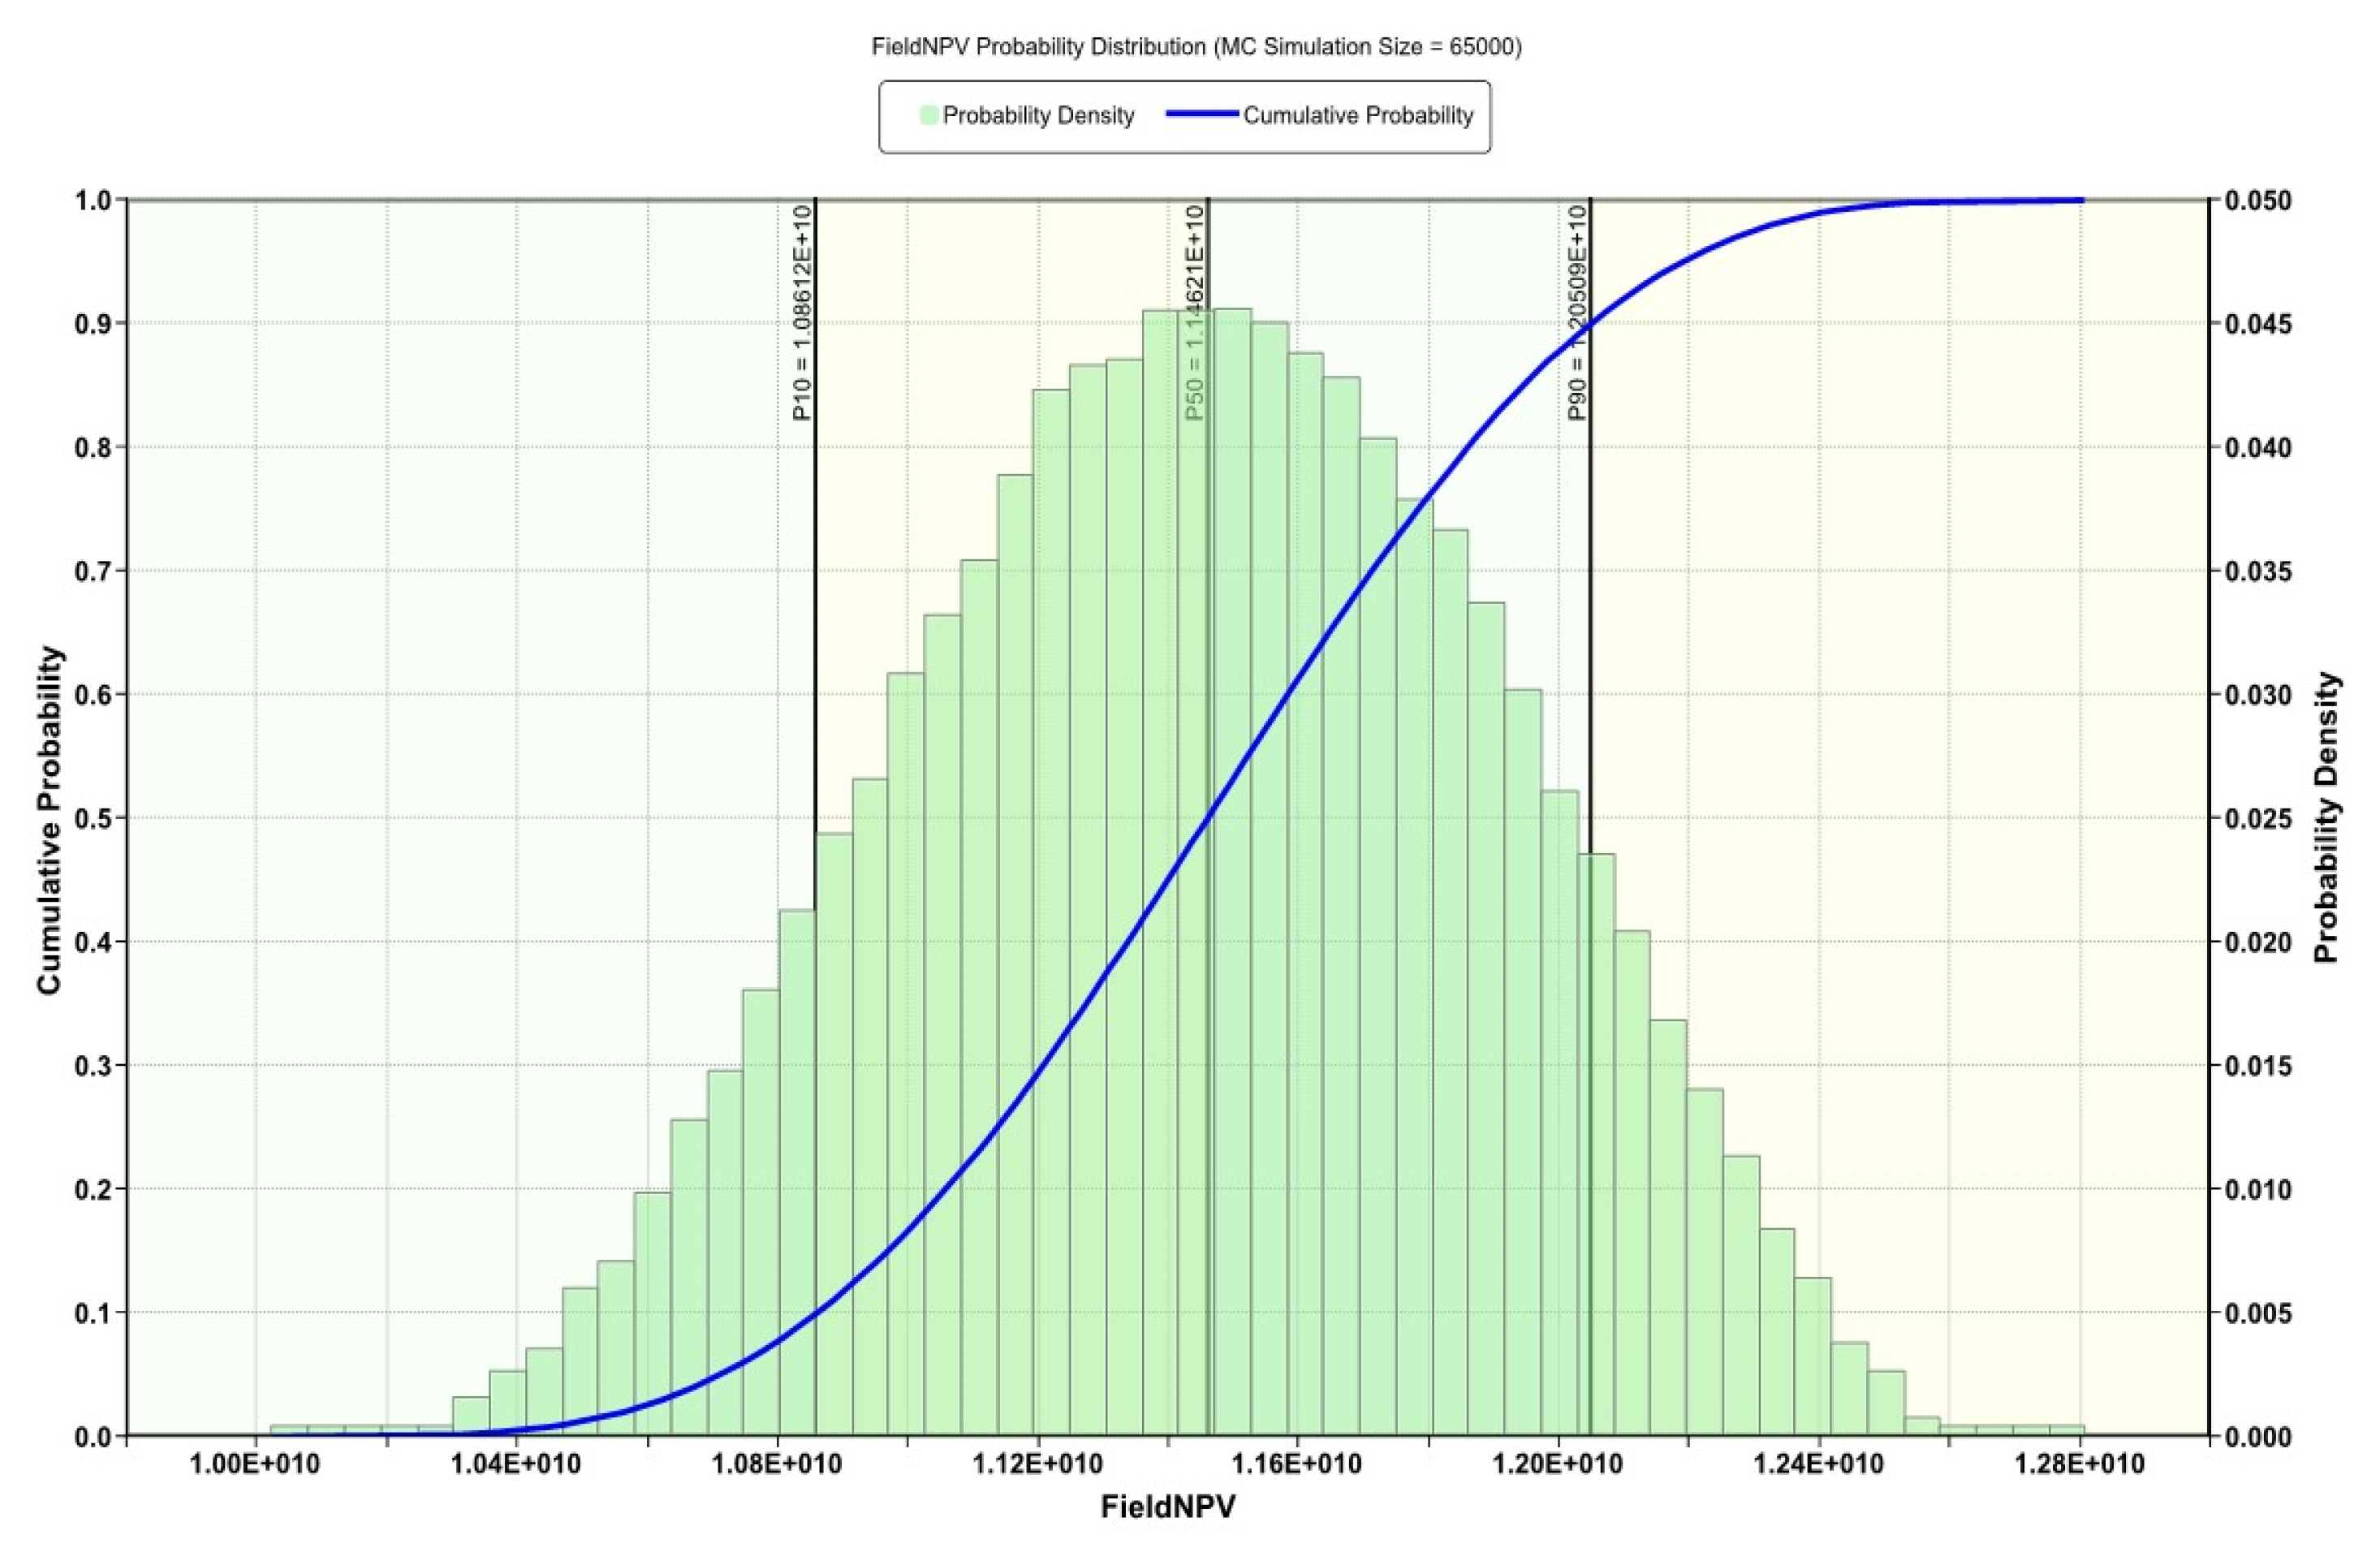
The Monte Carlo plot shows that this proxy estimates a difference of 9.87% between the P90 and P10. This wider range suggests a higher uncertainty in NPV predictions compared to oil production and CO2 storage. With P90 at 1.08612 × 10¹⁰ and P10 at 1.20509 × 10¹⁰, a resulting in a difference of 1.1897 × 10⁹.
Figure 27.
Monte Carlo Simulation for Field NPV.
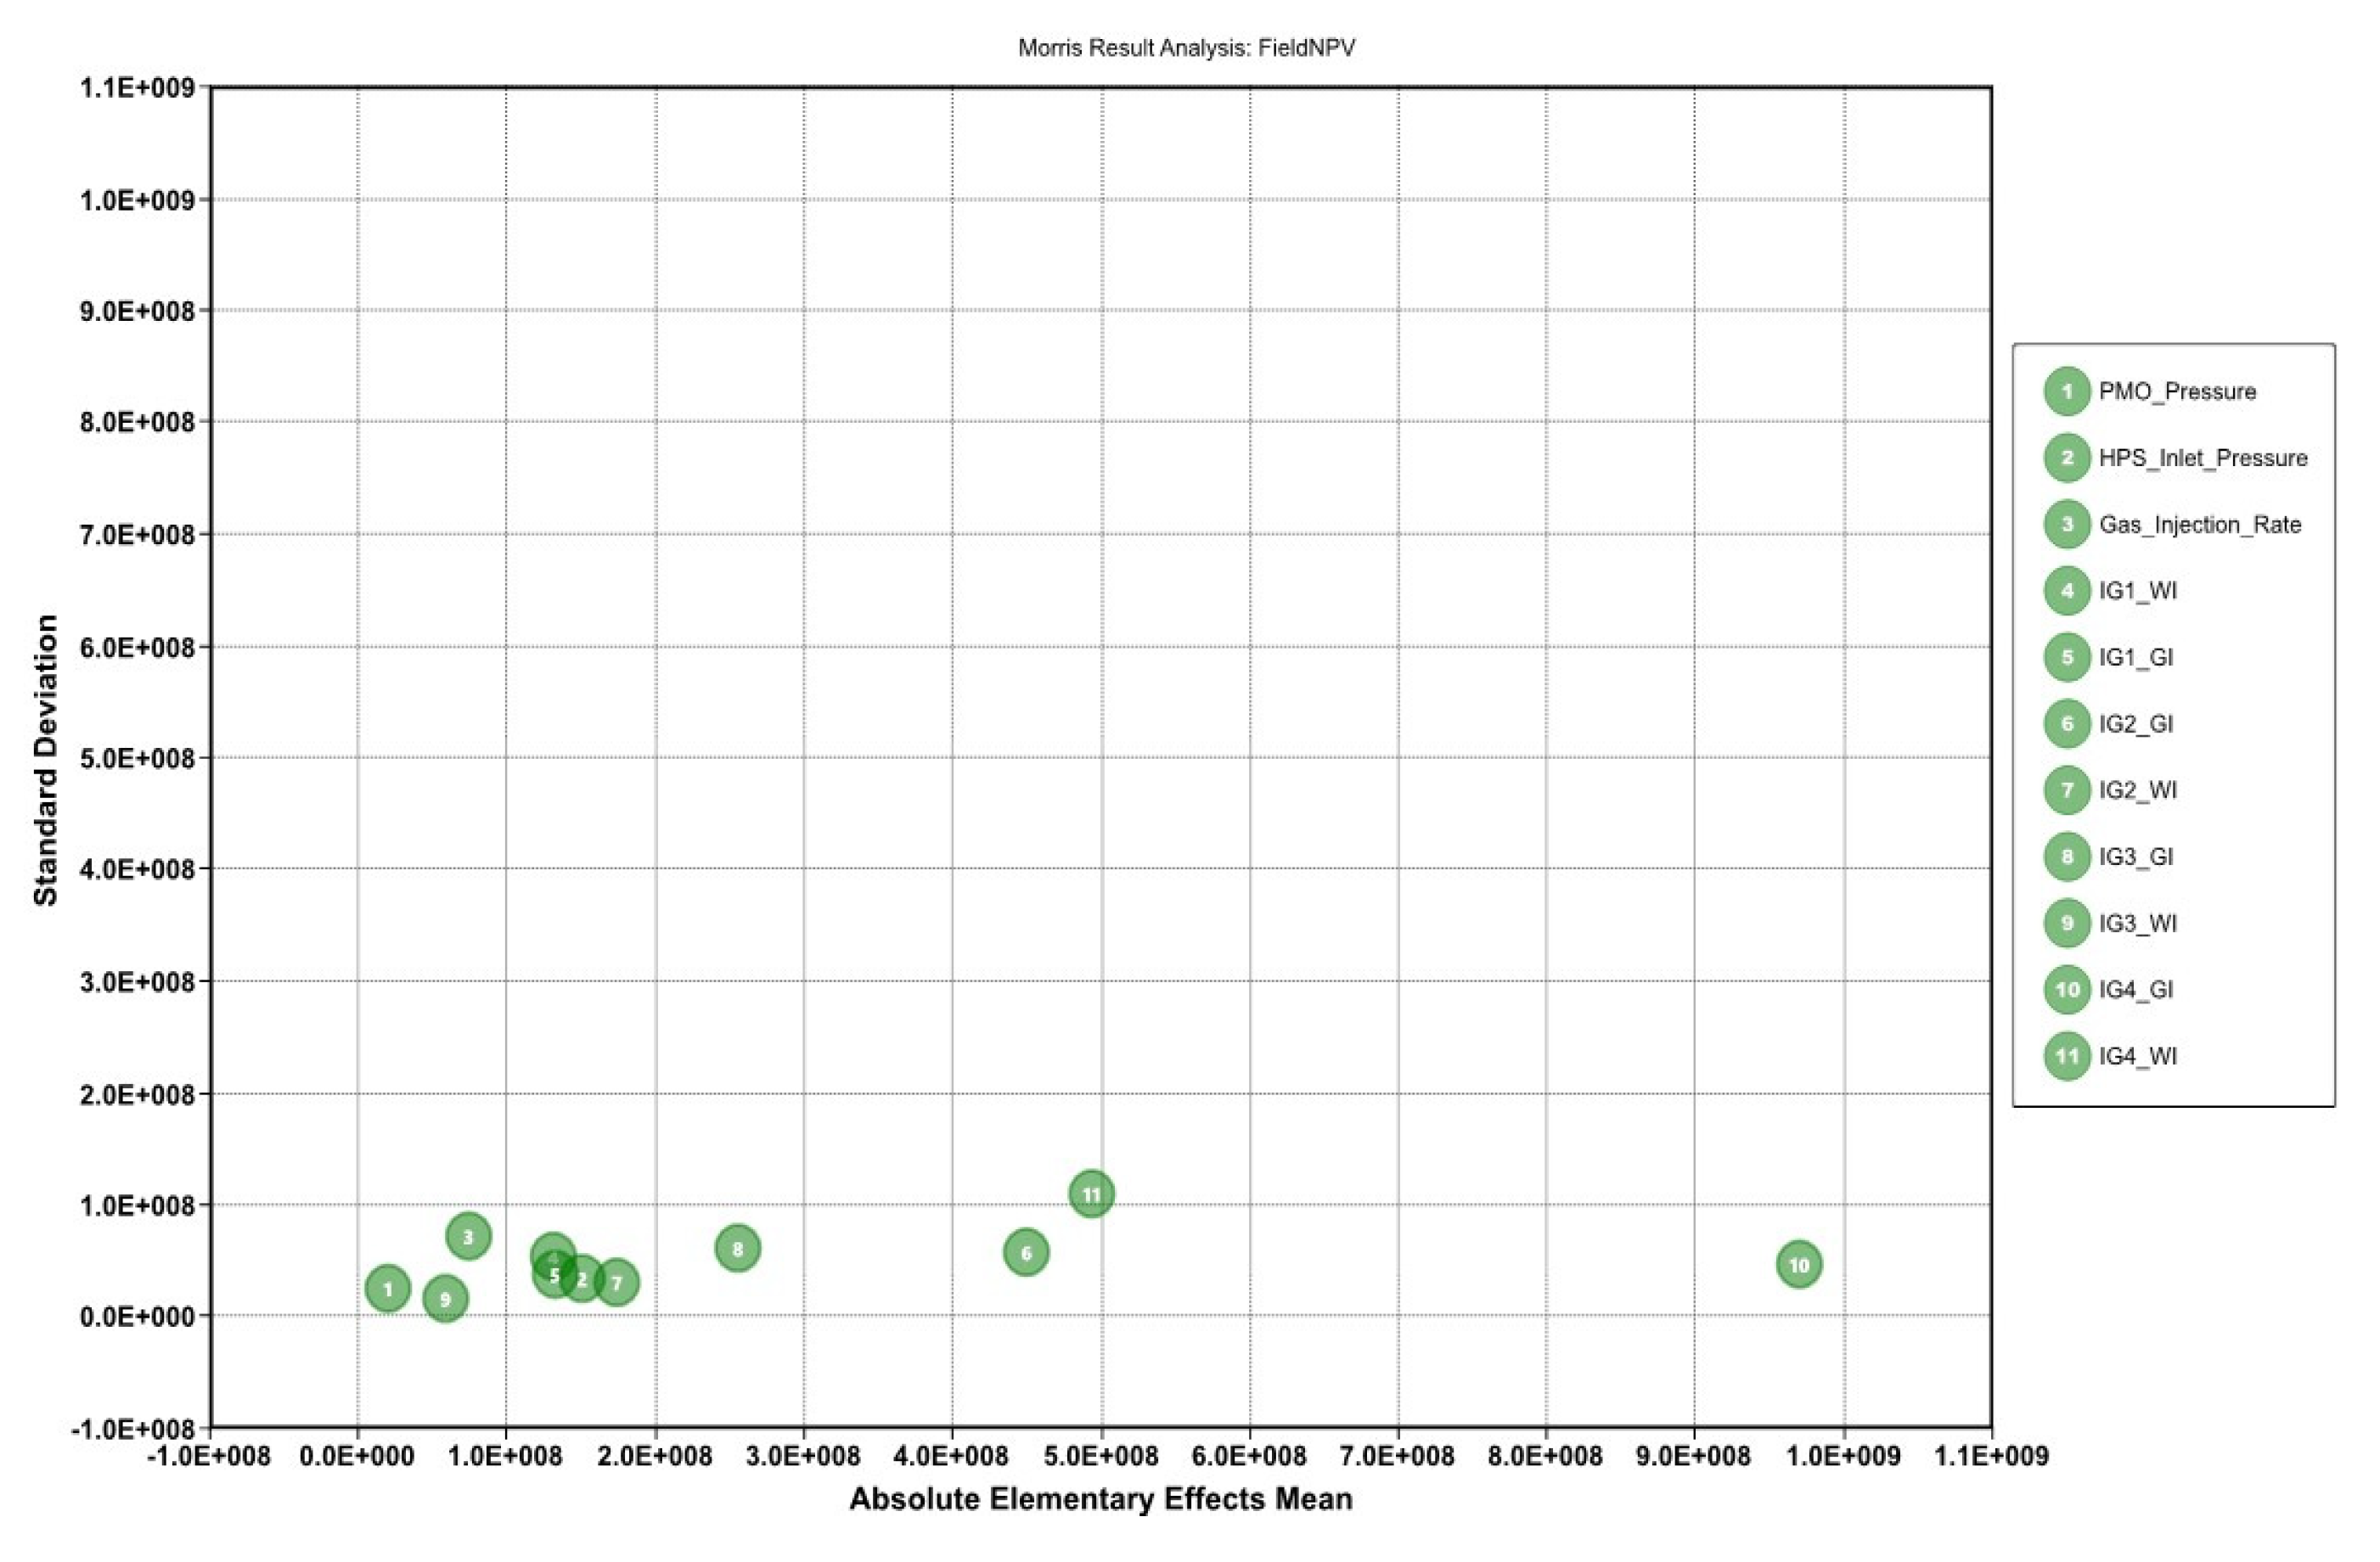
The Morris analysis clearly shows injection group 4 as being the most impactful despite all parameters having a similar degree of non-linearity. Following closely is the gas injection cycle of injection group 2 and at a distance is the gas injection of injection group 3. Parameters cluster together on the lower left side, including the surface components. This is due to limiting the range for sensitivity to existing field conditions.
Figure 28.
Morris Analysis for Field NPV.
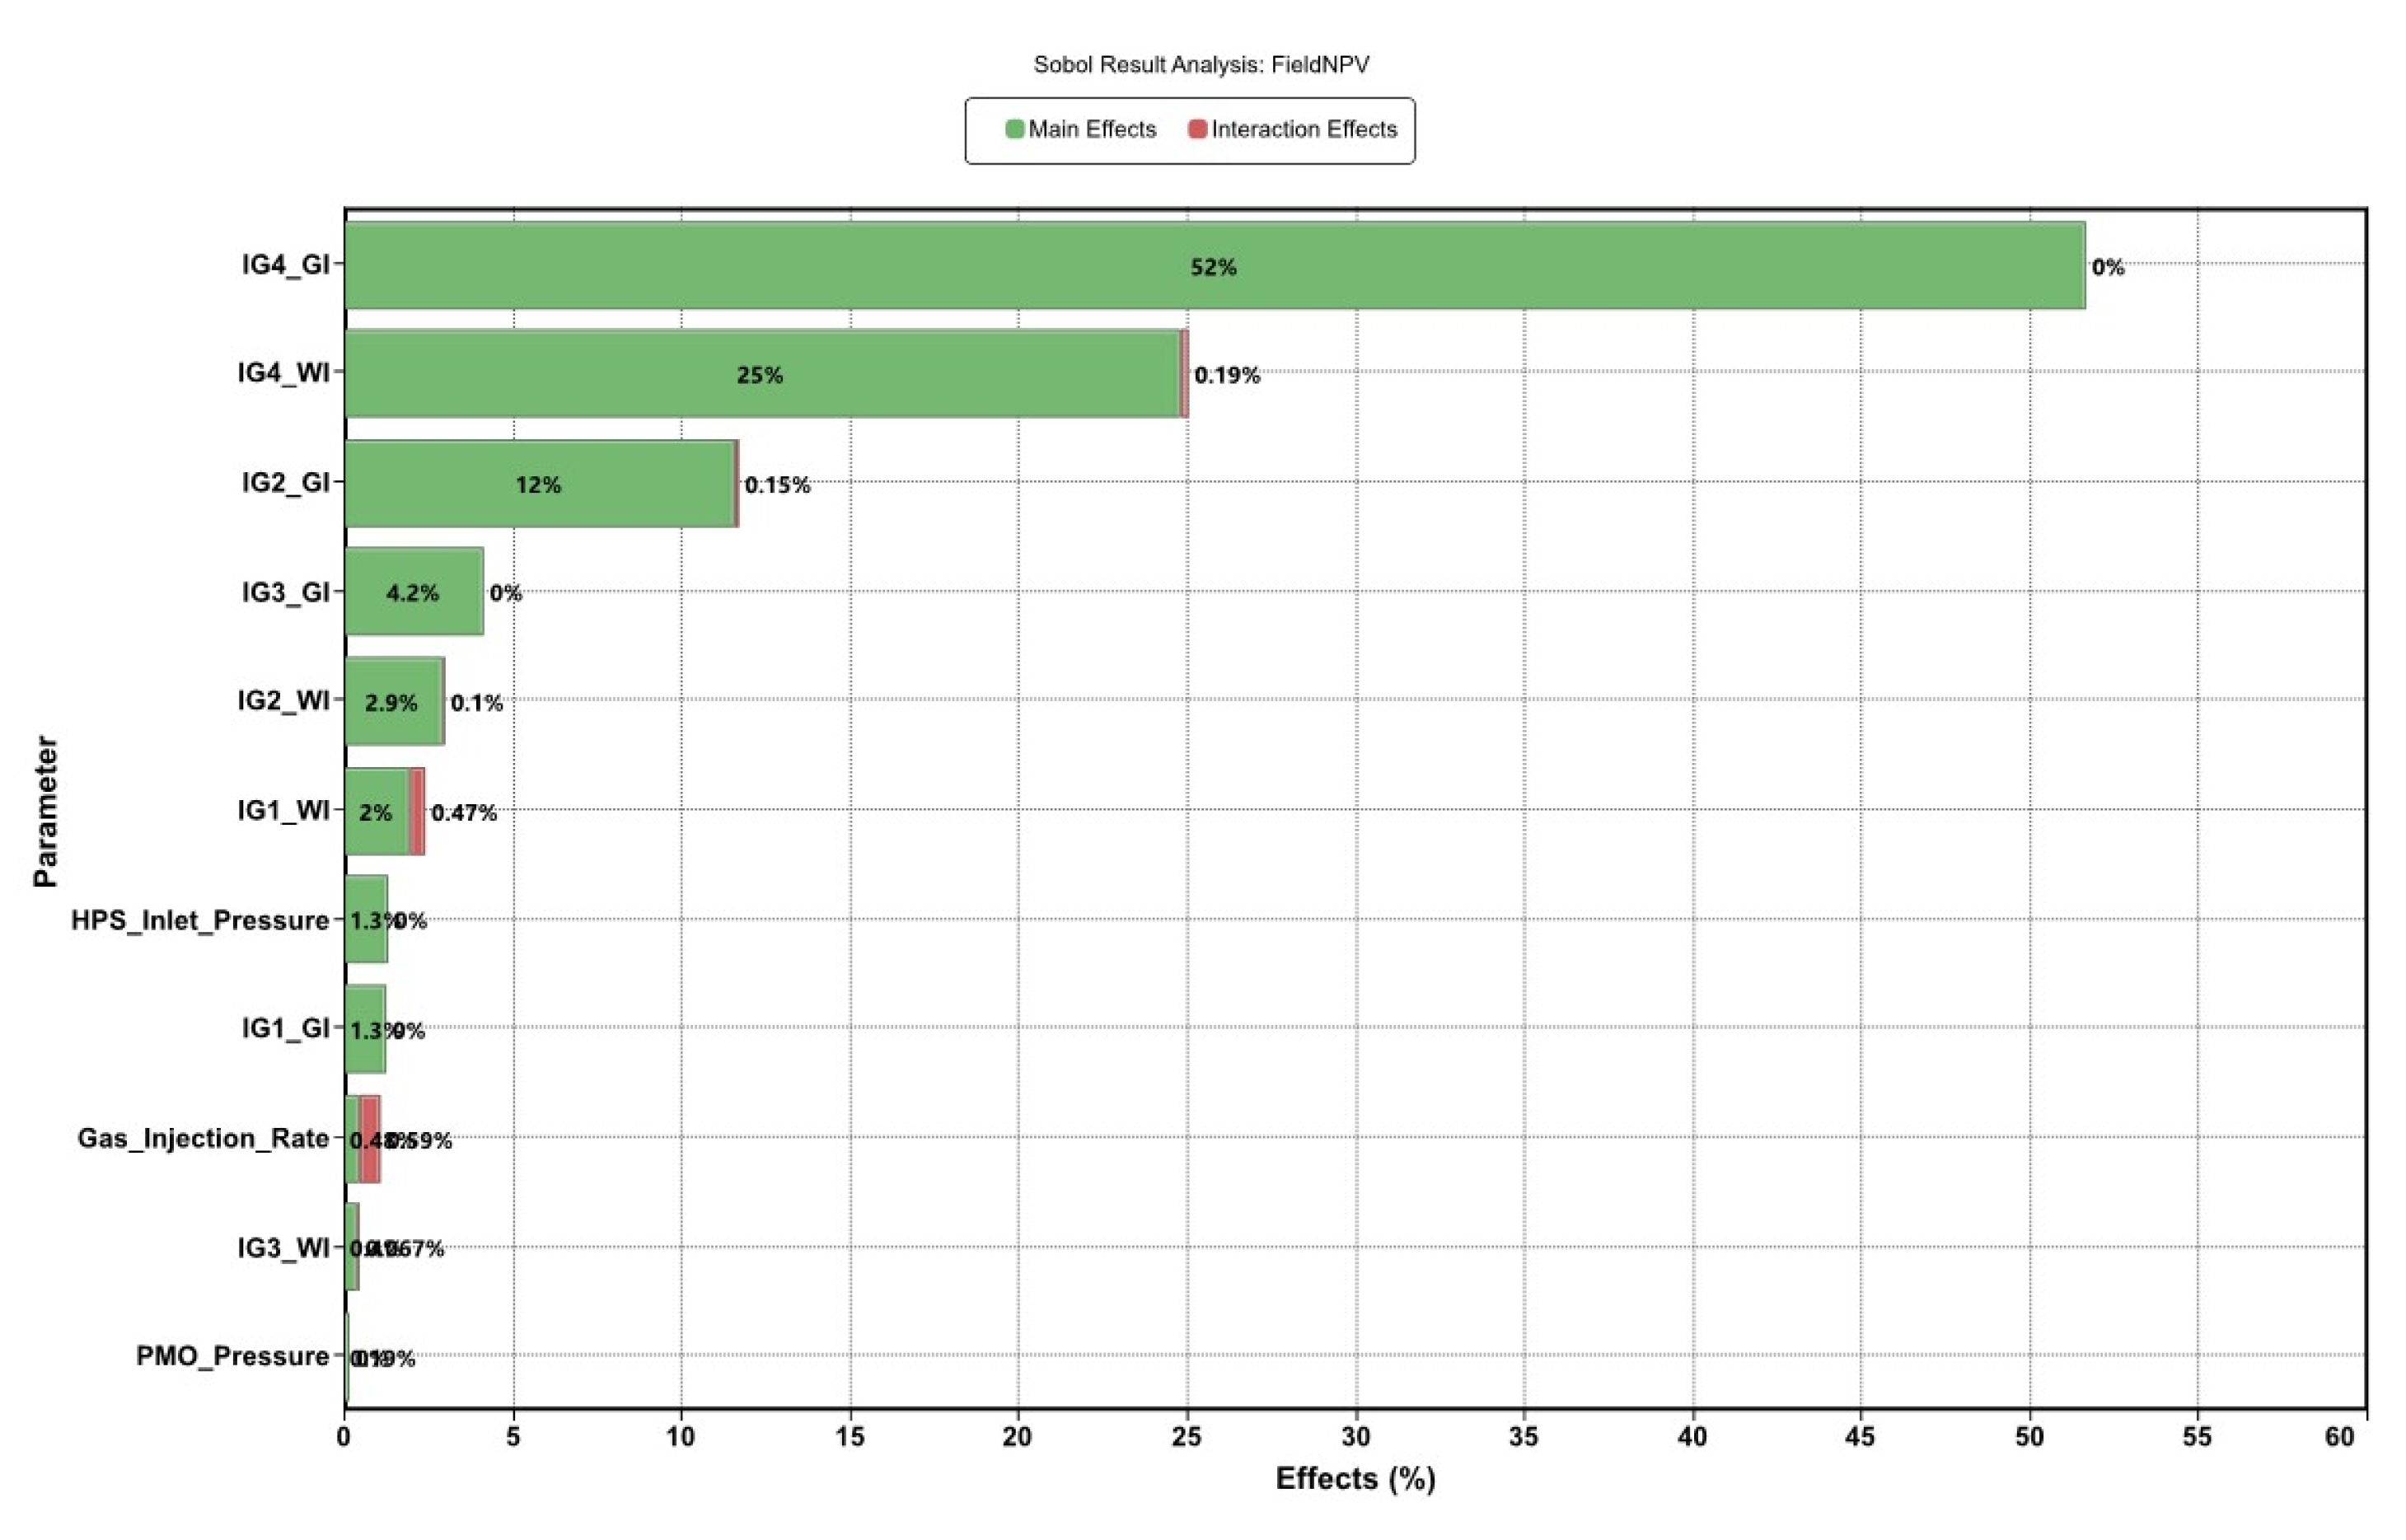
The Sobol analysis supports the results of the Morris analysis with injection group 4 being the most influential sensitive parameter at 52% and 25%, and gas injection of injection groups 2 and 3 following 12% and 4.2%. The parameters do not seem to show much interaction with each other in the outcome of the Field NPV.
Figure 29.
Sobol Analysis for field NPV.
Following the results of the sensitivity analysis, 7 of the 11 sensitivity parameters are selected for optimization using the particle swarm optimizer. Since our study focuses on the surface facility, all 3 of the surface component operation conditions are selected. These are the HPSIP, gas injection rate and Production Manifold Outlet Pressure (PMOP). The additional 4 parameters that are selected are the gas and water injection cycles for injection group 4, and gas injection cycles for injection groups 2 and 3.
3.4.2. Optimized Operating Conditions
The application of the particle swarm optimizer yielded optimum operating conditions for the selected sensitive parameters. The results of this optimization are depicted in the plots below, which demonstrate the improvements achieved through the optimization process.
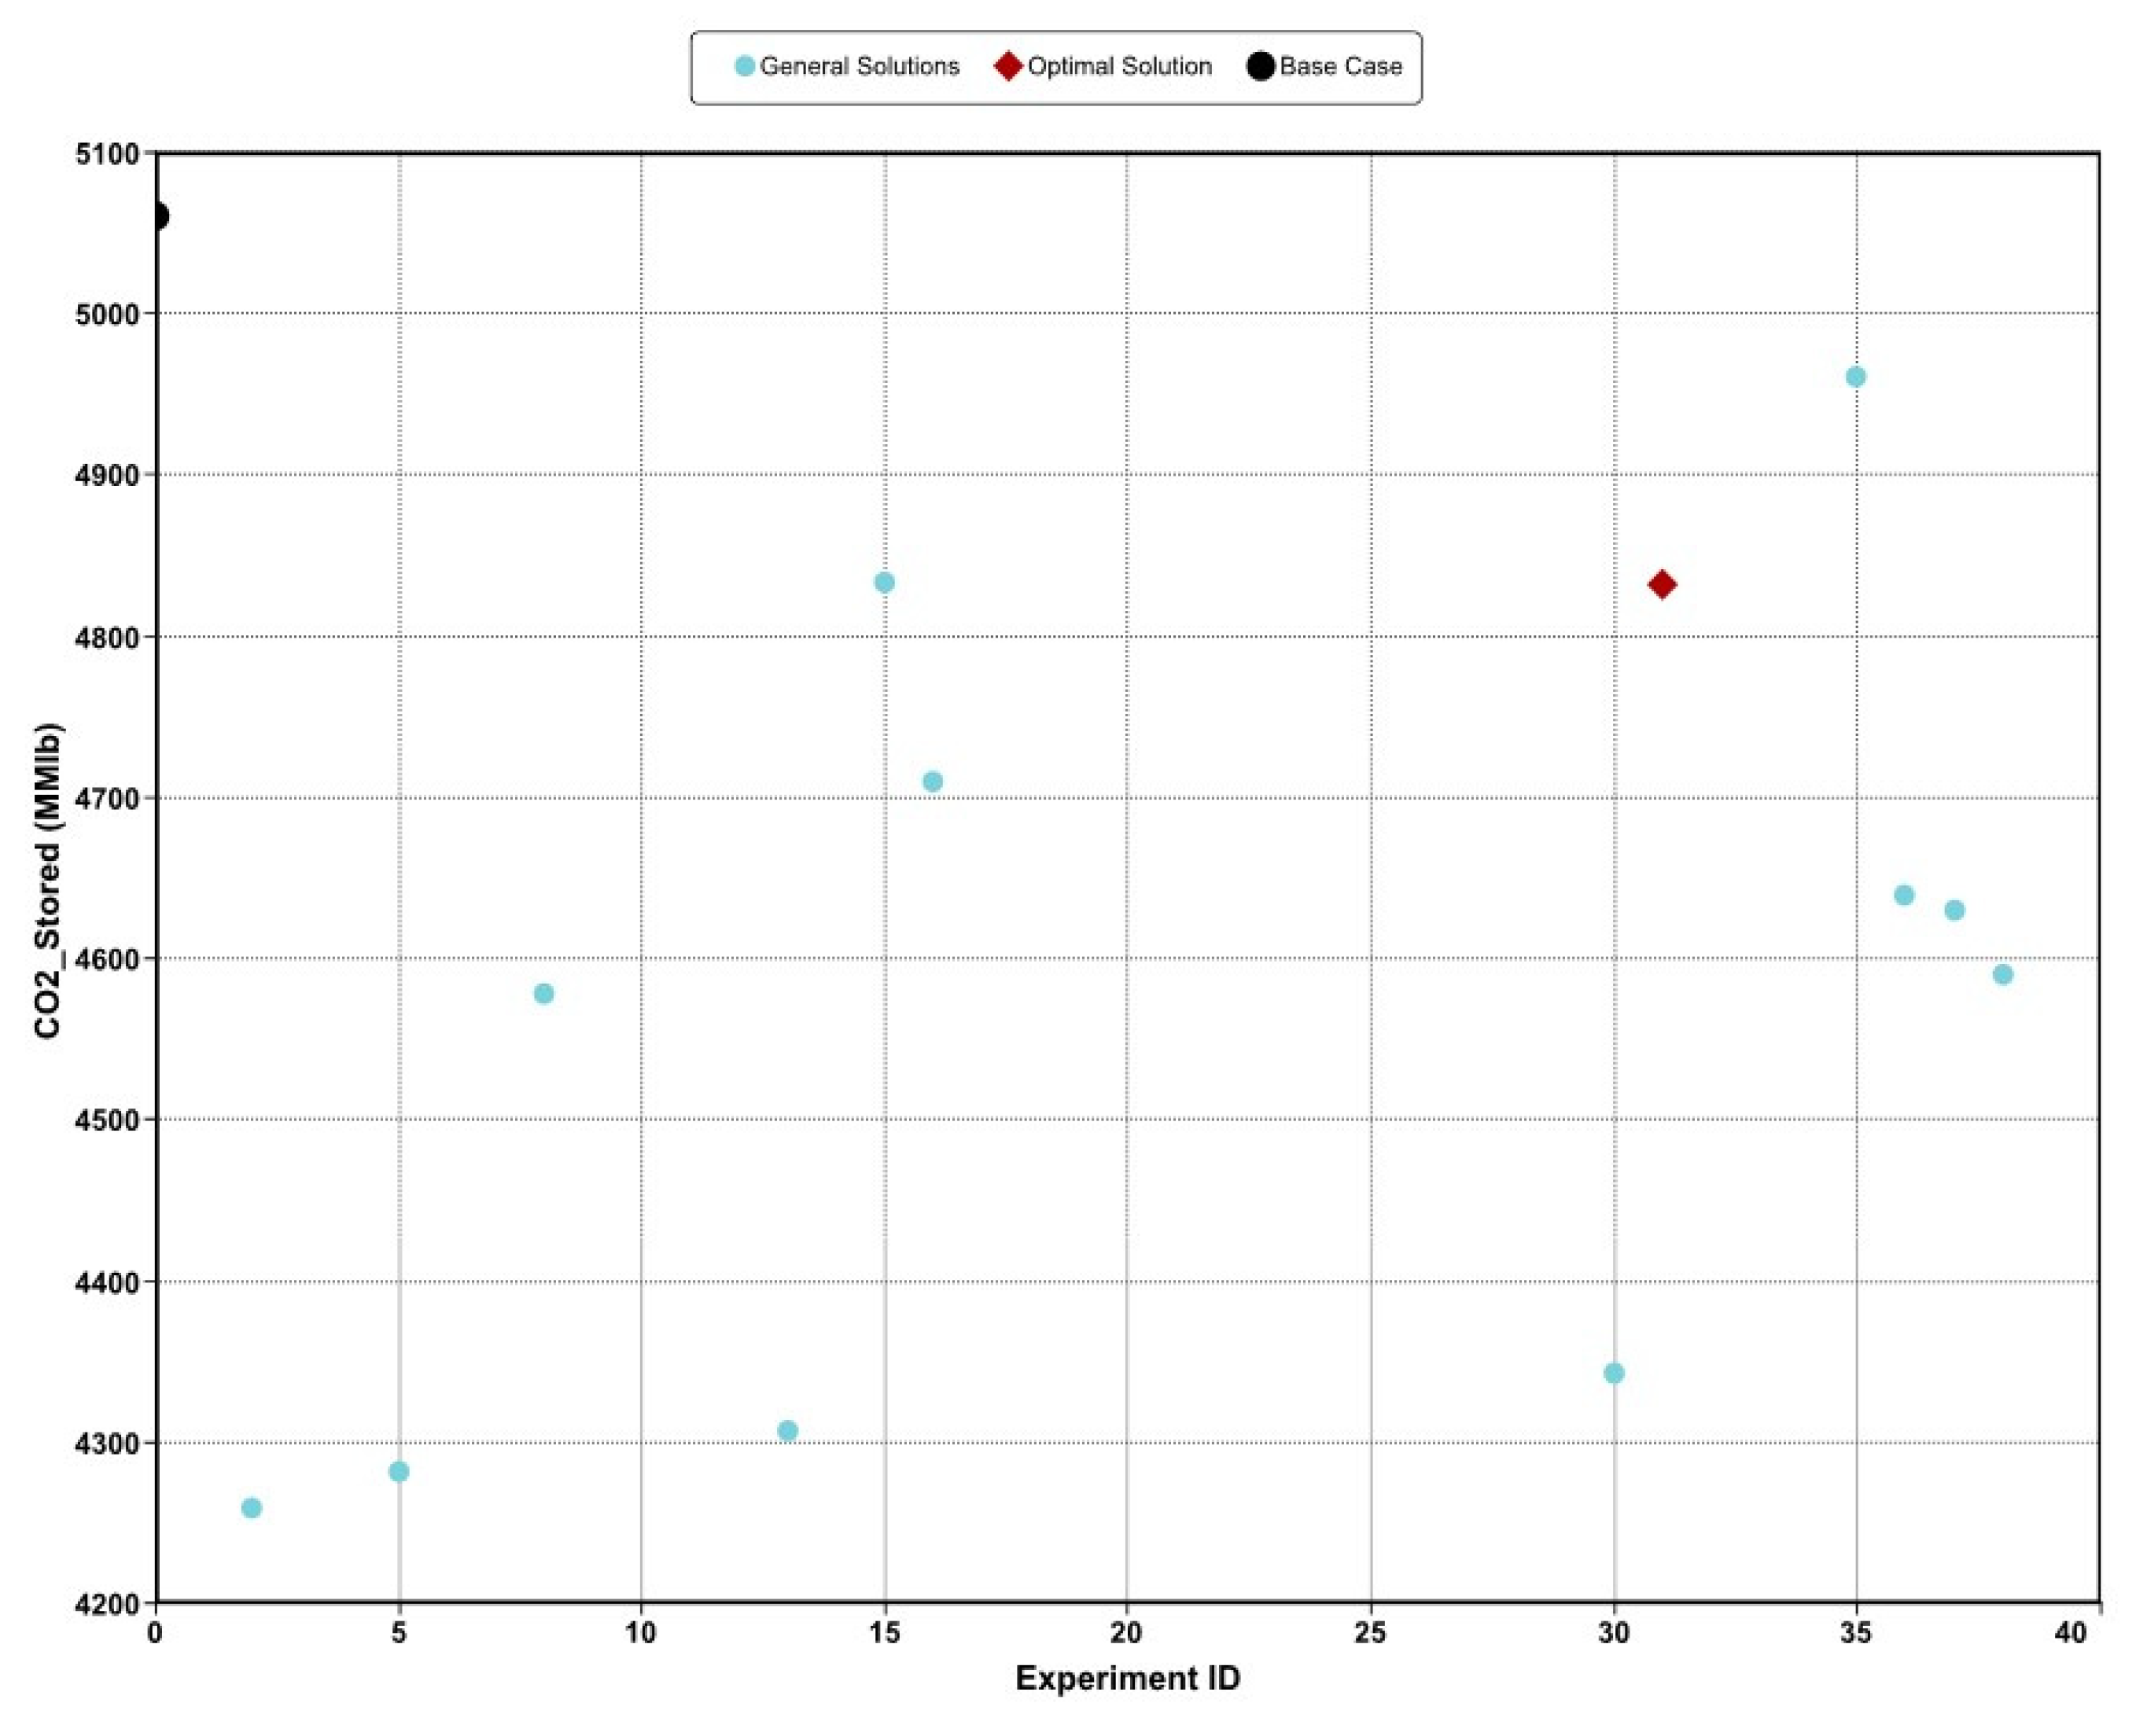
Based on the cumulative oil produced, the optimal experiment ID is 31, as shown in Figure 30. This experiment resulted in the highest incremental oil production. The optimal strategy produced a cumulative oil volume of 14,043,372 STB, which is an incremental increase of 96,804 STB over the base development strategy, translating to a 0.694% improvement (Figure 31 and Table 8).
Table 7.
Percentage Increase in Cumulative Oil Production.
| Experiment ID | Cumulative Oil Produced (STB) |
Incremental Oil Recovered (STB) |
Percentage Increment |
|---|---|---|---|
| Development Case | 13,946,568 | ||
| Optimal Strategy | 14,043,372 | 96,804 | 0.694 |
The optimized operating conditions not only enhanced oil recovery but also significantly reduced the amount of CO2 purchased. As illustrated in Figure 32, the optimal strategy utilized approximately 10% less purchased gas (1,984 MMSCF) to achieve a slightly higher cumulative oil production. This is the benefit of having the right operating conditions in the surface facility components and optimal scheduling of water and gas injection cycles. The savings involved in CO2 purchased is the driving force in raising NPV of experiment 31 above the others.
The economic benefits of the optimized strategy are evident in the Field NPV results (Figure 33). The optimal strategy yielded a field NPV of $114,871,730, which is a 25.84% increase over the base development strategy (Table 10). The reduced CO2 purchase costs and the efficient utilization of injected CO2 are the primary drivers behind this substantial increase in NPV. However, it is important to note that the reduction in CO2 purchase also results in less CO2 being stored subsurface.
Figure 33.
Field NPV at the end of forecast period.
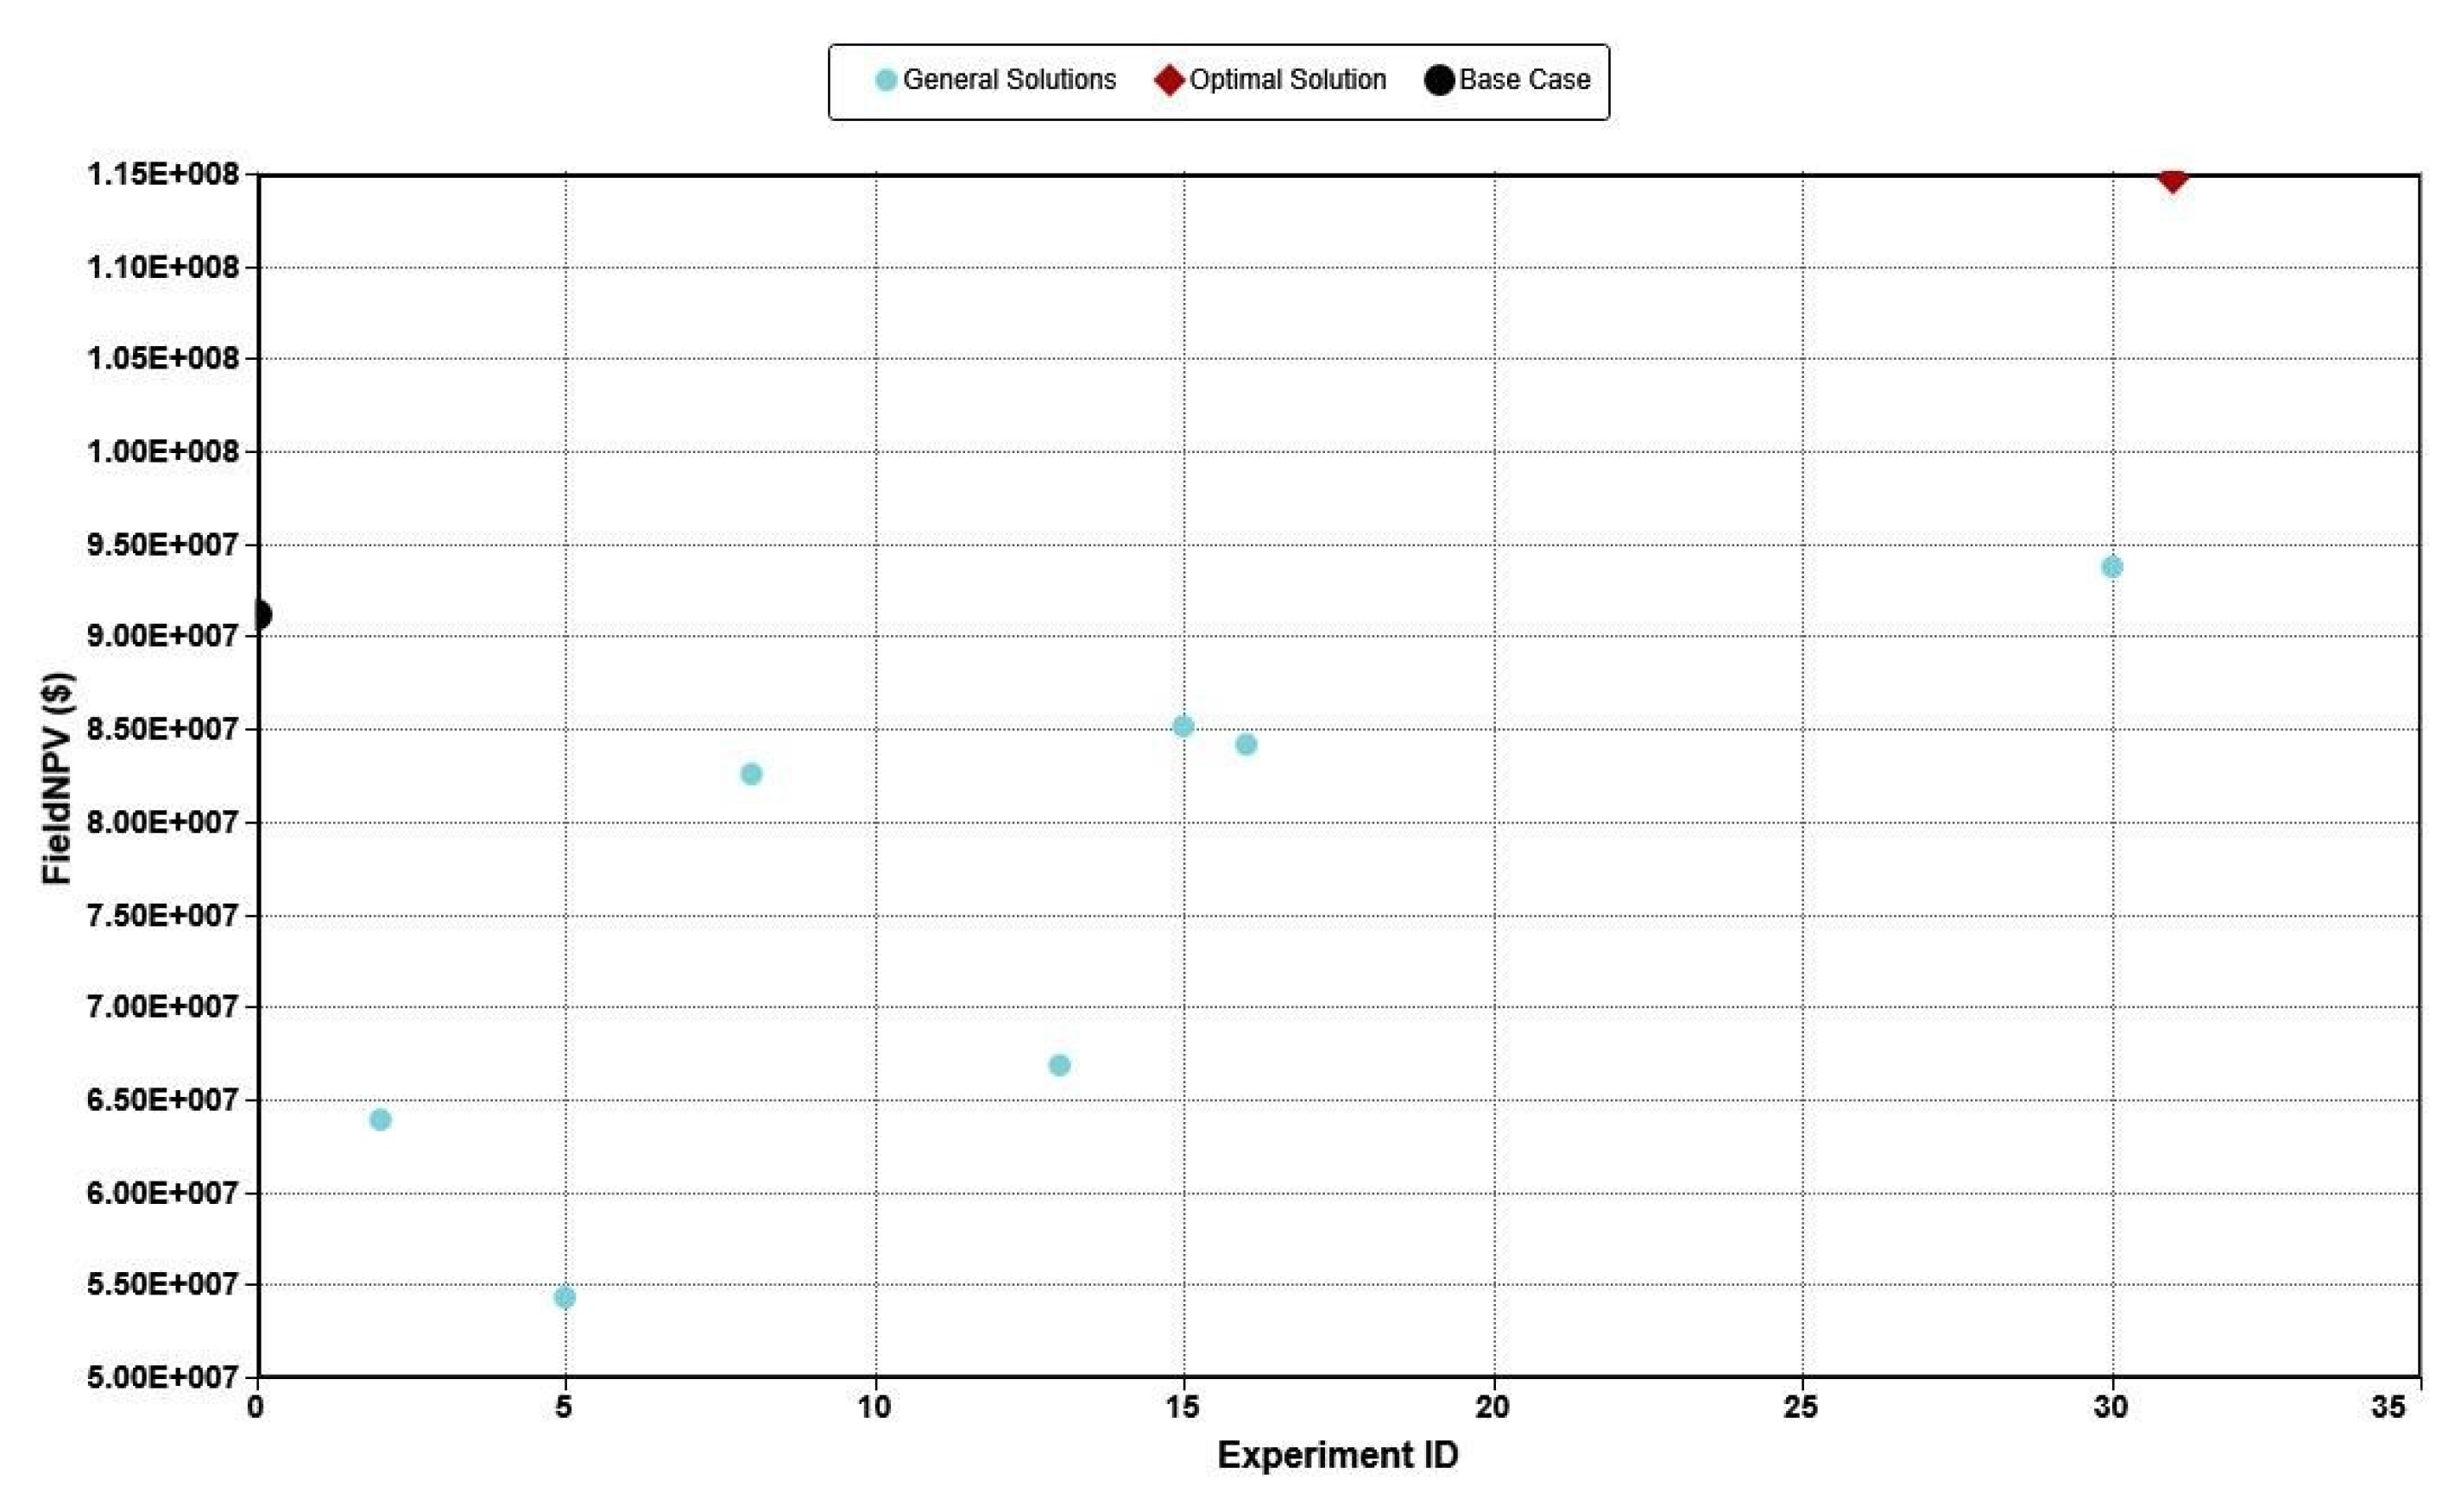
Table 9.
Percentage Increase in Field NPV.
| Experiment ID | Field NPV ($) | Incremental Field NPV ($) | Percentage of Incremental Field NPV |
|---|---|---|---|
| Development Case | 91,281,921 | ||
| Optimal Strategy | 114,871,730 | 23,589,809 | 25.84 |
Table 10.
Incremental CO2 Stored per Experimental ID.
| Experiment ID | Cumulative CO2 stored (MMIbs) | Incremental Storage (MMIbs) | Percentage Decrement |
|---|---|---|---|
| Development Case | 5,061.68 | ||
| Optimal Strategy | 4,832.18 | -229.5 | 4.53 |
Figure 34.
Plot of CO2 Stored per Experimental ID.
The cumulative CO2 stored for the optimal strategy is 4,832.18 MMlbs, compared to 5,061.68 MMIbs in the base development strategy (Figure 35). This discrepancy is due to the decreased need for external CO2, as the optimized strategy maximizes the use of recycled CO2 from produced gas. Based on these results. Experiment 31 is selected as our ideal optimized case.
The amount of CO2 stored is equal to the amount of purchased CO2 because all CO2 remains trapped in the closed system. This would not have huge economic significance since the financial gains and tax reliefs of CO2 storage last only 12 years. This simulation goes for 15 years and thus, the last 3 years of extra purchased CO2 does not contribute economic benefits to the strategy.
4. Recommendation and Conclusion
4.1. Conclusion
This study has demonstrated the successful integration of subsurface and surface facility models to optimize the CO2-EOR and CO2 storage at the FWU field. Through integrated asset modeling, significant insights into the interactions between various components of the production system were achieved, allowing for a more comprehensive and effective optimization strategy.
The history matching results confirmed the robustness of the surface-coupled model, accurately replicating historical data for liquid, oil, gas, and water production. This validation provided a solid foundation for reliable forecasting and optimization.
In the forecasting phase, the development strategy scenario proved superior to the Do-Nothing scenario, with notable increases in cumulative oil production and efficient management of water and gas production rates. The strategic interventions, such as shutting-in wells with high water cut and optimizing CO2 injection periods, significantly enhanced oil recovery and CO2 storage.
The sensitivity analysis identified critical parameters influencing cumulative oil production and CO2 storage, guiding the optimization process. The application of the particle swarm optimizer led to the identification of optimal operating conditions, resulting in a 0.694% increase in cumulative oil production and a 25.84% increase in field NPV. The optimized strategy also achieved a 10% reduction in purchased CO2, underscoring the economic viability and efficiency of the proposed approach.
To conclude, the integrated asset modeling approach presented in this study offers a robust framework for optimizing CO2-EOR and CO2 storage processes, balancing these with economic and environmental considerations. The findings provide valuable insights for future CO2-EOR projects, emphasizing the importance of comprehensive modeling and optimization in maximizing resource utilization and operational efficiency.
4.2. Recommendations
The work presented in this paper lays a robust foundation for optimizing CO2-EOR and CO2 storage processes through integrated asset modeling. However, this study can be improved moving forward and avenues for future research include:
- Replace Surface Network Connections with Actual Pipe Models: Employing pipe models that consider length, diameter, and appropriate flow correlations will provide more precise simulations of surface network dynamics. This improvement can lead to more accurate predictions of fluid behavior and pressure losses, enhancing the overall reliability of the integrated model.
- Incorporate Historical Fluid Composition in History Matching: Including the historical fluid composition sampled at the surface in the history-matching process can help reduce the non-uniqueness of the solution. This addition will provide a more detailed understanding of the reservoir’s fluid characteristics and improve the accuracy of the model’s predictions.
- Develop a Comprehensive Life-Cycle Assessment (LCA): Conducting a full LCA for the integrated asset model will provide a holistic view of the environmental impacts associated with CO2-EOR and CO2 storage processes. This assessment can identify areas for reducing carbon footprints and improving sustainability, thereby aligning the model with environmental regulations and sustainability goals.
Author Contributions
Conceptualization, W.A.; Formal analysis, A.E.-A. and W.A.; Funding acquisition, W.A.; Investigation, A.E.-A. and W.A.; Methodology, W.A.; Project administration, W.A.; Resources, W.A.; Software, W.A.; Supervision, W.A.; Validation, W.A.; Visualization, A.E.-A., W.A and A.A.; Writing—original draft, A.E.-A.; Writing—review and editing, A.E.-A. and A.A. All authors have read and agreed to the published version of the manuscript.
Funding
Funding for this project is provided by the U.S. Department of Energy’s (DOE) National Energy Technology Laboratory (NETL) through the Southwest Regional Partnership on Carbon Sequestration (SWP) under the Award No. DE-FC26-05NT42591.
Data Availability Statement
The data acquired from the FWU field were provided by the Southwest Regional Partnership on Carbon Sequestration (SWP).
Conflicts of Interest
The authors declare no conflicts of interest.
References
- IPCC. Climate Change 2014: Synthesis Report. Contribution of Working Groups I, II and III to the Fifth Assessment Report of the Intergovernmental Panel on C8limate Change; Pachauri, R., Meyer, L., Eds.; IPCC: Geneva, Switzerland, 2014; pp. 40–54. [Google Scholar]
- Houghton, J. Global Warming: The Complete Briefing; Cambridge University Press: Cambridge, UK, 2009; pp. 3–11. [Google Scholar]
- NASA. The Effects of Climate Change. Available online: https://climate.nasa.gov/effects/ (accessed on 10 March 2024).
- Koottungal, L. 2012 Worldwide EOR Survey. Oil Gas J. 2012, 110, 57–69. [Google Scholar]
- Al-Mutairi, S.M.; Kokal, S.L. EOR Potential in the Middle East: Current and Future Trends. In Proceedings of the SPE Europec Featured at EAGE Conference and Exhibition, Vienna, Austria, 23-26 May 2011. [Google Scholar]
- Kuuskraa, V.; Wallace, M. CO2-EOR Set for Growth as New CO2 Supplies Emerge. Oil Gas J. 2014, 112, 92–105. [Google Scholar]
- Allan, D. Integrated Asset Modeling. Oilfield Review 2016.
- Temizel, C.; Jia, B.; Ranjith, R.; Suhag, A.; Balaji, K.; Putra, D.; Saracoglu, O. Integrated Asset Modeling through Optimization of Multiple Reservoirs Using Next-Generation Reservoir Simulators. In Proceedings of the SPE Europec Featured at 79th EAGE Conference and Exhibition, Paris, France, 12-15 June 2017. [Google Scholar] [CrossRef]
- Primera, A.; Sifuentes, W.; Rodríguez, N. CO2 Injection and Storage: A New Approach Using Integrated Asset Modeling. In Proceedings of the EUROPEC/EAGE Conference and Exhibition, Amsterdam, The Netherlands, 8-11 June 2009. [Google Scholar] [CrossRef]
- Roadifer, R.D.; Sauvé, R.; Torrens, R.; Mead, H.W.; Pysz, N.P.; Uldrich, D.O.; Eiben, T. Integrated Asset Modeling for Reservoir Management of a Miscible WAG Development on Alaska’s Western North Slope. In Proceedings of the SPE Annual Technical Conference and Exhibition, San Antonio, TX, USA, 8-10 October 2012. [Google Scholar] [CrossRef]
- Araya, A.; Cullick, S.; Smyth, J. Holistic Approach for CO2 Underground Geological Storage. Energy Procedia 2011, 4, 2645–2653. [Google Scholar] [CrossRef]
- Carpenter, C. Integrated Asset Modeling: An Approach to Long-Term Production Planning. J. Pet. Technol. 2016, 68, 43–44. [Google Scholar] [CrossRef]
- Balch, R.; McPherson, B. Integrating Enhanced Oil Recovery and Carbon Capture and Storage: Farnsworth Field. J. Pet Technol. 2017, 69, 80–82. [Google Scholar] [CrossRef]
- Al-Mutairi, S.; Hayder, E.; Munoz, A.; Al-Shammari, A.; Al-Jama, N. A Study of Coupling Surface Network to Reservoir Simulation Model in a Large Middle East Field. In Proceedings of the North Africa Technical Conference and Exhibition, Cairo, Egypt, 14-17 February 2010. [Google Scholar] [CrossRef]
- Beliakova, N.; van Berkel, J.T.; Kulawski, G.J.; Schulte, A.M.; Weisenborn, A.J. Hydrocarbon Field Planning Tool for Medium to Long Term Production Forecasting from Oil and Gas Fields Using Integrated Subsurface—Surface Models. In Proceedings of the SPE European Petroleum Conference, Paris, France, 24-25 October 2000. [Google Scholar] [CrossRef]
- Wilson, A. A Fully Coupled Network Model: Comparison with Other Integrated Models on Field Cases. J. Pet. Technol. 2015, 67, 90–91. [Google Scholar] [CrossRef]
- Coats, B.K.; Fleming, G.C.; Watts, J.W.; Ramé, M.; Shiralkar, G.S. A Generalized Wellbore and Surface Facility Model, Fully Coupled to a Reservoir Simulator. In Proceedings of the SPE Reservoir Simulation Symposium, Houston, USA, 3-5 February 2003. [Google Scholar] [CrossRef]
- Ghorayeb, K.; Holmes, J.; Torrens, R. Field Planning Using Integrated Surface/Subsurface Modeling. In Proceedings of the SPE Middle East Oil and Gas Show and Conference, Kingdom of Bahrain, 12-15 March 2005. [Google Scholar] [CrossRef]
- Pathak, V.; Mirzabozorg, A.; Zuloaga, P.; Dorival Vargas, J.M.; Klix, B. Solving the Challenges of a Complex Integrated Production System in Camisea Field Using Novel Modeling Techniques. In Proceedings of the SPE Latin American and Caribbean Petroleum Engineering Conference, Virtual, 27-31 July 2020. [Google Scholar] [CrossRef]
- Rotondi, M.; Cominelli, A.; Di Giorgio, C.; Rossi, R.; Vignati, E.; Carati, B. The Benefits of Integrated Asset Modeling: Lesson Learned from Field Cases. In Proceedings of the EUROPEC/EAGE Conference and Exhibition, Rome, Italy, 9-12 June 2008. [Google Scholar] [CrossRef]
- Shammari, B.A.; Putra, S.A.; Nooruddin, H.A.; Bellaci, I.J.; Shammari, A.T. European Association of Geoscientists & Engineers, IPTC 2014: International Petroleum Technology Conference, Doha, Qatar, January 2014. [CrossRef]
- Bowen, D.W.; Weimer, P. Reservoir Geology of the Morrow Formation, Eastern Colorado and Western Kansas: Implications for CO2 Sequestration and EOR. NETL Proceeding, 2005. Available online: http://www.netl.doe.gov/publications/proceedings/05/carbon-seq/Poster (accessed on 12 March 2024).
- Ampomah, W.; Balch, R.; Cather, M.; Rose-Coss, D.; Dai, Z.; Heath, J.; Dewers, T.; Mozley, P. Reservoir Modeling of CO2 Storage and Enhanced Oil Recovery at the Morrow Formation, Farnsworth Unit, Texas. Energy Fuels 2016, 30, 8545–8555. [Google Scholar] [CrossRef]
- Kolodzie, S. Analysis of Pore Throat Size and Use of the Waxman-Smits Equation to Determine OOIP in Spindle Field, Colorado. In Proceedings of the SPE Annual Technical Conference and Exhibition, Dallas, USA, 21-24 September 1980. [Google Scholar] [CrossRef]
- Balch, R.; McPherson, B.; Will, R.; Ampomah, W. Recent Developments in Modeling: Farnsworth Texas, CO2 EOR Carbon Sequestration Project. In Proceedings of the 15th Greenhouse Gas Control Technologies Conference, Virtual, 15-18 March 2021. [Google Scholar] [CrossRef]
- Rasmussen, L.; Fan, T.; Rinehart, A.; Luhmann, A.; Ampomah, W.; Dewers, T.; Heath, J.; Cather, M.; Grigg, R. Carbon Storage and Enhanced Oil Recovery in Pennsylvanian Morrow Formation Clastic Reservoirs: Controls on Oil–Brine and Oil–CO2 Relative Permeability from Diagenetic Heterogeneity and Evolving Wettability. Energies 2019, 12, 3663. [Google Scholar] [CrossRef]
- Ross-Coss, D.; Ampomah, W.; Cather, M.; Balch, R.S.; Mozley, P.; Rasmussen, L. An Improved Approach for Sandstone Reservoir Characterization. In Proceedings of the SPE Western Regional Meeting, Anchorage, USA, 23-26 May 2016. [Google Scholar] [CrossRef]
- Sun, Q.; Ampomah, W.; Kutsienyo, E.J.; Appold, M.; Adu-Gyamfi, B.; Dai, Z.; Soltanian, M.R. Assessment of CO2 Trapping Mechanisms in Partially Depleted Oil-Bearing Sands. Fuel 2020, 278, 118356. [Google Scholar] [CrossRef]
- Moch, J.M.; Xue, W.; Holdren, J.P. Carbon Capture, Utilization, and Storage: Technologies and Costs in the U.S. Context. Harvard Kennedy School Belfer Center Policy Brief 2022. 2022.
- Smith, E.; Morris, J.; Kheshgi, H.; Teletzke, G.; Herzog, H.; Paltsev, S. The cost of CO2 transport and storage in global integrated assessment modeling. Int. J. Greenh. Gas Control 2021, 109, 103367. [Google Scholar] [CrossRef]
Figure 2.
(a) 2D view of geological model; (b) 3D of geological model showing facies.
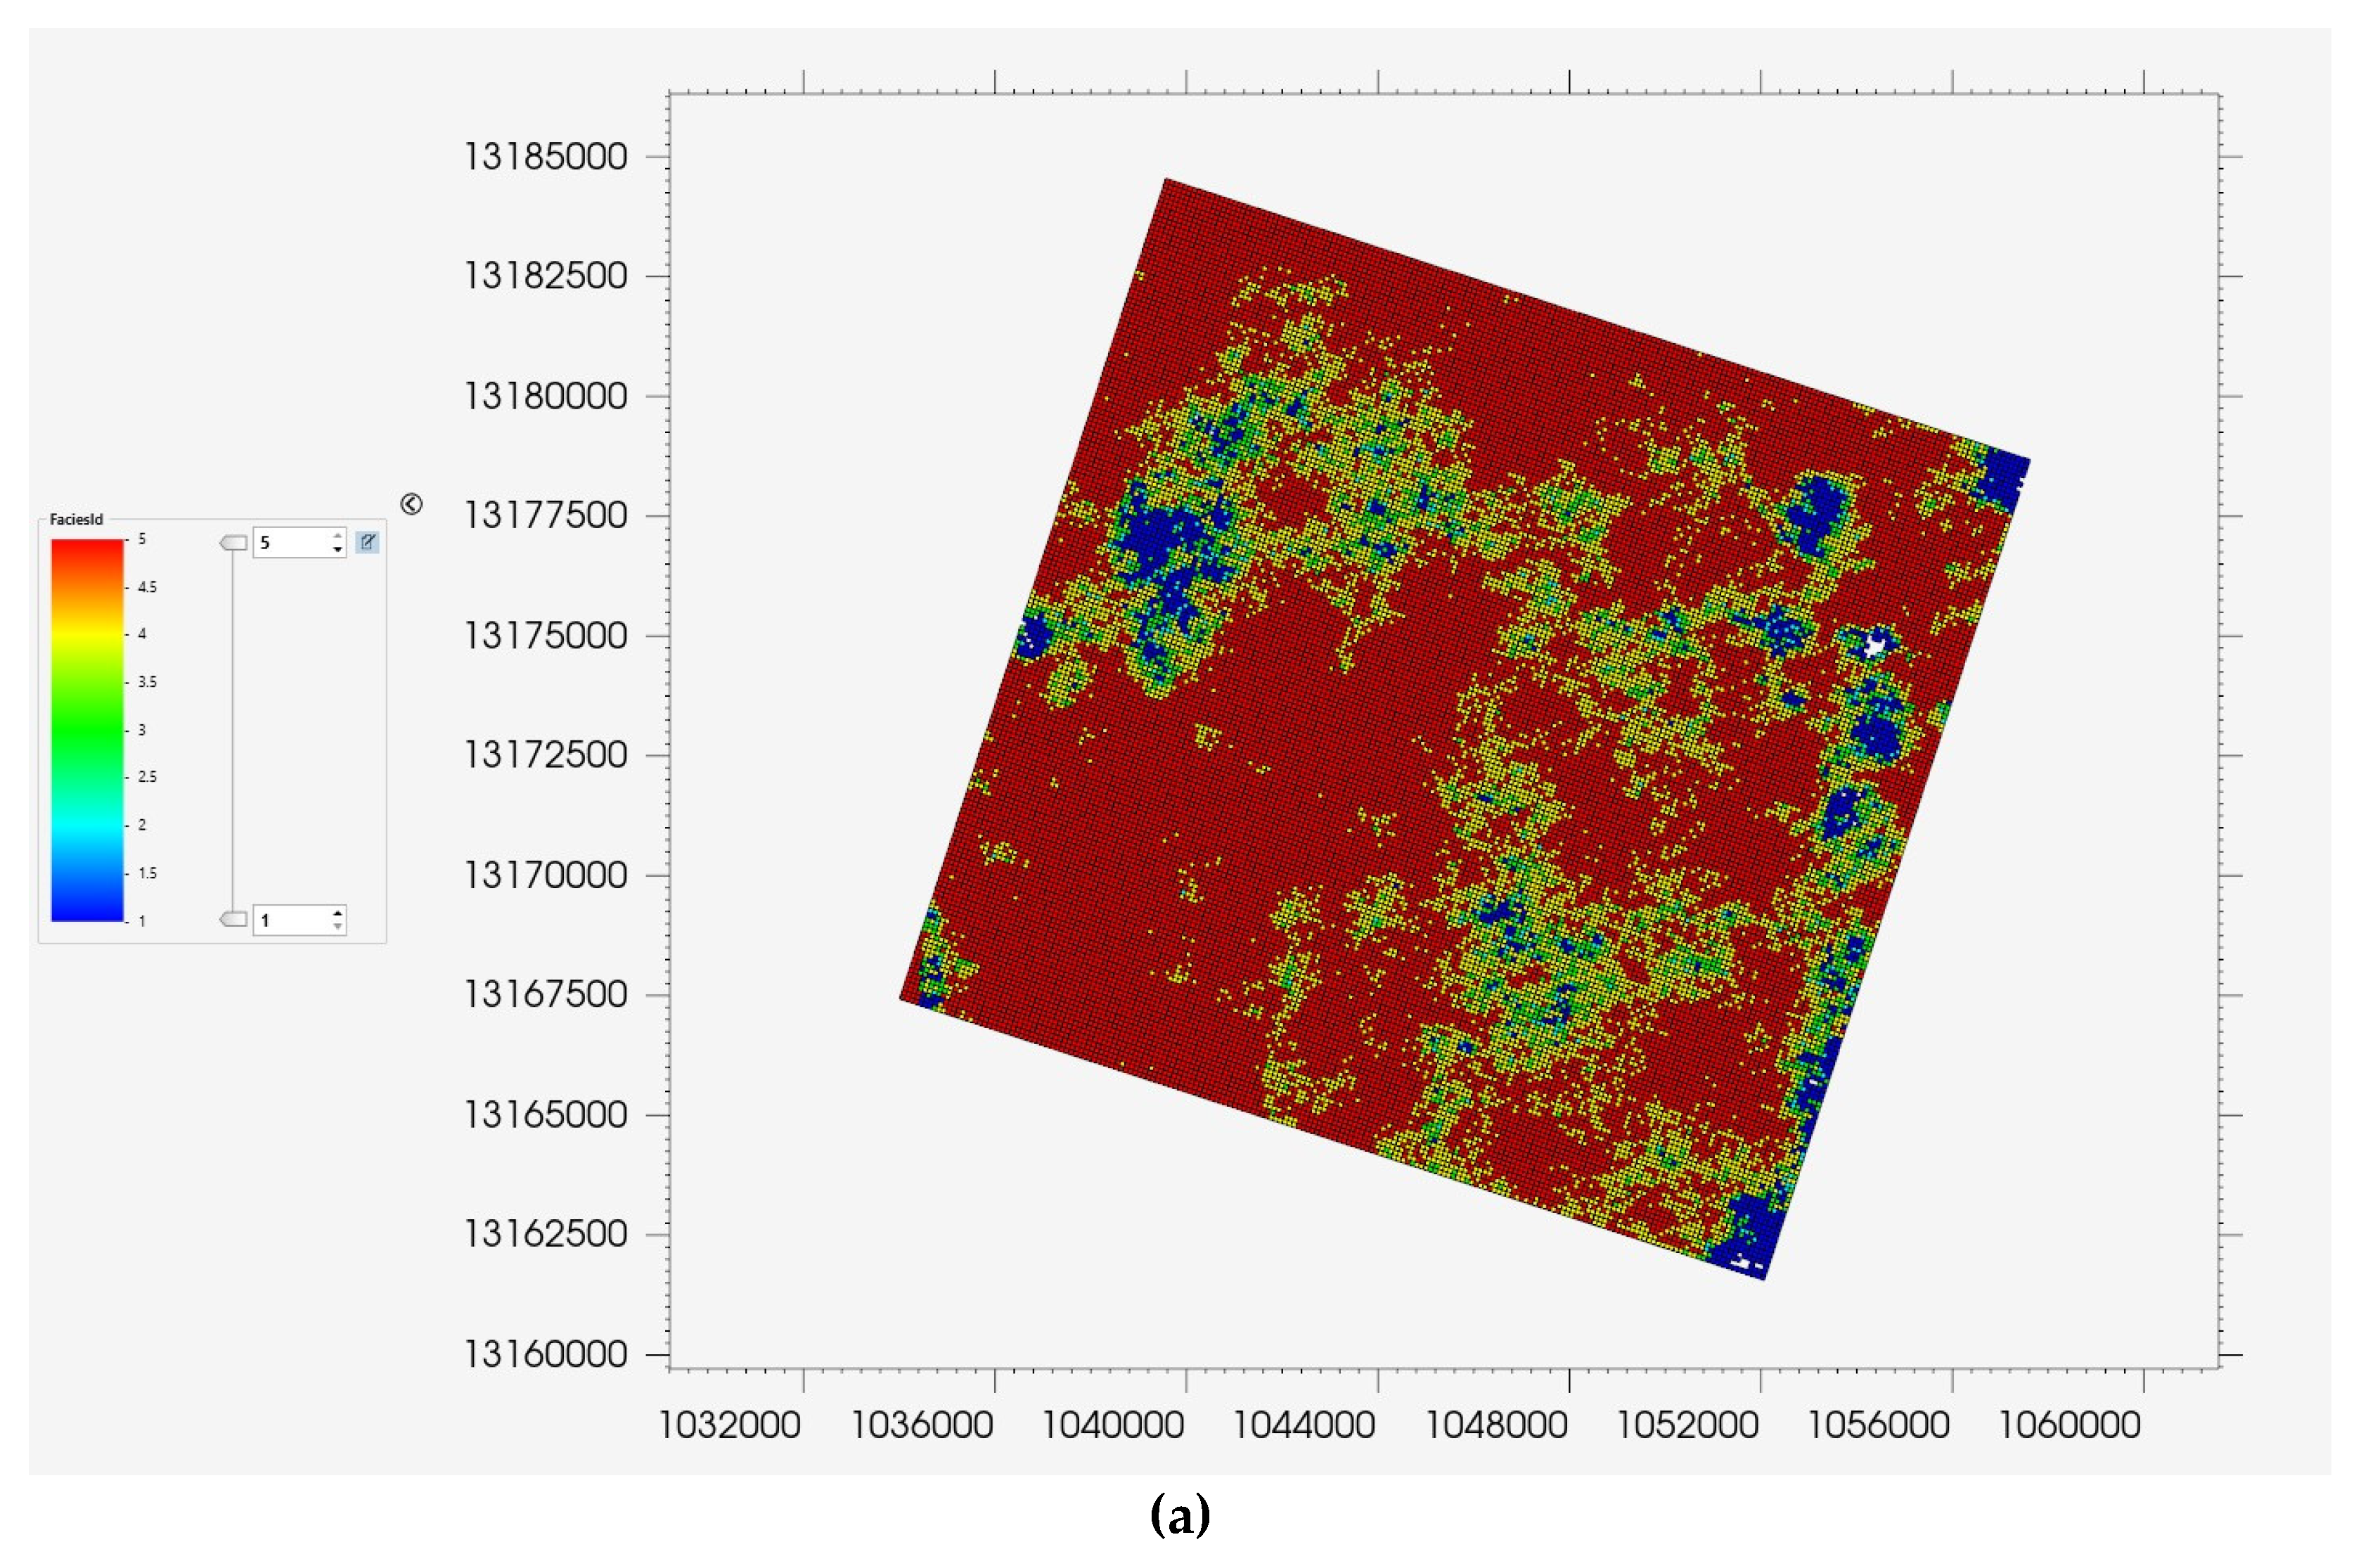
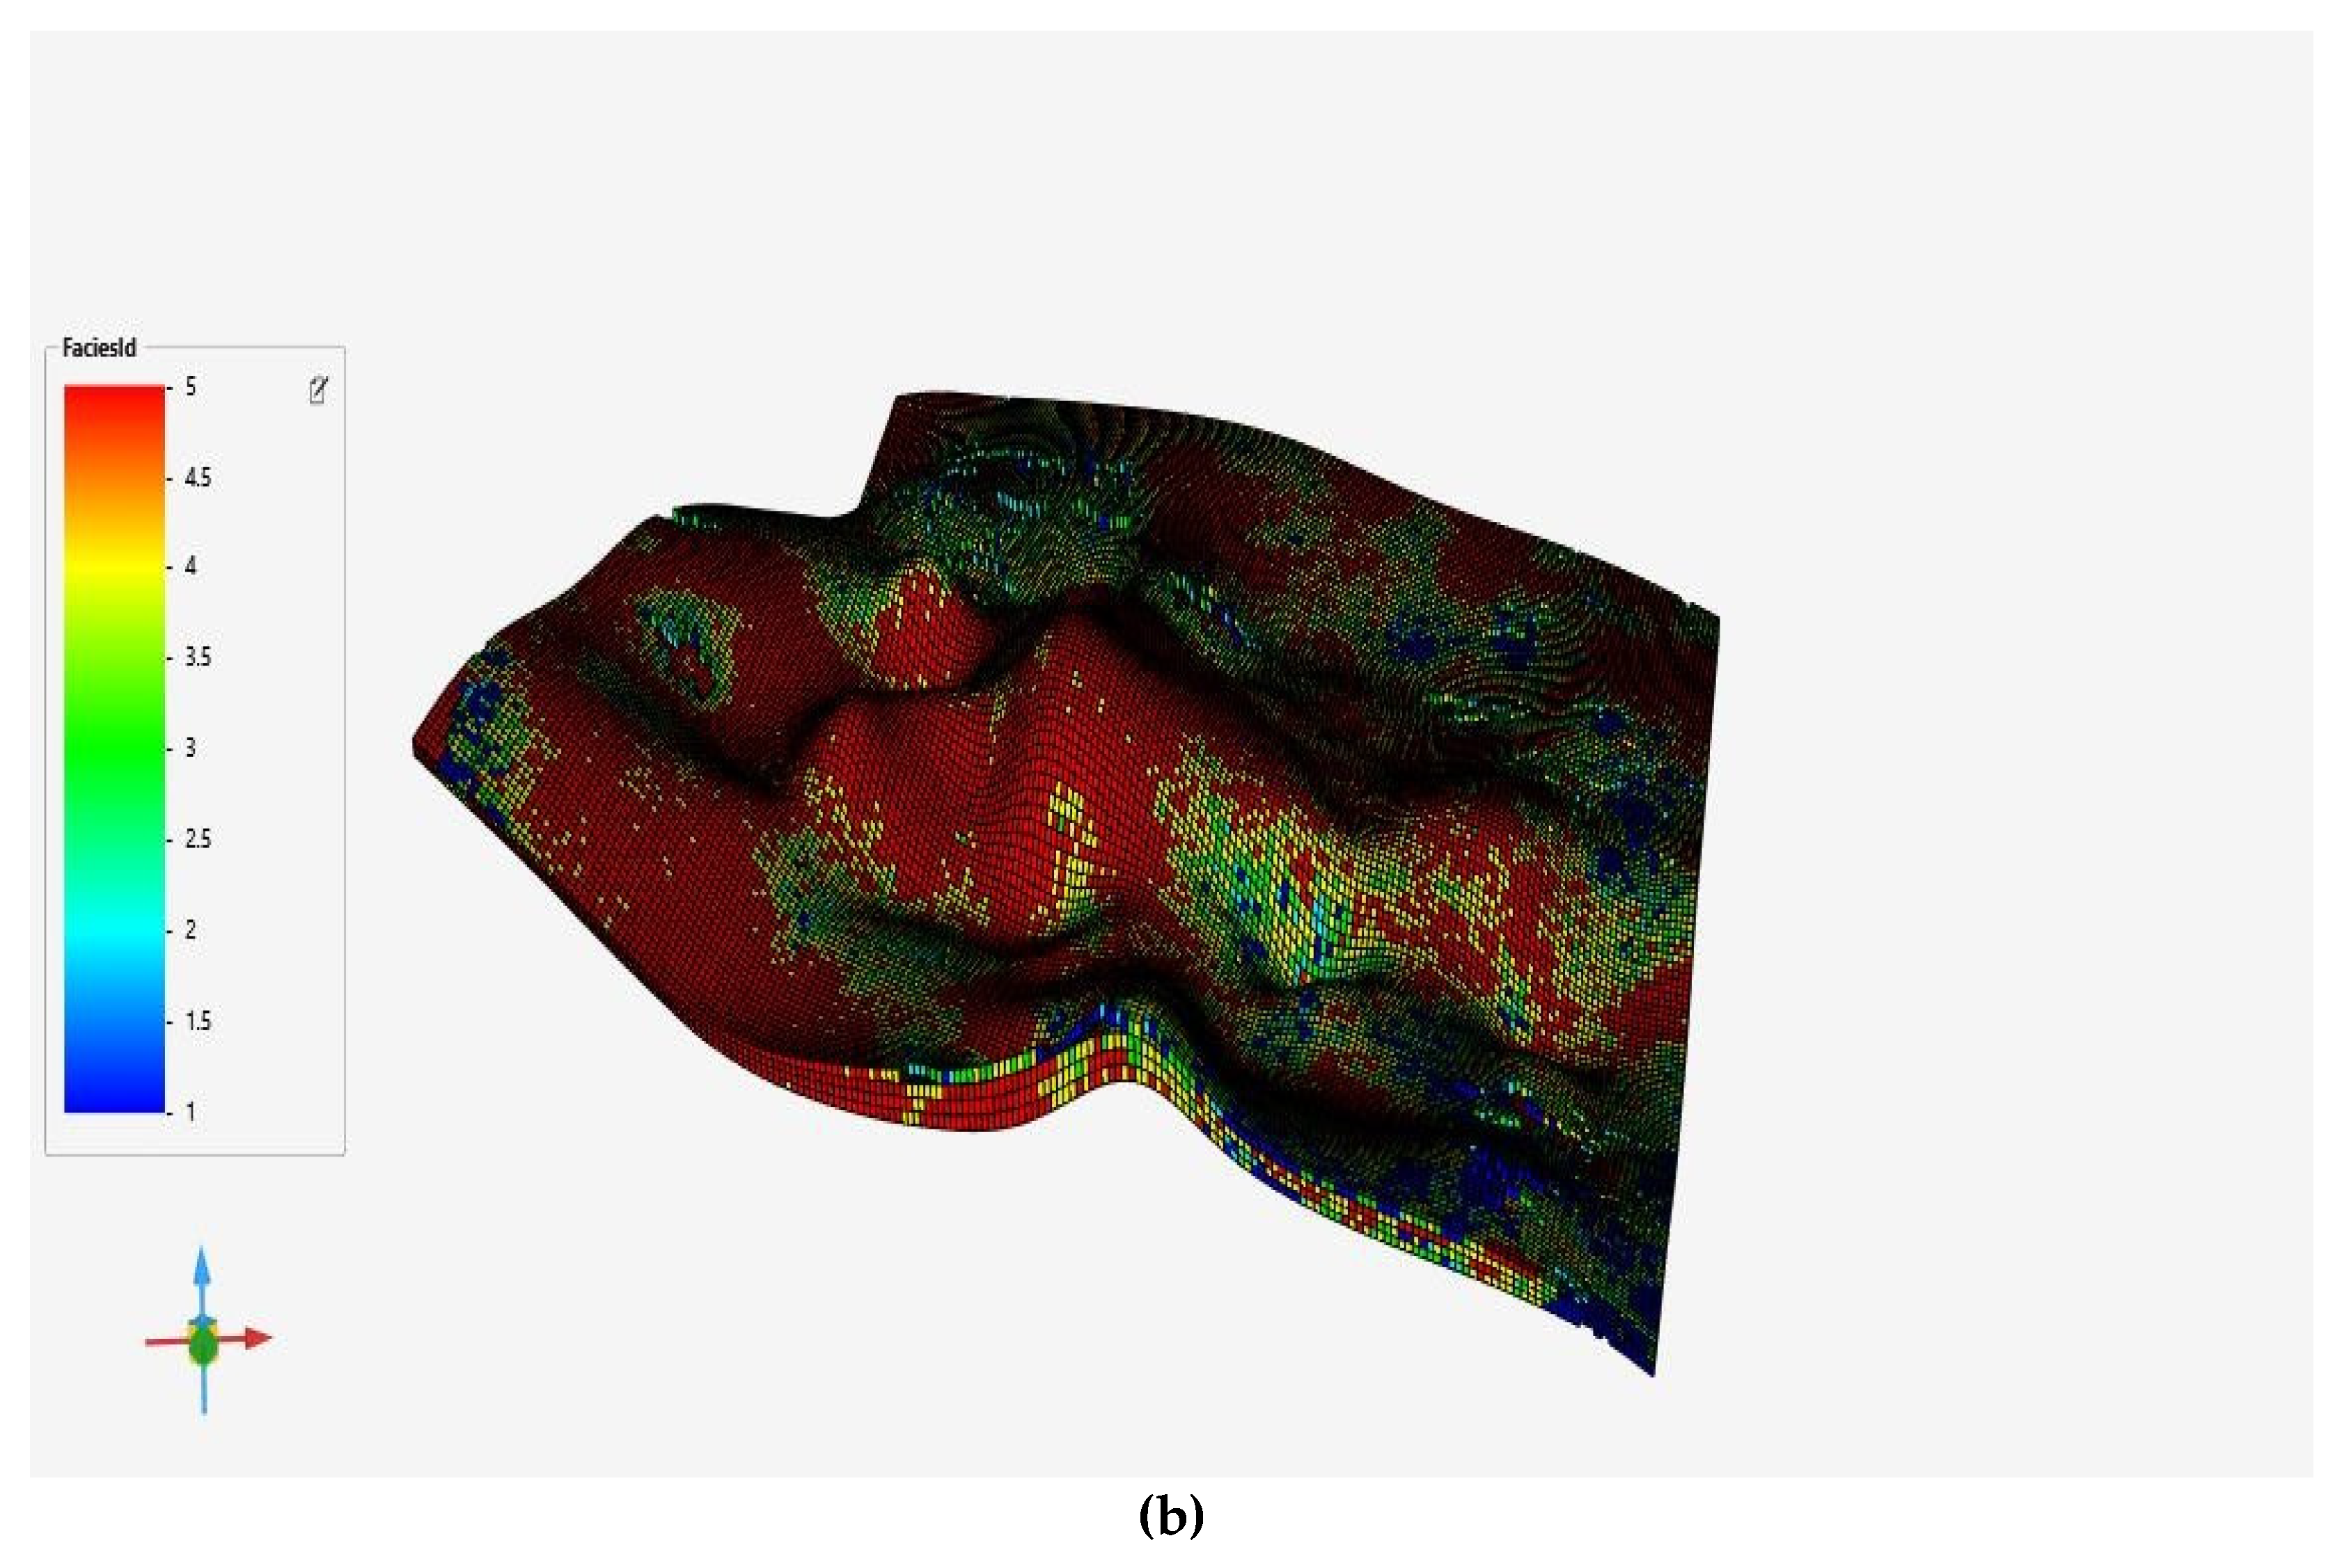
Figure 6.
Polynomial Regression vs. RBF Neural Network Model in Experiemnt 657.

Figure 7.
Polynomial Regression vs. RBF Neutral Model in Experiemnt 589.
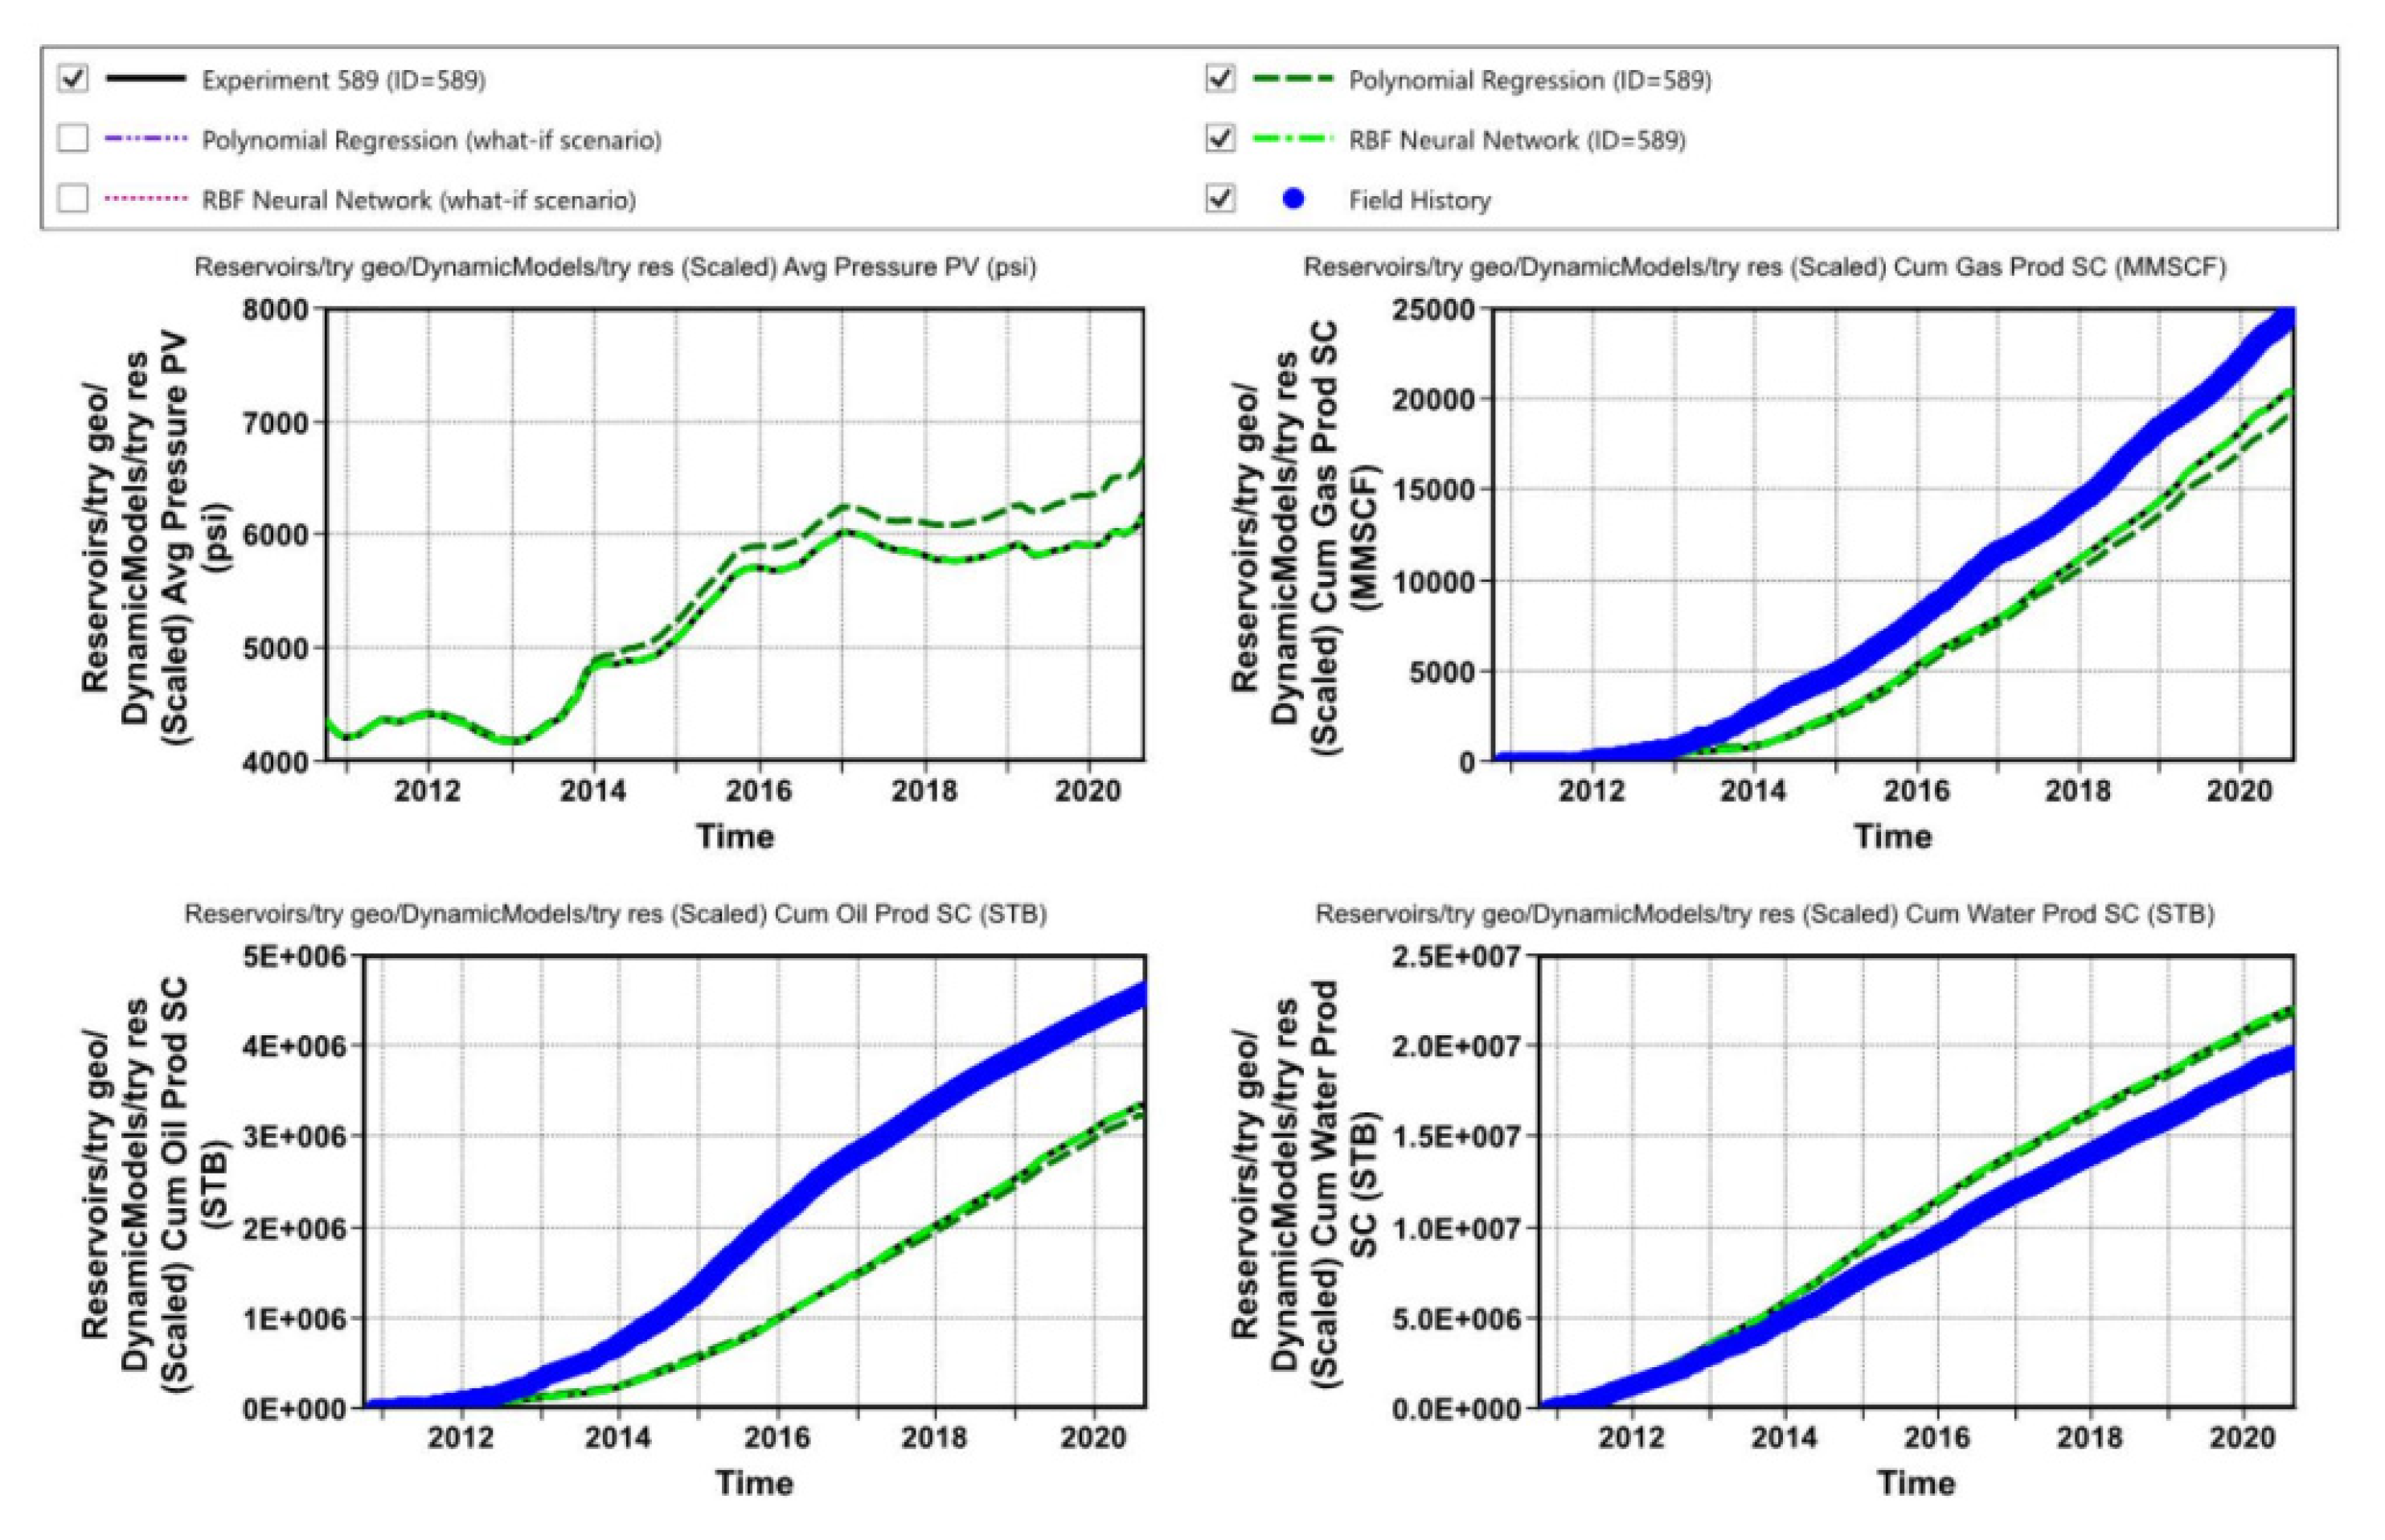
Figure 8.
Sobol Analysis of the Effect of each Parameter on Cumulative Oil Produced.
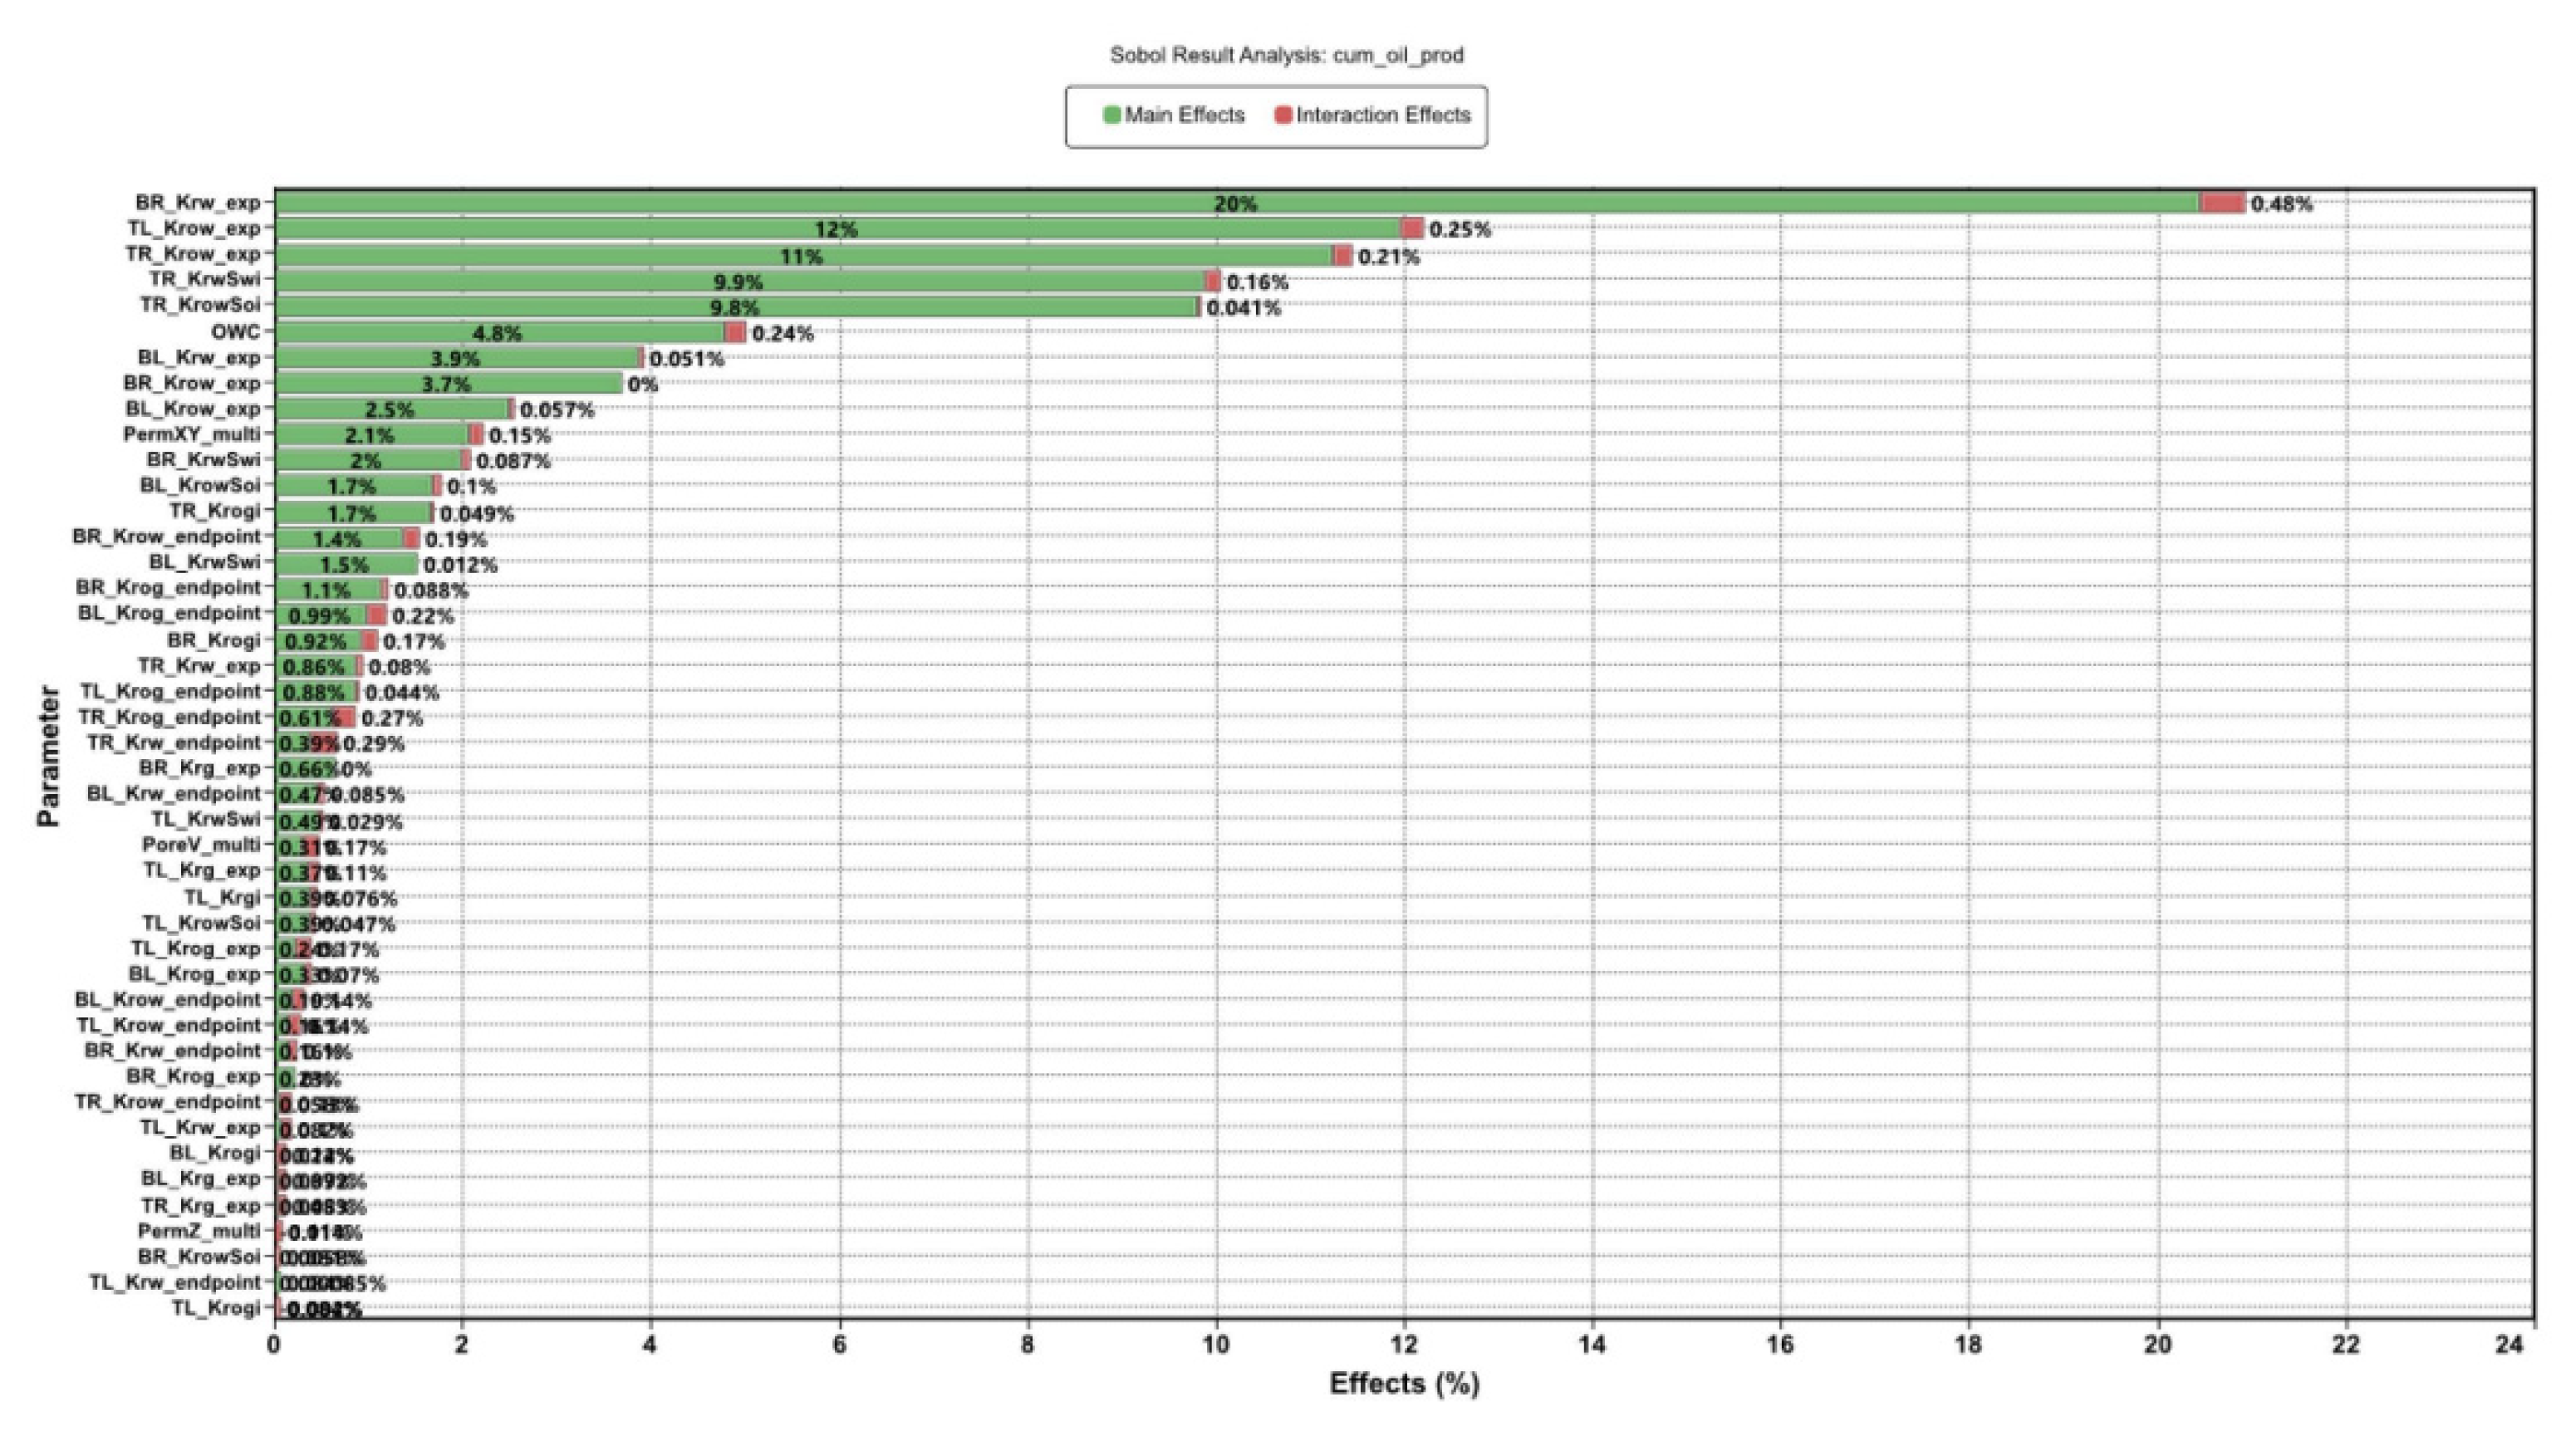
Figure 9.
(a) Liquid production rate history matching; (b) Water production rate history matching; (c) Oil production rate history matching; (d) Gas production rate history matching.
Figure 9.
(a) Liquid production rate history matching; (b) Water production rate history matching; (c) Oil production rate history matching; (d) Gas production rate history matching.
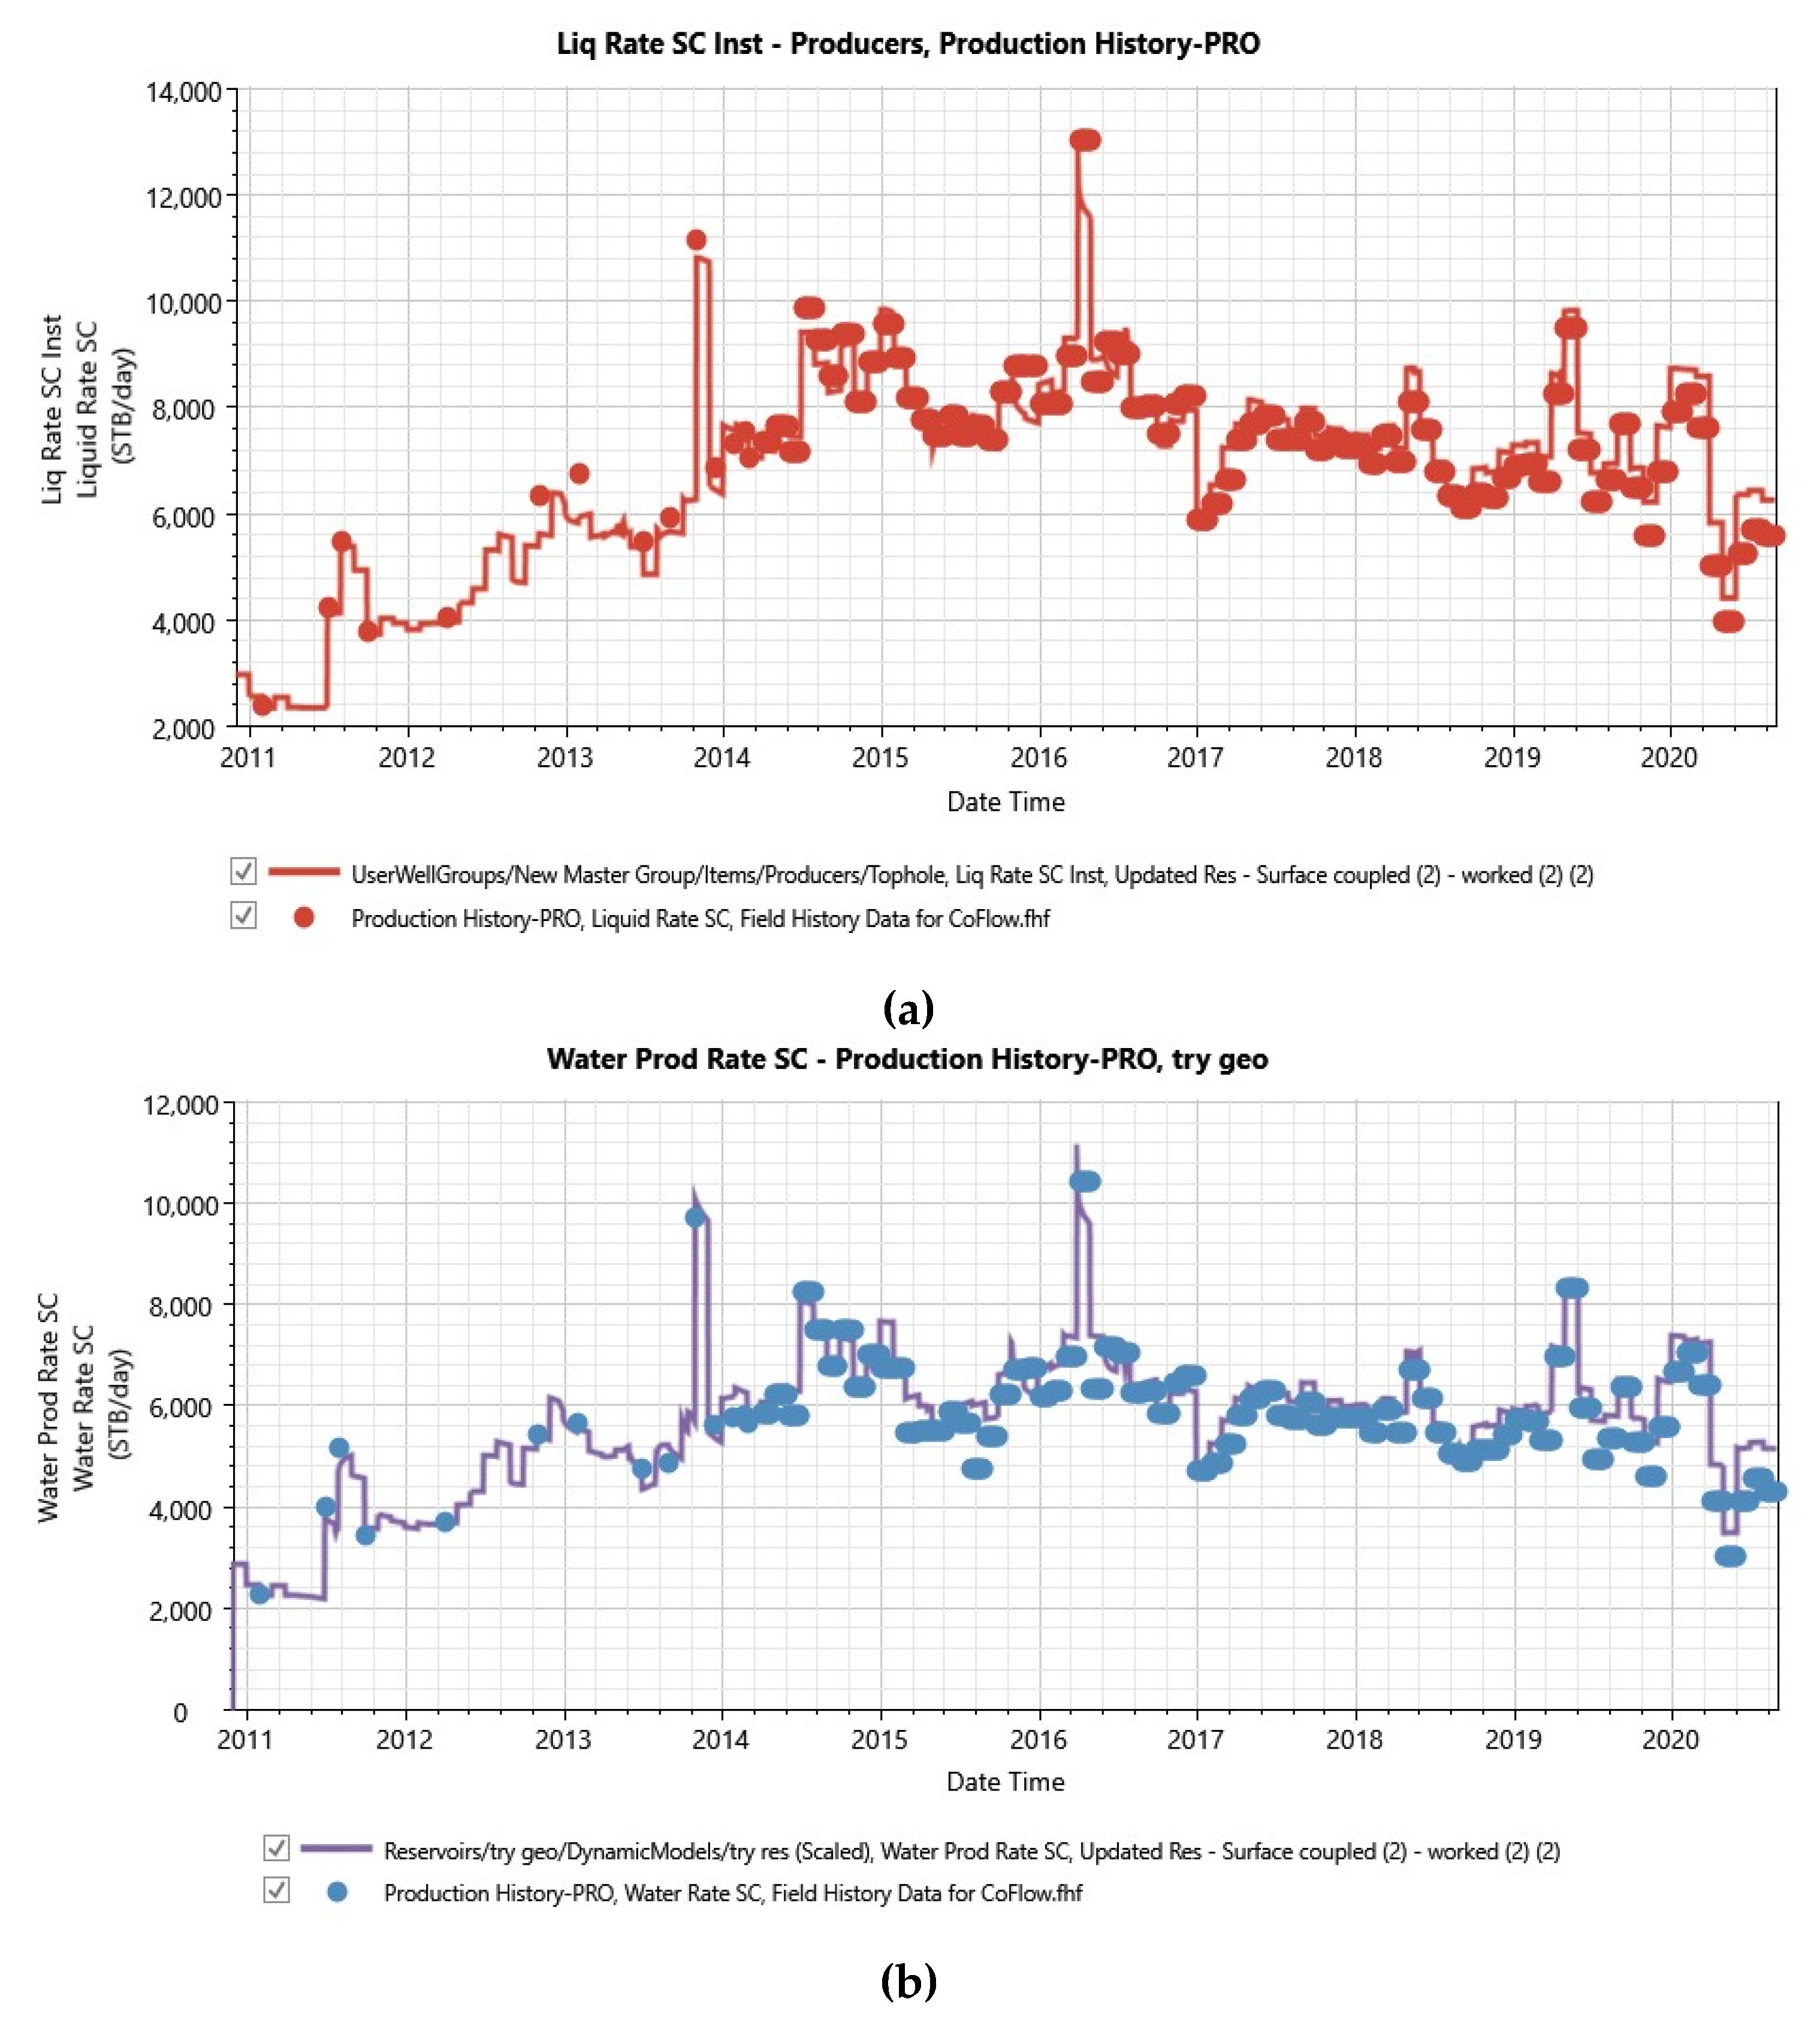
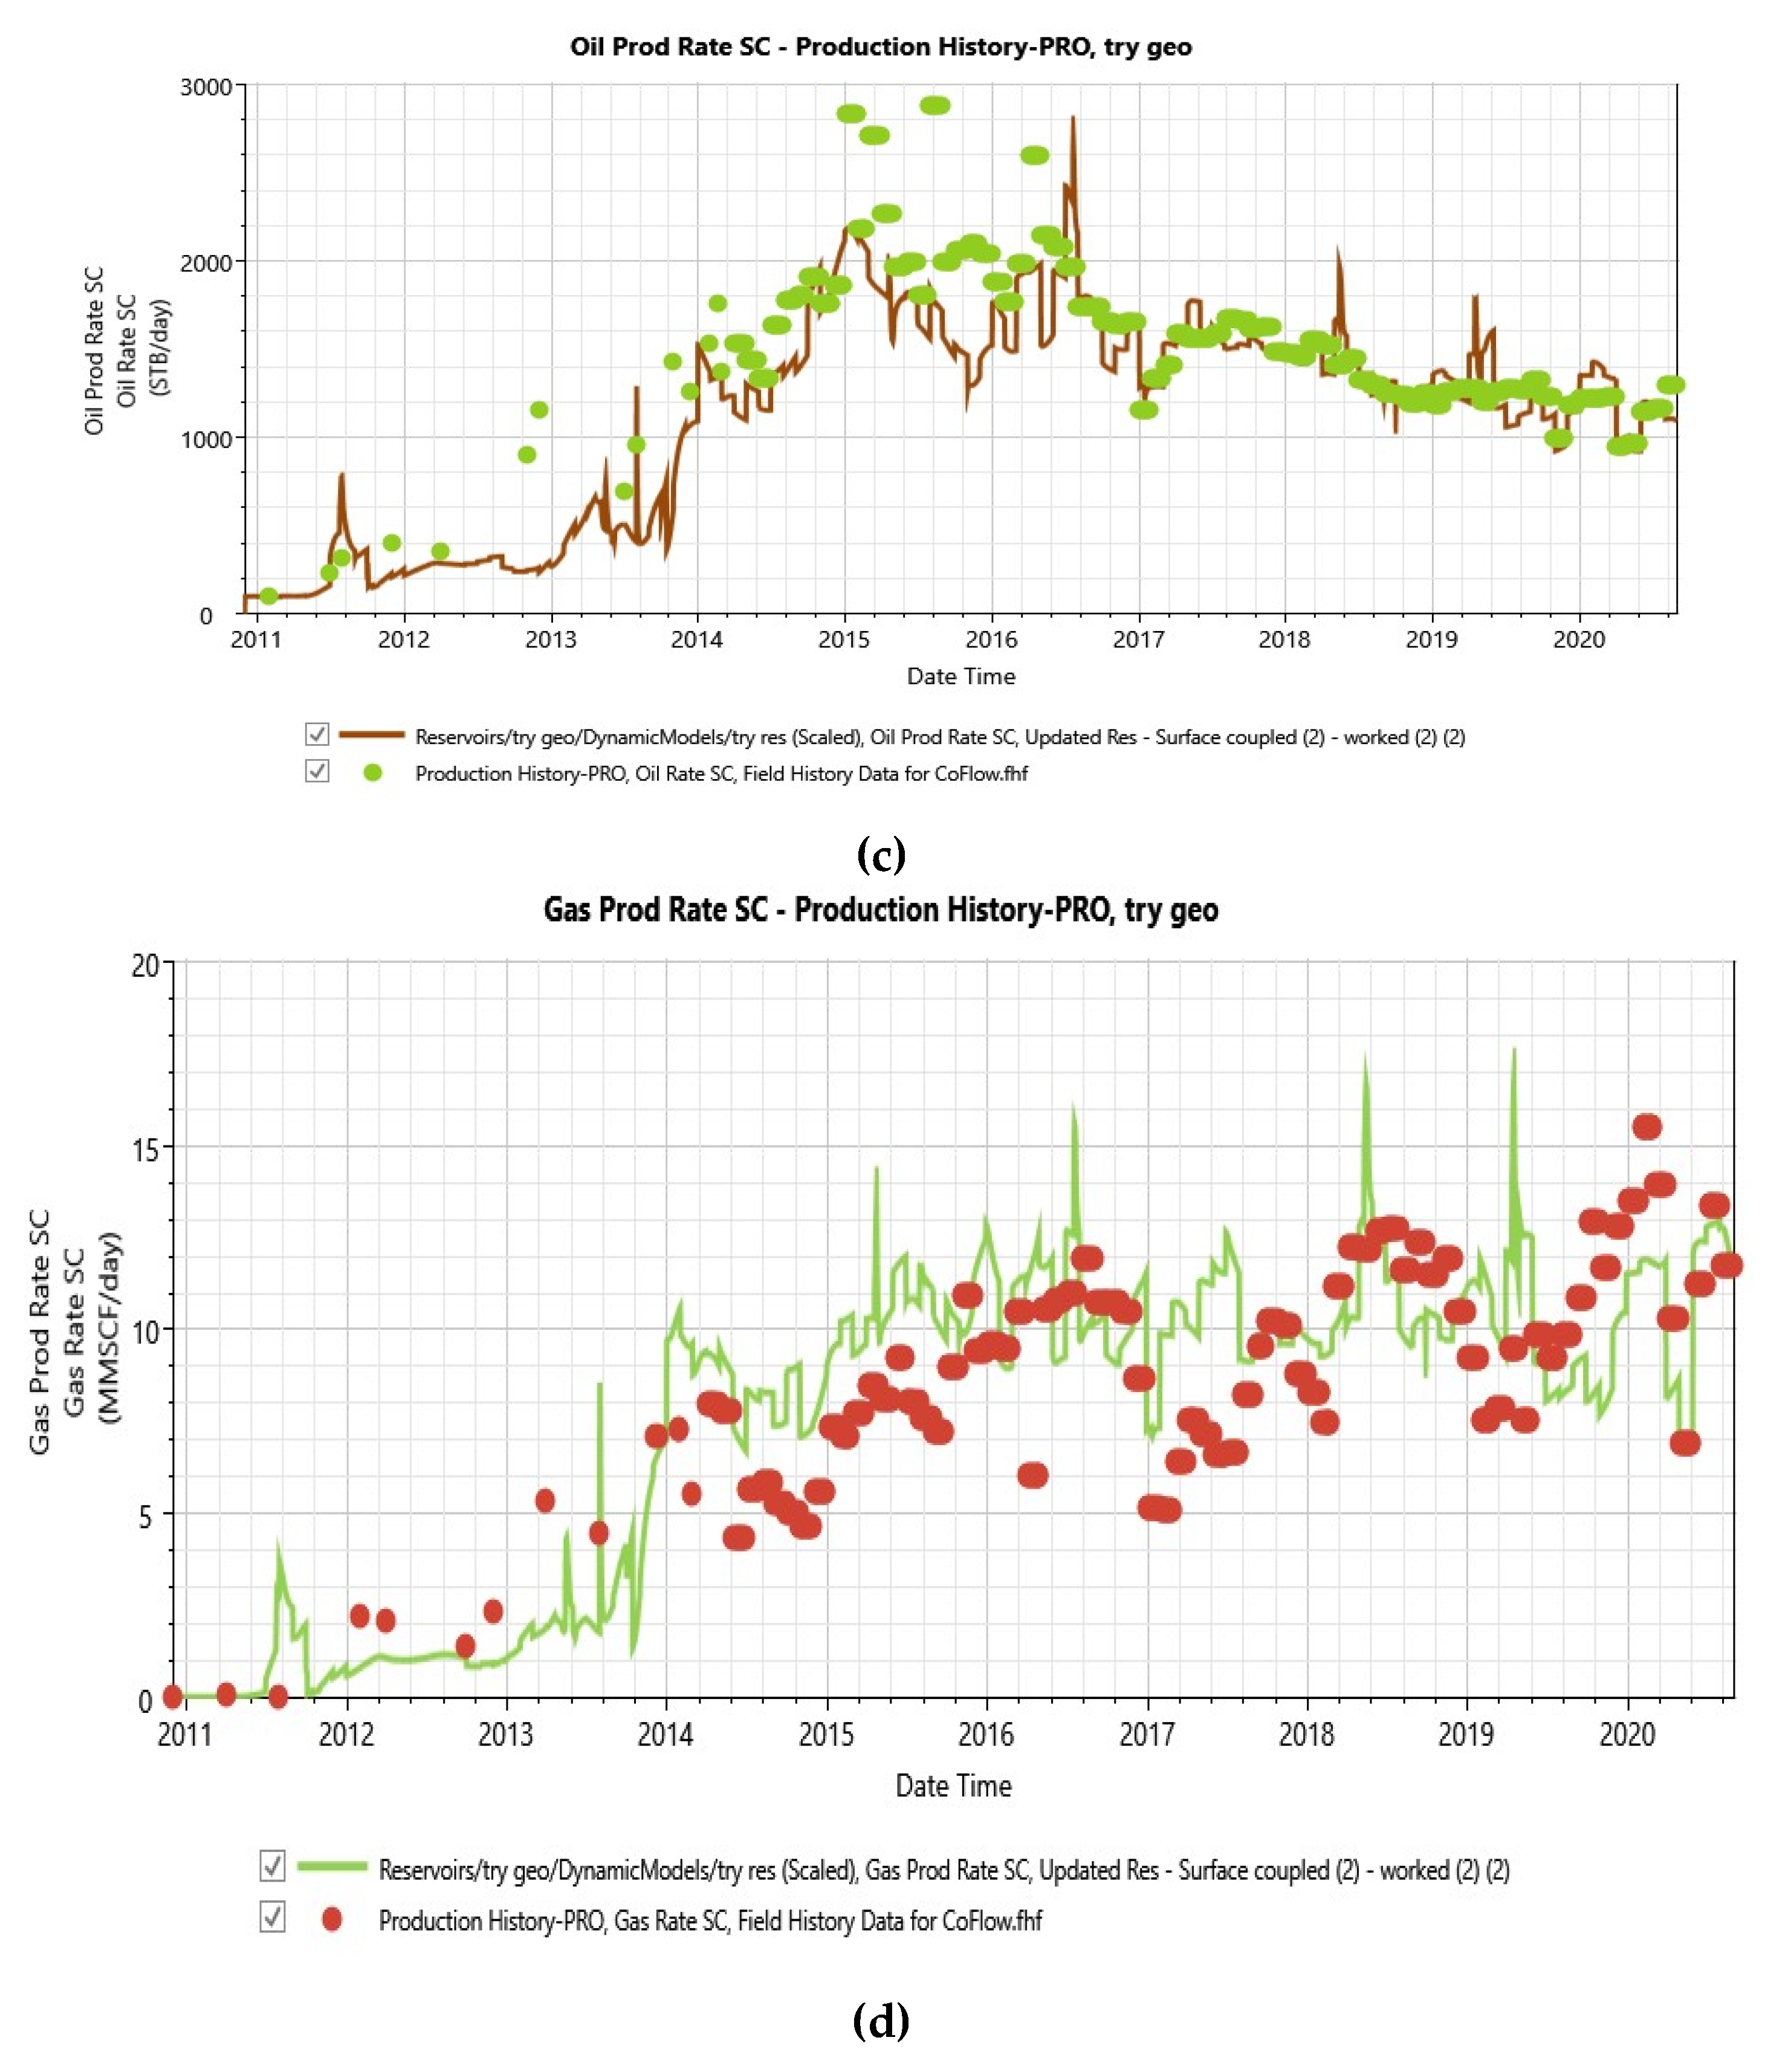
Figure 10.
Do-Nothing Forecasted Cumulative Oil Production.
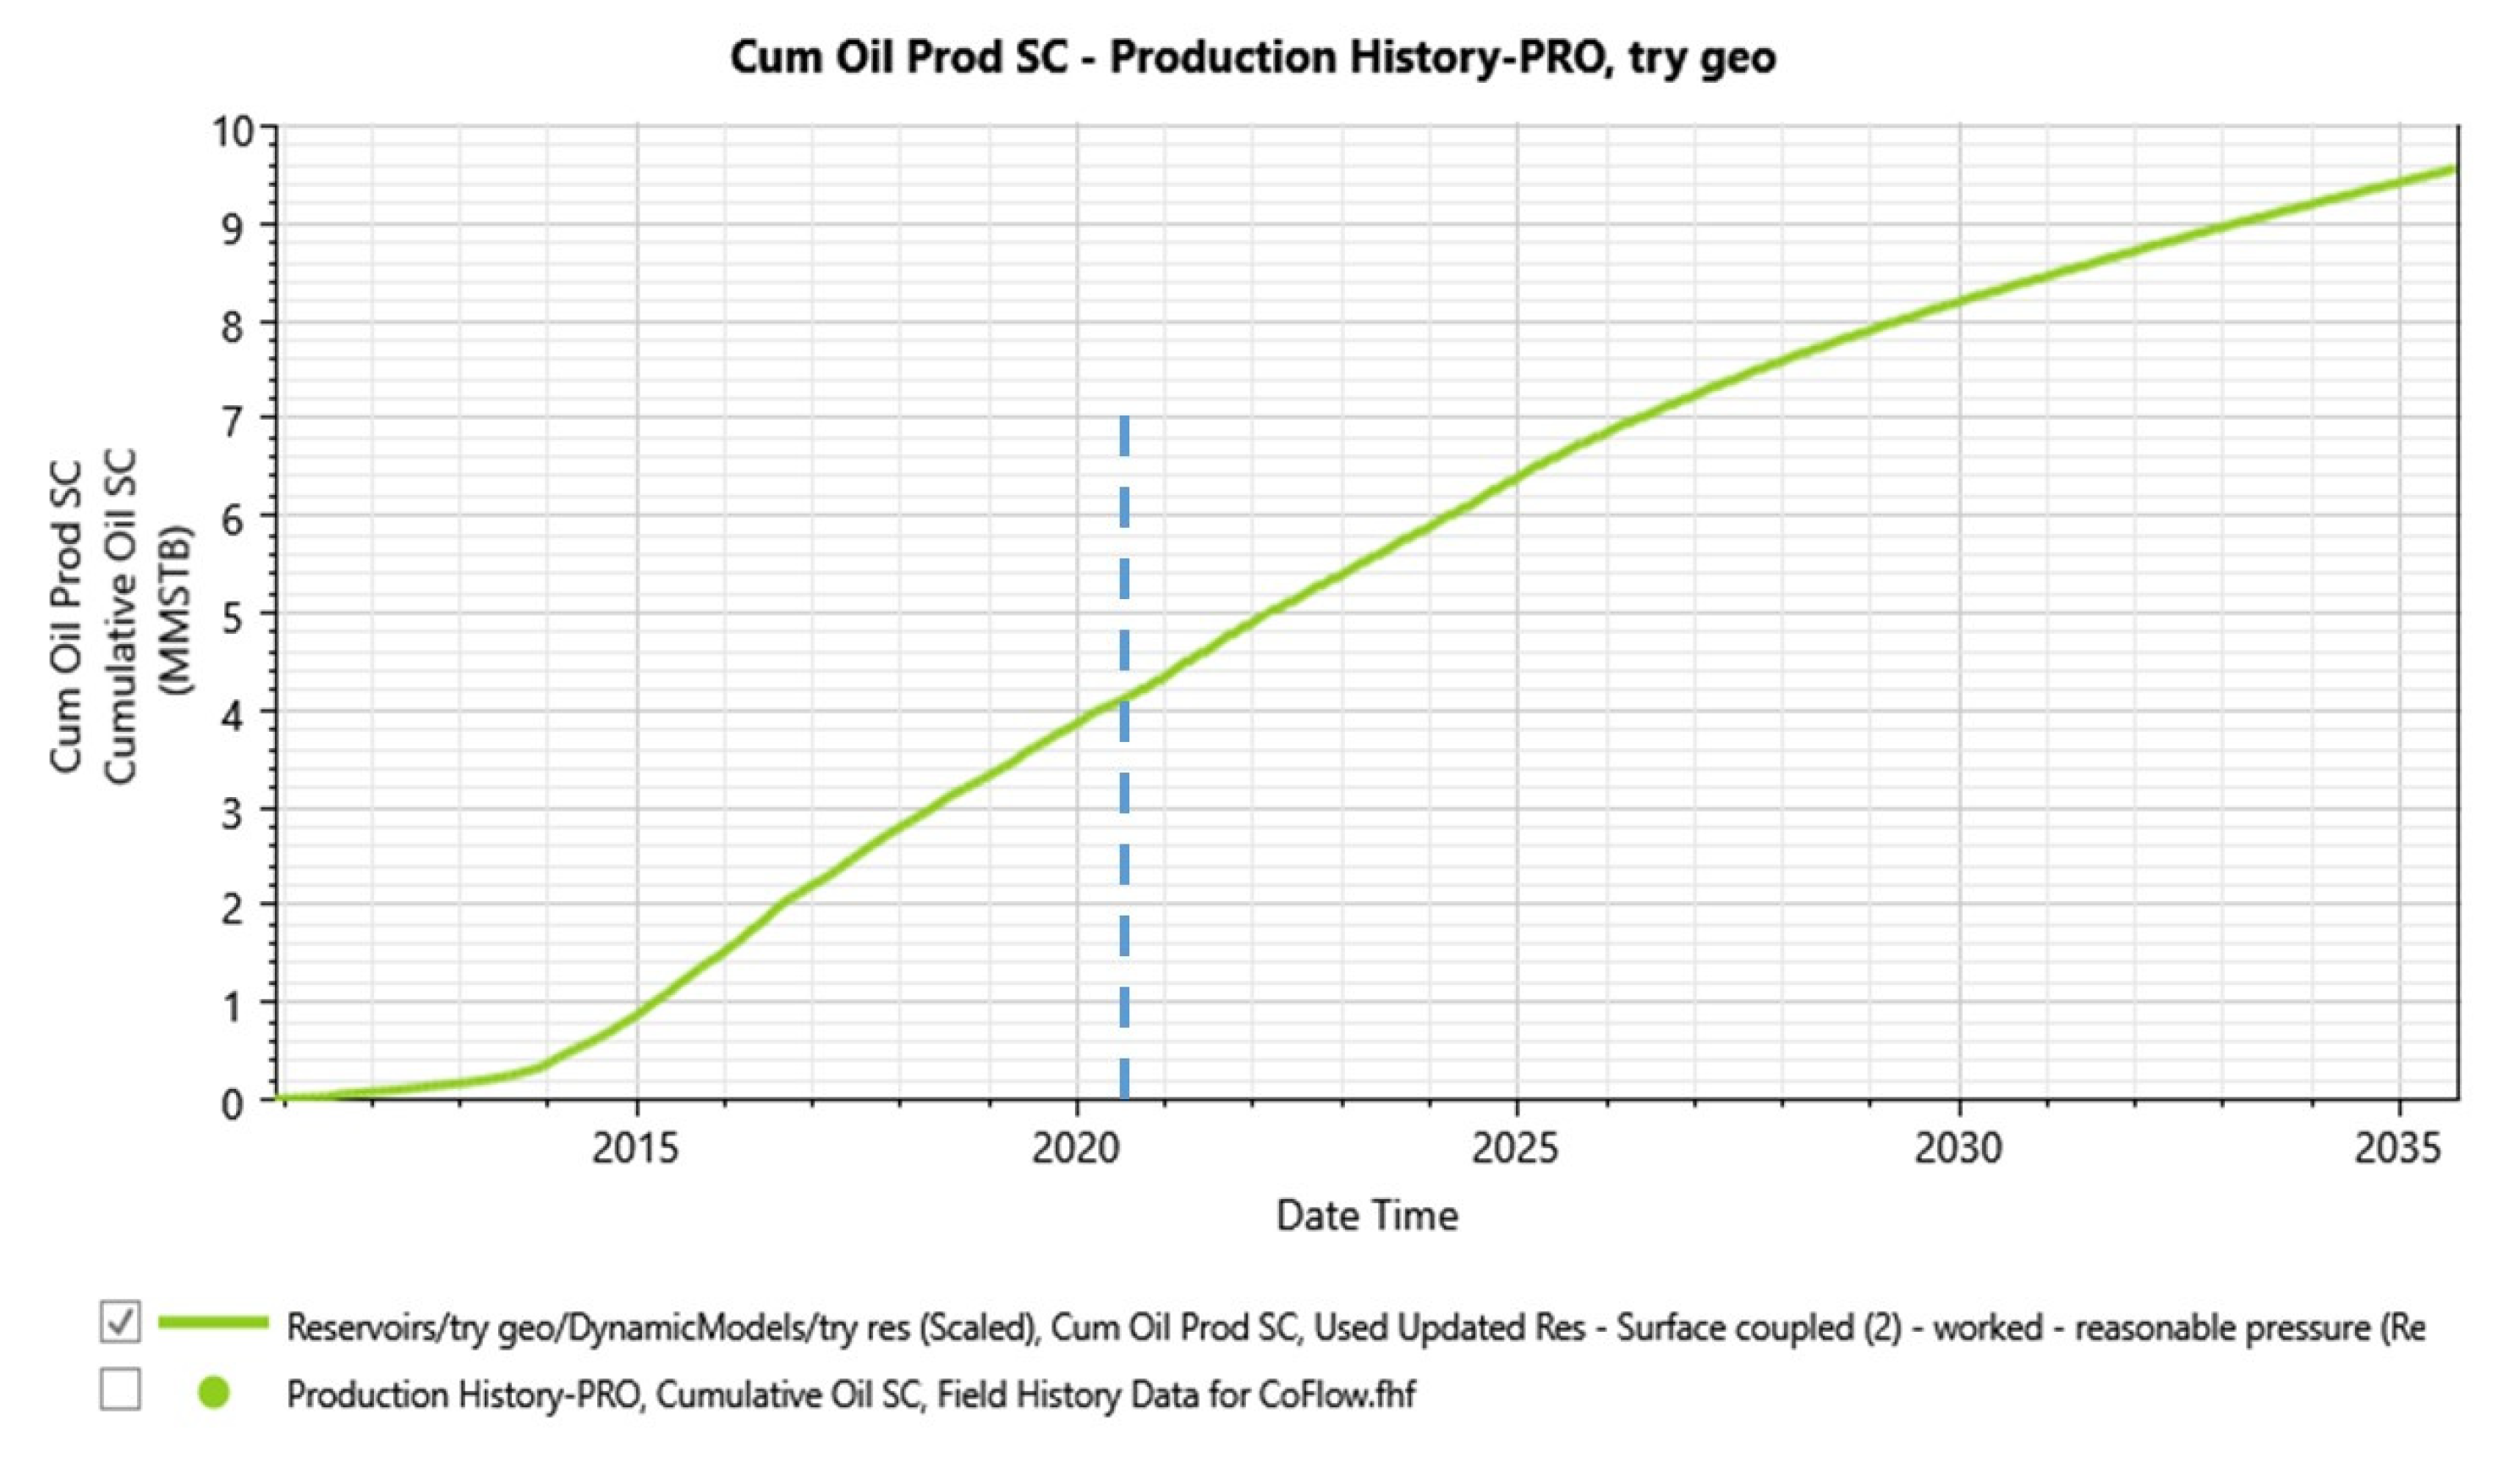
Figure 11.
Do-Nothing Forecasted Water Production Rate.
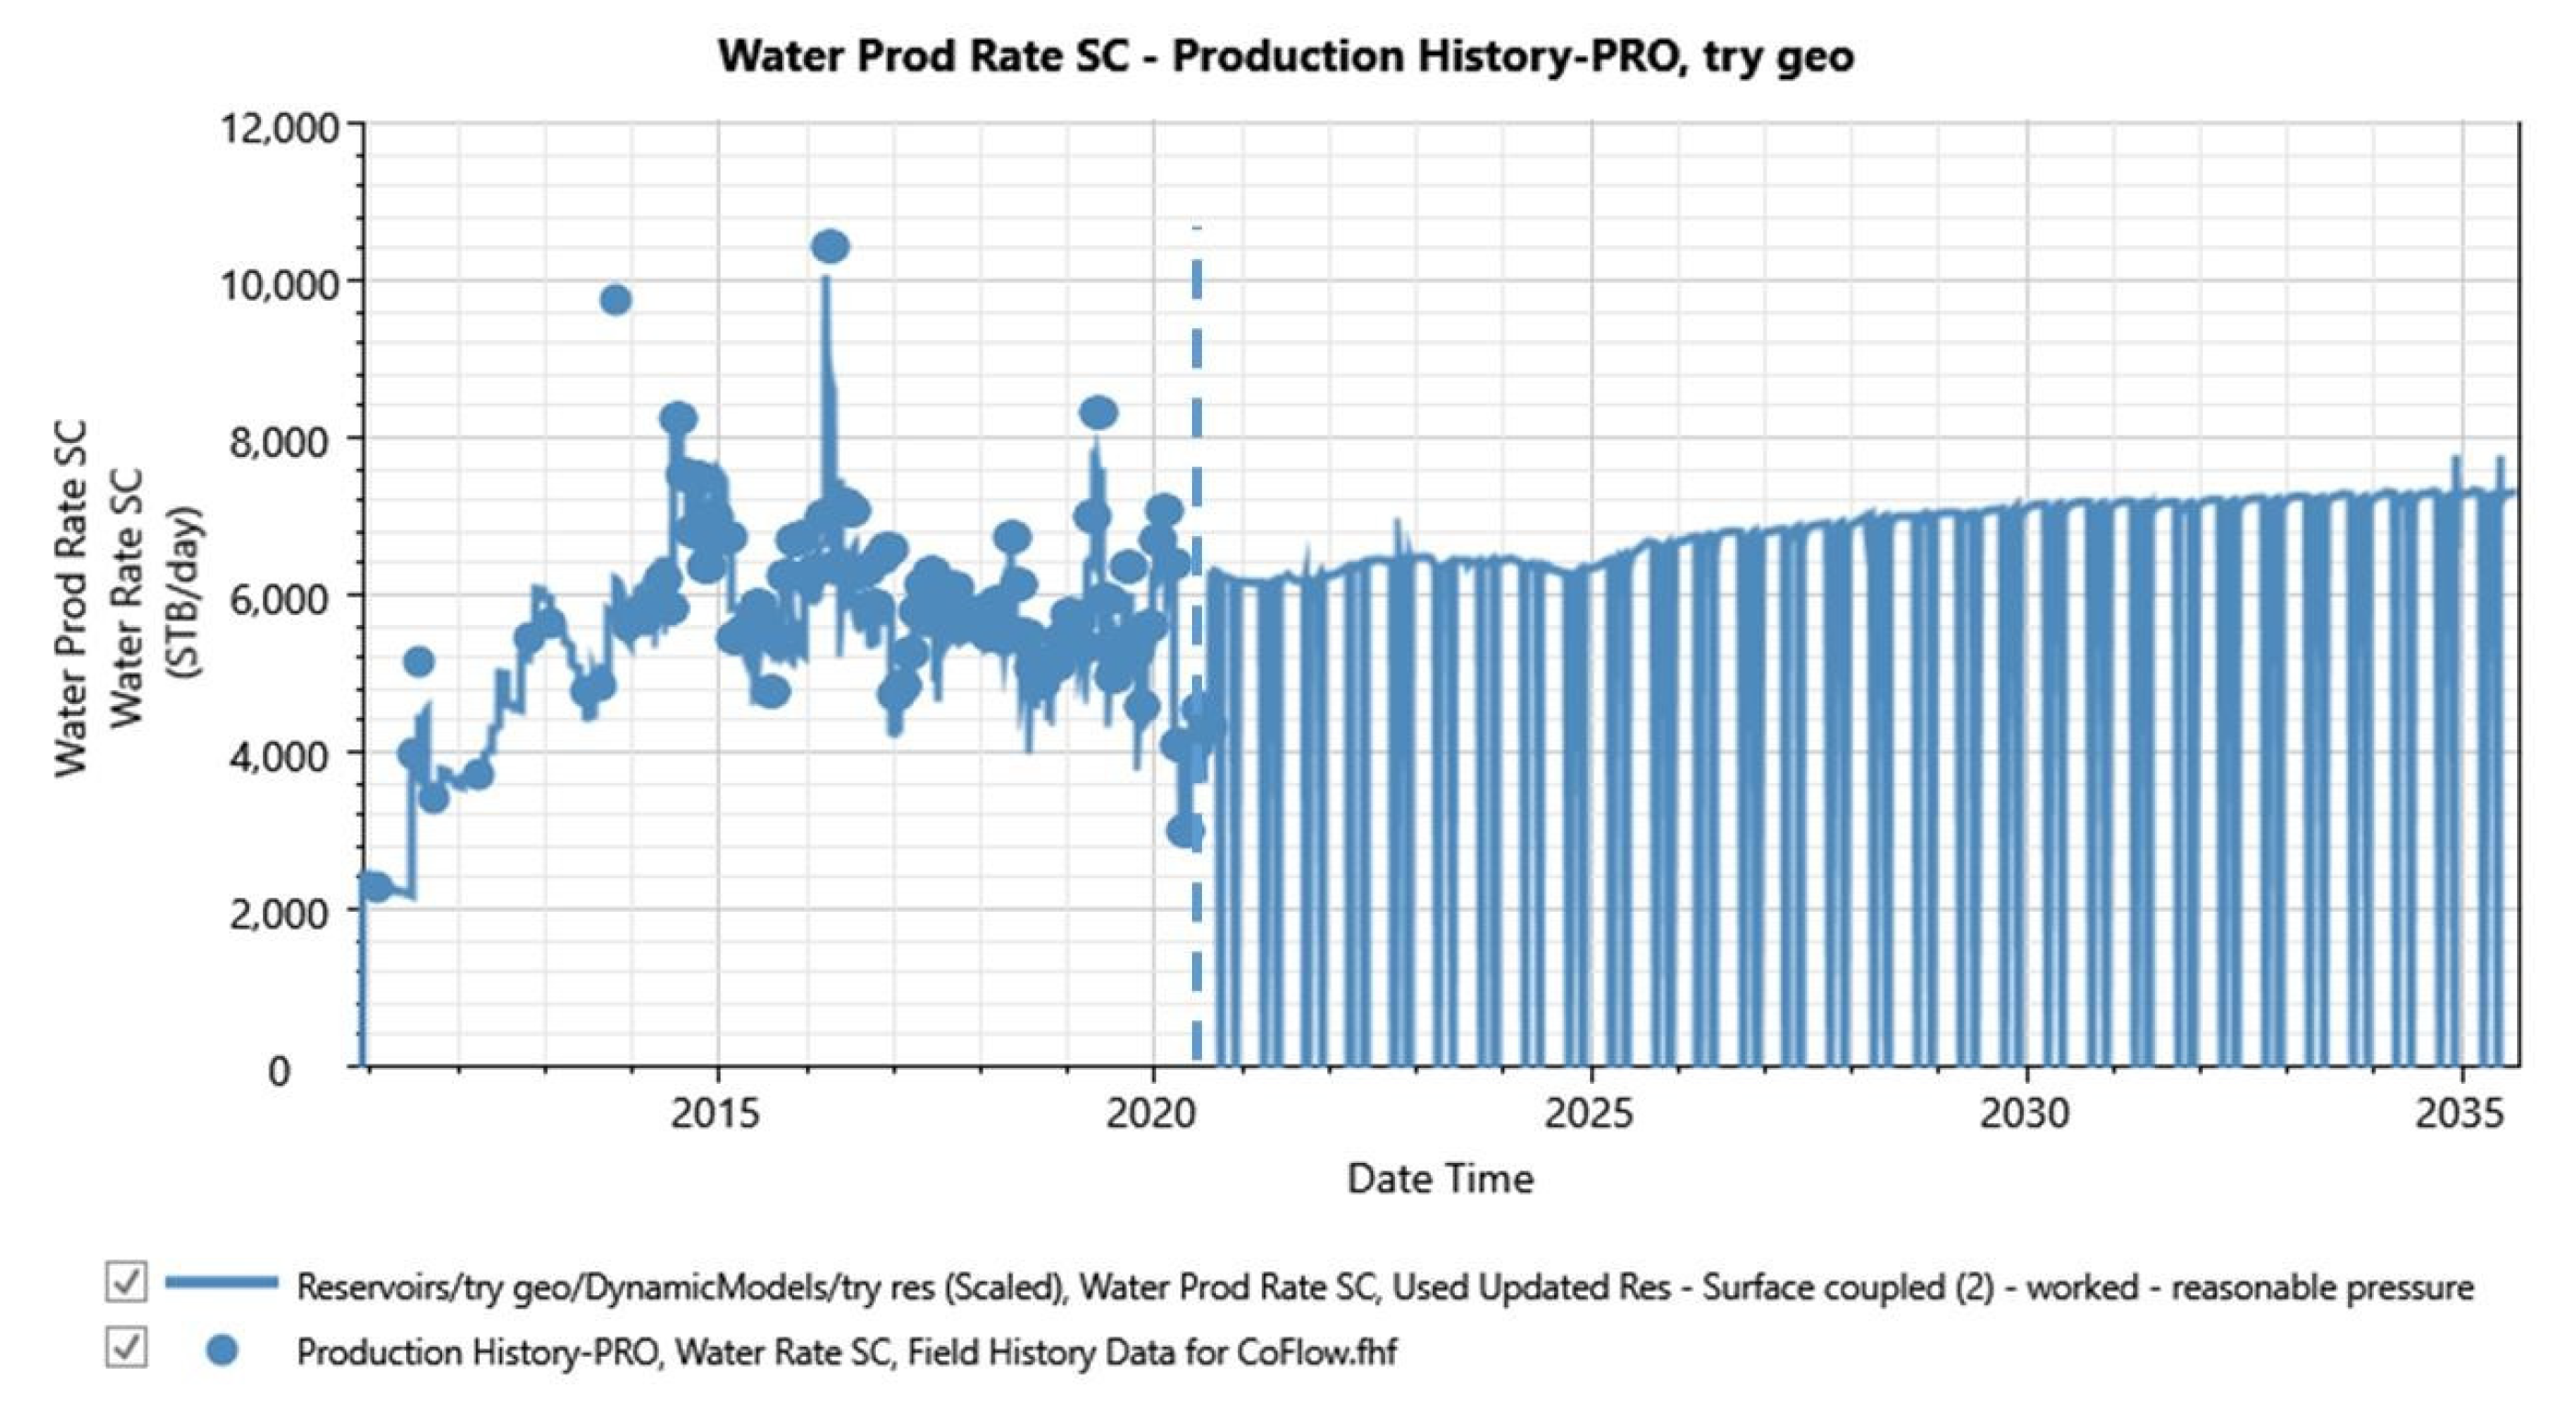
Figure 15.
Cumulative Water Production for Development Strategy.
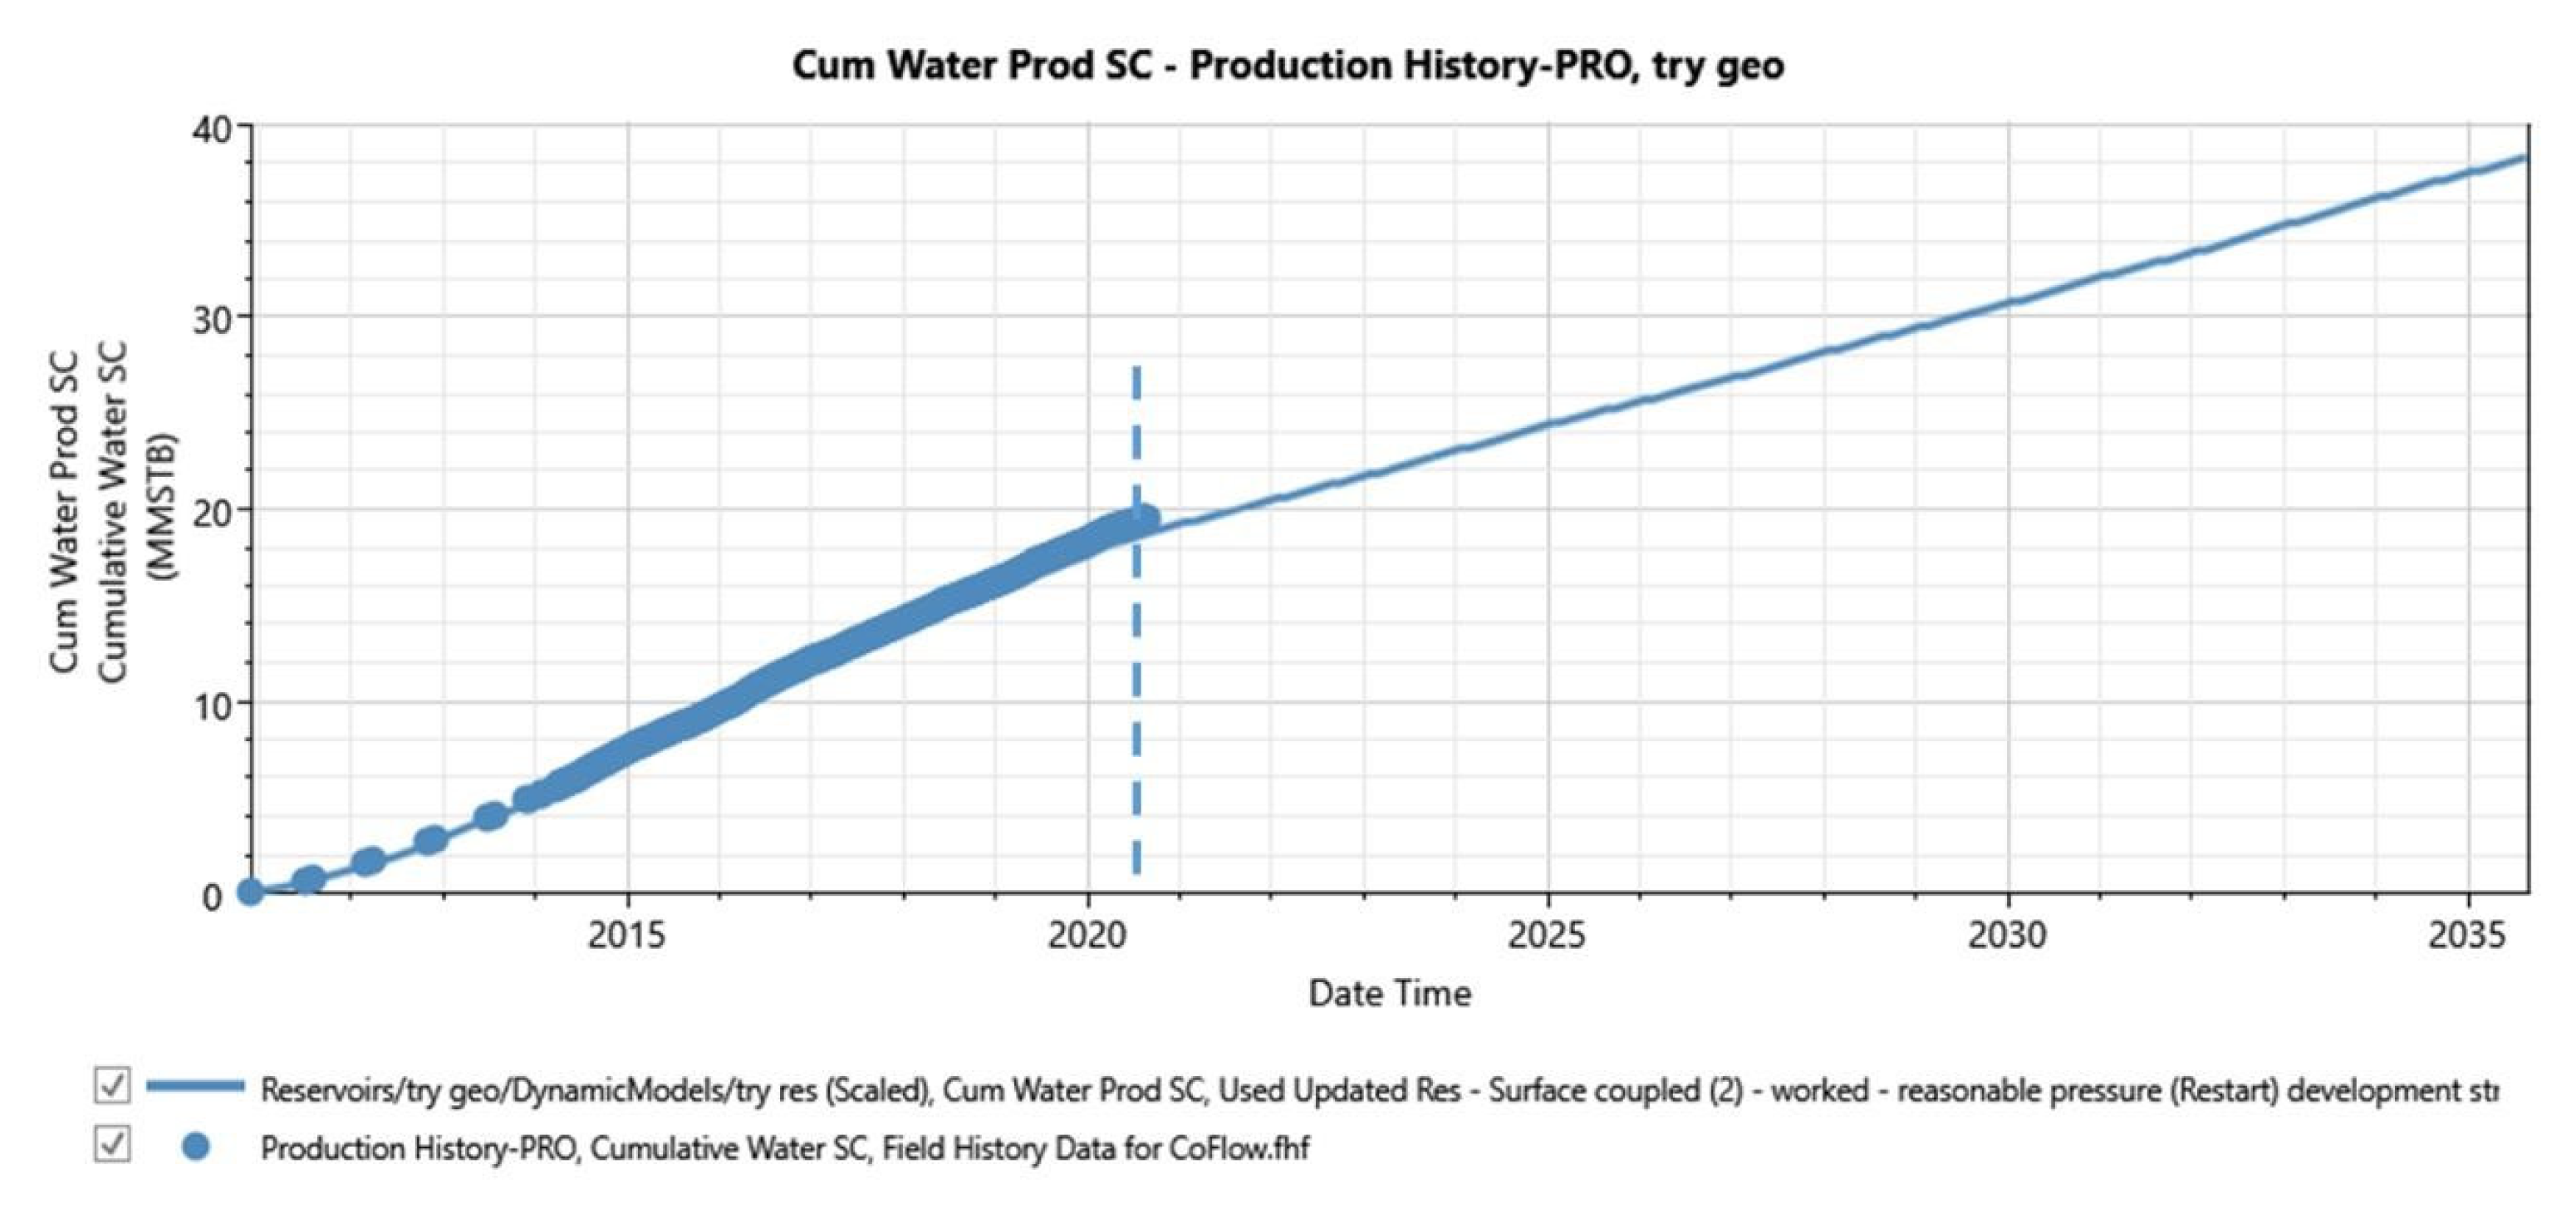
Figure 16.
Gas Production Rate for Development Strategy.
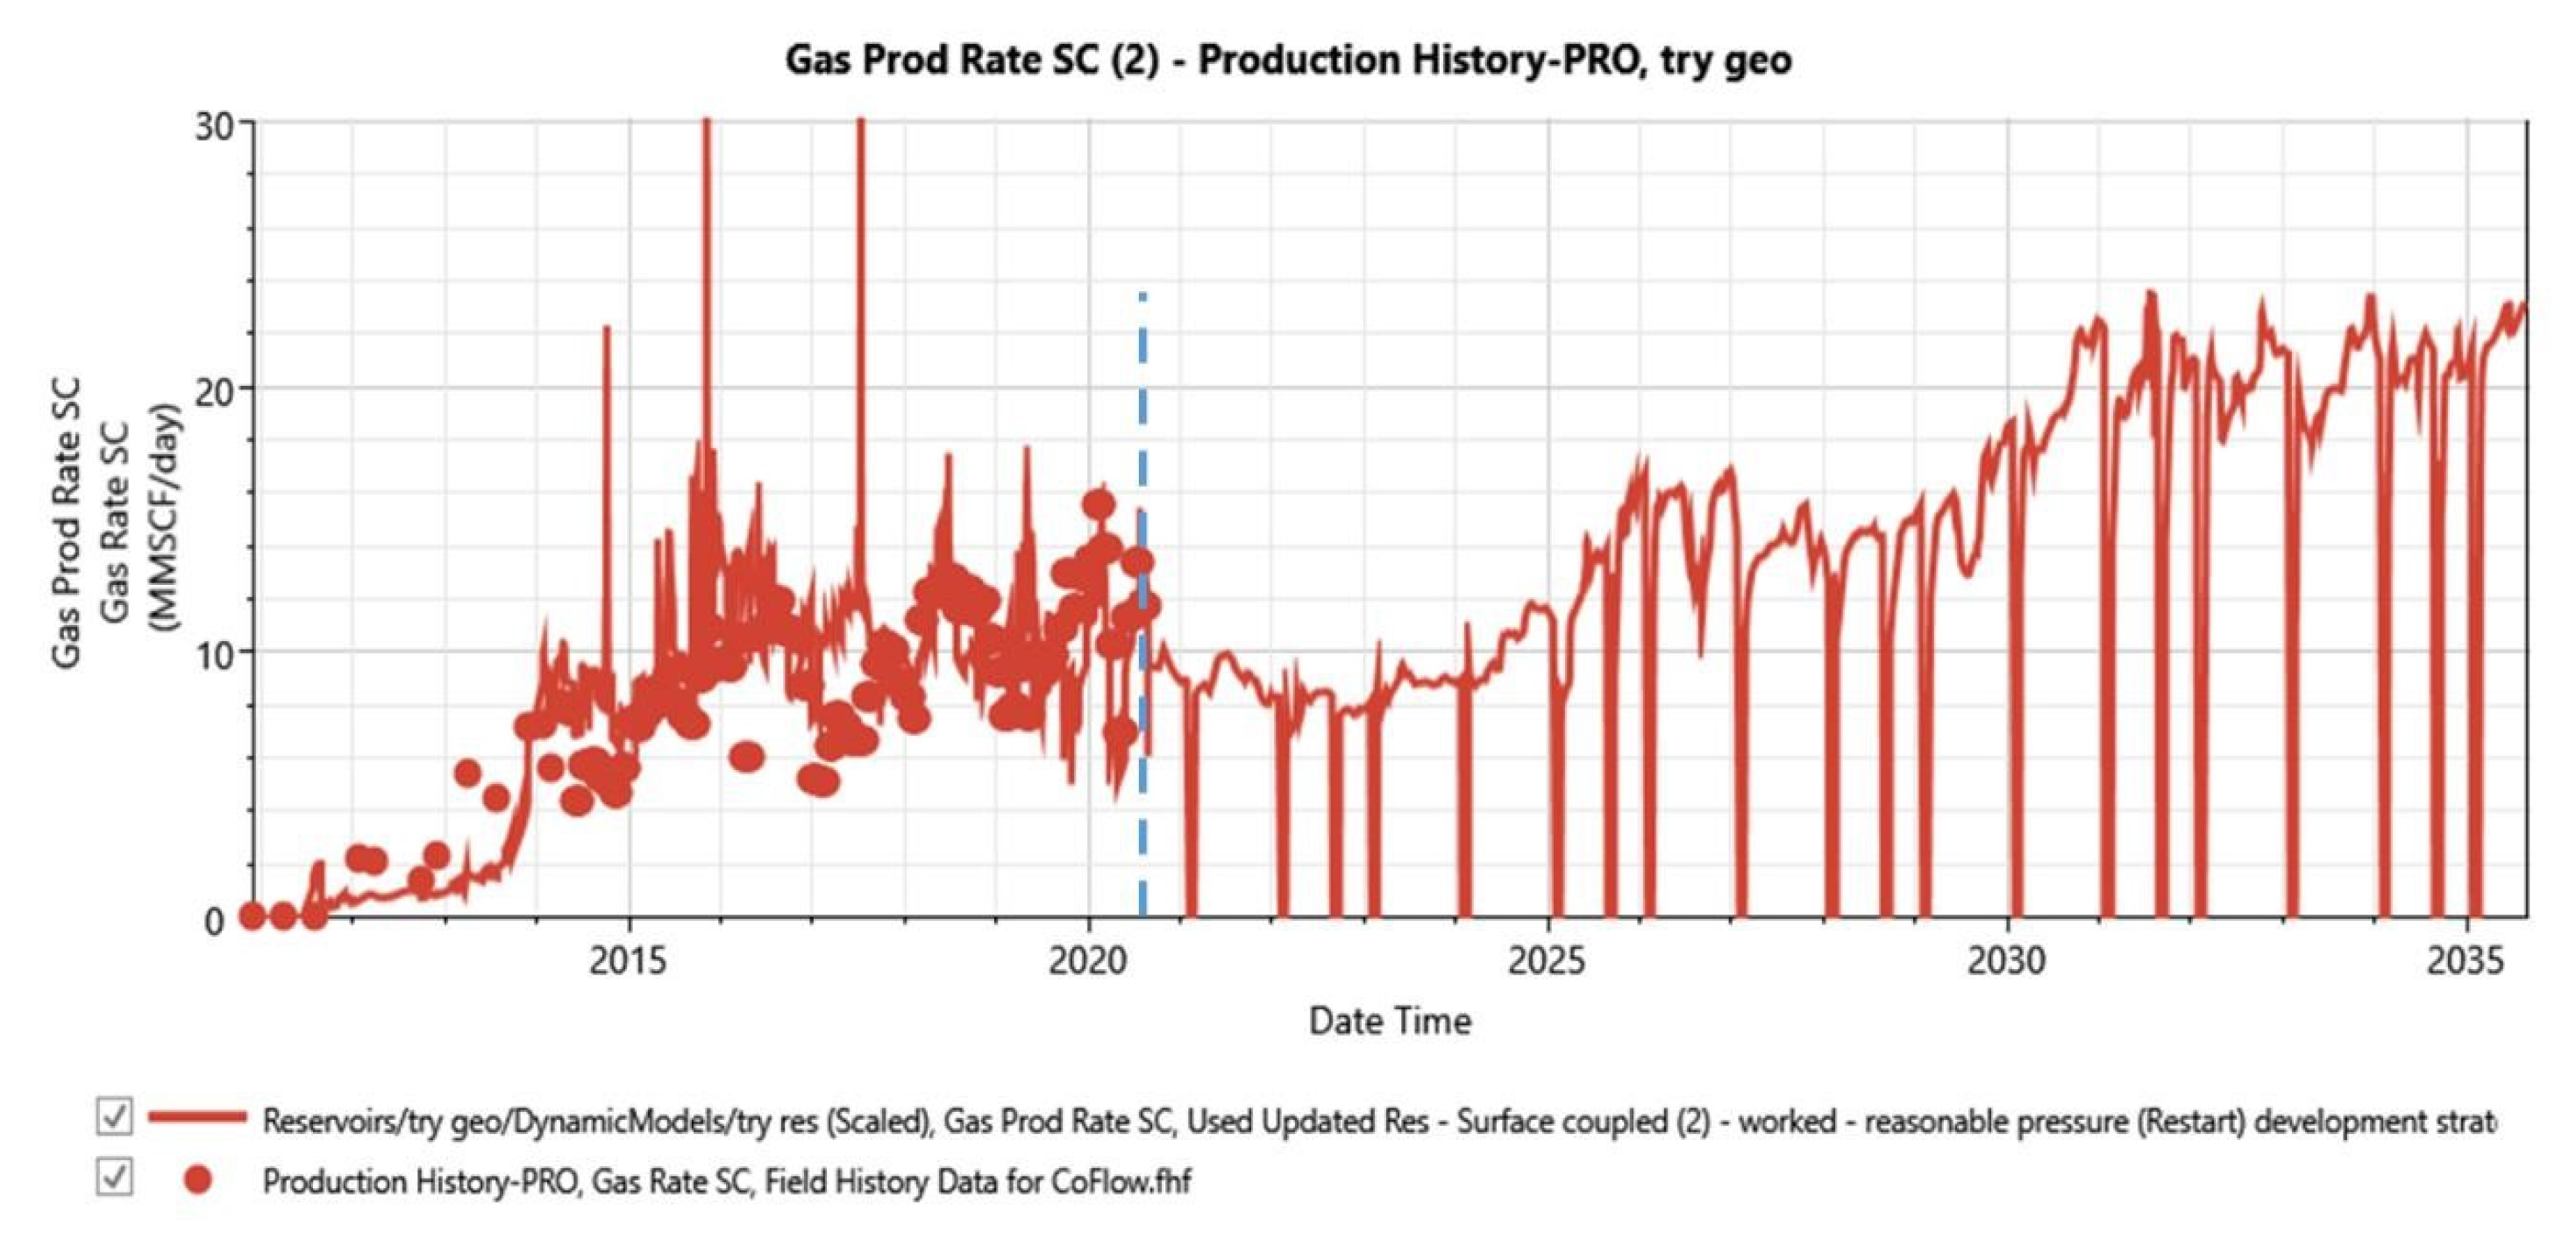
Figure 17.
Cumulative CO2 Stored for Development Strategy.
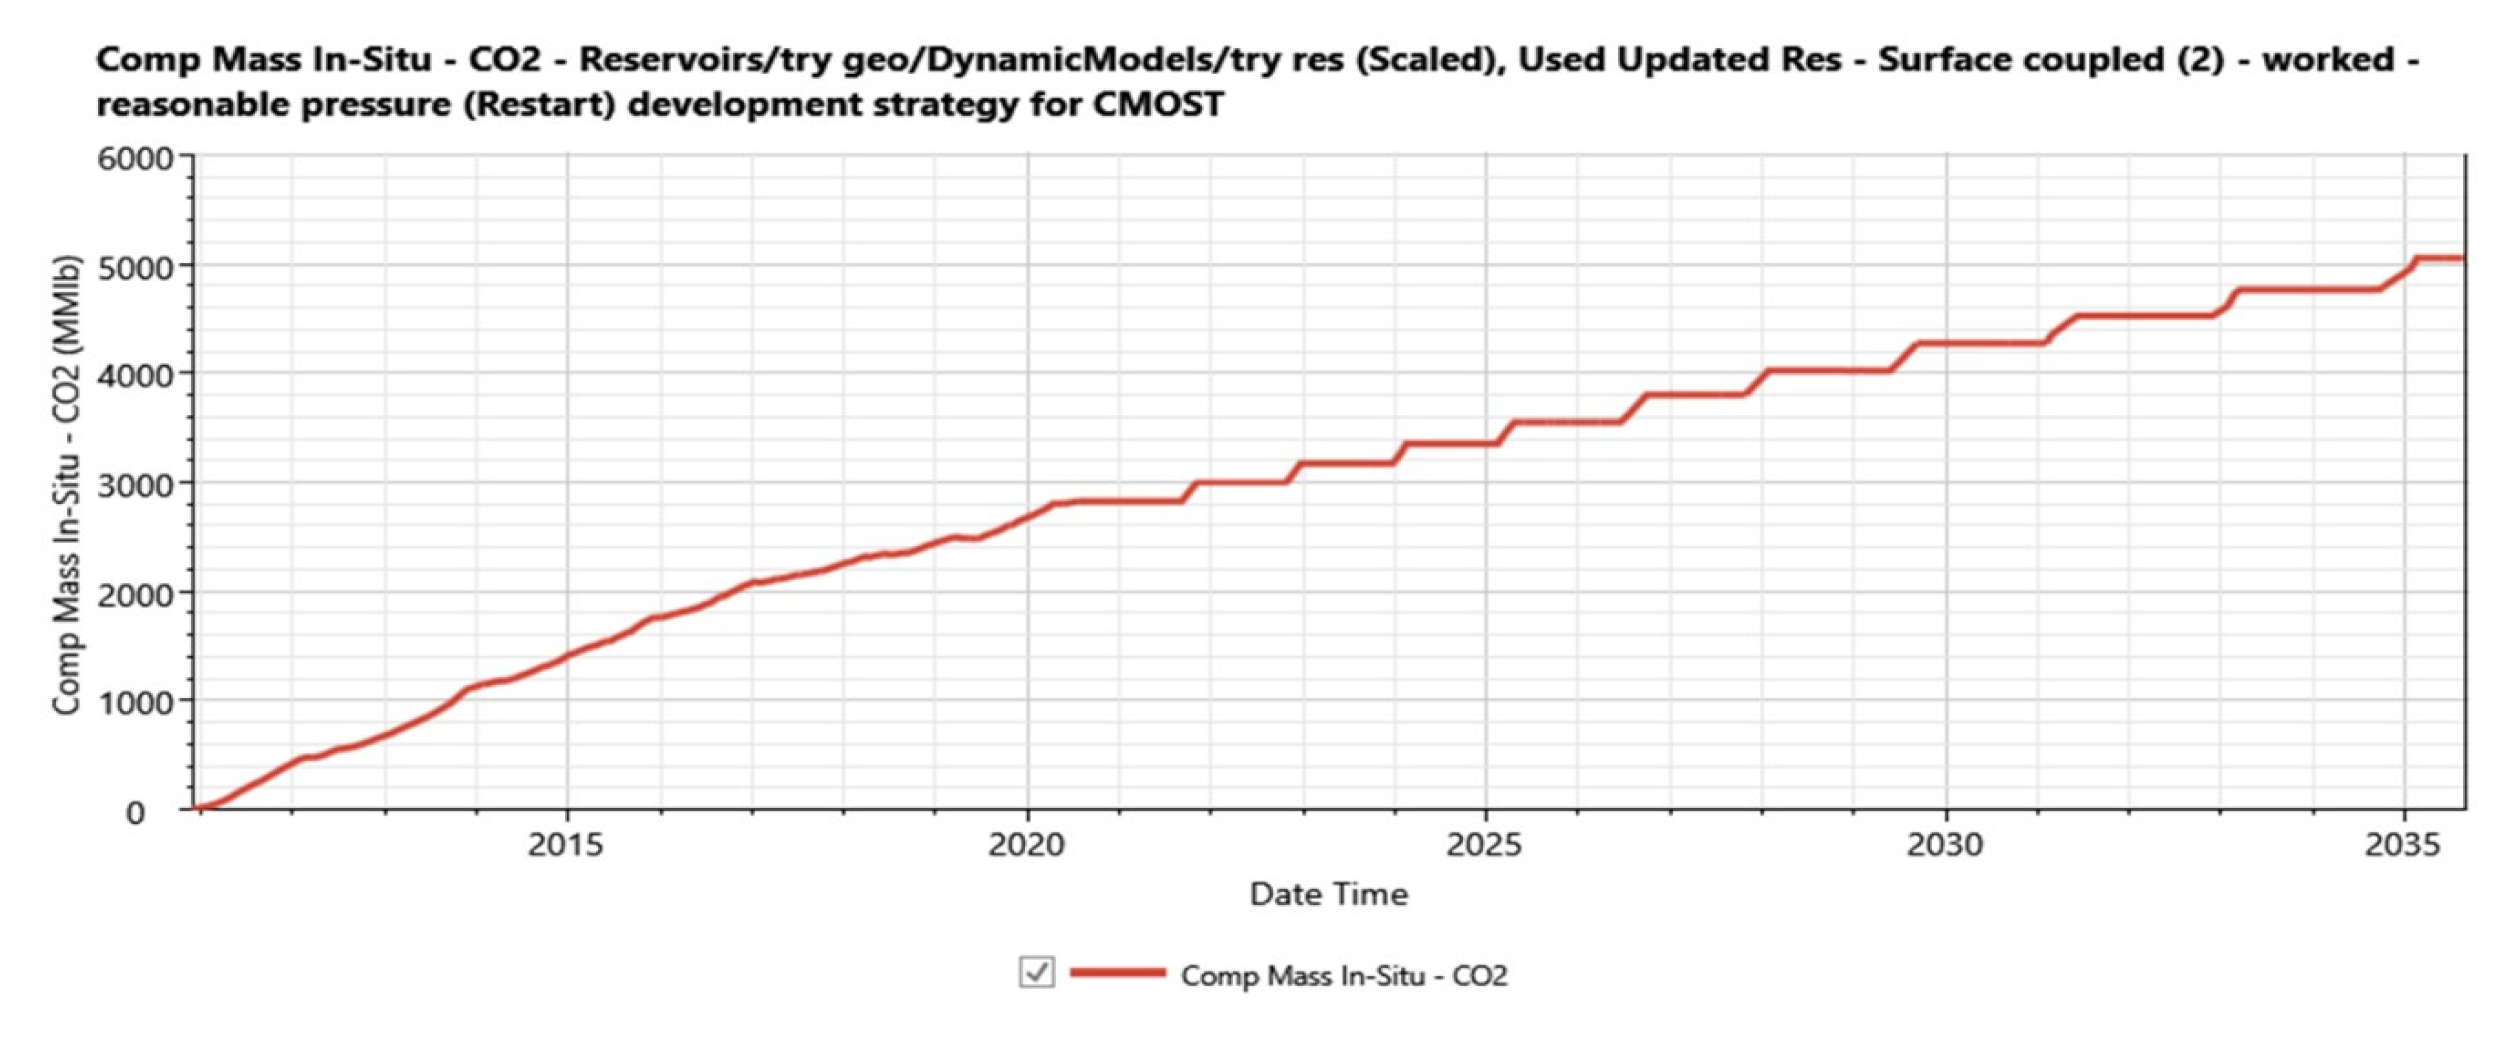
Figure 21.
Plot of Sobol Analysis for Cumulative Oil Produced.

Figure 22.
QQ-Plot of Proxy Model for CO2 Stored.
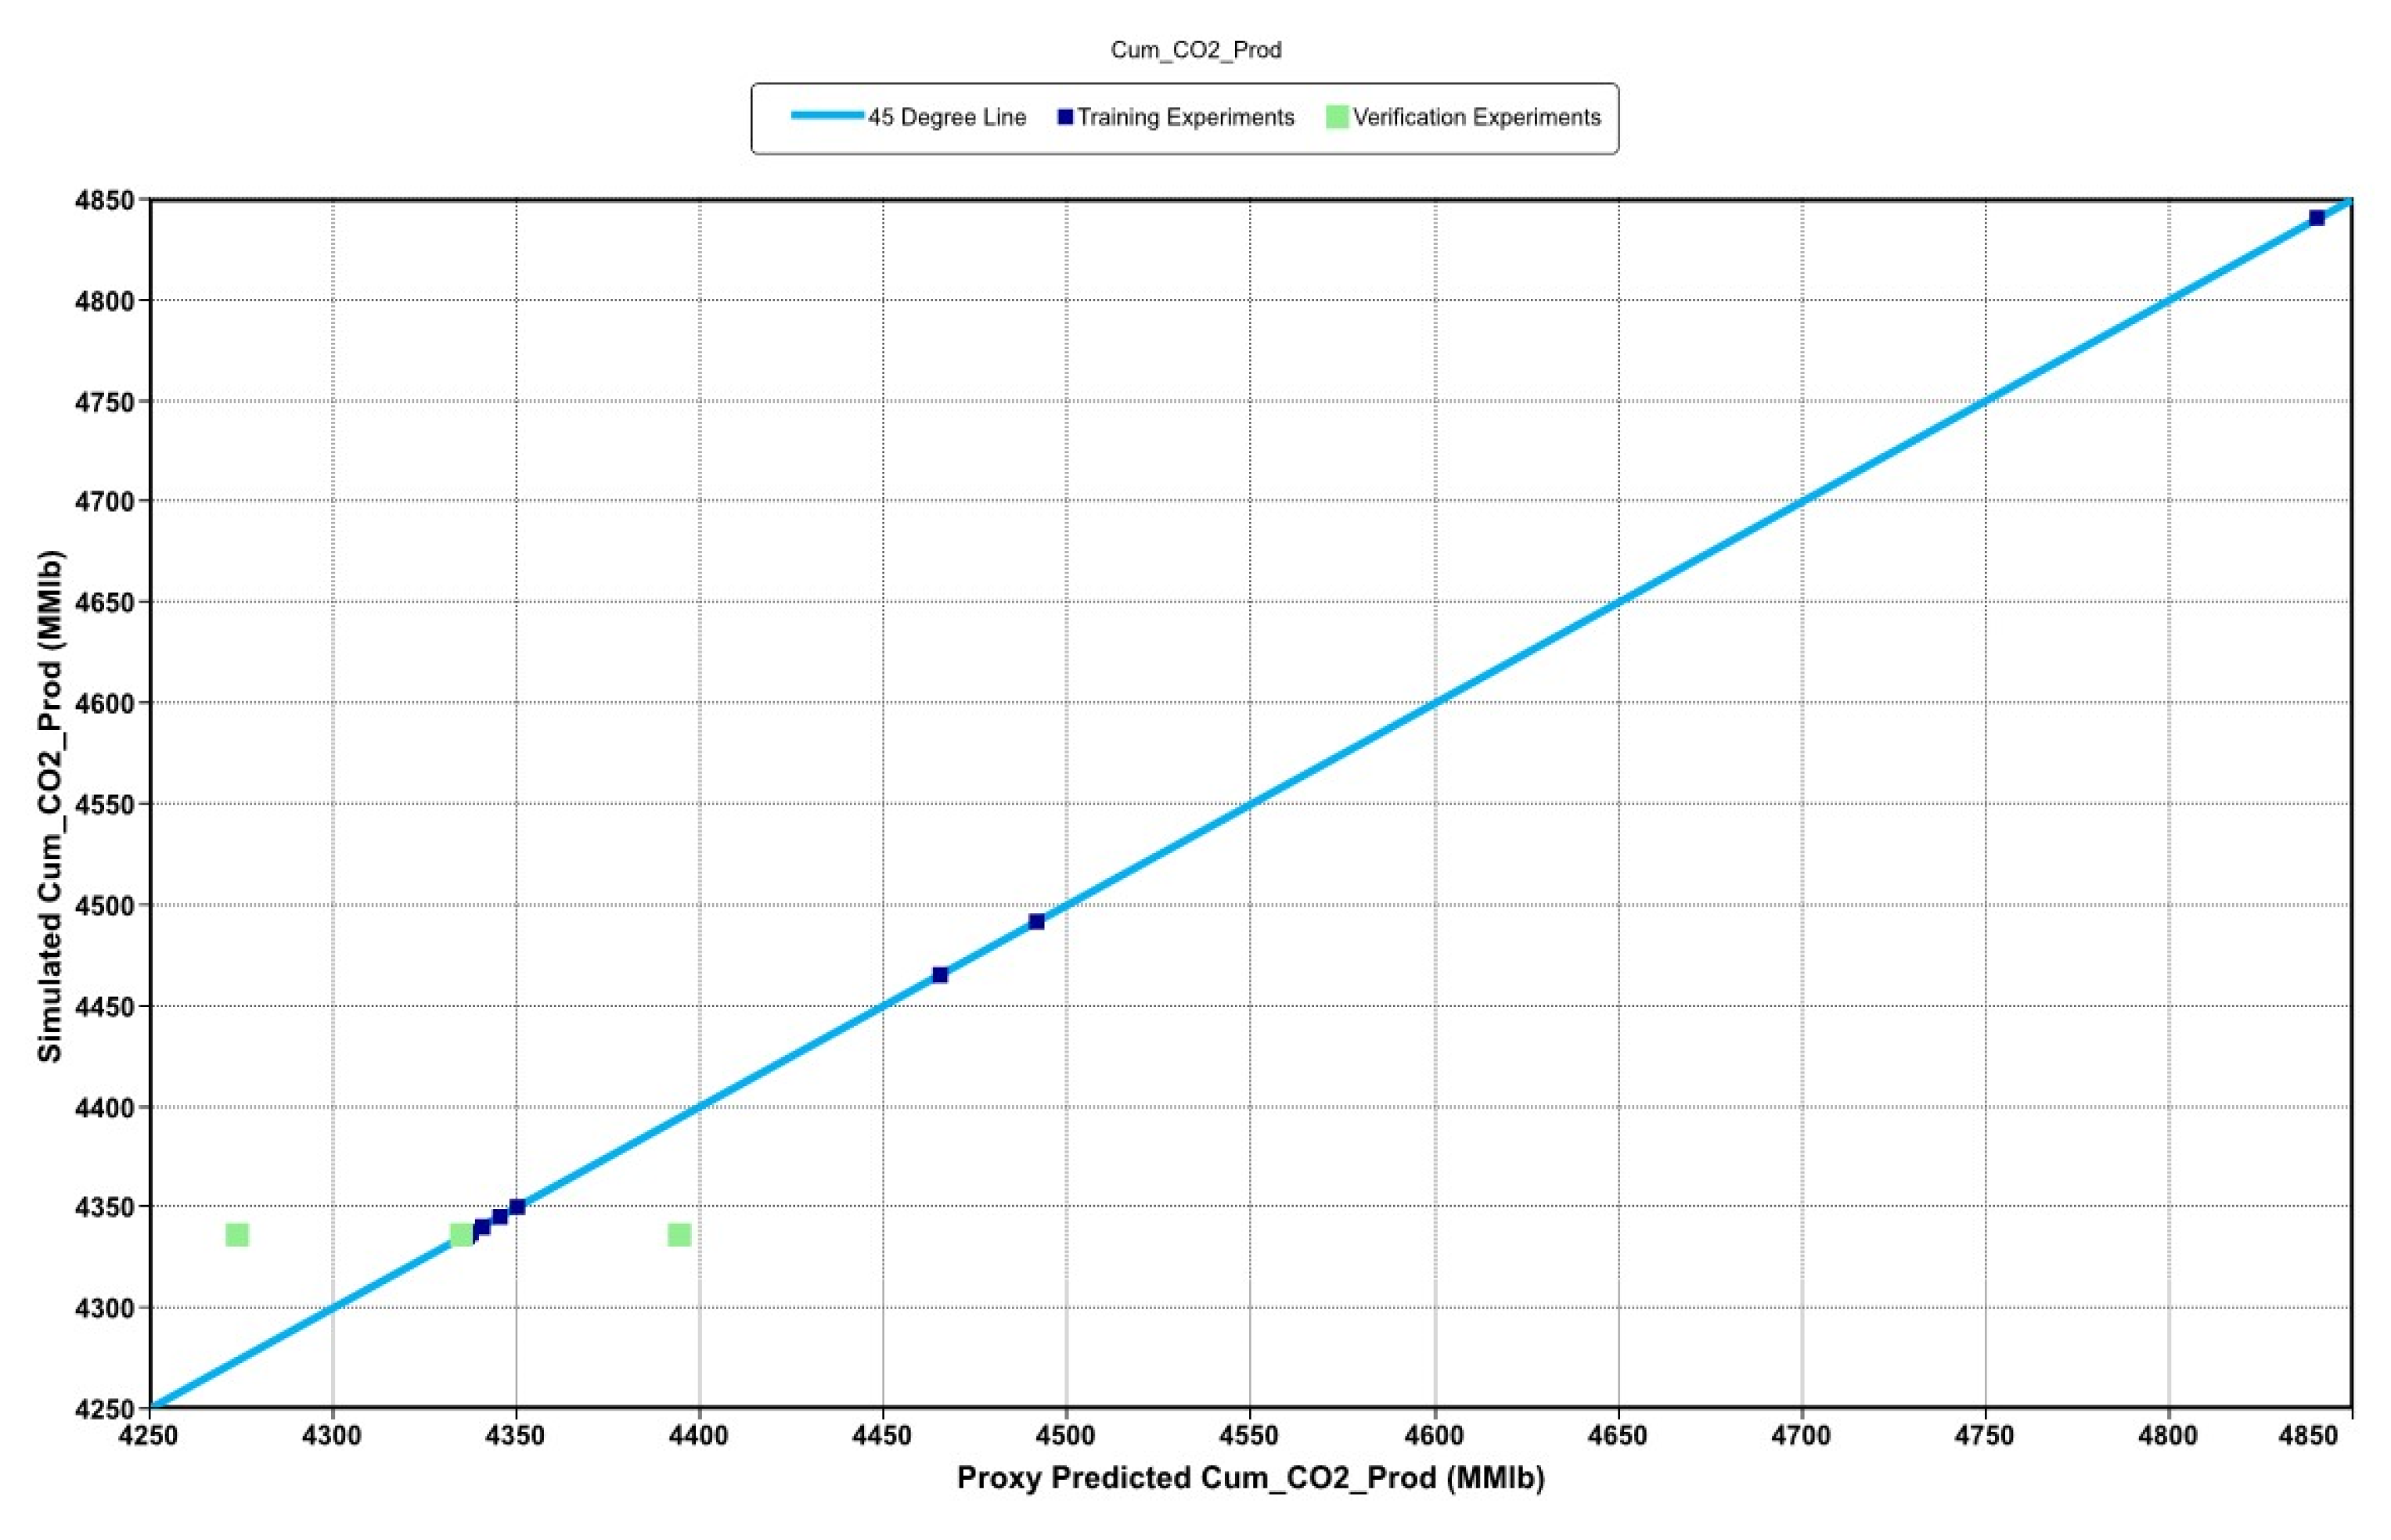
Figure 23.
Monte Carlo Plot for CO2 Stored.
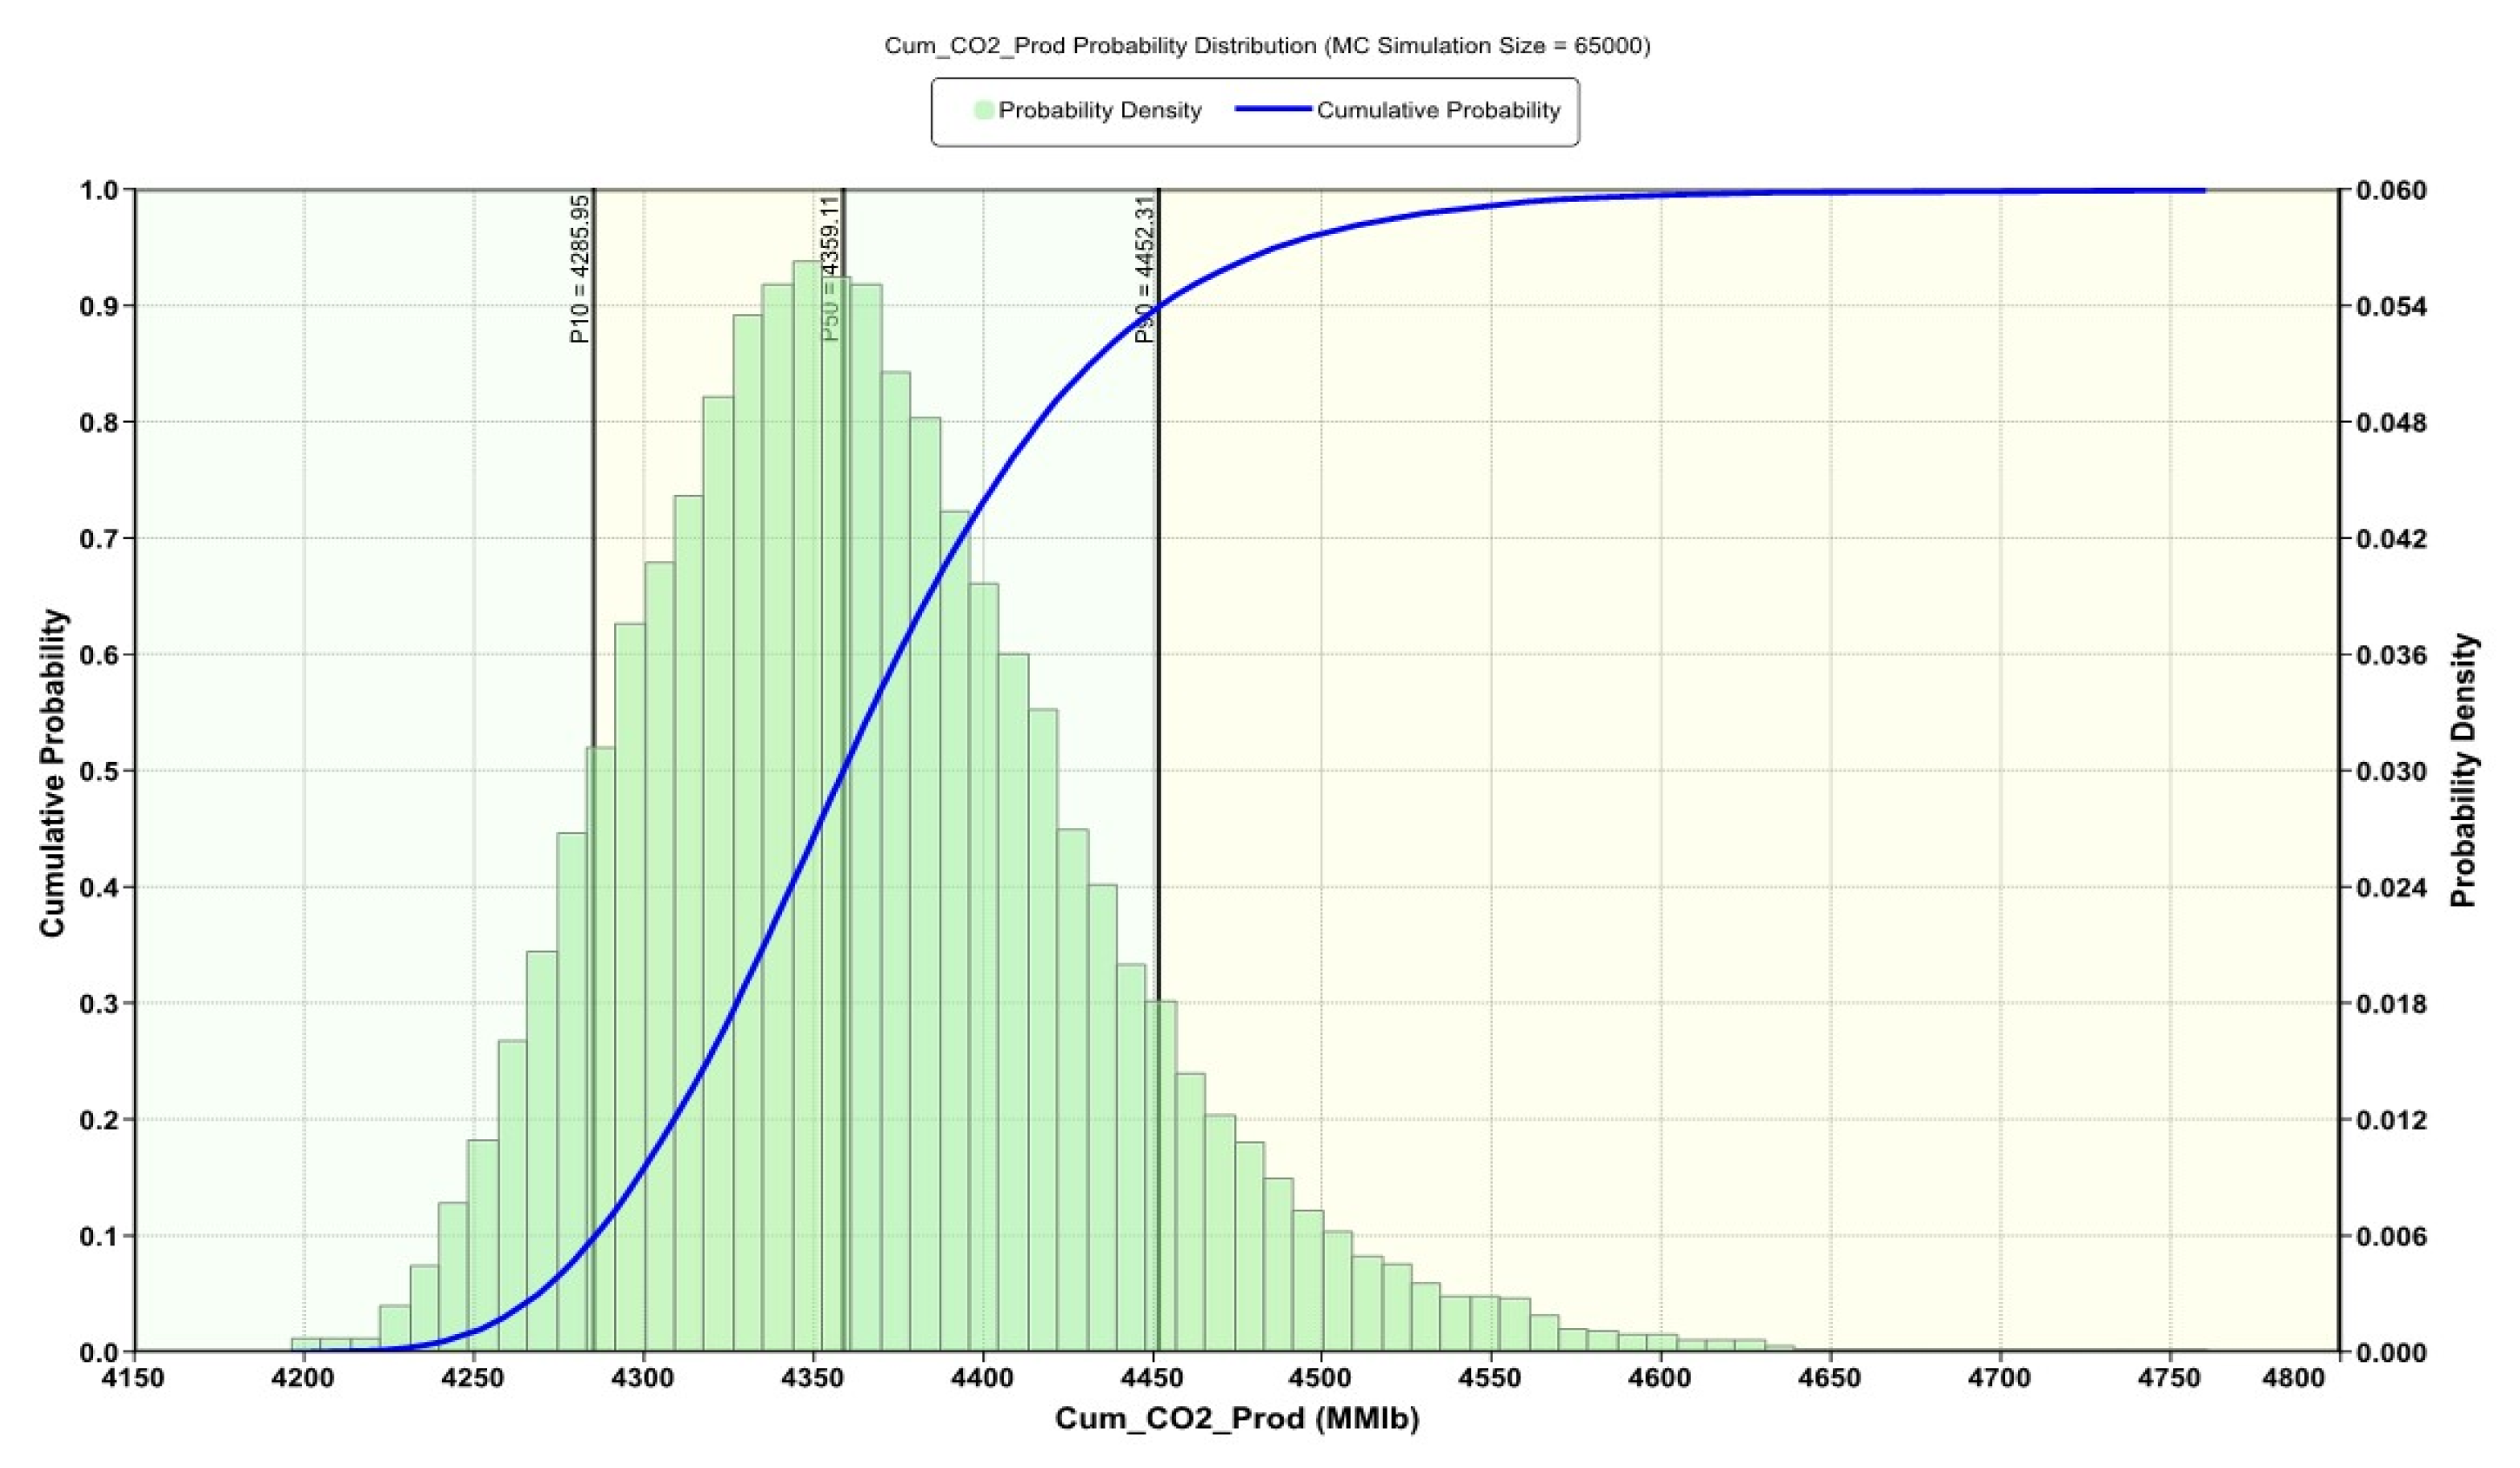
Figure 24.
Morris Analysis for CO2 Stored.
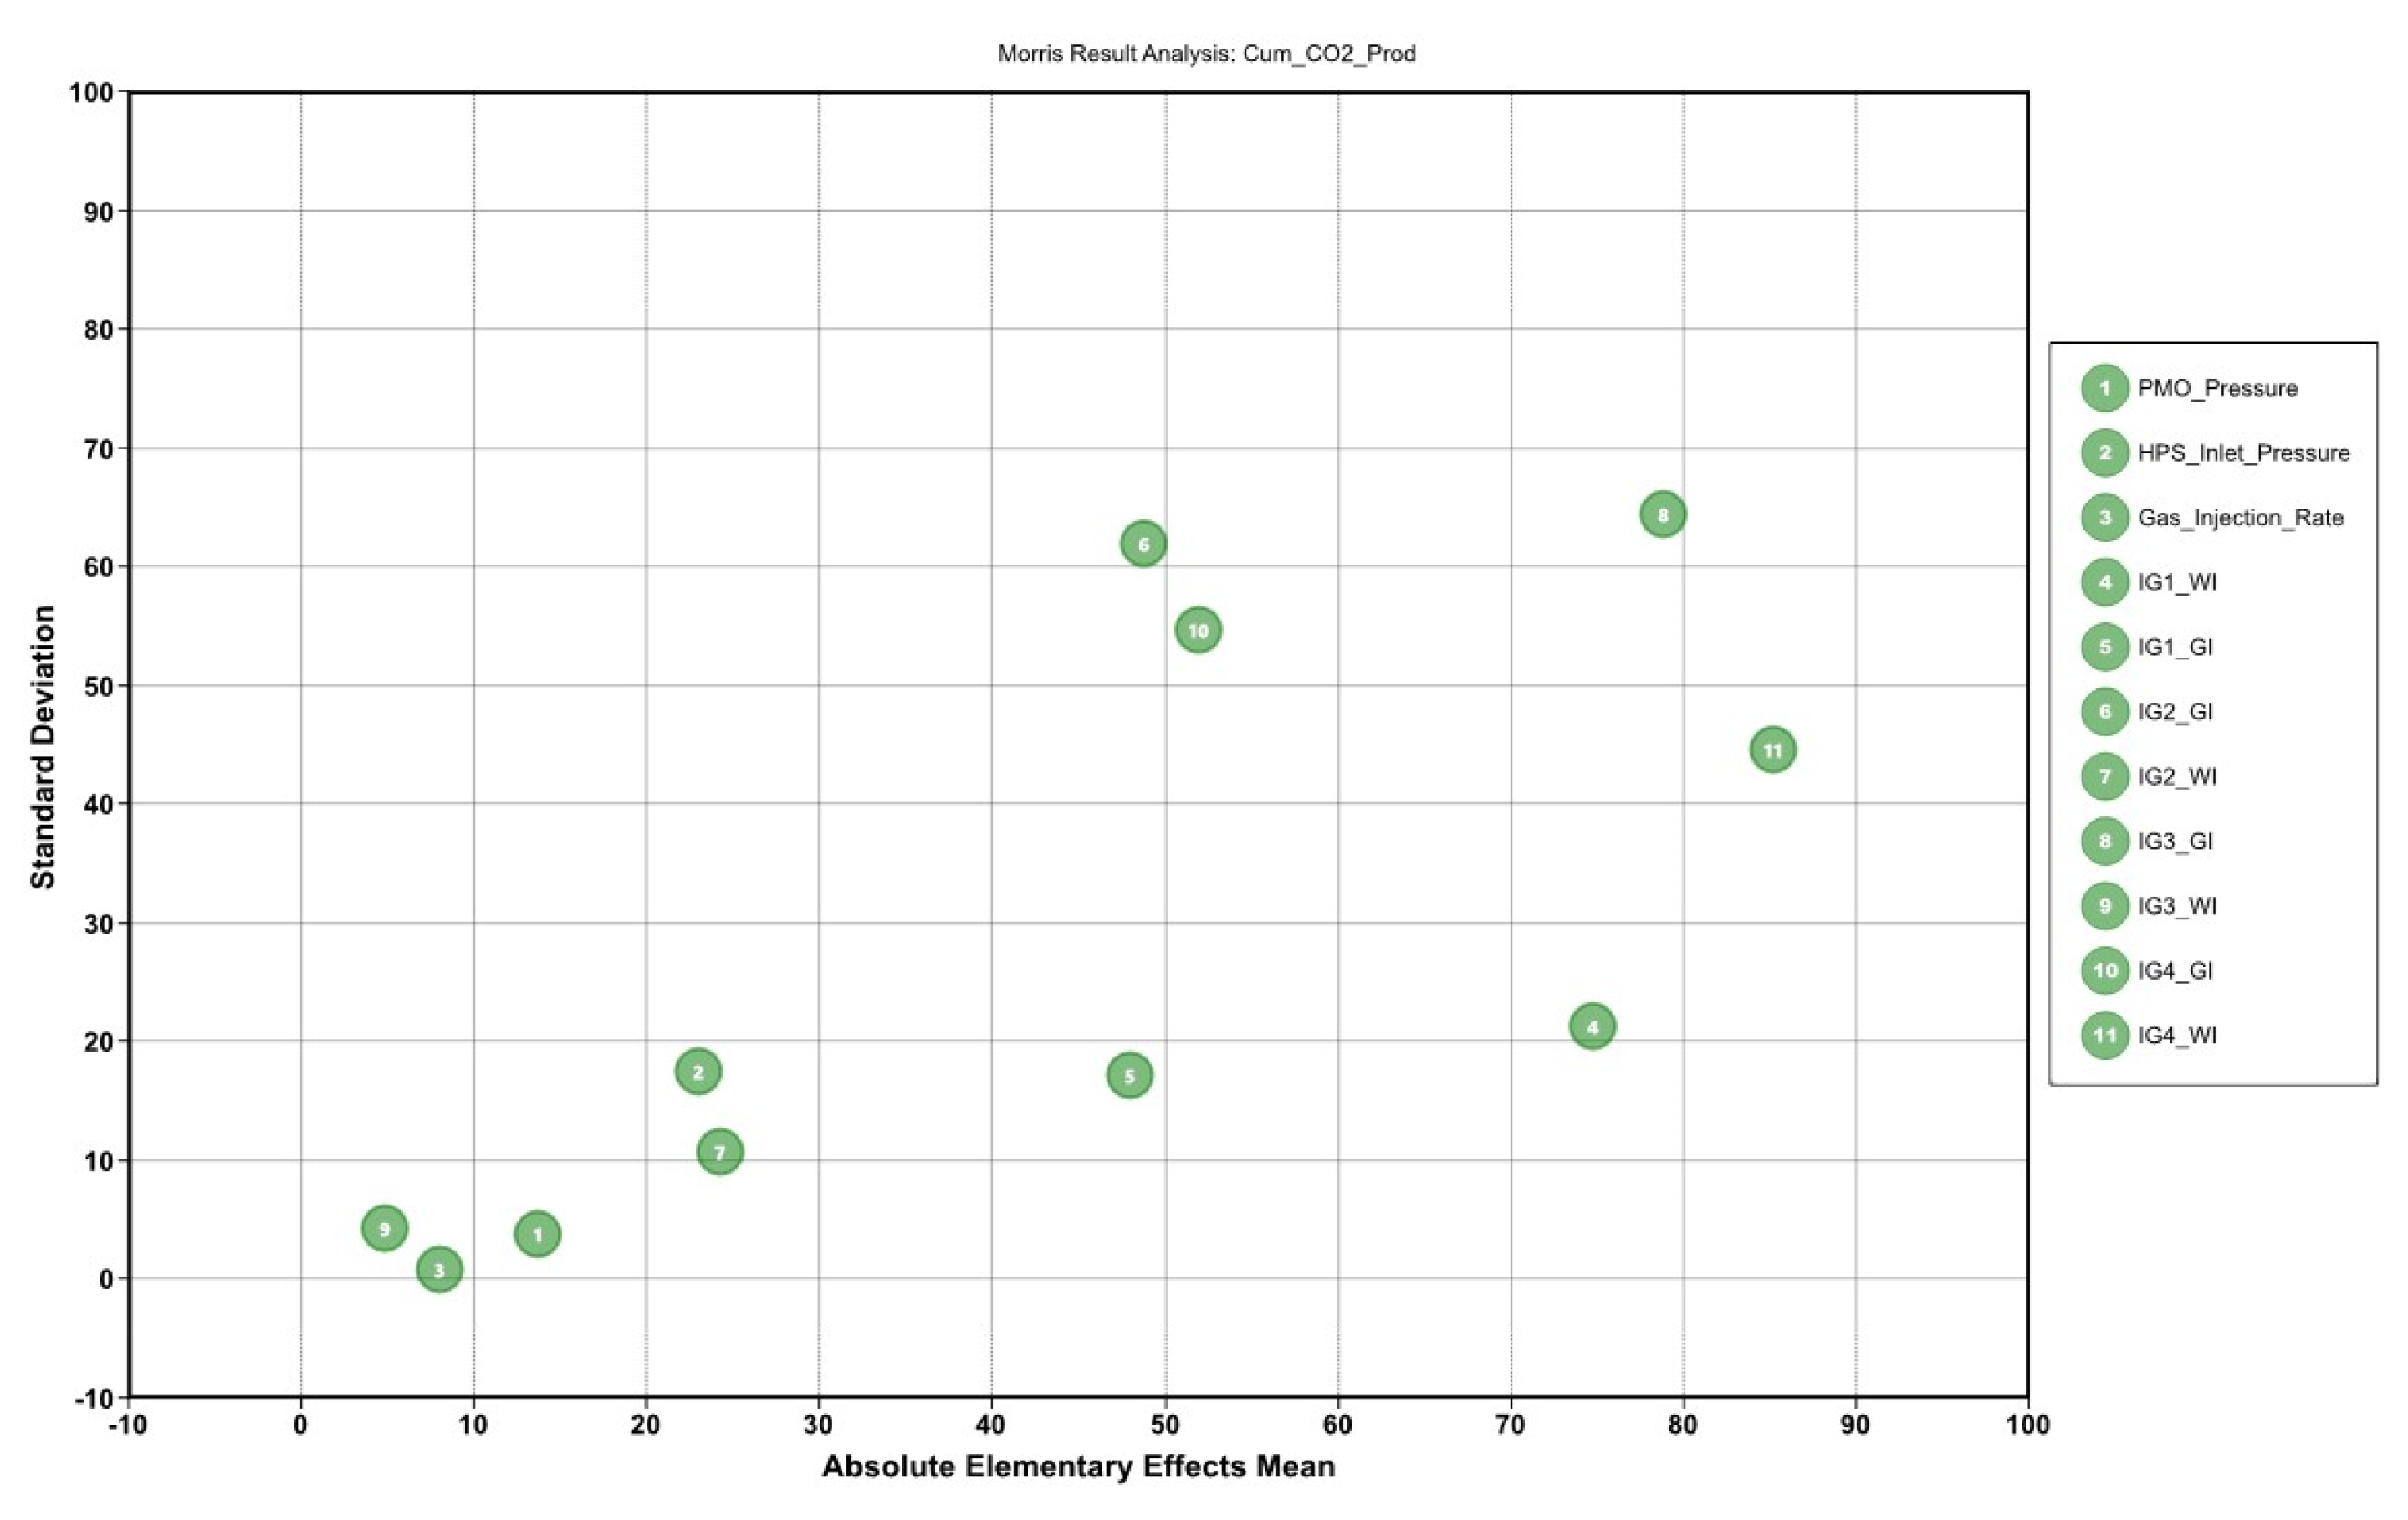
Figure 25.
Sobol Analysis for CO2 Stored.
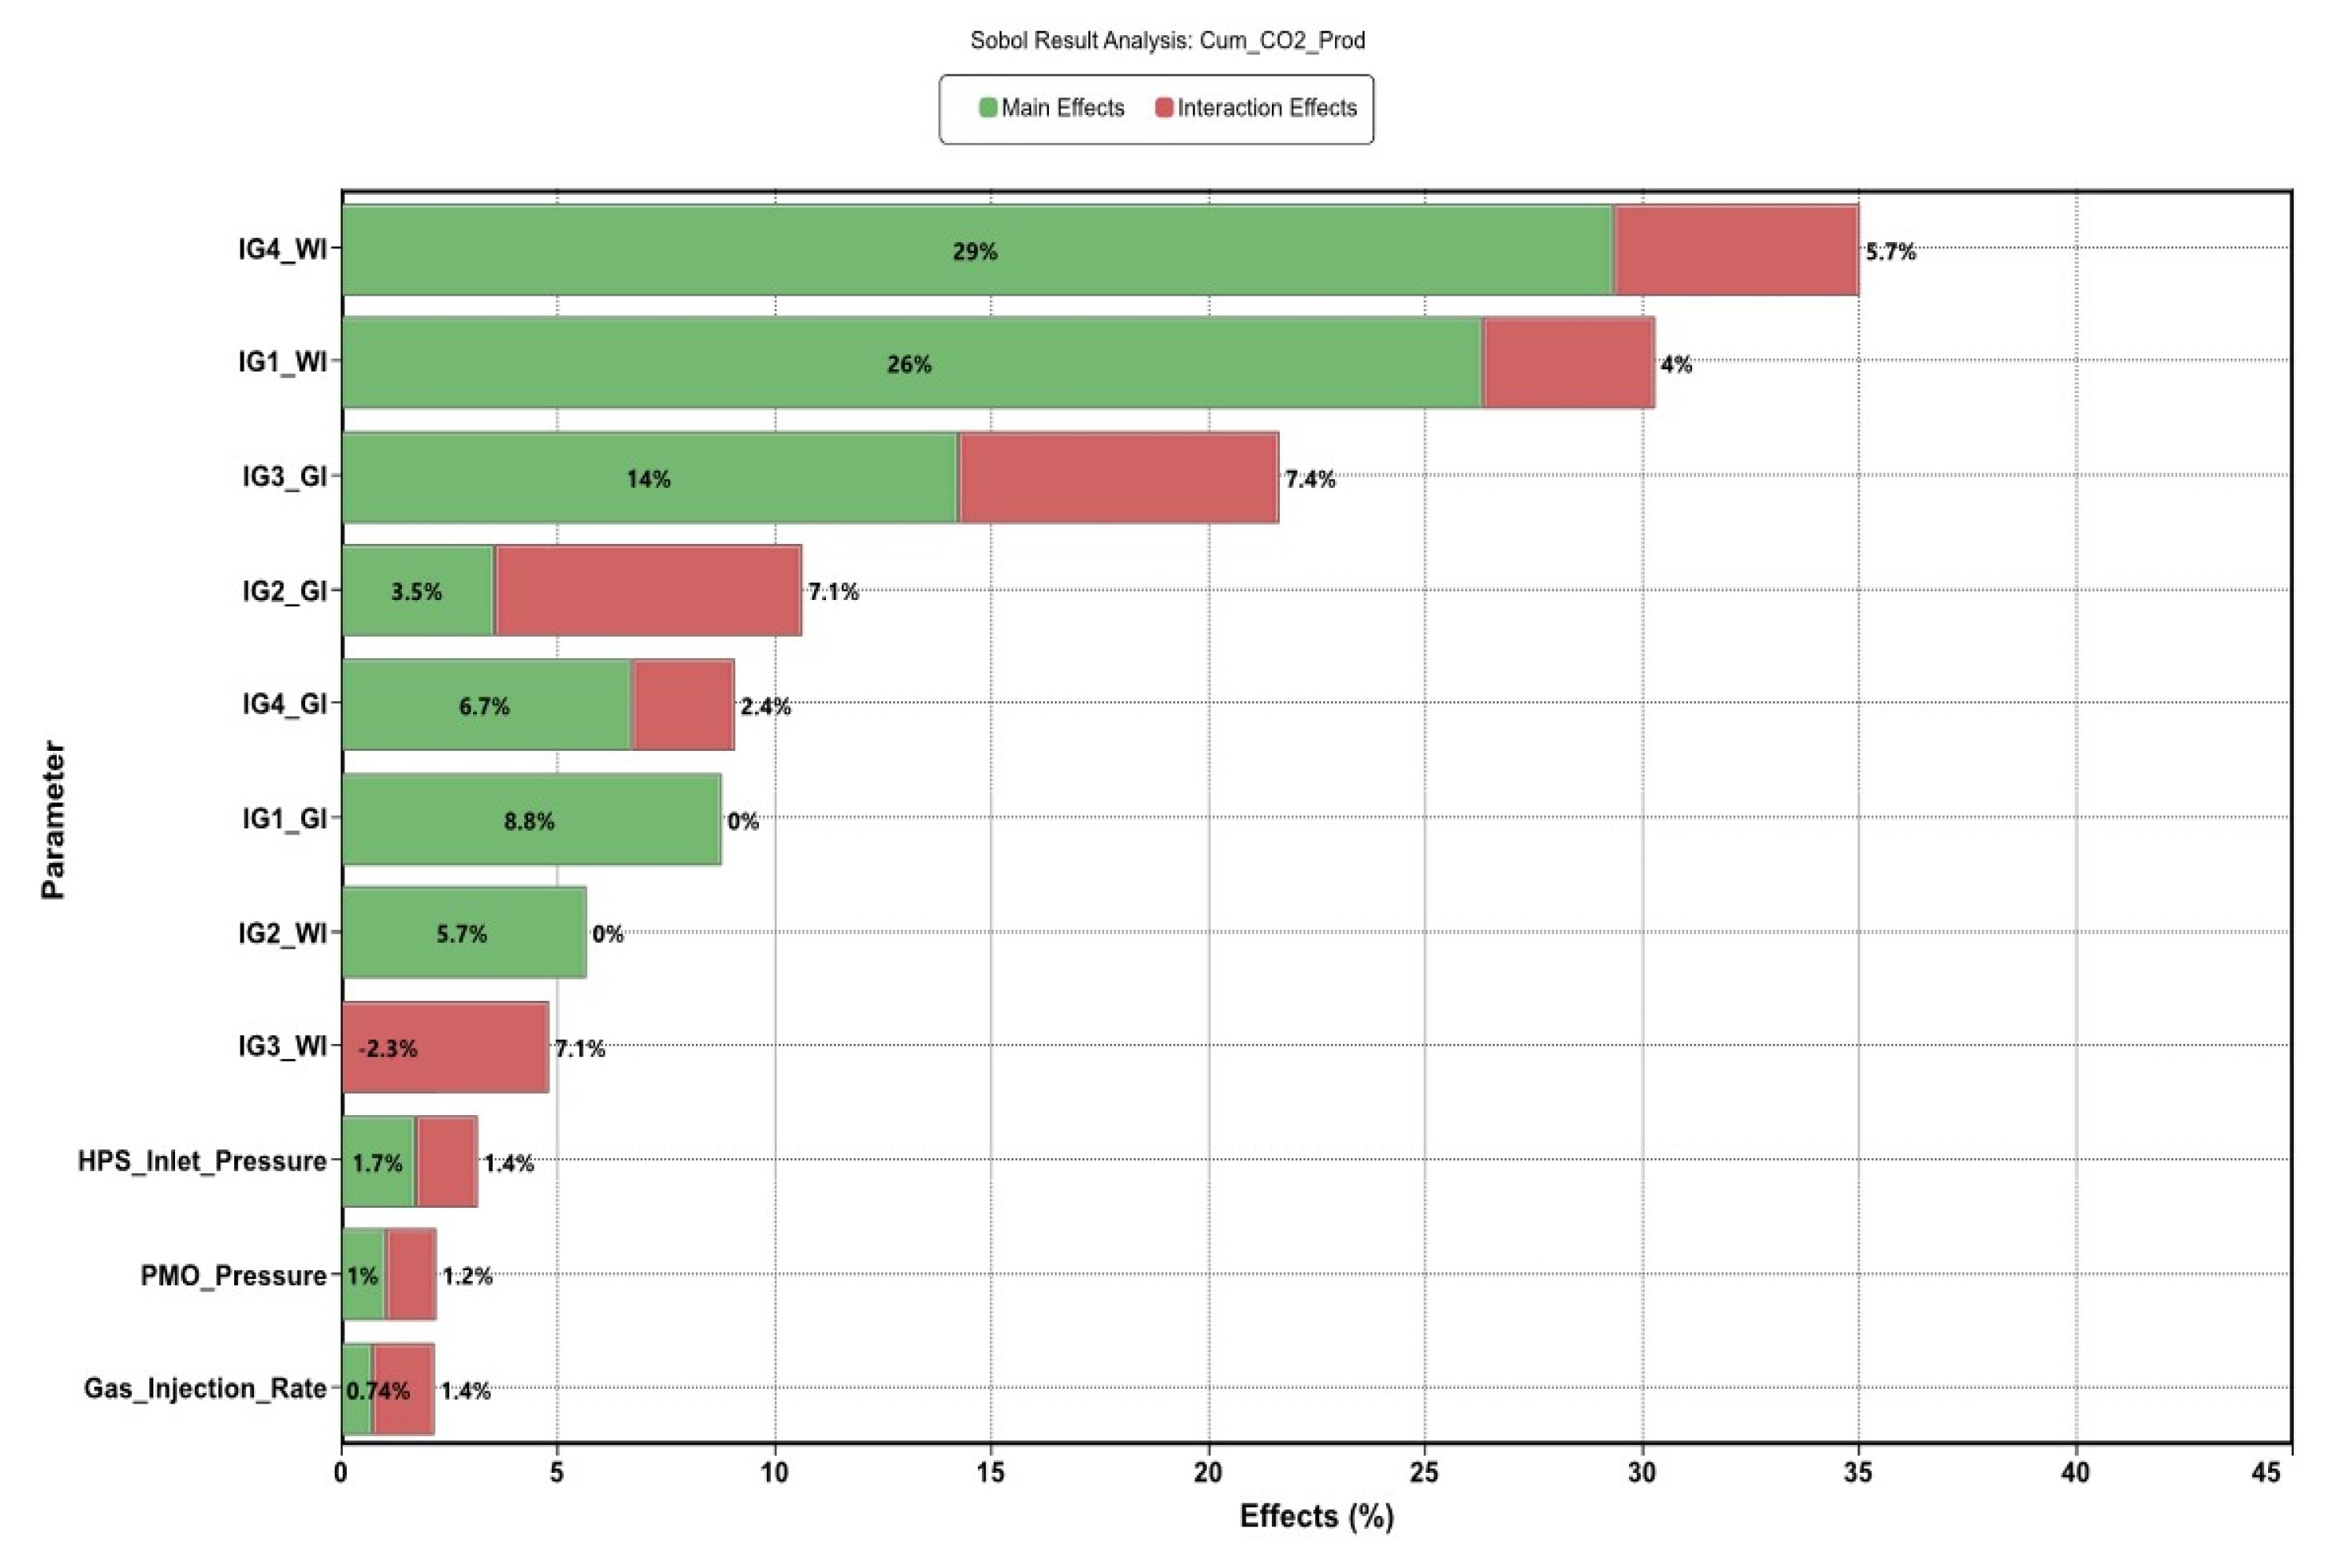
Figure 30.
Cumulative Oil Recovered per Experiment.
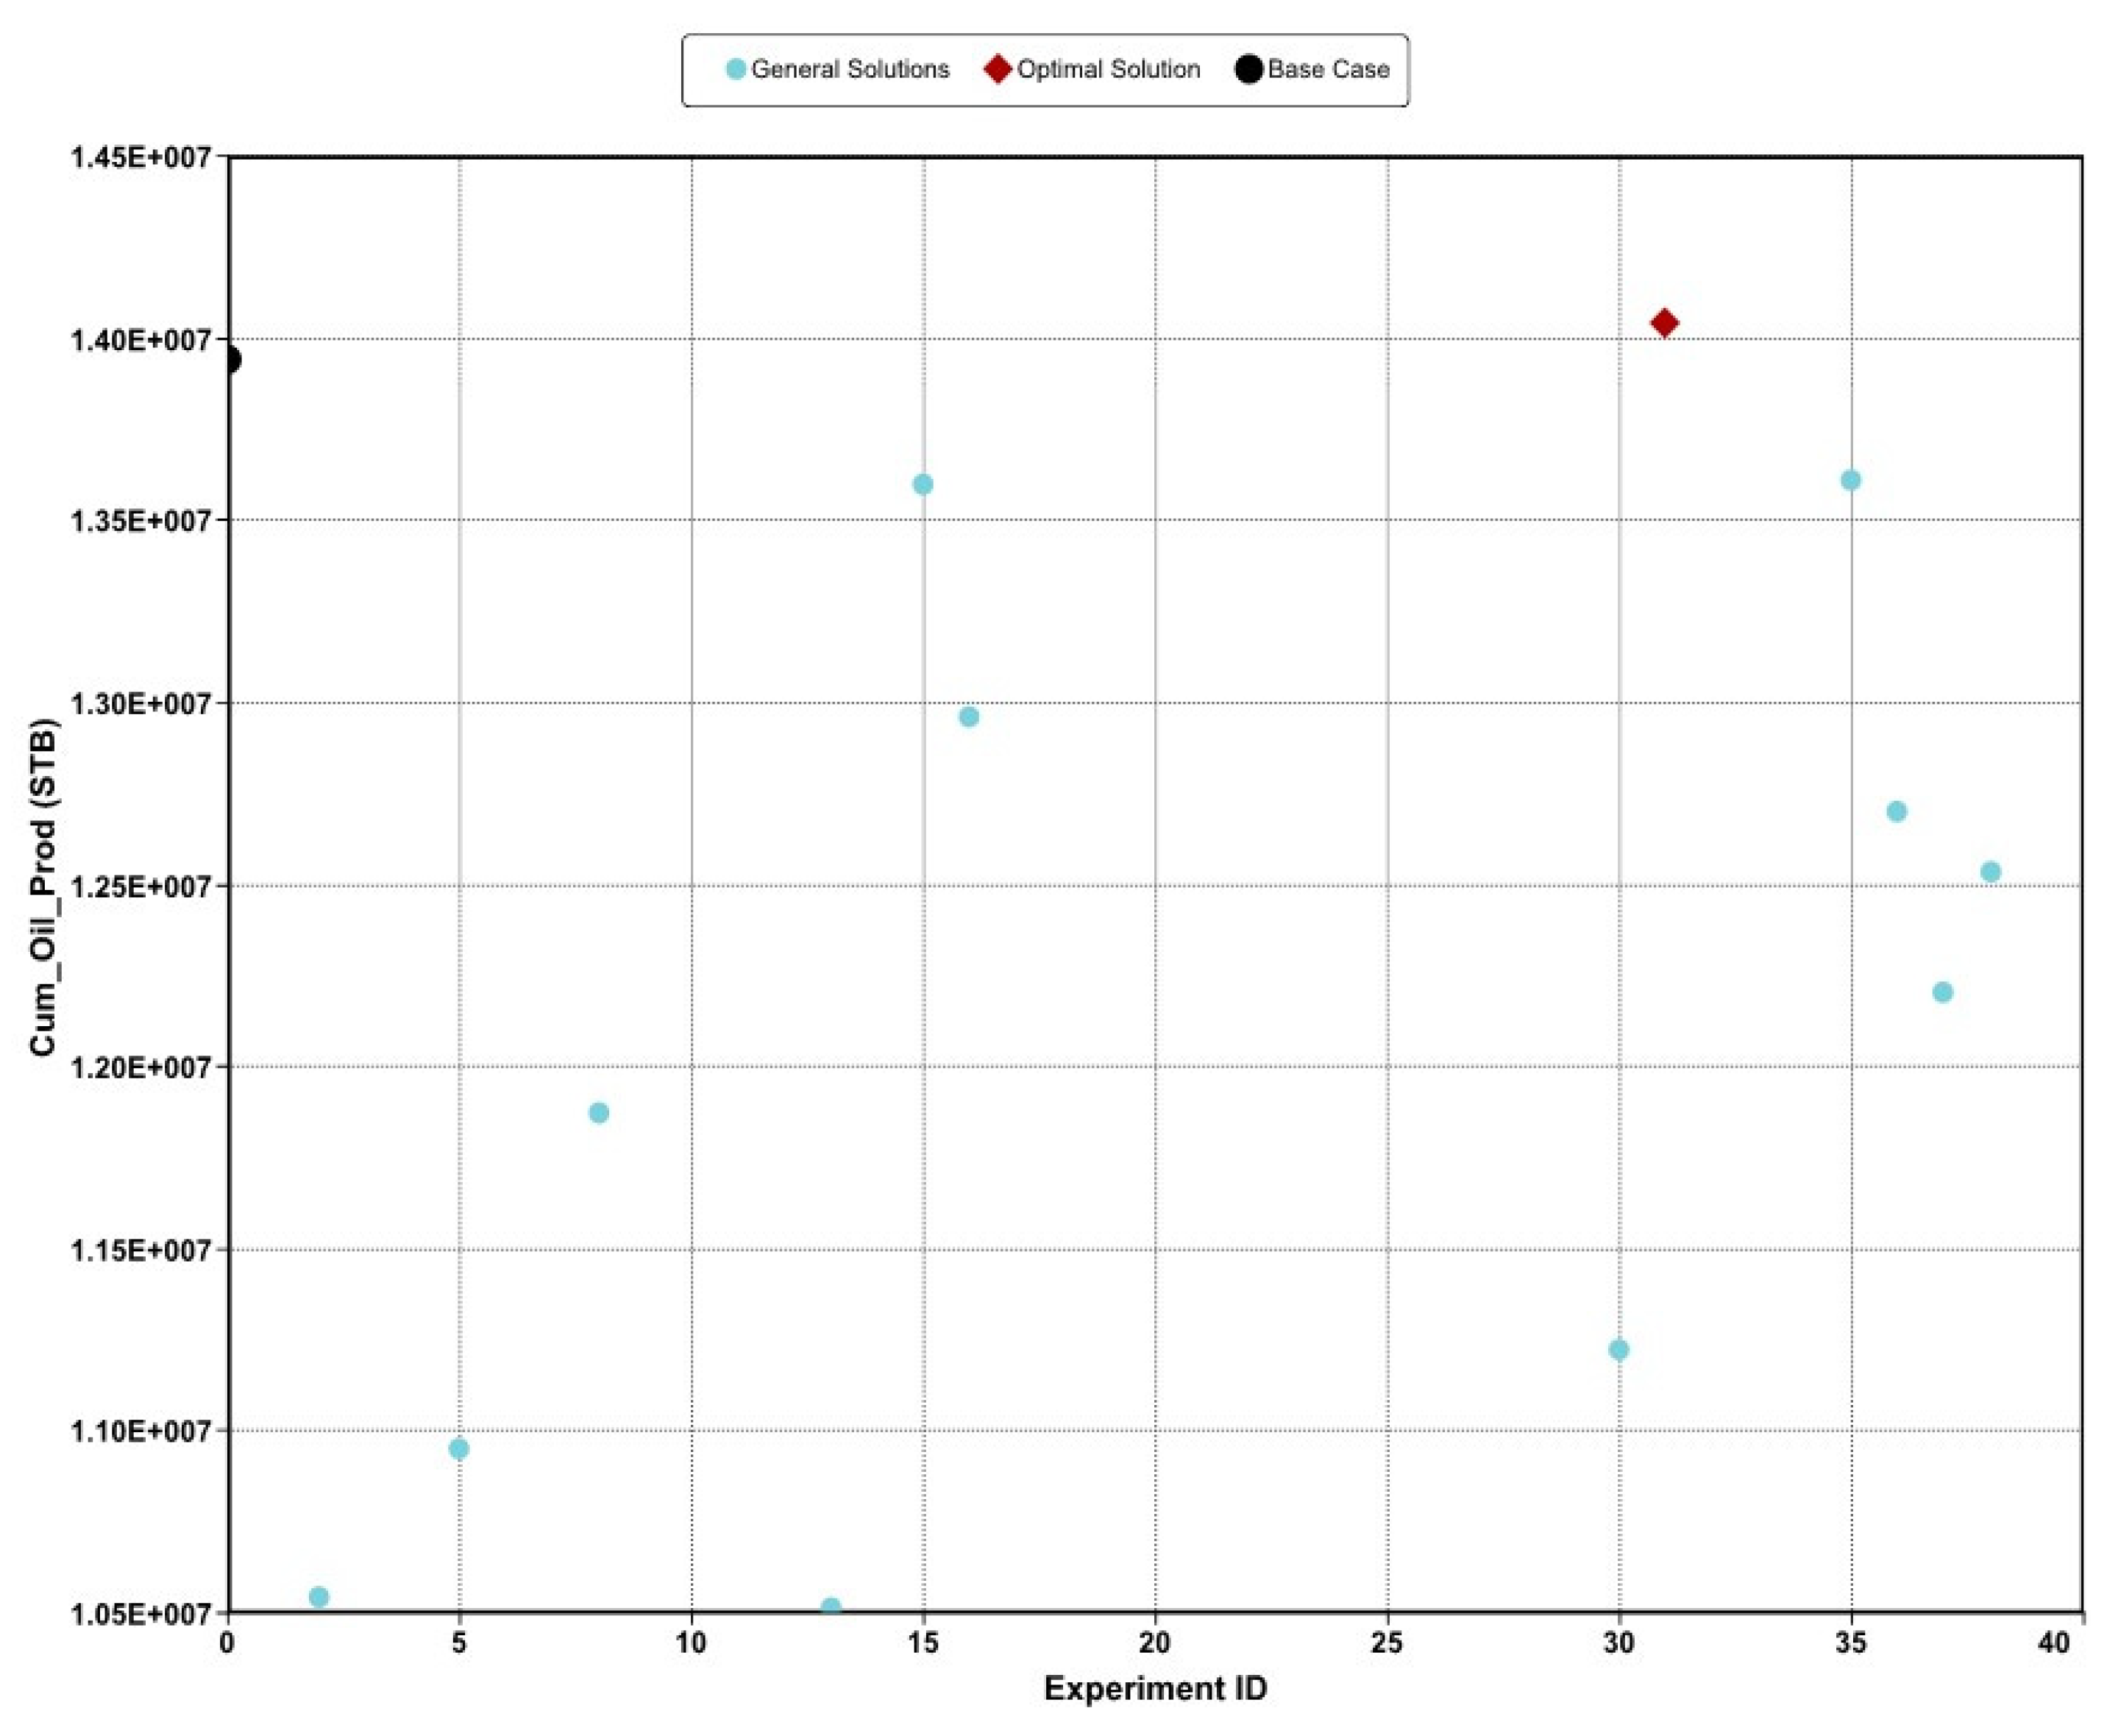
Figure 31.
Cumulative Oil Production for Optimal Experiment.
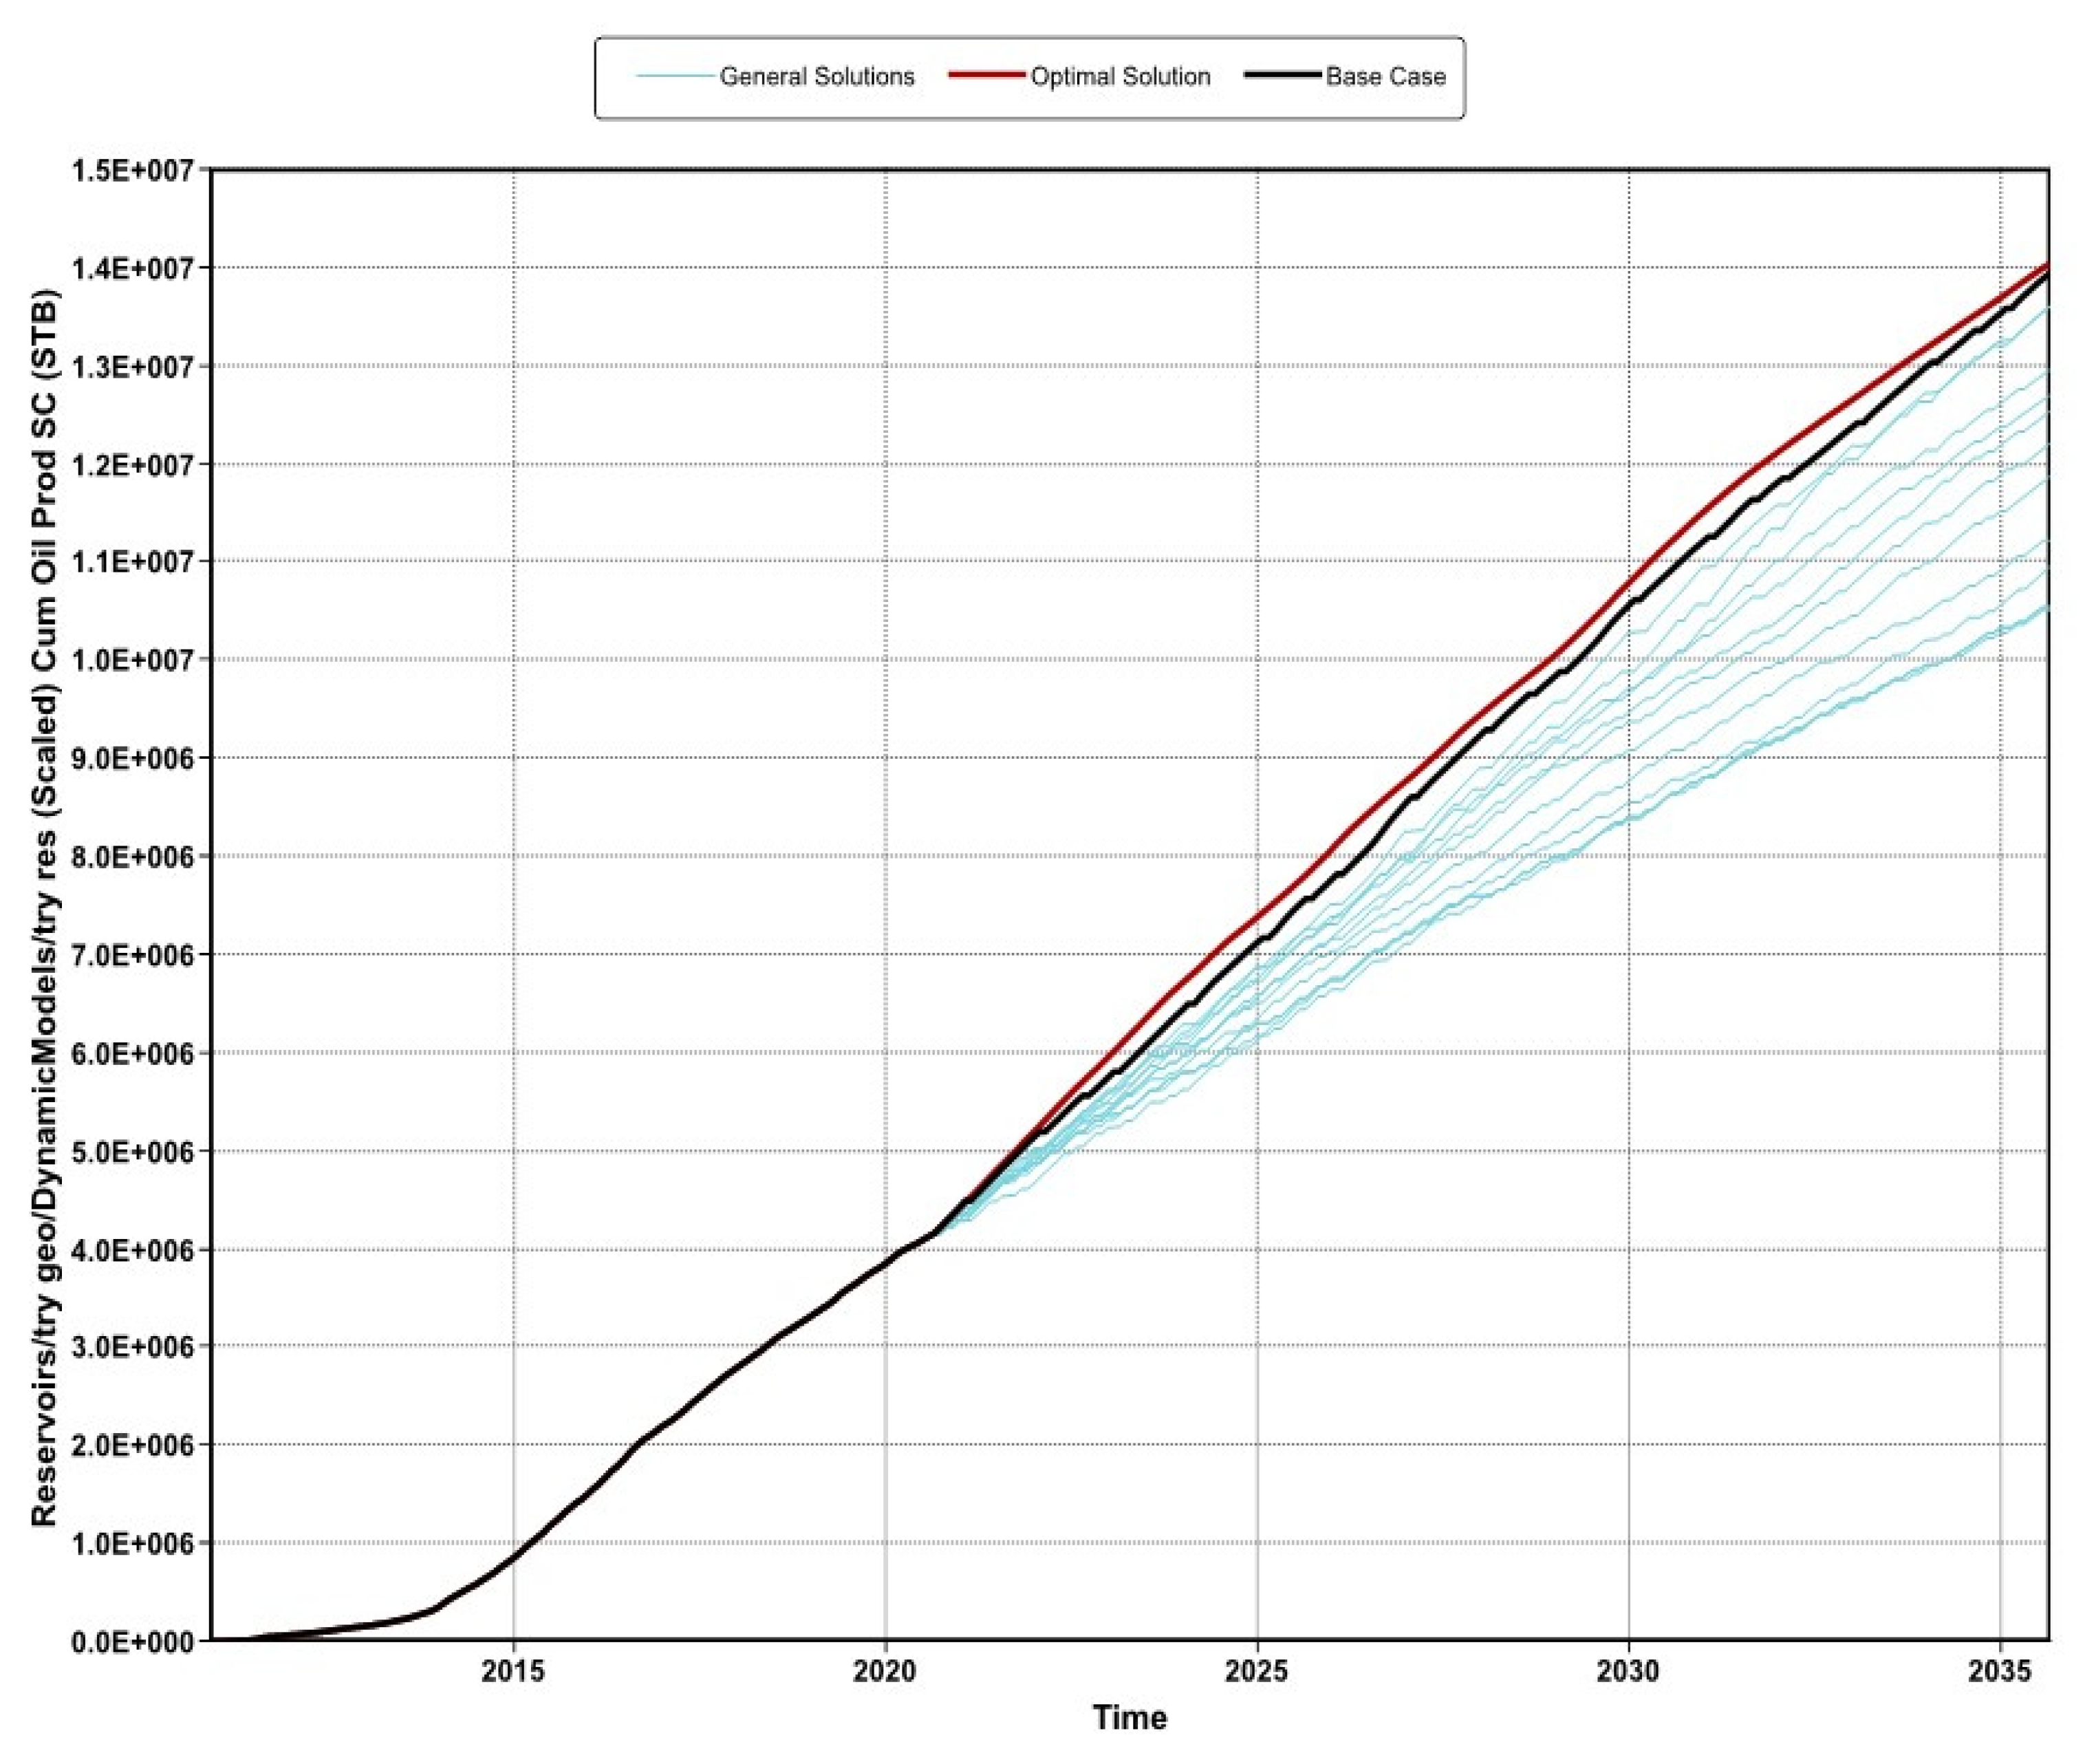
Figure 32.
Cumulative CO2 Purchased.
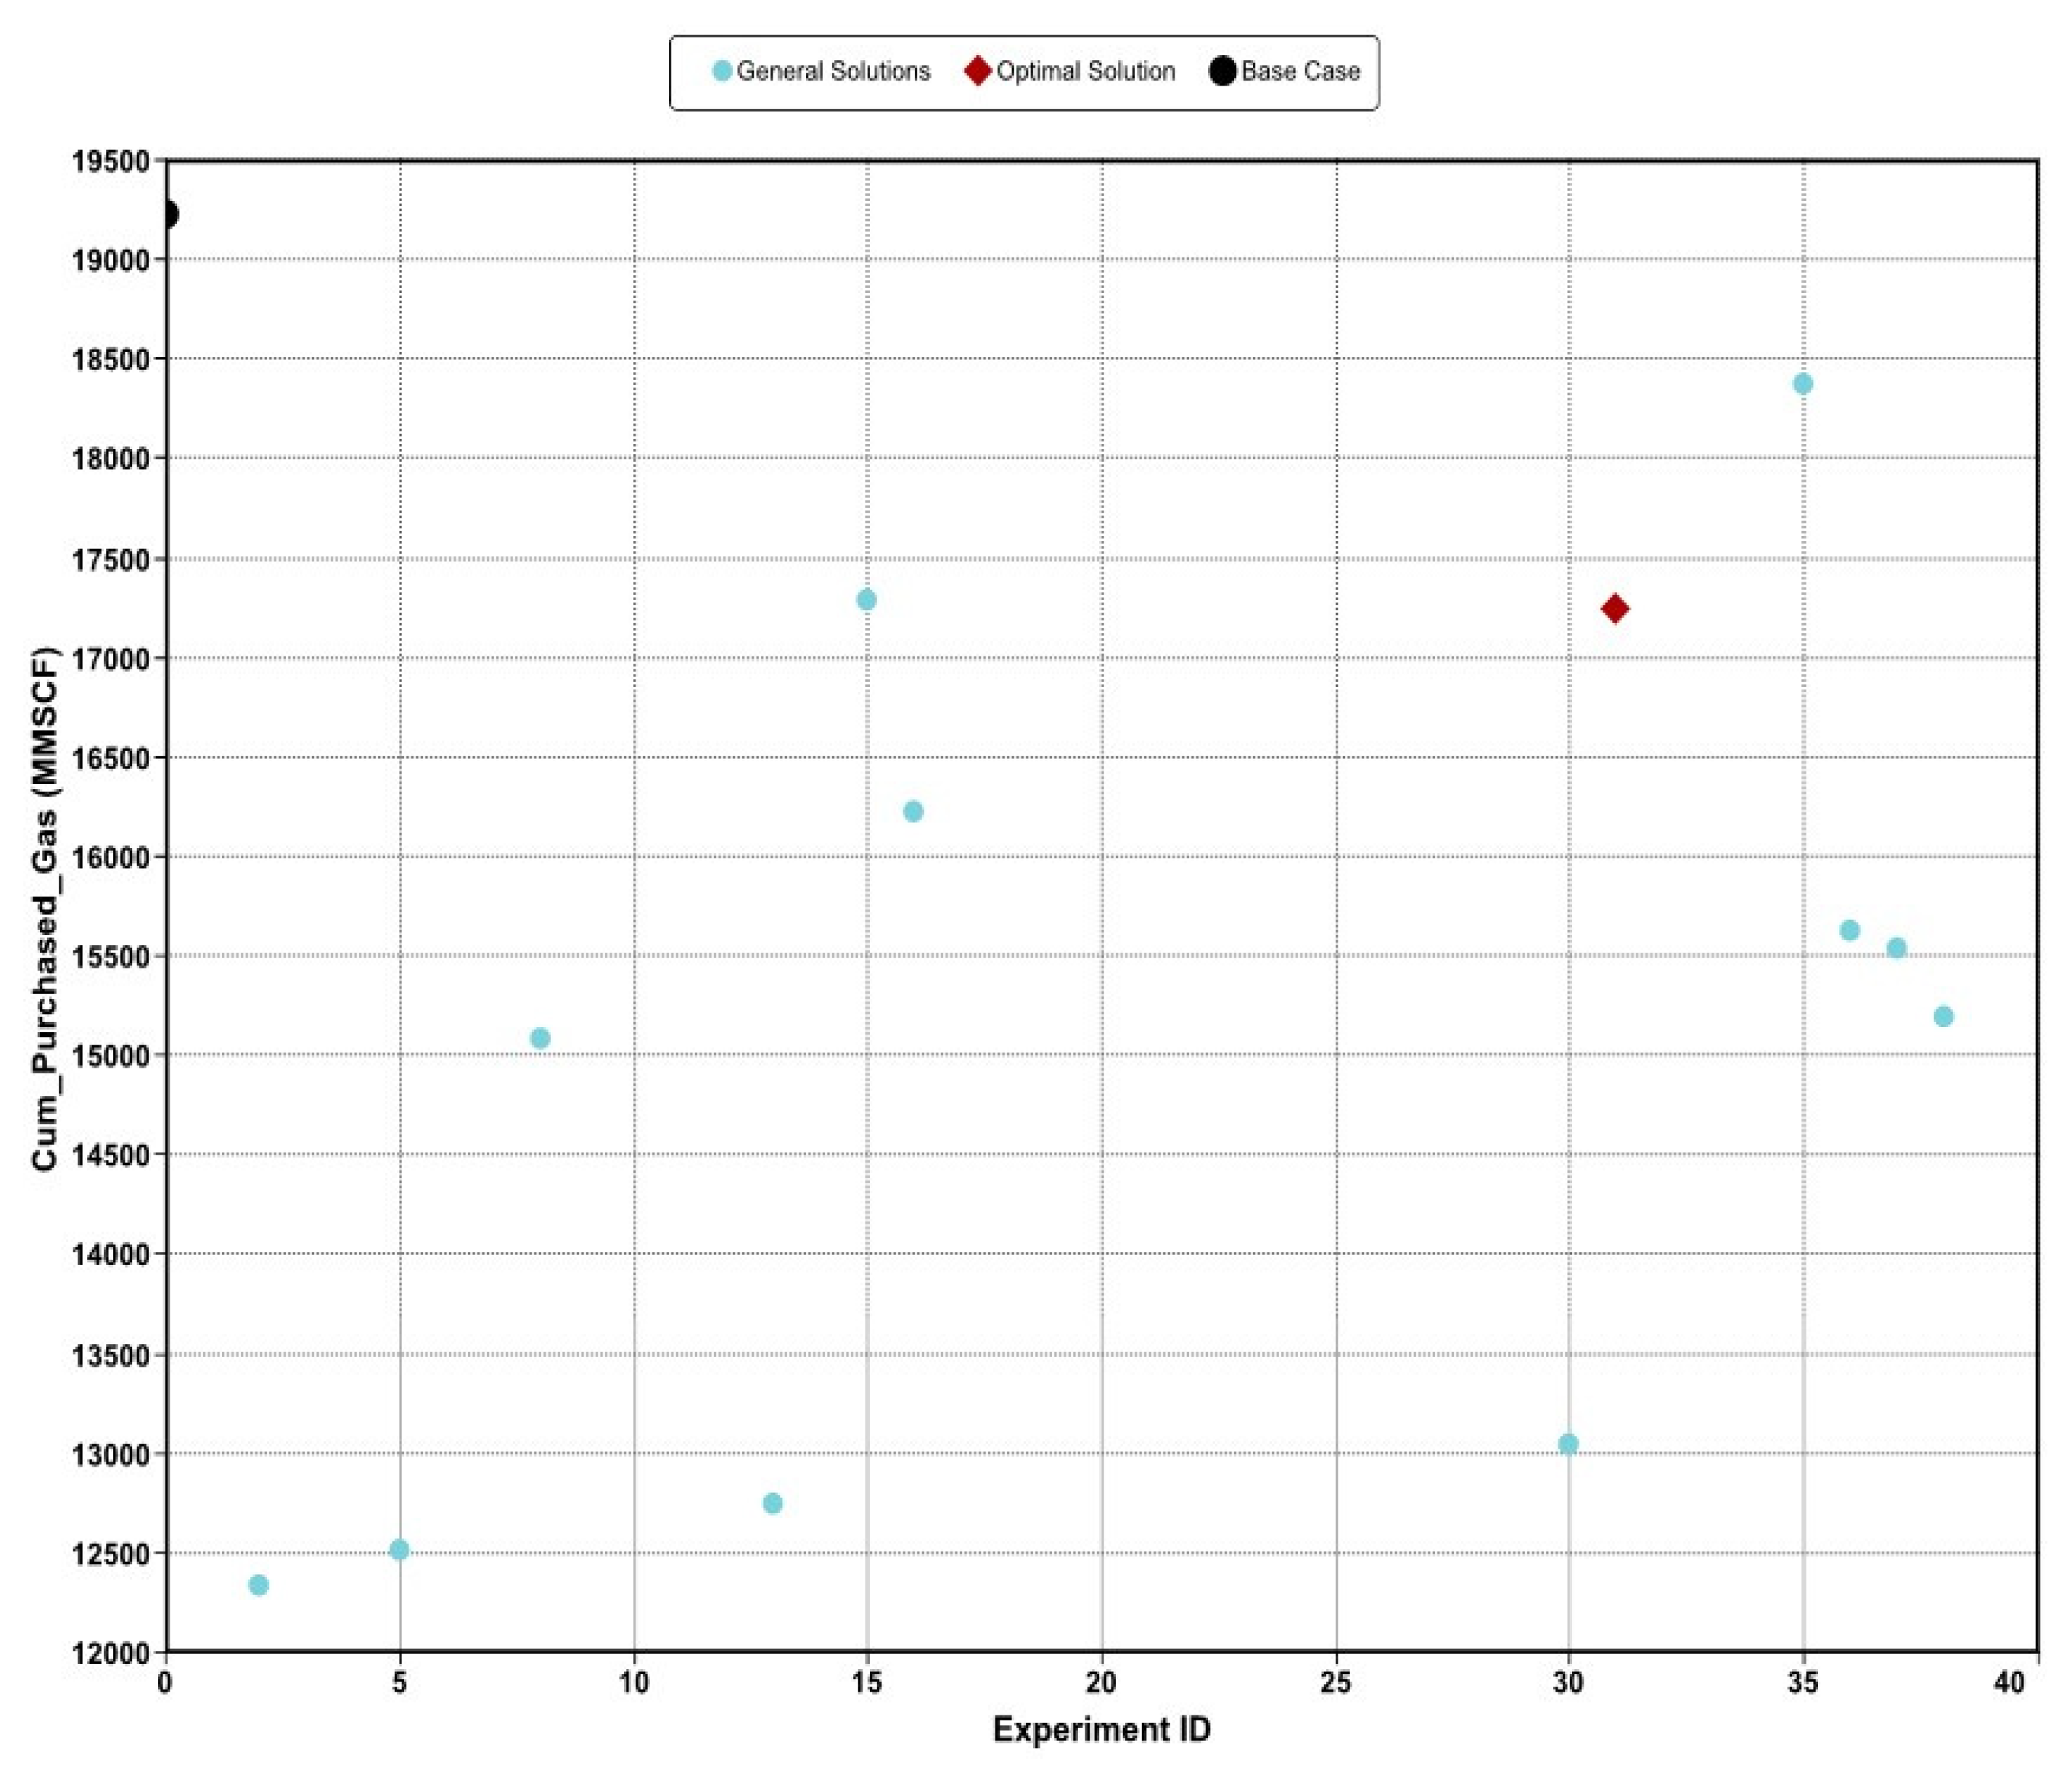
Figure 35.
Plot of Cumulative CO2 Stored vs Time.
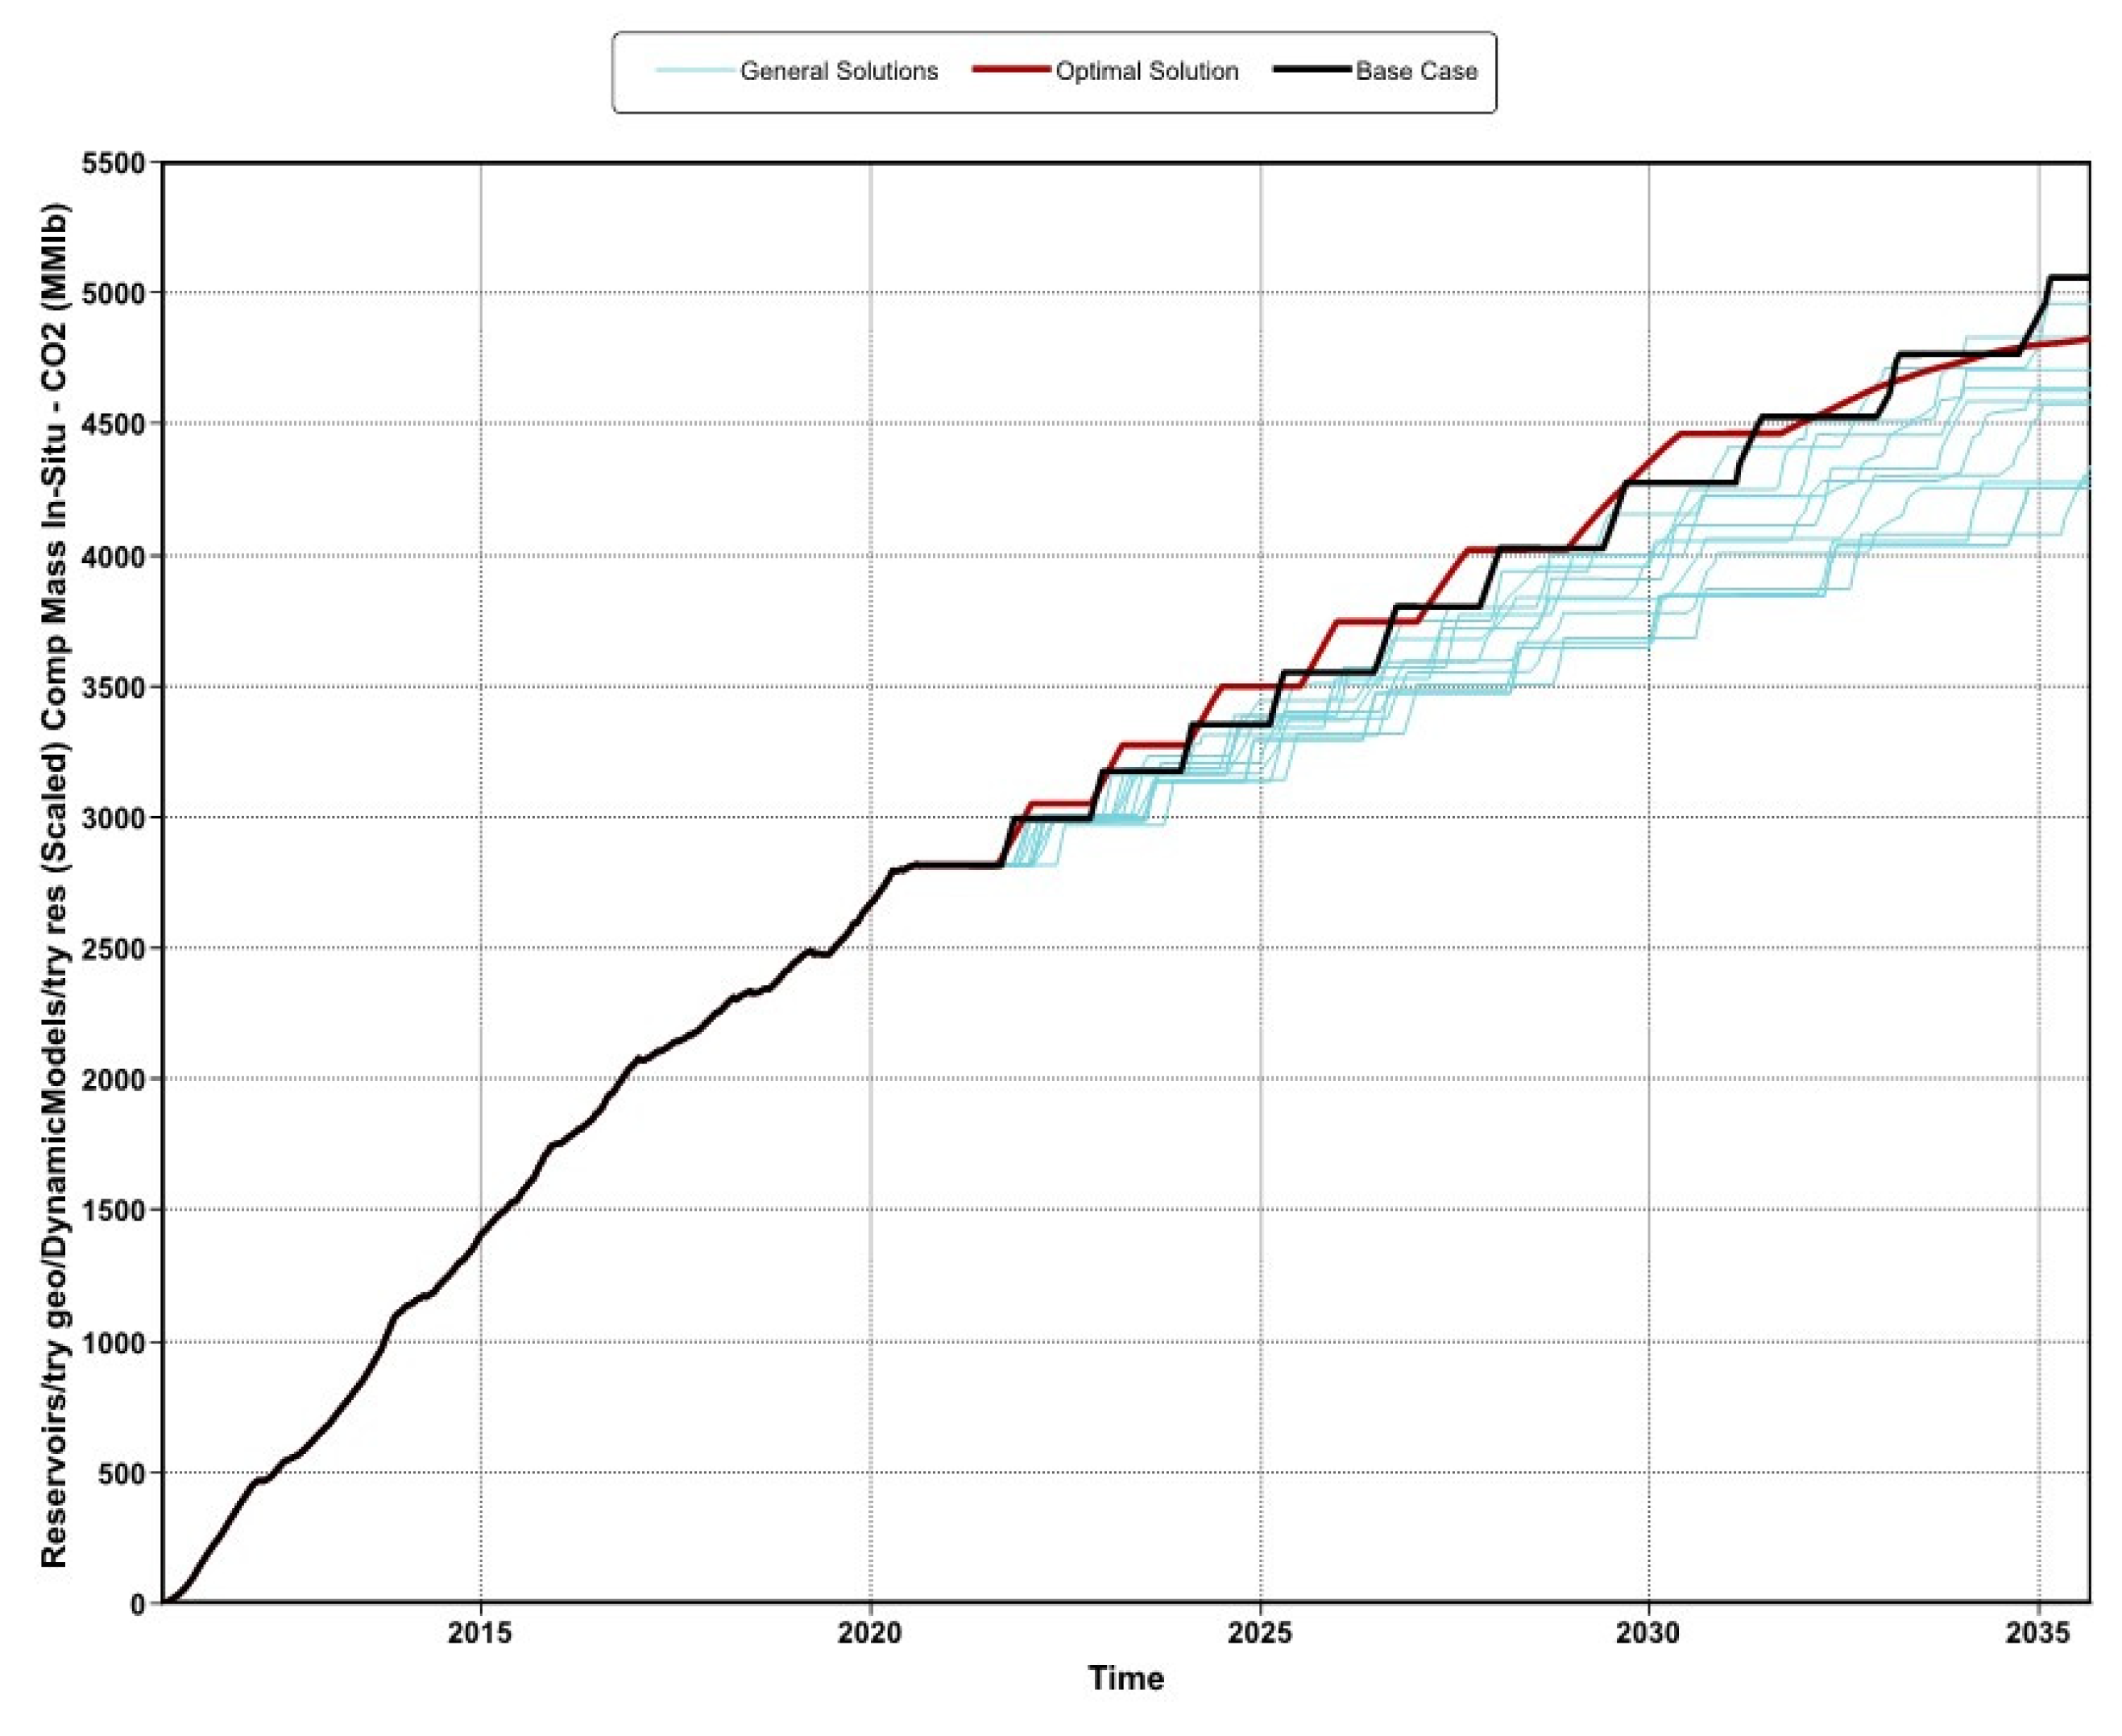
Table 1.
Parameters Used in Sensitivity Analysis.
| Parameter (Reference Name) | Default | Minimum | Maximum |
|---|---|---|---|
| X, Y Permeability Multiplier (PermXY multi) | 1.0 | 0.6 | 0.6 |
| Z Permeability Multiplier (PermZ multi) | 1.0 | 1.0 | 1.0 |
| Porosity Multiplier (PoreV multi) | 1.0 | 0.80 | 1.50 |
| Oil-Water Contact (OWC) | -6500 | -6500 | -4600 |
| Residual Water Saturation (KrwSwi) | 0.15 | 0.10 | 0.36 |
| Water Curve Endpoint (Krw endpoint) | 0.50 | 0.15 | 0.60 |
| Water Saturation Exponent (Krw exp) | 3.0 | 1.0 | 7.0 |
| Residual Oil Saturation (KrowSoi) | 0.1 | 0 | 0.3 |
| Oil Curve Endpoint (Krow endpoint) | 0.8 | 0.7 | 1.0 |
| Oil Saturation Exponent (Krow exp) | 4.0 | 1.0 | 8.0 |
| Residual Gas Saturation (Krgi) | 0 | 0 | 0.15 |
| Gas Curve Endpoint (Krg endpoint) | 1.0 | 0.8 | 1.0 |
| Gas Saturation Exponent (Krg exp) | 1.0 | 1.0 | 3.0 |
| Residual Liquid Saturation (Krogi) | 0.1 | 0.1 | 0.5 |
| Liquid Curve Endpoint (Krog endpoint) | 1.0 | 0.7 | 1.0 |
| Liquid Saturation Exponent (Krog exp) | 4.0 | 1.0 | 5.0 |
Table 6.
Summary of Cumulative Values from Development Strategy.
| Parameters | Cumulative Value |
|---|---|
| Oil Production, MMSTB | 13.95 |
| Water Production, MMSTB | 38.39 |
| Gas Production, MMSCF | 100,353.7 |
| CO2 Stored, MMIbs | 5,061.68 |
Table 8.
Percentage Decrease in Cumulative Purchased Gas.
| Experiment ID | Cumulative Gas Produced (MMSCF) |
Amount of CO2 Not Purchased (STB) |
Percentage of Purchased CO2 Less |
|---|---|---|---|
| Development Case | 19,236.79 | ||
| Optimal Strategy | 17,252.12 | 1,984.668 | 10.317 |
Disclaimer/Publisher’s Note: The statements, opinions and data contained in all publications are solely those of the individual author(s) and contributor(s) and not of MDPI and/or the editor(s). MDPI and/or the editor(s) disclaim responsibility for any injury to people or property resulting from any ideas, methods, instructions or products referred to in the content. |
© 2024 by the authors. Licensee MDPI, Basel, Switzerland. This article is an open access article distributed under the terms and conditions of the Creative Commons Attribution (CC BY) license (http://creativecommons.org/licenses/by/4.0/).
Copyright: This open access article is published under a Creative Commons CC BY 4.0 license, which permit the free download, distribution, and reuse, provided that the author and preprint are cited in any reuse.


