
Submitted:
12 June 2025
Posted:
12 June 2025
You are already at the latest version
Abstract
Against the backdrop of the current complex and changing world geopolitical landscape, ensuring national energy security has become the top priority of national energy governance.Enhancing the resilience of the oil and gas industry(OGI) chain is a key issue in addressing the global restructuring of industrial chains and the accelerated transformation of China's energy sector. This paper focuses on the primary contradictions facing the development of China's OGI, constructing a comprehensive evaluation index system for the resilience of China's OGI from four dimensions: resistance, recovery, innovation, and transformation. The resilience level of China's OGI chain from 2001 to 2022 was comprehensively evaluated using an entropy-weighted comprehensive assessment model, obstacle degree model, and coupling coordination degree model.The findings suggest that the overall resilience of China's OGI chain is exhibiting an upward trend, characterised by distinct phases. The performance of resilience varies significantly across different dimensions. The most notable of these is the improvement of resilience, whilst innovation capacity grows steadily, resistance remains relatively stable, and transformation capacity shows a significant increase after 2019. Carbon Capture, Utilization and Storage(CCUS )technology and innovation capabilities in the downstream industrial chain are two key obstacles that affect the resilience of the OGI chain.The overall trend shows an upward trend in the coordination and coupling of the various resilient subsystems within China's OGI.
Keywords:
OGI Chain (OGI)
; Resilienc degree
; obstacle degree
; coupling coordination degree
1. Introduction
Driven by rising international trade protectionism and escalating geopolitical tensions, the global energy market has experienced severe volatility, with external uncertainties intensifying and crises occurring frequently. The global OGI chain and value chain are undergoing significant disruptions and are being rapidly restructured. On the one hand, China’s dependence on foreign oil and gas resources is relatively high. The dependence on foreign oil has remained at around 70% for an extended period, and the dependence on foreign natural gas has also exceeded 40%. This means that Chinese OGI is highly vulnerable to fluctuations in the international oil and gas markets. On the other hand, China’s domestic energy supply and demand system is in a rapid transformation stage, and the important role of oil and natural gas as the “ballast stone” of national energy security is becoming more and more prominent. Its stable supply plays an irreplaceable role in ensuring the stability of the national economy and the stable development of society. The OGI is facing tremendous pressure for green and low-carbon transformation, for the rapid development of the new energy industry and the advancement of the China’s dual carbon goals of peaking carbon emissions before 2030 and achieving carbon neutrality before 2060. While ensuring energy supply, reduce carbon emissions and achieve sustainable development. On the premise of ensuring energy supply, China’s OGI needs to reduce carbon emissions and achieve sustainable development. As a basic industry to safeguard the national economy and people’s livelihood, the OGI is facing unpredictable risks and challenges brought by various “black swan” events at any time during this transformation. In this context, scientifically measuring the level of industrial chain resilience, deeply revealing the law of change in industrial chain resilience, and scientifically planning development paths are of great significance to improving energy security, ecological security and industrial security.
Holling (1973) first applied the concept of resilience to the field of ecology to explain the evolutionary characteristics within the ecosystem [1].
The concept of resilience was subsequently introduced into the fields of psychology, disaster science and economics to study the performance of specific objects under the influence of multiple external environmental factors. The development and evolution of resilience theory has at least three essential characteristics: (1) The system can withstand a series of changes and maintain control over its functions and structures, that is, equilibrium; (2) The system has the ability to self-organize, that is, self-organization; (3) The system has the ability to establish and promote learning adaptation, that is, innovation [2]. Walker (2004) believed that resilience mainly includes resistance, recovery and creativity [Error! Reference source not found.,4], and highly resilient systems can exhibit three types of resilience capabilities. Martin (2012) proposed a “4R” resilience theory analysis framework that includes resistance, recovery, renewal and repositioning capabilities [5]. Modern resilience theory emphasizes that when faced with a complex and uncertain environment, a system can achieve sustainable development through self-organization, learning, and innovation [6].
Industrial chain resilience is a new area of economic resilience research. Shishodia et al. (2021) defines industrial chain from the perspective of supply and demand chain and value chain.) [Error! Reference source not found.]. Guo Yaohui et al. (2025) Domestic scholars mainly define industrial chain resilience from the two dimensions of value chain and enterprise chain [8]. Ma, Li et al. (2023), Wang Yifan et al. (2024) Global industrial chain and value chain are developing in the direction of “regionalization”, “segmentation” and “localization”, and the risk of “chain breakage” is accelerating the reconstruction and unbalanced development of global industrial chain and value chain [Error! Reference source not found.,10].
There are three methods to measure resilience: single indicator method, sensitivity analysis method and comprehensive indicator analysis method. Among them, the comprehensive indicator analysis method is more widely used. It mainly includes the comprehensive weighting method of entropy weight and coefficient of variation (Gu Cheng et al. 2023) [11], dynamic combination weighting-TOPSIS method (Zhang Min, 2025; Wu, Anbo et al. 2023) [12,13,14,15], dynamic evaluation of base grey correlation (Wang Zeyu et al., 2023) [16,17] and entropy value comprehensive evaluation method (Guan Weihua, 2024) [18,19]. In terms of the evolution law of industrial chain resilience, the kernel density estimation, Dagum Gini coefficient decomposition method, σ test and Theil index are mainly used [11,Error! Reference source not found.,Error! Reference source not found.]. In terms of the correlation and attribution of industrial chain resilience system, the coupling coordination model and multi-matrix autoregression model are mainly used to analyze the correlation problems within the system and between different systems [21,22].
In the field of OGI, scholars focus on resource curse and industrial development issues [Error! Reference source not found.], driving factors of industrial development [24] and evolution paths of industrial development [25], energy investment return analysis of OGI [Error! Reference source not found.], ecological benefit evaluation and influencing factor analysis of OGI [27], impact evaluation of carbon emission reduction constraints on China’s OGI development [Error! Reference source not found.], and supply and demand forecasts of OGI under different scenarios [29,Error! Reference source not found.]. Research on the OGI from a resilience perspective is still in its infancy. Wu Wenjie et al. (2024) used the entropy method to measure the resilience level of the oil industry chain supply chain from 2002 to 2022, and used the DEMATEL-ISM model to find out the main factors affecting the resilience of the oil industry chain supply chain, Using macro indicators such as GDP and GDP per capital as key indicators to measure the economic resilience of the oil industry [Error! Reference source not found.].
The relevant results provide a good theoretical support and research foundation for this article. Although the research on the resilience of the OGI chain has started, it still needs to be supplemented from the following aspects: (1) In the context of the accelerated transformation of the energy industry at home and abroad, according to the actual situation of the development of China’s OGI, in addition to the energy security perspective, it is necessary to further supplement the industrial security and ecological security perspectives. (2) The oil industry and the natural gas industry have a strong intrinsic correlation. From natural gas reserves to mining, storage, transportation, processing, and sales, it is highly related to the oil industry. Therefore, the research object is expanded from the oil industry to the OGI. (3) Compared with exogenous factors such as the level of macroeconomic development and the industrial development environment, more attention should be paid to constructing an industrial chain resilience evaluation index system from the endogenous level.
2. Materials and Methods
2.1. Comprehensive Evaluation Index System for Resilience of OGI
Based on Martin’s “4R” resilience analysis framework, an OGI chain resilience evaluation index system is constructed from four dimensions: resistance, resilience, innovation and transformation. Refer to relevant research results, based on the principles of comprehensiveness, scientificity, typicality and availability of indicators, 4 first-level indicators, 13 second-level indicators and 35 third-level indicators are selected to construct a comprehensive evaluation index system for OGI resilience [31,32,33,34,35], as shown in Table 1.
The indicators are selected based on the following:
(1) Resistance Dimension. Resistance refers to the ability of a system to maintain its stability and continuous operation when facing external shocks and disturbances, that is, the ability to cope with uncertainty. During the past 20 years, analyzing from the sources of risk shocks, the main difficulties faced by China’s OGI are mainly insufficient domestic supply, high external dependence, import shortages and price shocks caused by international market turmoil, the impact of energy structure transformation on the industrial chain, and the pressure of dual control of carbon emissions (Total Carbon Emissions and Intensity). Based on this, this paper mainly selects three secondary indicators in the resistance dimension, namely resource guarantee capability, product supply capability and price buffer capability, to reflect the resistance of the OGI to risk shocks. The ability to cope with the dual control pressure of carbon emissions is analyzed from the dimension of transformation.
From the perspective of energy security and “two markets (domestic market and international market)”, this article selects four level 3 indicators to measure the resource security capacity of the OGI: recoverable reserves of oil, recoverable reserves of natural gas, dependence on oil imports, and dependence on natural gas imports.
Scholars usually choose to use “number of importing countries” and “import concentration” to reflect the OGI’s resistance to imported crises. Although such indicators can reflect the degree of risk, they cannot accurately reflect the ability to cope with risks. Therefore, this article chooses to use “Price buffering capacity of upstream and downstream of the industrial chain” to reflect the OGI’s ability to resist huge shocks caused by import shortages or international oil and gas price fluctuations.
(2) Resilience Dimension. Resilience refers to the ability of the OGI chain to quickly return to normal operation after suffering a shock [36]. Industrial foundation [Error! Reference source not found.], factor foundation, industry investment level and economic benefits are the basic conditions for the industrial chain to return to equilibrium after being impacted. This article selects 4 Level 2 indicators and 11 Level 3 indicators to reflect the OGI’s system repair capabilities after shocks.
(3) Innovation Dimension. Maintaining technological innovation capabilities is a key factor in achieving dynamic equilibrium in industrial development. When facing challenges and opportunities, the OGI chain can achieve sustainable development and enhance its competitiveness through technological innovation, product innovation, management innovation and other means. The selected secondary indicators include innovation input, innovation output, and technological innovation.
(4) Transformation Dimension. Transformation refers to the ability of the OGI chain to proactively adjust its industrial structure and achieve transformation and upgrading driven by changes in the external environment and its own development needs. This paper selects three secondary indicators, structural transformation, low-carbon transformation, and industrial chain extension and integration, and nine tertiary indicators, to reflect the innovation capability of the OGI.
According to the “14th Five-Year Plan for Modern Energy System” for China’s OGI development planning and the practice of reform and development of the domestic and foreign energy industries, the OGI shows characteristics and development trends of raw materialization, low carbonization, integration, diversification, digitalization and toolization. This article focuses on three aspects: raw materialization, low carbonization and integration. Raw materialization is chosen to reflect the structural transformation of the OGI; under the “dual control” system of carbon emissions, seven indicators such as carbon dioxide emissions and emission intensity, and CCUS annual CO2 storage level are selected to reflect the level of decarbonization. The number of enterprises extending downstream of the industrial chain reflects the level of integration of industrial development.
2.2. Evaluation Method
2.2.1. Resilience Comprehensive Evaluation Model
The key to comprehensive evaluation of multiple indicators lies in the reasonable determination of indicator weights to reflect the importance of each indicator to the overall system. There are two main methods for weight setting: subjective weighting method and objective weighting method. In order to avoid the influence of human subjective bias, this paper chooses the objective weighting method. Common objective weighting methods include entropy weight method, mean square error method, and dispersion method. Referring to the practices of Gu Cheng, Zhang Shushan (2023), Guan Weihua (2024) and Wu Wenjie (2024), the entropy weight method was chosen to determine the indicator weights [11,19,Error! Reference source not found.].
The entropy weight method is an objective weighting method based on information entropy theory. In multi-attribute decision analysis, different indicators carry different amounts of information and have different degrees of influence on the overall evaluation results. The core idea of this method is to determine the indicator weight by calculating the degree of discreteness (information entropy) of the indicator data. The smaller the entropy value, the greater the amount of information it carries.
(1) Data standardization. The original data is standardized and converted into dimensionless pure values to eliminate the dimensional effects between different indicators. Among them, is the original value of the j-th indicator in the i-th year, and are the minimum and maximum values of the j-th indicator, respectively, which are the standardized data.
For positive indicators (maximum), the normalized processing formula is:
For negative indicators (maximum), the normalized processing formula is:
For intermediate indicators, the normalized processing formula is:
(2) Calculate the proportion of the value of the i-th object under the j-th indicator to the indicator Pij. The standardized matrix Z at this time is:
Then:
(3) Calculate the entropy value Ej of the j-th indicator. When Pij=0, Pijln Pij=0.
(4) Calculate the coefficient of variation Gj of the j-th indicator
(5) Calculate the weight Wj of the j-th indicator
(6) Calculate the comprehensive resilience score of the OGI
Among them, Fz represents the comprehensive resilience level of the OGI chain, and Fa, Fb, Fc, and Fd represent the scores of the four dimensions of resistance, resilience, innovation, and transformation, respectively.
2.2.2. Obstacle Model
In order to better explore the key factors that inhibit the improvement of the resilience level of the OGI chain, the influence of each subsystem and each indicator within each subsystem on the improvement of the resilience of China’s OGI chain was examined, and the key factors affecting the improvement of the resilience of the industry chain were identified. According to Xiang, Kangli et al. (2022), Wang Bin, Tang Sheng (2023) et al. [38,Error! Reference source not found.], this paper selects the obstacle model for measurement.
The obstacle model is a method to identify key constraints by quantifying the degree of deviation of each indicator from the system goal. The core idea is: the greater the gap between the current value of a certain indicator and the ideal target, and the higher the importance (weight) of the indicator in the system, the stronger the obstacle effect of the indicator on the development of the system.
The method of using the obstacle model to identify the main obstacles to improving the resilience of China’s OGI is as follows:
(1) Calculate the factor contribution F, which reflects the expected contribution of the indicator to the system goal, usually equal to the weight Wj.
(2) Calculate the indicator deviation, which represents the gap between the actual value of the indicator and the optimal value.
(3) Calculate the obstacle degree Oij of each layer indicator.
2.2.3. Coupling Coordination Dgree Model (CCD Model)
According to the research of Martin, Ahmadi and others, from an evolutionary perspective, the resilience of the industrial chain is a dynamic evolutionary process of interaction and self-regulation among various links, elements and subsystems within the industrial system under the impact of external risks. From the perspective of resilience genesis, the resistance, resilience, innovation and transformation capabilities formed by the industrial chain in the face of risk shocks promote and restrict each other, and have a typical interactive coupling relationship. Referring to Xiao Cuixian (2021), Zhu Yongguang et al. (2023), the CCD model was used to analyze the relevant coupling coordination relationship between the subsystems in the urban resilience system and the copper industry resilience system [21,40]. This paper introduces a coupling coordination model to evaluate and grade the coupling relationship between the resistance, resilience, innovation and transformation capabilities of the resilience system of the OGI chain.
The CCD model is mainly used to analyze the coordinated development level of things. Generally, there are mutual influences and couplings between multiple subsystems.
(1) Calculate the coupling degree C
where is the number of subsystems, is the value of each subsystem, and the distribution range is [0,1]. That is, after standardization, the coupling degree C value range is also [0,1]. The larger the C value, the smaller the discreteness between subsystems and the higher the coupling degree; conversely, the lower the coupling degree between subsystems.
(2) Calculate the comprehensive coordination index T
where is the weight of the i-th subsystem, which is generally set to the same weight.
(3) Calculate CCD index D
2.3. Data Sources and Processing
The indicator data required for this article mainly come from the “China Statistical Yearbook”, “China Industrial Statistical Yearbook”, “China Energy Statistical Yearbook”, “China Environmental Statistical Yearbook” and “China Climate Change Yearbook” from 2002 to 2023. Among them, the data related to carbon emissions in the OGI comes from the China Emission Accounts and Datasets (CEADs), and the data related to Carbon Capture, Utilization, and Storage (CCUS) in the OGI comes from the CCUS Project Database (2024) of the International Energy Agency (IEA). Since some indicators were missing during the data collection process, linear regression interpolation method was used to supplement them.
3. Results Analysis
3.1. Analysis of The Results of The Resilience Evaluation of China’s OGI Chain
3.1.1. Comprehensive Index Analysis
Equations (3) to (12) are applied to calculate the comprehensive evaluation indexes of China’s OGI chain resilience, and the results are shown in Figure 1. The resilience of China’s OGI chain shows a fluctuating upward trend. The comprehensive resilience index increased from 0.23652 in 2001 to 0.72977 in 2022, with an average annual growth rate of 5.51%. The resilience of China’s OGI chain continues to increase. In order to further analyze the evolution process of its resilience index, the period from 2001 to 2022 is divided into five stages corresponding to China’s Five-Year Plan for Economic Development:
The first phase, from 2001 to 2005, corresponds to the period of China’s 15th Five-Year Plan. During this period, the resilience of China’s OGI showed a “V” shape, first declining and then rising. This is mainly because with the rapid economic growth, the demand for oil and gas resources has increased significantly. However, with the rapid rise in international oil prices in 2003, the domestic OGI has been faced with huge supply and demand pressures and cost pressures, and the industry’s resilience has declined. To cope with the impact, on the one hand, we continue to increase our efforts in oil and gas exploration and development, and on the other hand, we continue to actively expand overseas oil and gas cooperation. At the same time, with China’s accession to the World Trade Organization, the OGI has gradually opened up some markets. The three major state-owned oil companies, China National Petroleum Corporation, China National Petroleum Corporation and China National Offshore Oil Corporation, have completed their shareholding reforms and listed overseas. Competition in the OGI has become more diversified and the resilience of the OGI has increased.
The second stage, from 2006 to 2010, corresponds to the period of China’s 11th Five-Year Plan. During this period, the resilience of China’s OGI chain has steadily improved. As the economy grows, the demand for oil resources continues to grow, the country’s dependence on foreign oil continues to increase, and the contradiction between crude oil supply and demand intensifies. In order to cope with the risk of oil shortages, the country began to accelerate the construction of the oil reserve system at this time. China’s first oil reserve base was completed in 2006, and the National Petroleum Reserve Center was officially established in 2007. The national oil reserve system has increased the resilience of the OGI in responding to drastic fluctuations in international oil prices. This is confirmed by the 2008 Resilience Score. In 2008, international oil prices reached a historical high and then fell sharply, but the resilience of China’s OGI continued to steadily improve in 2008. At the same time, domestic exploration has achieved remarkable results in the past five years, and the scale of the refining and chemical industries has continued to expand. These are important reasons for promoting the steady improvement of overall resilience.
The third stage, from 2011 to 2015, corresponds to the period of China’s 12th Five-Year Plan. During this period, the resilience of China’s OGI also showed a “V” shape, first declining and then rising. The main reason for the decline in resilience in 2012 was the continued low international oil prices, which brought difficulties to investment decisions; at the same time, the domestic economic growth rate slowed down during this period, the growth rate of oil and gas demand slowed down, and the overall profitability of the domestic OGI declined. But overall, the resilience of the industrial chain has steadily improved from 2013 to 2015. This is mainly because China’s OGI has entered a stage of transformation and upgrading in the past five years. First, market-oriented reforms in the oil and gas sector have continued to deepen, with the relaxation of some oil price controls, etc., accelerating industry competition and improving resource allocation efficiency; second, breakthroughs have been made in the exploration and development of unconventional oil and gas such as shale gas, becoming a new growth point for oil and gas; third, international cooperation has become more diversified, not only strengthening cooperation in traditional regions such as the Middle East and Africa, but also having new cooperation projects in Latin America, Central Asia and other regions.
The fourth stage, 2016-2020, corresponds to China’s 13th Five-Year Plan period. After experiencing a slight decline in 2016, the resilience of China’s OGI has generally continued to grow during this period. In the past five years, international oil prices have fluctuated frequently, bringing uncertainty to the operations of oil and gas companies. The global energy transformation is accelerating, and the rapid development of new energy is creating competitive pressure on the OGI. The domestic economic growth rate has slowed down and the growth momentum of oil and gas market demand is insufficient. The “dual carbon” goals are increasingly placing constraints on carbon emissions in the OGI. However, the resilience of the OGI chain has steadily improved, mainly due to: first, the OGI has accelerated structural adjustment and green development, and the proportion of natural gas consumption has gradually increased; second, oil and gas exploration and development has expanded into deep sea and deep layers and other fields, and oil and gas supply capacity has increased; third, scientific and technological innovation capabilities have continued to increase, and the level of intelligence and digitalization of the OGI has been further improved.
The fifth stage, 2021-2022, corresponds to the first two years of China’s 14th Five-Year Plan. During this period, the global energy transformation accelerated, and the large-scale development of new energy had a substitution effect on the OGI. International geopolitics is complex and ever-changing, and the security of oil and gas supply faces challenges. Constrained by domestic carbon peak and carbon neutrality targets, the OGI needs to accelerate the pace of emissions reduction and carbon reduction. At the same time, competition in the oil and gas market has intensified, and companies need to continuously improve their competitiveness. During this period, the resilience of the industrial chain continued to improve mainly due to: first, the National Petroleum Reserve Center began to fully play its emergency management functions; second, CCUS technology began to develop rapidly. Thirdly, chemical raw materials have become the main driving force for the growth of oil demand, and natural gas consumption continues to grow in the fields of industry, urban gas, power generation et al.
3.1.2. Multidimensional Index Analysis
Equations (3) to (12) are applied to calculate the resilience index scores of different dimensions of China’s OGI chain, as shown in Figure 2.
In Figure 2, the overall dimensions of China’s OGI resilience showed a fluctuating upward trend from 2001 to 2022. Among them, the resilience index increased the most. The innovation index has steadily improved. The resistance index changes relatively steadily. The transformation index has increased significantly after 2019.
In order to clearly compare the characteristics of different stages, the indicators were selected for a total of six years, 2001, 2005, 2010, 2015, 2020 and 2022, to draw a radar chartof the resilience index of different dimensions of China’s OGI chain, as shown in Figure 3.
In Figure 3, the shape of the shadow in the figure is constantly changing, indicating that the functions of various dimensions of the resilience system of the OGI chain are constantly evolving and adjusting, and the OGI’s ability to disperse risk shocks is constantly increasing. The shaded area in the figure continues to expand, the overall resilience of the OGI chain has undergone substantial changes, and the ability to cope with risks has been enhanced.
3.2. Analysis of Key Barriers
To identify the key obstacles hindering the improvement of resilience in China’s OGI chain, formulas (13) to (14) were used to calculate the degree of obstacles in different dimensions of China’s OGI from 2001 to 2022. The results are shown in Figure 4.
In Figure 4, the obstacle values of the four dimensions fluctuated between 2001 and 2022. Among them, the trend of the obstacle degree in the resistance dimension is relatively stable, with slight increases in 2006-2011 and 2015-2022. The obstacle degree in the resilience dimension fluctuated the most, with a continuous decline between 2001 and 2011 and a significant increase between 2012 and 2015. The obstacle degree in the innovation dimension shows an overall downward trend, while the obstacle degree in the transformation dimension fluctuates upward. Among them, 2001-2014 is the first stage, and 2015-2021 is the second stage.
In summary, esilience has always been a key factor inhibiting the improvement of the resilience of China’s OGI. The overall innovation and development environment of China’s OGI has been relatively good over the past 22 years.
In order to clarify the key factors affecting the improvement of the resilience of China’s OGI, the obstacle factors from 2001 to 2022 were ranked respectively, and the top five key obstacle factors were extracted, as shown in Table 2.
From 2001 to 2021, indicator D8 (CCUS) has been ranked first in terms of obstacles. China began to focus on carbon dioxide enhanced oil recovery technology in 2000, which can be regarded as the early prototype of China’s CCUS technology. However, it was not until the 12th Five-Year Plan period that the OGI began to list CCUS as a key technology for research and development. It was not until after 2016 that CCUS technology entered the stage of large-scale and commercial exploration.
Indicator C4 (innovation results in the downstream of the industrial chain) ranked second in terms of obstacles 15 times in the 16 years between 2001 and 2016. 2001-2016 was the golden expansion period for the downstream of China’s OGI chain. Driven by high economic growth, refining capacity, sales network, etc. have experienced a spurt of growth. However, the market during this period was mainly driven by demand, and the scientific and technological research capabilities of the industry failed to fully match the market growth rate. From 2017 to 2021, indicator A4 jumped to the second place in the barrier ranking (dependence on natural gas imports). This is closely related to the explosive growth of China’s LNG imports after 2016. In 2006, China’s dependence on natural gas imports was less than 2%, and in 2021, it was 45.4%. With the long-term growth of urban gas demand and industrial demand, as well as the impact of factors such as the “dual carbon” transformation drive, this indicator still needs long-term attention.
From 2001 to 2021, the third-ranked obstacle index B11 appeared 8 times, B10 appeared 4 times, and B3 appeared 3 times. It can be seen that the overall economic efficiency of the OGI and the competition activity in the downstream of the industrial chain are the main reasons hindering the improvement of the resilience of the OGI chain, especially causing significant fluctuations in the resilience of the OGI chain.
From 2004 to 2013, indicator D7 appeared in the 4th-ranked indicator column 6 times and in the 3rd-ranked indicator column 3 times. Sulfur dioxide (SO₂) emissions from China’s OGI are mainly concentrated in the processing, refining, combustion, storage and transportation of sour natural gas. This shows that in the past 10 years, with the rapid development of the OGI, the application of low-sulfur technology has failed to offset the increase in emissions caused by the high growth of the industry.
Through the above analysis, it is found that the results of the obstacle degree analysis are basically consistent with the actual development of China’s OGI, indicating that the evaluation results are reliable.
3.3. Coupling Coordination Analysis
Using formulas (15) to (17), we calculated the coupling and coordination relationships between the various subsystems of China’s OGI chain resilience. The results are shown in Figure 5.
In Figure 5,the overall coordination of the various subsystems of China’s OGI chain resilience has maintaineda volatile upward trend from 2001 to 2022.In order to conduct phase-specific feature analysis, based on a hierarchical study of coupling coordination relationships, the natural breakpoint method was used to classify the resilience coupling coordination degree (CCD) of China’s OGI into five levels, as shown in Table 3: Level I Extremely Incoordination (0< R <0.3), Level II Mild Incoordination (0.3≤R < 0.5), Level III Primary Coordination (0.5≤R< 0.7), Level IV Mildly Coordination (0.7≤R < 0.9), and Level V High-quality Coordination (0.9≤R≤ 1.0).
From 2001 to 2003, the system was in Level I Extremely Incoordination, with CCD values showing a declining trend. From 2004 to 2007, it entered a state of Level II Mild Incoordination, but compared to the previous phase, CCD values overall maintained an upward trend, indicating that the coupling and coordination between subsystems were continuously improving. From 2008 to 2013, the system reached Level III Primary Coordination, but the CCD value showed a declining trend from 2010 to 2013. From 2014 to 2016, the CCD value exhibited significant fluctuations. Due to the declining trend in the CCD value from 2010 to 2013 in the previous cycle, the CCD value in 2014 reverted to Level II. Although the CCD value briefly returned to Level III in 2015, but in 2016, it returned to Level II. From 2017 to 2021, the CCD value rose to Level IV Mildly Coordination, with significantly improved coupling coordination among subsystems, indicating that the overall coordination of the OGI chain has improved when facing complex environments and challenges. In 2022, the CCD value exceeded 0.9, with coupling coordination among subsystems reaching Level V High-quality Coordination.
4. Discussion
This study conducted a comprehensive assessment of the resilience of China’s OGI chain and obtained a series of revealing results. Compared with the research results on the resilience of the OGI chain, this study has the following similarities and differences.
The similarities are: We chose to use the objective weighting method to construct a comprehensive evaluation model; we chose to conduct integration in different dimensions and periods; from the perspective of the overall resilience level, the resilience of China’s OGI chain showed a fluctuating upward trend, and its phased characteristics were obvious, indicating that the current OGI chain has a certain buffering, adaptability and recovery capabilities when facing various internal and external shocks.
The differences are: There are different interpretations of the concept of industrial chain resilience. Unlike Wu Wenjie and Feng Wangyi (2024), who regard indicators such as GDP, per capita GDP, and industrial added value as key factors in shaping the resilience of the OGI [Error! Reference source not found.], this paper tends to construct a comprehensive evaluation index system for the OGI based on endogenous factors (as shown in Table 1), while considering factors such as GDP fluctuations as exogenous shocks. This paper chooses to study the OGI as a whole. This is mainly due to the natural coexistence of oil and gas resources, their substitutability in consumption and use, and the identity of the development, processing and transportation production units. In addition, both the country’s energy industry policy and the oil and gas company’s development strategy layout will usually be considered as a whole. Only by studying the OGI as a whole can we more accurately reflect the complementary relationship between the development of China’s natural gas industry and oil industry after 2006 and fully, truly and comprehensively reflect their resource supply capabilities.
Although this study has achieved certain results in the comprehensive evaluation of the resilience of the OGI chain, there are still some limitations that need to be further improved and perfected in future research.
This study was limited by data availability and accuracy during the indicator selection and data collection process. The emergency reserve situation of national oil and gas resources is a key factor affecting the resilience of the OGI chain. However, since such data has not yet been made public, this article can only reflect it indirectly through indicators such as price buffer capacity. Since the data for 2023-2024 have not yet been fully disclosed, the research time dimension of this article only ends in 2022. Future research can further expand data sources and adopt a combination of multiple data collection methods to improve data integrity and reliability.
5. Conclusion and Implications
5.1. Research Conclusions
Based on Martin’s “4R” resilience theoretical framework, this paper comprehensively evaluates the resilience level of China’s OGI chain from 2001 to 2022 by constructing a comprehensive evaluation model based on the entropy weight method, an obstacle model and a CCD model. The main conclusions are as follows:
- (1)
- The resilience of China’s OGI chain is generally on the rise, with obvious phased characteristics. From 2001 to 2022, the resilience of China’s OGI chain increased from 0.23652 to 0.72977, with an average annual growth rate of 5.51%. Although China’s OGI has experienced multiple external shocks and internal adjustments during this period, its overall resilience has significantly improved, indicating that China’s OGI’s ability to cope with shocks is constantly improving.
- (2)
- According to the phased considerations of China’s five-year economic development plan cycle, the resilience of the OGI chain shows different characteristics at different stages. For example, during the 10th Five-Year Plan period, resilience showed a “V” shape, while resilience increased steadily during the 11th and 12th Five-Year Plan periods. This reflects the adaptability of the OGI in responding to fluctuations in international oil prices and changes in domestic economic growth rates. Although there were setbacks in the beginning of the 13th Five-Year Plan and the first two years of the 14th Five-Year Plan, it almost maintained long-term rapid growth. Despite frequent fluctuations in the international oil and gas market, the slowdown in China’s economic growth, and the global spread of COVID-19, the resilience of China’s OGI chain has still significantly increased. This shows that China’s OGI’s ability to resist risk shocks is constantly improving.
- (3)
- There are significant differences in resilience performance in different dimensions. The improvement in the resilience dimension was the most significant, the innovation dimension grew steadily, the resistance dimension was relatively stable, and the transformation dimension increased significantly after 2019. This shows that China’s OGI has made positive progress in technological innovation and low-carbon transformation, but its ability to resist external shocks still needs to be further strengthened.
- (4)
- Key obstacle factors are significant at different stages: Through obstacle analysis, it is found that resilience is the key factor inhibiting the improvement of the resilience of the OGI chain. In particular, CCUS technology and innovative achievements in the downstream of the industrial chain are the main obstacles. In addition, the dependence on natural gas imports and the economic benefits of the industrial chain also have a significant impact on improving resilience.
- (5)
- The CCD of the subsystems of China’s OGI chain has gradually improved. From 2001 to 2022, the CCD between the four subsystems of resistance, resilience, innovation and transformation of China’s OGI chain gradually increased from mild imbalance to moderate coordination, indicating that the synergy between the subsystems continued to increase and the overall ability of the industry chain to cope with risks significantly improved.
5.2. Research Implications
Based on the above research conclusions, the following insights are drawn:
- (1)
- The path to improving the resilience of China’s OGI chain mainly relies on technological innovation and low-carbon transformation. In the future, we should continue to increase the research and development and application of CCUS technology, reduce carbon emission intensity, and promote the transformation of the OGI towards a green and low-carbon direction. The oil and gas import structure should be further optimized to reduce dependence on a single country or region and enhance the risk resistance of the industrial chain.
- (2)
- Government policy support has an important impact on improving the resilience of the OGI chain. 1) Strengthen support for technological innovation. The government should increase financial and policy support for technological innovation in the OGI, especially in the fields of CCUS technology and unconventional oil and gas development, to promote the development of the industrial chain towards high-end and intelligent directions. 2) Optimize energy structure: Under the “dual carbon” goal, we should accelerate the use of clean energy such as natural gas, reduce the proportion of oil consumption, and enhance the diversity and sustainability of the energy structure [Error! Reference source not found.]. 3) Improve the national oil reserve system. Further expand the scale of national oil reserves, enhance the ability to cope with international oil price fluctuations and supply disruptions, and ensure energy security [Error! Reference source not found.,43].
Author Contributions
Conceptualization, Methodology, Data curation, Software, Validation, Writing–original draft, Writing–review & editing were performed by Yanqiu Wang. Conceptualization, Supervision, Methodology, Formal analysis, Validation, Writing–review & editing were conducted by Lixia Yao. Supervision, Formal analysis, Validation, Writing–review & editing were finished by Xiangyun LI. Supervision, Formal analysis, Writing–review & editing were finished by Zhaoguo Qin.All authors have read and agreed to the published version of the manuscript.
Funding
Supported by the Philosophy and Social Science Planning Project of Heilongjiang Province (24JYE011).
Institutional Review Board Statement
Not applicable.
Informed Consent Statement
This submission does not require an ethics statement.
Data Availability Statement
The datasets used and/or analyzed during the current study are available from the corresponding author on reasonable request.
Acknowledgments
The authors are grateful to all colleagues who helped us with this research.
Conflicts of Interest
The authors have declared that no competing interest exist.
Abbreviations
The following abbreviations are used in this manuscript:
| OGI | Oil and Gas Industry |
| CCD | Coupling Coordination Degree |
References
- Holling, C.S. (1973). Resilience and Stability of Ecological Systems. Annual Review of Ecology, Evolution, and Systematics, 4, 1-23. [CrossRef]
- Stadtfeld, G. M., & Gruchmann, T. (2023). Dynamic capabilities for supply chain resilience: A meta-review. The International Journal of Logistics Management. [CrossRef]
- Walker, B. W., Holling, C. S., Carpenter, S. R., & Kinzig, A. (2004). Resilience, adaptability and transformability in social-ecological systems. Ecology and Society, 9(2), 5. [CrossRef]
- Pu, G., Zhang, J., Wang, Y., & Li, S. (2022). Effect of supply chain resilience on firm’s sustainable competitive advantage: A dynamic capability perspective. Environmental Science and Pollution Research, 30, 4881–4898. [CrossRef]
- Martin, J., et al. (2012). Environmental indicator report 2012: Ecosystem resilience and resource efficiency in a green economy in Europe. European Environment Agency.
- Pisano, U. (2012). Resilience and sustainable development: Theory of resilience, systems thinking and adaptive governance. European Sustainable Development Network.
- Shishodia, A., et al. (2021). Supply chain resilience: A review, conceptual framework and future research. The International Journal of Logistics Management. [CrossRef]
- Guo Yaohui, Xie Lei & Du Xingduan. (2025). Evaluation of food security resilience: system construction, development differences and barrier analysis. Rural Economy, (01), 29-37.
- Ma, L., et al. (2023). Global industrial chain resilience research: Theory and measurement. Systems, 11(5), 466. [CrossRef]
- Wang Yifan, Yang Hanfang & Wang Xiaosong. (2024). Construction of a new development pattern of dual circulation from the perspective of industrial chain and supply chain security: A study based on an open macro model. International Financial Research, (12), 22-35. [CrossRef]
- Gu Cheng & Zhang Shushan. (2023). Research on the measurement, regional differences and convergence of industrial chain resilience. Economic Problem Exploration, (06), 123-139.
- Zhang Min. (2025). Research on the measurement and influencing factors of resilience of China’s high-tech industrial chain. Statistics and Decision, 41 (03), 118-123. [CrossRef]
- Wu, A. B., et al. (2023). Research on resilience evaluation of coal industrial chain and supply chain based on interval type-2F-PT-TOPSIS. Processes, 11(7), 2080.
- Wang Shouwen, Guo Rui & Wang Shubin. (2025). Research on the coordinated evolution and influencing factors of China’s energy resilience and scientific and technological innovation. Chinese Soft Science, (01), 208-224.
- Ouyang, M., Dueñas-Osorio, L., & Min, X. (2012). A three-stage resilience analysis framework for urban infrastructure systems. Structural Safety, 36–37, 23–31. [CrossRef]
- Wang, Z.Y., Tang, Y.Q., Han, Z.L. & Wang, Y.X. (2022). Measurement of resilience of marine shipping industry chain in coastal provinces of China and its influencing factors. Economic Geography, 42 (07), 117-125. [CrossRef]
- Zuo Zhili, Cheng Jinhua, Guo Haixiang & Zhan Cheng. (2024). Evolution and evaluation of the structural resilience of lithium industry chain trade network. Chinese Journal of Population, Resources and Environment, 34 (02), 155-166.
- Sun Yang, Zhang Luocheng & Yao Shimou. (2017). Evaluation of resilience of cities at prefecture level in the Yangtze River Delta based on the perspective of social ecological system. Chinese Population, Resources and Environment, 27 (08), 151-158.
- Guan W., Xu H., Wu W., Wu X., Zhang H. & Wu L. (2024). Comprehensive and dynamic prediction of urban resilience in Nanjing based on the new development concept. Geographical Science, 44 (04), 681-692. [CrossRef]
- Chang Xin & Han Ping. (2024). Research on the measurement, spatiotemporal evolution and regional differences of resilience of China’s digital industry chain. Statistics and Decision, 40 (16), 28-32. [CrossRef]
- Zhu, Y.G., Zhang, W.F., Wang, D., Dou, S.Q. & Xu, D.Y. (2023). Evaluation of supply chain resilience of China’s copper resource industry chain. Resources Science, 45 (09), 1761-1777.
- Zhao Yu, Ye Shiqi, Yang Cuihong & Hong Yongmiao. (2025). Measurement, correlation and attribution of industrial chain resilience from the perspective of big data. Chinese Journal of Industrial Economics, (02), 61-79. [CrossRef]
- Andrews-Speed, P. (2015). China’s oil and gas industry: Stranded between the plan and the market. The Oxford Institute for Energy Studies.
- Vermeer, E. B. (2015). The global expansion of Chinese oil companies: Political demands, profitability and risks. China Information, 29(1), 3–32. [CrossRef]
- Wang Yukun, Wang Zhaohua & Ding Yueting. Evolution of natural gas development path and resilience measurement of supply and demand system based on system dynamic response. Systems Engineering - Theory and Practice, 1-18.
- Kong, Z. Y., Dong, X. C., & Jiang, Q. Z. (2018). Analysis of energy return on investment of China’s oil and gas production. IOP Conference Series: Earth and Environmental Science, 146, 012052.
- Liu, C. Z., et al. (2023). Energy eco-efficiency in China’s oil and gas resource-based enterprises and its influencing factors: A data envelopment analysis from static and dynamic perspectives. Polish Journal of Environmental Studies, 32(3), 2825–2837. [CrossRef]
- Lyu, C., Lv, Y. L., & Zhang, J. (2024). A model for determining CO2 emission reduction targets in China’s oil and gas industry. SPE International Conference and Exhibition on Health, Safety, Environment, and Sustainability.
- Zhang Chuanping & Liu Le. (2015). System dynamics analysis of oil supply and demand security in my country. Science and Technology Management Research, 35 (20), 143-149.
- Chen, S. (2022). Research on the resilience of my country’s petroleum energy system under the import shortage scenario (PhD dissertation, China University of Mining and Technology). PhD https://link-cnki-net-s.webvpn.nepu.edu.cn/doi/10.27623/d.cnki.gzkyu.2022.000079. [CrossRef]
- Wu Wenjie & Feng Wangyi. (2024). Evaluation of the resilience of China’s oil industry chain and supply chain. Journal of Xi’an Shiyou University (Social Science Edition), 33 (06), 23-30+70.
- Xiao Xingzhi & Li Shaolin. (2022). Industrial chain resilience under major changes: generation logic, practical concerns and policy orientation. Reform, (11), 1-14.
- Cai Wugan & Xu Fengru. (2022). Research on the measurement and spatiotemporal evolution characteristics of China’s industrial resilience. Economic System Reform, (06), 90-97.
- Li Yan. (2023). Improving the resilience and security of my country’s industrial chain and supply chain in accelerating the construction of a new development pattern. Economic Perspectives, (11), 51-58. [CrossRef]
- Xi, X., et al. (2020). Impact of the global mineral trade structure on national economies based on complex network and panel quantile regression analyses. Resources, Conservation and Recycling, 161, 104989. [CrossRef]
- Li Xiaohua. (2022). The supporting foundation of industrial chain resilience: From the perspective of industry rootedness. Gansu Social Sciences, (06), 180-189. [CrossRef]
- Farley, J., & Voinov, A. (2016). Economics, socio-ecological resilience and ecosystem services. Journal of Environmental Management, 183, 389–398. [CrossRef]
- Xiang, K. L., et al. (2022). Evaluation and obstacle degree analysis of low-carbon development level in Fujian province–based on entropy weight TOPSIS method. Frontiers in Energy Research, 10, 966708. [CrossRef]
- Wang Bin & Tang Sheng. (2023). Evaluation of intensive utilization of cultivated land resources in China and diagnosis of barrier factors. Macroeconomic Research, (05), 117-127. [CrossRef]
- Xiao, Cuixian. (2021). Research on comprehensive evaluation of urban resilience in China (PhD dissertation, Jiangxi University of Finance and Economics). PhD https://link-cnki-net-s.webvpn.nepu.edu.cn/doi/10.27175/d.cnki.gjxcu.2021.001855. [CrossRef]
- Li Xiangjun & Li Mengmeng. (2023). Resilience reconstruction plan for key industry supply chains in the United States and its implications. Macroeconomic Management, (03), 83-90. [CrossRef]
- Han, S. Y., et al. (2023). The coupling and coordination degree of urban resilience system: A case study of the Chengdu–Chongqing urban agglomeration. Environmental Impact Assessment Review, 101, 107131. [CrossRef]
- Ni Hongfu, Zhong Daocheng & Fan Zijie. (2024). Measurement, structure and international comparison of China’s industrial chain risk exposure: from the perspective of production chain length. Management World, 40 (04), 1-26+46+27-45. [CrossRef]
Figure 1.
Resilience Index and Trend of China’s OGI from 2001 to 2022.
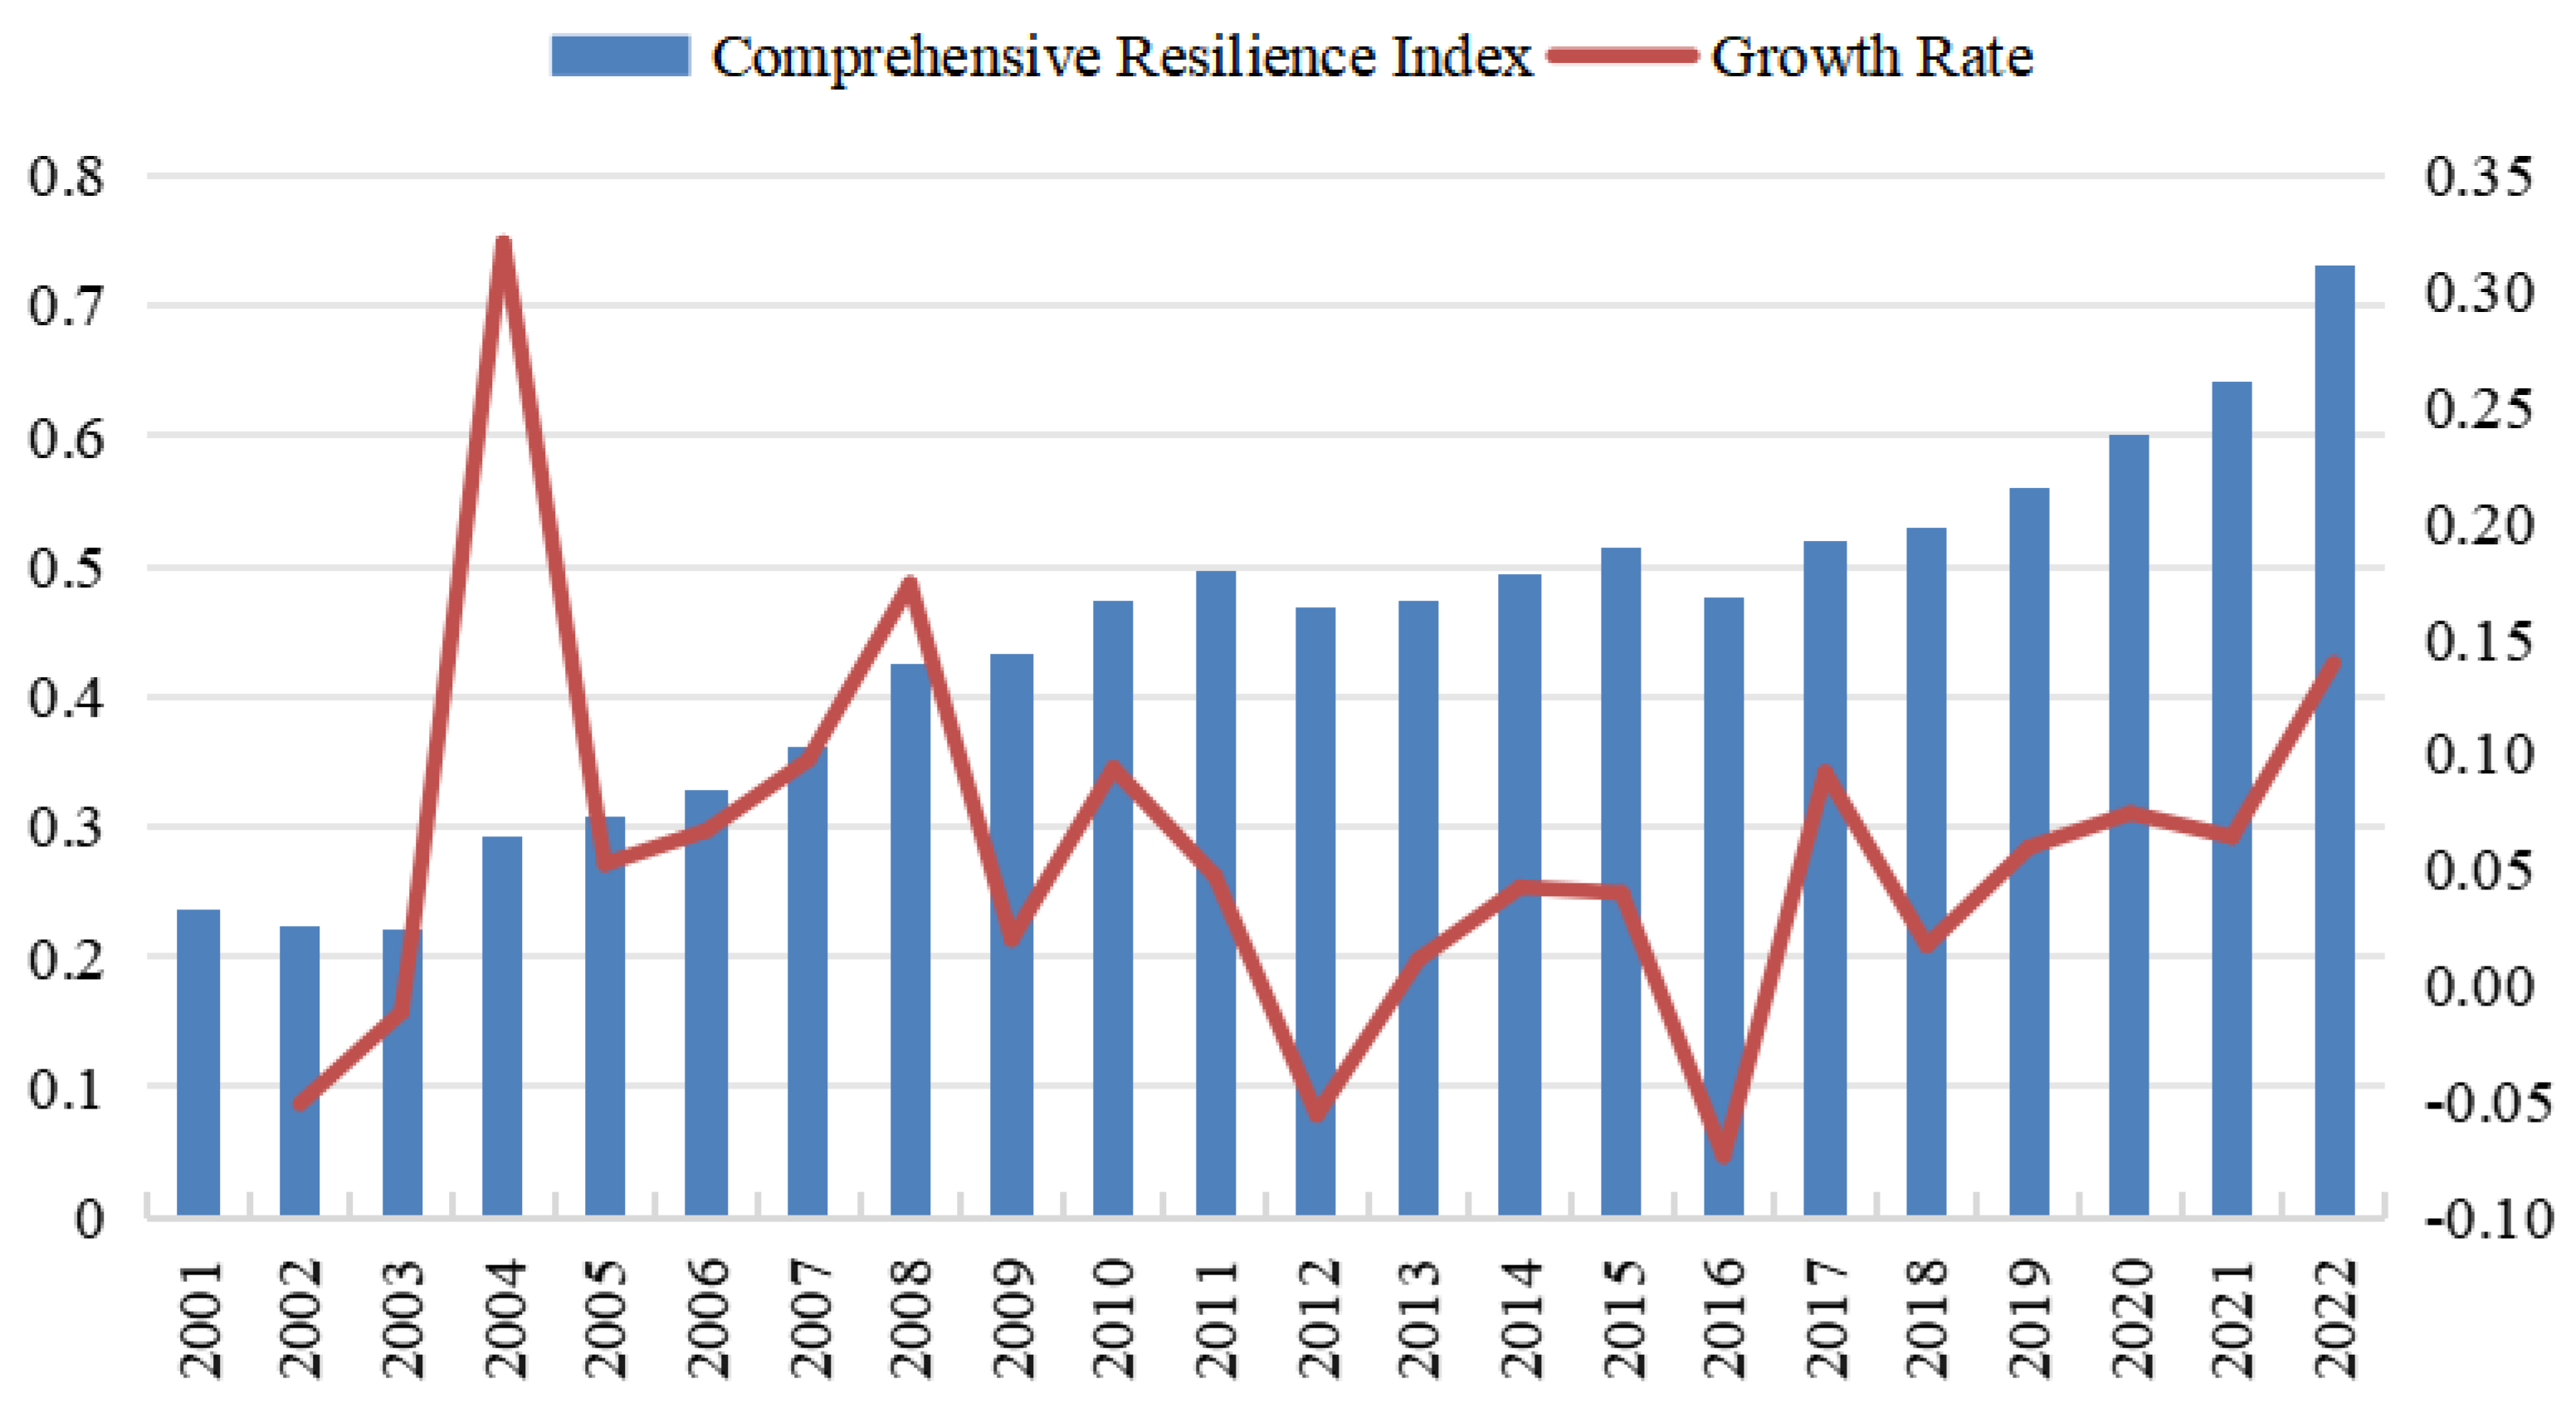
Figure 2.
Trends in Resilience Index of China’s OGI Chain in Different Dimensions from 2001 to 2022.
Figure 2.
Trends in Resilience Index of China’s OGI Chain in Different Dimensions from 2001 to 2022.
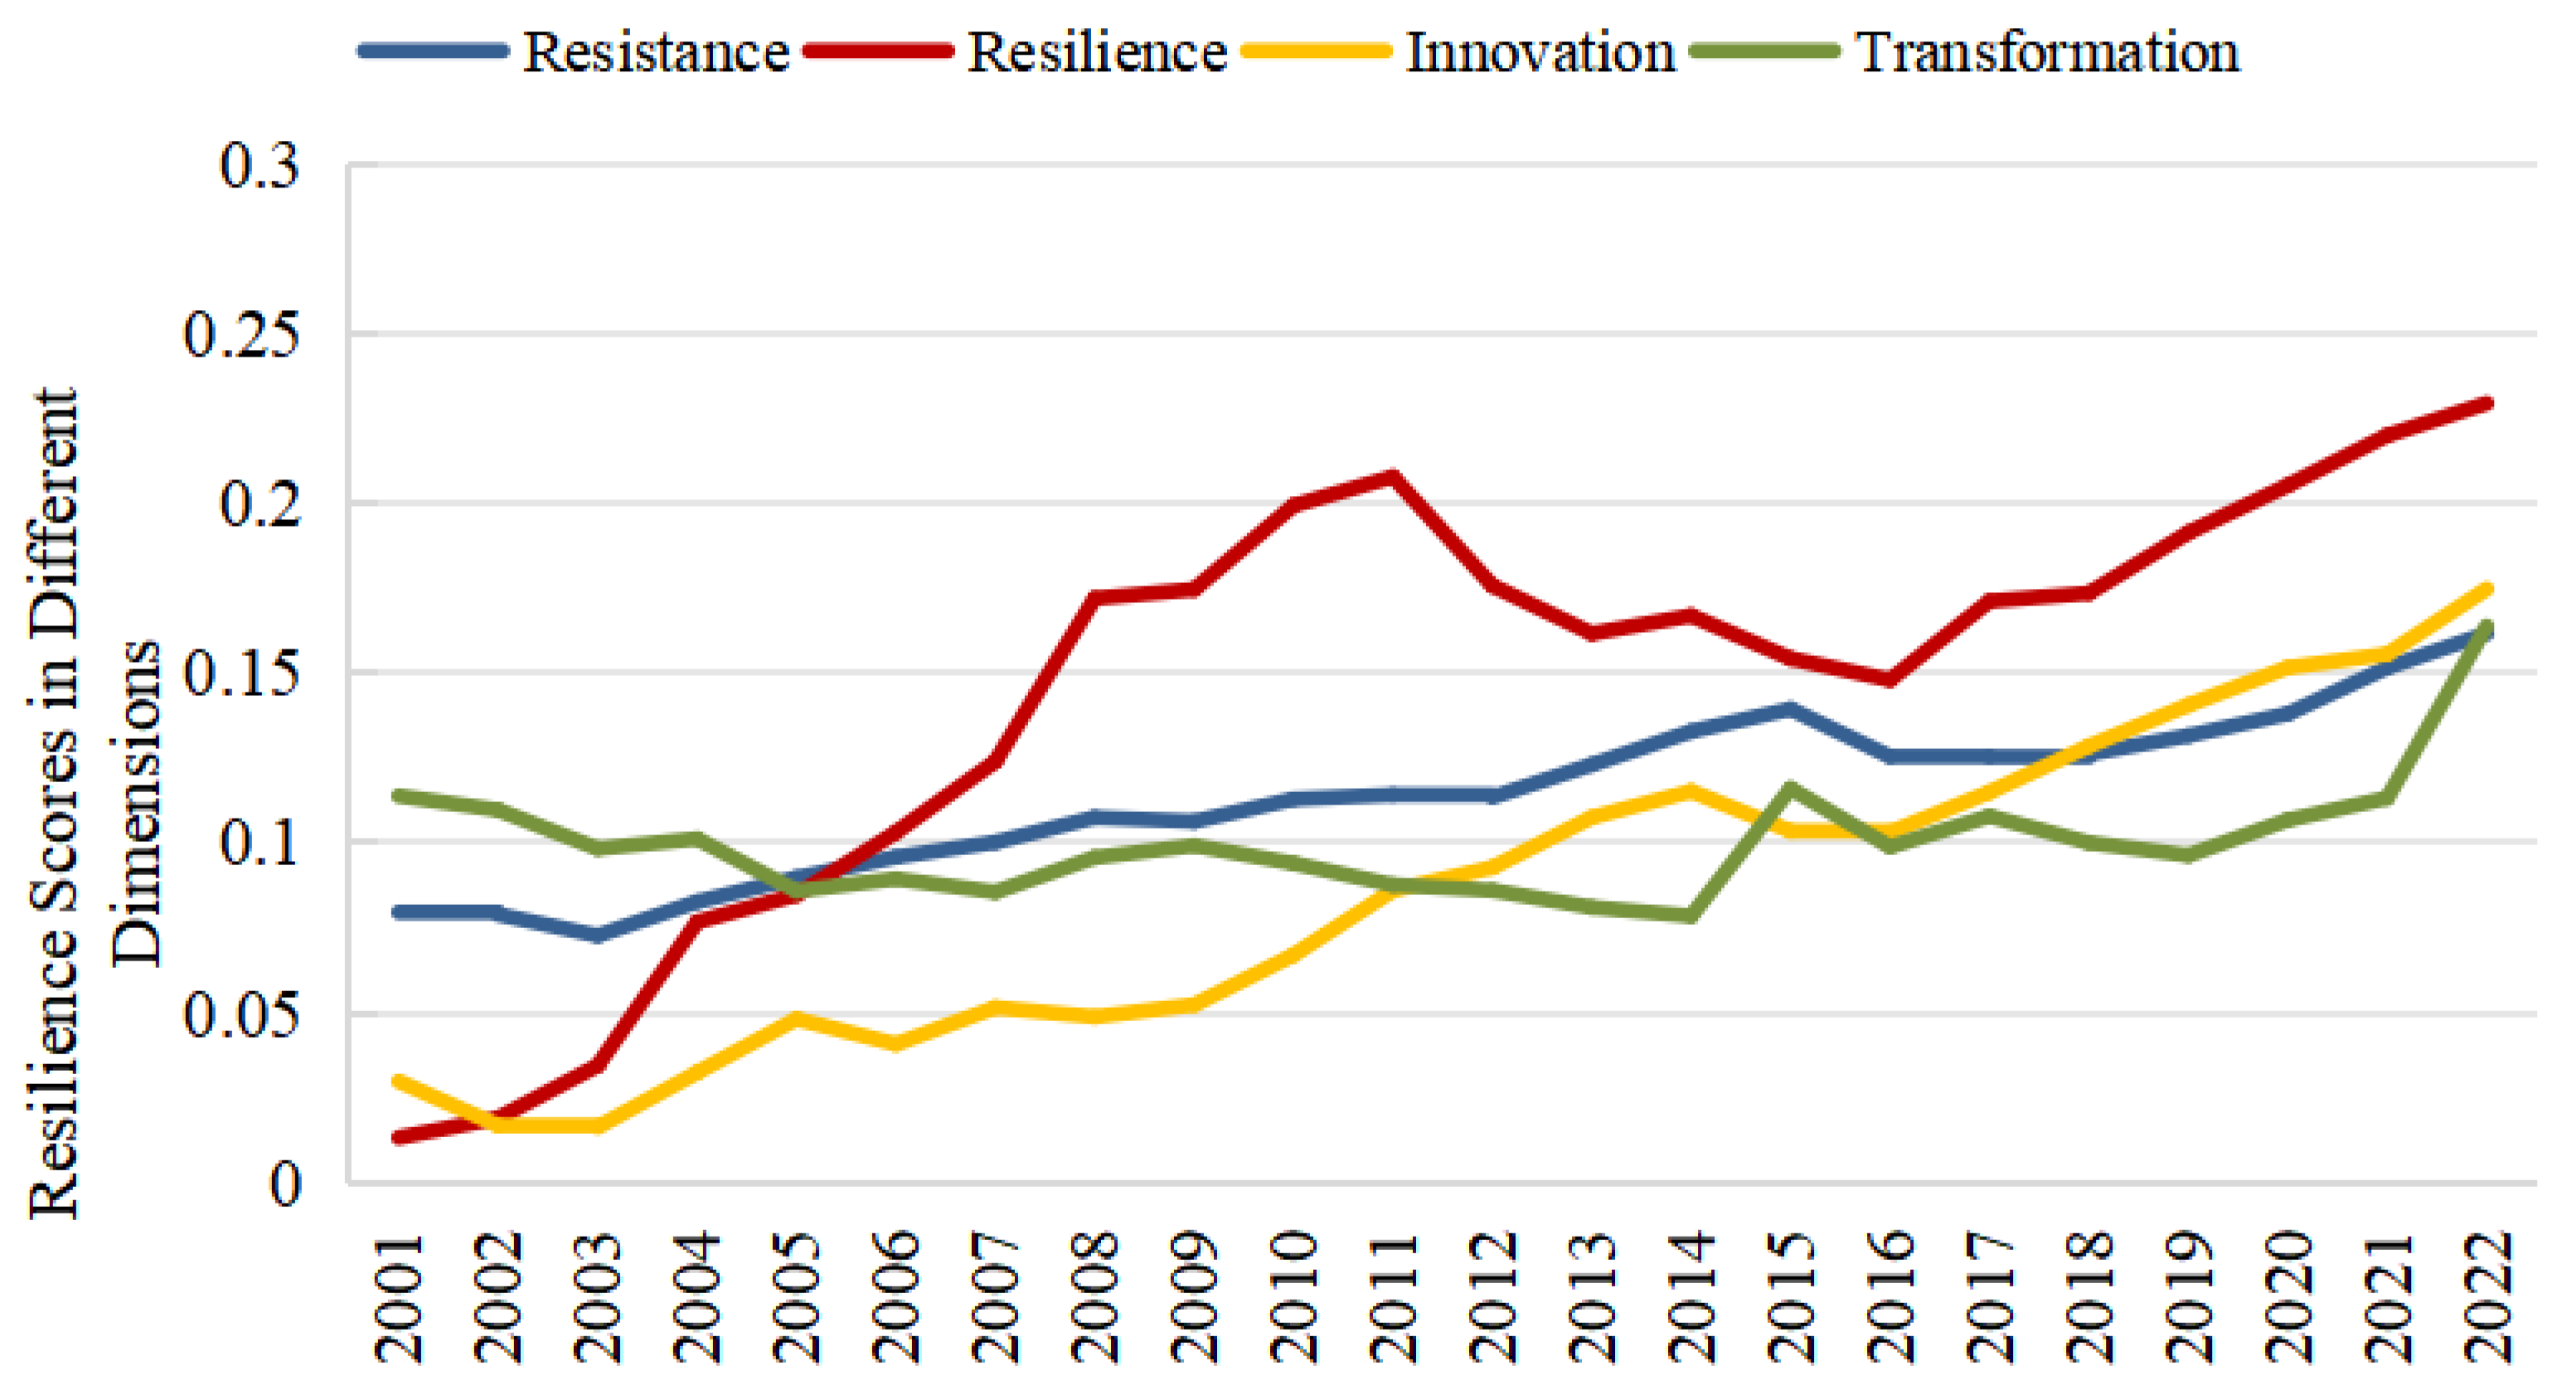
Figure 3.
Radar Chart of the Resilience Index Evolution of China’s OGI Chain.
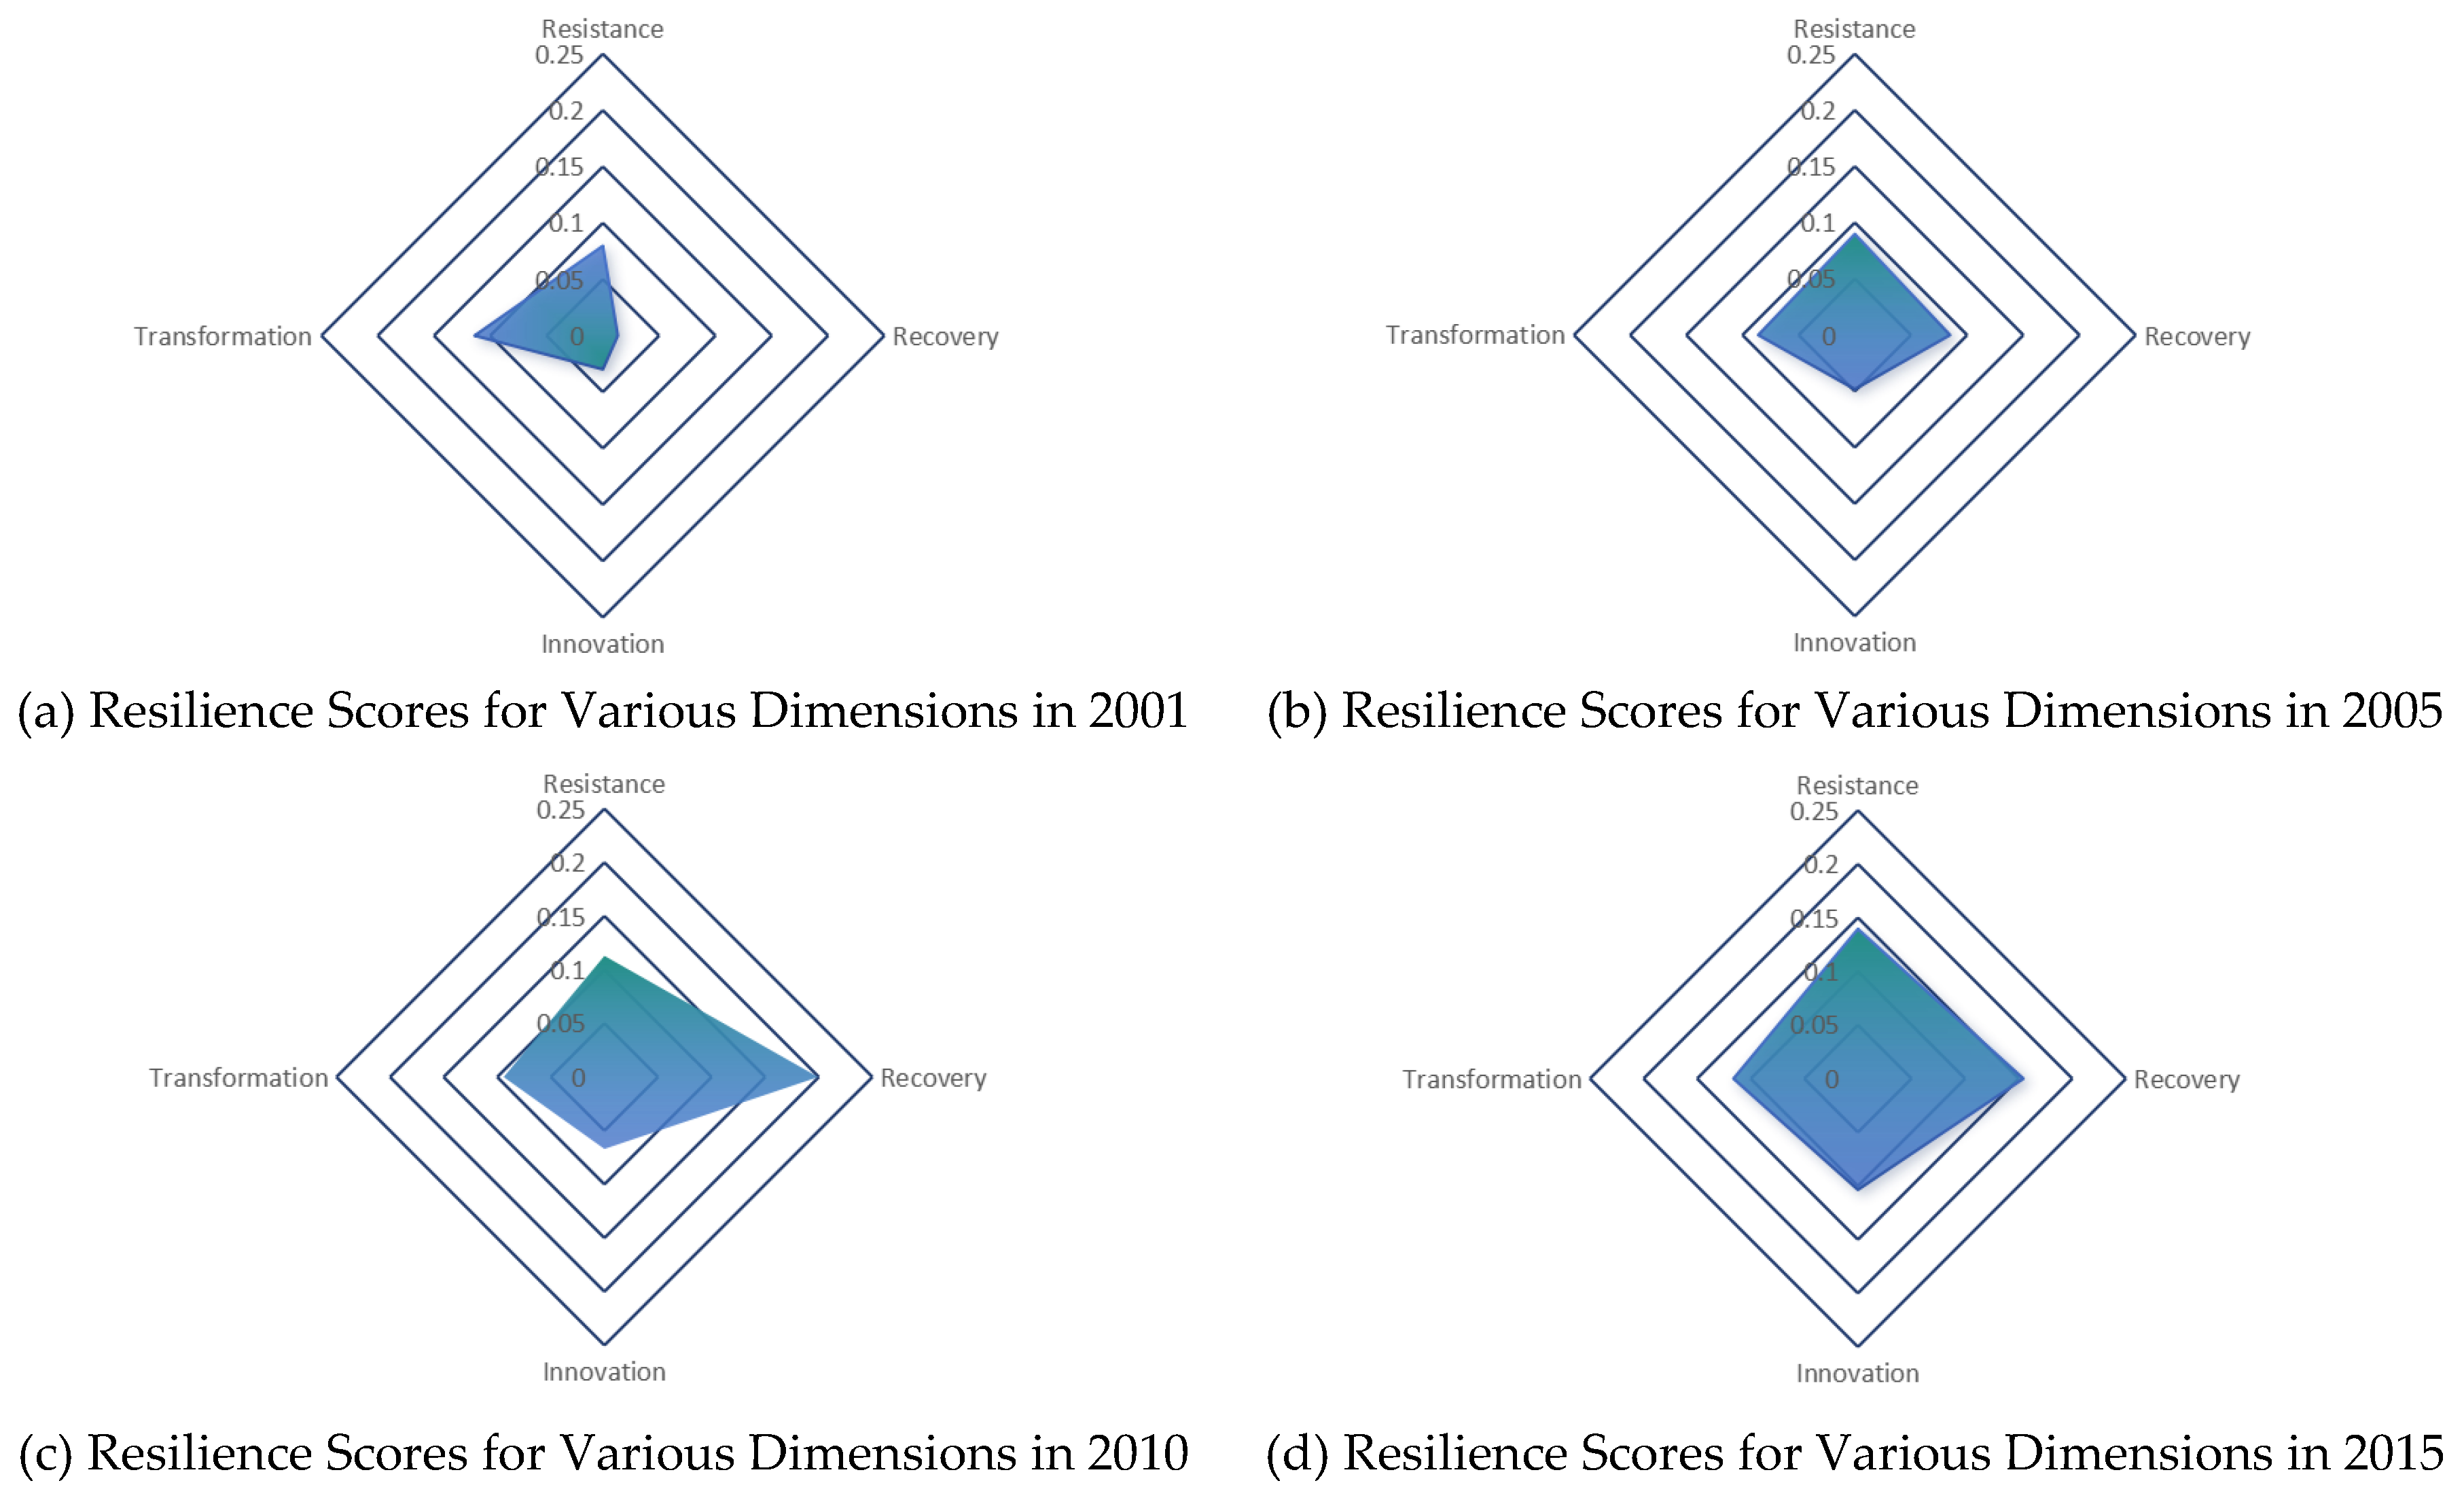
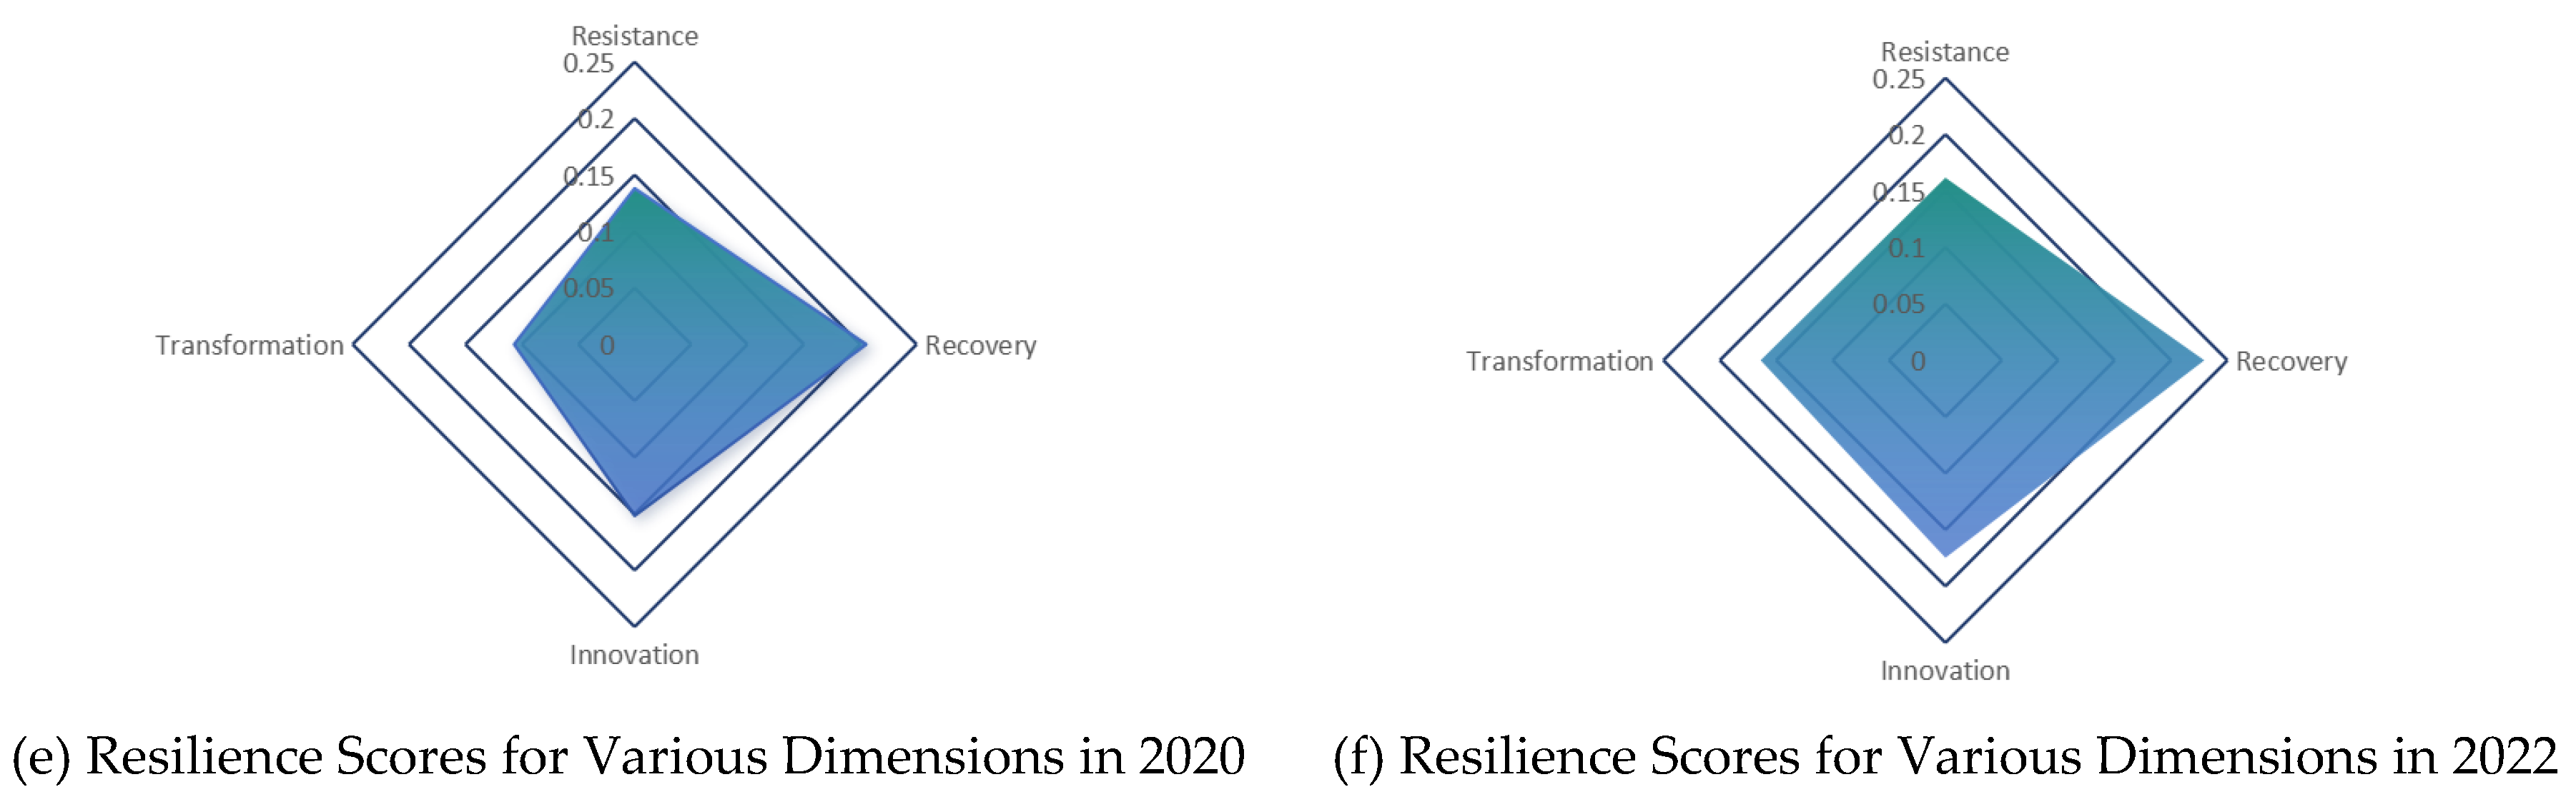
Figure 4.
Trend of Obstacle Degree Changes in Various Dimensions of China’s OGI.
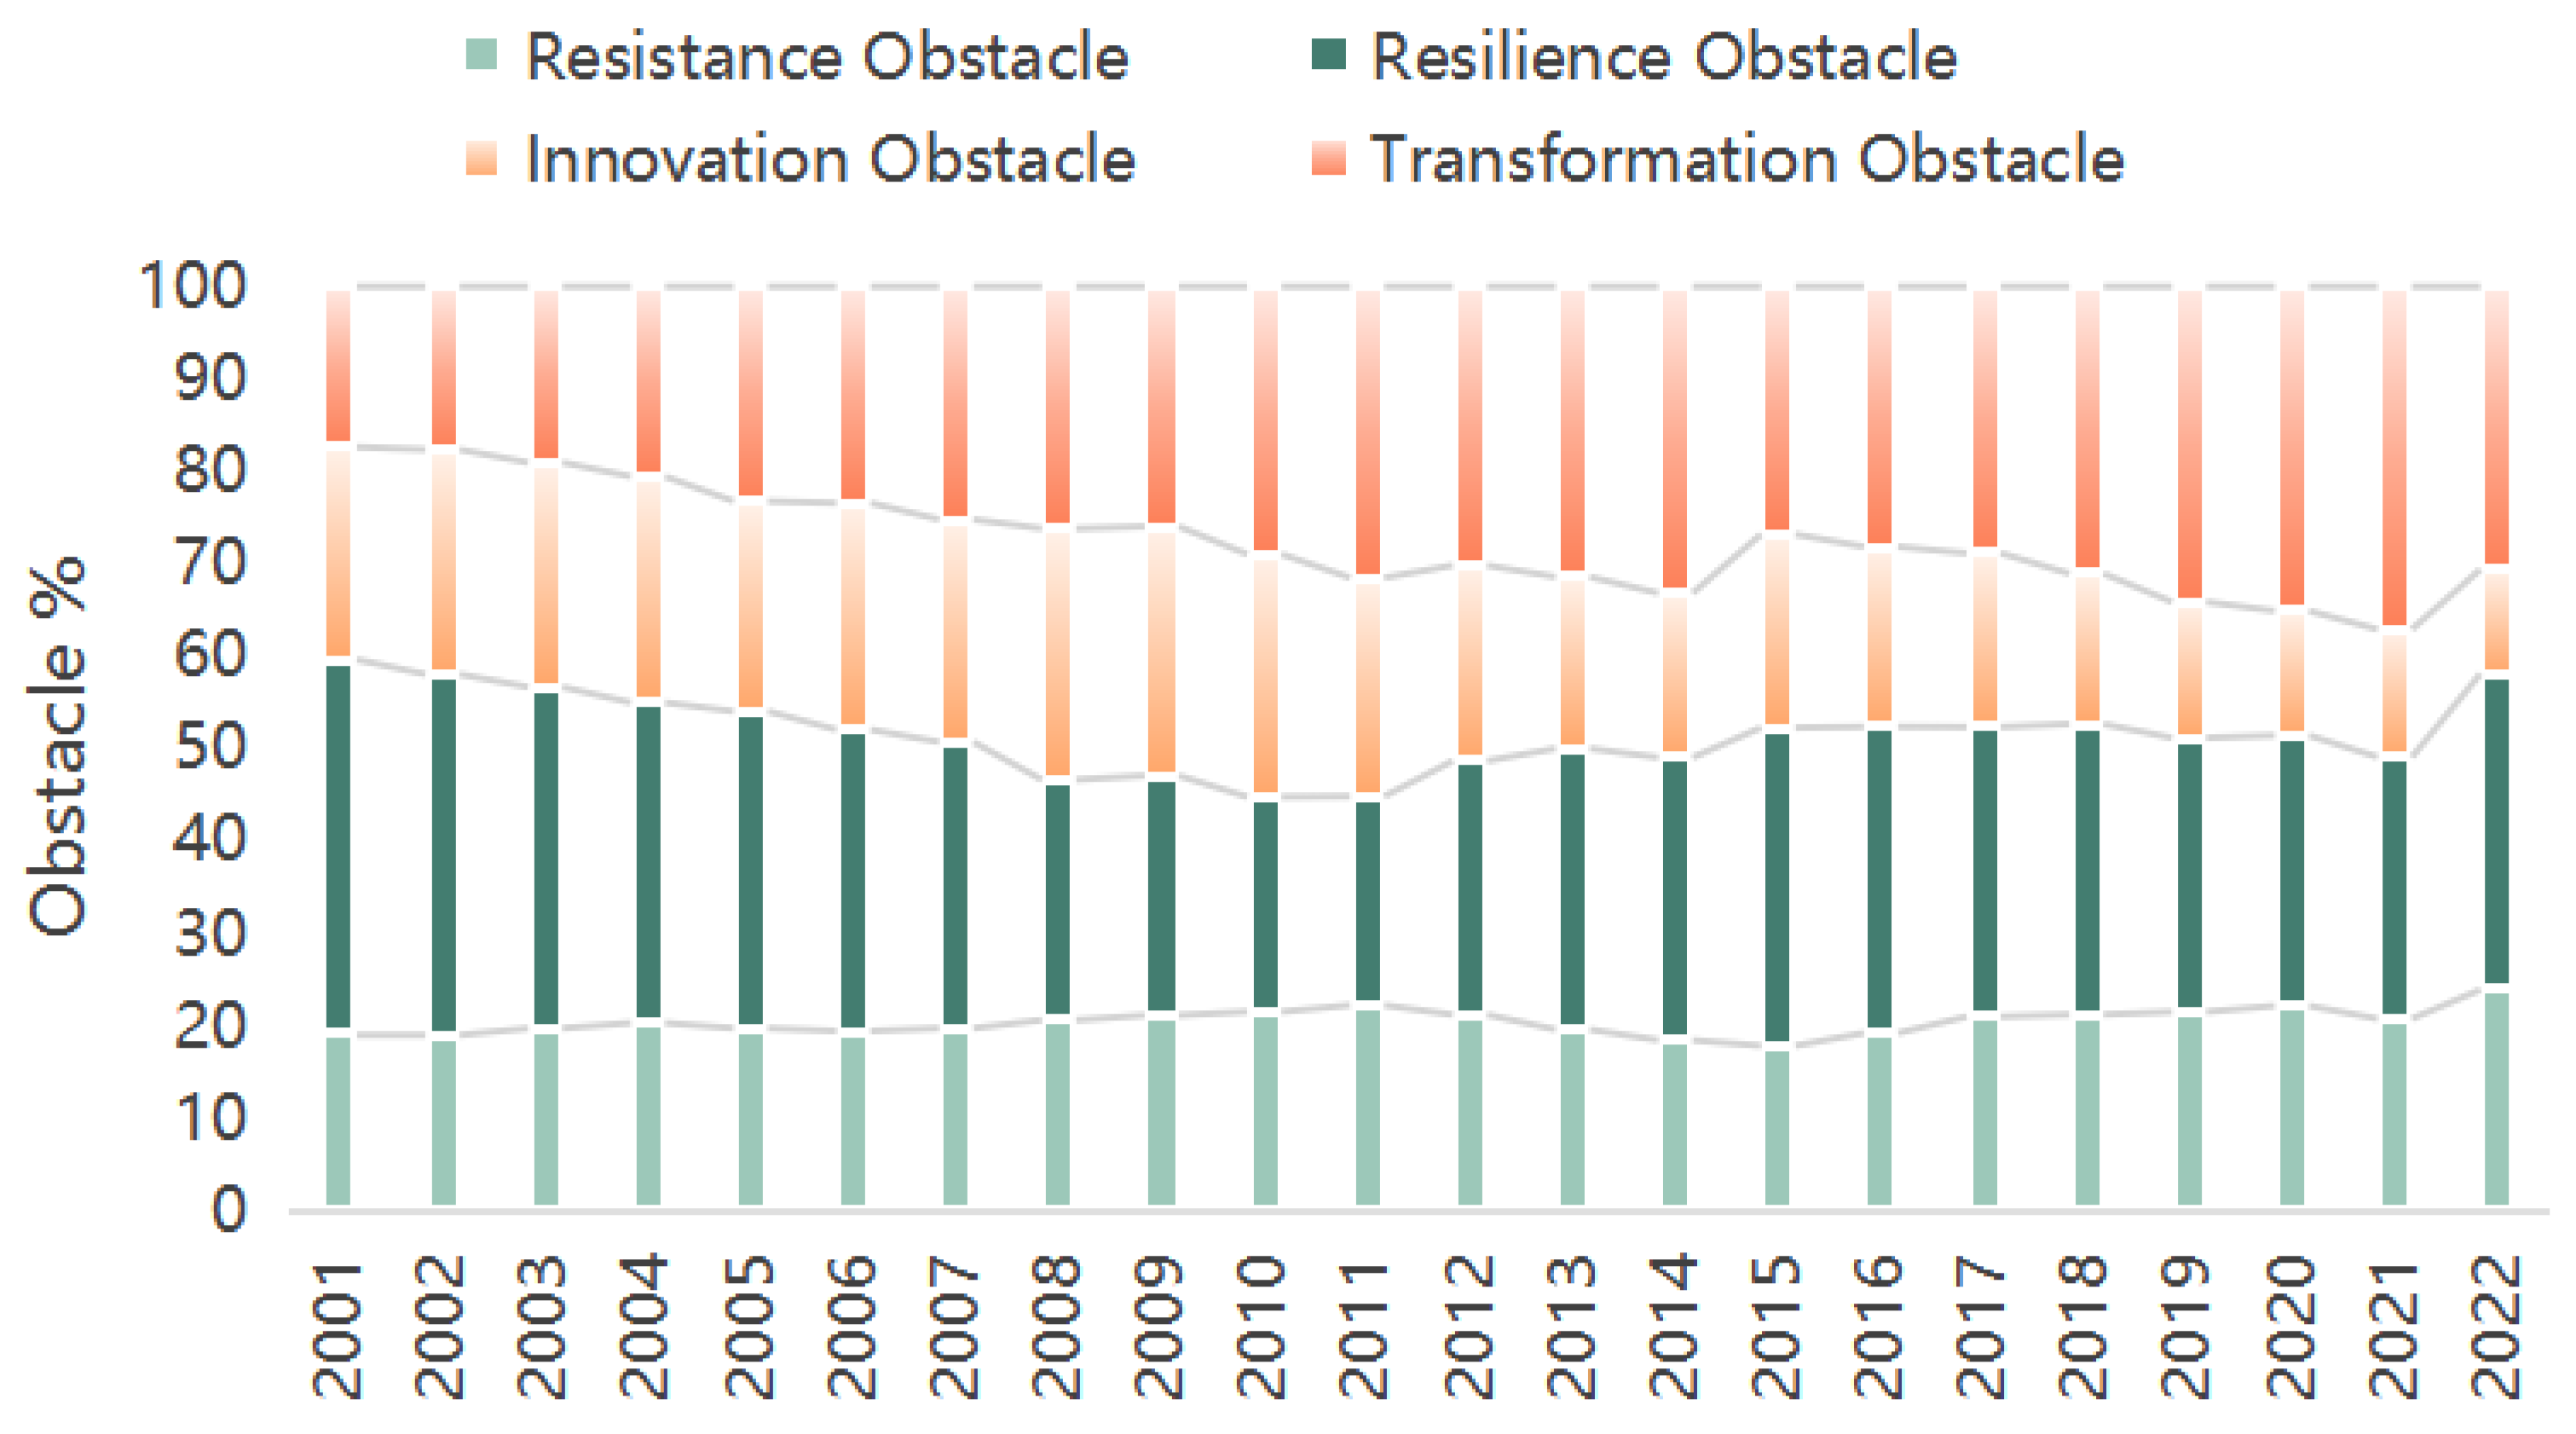
Figure 5.
Resilience Coupling Coordination of Resilience Subsystems in China’s OGI Chain.
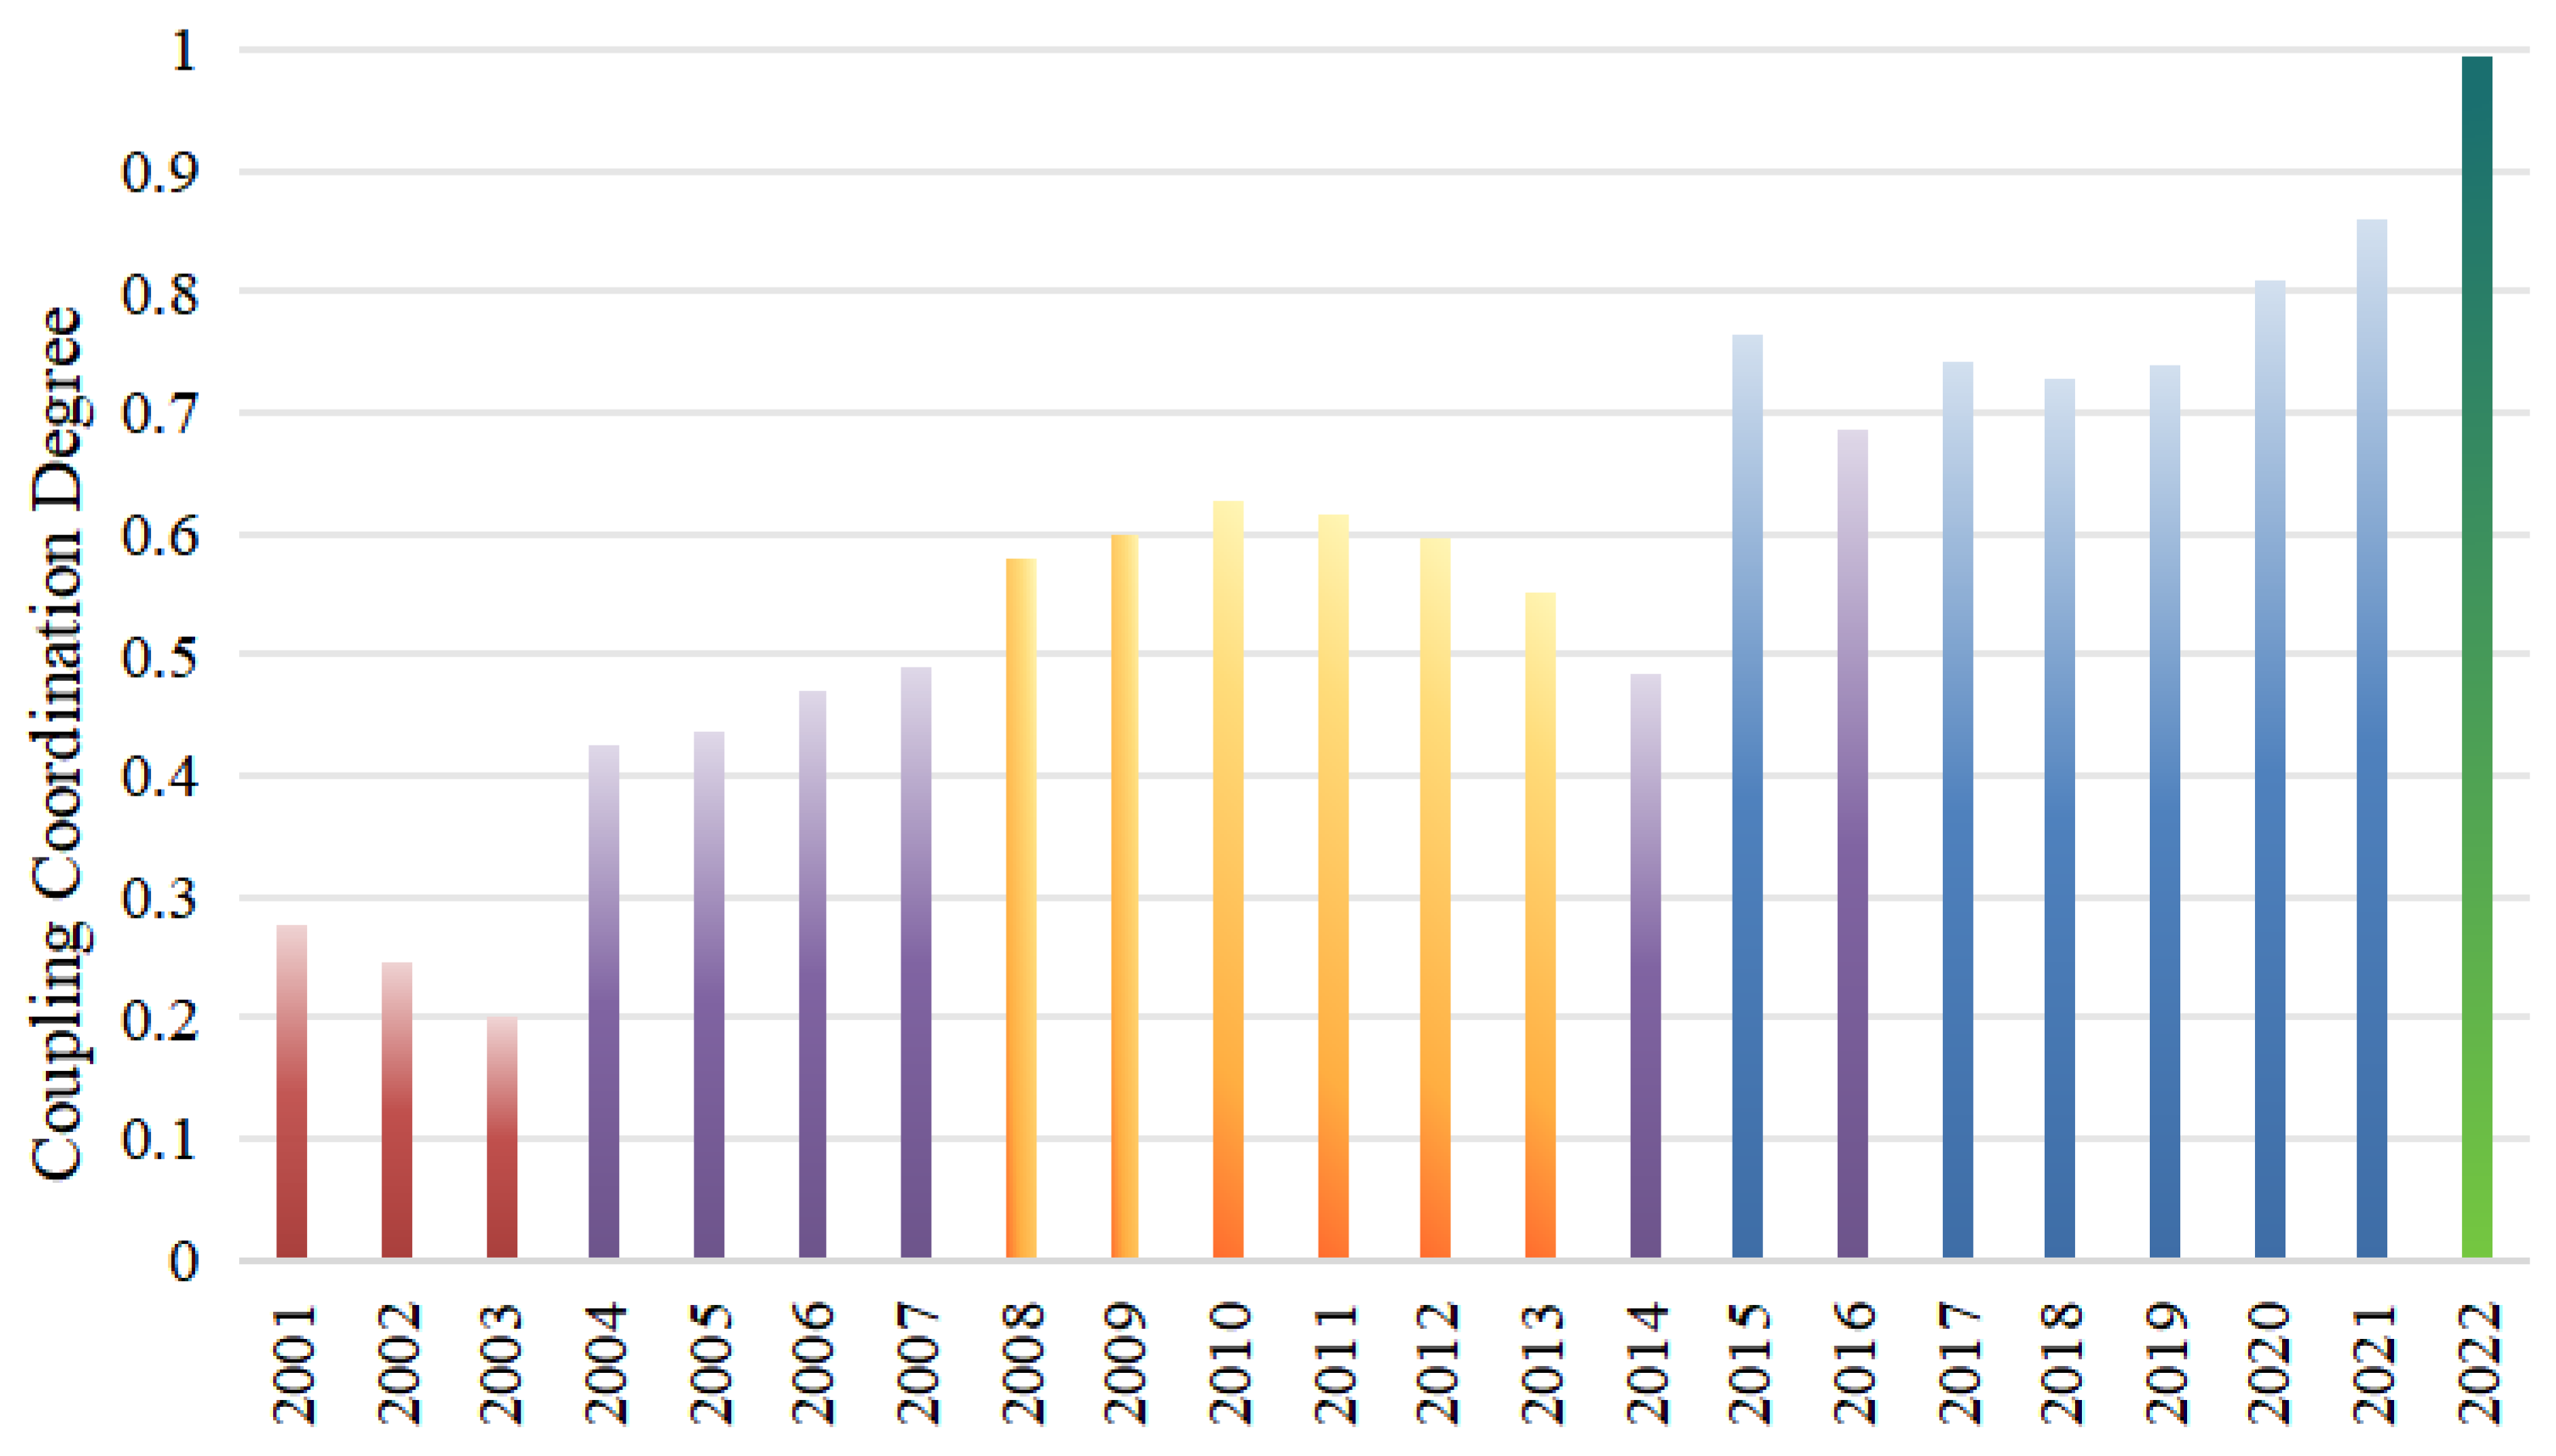

Table 1.
Comprehensive Evaluation Index System for Resilience of China’s OGI.
| First-level Indicators | Second-level Indicators | Third-level Indicators | Type | Weight | |
|---|---|---|---|---|---|
| Resistance | Resource Guarantee Capability | Ultimate Recoverable Reserves of Oil | A1 | Maximum | 0.0297 |
| Ultimate Recoverable Reserves of Natural Gas | A2 | Maximum | 0.0292 | ||
| Oil Import Dependence | A3 | Minimum | 0.0269 | ||
| Natural Gas Import Dependence | A4 | Minimum | 0.0394 | ||
| Product Supply Capability | Crude Oil Production | A5 | Maximum | 0.0181 | |
| Natural Gas Production | A6 | Maximum | 0.0341 | ||
| Pipeline Cargo Turnover | A7 | Maximum | 0.0365 | ||
| Price Buffer Capability | Price Buffer Capability of Upstream Industry Chain | A8 | Median | 0.0067 | |
| Price Buffer Capability of Downstream Industry Chain | A9 | Median | 0.0058 | ||
| Resilience | Industrial Base | Pipe Length | B1 | Maximum | 0.0295 |
| Number of Upstream Enterprises in The Industry Chain | B2 | Maximum | 0.0352 | ||
| Number of Downstream Enterprises in The Industry Chain | B3 | Maximum | 0.0474 | ||
| Element Base | Upstream Capital Stock of The OGI | B4 | Maximum | 0.0284 | |
| Downstream Capital Stock of The OGI | B5 | Maximum | 0.0342 | ||
| Upstream Labor Stock of The OGI | B6 | Maximum | 0.0289 | ||
| Downstream Labor Stock of The OGI | B7 | Maximum | 0.0296 | ||
| Investment Capacity | Upstream Investment in The OGI | B8 | Maximum | 0.0278 | |
| Downstream Investment inThe OGI | B9 | Maximum | 0.0272 | ||
| Economic Foundation | Main Operating Revenue Per 100 Yuan of Assets of Large-scale Enterprises |
B10 | Maximum | 0.0177 | |
| Return on Total Assets of Industrial Enterprises Above Designated Size | B11 | Maximum | 0.0159 | ||
| Innovation | Innovation Investment | Funding for R&D Investment in the Upstream OGI to Develop New Products | C1 | Maximum | 0.0212 |
| Funding for R&D Investment in the Downstream OGI to Develop New Products | C2 | Maximum | 0.0380 | ||
| Innovation Output | Number of Invention Applications from Upstream Oil and Gas Companies | C3 | Maximum | 0.0370 | |
| Number of Invention Applications from Downstream Oil and Gas Companies | C4 | Maximum | 0.0663 | ||
| Technology Improvement | Refining Rate | C5 | Maximum | 0.0270 | |
| Efficiency of Energy Conversion | C6 | Maximum | 0.0158 | ||
| Transformation | Structural Transformation | The Proportion of Crude Oil Consumption in Chemical Raw Materials and Chemical Products Manufacturing Industry | D1 | Maximum | 0.0183 |
| Low-carbon Transformation | CO2 Emissions - Oil | D2 | Minimum | 0.0239 | |
| CO2 Emissions - Natural Gas | D3 | Minimum | 0.0176 | ||
| Carbon Emission Intensity of Oil | D4 | Minimum | 0.0174 | ||
| Carbon Emission Intensity of Natural Gas | D5 | Minimum | 0.0305 | ||
| Sulfur Dioxide Emissions from Upstream of The Industrial Chain | D6 | Minimum | 0.0059 | ||
| Sulfur Dioxide Emissions from Downstream of The Industrial Chain | D7 | Minimum | 0.0448 | ||
| Annual storage of CO2 by CCUS | D8 | Maximum | 0.0719 | ||
| Extension and Integration of The Industrial Chain | Number of Downstream Enterprises in The Industrial Chain | D9 | Maximum | 0.0162 | |
Table 2.
Key obstacle factors and degree of obstacles affecting the resilience of China’s OGI from 2001 to 2022.
Table 2.
Key obstacle factors and degree of obstacles affecting the resilience of China’s OGI from 2001 to 2022.
| Title 1 | NO.1 | NO.2 | NO.3 | NO.4 | NO.5 | |||||
|---|---|---|---|---|---|---|---|---|---|---|
| Index | Obstacle | Index | Obstacle | Index | Obstacle | Index | Obstacle | Index | Obstacle | |
| 2001 | D8 | 9.41 | C4 | 8.63 | B3 | 6.20 | C2 | 4.95 | C3 | 4.85 |
| 2002 | D8 | 9.27 | C4 | 8.48 | B3 | 6.09 | C2 | 4.89 | C3 | 4.72 |
| 2003 | D8 | 9.24 | C4 | 8.42 | B3 | 6.02 | C2 | 4.88 | C3 | 4.65 |
| 2004 | D8 | 10.17 | C4 | 9.03 | B11 | 6.32 | D7 | 5.33 | C3 | 5.05 |
| 2005 | D8 | 10.39 | C4 | 9.19 | B11 | 6.49 | D7 | 5.68 | C3 | 4.85 |
| 2006 | D8 | 10.44 | C4 | 9.81 | B11 | 6.59 | D7 | 5.46 | C2 | 4.85 |
| 2007 | D8 | 10.97 | C4 | 10.38 | B11 | 6.77 | D7 | 5.68 | C3 | 4.78 |
| 2008 | D8 | 12.16 | C4 | 11.39 | B11 | 6.81 | D7 | 6.06 | C3 | 5.25 |
| 2009 | D8 | 12.34 | C4 | 11.23 | B11 | 6.77 | C2 | 5.86 | C7 | 5.22 |
| 2010 | D8 | 13.30 | C4 | 11.68 | B11 | 7.11 | D7 | 6.69 | C2 | 6.06 |
| 2011 | D8 | 11.46 | C4 | 10.87 | D7 | 8.89 | B11 | 7.72 | C2 | 5.49 |
| 2012 | D8 | 10.86 | C4 | 9.32 | D7 | 8.36 | B11 | 6.99 | B10 | 5.23 |
| 2013 | D8 | 10.39 | C4 | 9.00 | D7 | 8.35 | B11 | 6.65 | B5 | 5.40 |
| 2014 | D8 | 10.80 | D7 | 8.62 | C4 | 8.08 | B11 | 6.38 | A4 | 5.56 |
| 2015 | D8 | 10.93 | C4 | 8.87 | B11 | 6.30 | B5 | 5.82 | A4 | 5.80 |
| 2016 | D8 | 10.14 | C4 | 8.51 | A4 | 6.07 | B5 | 5.65 | B11 | 5.60 |
| 2017 | D8 | 11.06 | A4 | 7.31 | C4 | 6.82 | B10 | 6.10 | D5 | 5.87 |
| 2018 | D8 | 11.18 | A4 | 8.34 | B10 | 6.56 | D5 | 6.47 | C4 | 6.37 |
| 2019 | D8 | 11.98 | A4 | 8.79 | B10 | 6.83 | D5 | 6.45 | C5 | 6.13 |
| 2020 | D8 | 13.24 | A4 | 9.33 | B10 | 7.21 | C5 | 6.78 | A3 | 6.75 |
| 2021 | D8 | 12.53 | A4 | 10.96 | B4 | 7.78 | B10 | 7.33 | C5 | 7.19 |
| 2022 | A4 | 13.22 | B4 | 10.70 | B10 | 9.43 | C2 | 9.15 | A3 | 8.87 |
Table 3.
Types and Grades of Coupling Coordination Degree (CCD).
| Grade | Extremely Incoordination | Mild Incoordination |
Primary Coordination |
Mildly Coordination |
High-quality Coordination |
|---|---|---|---|---|---|
| CCD | [0.0,0.3) | [0.3,0.5) | [0.5,0.7) | [0.7,0.9) | [0.9,1.0) |
Disclaimer/Publisher’s Note: The statements, opinions and data contained in all publications are solely those of the individual author(s) and contributor(s) and not of MDPI and/or the editor(s). MDPI and/or the editor(s) disclaim responsibility for any injury to people or property resulting from any ideas, methods, instructions or products referred to in the content. |
© 2025 by the authors. Licensee MDPI, Basel, Switzerland. This article is an open access article distributed under the terms and conditions of the Creative Commons Attribution (CC BY) license (http://creativecommons.org/licenses/by/4.0/).
Copyright: This open access article is published under a Creative Commons CC BY 4.0 license, which permit the free download, distribution, and reuse, provided that the author and preprint are cited in any reuse.


