
Submitted:
28 November 2024
Posted:
28 November 2024
You are already at the latest version
Abstract
The global recoverable reserves of shale gas are estimated to reach 214.5 × 10¹² m³. Previous studies have primarily employed volumetric methods, analog methods, and genetic methods for shale gas resource evaluation. However, these methods face significant limitations, including the substantial impact of rock heterogeneity, challenges in determining the similarity of analog accumulations, and unsuitability for assessing high-mature-overmature source rocks. In the Qiongzhusi Formation of the Sichuan Basin(Є1q), China, high-mature-overmature shales have been extensively developed, achieving significant breakthroughs in both conventional shale gas exploration. This necessitates the establishment of an integrated evaluation system for conventional and unconventional resources. This study, based on the whole petroleum system theory and an improved hydrocarbon generation potential method, calculates the distribution characteristics of hydrocarbon generation, retention, and expulsion during these stages for the Є1q. It further evaluates the resource potential of conventional and shale oil and gas. Hydrocarbon generation and expulsion centers are favorable exploration targets for conventional oil and gas, primarily located in the central and northern regions of the Mianyang-Changning rift trough, with a resource potential of 6560 × 10¹² m³. Retention hydrocarbon centers, on the other hand, represent promising targets for shale oil and gas exploration, concentrated in the central Mianyang-Changning rift trough, with a resource potential of 287 × 10¹² m³.This study not only provides strategic guidance for future oil and gas exploration in the Є1q but also offers a methodological reference for integrated resource evaluation of conventional and unconventional oil and gas systems of high-mature-overmature source rock in similar basins worldwide.
Keywords:
effective source rock
; ΔlogR method
; resource potential evaluation
; improved hydrocarbon generation potential method
; Qiongzhusi source rock
1. Introduction
Currently, several approaches are used to restore the resource potential evaluation of source rocks, including the volume method [1], analogy method [2], Delphi comprehensive analysis method [3], and genetic method [4].
The analogy method estimates the abundance of oil and gas in an entire study area based on the geological characteristics of the known oil and gas accumulations. This method is relatively convenient and economical. However, accurately estimating similarities with discovered oil and gas accumulations is difficult, resulting in the low credibility of resource potential estimates. It is mainly applied to blocks with lower exploration levels [5].
Meanwhile, the volume method estimates the potential of hydrocarbon source rock resources using a homogeneous geological model. In this method, the resource potential of a unit volume of source rock is estimated, and the overall volume of the source rock is further calculated. The product of these parameters is regarded as the resource potential of the source rock. However, this method overlooks the heterogeneity within the source rock. Although multidimensional geological parameters, such as the total organic carbon (TOC) content, maturity, pyrolysis parameters, and adsorbed hydrocarbon content, are used to correct the final results, the estimation accuracy of this method still depends on the number of geological parameters considered. Moreover, this method requires extensive exploration and development data for reliable support and is best suited for mature exploration blocks with extensive geological data [6,7,8].
The Delphi comprehensive analysis method estimates the quantity of oil and gas resources by considering different evaluations of resource potential from various experts. The final resource evaluation result is obtained through linear weighted calculations of the evaluations, with the weights assigned by human judgment. Therefore, this method is subject to significant human interference and has low reliability [9].
The genetic method, also known as the material balance method, is fundamentally based on the theory of Tissot of late-stage hydrocarbon generation from kerogen thermal degradation [10]. This approach uses hydrocarbon generation as the primary evaluation concept. It begins by determining the effective hydrocarbon-generating volume of source rocks through spatiotemporal distribution studies. Subsequently, the hydrocarbon generation and expulsion efficiencies, as well as the quantities at different evolutionary stages, are established by integrating geochemical characteristics of source rocks with results from hydrocarbon generation and expulsion simulation experiments. Based on these data, the amounts of hydrocarbon generation and expulsion are calculated. Finally, the resource potential is estimated by combining the calculated hydrocarbon quantities with studies on hydrocarbon accumulation coefficients in the area under evaluation. The hydrocarbon generation potential method is a specific approach within the broader framework of the genetic method,, based on the fundamental mass conservation principle, evaluates the resource potential of conventional and unconventional oil and gas by establishing a hydrocarbon generation and expulsion model and simulating the intensities of hydrocarbon generation (total resources), retention (shale oil and gas resources), and expulsion (tight and conventional oil and gas resources) at different stages [4,11]. Among them, hydrocarbon generation represents the total resource, hydrocarbon retention represents the shale gas resources, and hydrocarbon expulsion represents the tight and conventional oil and gas resources. This method features simple parameters and high operational feasibility. From the perspective of the whole petroleum system, the hydrocarbon generation potential method can more accurately evaluate the potential of conventional and unconventional oil and gas resources in a target area. Moreover, it has been effectively applied in the canning basin, Western Australia, the Tarim Basin, the Sichuan Basin, the Junggar Basin, China and other large basins [12,13,14,15]. Therefore, this study used the hydrocarbon generation potential method to examine the intensities of hydrocarbon generation, retention, and expulsion in the source rock of the Qiongzhusi Formation (Є1q) in the Sichuan Basin.
Marine shale gas resources are abundant in the Sichuan Basin. The Sinian–Ordovician shale gas-bearing system, the oldest marine shale gas-bearing system in the Sichuan Basin, has revealed substantial shale gas accumulations, including the Doushantuo Formation shale gas accumulations of the Sinian system, the Є1q shale gas accumulations of the Cambrian system, and the Wufeng Formation shale gas accumulations of the Ordovician system [16,17].
In recent years, the Є1q source rock, which is enriched with organic matter, has become the main target for shale gas exploration in the Sichuan Basin [18,19]. In 2023, the Z201 well, drilled on the northeast wing of the Weiyuan anticline, became the shale gas well with the highest test production in Є1q over the past decade, revealing Є1q’s enormous potential as a shale gas resource [20,21]. However, because of the high-mature–overmature stage of the Є1q source rock and the limited number of drilling sites encountering it, its hydrocarbon generation and evolution process is difficult to recover, posing a challenge to its resource evaluation [22,23].
Because of the lack of key evaluation parameters, such as TOC and effective thickness, this study uses the ΔlogR method to determine TOC using recent oilfield exploration and development well-logging data and then clarifies the thickness of the effective source rock and the distribution characteristics of TOC in Є1q. A hydrocarbon generation and expulsion model for source rocks in the Sichuan Basin is established based on the evolution characteristics of the same kerogen type in five representative basins in China. This study aims to clarify the characteristics of hydrocarbon generation and expulsion in source rocks and evaluate their resource potential. The results provide a more objective, scientific, and accurate evaluation of Є1q. This resource assessment integrates conventional and unconventional oil and gas resources into a unified evaluation system, providing a basis for further oil and gas exploration and development in the study area. It also offers valuable insights for resource evaluation in other oil fields worldwide.
2. Geological Setting
The Sichuan Basin is located in southwestern China, covering an area of approximately 18.8 × 10⁴ km2. To the south lies the Emei Washan fault block belt and Loushan fold belt; to the east, the Sichuan Yunnan fold belt; to the north, the Micangshan Dabashan fault fold belt; and to the west, the Longmenshan fault fold belt [24] (Figure 1a). The Sichuan Basin is affected by both the Tethys tectonic domain and the Pacific tectonic domain. Since the Cambrian period, it has undergone multiple tectonic movements, including the Caledonian, Hercynian, Indosinian, Yanshan, and Xishan tectonic movements [9,25,26]. The Є1q is widely developed in the Sichuan Basin and is conformable with the Lower Cambrian Dengying Formation and unconformable with the Upper Cambrian Yuxiansi Formation. During its sedimentation period, Є1q was affected by the Tongwan tectonic movement and the Xingkai rift tectonic movement. In this period, a north–south trending rift trough was formed in the Mianyang–Changning direction within the Sichuan Basin. The thickness of the Є1q source rock is clearly controlled by the direction of the rift trough, with a relatively large thickness in the trough, gradually decreasing toward the edge of the rift trough. The sedimentary facies of the Є1q source rock are continental shelf facies, with the deposition of black shale, carbonaceous shale, and siltstone [27,28,29,30] (Figure 1b and 1c).
3. Samples and Methods
This study comprehensively utilize the hydrocarbon generation potential method, pyrolysis data of source rocks from five representative basins in China, measured pyrolysis data from the Є1q source rock samples, and well-logging curve data to evaluate the resource potential of the source rock. This study is divided into three parts. The first part outlines the construction of a numerical model to predict TOC using well-logging data. The average TOC and effective thickness of source rocks for each well in Є1q are predicted by using the ΔlogR method, and their distribution characteristics are clarified. The second part involves constructing a hydrocarbon generation potential evolution model for the Є1q source rock based on pyrolysis data from both the five representative basins in China and the measured pyrolysis data from the Є1q source rock samples. Finally, the third part employs the basin model method to determine the critical hydrocarbon accumulation periods related to the Є1q source rock and to estimate the characteristics, intensities, and quantities of hydrocarbon generation, retention, and expulsion during each key accumulation period.
3.1. Data Sources
The data used in this study is divided into two parts: measured data from the Є1q hydrocarbon source samples and data from hydrocarbon source rocks in five other representative basins. The former primarily consists of 450 samples of Є1q from 10 single wells in the Sichuan Basin (Figure 1a). These wells are widely distributed and representative, effectively capturing the characteristics of the Є1q source rock under various structural locations and geological conditions. Four kinds of experiments were conducted on these samples: rock pyrolysis, TOC measurement, microscopic observation of components, and asphalt maturity measurement. The data collected from hydrocarbon source rocks in the five representative basins include 150 samples of type I organic matter in Junggar Basin; 224 samples of type I organic matter and 188 samples of type III organic matter in Songliao Basin; 107 samples of type I organic matter, 526 samples of type II organic matter, and 107 samples of type III organic matter in Bohai Bay Basin; 319 samples of type II organic matter in Ordos Basin; and 205 samples of type I organic matter, 181 samples of type II organic matter, and 367 samples of type III organic matter in Sichuan Basin.
3.2. TOC Prediction and Effective Thickness Calculation Method
In 1990, Passey et al. [31] proposed the ∆logR method, which is now the most widely used technique for identifying source rocks and calculating TOC. The principle behind this method is that as the organic matter content in a source rock increases, both the acoustic travel time and resistivity logging values also increase. To apply this method, the resistivity logging curve is fixed, whereas the acoustic logging curve is shifted until these two curves coincide. The resulting overlapping curve is referred to as the baseline, where both the resistivity and acoustic logging values are at their minimum, indicating a nonsource rock section (Figure 2) To predict TOC, the distance between the acoustic time and resistivity logging values is defined as ∆logR, and its mathematical model can be expressed as Eq. 1.
where ∆t is the value of the acoustic travel time logging curve (μs/m), RT is the value of the resistivity logging curve (Ω⋅m); is the baseline value of the acoustic travel time (μs/m), and is the baseline value of the resistivity (Ω⋅m). ∆LogR shows a strong positive correlation with TOC. By linearly fitting the measured TOC values with the calculated ΔlogR, a numerical model for predicting TOC based on ΔlogR can be established.
Various methods have been developed for identifying effective source rocks, including the hydrocarbon expulsion threshold (HET) theory proposed by Pang et al. [33], the two-stage or three-step method proposed by Jiang et al [34], and the method proposed by Gao et al. [35] for effectively identifying source rocks using the relationship between TOC and the hydrocarbon index. The criteria for distinguishing effective source rocks in mudstone are relatively uniform, where TOC equal to 0.5% is generally regarded as the lower limit [23]. Accordingly, this study defines source rock intervals with TOC greater than 0.5% as effective source rocks. According to the TOC prediction results, methods for calculating the effective thickness (Eq. 2) and the TOC value of a single well (Eq. 3) are developed.
where is the value of the total effective thickness and is the value of the thickness of the effective thickness unit.
The calculation method for the average TOC of effective source rocks in each single well, based on the identified effective thickness range, is shown in Eq. 3.
where is the weighted average value of TOC of a single well and is the value of predicted TOC.
3.3. Resource Potential Assessment Method
The hydrocarbon generation potential method is a new method based on the principle of conservation of matter. It provides a convenient and effective means of evaluating the resource potential of source rocks by establishing a hydrocarbon generation and expulsion model and simulating the intensities of hydrocarbon generation, retention, and expulsion at different stages [19,36,37]. The two parameters S1 and S2 from rock pyrolysis respectively represent the amount of hydrocarbon retention within the source rock and the amount of organic matter that can be converted. Therefore, the hydrocarbon generation potential index (GPI = [S1 + S2]/TOC) represents the maximum amount of hydrocarbons that can be generated per unit of TOC in the source rock. Meanwhile, the hydrogen index (HI), S2/TOC, can represent the maximum amount of hydrocarbons that can be converted per unit TOC in the source rock [33]. On the basis of the evolution trends of the GPI and HI data from numerous source rock samples with varying maturities, the evolutionary behavior of the GPI and HI at different maturities can be restored [33].
The evolution curves of GPI and HI typically initially remain stable, then rapidly decrease, and finally slowly decline as the maturity increases (Figure 3). The onset of hydrocarbon generation in source rocks corresponds to the point where the HI evolution curve begins to decline rapidly with the corresponding maturity or other geological conditions, termed the hydrocarbon generation threshold (HGT) [33]. Similarly, the onset of hydrocarbon expulsion in source rocks corresponds to the point where the GPI begins to decrease rapidly with the corresponding maturity or geological conditions, termed the HET. The HI and GPI values corresponding to maturities below the HGT and HET are referred to as the original HI (HI0) and the original hydrocarbon GPI (GPI0), respectively [33].
Using the evolution models of GPI and HI, the hydrocarbon generation amount per unit area of source rocks at any maturity can be calculated as the hydrocarbon generation intensity (Ig) (Eq. 4), the hydrocarbon expulsion amount per unit area of source rock as the hydrocarbon expulsion intensity (Ie) (Eq. 5), and the hydrocarbon retention amount per unit area of source rocks as the hydrocarbon retention intensity (Ir) (Eq. 6). By integrating the hydrocarbon generation intensity, expulsion intensity, and hydrocarbon retention intensity over a given area at a certain maturity, the hydrocarbon generation amount (Qg) (Eq. 7), expulsion amount (Qe) (Eq. 8), and hydrocarbon retention amount (Qr) (Eq. 9) of the source rock at that maturity can be calculated.
where HI is the hydrogen index (mg HC/g TOC), HI0 is the original HI (mg HC/g TOC), GPI is the hydrocarbon generation potential index (mg HC/g TOC), GPI0 is the original GPI (mg HC/g TOC), ρ is the density of the source rock, assumed to be 2.65 g/cm3 in this paper, H is the effective thickness of the source rock (m), TOC is the total organic carbon (%), TOC0 is the original TOC (%), (x,y) represents the coordinates of the region, Ig is the hydrocarbon generation intensity (104 kg/km2), Ie is the hydrocarbon expulsion intensity (104 kg/km2), and Ir is the hydrocarbon retention intensity (104 kg/km2). Ig (x, y) is the hydrocarbon generation intensity at a certain coordinate (104 kg/km2), Ie (x, y) is the hydrocarbon expulsion intensity at a certain coordinate (104 kg/km2), Ir (x, y) is the hydrocarbon retention intensity at a certain coordinate (104 kg/km2), Qg represents the amount of hydrocarbon generation (104 kg), Qe represents the amount of hydrocarbon expulsion (104 kg), and Qr represents the amount of hydrocarbon retention (104 kg).
For the recovery of the original TOC, this study used the calculation formula (Eq. 10) proposed by Jiang et al. [38].
where TOC is the total amount of present organic carbon (%), TOC0 is the recovered TOC, which corresponds to the TOC during the same period as the GPI measurement (%), GPI is the hydrocarbon generation potential index (mg HC/g TOC), and GPI0 is the original GPI (mg HC/g TOC).
4. Results
4.1. Single-Well Effective Thickness and TOC Prediction Results
Using the method described in Section 2.2, ΔlogR curves were constructed for each single-well location, and a linear relationship between ΔlogR and the measured TOC was fitted. The results indicated a strong correlation between the ΔlogR curve and the measured TOC for the individual wells (Figure 4a). Although the predicted TOC using the ΔlogR method was slightly lower than the actual measured TOC, the correlation remained strong, with a determination coefficient of 0.903 (Figure 4b).
By identifying and calculating the effective source rock of Є1q in the research area, we found that because of the influence of the development of the rift trough, the source rock of Є1q was predominantly distributed in the northern and central parts of the rift trough, with a maximum thickness of up to 626 m. The thickness decreased gradually toward both sides of the rift trough (Figure 5a). The TOC of Є1q primarily ranged from 0.9% to 2.1%, with higher TOC values concentrated in the northern and central parts of the Mianyang–Changning rift trough, ranging from 1.9% to 2.1% (Figure 5b).
4.2. Recovery Results of Hydrocarbon Generation and Expulsion History and Maturity Evolution Characteristics of Source Rocks
According to one-dimensional basin simulation results, the effective source rock of Є1q began to generate oil for the first time during the late Ordovician period. In the late Silurian period, it experienced the effects of the Caledonian orogeny, which caused tectonic uplift and erosion, halting their thermal evolution. During the Permian to early Triassic, the strata rapidly subsided, leading to secondary oil generation. From the late Triassic to the early Jurassic period, influenced by the Yanshan orogeny, the strata rapidly settled and the degree of thermal evolution further increased, resulting in the cracking of crude oil and kerogen gas. After the Paleogene, the Xishan Movement influenced the uplift and erosion of the strata, stopping the evolution of the source rock (Figure 6).
Because of the significant impact of the above tectonic movements, this study divided Є1q into three periods of hydrocarbon generation and expulsion: the first period is the Ordovician–Silurian, the second period is the Permian–Triassic, and the third period is the Jurassic period. The hydrocarbons generated during the first two periods were primarily liquid, whereas those from the third period were predominantly gaseous.
Because the Sichuan Basin was a marine environment during the early Paleozoic era and lacked input from terrestrial higher plants, the organic matter in the source rocks primarily originated from marine phytoplankton and bacteria, resulting in a lack of vitrinite. Additionally, due to the high degree of evolution of Є1q, some commonly used parameters for submaturity were not applicable. Consequently, many scholars have employed the “equivalent vitrinite reflectance” method to study the marine strata in the Sichuan Basin [39,40]. Currently, the maturity of source rocks in the study area is mainly assessed by measuring asphalt reflectance and establishing its equivalence to vitrinite reflectance. The asphalt reflectance method was first proposed by Jacob [41] with the following formula (Eq. 11):
where is the equivalent vitrinite reflectance and is the asphaltene reflectance (%).
This study established a relationship between Ro and depth by collecting the measured Ro data of the Є1q source rock in the Sichuan Basin. Based on a structural burial depth map of Є1q in the research area, the maturity distribution characteristics of the Є1q source rock for three periods were characterized (Figure 7). During the Ordovician–Silurian period, the degree of thermal evolution in the southwestern part of the area was relatively rapid, reaching up to 1.49%, whereas the northern part was in a submature stage with Ro of <0.8%. During the Permian–Triassic period, the burial depth of the strata decreased significantly because of the Indosinian movement, leading to a generally high degree of thermal evolution in the study area, with the maximum value located in the eastern part, reaching up to 3.94%. Influenced by the Yanshan Movement, the burial depth of Є1q decreased significantly again during the Jurassic period, resulting in an even higher degree of thermal evolution across the current study area, all exceeding 1.9%, with the maximum value in the eastern part, reaching up to 6.9%.
4.3. Results of Resource Potential Evaluation
Because of the high-mature–overmature evolution stage of the Є1q source rock in the Sichuan Basin and the lack of submature source rock samples and a complete thermal evolution sequence, a hydrocarbon generation and expulsion model cannot be established. However, previous studies have shown that the same types of kerogen have similar thermal evolution processes and hydrocarbon generation and expulsion characteristics [42] (Figure 8a). On this basis, by collecting and analyzing pyrolysis data of other submature source rocks consistent with the kerogen type of Є1q, combined with the pyrolysis data of the Є1q source rock, a hydrocarbon generation and expulsion model for the high-quality source rock of Є1q can be constructed (Figure 8b).
Microscopic component analysis experiments were conducted on 43 source rock samples from Є1q in the study area, and the organic matter type indices of each source rock sample were calculated. The results showed that the Є1q source rock was mainly enriched in sapropeline groups, with a relative percentage ranging from 86% to 90%. There was almost no exonite group or inertinite group, with a low content of the vitrinite group ranging from 2% to 14%. The organic matter type index of each sample mainly ranged from 80 to 96.5, indicating type I organic matter. Only one sample had an organic matter type index of 75.5, which was lower than the critical type index of type I organic matter, indicating type II1 organic matter (Figure 8a).
For Є1q in this study, the evolution curves of GPI and HI were constructed (Figure 8b) using the GPI data of type I organic matter in five representative basins in China, as well as measured hydrocarbon generation potential data. Although the maturity of the samples from Є1q was high-mature–overmature, they still showed a good fit with the GPI curves of the five representative basins with type I organic matter (Figure 8b), which further proved that the hydrocarbon generation and expulsion patterns of the Є1q source rock were similar to those of type I organic matter in other basins in China. On this basis, further reference was made to the HI evolution curve of type I organic matter proposed by Guo et al. [43] to reflect the hydrocarbon generation law of the Є1q source rock (Figure 8c).
Furthermore, the evolution curve of the hydrocarbon generation, retention, and expulsion rate of the Є1q source rock was constructed, which included the oil and gas generation rate per unit of TOC organic matter, the hydrocarbon expulsion rate, the oil and gas expulsion rate per unit of TOC organic matter, and the hydrocarbon retention rate, which was the evolution curve of the oil and gas retention rate per unit of TOC organic matter (Figure 8d). The HI0 and GPI0 of the Є1q source rock were equal at 800 mg HC/g TOC. HGT was Ro = 0.5%, and HET was Ro = 0.7%. As the degree of thermal evolution increased, the potential for hydrocarbon generation in the source rock gradually decreased and the rates of hydrocarbon generation and expulsion gradually increased. The hydrocarbon retention rate initially increased and then decreased (Figure 8d). The Ro of the source rock in Є1q was mainly distributed in the range of 1.9% to 6.9%, corresponding to a hydrocarbon generation rate ranging from 720 to 780 mg HC/ g TOC. The hydrocarbon expulsion rate ranged from 600 to 720 mg HC/ g TOC, and the hydrocarbon retention rate ranged from 20 to 170 mg HC/ g TOC (Figure 8d).
Using Eq. 7 to recover the TOC of the Є1q source rock, this study clarified the TOC0 and TOC distribution characteristics of the critical hydrocarbon accumulation period related to the Є1q source rock (Figure 9). The TOC0 of the Є1q source rock and the TOC distribution characteristics from the Ordovician–Silurian and Permian–Triassic periods were all similar to the current TOC distribution characteristics (Figure 9). Controlled by the Mianyang–Changning Rift Trough, the high-TOC-value areas were located in the northern and central parts of the Rift Trough. Before the generation and expulsion of hydrocarbons, the TOC0 distribution range of the Є1q source rock was 2.1%–5.8%, and the TOC distribution range of the Ordovician–Silurian period was 2.09%–5.72%. The values in the southern part decreased, whereas those in the northern part did not change much, indicating that hydrocarbon generation had already begun in the southern part but not yet in the northern part (Figure 9). The distribution range of TOC in the Permian–Triassic period was 1.07%–5.31%. At this time, the distribution characteristics of TOC in this area began to show significant changes, indicating that a large number of hydrocarbon generation and expulsion processes had already occurred in the Є1q source rock (Figure 9).
Based on the evolution models of GPI and HI, combined with the thickness, TOC, and maturity characteristics of the source rock at each key period of accumulation, the distribution characteristics and quantity of hydrocarbon generation, retention, and expulsion intensities of the Є1q source rock at each key period of accumulation were calculated. During the critical period of the Ordovician–Silurian accumulation, the southwestern part of the basin had strong hydrocarbon generation capacity, with the highest hydrocarbon generation intensity reaching 480.8 × 10⁸ m3/km2. At this time, the northern part of the basin was still shallowly buried, with extremely low hydrocarbon generation intensity and almost no hydrocarbon generation. The distribution characteristics of hydrocarbon expulsion and hydrocarbon retention intensities were similar to those of the hydrocarbon generation intensity, both concentrated in the southwestern part of the basin. Among them, the hydrocarbon expulsion intensity in the southwest of the basin ranged from 100 to 300 × 108 m3/km2, whereas the hydrocarbon retention intensity mainly ranged from 20 to 100 × 108 m3/km2. Overall, hydrocarbon expulsion was predominant (Figure 10a–c).
During the key period of the Permian–Triassic accumulation, the hydrocarbon generation center of the basin was located in the central rift trough of the basin. The hydrocarbon generation intensity was the highest in the rift trough, ranging from 450 to 900 × 108 m3/km2, whereas the hydrocarbon generation intensity outside the rift trough was still at a relatively low level, almost all less than 300 × 108 m3/km2. The distribution characteristics of the hydrocarbon expulsion retention intensities were similar to those of the hydrocarbon generation intensity. The hydrocarbon expulsion intensity and hydrocarbon retention intensity in the fracture groove were between 300–600 × 108 m3/km2 and 200–300 × 108 m3/km2, respectively (Figure 10d–f).
During the critical period of the Jurassic accumulation, areas with high hydrocarbon generation intensity were mainly distributed in the central and northern parts of the rift trough, with the secondary center located in the southern part of the rift trough. The hydrocarbon generation intensity in the rift trough ranged from 300 to 900 × 108 m3/km2. The distribution pattern and numerical value of the hydrocarbon expulsion intensity were similar to those of hydrocarbon generation intensity, indicating that the source rock entered a high-mature–overmature stage. This resulted in a significant reduction in its hydrocarbon retention capacity, and almost all the generated hydrocarbons were expelled from the source rock (Figure 10g and 10h). The maximum hydrocarbon retention in the source rock of Є1q during this stage was only 60 × 108 m3/km2, mainly distributed in the middle of the rift trough (Figure 10i).
Hydrocarbon generation during the key period of the Ordovician–Silurian hydrocarbon accumulation was relatively small at only 594 × 1012 m3. Most of the generated hydrocarbons were expelled from the source rock, with the expelled hydrocarbon volume amounting to 427 × 10¹² m³, accounting for 71.9% of the total generated hydrocarbons, whereas the hydrocarbon retention accounted for only 28.1% (Figure 11). During the critical period of the Permian–Triassic accumulation, the Є1q source rock began to generate a large amount of hydrocarbons, with a hydrocarbon generation volume of 6250 × 1012 m3. At this stage, a large amount of hydrocarbons was retained inside the source rock, with a hydrocarbon retention volume of 2463 × 1012 m3, accounting for 39.4% of the total hydrocarbon generation, and a hydrocarbon expulsion volume accounting for 60.6% of the total hydrocarbon generation (Figure 11). At this stage, the significant increase in hydrocarbon retention volume might be attributed to the extensive development of organic pores within the organic matter during the maturation stage, providing abundant space for oil and gas [44].
During the critical period of the Jurassic accumulation, the generation of oil and gas reached its peak at 6847 × 1012 m3. Only 0.04% of the generated hydrocarbons was retained within the source rock layers, whereas the remaining hydrocarbons were expelled from the source rock (Figure 11). The rapid reduction in hydrocarbons retention might be due to the significant decrease in the ability of organic matter to adsorb hydrocarbons during the overmature stage [45].
In summary, the Є1q source rock in the Sichuan Basin has significant resource potential. During the critical period of the Ordovician–Silurian hydrocarbon accumulation, the center of hydrocarbon generation and expulsion was concentrated in the southwestern part of the basin. During the key periods of the Permian–Triassic and Jurassic accumulations, hydrocarbon generation and expulsion centers were concentrated within the rift troughs at the center of the basin. Therefore, in the exploration process of conventional oil and gas fields, special attention should be paid to the migration and accumulation characteristics of oil and gas resources in the southern part of the basin and the interior of the rift trough. The Jurassic hydrocarbon retention intensity centers were mainly concentrated in the central rift troughs of the basin, indicating that there is still a lot of shale gas exploration potential in the central part of the Sichuan Basin. Future shale gas exploration should focus on the central rift zones of the basin.
5. Discussion
5.1. Comparison of International Resource Evaluation Methods
According to the U.S. Energy Information Administration (EIA) (2020) [46] Energy Outlook, shale gas production is expected to account for over 75% of total natural gas production in the coming decades. Shale gas, as an efficient and clean unconventional oil and gas resource, plays a significant role in energy structure adjustment. The widespread exploitation of shale gas has led to a more than doubling of the proportion of unconventional oil and gas in the U.S. energy mix since 2000, with shale gas accounting for 67% of total natural gas production in 2011. Promising shale gas regions include vast areas along the North Slope of Alaska. Poland and the United Kingdom began commercial production in 2015 and 2016, respectively [47]. China, Argentina, and Australia have technically recoverable shale gas resources of 31 × 10⁸ m³, 22 × 10⁸ m³, and 11 × 10⁸ m³, respectively, and are increasingly seen as potential major producers [48]. The volumetric method is commonly used for shale oil and gas resource evaluation. For instance, it has been applied in regions such as the Neuquén Basin, Argentina) [8]and the Triassic Montney Formation in northeastern British Columbia [7]. Romero-Sarmiento et al. [8] investigated the relationship between the organic matter properties and core depth of the Vaca Muerta Formation using open-system pyrolysis techniques, organic petrography, and biomarker analysis. They also estimated the physical characteristics of shale rocks and pore network properties using gas permeability, porosity, and nuclear magnetic resonance (NMR) methods. Based on new Rock-Eval Shale Play data, they used an improved oil saturation index to estimate the potential producible oil and gas resources in rock samples. Although CT scanning may have been employed to analyze rock samples, it is extremely challenging to clearly define the rock heterogeneity across the entire study area. This difficulty could introduce errors in the resource evaluation process.
Many scholars have employed the genetic method for conventional oil and gas resource evaluation, achieving favorable results. However, traditional genetic theories and evaluation models are primarily based on buoyancy-driven migration, trap-controlled accumulation, and the classic petroleum system theory [49], which are not fully applicable to the evaluation of unconventional oil and gas resources [50,51].Although some institutions and scholars have made significant progress by modifying existing models to evaluate unconventional resources such as tight oil and gas and shale oil and gas [52,53,54], challenges remain, including the complexity of basin simulation processes and the lengthy evaluation cycles.
The hydrocarbon generation potential method, as a subtype of the genetic method, is based on the fundamental principle of material conservation. It establishes hydrocarbon generation and expulsion models to simulate the intensities of hydrocarbon generation, retention and expulsion during different periods, thereby evaluating the resource potential of shale gas [4,11]. This method is simple in terms of parameters and highly feasible in practice. From the perspective of the whole petroleum system, it provides a more accurate assessment of both conventional and unconventional oil and gas resource potential in the target area [12]. In the case of shale oil and gas resource evaluation in the Canning Basin, Western Australia, the method was applied using data on pressure and temperature variations, kerogen types, thermal maturity, hydrocarbon generation potential, rock mineralogy, and fluid analysis. This method facilitated a detailed resource evaluation of the Goldwyer III and Upper Laurel shale intervals [12]. It has also been effectively applied in large basins such as the Tarim Basin, Sichuan Basin, and Junggar Basin [13,14,15], demonstrating its broad applicability in integrated evaluation of conventional and unconventional resources.
In response to the characteristics of the high-mature-overmature evolutionary stage of the Є1q shale, the existing TOC, which reflects the abundance of organic matter remaining after hydrocarbon generation and expulsion, is not able to represent the hydrocarbon generation potential from earlier geological history stages. Therefore, this study modifies and improves the traditional hydrocarbon generation potential method. Specifically, the original TOC of the source rock is restored, and the evaluation is conducted using the restored TOC. Additionally, a complete hydrocarbon generation potential evolution model is constructed by combining samples from five other basins with similar kerogen types but lower maturity levels. This modification overcomes the limitation of excluding the early-stage resource potential of source rocks. Thus, the improved hydrocarbon generation potential method is better suited for the integrated evaluation of conventional and unconventional resource potential in high-mature-overmature source rocks.
5.2. Beneficial Exploration Areas for the Є1q
The Sichuan Basin is primarily developed with two sets of marine shale formations: the Wufeng-Longmaxi and the Є1q. Among them, the Wufeng-Longmaxi marine shale has already established a series of core technologies for shale gas exploration and development, leading to the creation of first shale gas giant field with "trillion-scale reserves and billion-scale production" of China [28]. At the same time, the Є1q is widely distributed across the entire Upper Yangtze region of the Sichuan Basin, China. The deployment of Well Z201 has achieved a high industrial gas flow rate of 73.88 × 10⁴ m³/d, demonstrating the excellent hydrocarbon generation potential of the Є1q. However, the next steps for exploration in the Є1q remain unclear, making detailed resource evaluation of shale gas in this area urgently needed. The source rocks in this region exhibit high-mature-overmature geological characteristics, which render traditional resource evaluation methods unsuitable for this area.
This study, based on the whole petroleum system theory and the principle of material balance, improves upon the hydrocarbon generation potential method [55]. The method uses readily available pyrolysis data to establish a hydrocarbon generation and expulsion model, determining the expulsion threshold and calculating the volume of hydrocarbon generation and expulsion. After hydrocarbon generation and expulsion, conventional oil and gas are expelled from the source rock under buoyancy forces and accumulate in traps, while hydrocarbons that remain within the source rock form unconventional shale resources [23,51]. For the Є1q source rocks, this study clarifies their geological and geochemical characteristics, combining new well data, and establishes a hydrocarbon generation and expulsion model. Through numerical simulations, the study quantitatively evaluates the characteristics of the intensities of hydrocarbon generation, retention, and expulsion, identifying the potential for both conventional and unconventional resources. This provides a geological basis for oil and gas exploration and development in the region. The results show that the favorable area for conventional oil and gas is mainly the hydrocarbon generation and expulsion center, located in the central and northern parts of the rift trough, with a secondary center in the southern part of the rift trough. The resource potential in this area is 6560 × 10¹² m³. The favorable area for shale oil and gas is primarily the retention hydrocarbon center, located in the central part of the rift trough, with a resource potential of 287 × 10¹² m³ (Figure 10g–i and 11). The substantial hydrocarbon generation potential of the Є1q provides a rich material foundation for the discovery of the next major gas field. The central and northern parts of the rift basin are recommended as key areas for further exploration.
In addition, compared to previous resource evaluation results, this study redefines the effective source rocks. For example, resource evaluation of the Є1q by Li et al [19] did not consider the hydrocarbon generation contribution from mudstone-siltstone, which led to an effective thickness of only 450 meters. Their study primarily focused on pure mudstone or pure shale, which is much thinner compared to the maximum thickness of 626 meters identified in this evaluation. This difference in the definition of effective source rock thickness is another reason why the resource estimates in previous studies are smaller than those of this study.
Recent research has shown that mudstone-siltstone also has significant hydrocarbon generation potential. Moreover, compared to pure shale, mudstone-siltstone possesses better storage capacity, which has been demonstrated in actual exploration in the the Su Bei Basin, China, where it has shown excellent resource abundance [56]. Additionally, the latest drilling results (Table 1) reveal that the TOC content of some mudstone-siltstone in the 7th small layer of the Є1q in well A1 is around 1%. In the microscopic composition of kerogen in the sample located at 4622.2m, the sapropel group accounts for 97%, which indicated that it is type I kerogen. Evaluation results from drilling indicate that the gas content in this layer can exceed 2 m³/t (Figure 12). These findings indicate that mudstone-siltstone has well hydrocarbon generation potential, and its contribution to hydrocarbon generation should not be overlooked.
In this study, siltstone-mudstone with TOC > 0.5% is also considered as an effective source rock. This approach results in an effective source rock thickness that is 1.5 times greater than previous estimates. Based on this analysis, it can be concluded that the resource potential estimated in this study is more objective and accurate.
6. Conclusions
This study uses the hydrocarbon generation potential method to determine the characteristics of hydrocarbon generation, retention (shale oil and gas), and expulsion (conventional oil and gas) in the key hydrocarbon generation and expulsion periods of the Є1q source rocks in the Sichuan Basin, China. Based on different oil and gas accumulation mechanisms and the whole petroleum system theory, the study calculates the conventional and unconventional resource volumes, improving the accuracy and applicability of oil and gas resource evaluation. The main conclusions of this study are as follows:
The distribution of current TOC and effective thickness in the Є1q source rocks of the study area is controlled by the Mianyang-Changning rift trough. High TOC values are concentrated in the northern and central parts of the rift trough, with the average TOC ranging from 0.9% to 2.1% and effective thickness ranging from 4 to 626 meters. The TOC0 distribution range is from 2.1% to 5.8%. Additionally, the current TOC of mudstone-siltstone can reach up to 1.43%, which can also be considered an effective source rock, with its resource potential being significant and not to be overlooked.
In the study area, the organic matter in the Є1q source rocks is primarily classified as Type I kerogen. The source rocks enter the hydrocarbon generation threshold at Ro = 0.5% and the expulsion threshold at Ro = 0.7%. Currently, the organic matter maturity of the Є1q source rocks has generally reached overmature conditions. There are three key hydrocarbon generation and expulsion periods in the Є1q source rocks of the Sichuan Basin, China. In the late stage, the hydrocarbon generation and expulsion centers are located in the central and northern parts of the Mianyang-Changning rift trough, while the hydrocarbon retention center is located in the central part of the rift trough. The maximum resource potential in these areas can reach 988 × 108 m³/km², 915 × 108 m³/km², and 74 × 108 m³/km², respectively.
Based on the theory of the whole petroleum system, the improved hydrocarbon potential method was used to evaluate the conventional and shale oil and gas resources of the Є1q in the Sichuan Basin, identifying the favorable exploration areas and resource quantities. The results indicate that the favorable conventional oil and gas areas are mainly the hydrocarbon generation and expulsion centers, located in the central and northern parts of the rift trough, with a secondary center in the southern part of the rift trough. The resource potential in these areas reaches 6560 × 1012 m³. The favorable shale oil and gas areas are primarily the hydrocarbon retention centers, located in the central part of the rift trough, with a resource potential of 287 × 1012 m³. The significant hydrocarbon generation potential of the Є1q source rocks provides a rich material basis for the discovery of the next large gas field, with the central and northern regions of the rift trough being the recommended focus for the next phase of exploration.
Acknowledgments
We appreciate the Southern Sichuan Gas District of PetroChina Southwest Oil & Gasfield Company for providing background geologic data and permission to publish the results.
References
- Jin, Q.; Hou, Q.; Cheng, F.; Wang, S.; Zhang, R.; Wang, F. Evaluation method of effective source rock in mature exploration area: a case study of Liaodong Bay. Acta Petrolei Sinica 2019, 40, 257. [Google Scholar] [CrossRef]
- McCarthy, K.; Rojas, K.; Niemann, M.; Palmowski, D.; Peters, K.; Stankiewicz, A. Basic petroleum geochemistry for source rock evaluation. Oilfield Review 2011, 23, 32–43. [Google Scholar]
- Weeks, L.G. Highlights on 1948 developments in foreign petroleum fields. AAPG Bulletin 1949, 33, 1029–1124. [Google Scholar]
- Li, C.; Pang, X.; Huo, Z.; Wang, E.; Xue, N. A revised method for reconstructing the hydrocarbon generation and expulsion history and evaluating the hydrocarbon resource potential: Example from the first member of the Qingshankou Formation in the Northern Songliao Basin, Northeast China. Marine and Petroleum Geology 2020, 121, 104577. [Google Scholar] [CrossRef]
- Pepper, A.S. Estimating the petroleum expulsion behaviour of source rocks: a novel quantitative approach. Geological Society, London, Special Publications 1991, 59, 9–31. [Google Scholar] [CrossRef]
- Jarvie, D.M. Shale resource systems for oil and gas: Part 2—Shale-oil resource systems. 2012. [CrossRef]
- Egbobawaye, E.I. Petroleum source-rock evaluation and hydrocarbon potential in Montney Formation unconventional reservoir, northeastern British Columbia, Canada. Natural Resources 2017, 8, 716. [Google Scholar] [CrossRef]
- Romero-Sarmiento, M.-F.; Ramiro-Ramirez, S.; Berthe, G.; Fleury, M.; Littke, R. Geochemical and petrophysical source rock characterization of the Vaca Muerta Formation, Argentina: Implications for unconventional petroleum resource estimations. International Journal of Coal Geology 2017, 184, 27–41. [Google Scholar] [CrossRef]
- Liu, G.; Wang, Y.; Wang, X.; Pan, Y. Quantitative evaluation of oil and gas resources: a geological analogy model based on Delphi method. In Proceedings of the 2009 Sixth International Conference on Fuzzy Systems and Knowledge Discovery; 2009; pp. 603–607. [Google Scholar] [CrossRef]
- Tissot, B.P.; Welte, D.H. Petroleum formation and occurrence; Springer Science & Business Media: 2013.
- Wang, E.; Feng, Y.; Liu, G.; Chen, S.; Wu, Z.; Li, C. Hydrocarbon source potential evaluation insight into source rocks—A case study of the first member of the Paleogene Shahejie Formation, Nanpu Sag, NE China. Energy Reports 2021, 7, 32–42. [Google Scholar] [CrossRef]
- Triche, N.E.; Bahar, M. Shale gas volumetrics of unconventional resource plays in the Canning Basin, Western Australia. In Proceedings of the SPE Asia Pacific Unconventional Resources Conference and Exhibition, 2013; pp. SPE–167078-MS. [CrossRef]
- Wang, P.; Chen, X.; Pang, X.; Li, J.; Yang, H.; Jiang, F.; Guo, J.; Guo, F.; Peng, W.; Xu, J. Gas generation and expulsion characteristics of Middle–Upper Triassic source rocks, eastern Kuqa Depression, Tarim Basin, China: Implications for shale gas resource potential. Australian Journal of Earth Sciences 2014, 61, 1001–1013. [Google Scholar] [CrossRef]
- Wei, G.; Wang, Z.; Li, J.; Yang, W.; Xie, Z. Characteristics of source rocks, resource potential and exploration direction of Sinian-Cambrian in Sichuan Basin, China. Journal of Natural Gas Geoscience 2017, 2, 289–302. [Google Scholar] [CrossRef]
- Yiming, A.; Ding, X.; Qian, L.; Liu, H.; Hou, M.; Jiang, Z. Gas Generation Potential of Permian Oil-Prone Source Rocks and Natural Gas Exploration Potential in the Junggar Basin, NW China. Applied Sciences 2022, 12, 11327. [Google Scholar] [CrossRef]
- Huang, J.; Caineng, Z.; Jianzhong, L.; Dazhong, D.; Sheiiao, W.; Shiqian, W.; Cheng, K. Shale gas generation and potential of the lower Cambrian Qiongzhusi formation in the southern Sichuan Basin, China. Petroleum Exploration and Development 2012, 39, 75–81. [Google Scholar] [CrossRef]
- Zeng, P.; Guo, T. Enrichment of shale gas in different strata in Sichuan Basin and its periphery—The examples of the Cambrian Qiongzhusi Formation and the Silurian Longmaxi Formation. Energy Exploration & Exploitation 2015, 33, 277–298. [Google Scholar] [CrossRef]
- Zou, C.; Du, J.; Xu, C.; Wang, Z.; Zhang, B.; Wei, G.; Wang, T.; Yao, G.; Deng, S.; Liu, J.; et al. Formation, distribution, resource potential, and discovery of Sinian–Cambrian giant gas field, Sichuan Basin, SW China. Petroleum exploration and development 2014, 41, 306–325. [Google Scholar] [CrossRef]
- Li, C.; Pang, X.; Ma, X.; Wang, E.; Hu, T.; Wu, Z. Hydrocarbon generation and expulsion characteristics of the Lower Cambrian Qiongzhusi shale in the Sichuan Basin, Central China: Implications for conventional and unconventional natural gas resource potential. Journal of Petroleum Science and Engineering 2021, 204, 108610. [Google Scholar] [CrossRef]
- Wei, G.; Chen, G.; Du, S.; Zhang, L.; Yang, W. Petroleum systems of the oldest gas field in China: Neoproterozoic gas pools in the Weiyuan gas field, Sichuan Basin. Marine and Petroleum Geology 2008, 25, 371–386. [Google Scholar] [CrossRef]
- Ma, X.; Xie, X. The progress and prospects of shale gas exploration and development in southern Sichuan Basin, SW China. Petroleum Exploration and Development 2018, 45, 172–182. [Google Scholar] [CrossRef]
- Qiu, N.; Chang, J.; Zuo, Y.; Wang, J.; Li, H. Thermal evolution and maturation of lower Paleozoic source rocks in the Tarim Basin, northwest China. AAPG bulletin 2012, 96, 789–821. [Google Scholar] [CrossRef]
- Pang, X.; Jia, C.; Zhang, K.; Li, M.; Wang, Y.; Peng, J.; Li, B.; Chen, J. The dead line for oil and gas and implication for fossil resource prediction. Earth System Science Data 2020, 12, 577–590. [Google Scholar] [CrossRef]
- Liu, W.; Wu, J.; Jiang, H.; Zhou, Z.; Luo, C.; Wu, W.; Li, X.; Liu, S.; Deng, B. Cenozoic exhumation and shale-gas enrichment of the Wufeng-Longmaxi formation in the southern Sichuan basin, western China. Marine and Petroleum Geology 2021, 125, 104865. [Google Scholar] [CrossRef]
- Zhao, L.; Mao, W.; Liu, Z.; Cheng, S. Research on the differential tectonic-thermal evolution of Longmaxi shale in the southern Sichuan Basin. Advances in Geo-Energy Research 2023, 7, 152–163. [Google Scholar] [CrossRef]
- Jin, Z.; Nie, H.; Liu, Q.; Zhao, J.; Jiang, T. Source and seal coupling mechanism for shale gas enrichment in upper Ordovician Wufeng Formation-Lower Silurian Longmaxi Formation in Sichuan Basin and its periphery. Marine and Petroleum Geology 2018, 97, 78–93. [Google Scholar] [CrossRef]
- Ma, K.; Wen, L.; Zhang, B.; Li, Y.; Zhong, J.; Wang, Y.; Peng, H.; Zhang, X.; Yan, W.; Ding, Y.; et al. Segmented evolution of Deyang–Anyue erosion rift trough in Sichuan Basin and its significance for oil and gas exploration, SW China. Petroleum Exploration and Development 2022, 49, 313–326. [Google Scholar] [CrossRef]
- Zhao, L.; Liu, S.; Li, G.; Zhang, M.; Liang, X.; Li, J.; Xu, J. Sedimentary Environment and Enrichment of Organic Matter During the Deposition of Qiongzhusi Formation in the Upslope Areas—A Case Study of W207 Well in the Weiyuan Area, Sichuan Basin, China. Frontiers in Earth Science 2022, 10, 867616. [Google Scholar] [CrossRef]
- Ma, B.; Liang, H.; Wu, G.; Tang, Q.; Tian, W.; Zhang, C.; Yang, S.; Zhong, Y.; Zhang, X.; Zhang, Z. Formation and evolution of the strike-slip faults in the central Sichuan Basin, SW China. Petroleum Exploration and Development 2023, 50, 373–387. [Google Scholar] [CrossRef]
- Li, R.; Wang, Y.; Wang, Z.; Xie, W.; Li, W.; Gu, M.; Liang, Z. Geological characteristics of the southern segment of the Late Sinian—Early Cambrian Deyang—Anyue rift trough in Sichuan Basin, SW China. Petroleum Exploration and Development 2023, 50, 321–333. [Google Scholar] [CrossRef]
- Passey, Q.; Creaney, S.; Kulla, J.; Moretti, F.; Stroud, J. A practical model for organic richness from porosity and resistivity logs. AAPG bulletin 1990, 74, 1777–1794. [Google Scholar]
- Bian, L.; Liu, G.; Sun, M.; Yang, D.; Wan, W.; Zhang, C. Improved ΔlogR technique and its application to predicting total organic carbon of source rocks with middle and deep burial depth. Petroleum Geology and Recovery Efficiency 2018, 25, 40–45, (in Chinese with English abstract). [Google Scholar] [CrossRef]
- Pang, X.; Lerche, I.; Fajin, C.; Zhangming, C. Hydrocarbon expulsion threshold: Significance and applications to oil and gas exploration. Energy exploration & exploitation 1998, 16, 539–555. [Google Scholar] [CrossRef]
- Jiang, F.; Pang, X.; Meng, Q.; Zhou, X. A method of identifying effective source rocks and its application in the Bozhong Depression, Bohai Sea, China. Petroleum Science 2010, 7, 458–465. [Google Scholar] [CrossRef]
- Gao, G.; Liu, G.; Fu, J.; Yao, J. A new method for determining the lower limit of organic matter abundance in effective source rocks - taking the lacustrine mudstone source rocks of the Upper Triassic Yanchang Formation in the Longdong area of the Ordos Basin as an example. Journal of Xi'an Shiyou University (Natural Science Edition) 2012, 27, 22-26+118, (Chinese). [Google Scholar]
- Cui, J.; Zhang, Z.; Liu, J.; Liu, G.; Huang, X.; Qi, Y.; Mao, Z.; Li, Y. Hydrocarbon generation and expulsion quantification and contribution of multiple source rocks to hydrocarbon accumulation in Yanchang Formation, Ordos Basin, China. Journal of Natural Gas Geoscience 2021, 6, 375–391. [Google Scholar] [CrossRef]
- Feng, Y.; Huang, Z.; Li, T.; Wang, E.; Zhang, H.; Liang, Y. Hydrocarbon generation and expulsion of Middle Jurassic lacustrine source rocks in the Turpan–Hami Basin, NW China: Implications for tight oil accumulation. Energy Exploration & Exploitation 2021, 39, 44–64. [Google Scholar] [CrossRef]
- Jiang, H.; Pang, X.; Shi, H.; Yu, Q.; Cao, Z.; Yu, R.; Chen, D.; Long, Z.; Jiang, F. Source rock characteristics and hydrocarbon expulsion potential of the Middle Eocene Wenchang formation in the Huizhou depression, Pearl River Mouth basin, south China sea. Marine and Petroleum Geology 2015, 67, 635–652. [Google Scholar] [CrossRef]
- Chen, S.; Zhu, Y.; Qin, Y.; Wang, H.; Liu, H.; Fang, J. Reservoir evaluation of the Lower Silurian Longmaxi Formation shale gas in the southern Sichuan Basin of China. Marine and Petroleum Geology 2014, 57, 619–630. [Google Scholar] [CrossRef]
- Jiang, S.; Tang, X.; Cai, D.; Xue, G.; He, Z.; Long, S.; Peng, Y.; Gao, B.; Xu, Z.; Dahdah, N. Comparison of marine, transitional, and lacustrine shales: A case study from the Sichuan Basin in China. Journal of Petroleum Science and Engineering 2017, 150, 334–347. [Google Scholar] [CrossRef]
- Jacob, H. Classification, structure, genesis and practical importance of natural solid oil bitumen (“migrabitumen”). International Journal of coal geology 1989, 11, 65–79. [Google Scholar] [CrossRef]
- Chen, J.; Sun, Y.; Zhong, N.; Huang, Z.; Deng, C.; Xie, L.; Han, H. Efficiency and model of hydrocarbon generation and expulsion in lacustrine source rocks under geological conditions. Acta Geologica Sinica88, 2014, 2005-2032. (Chinese). [CrossRef]
- Guo, Q.; Mi, J.; Wang, J.; Li, J.; Li, Y.; Y.Z. An improved hydrocarbon generation model of source rocks and key parameter templates. China Petroleum Exploration 2019, 24, 661.
- Hu, G.; Pang, Q.; Jiao, K.; Hu, C.; Liao, Z. Development of organic pores in the Longmaxi Formation overmature shales: Combined effects of thermal maturity and organic matter composition. Marine and Petroleum Geology 2020, 116, 104314. [Google Scholar] [CrossRef]
- Li, J.; Ma, W.; Wang, Y.; Wang, D.; Xie, Z.; Li, Z.; Ma, C. Modeling of the whole hydrocarbon-generating process of sapropelic source rock. Petroleum Exploration and Development 2018, 45, 461–471. [Google Scholar] [CrossRef]
- EIA, (2021). Energy Outlook 2020. Available online: https://www.eia.gov/outlooks/aeo/ (accessed on 24 September 2024).
- Estrada, J.M.; Bhamidimarri, R. A review of the issues and treatment options for wastewater from shale gas extraction by hydraulic fracturing. Fuel 2016, 182, 292–303. [Google Scholar] [CrossRef]
- Mauter, M.S.; Alvarez, P.J.; Burton, A.; Cafaro, D.C.; Chen, W.; Gregory, K.B.; Jiang, G.; Li, Q.; Pittock, J.; Reible, D. Regional variation in water-related impacts of shale gas development and implications for emerging international plays. 2014. [CrossRef]
- Magoon, L.B.; Dow, W.G. The petroleum system-from source to trap. AAPG Bulletin (American Association of Petroleum Geologists);(United States) 1991, 75. [Google Scholar]
- Jia, C. Breakthrough and significance of unconventional oil and gas to classical petroleum geology theory. Petroleum Exploration and Development 2017, 44, 1–10. [Google Scholar] [CrossRef]
- Jia, C.; Pang, X.; Song, Y. Basic principles of the whole petroleum system. Petroleum Exploration and Development 2024, 51, 780–794. [Google Scholar] [CrossRef]
- Alexander, T.; Baihly, J.; Boyer, C.; Clark, B.; Waters, G.; Jochen, V.; Le Calvez, J.; Lewis, R.; Miller, C.K.; Thaeler, J. Shale gas revolution. Oilfield review 2011, 23, 40–55. [Google Scholar]
- Jaffe, A.M.; Medlock III, K.B.; Soligo, R. The status of world oil reserves: conventional and unconventional resources in the future supply mix. Baker Institute for Public Policy, Rice Univ., Houston, TX 2011.
- Meakin, P.; Huang, H.; Malthe-Sørenssen, A.; Thøgersen, K. Shale gas: Opportunities and challenges. Environmental Geosciences 2013, 20, 151–164. [Google Scholar] [CrossRef]
- Pang, X.; Li, M.; Li, S.; Jin, Z. Geochemistry of petroleum systems in the Niuzhuang South Slope of Bohai Bay Basin: Part 3. Estimating hydrocarbon expulsion from the Shahejie formation. Organic Geochemistry 2005, 36, 497–510. [Google Scholar] [CrossRef]
- Zan, L. , Luo, W., Yin, Y., Jin, X. Formation conditions of shale oil and favorable targets in the second member of Paleogene Funing Formation in Qintong Sag, Subei Basin. Petroleum Geology & Experiment. 2021, 43, 233–241, (in Chinese with English abstract. [Google Scholar] [CrossRef]
Figure 1.
(a) Location and structural map of the Sichuan Basin. (b) Lithological characteristics of the Cambrian and Sinian systems in the Sichuan Basin. (c) Key cross-sectional profile of the Sichuan Basin across the Deyang–Anxian rift trough (profile line shown in Figure 1a as A–A′).
Figure 1.
(a) Location and structural map of the Sichuan Basin. (b) Lithological characteristics of the Cambrian and Sinian systems in the Sichuan Basin. (c) Key cross-sectional profile of the Sichuan Basin across the Deyang–Anxian rift trough (profile line shown in Figure 1a as A–A′).
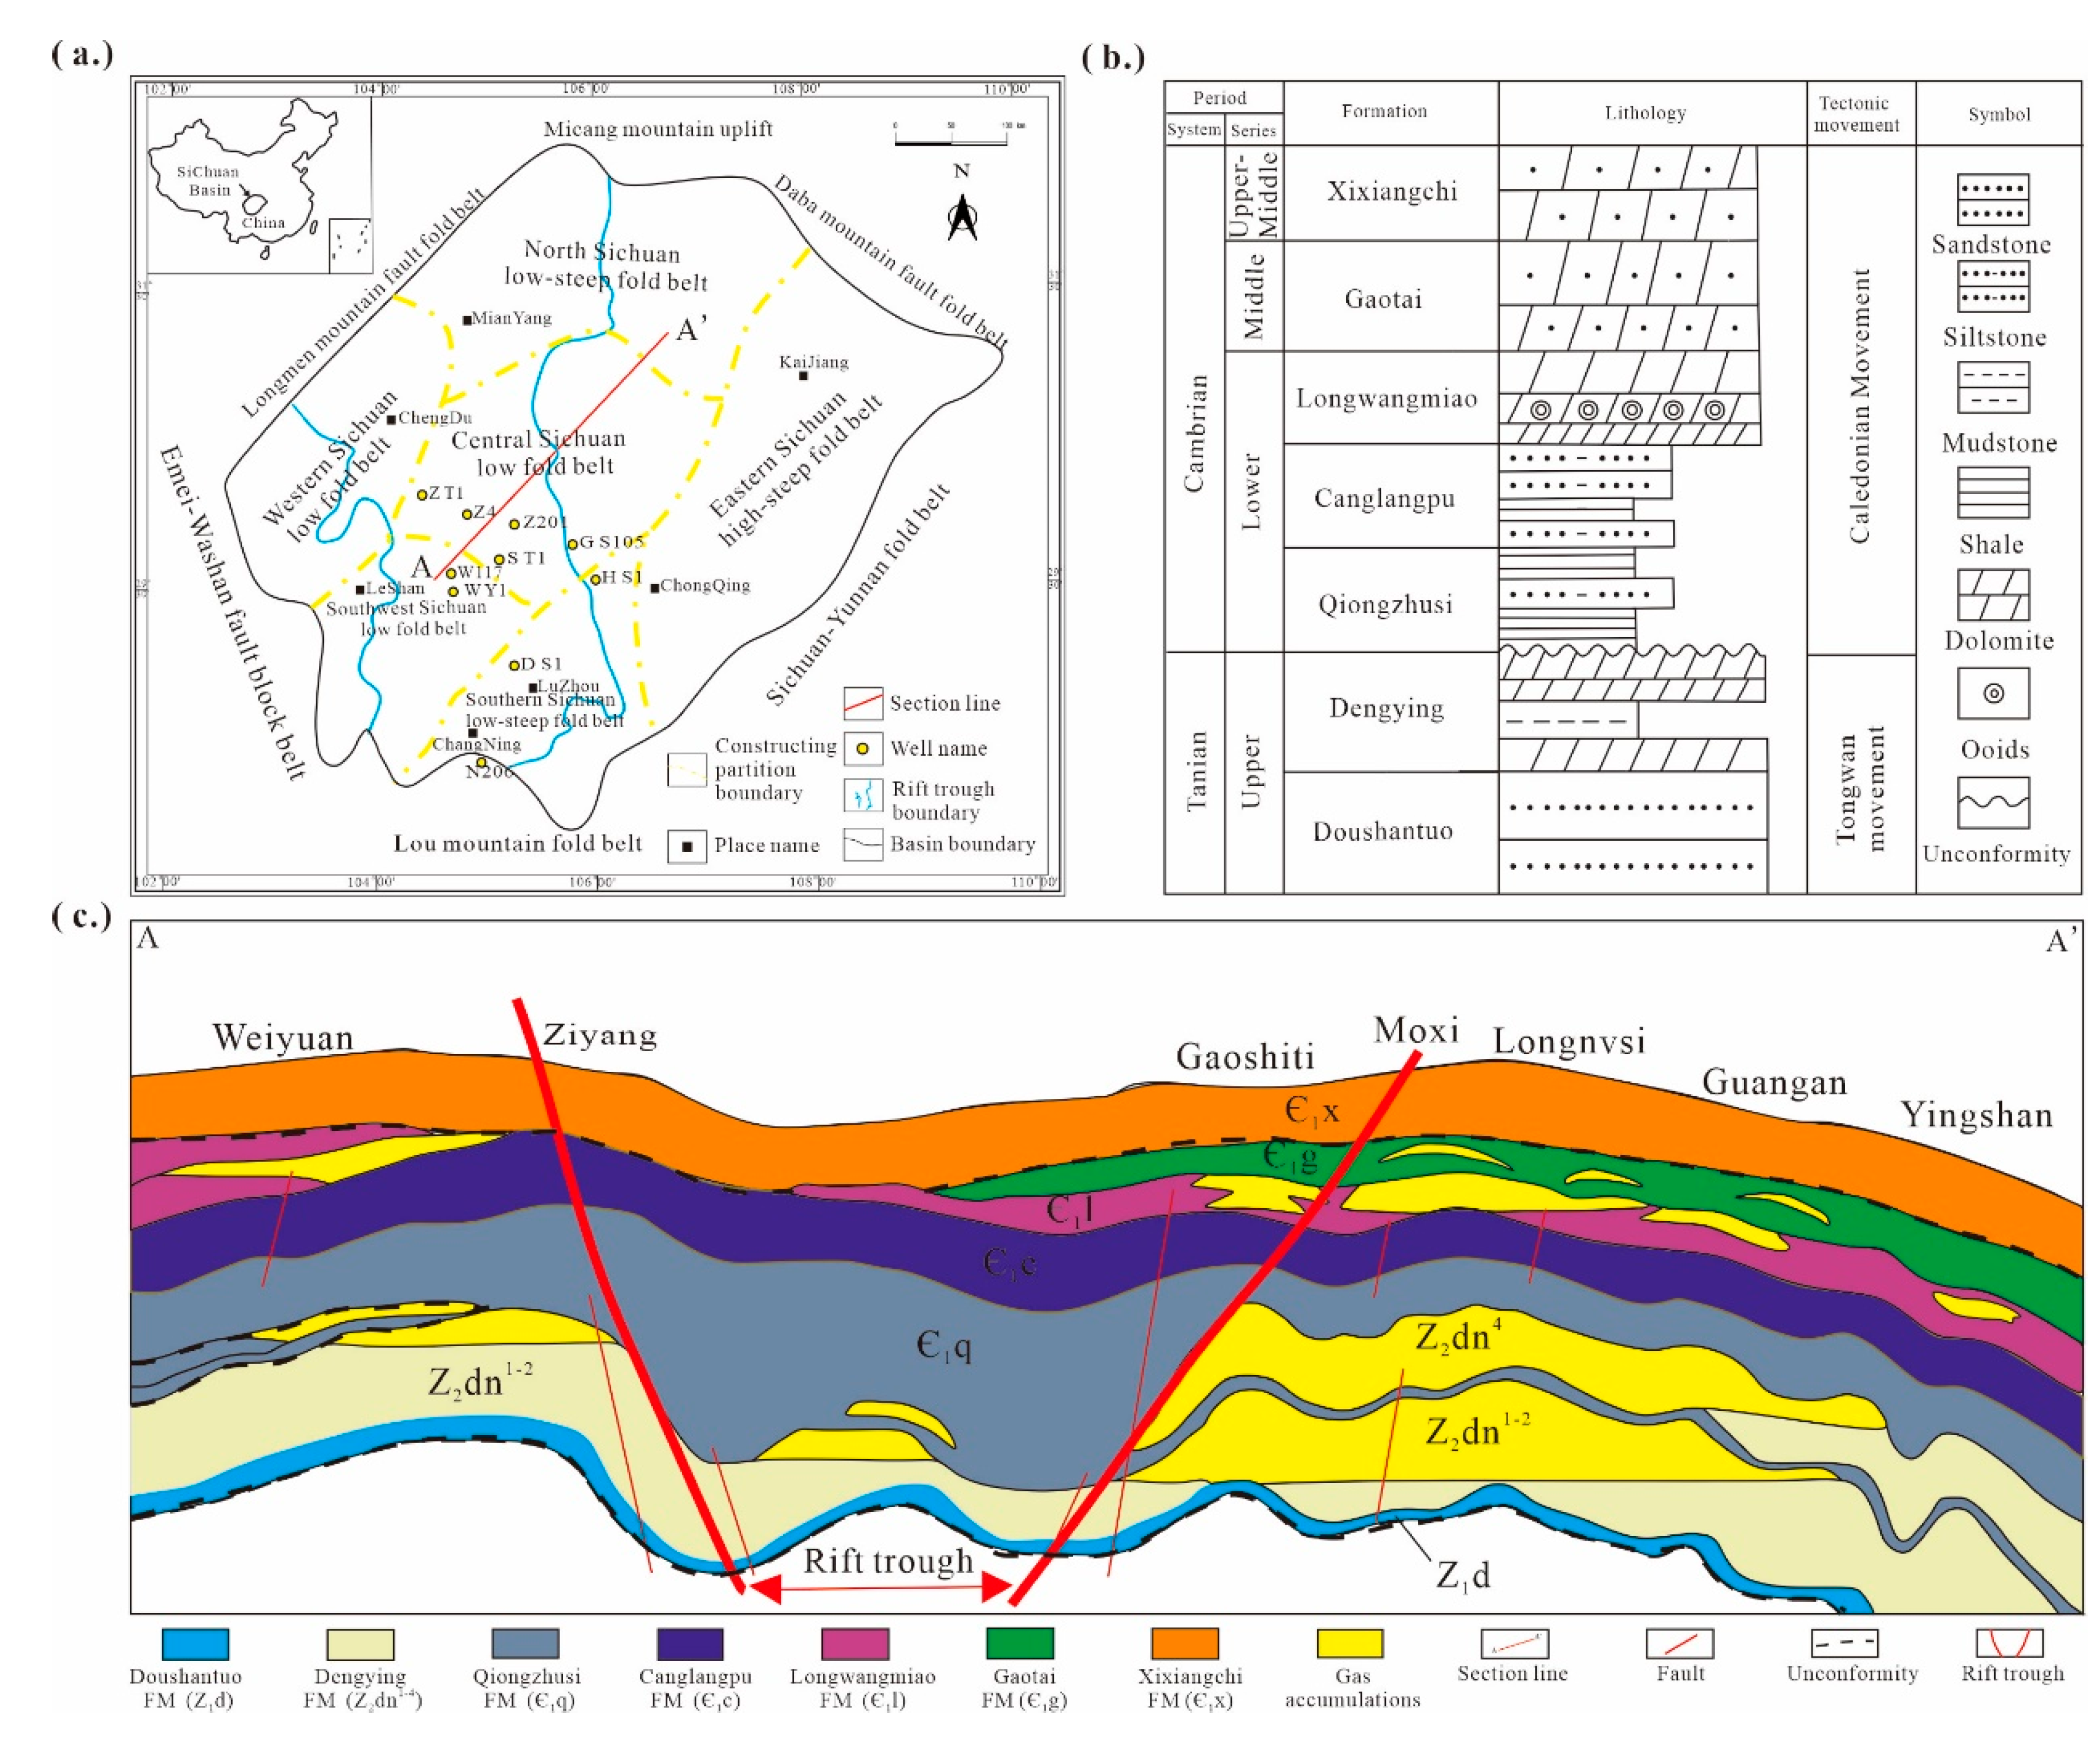
Figure 2.
Schematic explanation of different scenarios of the ΔlogR stacking technology modified by Bian Leibo [32].
Figure 2.
Schematic explanation of different scenarios of the ΔlogR stacking technology modified by Bian Leibo [32].
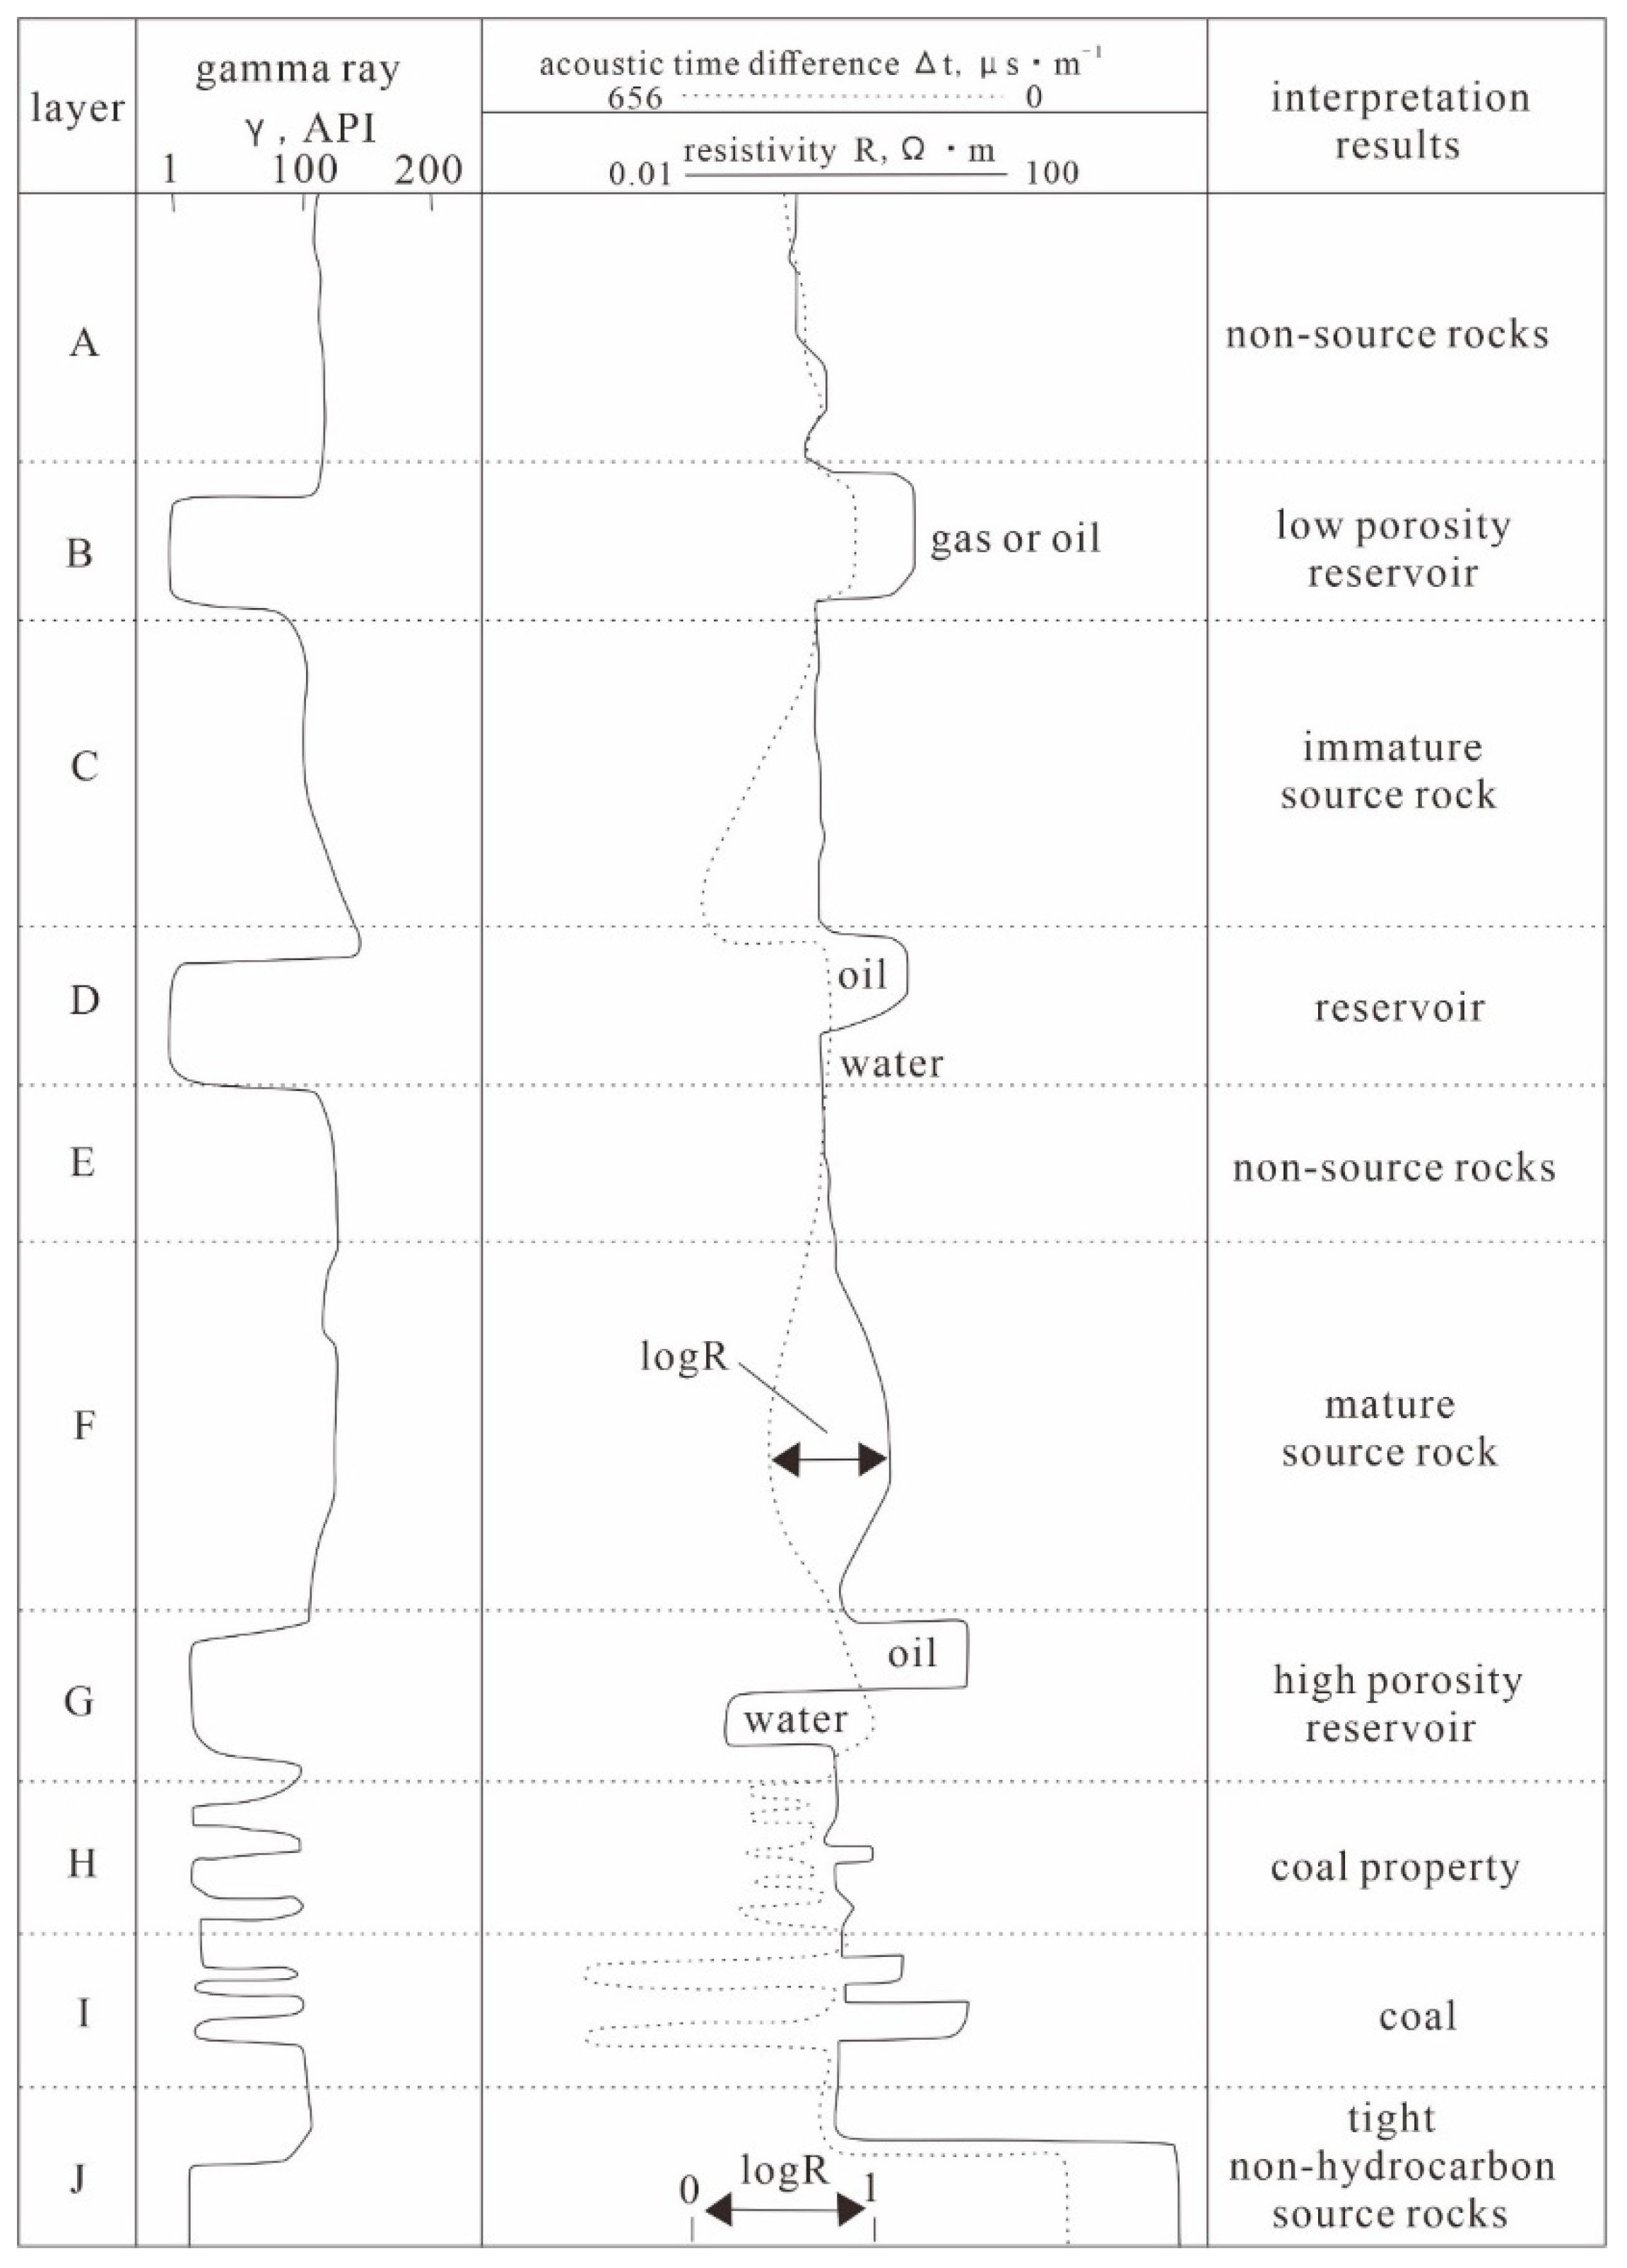
Figure 3.
Schematic diagram of the hydrocarbon generation potential method.
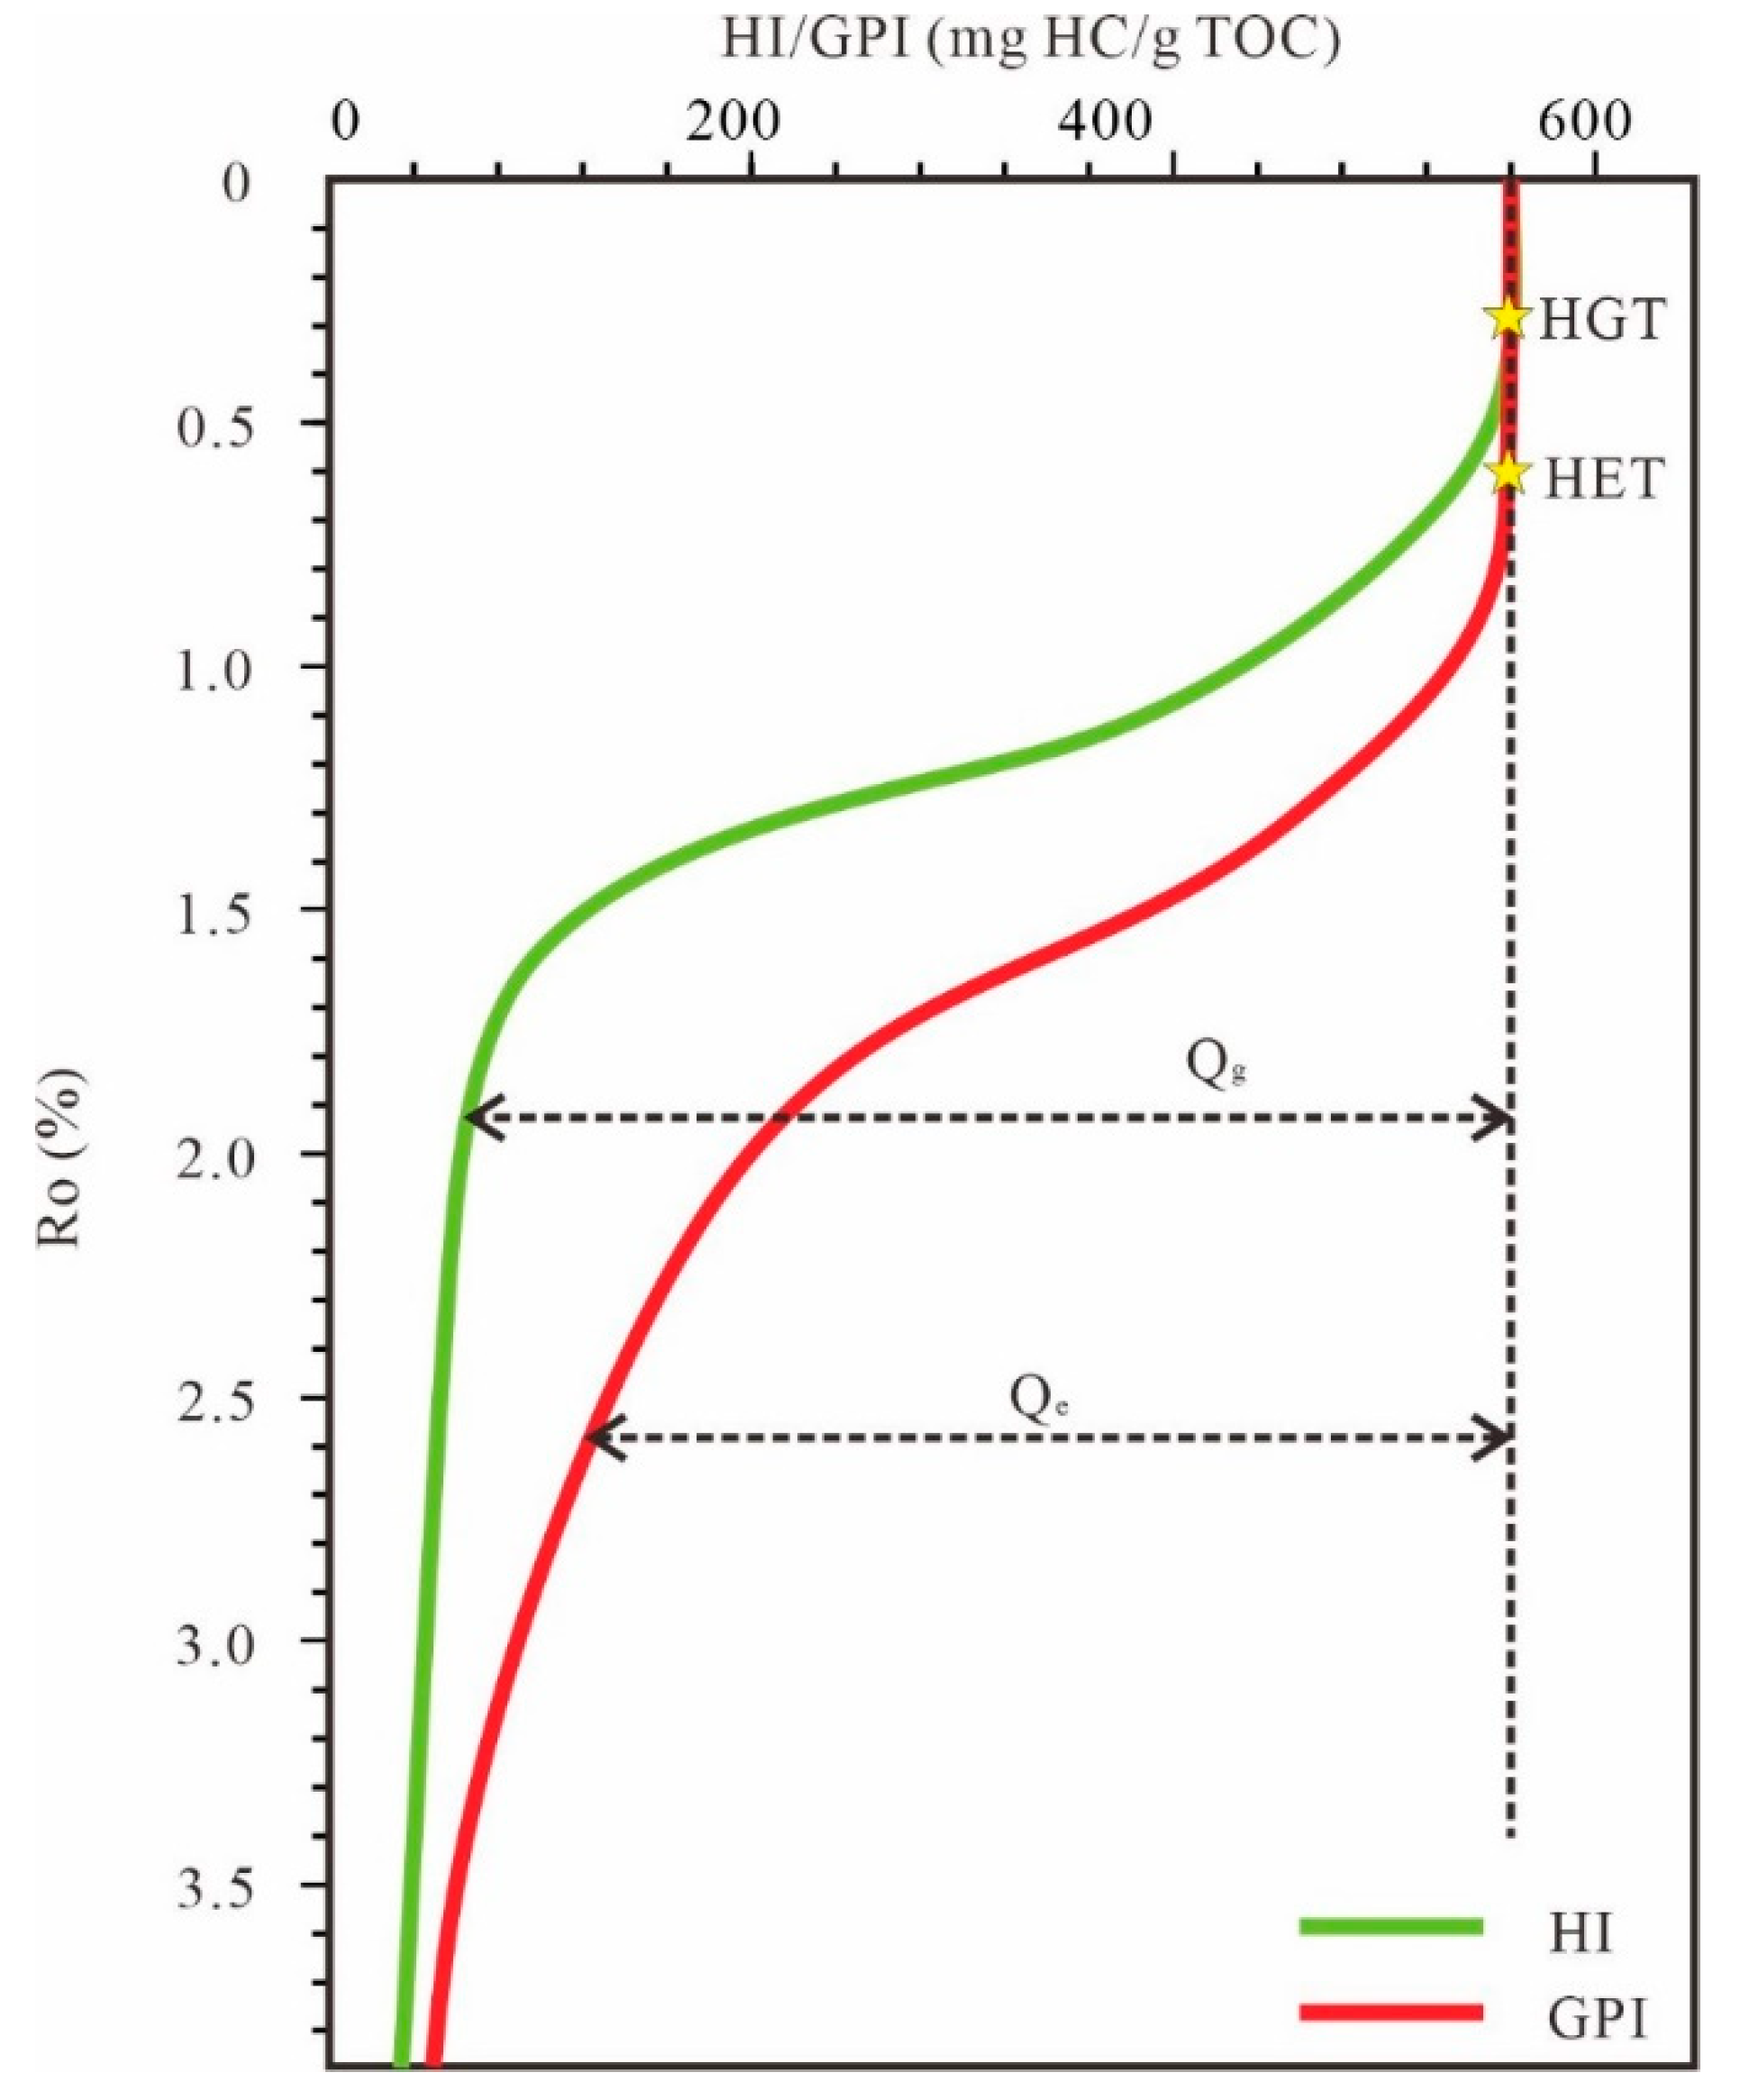
Figure 4.
(a) Results of the construction of the ΔlogR curve and the prediction of TOC for the representative single well Z201. (b) Correlation analysis chart between measured TOC and ΔlogR-predicted TOC.
Figure 4.
(a) Results of the construction of the ΔlogR curve and the prediction of TOC for the representative single well Z201. (b) Correlation analysis chart between measured TOC and ΔlogR-predicted TOC.
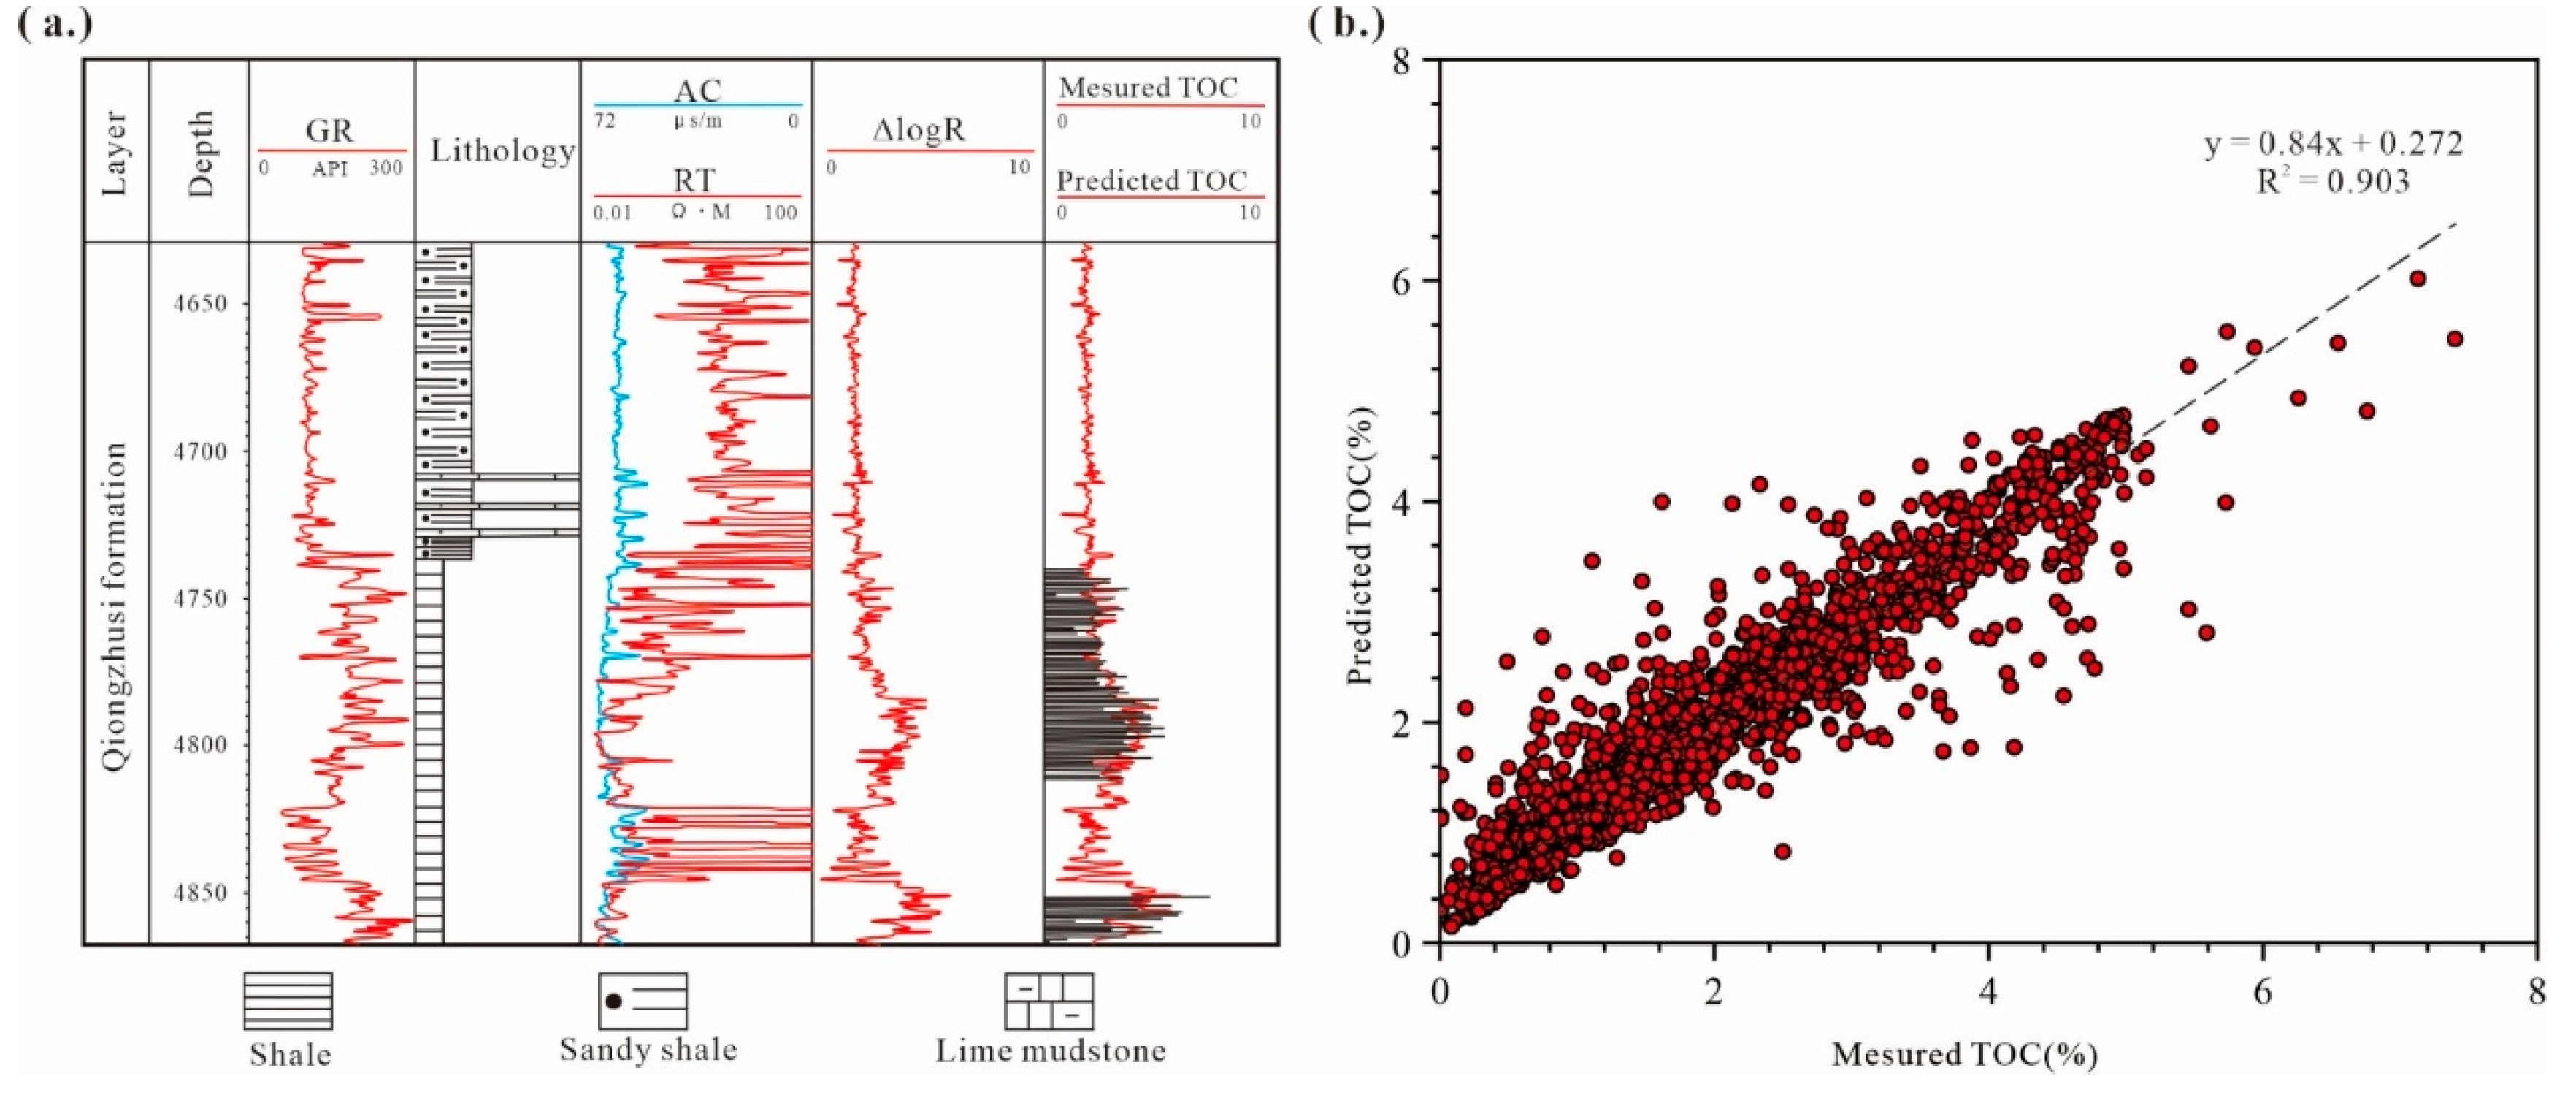
Figure 5.
(a) Contour map of the effective thickness of the source rock in Є1q. (b) TOC contour map of the Є1q source rock.
Figure 5.
(a) Contour map of the effective thickness of the source rock in Є1q. (b) TOC contour map of the Є1q source rock.
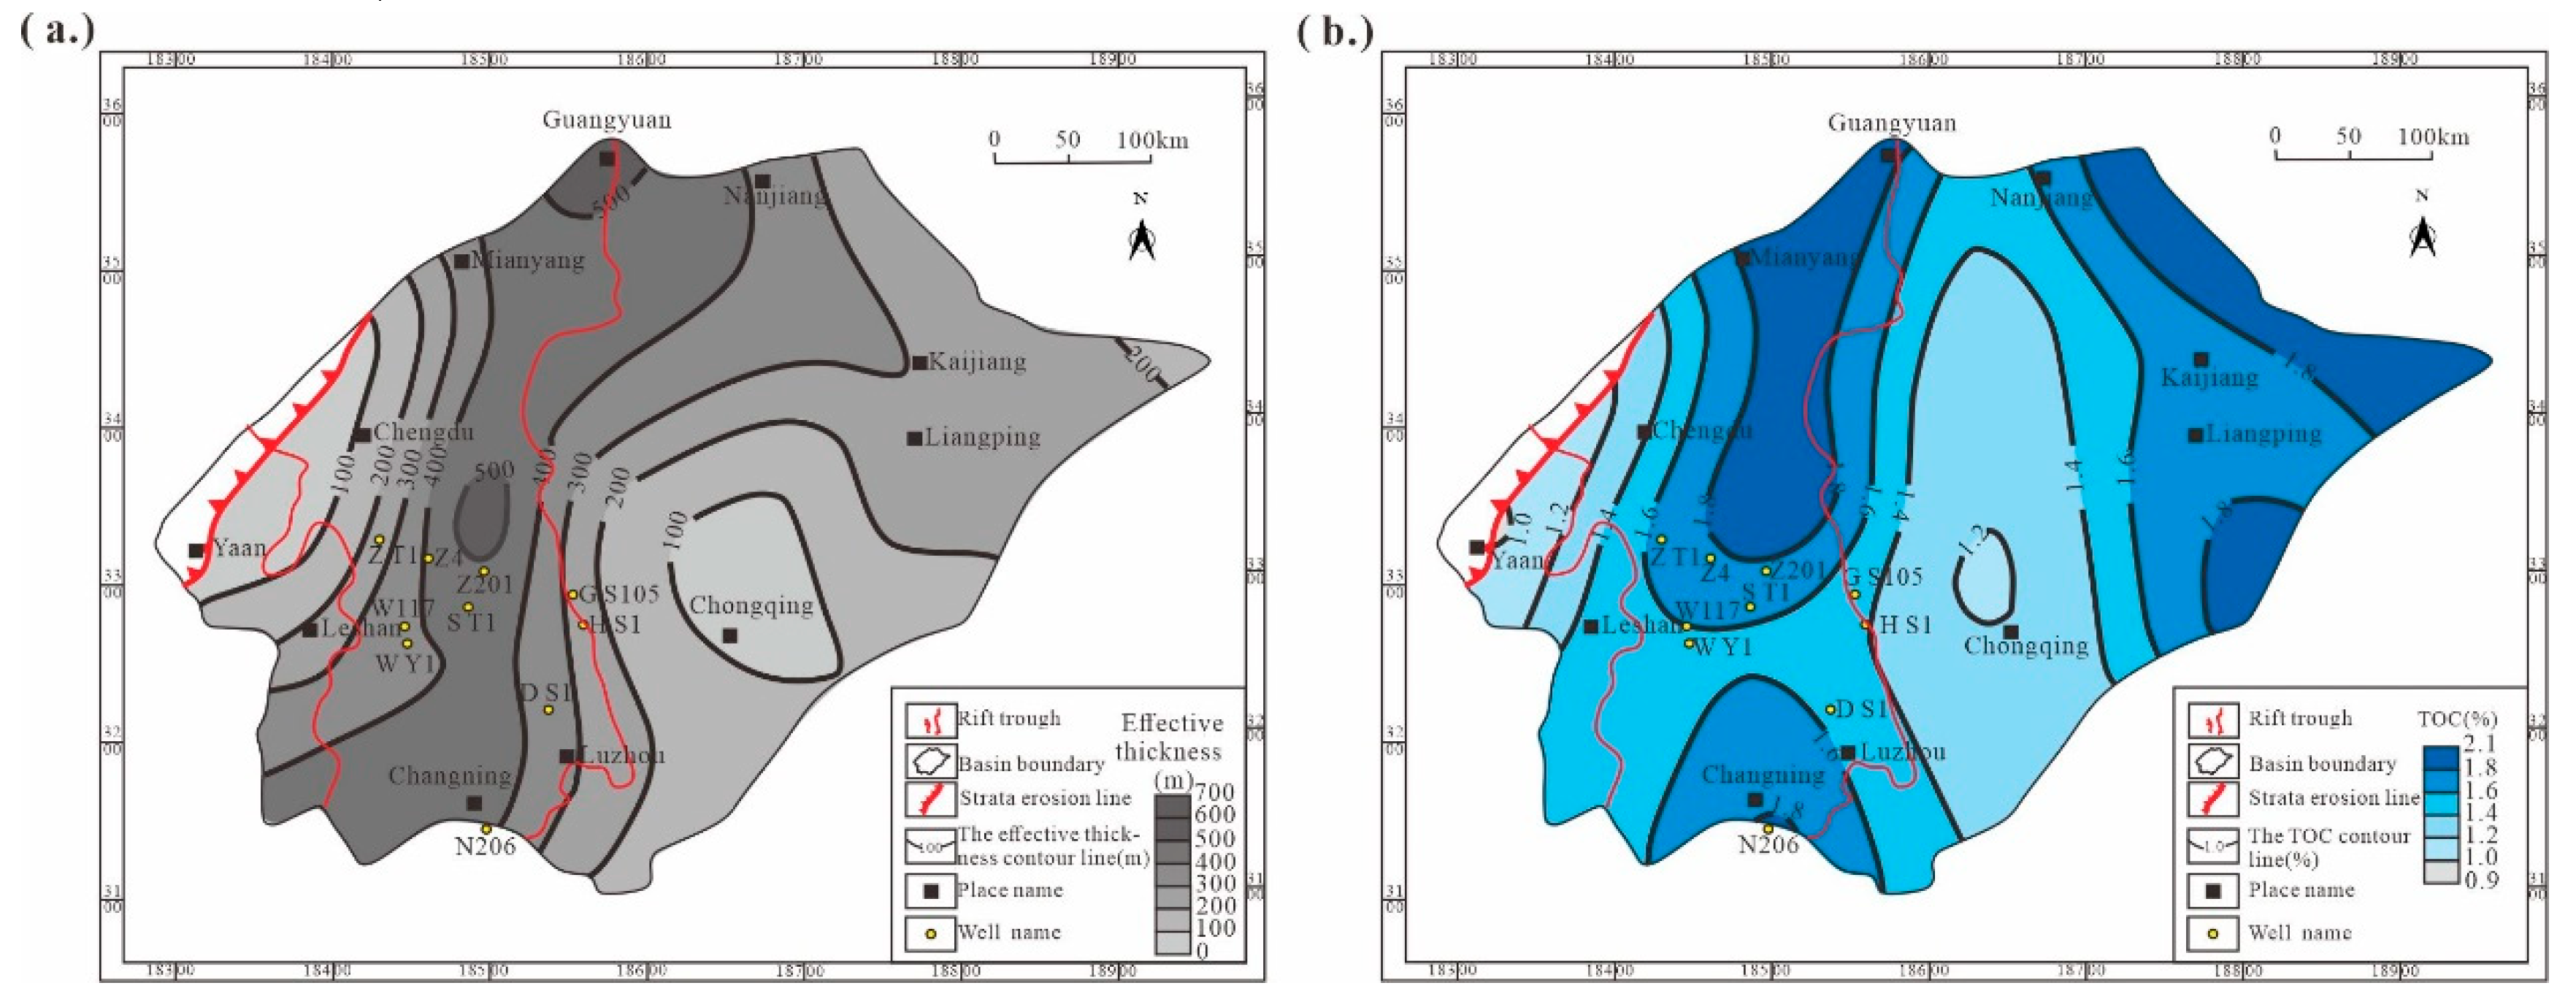
Figure 6.
Sedimentary burial history and thermal evolution history of Well GS1.
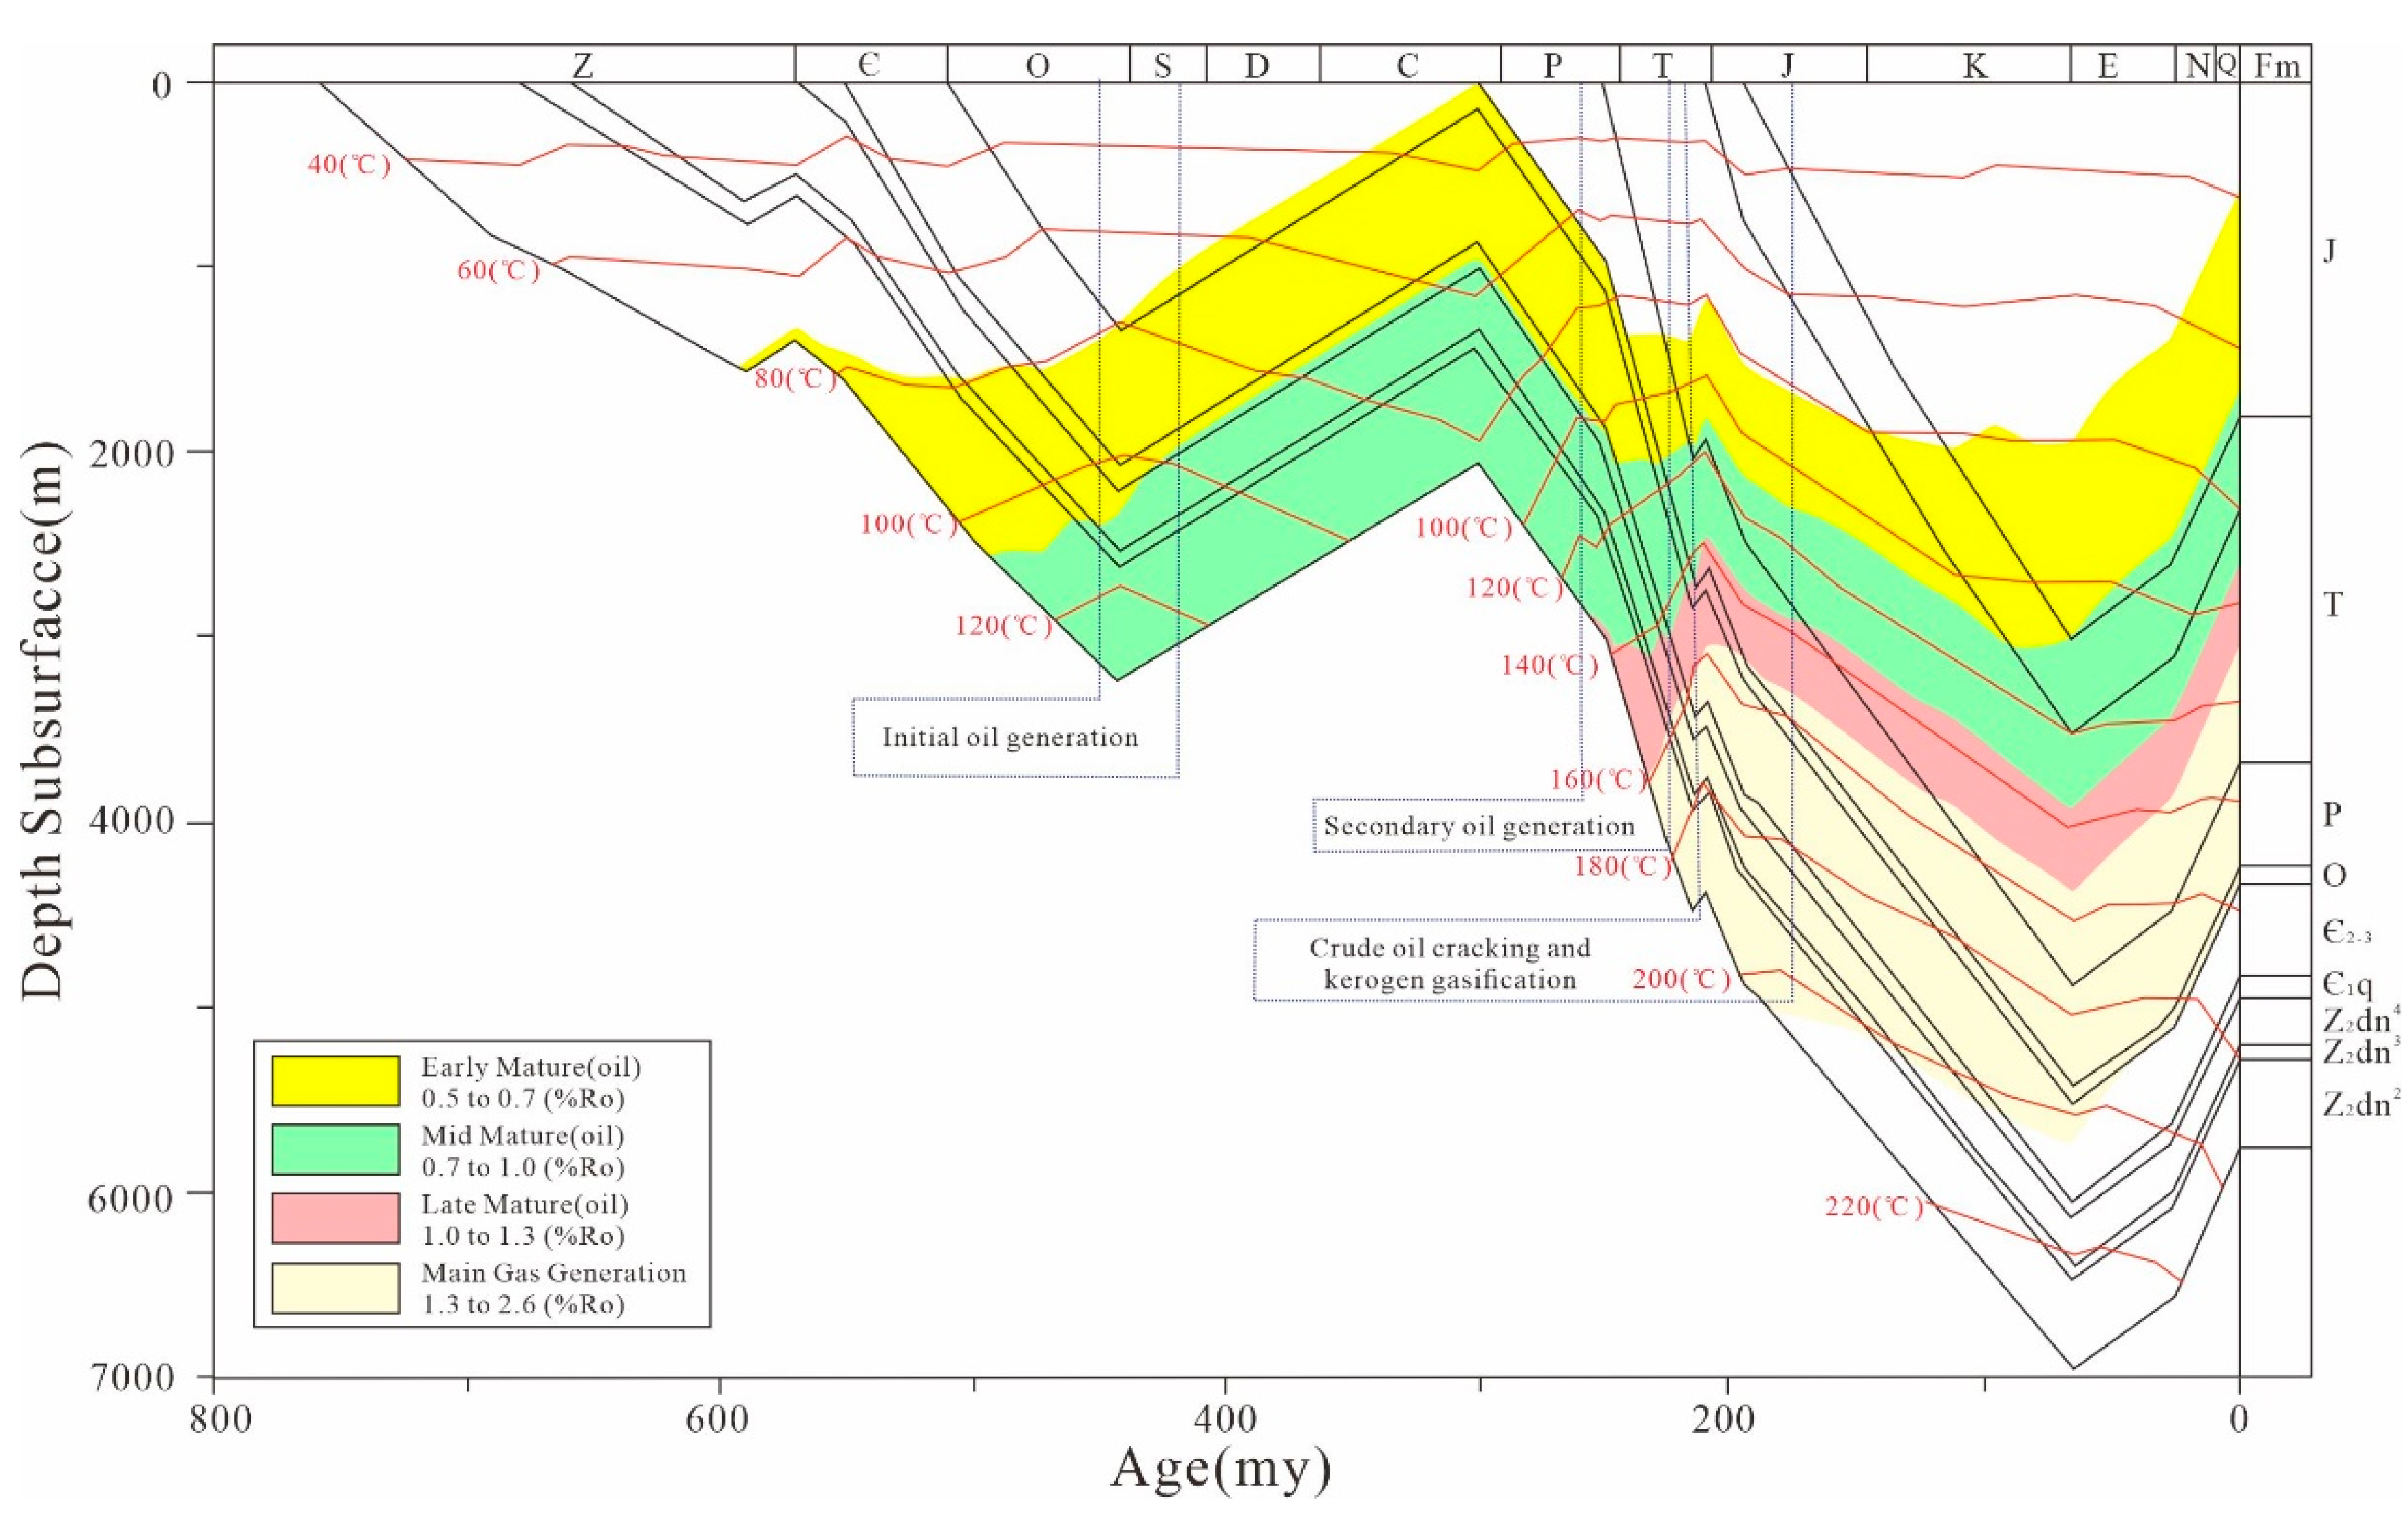
Figure 7.
Maturity Ro contour map of Є1q during (a) the Ordovician–Silurian period, (b) the Permian–Triassic period, and (c) the Jurassic period.
Figure 7.
Maturity Ro contour map of Є1q during (a) the Ordovician–Silurian period, (b) the Permian–Triassic period, and (c) the Jurassic period.
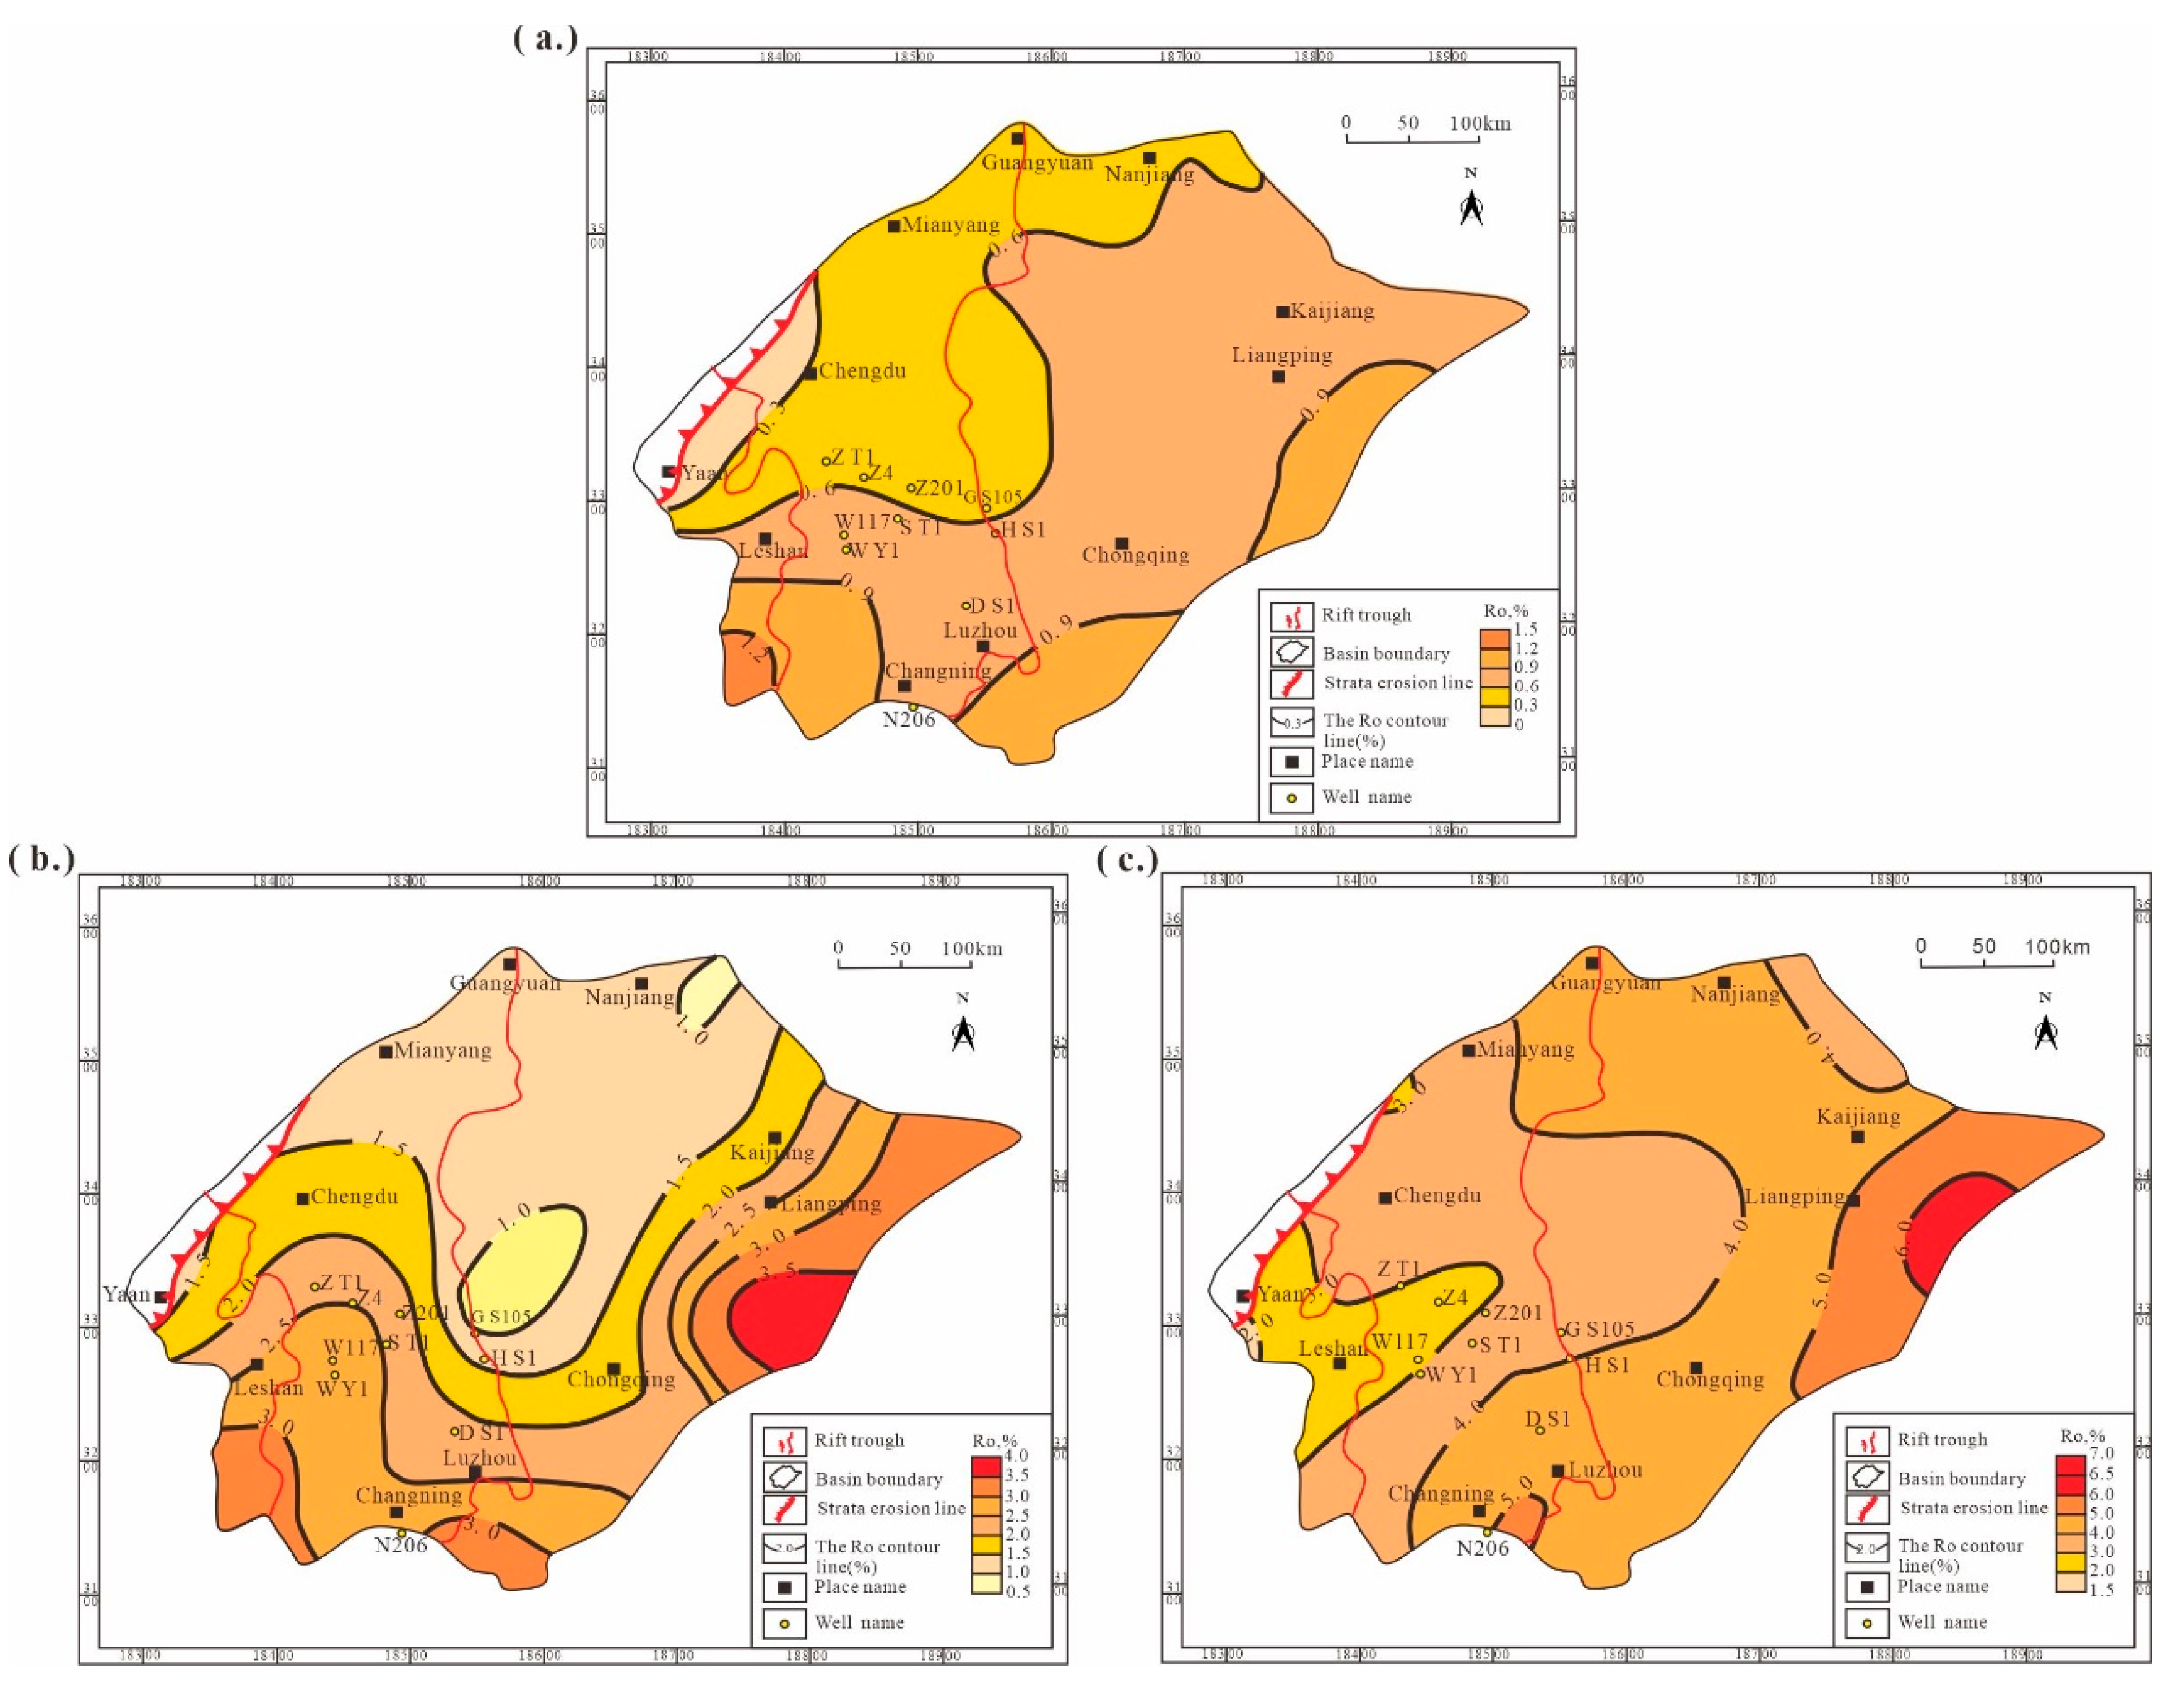
Figure 8.
(a) Microscopic component content and type discrimination diagram of organic matter types. (b) Evolution curves of organic matter GPI for five representative basins in China, namely, types I, II, and III. (c) GPI and HI evolution curves of the Є1q source rock. (d) Evolution curves of hydrocarbon generation rate, expulsion rate, and hydrocarbon retention rate in the Є1q source rock.
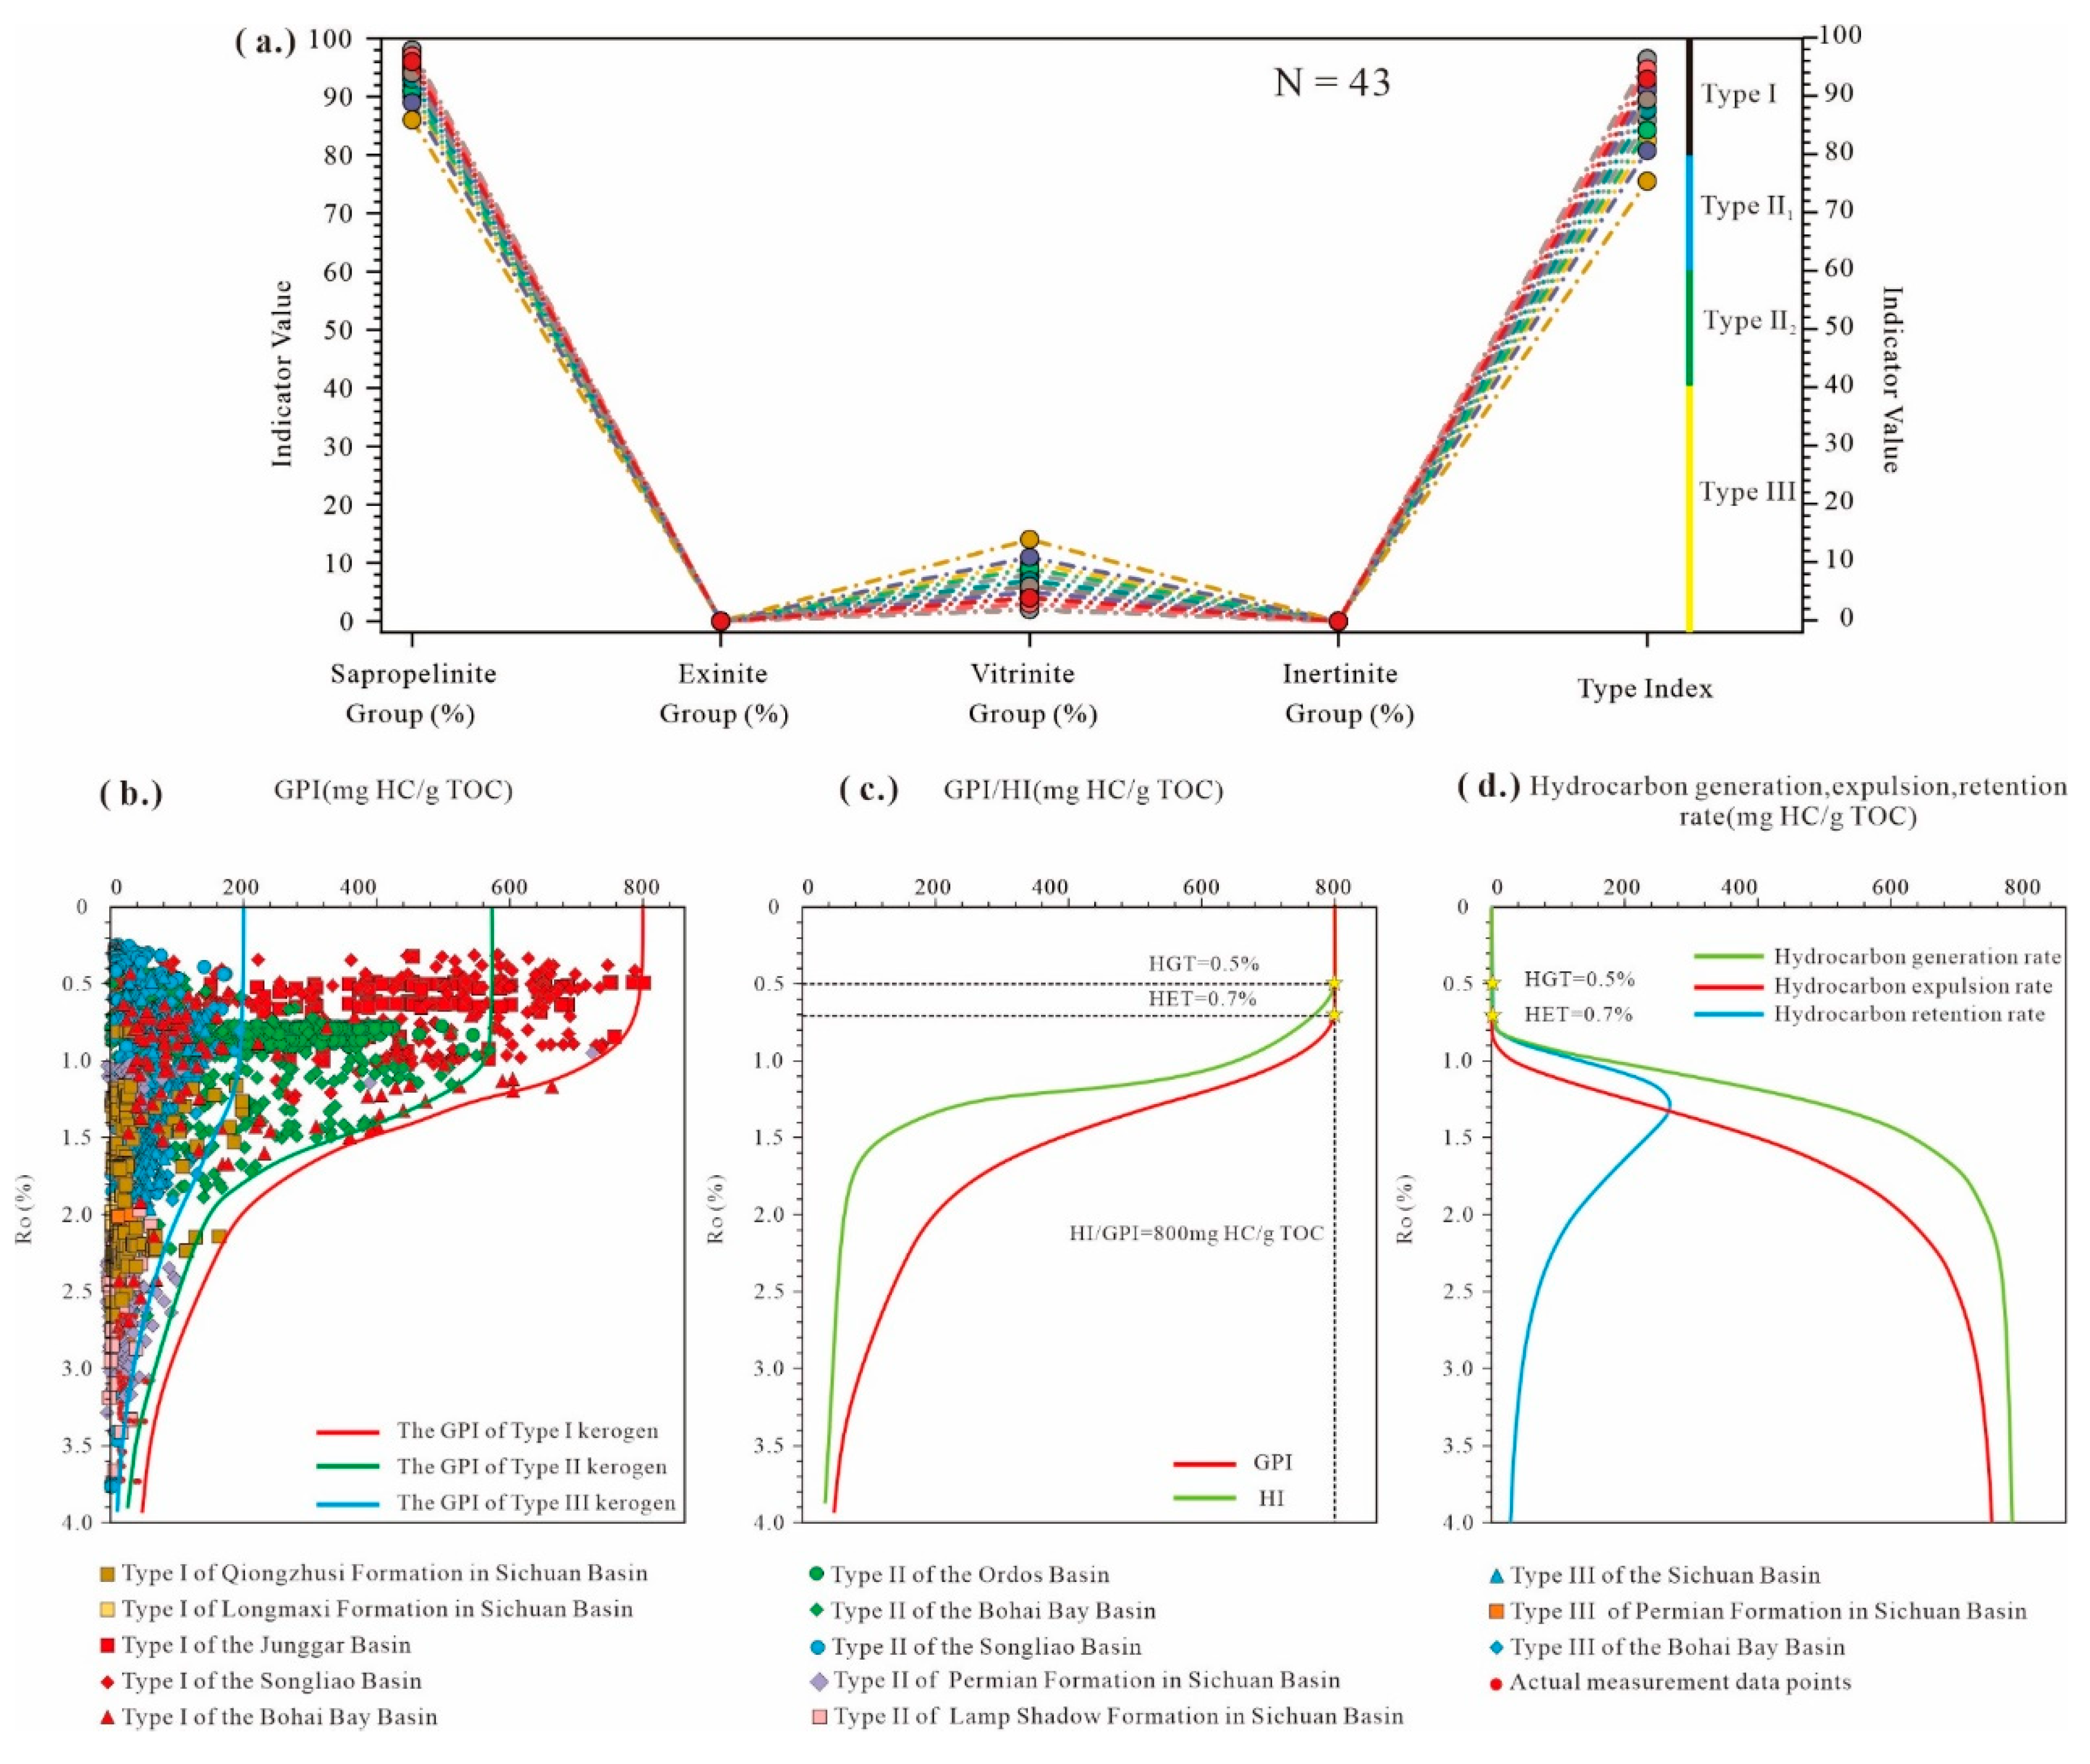
Figure 9.
TOC contour maps of the (a) Ordovician–Silurian, (b) Permian–Triassic, and (c) Jurassic source rock in Є1.
Figure 9.
TOC contour maps of the (a) Ordovician–Silurian, (b) Permian–Triassic, and (c) Jurassic source rock in Є1.
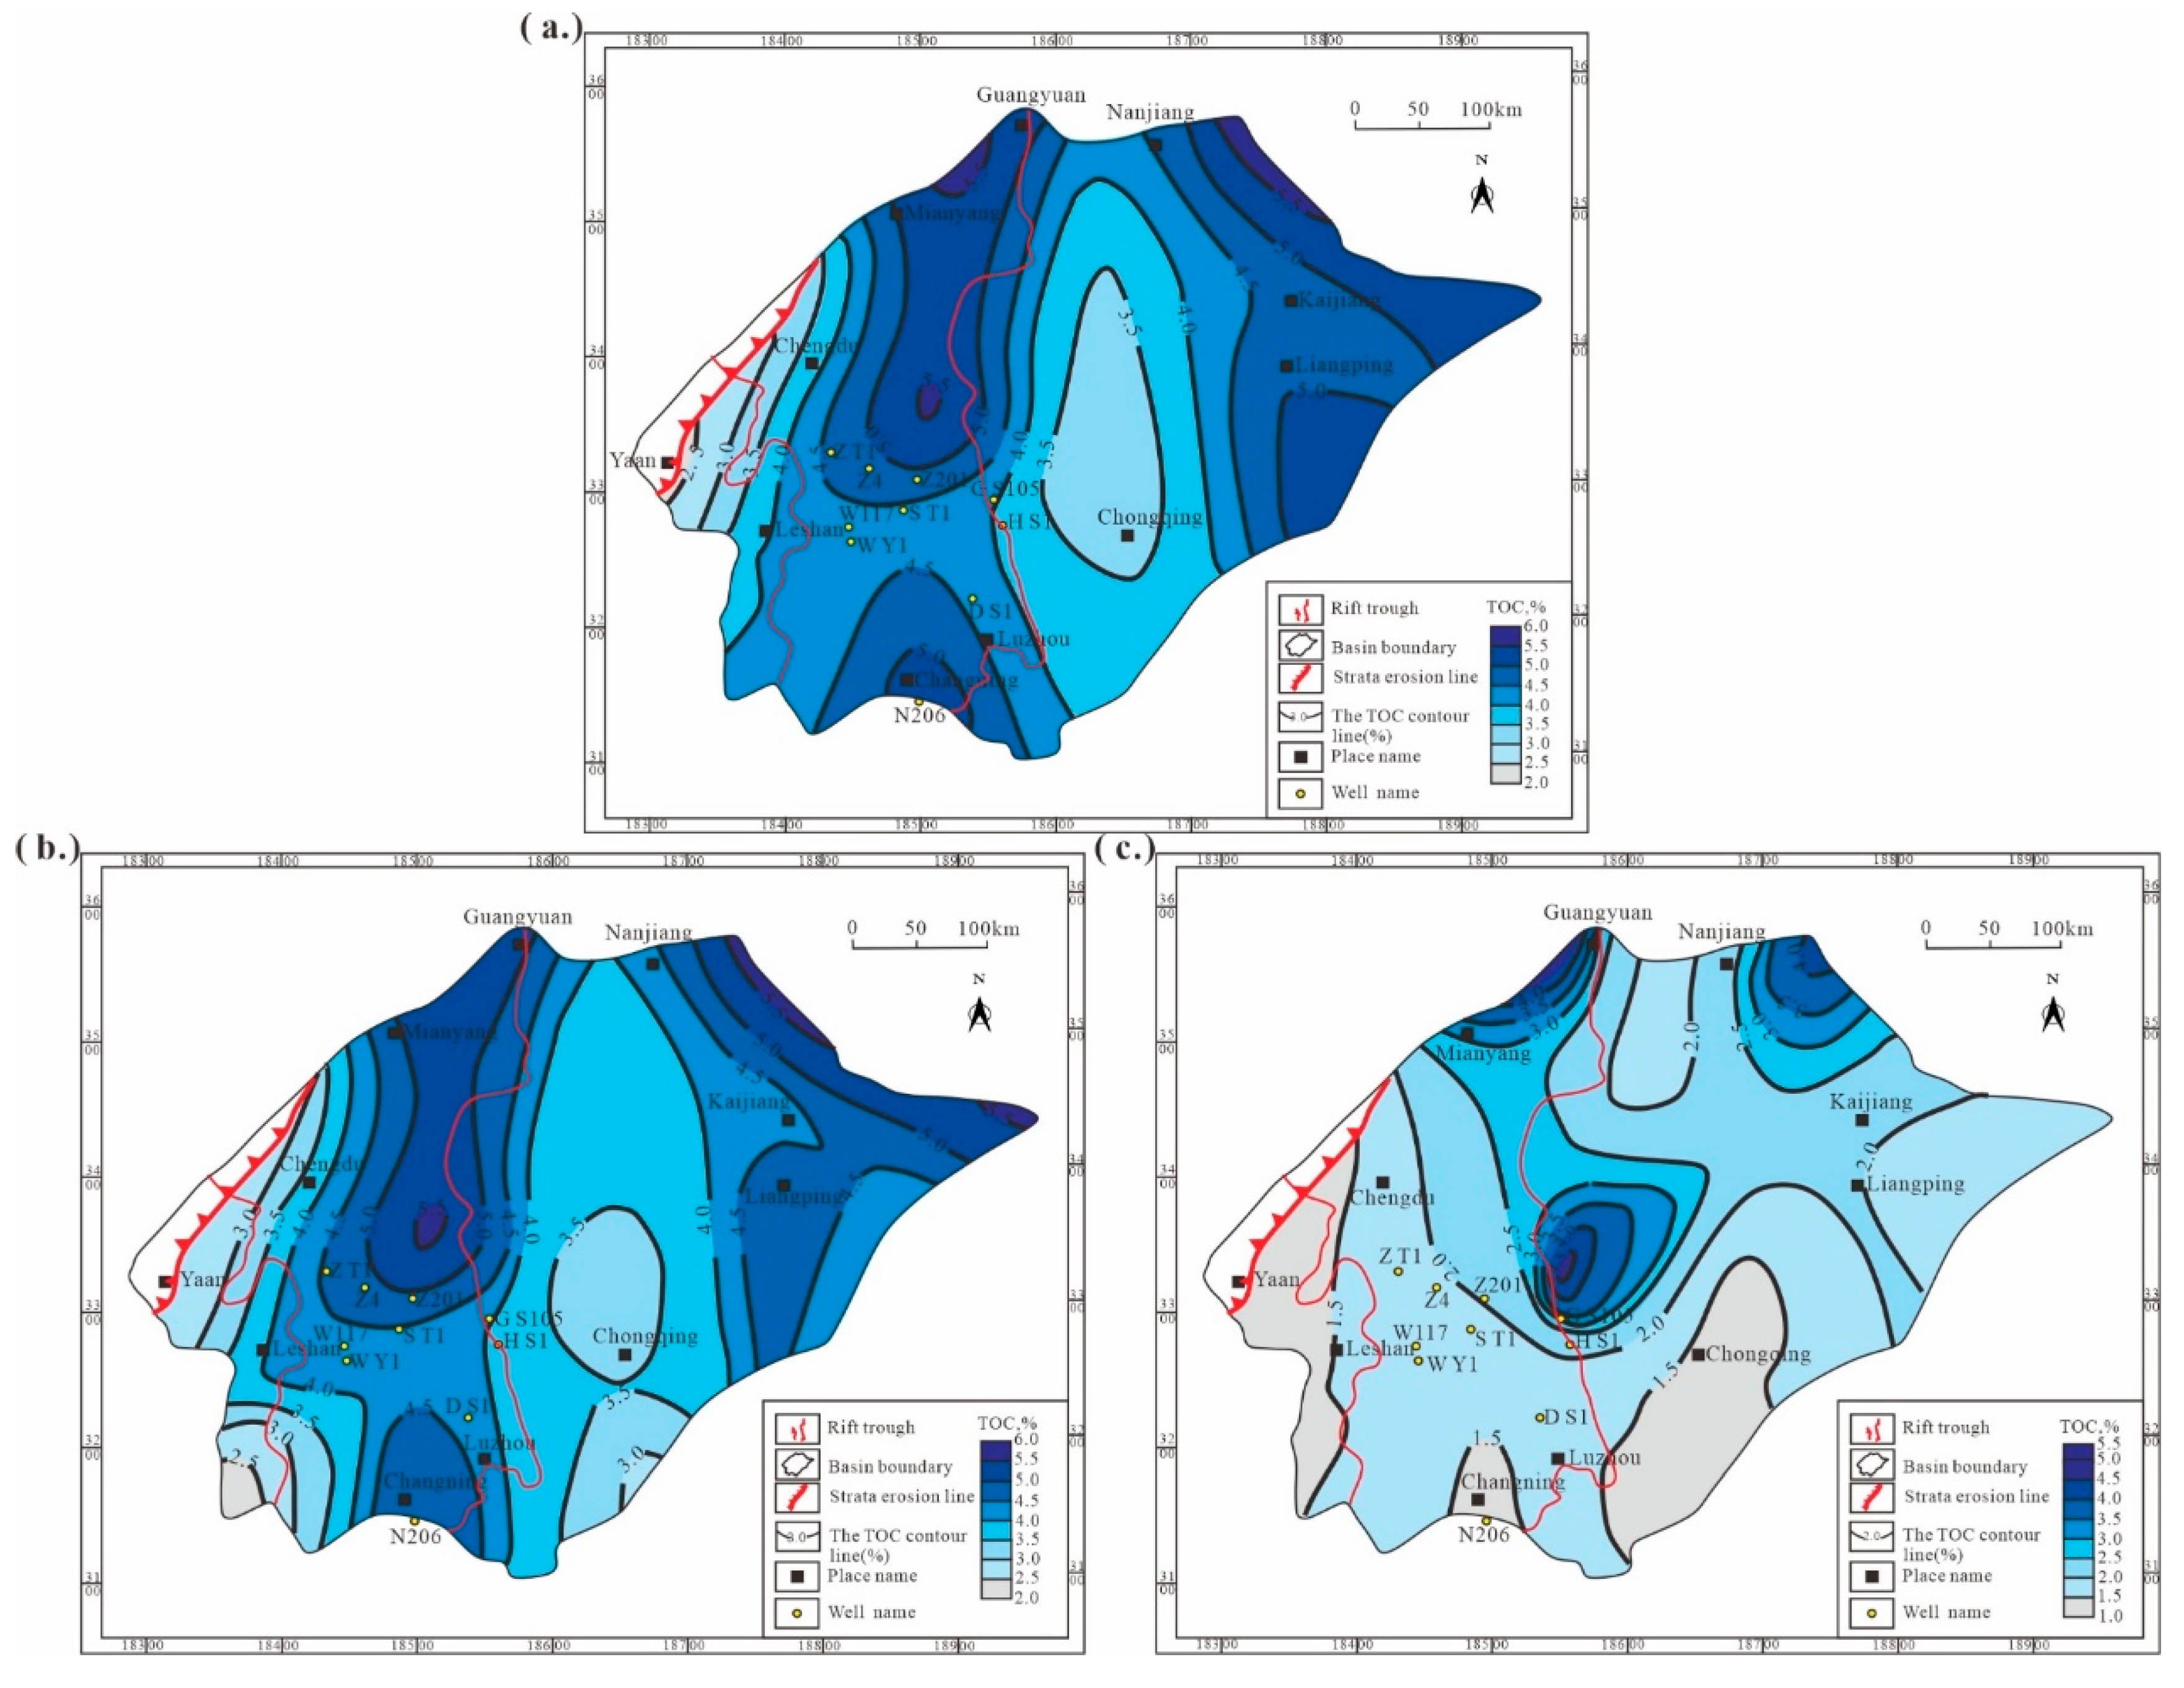
Figure 10.
Distribution characteristics of hydrocarbon generation intensity in the Є1q source rock in the (a) Ordovician–Silurian period, (d) Permian–Triassic period, and (g) Jurassic period. Distribution characteristics of hydrocarbon expulsion intensity in the Є1q source rock in the (b) Ordovician–Silurian period, (e) Permian–Triassic period, and (h) Jurassic period. Distribution characteristics of hydrocarbon retention intensity in the Є1q source rock in the (c) Ordovician–Silurian period, (f) Permian–Triassic period, and (i) Jurassic period.
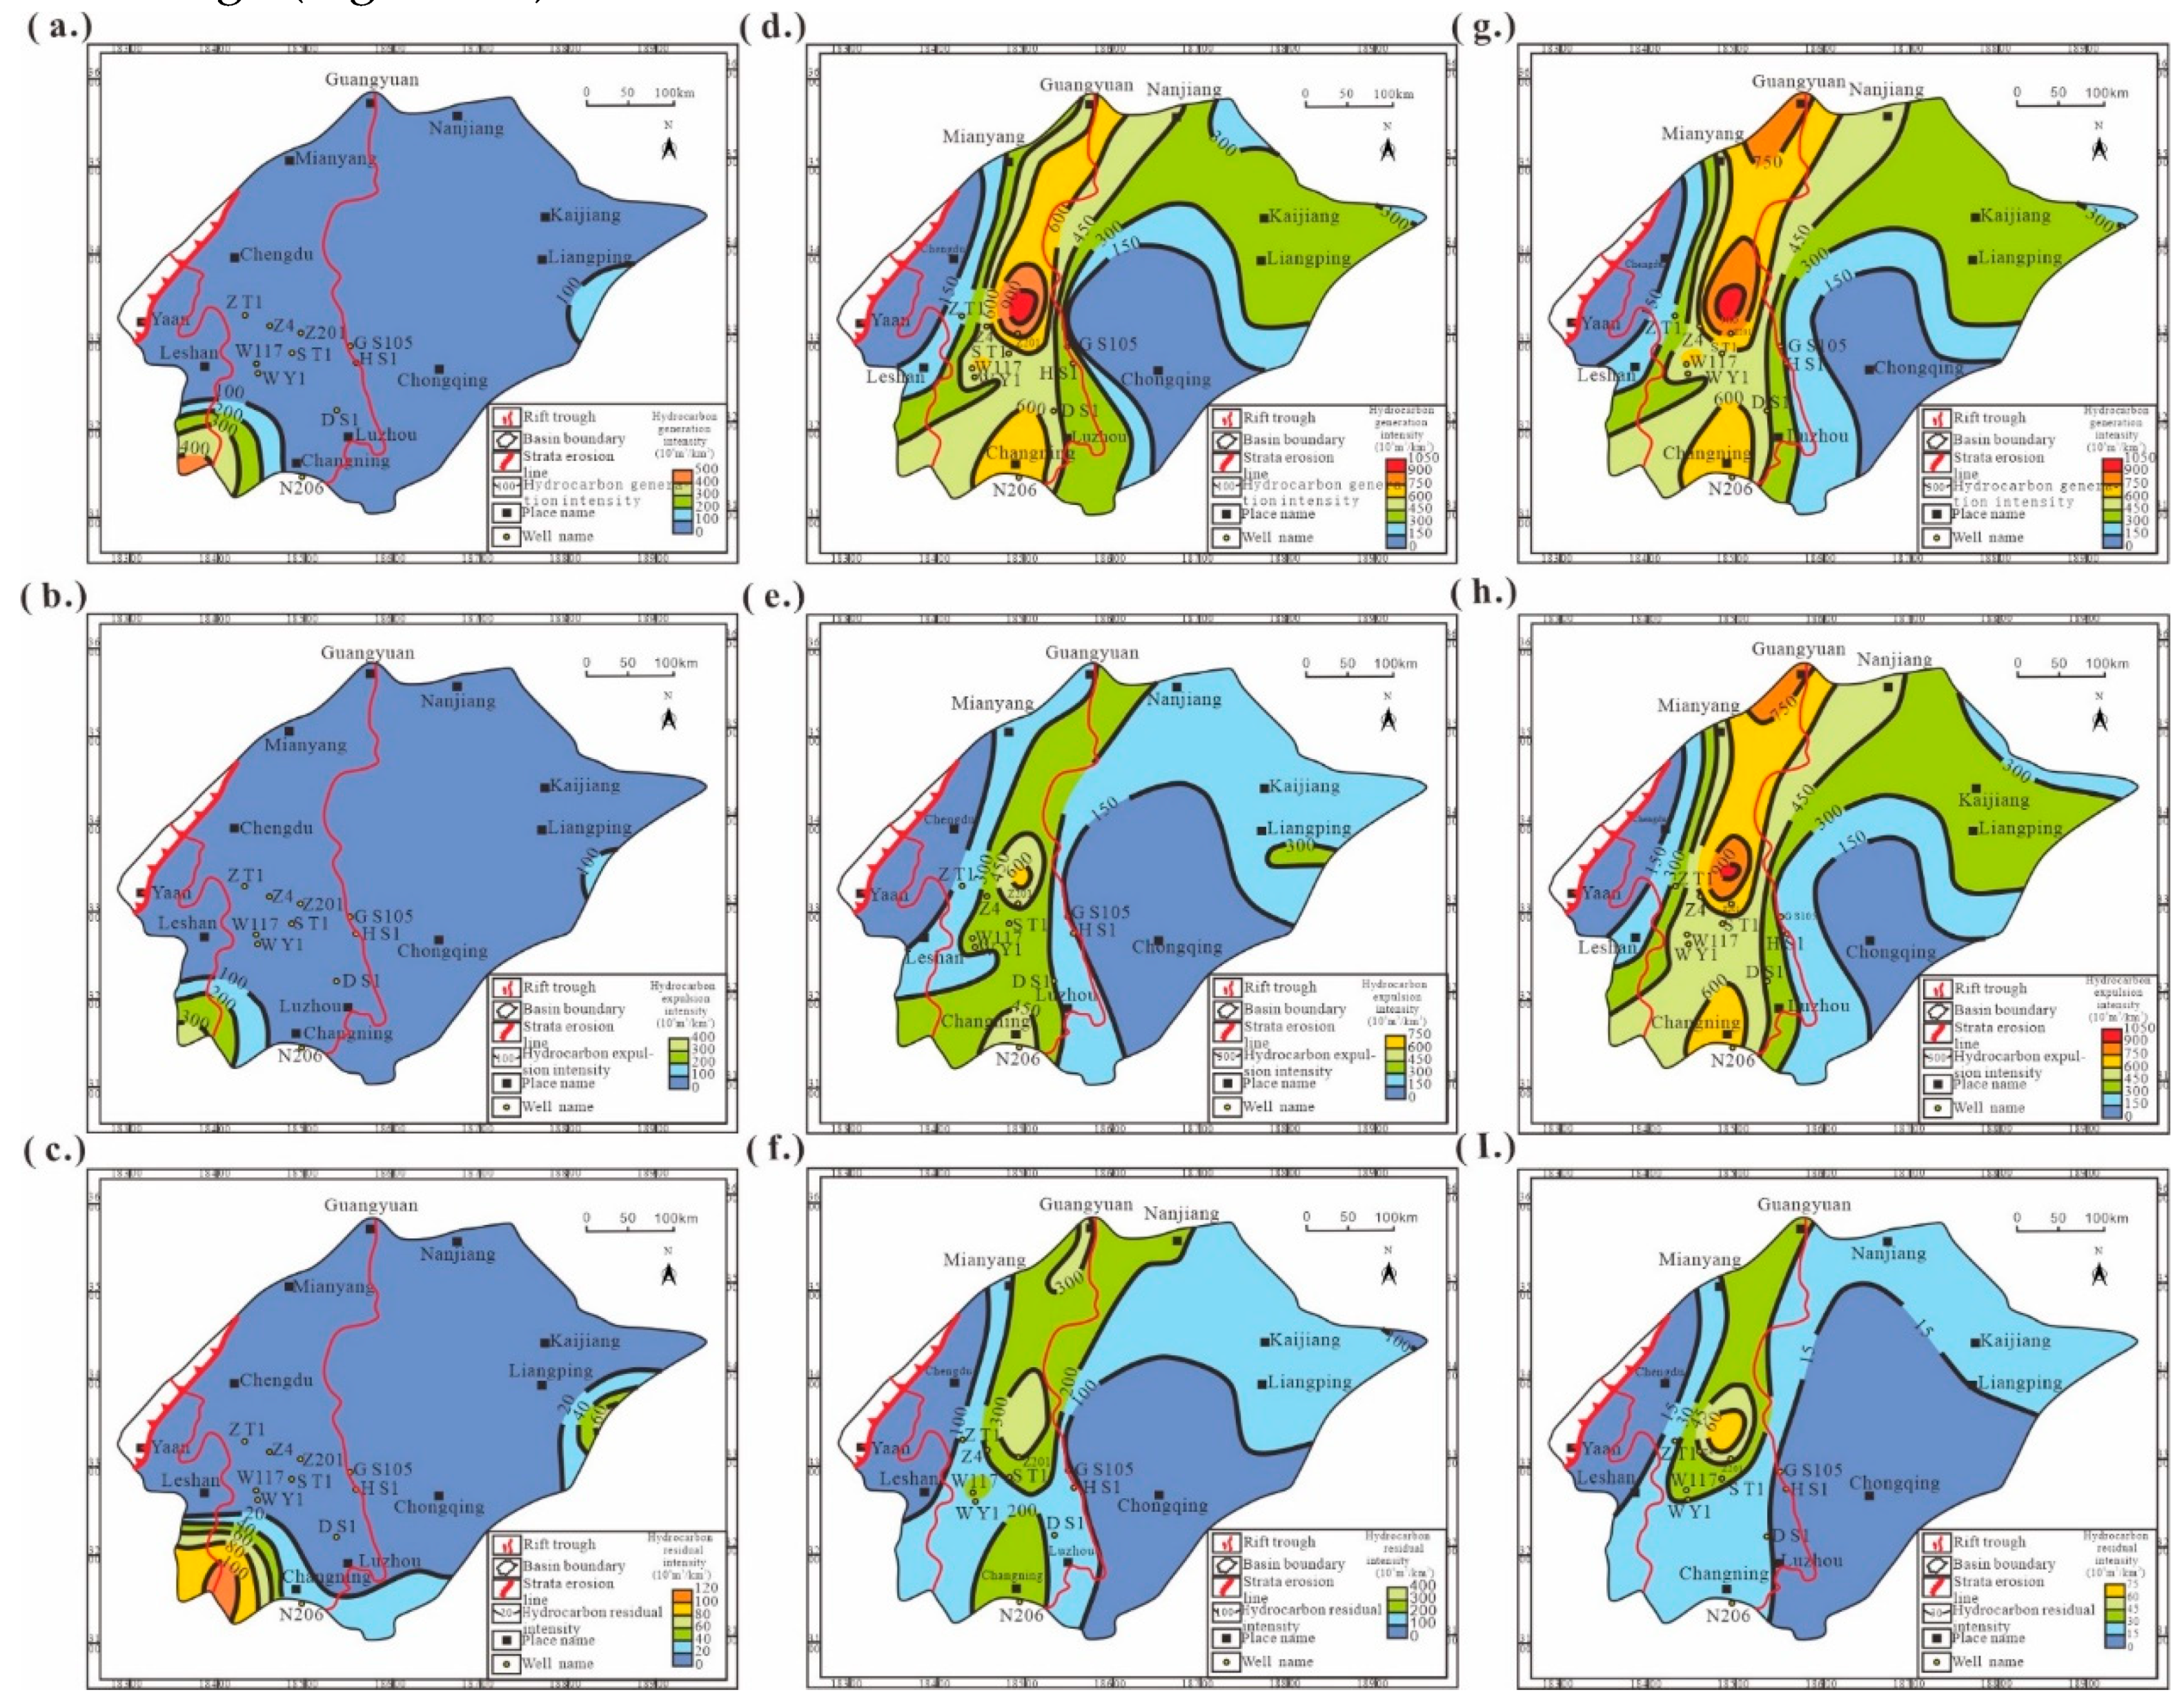
Figure 11.
Statistical diagram of generation, retention, and expulsion resources during various key periods of oil and gas accumulation related to Є1q.
Figure 11.
Statistical diagram of generation, retention, and expulsion resources during various key periods of oil and gas accumulation related to Є1q.
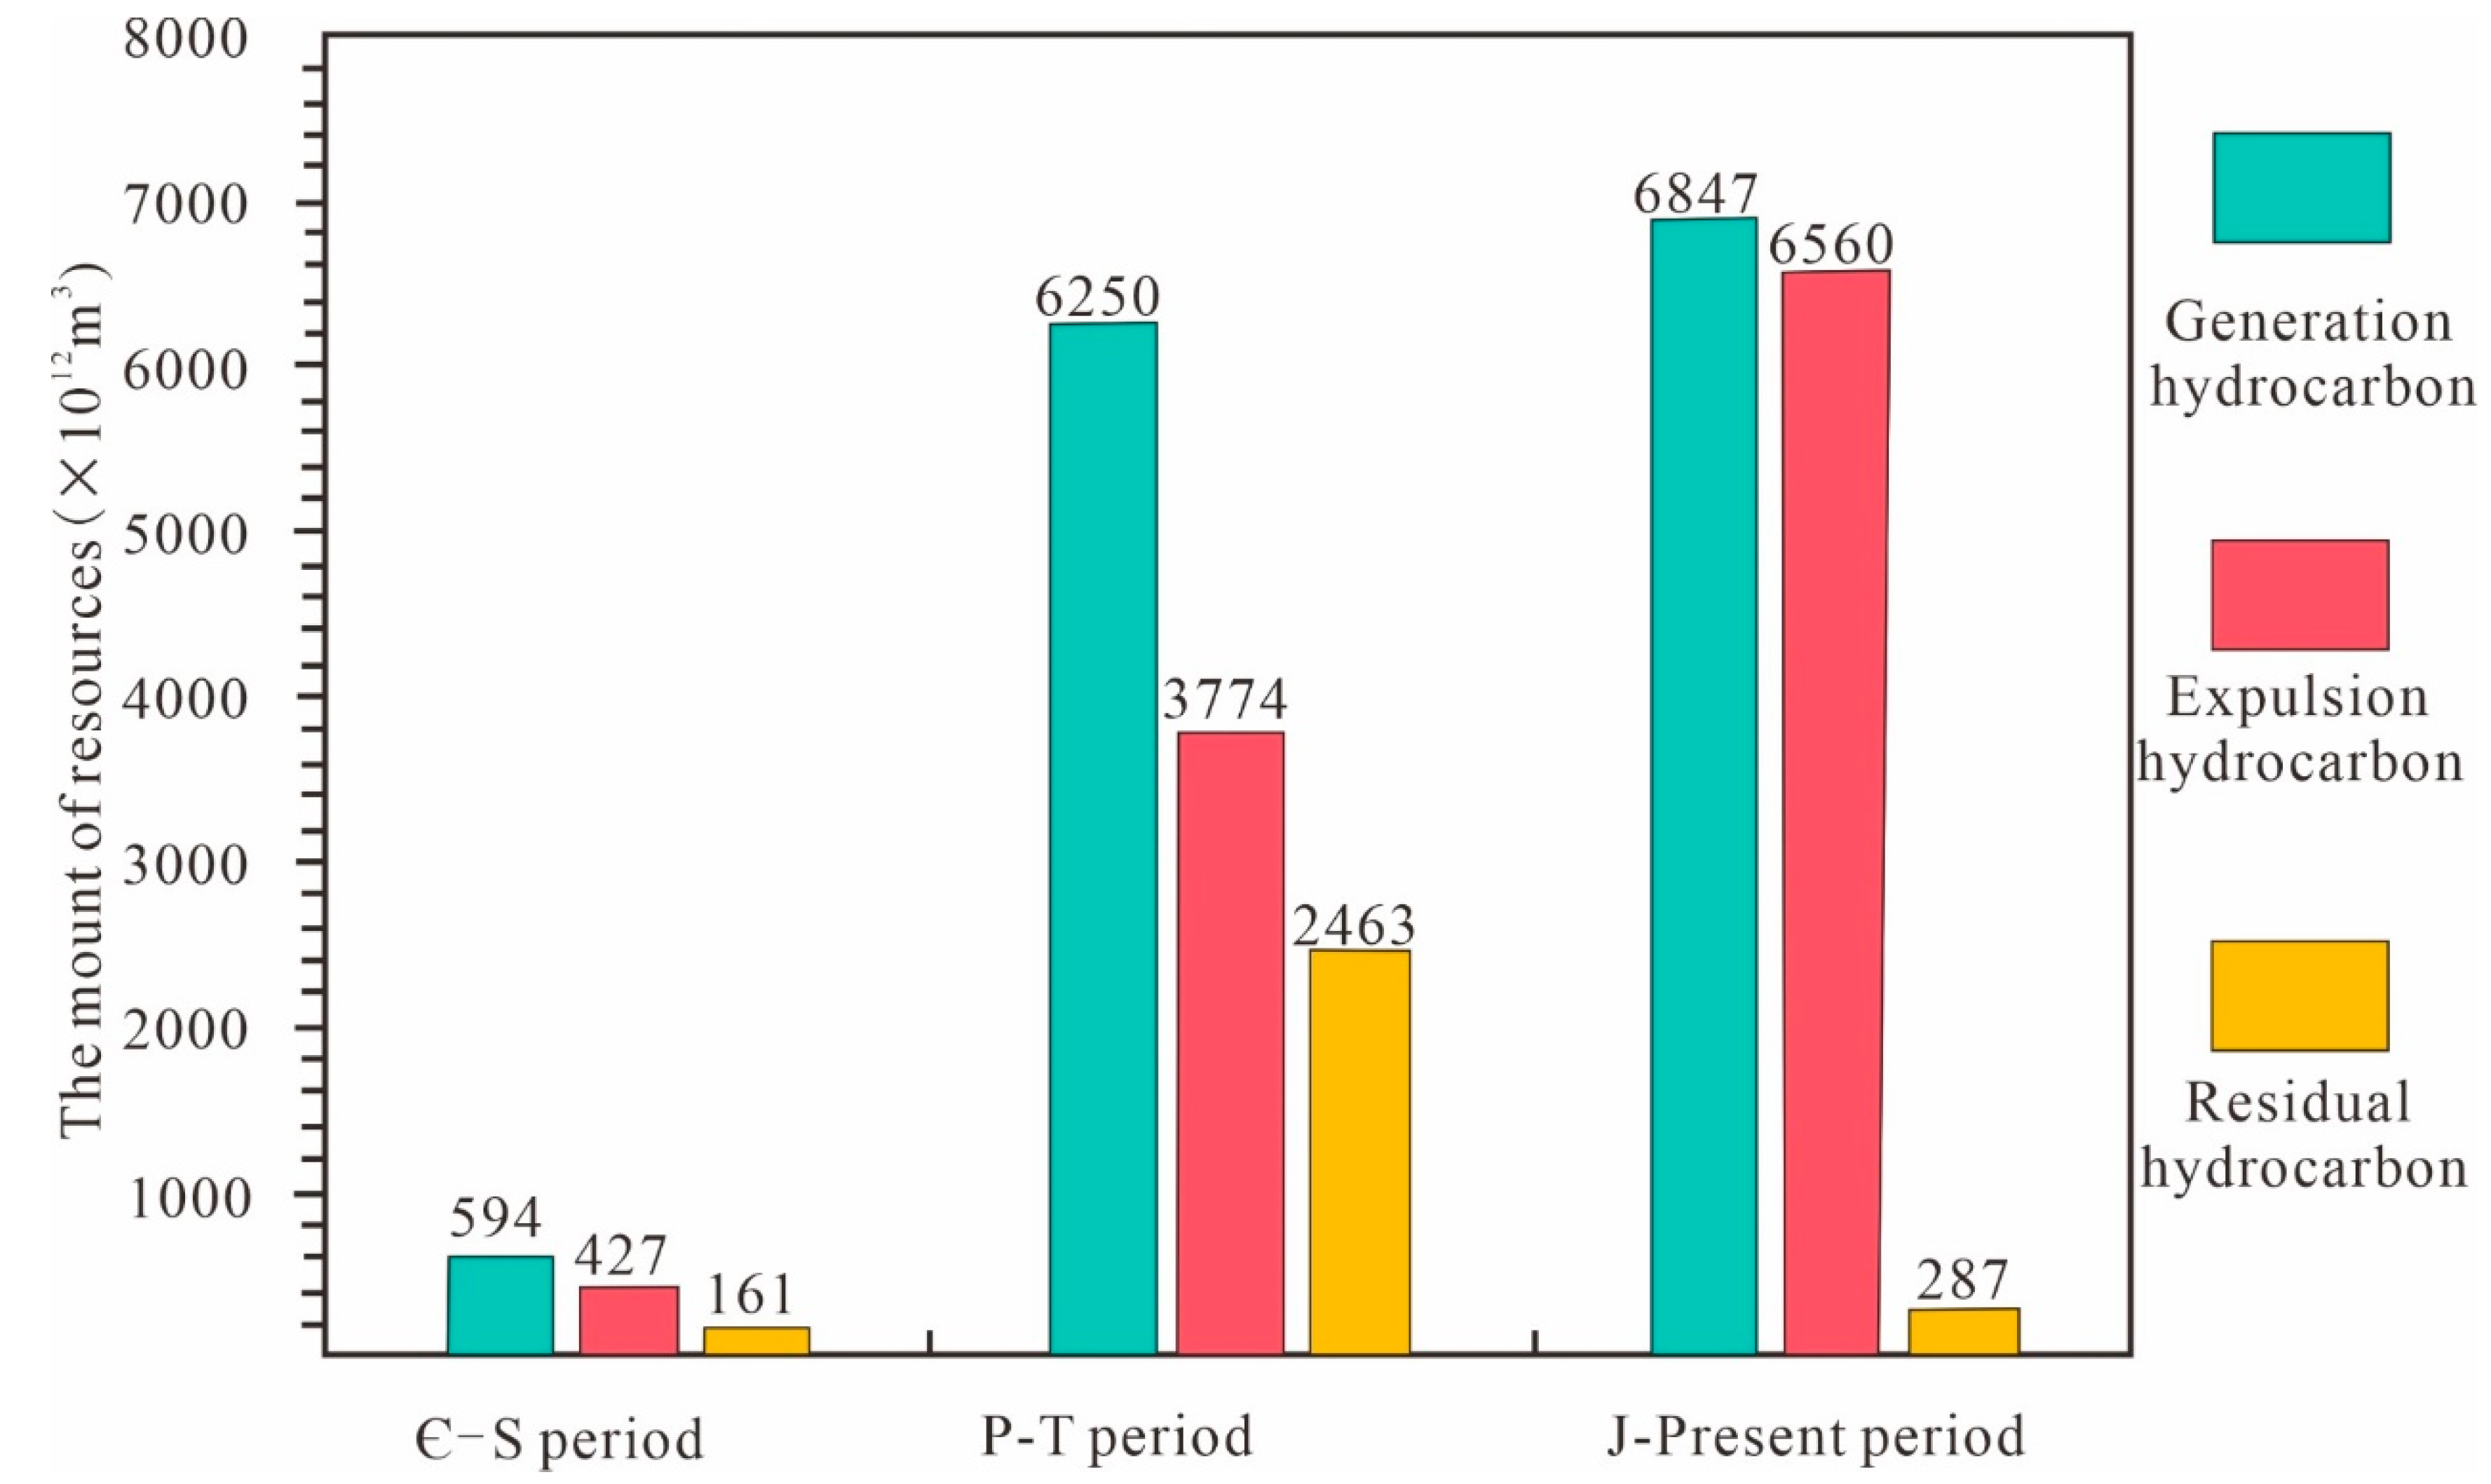
Figure 12.
Comprehensive Evaluation diagram in the Є1q of A1 well.
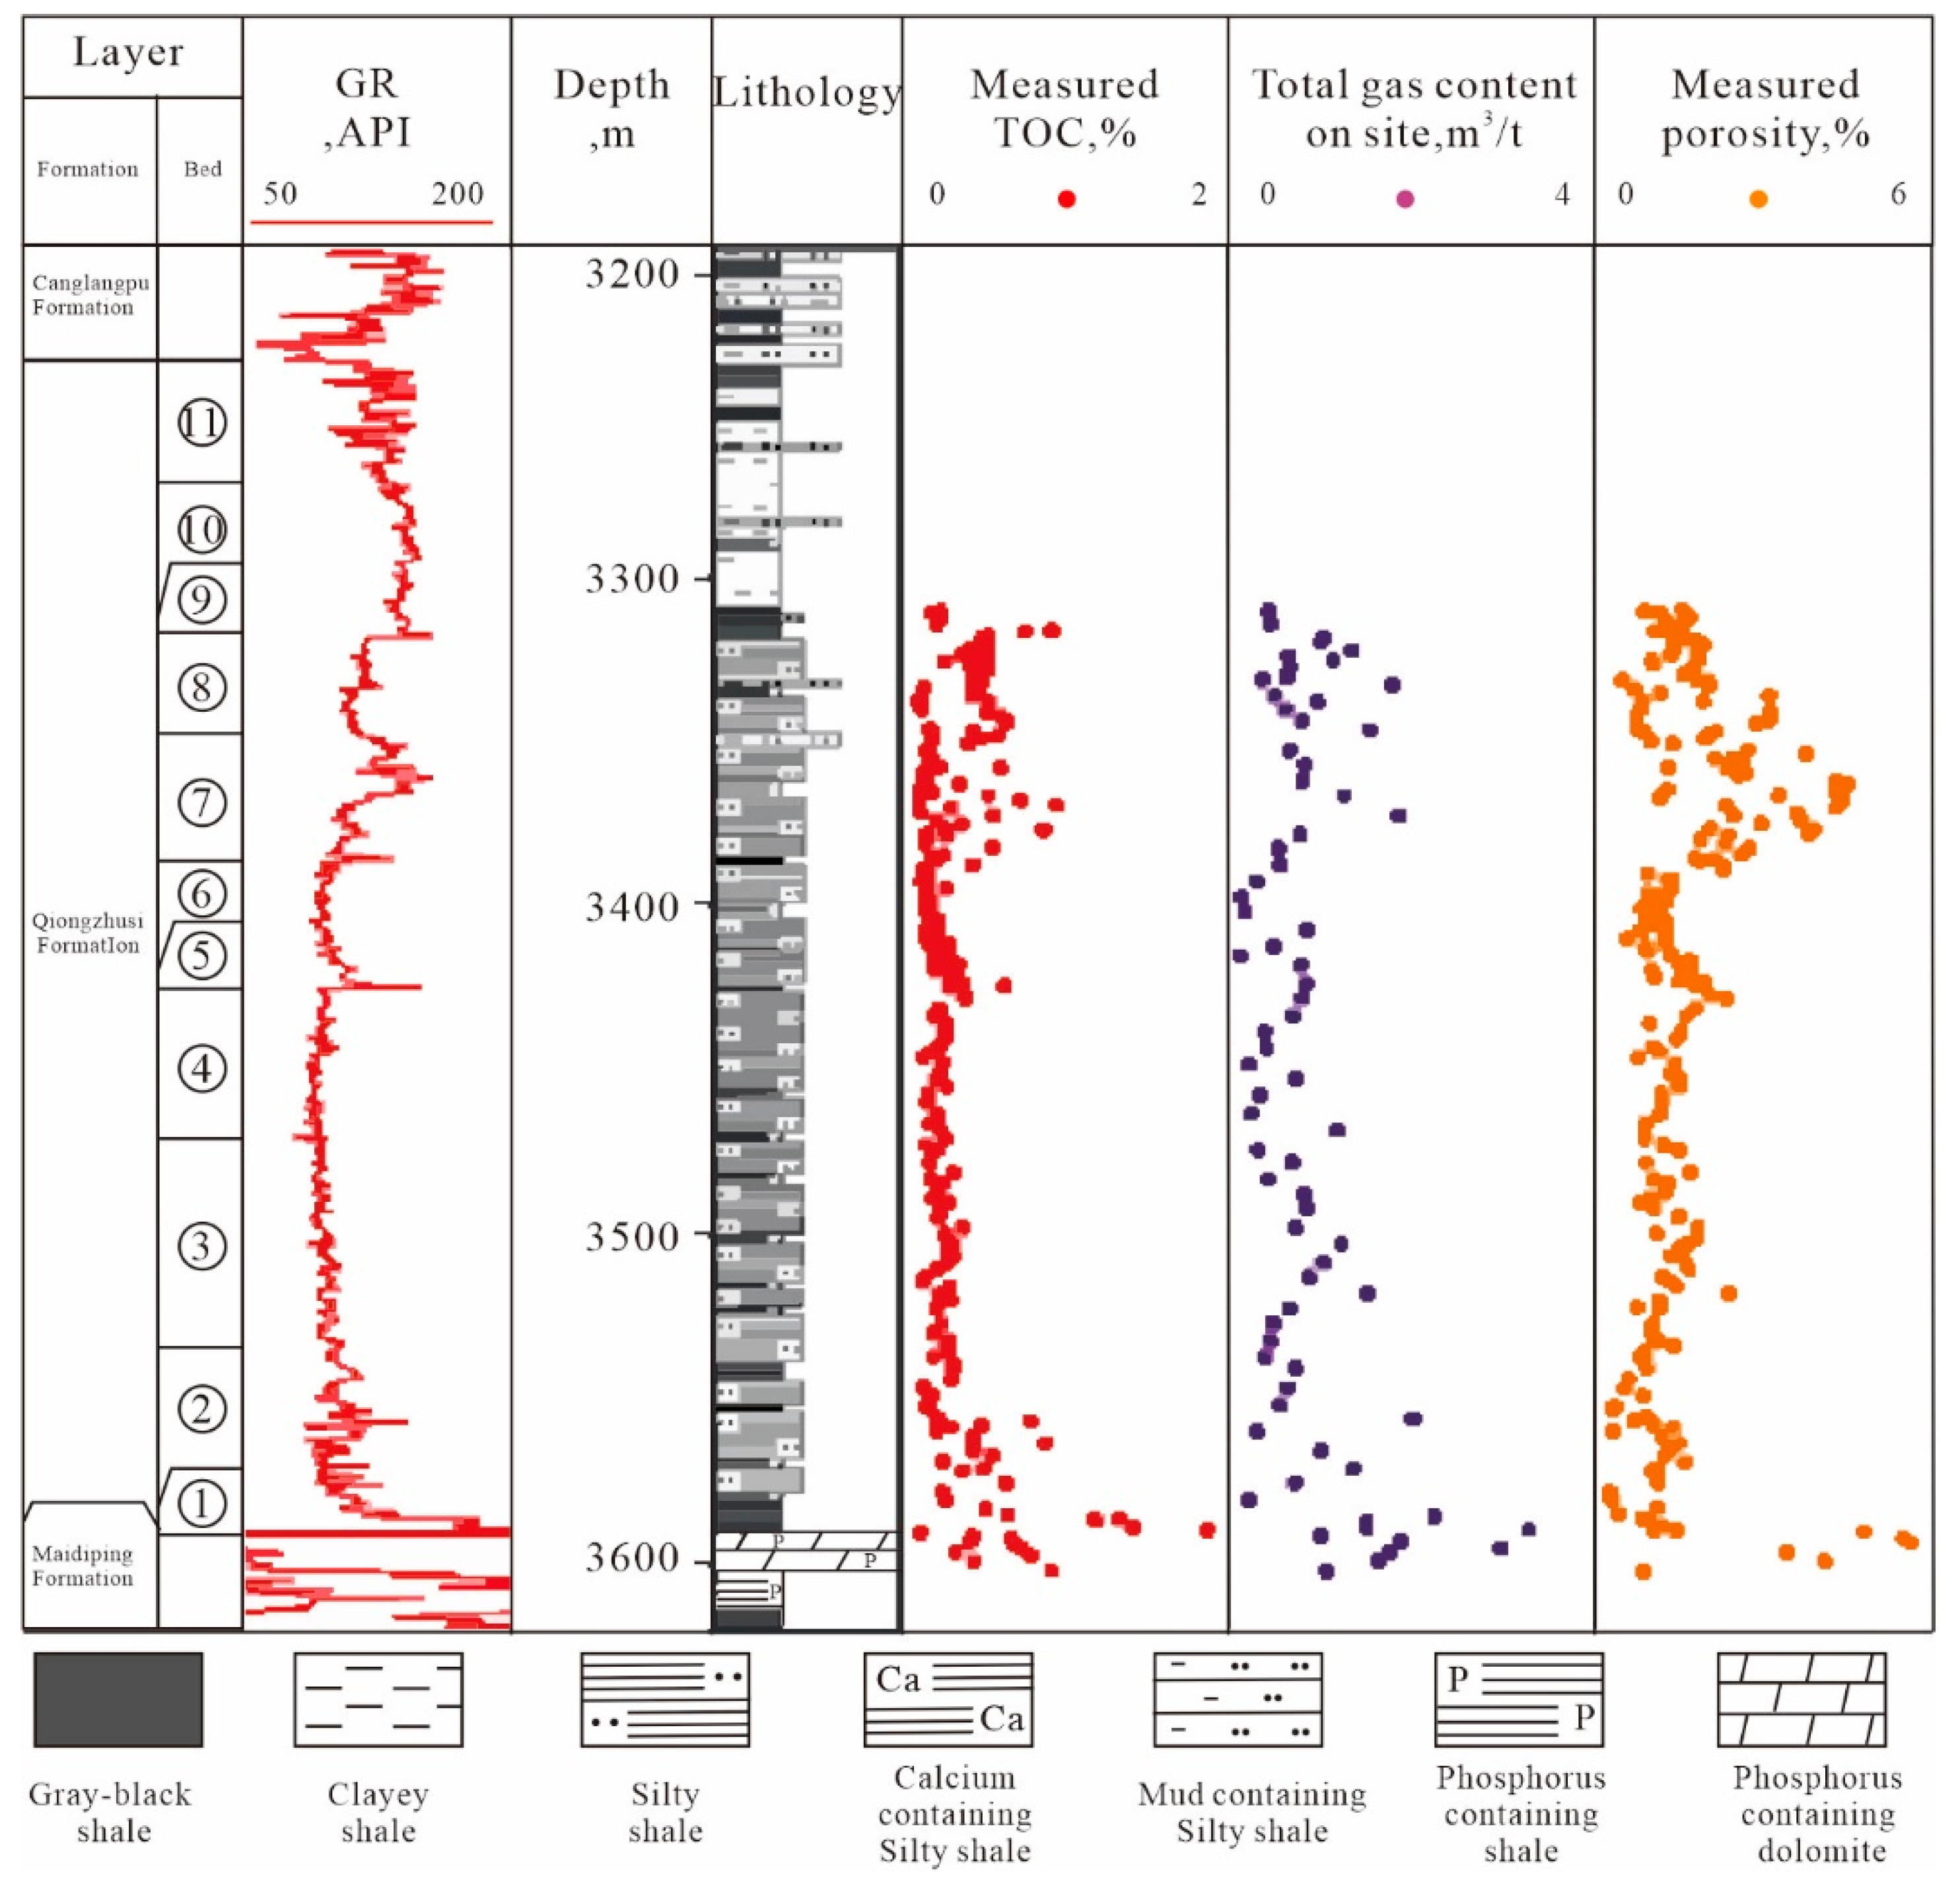

Table 1.
Measured TOC Data Table.
| Well | Depth | Lithology | TOC | Well | Depth | Lithology | TOC, % |
| DB1 | 5979.0 | Silty mudstone | 0.62 | GS17 | 5176.5 | Silty mudstone | 0.88 |
| DB1 | 5979.0 | Silty mudstone | 0.62 | ZS101 | 5549.0 | Silty mudstone | 0.70 |
| DB1 | 5973.0 | Silty mudstone | 0.95 | ZS101 | 5564.0 | Silty mudstone | 0.75 |
| DB1 | 5979.0 | Silty mudstone | 0.62 | ZS101 | 5579.0 | Silty mudstone | 0.60 |
| GS17 | 4604.9 | Silty mudstone | 0.60 | ZS101 | 5609.0 | Silty mudstone | 0.60 |
| GS17 | 4645.9 | Silty mudstone | 0.61 | ZS101 | 5624.0 | Silty mudstone | 0.53 |
| GS17 | 5125.3 | Silty mudstone | 1.22 | Z201 | 4621.3 | Silty mudstone | 0.78 |
| GS17 | 5138.6 | Silty mudstone | 0.76 | Z201 | 4624.2 | Silty mudstone | 0.74 |
Disclaimer/Publisher’s Note: The statements, opinions and data contained in all publications are solely those of the individual author(s) and contributor(s) and not of MDPI and/or the editor(s). MDPI and/or the editor(s) disclaim responsibility for any injury to people or property resulting from any ideas, methods, instructions or products referred to in the content. |
© 2024 by the authors. Licensee MDPI, Basel, Switzerland. This article is an open access article distributed under the terms and conditions of the Creative Commons Attribution (CC BY) license (http://creativecommons.org/licenses/by/4.0/).
Copyright: This open access article is published under a Creative Commons CC BY 4.0 license, which permit the free download, distribution, and reuse, provided that the author and preprint are cited in any reuse.


